local residents' attitudes towards elk in tennessee · neelam c. poudyal, cristina watkins,...
TRANSCRIPT
Local Residents’ Attitudes Towards Elk in Tennessee (Results from a survey of
residents in Anderson, Scott, Campbell, Morgan, and
Claiborne county)
Neelam C. Poudyal, Cristina Watkins, and Binod P. Chapagain, Department
of Forestry Wildlife & Fisheries, University of Tennessee, Knoxville
TWRA Wildlife Technical Report 18-6, October 2018

Equal opportunity to participate in and benefit from programs of the Tennessee Wildlife Resources Agency is available to all persons without regard to their race, color, national origin, sex, age, disability, or military service. TWRA is also an equal opportunity/equal access employer. Questions should be directed to TWRA, Human Resources Office, P.O. Box 40747, Nashville, TN 37204, (615) 781-6594 (TDD 781-6691), or to the U.S. Fish and Wildlife Service, Office for Human Resources, 4401 N. Fairfax Dr., Arlington, VA 22203.

Local Residents’ Attitudes towards Elk in Tennessee (Results from a survey of residents in Anderson, Scott, Campbell, Morgan, & Claiborne County)
Submitted to:
Tennessee Wildlife Resource Agency 440 Hogan Rd.
Nashville, TN 37204
Submitted by:
Neelam C. Poudyal, Cristina Watkins, and Binod P. Chapagain Department of Forestry, Wildlife, & Fisheries
University of Tennessee Knoxville, TN 37922
May 22, 2018

2
Summary Introduction:
This study was conducted during February and March of 2018 by using a mail survey of residents living within the 5-county region in and around the elk restoration zone (ERZ) in east Tennessee. The objective was to assess residents’ opinions and attitudes towards elk, perception of benefits and risks associated with having elk, and acceptability of various strategies of elk management. This study also characterizes the economic value of elk in Tennessee. A stratified random sampling approach secured a total of 1,005 surveys from residents in the region. Experiences with elk on property:
Landowners in this 5-county region seem to have a high awareness of elk presence in the area as 93% reported to know that elk were present in prior to receiving the survey. Additionally, only 32% of respondents had seen an elk on their own or neighbor’s property. However, 48% of respondents reported seeing elk within the 5-county region, but not near their property. Lastly, 32% of respondents reported not having seen elk in the region at all. Residents seem mostly interested in participating in elk-related activities such as watching elk, but are less interested in hunting elk.
Attitudes towards elk:
Attitudes towards elk were generally positive, as 66% (CI: 61%, 71%) were somewhat or very interested at the idea of having elk and 73% (CI: 67%, 79%) supported establishing a healthy population of elk in Tennessee. As high as 86% (CI: 80%, 91%) said it is important for them to ensure that their heirs can see elk in Tennessee, and 76% (CI:70%, 81%) said it is important for them to protect elk in Tennessee even if they never get to see them, suggesting a strong sense of non-use value of elk among the residents. Vast majority of respondents apprehend the ecological value of elk as 82% (CI: 76%, 86%) agree that elk are a valuable part of nature and 63% think having elk helps maintain balance in the natural environment. Majority of residents believe elk bring economic benefits to local communities through tourism. Very few (<20%) agreed with the statements corresponding to negative aspects of elk including the cost of managing elk outweighs the benefits they bring, and elk threaten the economic prosperity of farmers in Tennessee. Elk viewing and hunting: While 64% of respondents were interested in watching elk in Tennessee, only 31% of respondents had taken trip for primary purpose of elk viewing. About 35% of respondents to this survey self-identified as hunters. The majority of respondents (62%; CI: 59%, 65%) stated to have little to no interest in hunting elk, however 66% (CI: 59%, 72%) noted hunting by licensed hunters to be somewhat or completely acceptable as an elk management strategy and 46%

3
(CI:41%,52%) found private hunting acceptable as a management strategy. Support for allowing regulated hunting by licensed hunters was much higher than for allowing landowners and their designees to hunt or establishing private land only elk hunting program. In general, the respondents preferred promotion of elk-based tourism to hunting. Concerns related to elk damage:
Overall, the majority of respondents seem to have little to no concern for most of the specific types of damage caused by elk. The one area with a higher proportion of respondents reporting higher levels of concern was “elk/vehicle accidents.” Only 4% (CI: 2.4%, 5.2%) of respondents reported noticeable damage to their property due to elk. When asked to rate the severity of the elk damage on their land, 83% stated the damage to be “not a problem at all,” while 7% stated the damage was a “small problem,” 7% stated the damage to be a moderate problem, and the remaining 3% stated the damage to be a “big or severe problem”. Even though this study did not intend to quantify the economic value of damage, it appears the most severe elk damage may be concentrated to a few landowners within the ERZ. Elk Management: Respondents on average expressed acceptable or neutral opinions towards all management options they were asked about. The relative acceptability was highest among strategies that utilize education, awareness, and habitat expansion inside NCWMA and lowest for strategies that emphasize trapping, hunting, or hazing of elk. Respondents also expressed great deal of confidence and trust on TWRA and its professionals to effectively manage elk population in Tennessee. Economic Value:
Models of demand for elk hunting permit and elk viewing trips were analyzed in travel cost method of non-market valuation to estimate use value. Responses to a willingness to pay question in the household survey was modeled to quantify the non-use value (existence value). The total economic value of consumptive and non-consumptive use of elk in Tennessee was estimated to be $10.25 million in 2017 (hunting opportunity: $2.54 million, elk viewing opportunity: $4.87 million, and existence value: $2.84 million). This estimate reflects the annual net benefit provided by elk program to a variety of user groups that directly or indirectly enjoy elk. In other words, this amount reflects the potential annual loss of welfare for stakeholders if the elk no longer exist in Tennessee for hunting, viewing, etc.

4
Table of Contents
Introduction .......................................................................................................................... 6
Methodology ......................................................................................................................... 6
Results .................................................................................................................................. 9 Survey Response ............................................................................................................................9 Respondent demographics .............................................................................................................9 Property Characteristics ............................................................................................................... 11 Experience with and Interest in elk ............................................................................................... 12 Elk viewing .................................................................................................................................. 16 Elk damage concerns .................................................................................................................... 17 Elk hunting .................................................................................................................................. 20 Private land elk hunting ............................................................................................................... 20 Human Elk Interaction .................................................................................................................. 23 Elk Management .......................................................................................................................... 25 Importance of and satisfaction with elk management ................................................................... 27 Confidence and Trust in Restoration ............................................................................................. 29 Economic value of elk in Tennessee .............................................................................................. 30 Open ended comments from respondents .................................................................................... 34
Acknowledgements ............................................................................................................. 46
References .......................................................................................................................... 46
Appendix A: Survey questionnaire ....................................................................................... 48
Appendix B: Pre-notification Invitation ................................................................................ 58
Appendix C: Cover Letter with Invitation.............................................................................. 60
Appendix D: Reminder Post Card ......................................................................................... 62
Appendix E: Follow up letter with reminder ......................................................................... 64
Appendix F: Economic Analysis Methodology ...................................................................... 66
5
Table of Figures Figure 1: Cover page of the survey questionnaire 6 Figure 2: The 5-county region showing the Elk Restoration Zone (ERZ), Buffer zone, and the remaining county
area 7 Figure 3: Age distribution of respondents (N = 963) 9 Figure 4: Distribution of respondents by income group (N = 806) 10 Figure 5: Percentage of respondents by self-reported hunter status (N = 956) 10 Figure 6: Respondent by location of residence (N = 991) 11 Figure 7: Respondents by reported use of property (N= 932). [Note: Percentages do not add up because of
multiple usage types] 12 Figure 8: Respondents' awareness of elk presence in the region by location (n1=667, n2=324) 12 Figure 9: Respondents interest in elk-related activities in Tennessee (from left: n1= 958, n2=928, n3=945, n4=926,
n5=921) 13 Figure 10: Percentage of respondents with various level of agreements with elk related statements (N = 945) 14 Figure 11: Respondents familiarity with the elk in the region (from left: n1= 957, n2=957, n3=955,n4=956) [Note:
Percentages do not add up because multiple options could be checked] 16 Figure 12: Tentative location of elk-related damage to land and property as reported by respondents (N = 719)
[Note: locations are tentative only] 17 Figure 13: Severity of elk damage as reported by the respondents (N =126) 18 Figure 14: Respondents' concern with various elk/human conflicts (from top: n1= 918, n2=899, n3=905, n4=905,
n5=913, n6=909, n7=906, n8=907, n9=901, n10=90) 19 Figure 15: Respondents' acceptability of allowing landowners and their designees to hunt elk on private land (N
= 935) 20 Figure 16: Respondents' acceptability of allowing private landowners and their designees to hunt elk on private
land (from left: n1= 578, n2= 334) 21 Figure 17: Respondents’' willingness to allow hunting access on their property in the future (N = 458) [Note: this
graph excludes respondents who cited “not enough land” as the reason for not allowing hunting access] 21 Figure 18: Proportion of respondents that were interested in allowing elk hunting on private land, by motivation
(N = 226) 22 Figure 19: Proportion of respondents that would not allow hunting access on private land, by motivation (from
top: n1= 622, n2=625, n3=625, n4=625, n5=625, n6=625, n7=623, n8=482) [Note: percentages do not add up because respondents were allowed to check multiple responses] 23
Figure 20: Respondents' perception of current and preferred level of elk population (ncurrent=957, npreferred=941) 24 Figure 21: Respondents acceptance of various elk management strategies (from top, n1=936, n2=935, n3=927,
n4=931, n5=939, n6=941, n7=925, n8=935, n9=901, n10=931) 26 Figure 22: Respondents' acceptance of various elk management strategies (from top: n1=937, n2=943, n3=943,
n4=945,n5=940) 27 Figure 23: Respondents reported importance of restoring and conserving elk in Tennessee (N = 952) [locations
are tentative only] 28 Figure 24: Respondents' reported satisfaction with the current elk management effort in Tennessee (N = 937)
[locations are tentative only] 28 Figure 25: Respondents' agreement with various statement regarding confidence and trust on agency to manage
elk (from top: n1=936, n2=935, n3=927, n4=931, n5=939, n6=941, n7=925) 29 Figure 26: Percentage of respondents saying "Yes" to paying various amount of annual donation towards
conserving elk in Tennessee (from left: n1 = 94, n2 = 88, n3=92, n4=100, n5= 83, n6=89, n7 = 107, n8=85, n9=88, n10=111) 32

6
Introduction
Background
Tennessee Wildlife Resource Agency (TWRA) along with the partnership with Campbell County Outdoor Recreation Association, Tennessee Wildlife Federation, University of Tennessee, and the U.S. Forest Service reintroduced elk to a 5-county region in east Tennessee in December 2000. Those counties include Morgan, Scott, Anderson, Campbell, and Claiborne. Over the years, the elk herd numbers have increased from about 200 to over 400. TWRA currently manages the elk population through a regulated quota hunting program.
Even though a substantial portion of North Cumberland Wildland Management Areas (WMA), serve as prime habitat for elk herds, it is natural for some to roam outside the WMAs, specifically on private farms and ranchlands in the surroundings. This leads to a variety of situations where elk interact with local residents in many ways. Some of those could be positive (e.g. elk viewing, photographing opportunity, tourism) and others could be negative (e.g. crop damage, elk-vehicle collision). Hence, to ensure the sustainability of elk management in the region, collaboration and cooperation from thousands of landowners and local residents in the region will be critical. In fact, one of the strategies outlined in recently prepared Elk Management Plan is conducting stakeholder attitudes and opinion survey to improve communication between TWRA and stakeholders and inform recommendations about elk management. Study Objectives
Objectives of this project were to understand the opinion, and attitudes of residents living in and around elk restoration zone within five county region in east Tennessee. Specifically, the study assessed what opinions and attitudes residents have towards elk, whether and how they perceive the benefits and risks associated with having elk in the region, and how they rate the acceptability of various strategies of elk management. This study also attempted to characterize the economic value of elk in Tennessee in terms of its potential use and non-use values.
Methodology Objectives of this study were met by conducting a mail
survey of residents living in Morgan, Scott, Anderson, Campbell, and Claiborne counties in east Tennessee. A paper-based questionnaire (Appendix A), which included a cover page (fig. 1), seven inner pages accommodating a total of 40 questions, and a back cover that provided extra space for respondents to provide open-ended comments was first
Figure 1: Cover page of the survey questionnaire
7
developed. The first section of the questionnaire included questions related to resident’s property ownership, knowledge and opinions regarding elk in five county region in general. The second section included questions about their experience with elk presence on their property in particular. The third section had a variety of questions about their attitude towards elk in the region, and acceptability of various management strategies. The final section included a few questions about the social and demographic characteristics, which are included to make sure that the survey respondents are representative of the population of the region. Questions about opinions and attitudes utilized a series of statements about elk, in which respondents can indicate their level of agreement or disagreement in a five-point Likert scale. Similar format is used to measure their acceptability of various strategies in elk management. Many of these questions are adopted verbatim from similar surveys recently conducted in other states (e.g. Arkansas, North Carolina, Kentucky, South Dakota).
A copy of the survey questionnaire along with a personalized cover letter was mailed to
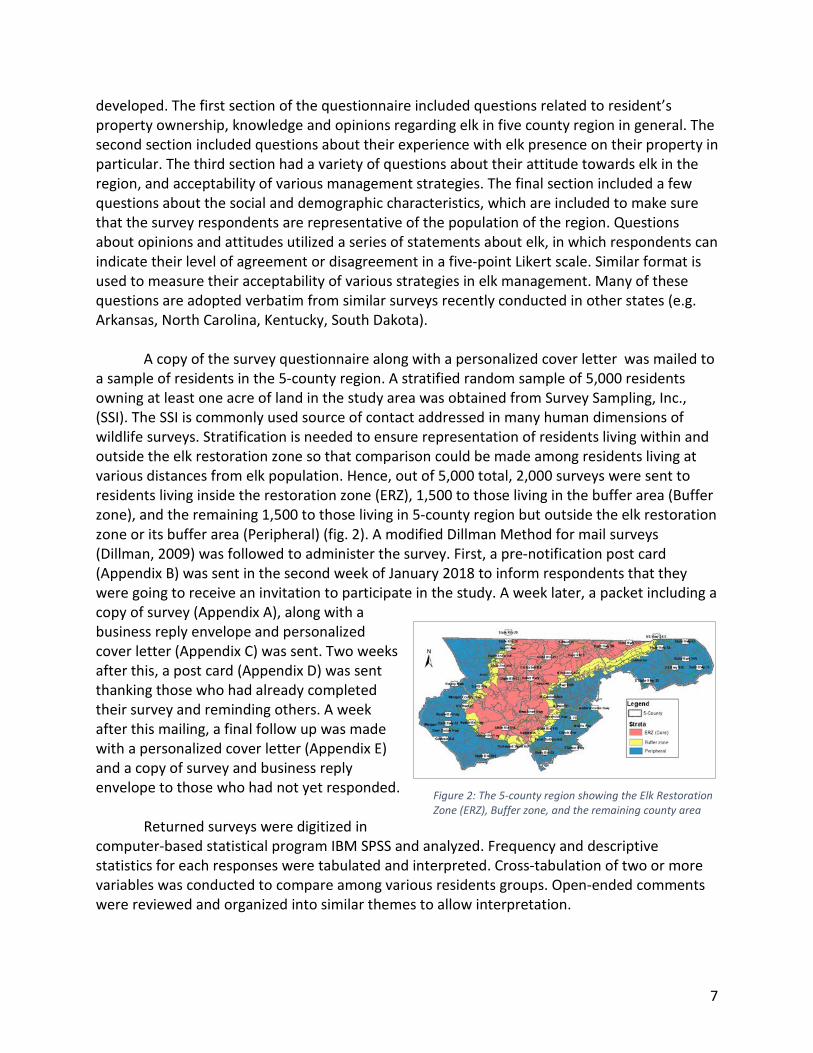
a sample of residents in the 5-county region. A stratified random sample of 5,000 residents owning at least one acre of land in the study area was obtained from Survey Sampling, Inc., (SSI). The SSI is commonly used source of contact addressed in many human dimensions of wildlife surveys. Stratification is needed to ensure representation of residents living within and outside the elk restoration zone so that comparison could be made among residents living at various distances from elk population. Hence, out of 5,000 total, 2,000 surveys were sent to residents living inside the restoration zone (ERZ), 1,500 to those living in the buffer area (Buffer zone), and the remaining 1,500 to those living in 5-county region but outside the elk restoration zone or its buffer area (Peripheral) (fig. 2). A modified Dillman Method for mail surveys (Dillman, 2009) was followed to administer the survey. First, a pre-notification post card (Appendix B) was sent in the second week of January 2018 to inform respondents that they were going to receive an invitation to participate in the study. A week later, a packet including a copy of survey (Appendix A), along with a business reply envelope and personalized cover letter (Appendix C) was sent. Two weeks after this, a post card (Appendix D) was sent thanking those who had already completed their survey and reminding others. A week after this mailing, a final follow up was made with a personalized cover letter (Appendix E) and a copy of survey and business reply envelope to those who had not yet responded.
Returned surveys were digitized in
computer-based statistical program IBM SPSS and analyzed. Frequency and descriptive statistics for each responses were tabulated and interpreted. Cross-tabulation of two or more variables was conducted to compare among various residents groups. Open-ended comments were reviewed and organized into similar themes to allow interpretation.
Figure 2: The 5-county region showing the Elk Restoration Zone (ERZ), Buffer zone, and the remaining county area
8
To characterize economic value of elk in Tennessee, a variety of methods commonly used in non-market valuation of wildlife resources were utilized. Both the use values (hunting and viewing) and non-use value (existence value) were considered in characterizing economic value of elk resources in the restoration area.
Value of elk hunting: To estimate the value of opportunity to hunt elk in NCWMA, we
followed a typical travel cost method of estimating net economic benefit of having access to a site for recreation. The travel cost method involves developing a statistical model of demand for trips (i.e. access) to a recreation site for primary purpose of a given recreation activity (i.e. elk hunting), and investigates how trip demand changes relative to the cost of accessing the site. Since, elk hunting in Tennessee is constrained by lottery-based mechanism, economists have used elk permit application data at Zip code level to measure demand for hunting. We followed the approach taken by Loomis (1982) and Scrogin et al. (2002) to estimate a zonal travel cost model of elk permit application in Tennessee and quantify net benefit of opportunity to hunt elk. Zip code level estimates were aggregated to the entire set of Zip Codes from where hunters applied for elk permit to hunt in North Cumberland. Further details of estimation procedure, statistical modeling and data sources are presented in Appendix F.
Value of elk viewing: To characterize the net benefit local residents receive by viewing
elk, we developed and estimated an individual travel cost model of elk viewing trips to NCWMA. In order to estimate how much an elk viewing trip to local spots (e.g. Hatfield Knob Elk Viewing Tower) worth to households, a statistical model of trip demand and travel cost was developed. Trips taken by local households for the primary purpose of elk viewing and the distance travelled were collected from the mail survey described above. Estimated economic benefit of individual trip was extrapolated to appropriate portion of the entire population in the region. Further details of estimation procedure, statistical modeling and data sources are presented in Appendix F.
Existence value. Unlike the direct use values of hunting and viewing, existence value
relates to the value people place on knowing that a given wildlife species exist in the ecosystem. The existence value of elk for residents in the region was estimated by following the method used by Stevens et al. (1991). We included a willingness to pay question in the household survey to elicit their maximum annual willingness to pay (in terms of donation) to sustain the elk conservation efforts in the long run. The question was adopted from Stevens et al. (1991) and Duffield (1991), who used it to elicit residents’ willingness to pay for conserving other wildlife of similar nature. Mean willingness to pay estimated at individual household were aggregated across the population of appropriate households in the region to derive the total estimate of existence value. Further details of estimation procedure, statistical modeling and assumptions are presented in Appendix F.
9
Results Survey Response
Out of 5,000 contacts, 18 were returned because the person being contacted was deceased or had moved from the stated address. A total of 1,005 surveys were returned, yielding an adjusted response rate of 20.17%. The response rate reported in our survey is consistent with several recent surveys that utilized randomized local residents as the sampling frame in a mail survey (e.g. Crank et al., 2010: 27% in Nebraska). It has been shown that people affected by or familiar with the issue are more likely to respond (Dillman et al. 2009). Considering the demands on people’ time and the constant barrage of telemarketing and political subjects, people are just as likely to simply be survey wary (Pelham and Blanton 2012). So, those responding may not necessarily provide biased results.
Nonetheless, this sample size is sufficient for the study area population of five counties,
with 95% confidence interval and 5% margin of error (Vaske, 2009). This response rate, although less than desirable, is not surprising considering the nature of the sampling frame. Residents who live outside of the elk restoration zone were oversampled compared to residents who live within the zone. This was done to ensure responses from a group who were deemed less likely to respond to a survey concerning elk management due to lack of contact with elk. No post-stratification weighting was applied because the response rate was consistent across the strata. Respondent demographics
In terms of demographic characteristics, the average age of the respondents was 60
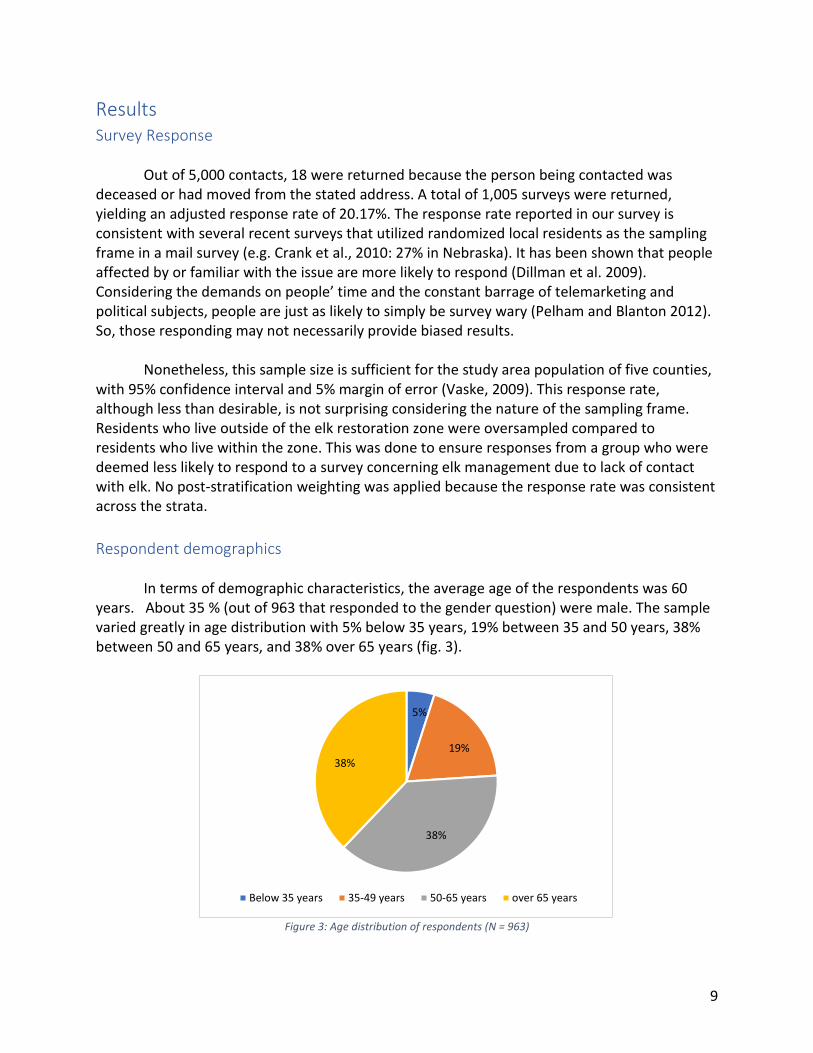
years. About 35 % (out of 963 that responded to the gender question) were male. The sample varied greatly in age distribution with 5% below 35 years, 19% between 35 and 50 years, 38% between 50 and 65 years, and 38% over 65 years (fig. 3).
Figure 3: Age distribution of respondents (N = 963)
5%
19%
38%
38%
Below 35 years 35-49 years 50-65 years over 65 years

10
Of 949 participants that responded to the employment question, about 40% reported to be full-time employees, 48% were retirees, and 7% had part-time employment. The remaining 5% included the unemployed, students, and military. Of 953 participants that responded to the education attainment question, 10% had some high school education, 34% had a high school diploma or GED, 35% had some college or associate degree, 12% had a bachelor’s degree, and remaining 8% had post graduate degree. Of 806 participants that responded to the income question, 55% indicated to have less than $50,000 in annual household gross income in 2017, another 31% reported between $50,000 and $100,000, and the remaining 14% more than $100,000 (fig. 4).
Figure 4: Distribution of respondents by income group (N = 806)
As an important goal of this survey was to assess attitudes towards elk hunting in Tennessee, we asked respondents whether they hunted for big or small game in Tennessee or elsewhere (fig.5). This was done to later compare attitudes towards elk hunting between hunters and non-hunters. About 35% of the respondents self-identified to be hunter whereas the remaining 64% stated otherwise.
Figure 5: Percentage of respondents by self-reported hunter status (N = 956)
25%
30%18%
13%
7%7%
Less than $25,000 $25,000 - $49,999 $50,000 - $74,999
$75,000 - $99,999 $100,000 - $124,999 $125,000 and more
36%
64%
Hunter
Non-Hunter

11
Property Characteristics Respondents were first asked whether they live or own property in the elk restoration
zone (ERZ), which was shown in a map. Of the 991 who responded to this question, the majority (67%) reported to live or own property within the ERZ (fig.6). The remaining 33% live within the 5-county study region, but outside the borders of the ERZ. The 667 respondents who live within the ERZ have lived there for an average length of 29 years with a range from 1 to 85 years. This indicates that the respondents in this study are generally long-term residents of the area.
Figure 6: Respondent by location of residence (N = 991)
Within the 5-county region of Anderson, Scott, Campbell, Morgan, and Claiborne counties, 853 respondents reported to own land, 89 respondents lease and, 78 live in the area but do not currently own or lease land. The average property size of those who own land is 29.25 acres and those who lease land is 270.30 acres.
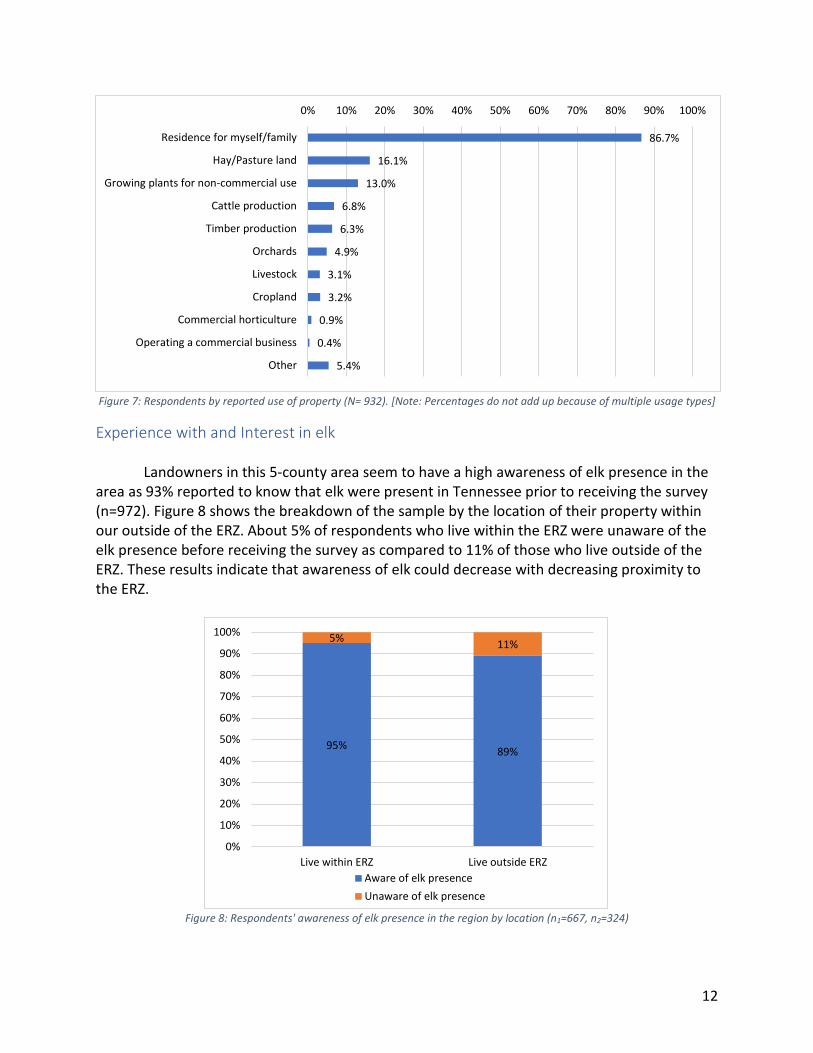
Respondents reported a variety of uses for their land (n = 932) (fig. 7). The majority of participants (86.7%) utilized their property as a residence for themselves and/or their families. 16% of respondents use their property for hay and pasture land, 13% use it for growing plants for non-commercial use, 7% use it for cattle production, 6% for timber production, 5% for orchards, 3% for other livestock, and 3% for cropland. Less than one percent of respondents use their land for commercial horticulture or operating a commercial business. A small fraction (5%) use their land for other purposes, which were self-reported such as housing horses for pleasure, hunting and outdoor recreation, and observing nature.
67%
33%Live within ERZ
Live outside ERZ
12
Figure 7: Respondents by reported use of property (N= 932). [Note: Percentages do not add up because of multiple usage types]
Experience with and Interest in elk Landowners in this 5-county area seem to have a high awareness of elk presence in the
area as 93% reported to know that elk were present in Tennessee prior to receiving the survey (n=972). Figure 8 shows the breakdown of the sample by the location of their property within our outside of the ERZ. About 5% of respondents who live within the ERZ were unaware of the elk presence before receiving the survey as compared to 11% of those who live outside of the ERZ. These results indicate that awareness of elk could decrease with decreasing proximity to the ERZ.
Figure 8: Respondents' awareness of elk presence in the region by location (n1=667, n2=324)
86.7%
16.1%
13.0%
6.8%
6.3%
4.9%
3.1%
3.2%
0.9%
0.4%
5.4%
0% 10% 20% 30% 40% 50% 60% 70% 80% 90% 100%
Residence for myself/family
Hay/Pasture land
Growing plants for non-commercial use
Cattle production
Timber production
Orchards
Livestock
Cropland
Commercial horticulture
Operating a commercial business
Other
95% 89%
5% 11%
0%
10%
20%
30%
40%
50%
60%
70%
80%
90%
100%
Live within ERZ Live outside ERZAware of elk presenceUnaware of elk presence

13
Participants had varying responses when asked to rate their level of interest in elk related activities in Tennessee (fig.9). The largest proportion of residents reported interest in having elk in Tennessee and watching elk as 64% were somewhat or very interested in watching elk and 66% had the same attitudes towards having elk in Tennessee. Smaller proportions reported interest in hunting elk (25%), learning more about elk management (40%), and providing input for decisions about elk management (33%). The majority of respondents to this question reported having little to no interest in hunting elk (69%). Overall, residents seem to be more interested in passive elk-related activities such as watching elk over active activities such as hunting or managing elk.
Figure 9: Respondents interest in elk-related activities in Tennessee (from left: n1= 958, n2=928, n3=945, n4=926, n5=921)
Respondents were asked to rate their level of agreement with various statements
regarding elk in Tennessee (fig. 10). The majority of respondents agreed with statements such as “I support a healthy population of elk in my region,” “having elk helps maintain balance in the natural environment,” “I enjoy having elk around my home and property,” “future generations should be able to see elk in Tennessee,” “ Elk are a valuable part of nature,” “elk have the right to exist wherever they occur,” “elk bring economic benefits to our communities through tourism,” and “even if I never see an elk in the wild, it is important for me to know they exist in Tennessee.” The majority of respondents disagreed with the statement “no need to protect elk in Tennessee because there are healthy populations elsewhere.”
11%
62%
14%23%
30%8%
7%
6%
13%
14%
17%
6%
14%
24%22%
17%
6%
14%
13%12%
47%
19%
52%
27% 21%
0%
10%
20%
30%
40%
50%
60%
70%
80%
90%
100%
Watching elk Hunting elk Having elk inTennessee
Learningmore about
elkmanagement
Providinginput fordecisionsabout elk
management
Very interested
Somewhat interested
Neutral
Somewhat uninterested
Not at all interested

14
Figure 10: Percentage of respondents with various level of agreements with elk related statements (N = 945)
To supplement this graph, mean responses for each statement can be seen in table 1.
Agreement was measured based on a 5 pt. Likert scale (1 – strongly disagree, 5 – strongly agree). On average, respondents were most strongly agreeable with the statements “even if I never see an elk in the wild, it is important for me to know they exist in Tennessee,” “elk are a valuable part of nature,” “future generations should be able to see elk in Tennessee,” and “I support a healthy population of elk in my region.” Again, respondents were most disagreeable towards the statement “no need to protect elk in Tennessee because there are healthy populations elsewhere.” Interestingly, an overwhelming majority agreed that elk are a valuable part of nature (82%) and future generations should be able to see elk in Tennessee (86%) but disagreed with the idea that protecting elk in Tennessee many not necessary just because they exist elsewhere (74%). These are strong evidences confirming that residents in general value elk’s presence in the landscape and support conservation.
6%
12%
74%
12%
5%
5%
48%
18%
16%
9%
43%
47%
10%
18%
25%
17%
15%
13%
9%
32%
35%
30%
28%
38%
31%
17%
76%
63%
9%
73%
82%
86%
20%
49%
54%
63%
19%
22%
73%
0% 20% 40% 60% 80% 100%
Even if I never see an elk in the wild, it is important for me toknow they exist in Tennessee
Elk bring economic benefits to our communities throughtourism
No need to protect elk in Tennessee because there arehealthy populations elsewhere
Elk have the right to exist wherever they occur
Elk are a valuable part of nature
Future generations should be able to see elk in Tennessee
Elk threaten the economic prosperity of farmers in Tennessee
Elk compete with other wildlife for food and resources
I enjoy having elk around my home and property
Having elk helps maintain balance in the natural environment
The cost of managing elk outweighs the benefits they bring
Management should focus on doing what is best for peopleinstead of what is best for elk
I support establishing a healthy population of elk in my region
Disagree Neutral Agree
15
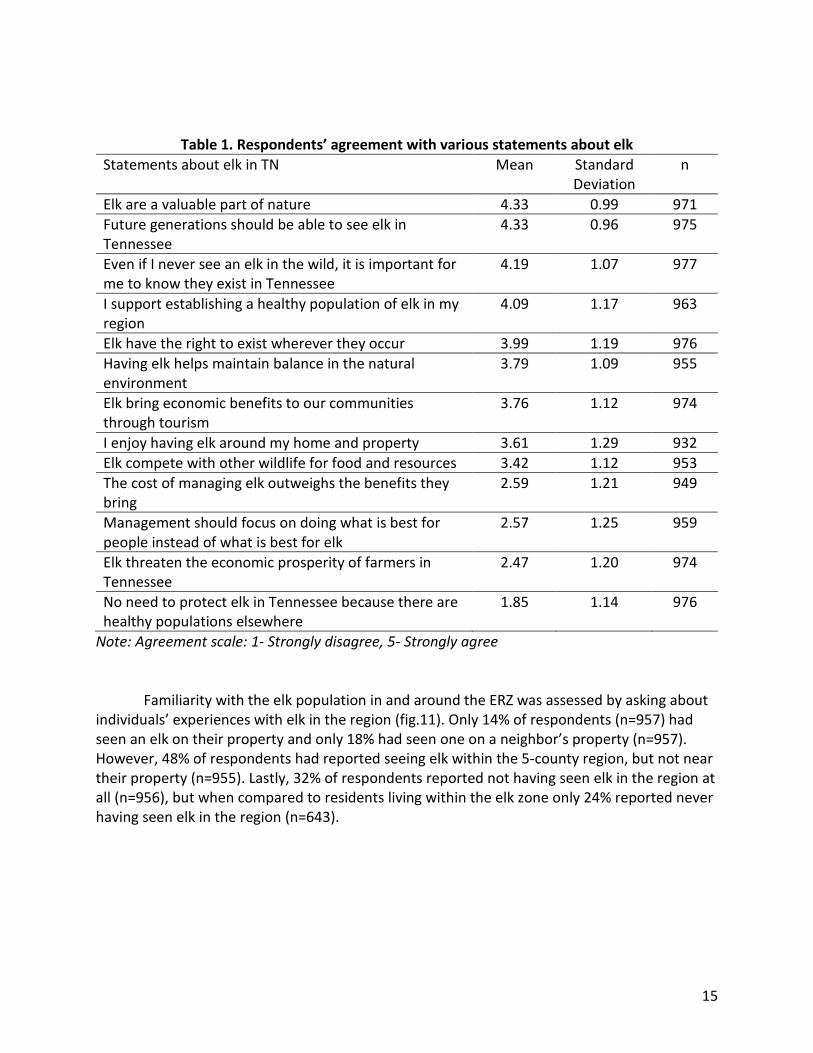
Table 1. Respondents’ agreement with various statements about elk Statements about elk in TN Mean Standard
Deviation n
Elk are a valuable part of nature 4.33 0.99 971 Future generations should be able to see elk in Tennessee
4.33 0.96 975
Even if I never see an elk in the wild, it is important for me to know they exist in Tennessee
4.19 1.07 977
I support establishing a healthy population of elk in my region
4.09 1.17 963
Elk have the right to exist wherever they occur 3.99 1.19 976 Having elk helps maintain balance in the natural environment
3.79 1.09 955
Elk bring economic benefits to our communities through tourism
3.76 1.12 974
I enjoy having elk around my home and property 3.61 1.29 932 Elk compete with other wildlife for food and resources 3.42 1.12 953 The cost of managing elk outweighs the benefits they bring
2.59 1.21 949
Management should focus on doing what is best for people instead of what is best for elk
2.57 1.25 959
Elk threaten the economic prosperity of farmers in Tennessee
2.47 1.20 974
No need to protect elk in Tennessee because there are healthy populations elsewhere
1.85 1.14 976
Note: Agreement scale: 1- Strongly disagree, 5- Strongly agree
Familiarity with the elk population in and around the ERZ was assessed by asking about individuals’ experiences with elk in the region (fig.11). Only 14% of respondents (n=957) had seen an elk on their property and only 18% had seen one on a neighbor’s property (n=957). However, 48% of respondents had reported seeing elk within the 5-county region, but not near their property (n=955). Lastly, 32% of respondents reported not having seen elk in the region at all (n=956), but when compared to residents living within the elk zone only 24% reported never having seen elk in the region (n=643).

16
Figure 11: Respondents familiarity with the elk in the region (from left: n1= 957, n2=957, n3=955,n4=956) [Note: Percentages do
not add up because multiple options could be checked]
Elk viewing As stated earlier 64% of respondents were interested in viewing elk in Tennessee,
however only 31% of respondents had visited the Hatfield Knob elk viewing tower in Campbell County or other places within the NCWMA (n=979). Of those who had visited the tower, respondents and their families visited an average of 2.95 times in 2017.
Out of 975 respondents, 24% had visited other places in Tennessee to view or photograph elk (n=975). The 233 respondents who had visited other places to view elk reported a variety of location names. Table 2 shows the frequency for most commonly listed locations. These place names were self-reported and often consisted of colloquial names for locations. Places that were similar in located were grouped together. For example, under the umbrella “GSMNP,” we included responses such as “Cades Cove” and “Cattaloochee” along with responses like “Smokey Mountains” and “Smokies in NC.”
Table 2. Locations where respondents reported to have visited in order to view elk Location Frequency
Near home 15 Buffalo, TN 8
GSMNP 28 Caryville Mountain 9
Dutch Valley 14 Elk Valley 16
Norma, TN 27 ERZ 41
Wartburg, TN 13 Oneida, TN 10
Other places 33
14%18%
48%
32%
0%
10%
20%
30%
40%
50%
60%
Have seen elk onproperty
Have seen elk onneighbors property
Have seen elk in theregion, not near
property
Have not seen elk inregion
17
As elk have ventured outside of the elk restoration zone, so have residents trying to catch a glimpse of them. Several respondents reported seeing elk in the Wartburg, Oneida, Norma, Elk Valley, Caryville Mountain, Dutch Valley, and Buffalo mountain areas, which all reside outside of the ERZ. Respondents reported driving an average of 24.85 miles to get to these other locations (n=253). This pattern along with the fact that 66% of residents are interested in elk watching shows that residents might be interested in additional elk viewing locations in the area.
It is also interesting to note that while the question specifically asked about places
respondents have visited in Tennessee, several responses were given from outside the state such as in the North Carolina side of Great Smokey Mountain National Park (GSMNP) and Land Between the Lakes, Kentucky (here, listed under “other places”) Elk damage concerns
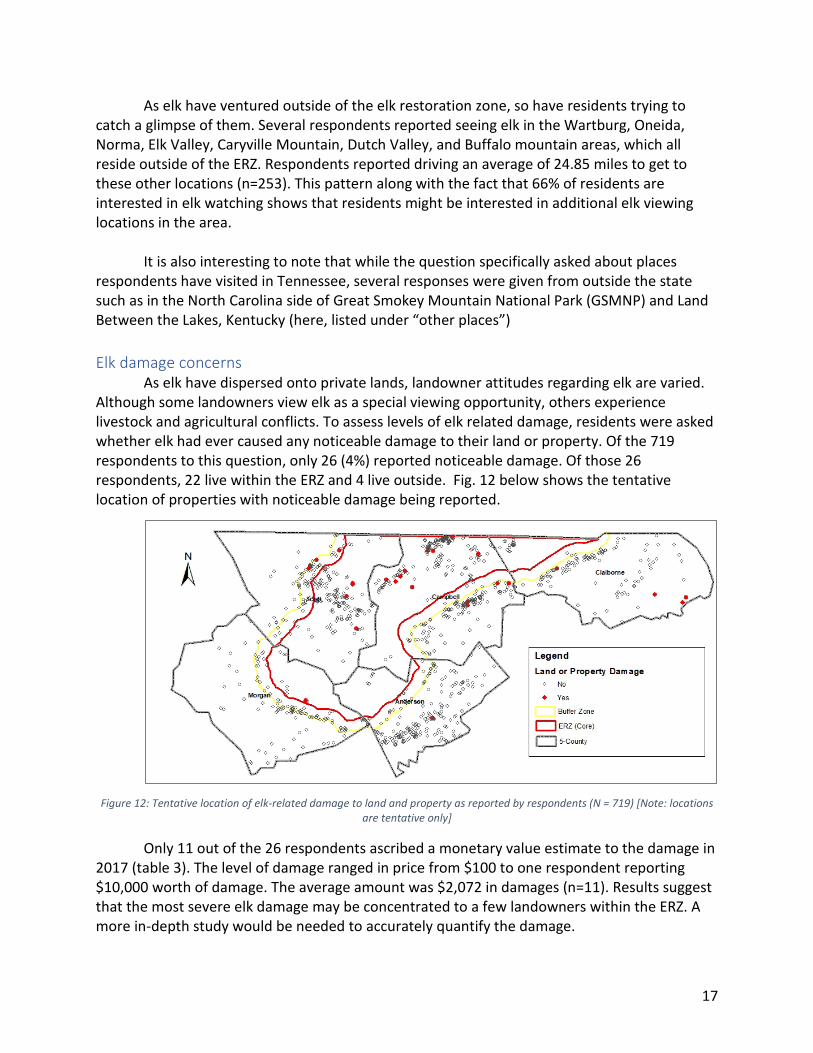
As elk have dispersed onto private lands, landowner attitudes regarding elk are varied. Although some landowners view elk as a special viewing opportunity, others experience livestock and agricultural conflicts. To assess levels of elk related damage, residents were asked whether elk had ever caused any noticeable damage to their land or property. Of the 719 respondents to this question, only 26 (4%) reported noticeable damage. Of those 26 respondents, 22 live within the ERZ and 4 live outside. Fig. 12 below shows the tentative location of properties with noticeable damage being reported.
Figure 12: Tentative location of elk-related damage to land and property as reported by respondents (N = 719) [Note: locations
are tentative only]
Only 11 out of the 26 respondents ascribed a monetary value estimate to the damage in 2017 (table 3). The level of damage ranged in price from $100 to one respondent reporting $10,000 worth of damage. The average amount was $2,072 in damages (n=11). Results suggest that the most severe elk damage may be concentrated to a few landowners within the ERZ. A more in-depth study would be needed to accurately quantify the damage.
18
Table 3. Frequency of respondents’ estimates of damage (n=11) Self-reported estimates of damage Frequency
$100 2 $200 1 $300 3 $500 1
$1,000 1 $3,000 1 $7,000 1
$10,000 1
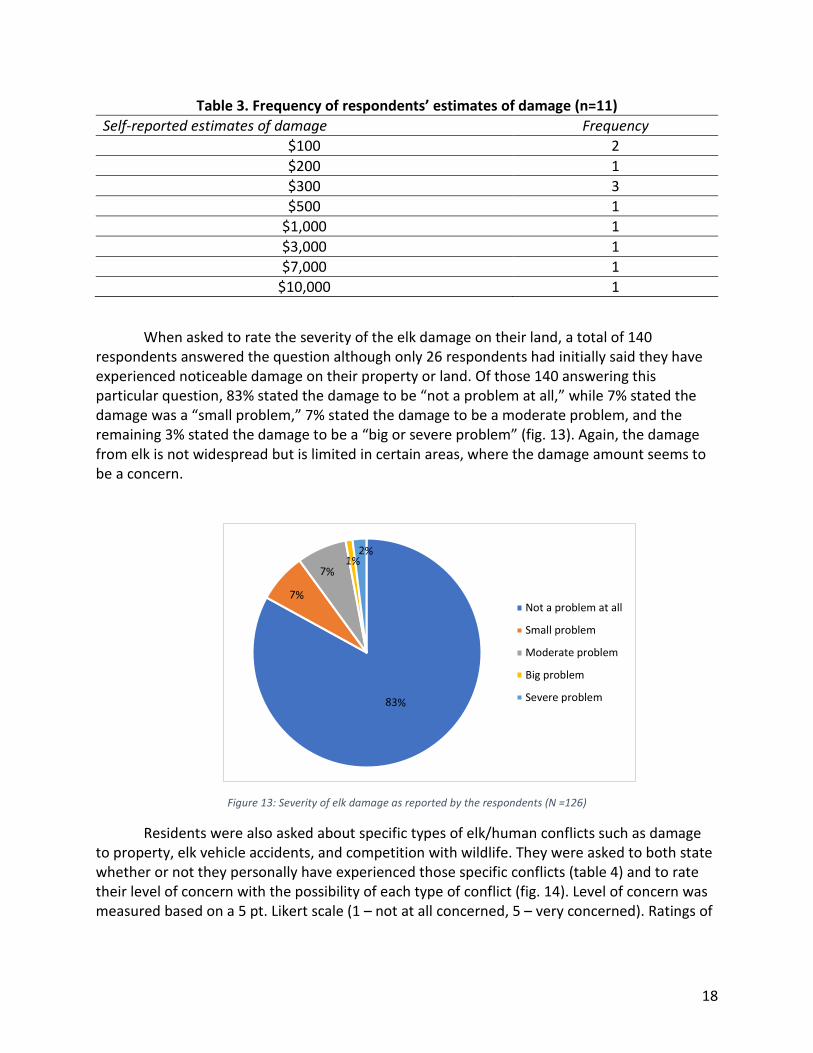
When asked to rate the severity of the elk damage on their land, a total of 140 respondents answered the question although only 26 respondents had initially said they have experienced noticeable damage on their property or land. Of those 140 answering this particular question, 83% stated the damage to be “not a problem at all,” while 7% stated the damage was a “small problem,” 7% stated the damage to be a moderate problem, and the remaining 3% stated the damage to be a “big or severe problem” (fig. 13). Again, the damage from elk is not widespread but is limited in certain areas, where the damage amount seems to be a concern.
Figure 13: Severity of elk damage as reported by the respondents (N =126)
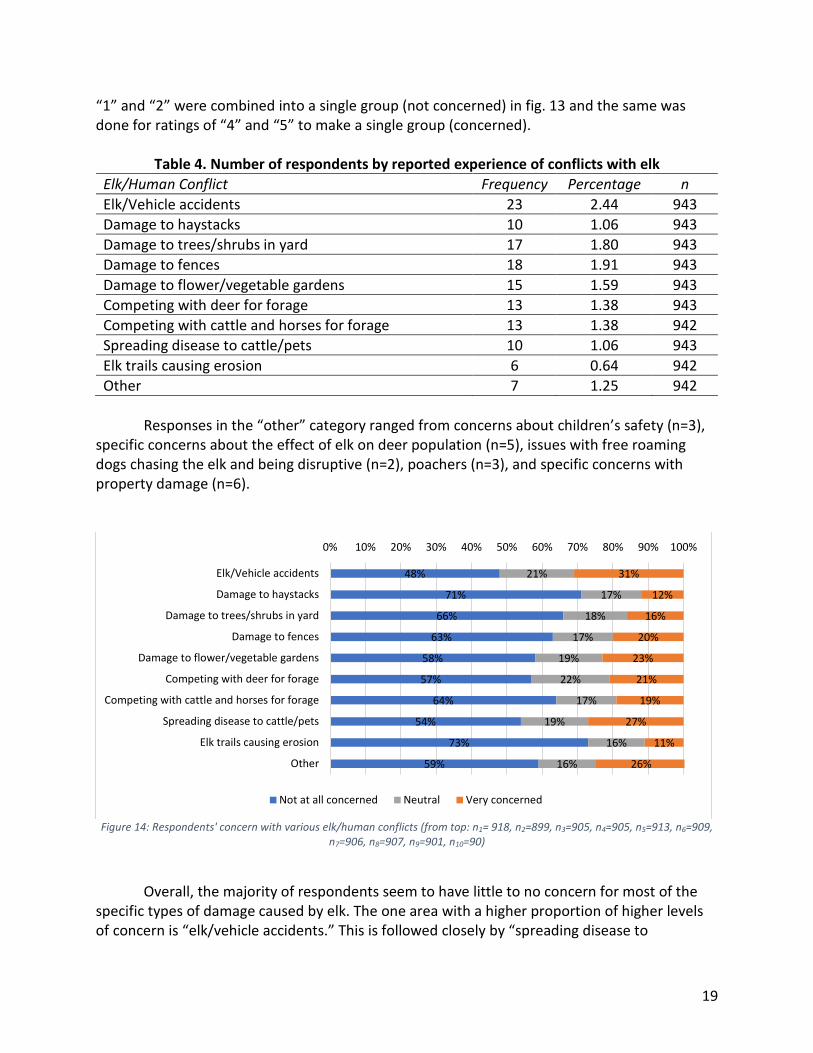
Residents were also asked about specific types of elk/human conflicts such as damage to property, elk vehicle accidents, and competition with wildlife. They were asked to both state whether or not they personally have experienced those specific conflicts (table 4) and to rate their level of concern with the possibility of each type of conflict (fig. 14). Level of concern was measured based on a 5 pt. Likert scale (1 – not at all concerned, 5 – very concerned). Ratings of
Not a problem at all
Small problem
Moderate problem
Big problem
Severe problem
19
“1” and “2” were combined into a single group (not concerned) in fig. 13 and the same was done for ratings of “4” and “5” to make a single group (concerned).
Table 4. Number of respondents by reported experience of conflicts with elk Elk/Human Conflict Frequency Percentage n Elk/Vehicle accidents 23 2.44 943 Damage to haystacks 10 1.06 943 Damage to trees/shrubs in yard 17 1.80 943 Damage to fences 18 1.91 943 Damage to flower/vegetable gardens 15 1.59 943 Competing with deer for forage 13 1.38 943 Competing with cattle and horses for forage 13 1.38 942 Spreading disease to cattle/pets 10 1.06 943 Elk trails causing erosion 6 0.64 942 Other 7 1.25 942
Responses in the “other” category ranged from concerns about children’s safety (n=3),
specific concerns about the effect of elk on deer population (n=5), issues with free roaming dogs chasing the elk and being disruptive (n=2), poachers (n=3), and specific concerns with property damage (n=6).
Figure 14: Respondents' concern with various elk/human conflicts (from top: n1= 918, n2=899, n3=905, n4=905, n5=913, n6=909,
n7=906, n8=907, n9=901, n10=90)
Overall, the majority of respondents seem to have little to no concern for most of the specific types of damage caused by elk. The one area with a higher proportion of higher levels of concern is “elk/vehicle accidents.” This is followed closely by “spreading disease to
48%
71%
66%
63%
58%
57%
64%
54%
73%
59%
21%
17%
18%
17%
19%
22%
17%
19%
16%
16%
31%
12%
16%
20%
23%
21%
19%
27%
11%
26%
0% 10% 20% 30% 40% 50% 60% 70% 80% 90% 100%
Elk/Vehicle accidents
Damage to haystacks
Damage to trees/shrubs in yard
Damage to fences
Damage to flower/vegetable gardens
Competing with deer for forage
Competing with cattle and horses for forage
Spreading disease to cattle/pets
Elk trails causing erosion
Other
Not at all concerned Neutral Very concerned

20
cattle/pets,” although the majority of respondents found this to be of little concern. The types of damage with the lowest proportion of respondents claiming high levels of concern were “damage to haystacks,” “damage to trees/shrubs in yard,” and “elk trails causing erosion.” Results suggest the elk/vehicle accidents are the major source of concern when it comes to elk related damage. Elk hunting
One of the goals of the elk restoration proposal (TWRA 2000) was to “develop a self-
sustaining herd, capable of providing wildlife viewing opportunities and sustainable hunting.” As such, we asked residents several questions about the public elk hunt as well as the possibility of allowing private elk hunting in Tennessee. The majority of respondents (69%) stated to have little to no interest in hunting elk (n=928), however 51% found hunting to be somewhat or completely acceptable to allow elk hunting by licensed hunters (n=940). This is not surprising considering that only 35% of respondents to this survey self-identified as hunters. This suggests that while the respondents to this survey were generally not interested in hunting elk, they have mixed attitudes towards the idea of allowing others the right to do so. Additionally, 6% of respondents had applied for an elk hunting permit in Tennessee since elk hunting opened in the state (n=956). Private land elk hunting
Respondents were asked to rate their level of acceptance for allowing landowners and their designees to hunt elk on private land (fig 15). Of 935 respondents, 46% found this to be completely or somewhat acceptable whereas another 25% of respondents were neutral to this. The remaining 29% found this to be completely or somewhat unacceptable. These evidences suggest that introducing a new management strategy to let landowners hunt elk on private land may fairly acceptable to landowners. There was no significant difference among strata (ERZ, Buffer zone, and Peripheral) in terms of these acceptability ratings.
Figure 15: Respondents' acceptability of allowing landowners and their designees to hunt elk on private land (N = 935)
18%
11%
25%21%
25%
Completelyunacceptable
Somewhatunacceptable
Neutral
Somewhat acceptable
Competely acceptable

21
When comparing hunters and non-hunters, however, hunting on private land becomes more acceptable to hunters (fig.16). About 60% of hunters find private land hunting to be acceptable, while only 37% of non-hunters find it to be so. Unacceptability rates show a similar pattern as a larger proportion of non-hunters find private hunting to be unacceptable (33%) when compared to hunters (23%).
Figure 16: Respondents' acceptability of allowing private landowners and their designees to hunt elk on private land (from left:
n1= 578, n2= 334)
Currently, 2% of respondents stated that they allow elk hunting on their property (n=706). However, when asked about future, 27% of respondents stated that they might or definitely would allow hunting on their property (n=458) (fig.17). For those who were possibly or definitely interested in allowing hunting on their property in the future, the average amount of access fee expected was $298 per season. Respondents stated a range of values from $0 to $5,000. There was no significant difference among strata (ERZ, Buffer zone, and Peripheral) in terms of proportion who would allow elk hunting on their land in future.
Figure 17: Respondents’' willingness to allow hunting access on their property in the future (N = 458) [Note: this graph excludes
respondents who cited “not enough land” as the reason for not allowing hunting access]
23%33%
17%
30%
60%
37%
0%
10%
20%
30%
40%
50%
60%
70%
80%
90%
100%
Hunters Non-hunters
Unacceptable Neutral Acceptable
18%
73%
9%
yes
no
maybe

22
Respondents were then asked to choose the option that best described their main reason for allowing elk hunting on their property now or in the future (fig. 18). The most frequently stated motivation was “I believe we should be able to hunt elk just like other game animals,” which was chosen by 54% of respondents. This was followed by the motivations “to help control the elk population” at 21% and “to reduce crop or property damage” at 6% of respondents. Responses in the “other” category ranged from “to eat elk meat,” to “to increase the deer population,” and “to educate children.”
Figure 18: Proportion of respondents that were interested in allowing elk hunting on private land, by motivation (N = 226)
Respondents who stated that they would not allow elk hunting on their property now or in the future were also asked to state their motivations for doing so. The question asked for several possible reasons they would not allow elk hunting on their property. Out of 625 respondents, 40% stated that they did not have enough land to allow elk hunting on their property (fig. 19). Out of 622 respondents, 38% stated that they enjoyed seeing elk alive on their property too much to allow hunting. Out of 625 respondents, 36% were worried about potential injury to family or neighbors caused by hunting.
6%
21%
54%
4% 4%
11%
0%
10%
20%
30%
40%
50%
60%
To reducecrop or
propertydamge
To helpcontrol elkpopulation
I believe weshould be
able to huntelk just likeother game
animals
To generateextra income
I don't likewild animals
on myproperty
Other

23
Figure 19: Proportion of respondents that would not allow hunting access on private land, by motivation (from top: n1= 622,
n2=625, n3=625, n4=625, n5=625, n6=625, n7=623, n8=482) [Note: percentages do not add up because respondents were allowed to check multiple responses]
Responses in the “other” category ranged from not liking hunting at all (n=22), living in a more urban/suburban setting with small plots of land (n=20), not liking hunters damaging or being disrespectful to property (n=6), worrying about cattle and livestock on property (n=4), and elk population concerns (n=4). Human Elk Interaction
Respondents were presented with the following choice scheme and asked to indicate their preferred level of interactions between people and elk on or near their property. Situation A
• No elk exist.
Situation B
• Elk are almost never seen • Residents including you rarely have
damage to fences, crops, gardens, or trees
• A low number of elk are present for wildlife viewing or other activities
Situation C
• Elk are sometimes seen • Residents including you have occasional
damage to fences, gardens, crops, or trees
• A moderate number of elk are present for wildlife viewing or other activities
Situation D
• Elk are regularly seen • Residents including you have regular
damage to fences, gardens, crops, or other trees
• Many elk are present for wildlife viewing or other activities
38%
4%
36%
15%
24%
40%
10%
13%
0% 10% 20% 30% 40% 50%
I enjoy seeing them alive on my property
Lack of interested hunters
Potential injury to family or neighbors
I would rather hunt myself than lettingothers in
Potential liability/lawsuits
Not enough land/compensation
I am not sure if this is legal
Other

24
About 40% of respondents chose situation B, 33% chose situation A, 23% chose situation C, and 5% chose situation D as their preferred level of interaction (n=941) (fig.20). We then asked which of the same four situations describes the current level of the elk population and their interaction with them in the area they live. About 41% stated that situation A best described the current conditions, while 38% stated situation B, 11% stated situation C, 3% stated situation D, and 7% were unsure (n=957).
Figure 20: Respondents' perception of current and preferred level of elk population (ncurrent=957, npreferred=941)
There were some notable variation among strata in terms of preferred level of elk population and perception of current population level (table 5). For example, 52% of those living inside the ERZ indicated situation B as the current level of population and 46% in the stratum indicated this to be preferred situation. The most preferred situation in buffer zone was also situation B, with 45% indicating preference for this, and about the same number also indicating this to be their perceived level of current elk population in the area. Surprisingly, the preferred scenario in Peripheral region, where currently no elk exist was also A. Considering that Situation B is the most preferred scenario in each location, it appears that local resident do want to see elk but in a very controlled numbers.
Table 5. Respondent’s perception of current and preferred elk population in their surroundings, by location
ERZ Buffer zone Peripheral
Current Preferred Current Preferred Current Preferred Situation A 29% 28% 39% 30% 66% 43% Situation B 52% 46% 46% 45% 23% 27% Situation C 14% 21% 12% 21% 10% 26% Situation D 5% 5% 3% 5% 1% 4%
33%
39%
23%
5%
41%38%
11%
3%
0%
5%
10%
15%
20%
25%
30%
35%
40%
45%
Situation A Situation B Situation C Situation D
Preffered Current

25
Elk Management Respondents were asked to rate the acceptability of possible elk management strategies
within the local 5-county area. In a 5-point acceptability scale (1-very unacceptable, 2-somewhat unacceptable, 3-neutral, 4-somewhat acceptable, 5-very acceptable), residents on average expressed acceptable or neutral opinions. As table 6 shows, the relative acceptability was highest for “installing signs and speed limits in highways to avoid elk collision” and “educate people about living with elk,” and lowest for “allowing landowners and their designees to hunt elk on private land.”
Table 6. Acceptance levels for local elk management strategies Management Action Mean Standard
deviation N
Educate people about living with elk 4.30 0.99 939
Install signs and speed limits in highways to avoid elk collision
4.30 1.04 941
Construct elk food plots and open habitat areas within WMAs
4.24 1.07 936
Allow regulated hunting by licensed hunters 3.87 1.29 931 Expand protection for elk by protecting more land in or around the restoration zone
3.64 1.23 927
Offer nuisance elk control permit to landowners 3.55 1.23 935
Use fencing to keep elk off of private property 3.36 1.30 931
Trap elk and relocate to another location 3.25 1.24 925
Allow landowners and their designees to hunt elk on private land
3.23 1.41 935
Haze elk away from private land 2.93 1.23 901
Note: The acceptance scale: 1-very unacceptable, 2-somewhat unacceptable, 3-neutral, 4-somewhat acceptable, 5-very acceptable As fig.21 shows below, residents on average expressed acceptable or neutral opinions towards all management options. It is of interest to note that the management strategy with the highest relative acceptability involved installing signs to limit elk vehicle collisions, as collisions were the number one concern for respondents concerning elk/human conflicts. The management options with the lowest relative acceptability include hazing, hunting, and relocating the elk, or using fencing to keep elk away. It is possible that these strategies might seem too aggressive considering the low number of respondents who were concerned about elk damage.

26
Figure 21: Respondents acceptance of various elk management strategies (from top, n1=936, n2=935, n3=927, n4=931, n5=939,
n6=941, n7=925, n8=935, n9=901, n10=931)
Respondents were asked about additional elk management strategies that may benefit residents from inside or outside the 5-county area of this study. In a 5-point acceptability scale (1-very unacceptable, 5-very acceptable), residents generally expressed acceptable or neutral opinions. However, the relative acceptability scores were higher for activities promoting non-consumptive use of elk such as elk viewing and lower for activities corresponding to consumptive use such as hunting (table 7).
Table 7. Acceptance levels for statewide elk management strategies Management Action Mean Standard
deviation n
Develop elk viewing opportunities in multiple locations
4.26 1.05 945
Design and implement statewide promotion of elk tourism
4.05 1.11 943
Give priority for local landowners in elk permit lottery drawing
3.67 1.28 937
Promote elk hunting opportunities for local and tourists
3.44 1.40 940
Establish a private land only elk hunting program 3.43 1.29 943 Note: The acceptance scale: 1-very unacceptable, 5-very acceptable
13%
17%
18%
15%
4%
3%
9%
8%
9%
4%
8%
14%
11%
11%
3%
1%
6%
7%
7%
2%
35%
40%
25%
29%
13%
16%
18%
30%
30%
15%
18%
16%
21%
21%
20%
23%
23%
23%
26%
22%
26%
13%
25%
24%
60%
57%
44%
32%
28%
57%
0% 10% 20% 30% 40% 50% 60% 70% 80% 90% 100%
Use fencing to keep elk off of private property
Haze elk away from private land
Allow landowners and their designees to hunt elk onprivate land
Trap elk and relocate to another location
Install signs and speed limits in highways to avoid elkcollision
Educate people about living with elk
Allow regulated hunting by licensed hunters
Expand protection for elk by protecting more land in oraround the restoration zone
Offer nuisance elk control permit to landowners
Construct elk food plots and open habitat areas withinWMAs
Completely unacceptable Somewhat unacceptable Neutral
Somewhat acceptable Completely Acceptable
27
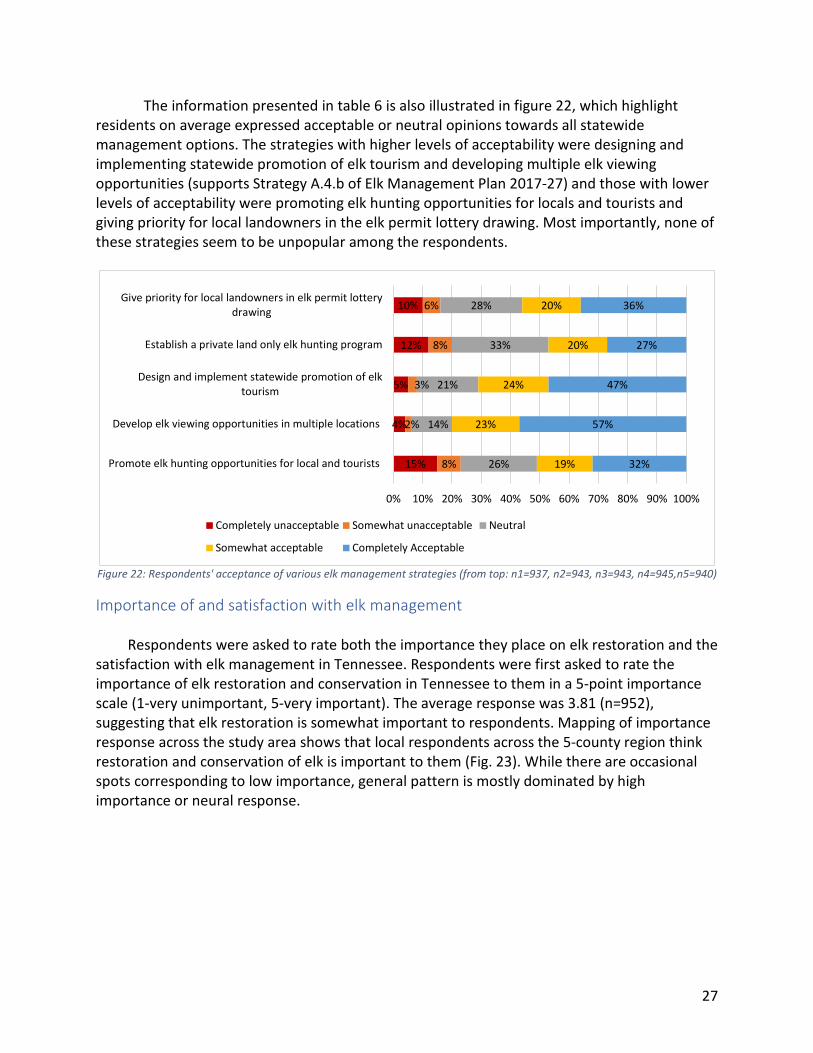
The information presented in table 6 is also illustrated in figure 22, which highlight residents on average expressed acceptable or neutral opinions towards all statewide management options. The strategies with higher levels of acceptability were designing and implementing statewide promotion of elk tourism and developing multiple elk viewing opportunities (supports Strategy A.4.b of Elk Management Plan 2017-27) and those with lower levels of acceptability were promoting elk hunting opportunities for locals and tourists and giving priority for local landowners in the elk permit lottery drawing. Most importantly, none of these strategies seem to be unpopular among the respondents.
Figure 22: Respondents' acceptance of various elk management strategies (from top: n1=937, n2=943, n3=943, n4=945,n5=940)
Importance of and satisfaction with elk management
Respondents were asked to rate both the importance they place on elk restoration and the satisfaction with elk management in Tennessee. Respondents were first asked to rate the importance of elk restoration and conservation in Tennessee to them in a 5-point importance scale (1-very unimportant, 5-very important). The average response was 3.81 (n=952), suggesting that elk restoration is somewhat important to respondents. Mapping of importance response across the study area shows that local respondents across the 5-county region think restoration and conservation of elk is important to them (Fig. 23). While there are occasional spots corresponding to low importance, general pattern is mostly dominated by high importance or neural response.
15%
4%
5%
12%
10%
8%
2%
3%
8%
6%
26%
14%
21%
33%
28%
19%
23%
24%
20%
20%
32%
57%
47%
27%
36%
0% 10% 20% 30% 40% 50% 60% 70% 80% 90% 100%
Promote elk hunting opportunities for local and tourists
Develop elk viewing opportunities in multiple locations
Design and implement statewide promotion of elktourism
Establish a private land only elk hunting program
Give priority for local landowners in elk permit lotterydrawing
Completely unacceptable Somewhat unacceptable Neutral
Somewhat acceptable Completely Acceptable

28
Figure 23: Respondents reported importance of restoring and conserving elk in Tennessee (N = 952) [locations are tentative only]
Respondents were then asked to rate their satisfaction with the current elk management effort in Tennessee in a 5-point satisfaction scale (1-very satisfied, 5-very satisfied). The average response was 3.67 (n=937), suggesting that respondents are fairly satisfied with elk management in Tennessee. Mapping of satisfaction response also shows that residents across the 5-0county region are fairly satisfied with the current effort (fig. 24). There was no outstanding hotspots of dissatisfaction and several small pockets of high satisfaction response were common in different places.
Figure 24: Respondents' reported satisfaction with the current elk management effort in Tennessee (N = 937) [locations are
tentative only]
29
Confidence and Trust in Restoration
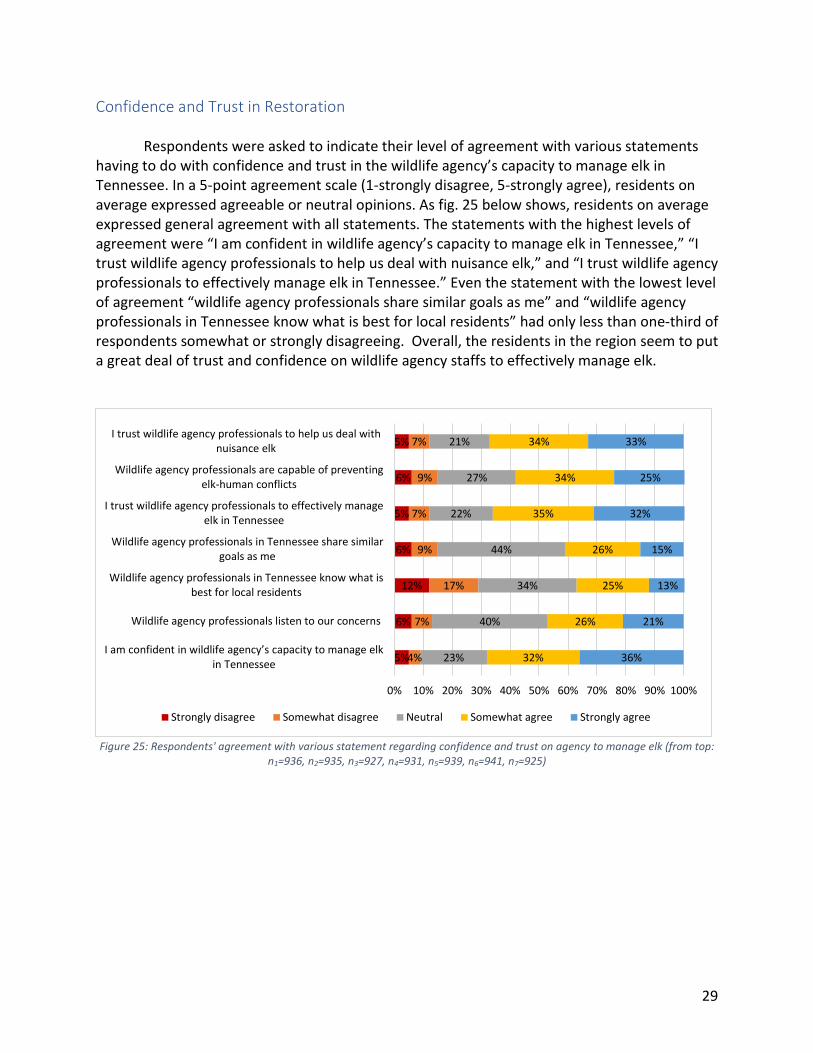
Respondents were asked to indicate their level of agreement with various statements having to do with confidence and trust in the wildlife agency’s capacity to manage elk in Tennessee. In a 5-point agreement scale (1-strongly disagree, 5-strongly agree), residents on average expressed agreeable or neutral opinions. As fig. 25 below shows, residents on average expressed general agreement with all statements. The statements with the highest levels of agreement were “I am confident in wildlife agency’s capacity to manage elk in Tennessee,” “I trust wildlife agency professionals to help us deal with nuisance elk,” and “I trust wildlife agency professionals to effectively manage elk in Tennessee.” Even the statement with the lowest level of agreement “wildlife agency professionals share similar goals as me” and “wildlife agency professionals in Tennessee know what is best for local residents” had only less than one-third of respondents somewhat or strongly disagreeing. Overall, the residents in the region seem to put a great deal of trust and confidence on wildlife agency staffs to effectively manage elk.
Figure 25: Respondents' agreement with various statement regarding confidence and trust on agency to manage elk (from top:
n1=936, n2=935, n3=927, n4=931, n5=939, n6=941, n7=925)
5%
6%
12%
6%
5%
6%
5%
4%
7%
17%
9%
7%
9%
7%
23%
40%
34%
44%
22%
27%
21%
32%
26%
25%
26%
35%
34%
34%
36%
21%
13%
15%
32%
25%
33%
0% 10% 20% 30% 40% 50% 60% 70% 80% 90% 100%
I am confident in wildlife agency’s capacity to manage elk in Tennessee
Wildlife agency professionals listen to our concerns
Wildlife agency professionals in Tennessee know what isbest for local residents
Wildlife agency professionals in Tennessee share similargoals as me
I trust wildlife agency professionals to effectively manageelk in Tennessee
Wildlife agency professionals are capable of preventingelk-human conflicts
I trust wildlife agency professionals to help us deal withnuisance elk
Strongly disagree Somewhat disagree Neutral Somewhat agree Strongly agree

30
Economic value of elk in Tennessee As stated earlier, part of the objective of this study was to characterize the economic
importance of elk in Tennessee. To meet this objective, we focused on three types of values including opportunity for hunting, elk viewing, and existence value. Our analysis focused on these three dimensions because they constitute the most common ways people interact or relate with the consumptive and non-consumptive use of elk in the study area. Details of economic estimation methods are presented in Appendix E, and the estimated economic value of each type are presented below. Hunting elk Results from a zonal travel cost model of demand for hunting at North Cumberland Wildlife Management Area (NCWMA) in Tennessee were analyzed to first estimate expected benefit (of opportunity to hunt if permit is given) at zip code level, and then extrapolate zip code level benefits to the entire set of Zip codes from where TWRA receives elk permit application. The net economic benefit of the opportunity of receiving a permit to hunt elk at NCWMA per person was estimated to be $212 (95% CI: $197, $228) and $260 (95% CI: $241, $281) depending upon modeling assumptions. This indicates the net benefit of opportunity to hunt elk in NCWMA. The lower value of $212 was estimated when the economic modeling did not consider hunters’ opportunity cost of time involved in travelling from their residence to the NCWMA whereas the higher value of $2601 was estimated when the modeling considered one-third of the wage rate as opportunity cost of time. This estimate is very similar to benefits reported in the literature and confirms that elk hunting in Tennessee has a substantial economic benefit to the resident and non-resident hunters. Since the benefit estimates reported in the literature are mostly based on decades-old studies conducted in the western states, estimates presented in this study uniquely update the literature on economic value of elk hunting. In fact, this is the only study of elk hunting valuation in the east of Rocky Mountain region.
It should be noted that the value of hunting opportunity is not limited to 5-county but the entire population of potential elk hunters (residential and non-residential) that apply for elk hunting in Tennessee. When aggregated across potential hunter population, annual total net economic benefits of the opportunity to hunt elk on the NCWMA ranged from $2.07 (when no opportunity cost of time assumed) and $2.54 million (when one-third of wage is assumed for opportunity cost of time). Since the standard practice of calculating travel cost in recreation economics includes some fraction (i.e. 33%) of wage rate in opportunity cost of travel time, it is reasonable to conclude that the net benefit of elk hunting opportunity in Tennessee is $212 for 1 A study by Fried et al. (1995) had estimated hunter’s average willingness to pay for a virtually certain opportunity to shoot an elk in eastern Oregon to be $287 (i.e. $432 in 2017 dollar). Furthermore, a recent benefit transfer study utilizing estimates from 12 studies found the mean value of elk hunting to be $103 per person per day, with values ranging from $27 to $367 in survey –based studies (Rosenberger et al. 2016)

31
a single hunter, and $2.54 million for the entire elk hunter population. As this measure captures the net benefit, this estimate shows how much elk hunting opportunity in NCWMA worth to residential and non-residential hunters in Tennessee. In other words, this value indicates hunters’ loss of welfare if elk hunting opportunity at NCWMA is closed to hunters. Viewing elk Results from individual travel cost model were utilized to estimate the net economic benefit a household derives from a trip to view elk within 5-county region of NCWMA. Benefit estimated at household level was then aggregated for the population of households in and outside the 5-county region.
Of 1,005 respondents, 372 indicated to have visited the Hatfield Knob Tower or other places within the 5-county region for elk viewing in 2017. On average, respondents who traveled for the primary purpose of elk viewing took 2.95 trips to Hatfield Knob Tower in 2017. Economic analysis indicated that the net benefit a household derived from a trip to view elk in NCWMA ranged from $20 (95% CI: $12, $49) when no opportunity cost of time is assumed in travel to $44 (95% CI: $29, $98) when one-third of wage rate is assumed for opportunity cost of time involved in travel. Since it is a standard practice in non-market valuation to account for some fraction (i.e. 33%) of wage rate as opportunity cost of time involved, we estimate the economic benefit of elk viewing in NCWMA to be $44/trip per household. Again, this is a measure of economic benefit a household enjoys by having elk viewing opportunity in the region. In other words, for each elk viewing trip lost due to absence of elk in the region, households will experience a loss of $44.
The above-estimated benefit at household level was aggregated to the population of
households in the region. Since only 31.31% respondents in the sample indicated to have made trips for elk viewing, the same proportion of households in the population was considered as beneficiaries in the 5-county region. Aggregating the benefit to the estimated beneficiaries households in the 5-county region revealed a total value of $1.38 million (with no opportunity cost of time assumed) and $3.04 million (with one-third of wage rate assumed as the opportunity cost of time). Again, these dollar figures correspond the estimated loss of welfare for local residents if the elk viewing opportunities in the region were to be taken away. It should be noted that elk viewing opportunities are enjoyed by residents living outside the five-counties. For example, based on multiple years of survey conducted by UT Human Dimensions Lab and Campbell Outdoor Recreation Association (UT Human Dimensions Lab, 2015), it was found that as high as 63.22% of the visitors at Hatfield Knox tower were non-locals (outside the five county region). Hence, by considering both local and non-local visitors in benefit aggregation procedure, the total value of elk viewing could be as low as $2.21 million and high as $4.87 million2 assuming a very conservative scenario of non-local visitors taking only one trip 2 A similar study conducted by Donovan and Champ (2009) estimated the economic benefits of elk viewing at the Jewell Meadows Wildlife Area in Oregon (elk herd size= 250) to be $6.5 million (i.e. $7.7 million in 2017 dollar).
32
annually. This is a reasonable assumption because slightly less than half of the non-local visitors were out of state visitors, who are less likely to take frequent trips.
Existence (non-use) value
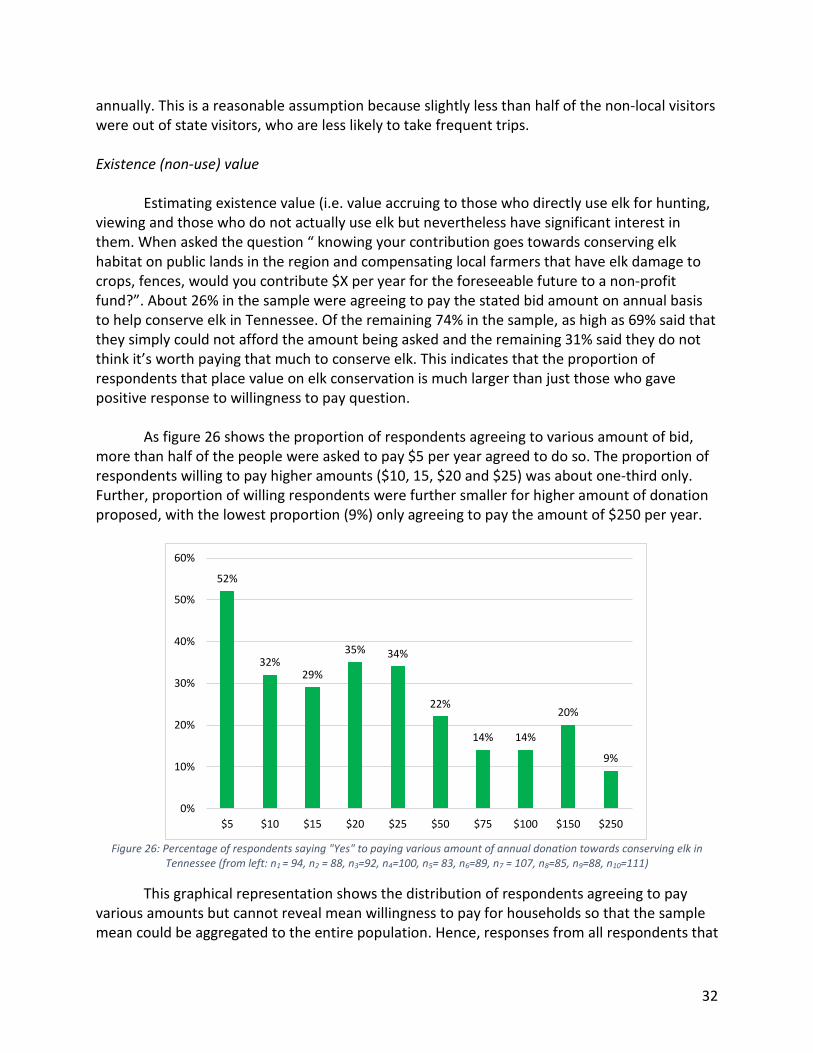
Estimating existence value (i.e. value accruing to those who directly use elk for hunting, viewing and those who do not actually use elk but nevertheless have significant interest in them. When asked the question “ knowing your contribution goes towards conserving elk habitat on public lands in the region and compensating local farmers that have elk damage to crops, fences, would you contribute $X per year for the foreseeable future to a non-profit fund?”. About 26% in the sample were agreeing to pay the stated bid amount on annual basis to help conserve elk in Tennessee. Of the remaining 74% in the sample, as high as 69% said that they simply could not afford the amount being asked and the remaining 31% said they do not think it’s worth paying that much to conserve elk. This indicates that the proportion of respondents that place value on elk conservation is much larger than just those who gave positive response to willingness to pay question.
As figure 26 shows the proportion of respondents agreeing to various amount of bid,
more than half of the people were asked to pay $5 per year agreed to do so. The proportion of respondents willing to pay higher amounts ($10, 15, $20 and $25) was about one-third only. Further, proportion of willing respondents were further smaller for higher amount of donation proposed, with the lowest proportion (9%) only agreeing to pay the amount of $250 per year.
Figure 26: Percentage of respondents saying "Yes" to paying various amount of annual donation towards conserving elk in
Tennessee (from left: n1 = 94, n2 = 88, n3=92, n4=100, n5= 83, n6=89, n7 = 107, n8=85, n9=88, n10=111)
This graphical representation shows the distribution of respondents agreeing to pay various amounts but cannot reveal mean willingness to pay for households so that the sample mean could be aggregated to the entire population. Hence, responses from all respondents that
52%
32%29%
35% 34%
22%
14% 14%
20%
9%
0%
10%
20%
30%
40%
50%
60%
$5 $10 $15 $20 $25 $50 $75 $100 $150 $250
33
either accepted or rejected to pay a given amount of donation bid were utilized to develop a willingness to pay model for the sample (detail estimation procedure in Appendix F). Results from a logit regression equation modeling willingness to pay for continued existence of elk in Tennessee indicated a mean annual willingness to pay of $55 per household3. When this is aggregated across households in five counties, a total of $4.12 million in annual value of elk existence was derived when assuming that every household would be willing to pay this amount. This may not necessarily be true as not everyone may value elk for its existence, aggregation needs adjustment based on who actually value elk. So, in a more conservative approach, we noticed that high as 68.59% in the sample indicated that restoring and conserving elk in Tennessee is “somewhat important” or “very important”. Hence, limiting extrapolation of sample mean to that segment of the population yielded $2.84 million in annual value local residents place in continual existence of elk. In either case, it is evident that the local residence place a great deal of value in continual existence of elk in the region. Total Economic Value of Elk Taken together, the total economic value of consumptive and non-consumptive use of elk in Tennessee was found to be $10.25 million in 2017 (hunting opportunity: $2.54 million, elk viewing opportunity: $4.87 million, and existence value: $2.84 million). This estimate reflects the net benefit annually provided by elk program to a variety of user groups that directly or indirectly enjoy elk. In other words, this amount reflects the potential annual loss of welfare for stakeholders if the elk no longer exist in Tennessee for hunting, viewing, etc. This information can help form a basis for comparing the net benefit of elk restoration program with the annual cost of operating and sustaining the elk program. It should be noted that benefits from hunting is not what local residents may enjoy considering the fact that hunting is regulated with quota system to allow a broader population of residents and non-resident hunters. However, the other benefits from viewing and existence values comprise the benefits mainly enjoyed by the local population. Since the TWRA’s Elk Management Plan for 2017-27 aims to increase the public awareness of the elk resources in Tennessee (Strategy: A.5.c), these findings could be used to highlight the public benefit of elk program in policy debates with local community and statewide stakeholders.
We believe that the economic value presented here may be a conservative estimate of total economic benefit of elk because it is possible that households living outside of the region may also place significant, if not similar, existence value. Further, while extrapolating the benefits of opportunity to hunt among non-resident hunters, we only considered states that are adjacent to Tennessee as applications for TN elk permit were consistently received from those states. However, there were occasional applications from Zip Codes outside those states, indicating that the potential beneficiaries of hunting opportunities at NCWMA may be beyond just the adjacent states. Hence, the actual estimates of values for all uses and non-use activities could indeed be higher than what we have estimated here.
3 A similar survey by Duffield (1991) found a mean willingness to pay of $78 (i.e. $128 in 2017 dollar) in donation to help set up a trust fund for elk winter range in Northern Yellowstone.

34
It is possible that the estimate of total benefit may increase in future especially if additional outreach, marketing and promotion can increase current participation rate in elk viewing activities. Increased population of elk and available hunting quota may also lead to more hunting opportunities and benefits. However, it is also possible that increased population could come with some loss incurred due to damage to crops, fence, properties that eventually may have to be taken into account in any benefit-cost analysis. Open ended comments from respondents
Respondents were requested to provide additional comments about elk reintroduction in Tennessee. A total of 206 comments and suggestions were provided. Based on the thematic similarity, these were broadly classified and presented below in six categories of Elk management (75); Favorable towards elk (49); Elk concerns (21); Other Management Concerns (18); Elk survey (13); and Miscellaneous (30)). Personal identifiers and contact information have been omitted to ensure anonymity.
Elk Management
• I would love to see elk as well as many other species of wildlife returned to the area. We must pressure all wildlife and we must show these animals respect. People must be educated in the importance of such things. I want my children to be able to experience nature and wildlife to its fullest. Thank you so much for your efforts, it is much appreciated by myself and all other animal lovers. Keep up the good work!
• I would not allow hunting. • Would like to see a place like chuck swan where they have a drawing for elk hunts plus
where you could drive and see the elk in the fields where you could spend a day viewing elk
• The number of low income families in Scott Co. could benefit by affordable permits to harvest elk.
• As a hunter I am very supportive of the elk population in TN (Campbell Cty). As a farmer I fully believe that we should be able to have nuisance elk trapped or given a kill tag with the provision of keeping the meat for food/ or donating the meat. The elk in my home area are of one herd. With two very dominant bulls. I have not asked to be reimbursed for our losses/ it is a cost of farming in the area and we do enjoy them but if TWRA would foot the cost of a food plot (seeds/plants) most farms would be willing to plant on our borders to save our fences and crops. You may use my name and responses if you wish or contact me at [removed].
• We need a greater population of elk in our region before hunting is permitted. The elk is helpful to our environment, but need larger numbers in our area.
• I am not against elk but the deer population keeps our vehicles tore all to pieces. One hit me this last summer and caused almost $5,000 damage to my car. Other than that I do not want to participate in any further surveys.
• As I am 63 years old I will never see the day that myself or my children will be allowed to hunt elk in Campbell County. The lottery system is a joke. If you have enough money
35
you might be able to buy a tag. The TWRA steals all the money generated in our Eastern Regions and uses it in the middle and west regions. Nothing other than elk and turkey are cared for. I could address this issue for hours! But you don’t care nor do you want to hear. You just want the money. XXXXXXXXXXXXXXXXXXX
• When elk was first brought to TN especially in Campbell County I was all for it. But since then, I have seen the deer hunting here decline big time. TWRA has gone in and basically destroy large parts of the mountains with their clear cutting for food plots that they very seldom maintain. According to their own numbers the amount of deer checked in continues to decline every year. The majority of deer hunters here want the elk gone. All TWRA and other organizations here in Campbell County have done is turn this county into a tourist attraction for elk and ATV riders and don’t give one thought to hunters for this area. Before the elk was brought, this area I would have put the Hatfield Knob; Walnut Mountain and a few other places in this area up against any other area in East Tennessee as far as deer hunting goes. Now if you got a chance at a deer in this area consider yourself lucky. Elk are a very beautiful and majestic animal and I have been blessed enough to be able to go to Colorado and hunt them. By bringing them to this area all that has happened is a lot of the mountains and deer hunting has been destroyed. Hunters now pay up to $166.00 a year just to go sit in the mountains cause when you see the elk you more than likely are not going to see deer where you are at. It would not bother me at all for them to be relocated. And as far as TWRA foes they could care less what the people say or want. Need to get rid of TWRA and bring in a DNR!!
• More habitats – RMEF has put a lot of money in property that hasn’t been used in the way it was intended. It was supposed to be cleared and sown for grazing. Smokey Junction Area.
• If they are going to be hunted out then don’t bring them here. There has to be a better way of managing elk. Never hunt for sport. We have grocery stores and animals raised for food. It kills me to see deer in the back of trucks up here on the mountain. Don’t eat them.
• I know that hunting controls the population. I’m not against, but I myself do not. I hope to see an elk. We’ve lived here 20 years and just saw a doe and her fawns. It was beautiful. We butt up against Norris dam, always thought it was strange we have never saw a lot of wildlife
• The baby and elks and baby deer are being killed by the coyotes. Husband has found several baby elk dead on TWRA land from coyotes
• Viewing elk in Tennessee is great, but because of the ATVs running all over the roads and mountains in Campbell County the Elk are pushed out of their mountain habitat. I see it every day when elk are seen by roadways and next to people’s homes. Get the ATV traffic away from them and the elk will be fine. If not they will never make it
• I agree all wildlife has its place. Good fences will not control elk because of their ability to jump. If there was a way to keep elk off private land where there are not wanted, I may not be so against them.
• The elk need a few buffalo for company.

36
• I can see elk from my property – a few months ago 2 were killed at night and left – something has to be done about poaching in Lafollette area.
• Hunt deer and would like to hunt elk if I get the opportunity. • While hunting I have observed elk foraging in direct competition with deer. I have
observations of deer behavior completely changing due to elk presence. This contradicts what the female UT biologist once over the program stated to me. I want elk yet want more done to compensate for the effect on the deer herd.
• I don’t think you should close off land to all hunting just for elk habitat. • I don’t understand a lot of the terminology, nor aware of current management • This cannot be about tourism or profit. I realize it cost TWRA money to relocate and
manage these creatures. If we have the abundance of elk in TN then there should be an elk tag offered to every licensed hunter in said state. Cost of tag should not exceed $100. I agree with management of our wildlife resources to preserve our natural game species. There is no rich or poor in the eyes of the animal.
• I would like to see one of the elk permits be designated to a hunter who resides in one of the five counties in the elk restoration zone.
• Please continue to expand any/all educational efforts with public in regard to all things elk.
• I don’t agree with all the new rules invoked on residents or ATVs, hunting, or fishing out streams.
• Elk provide both tourism and possible hunting opportunities for local inhabitants. It would be nice to find a balance as elk can provide food to locals in tough times.
• The elk needs to be allowed to move to Big South Fork, on Frozen Head as there are open fields.
• Would love to see elk in our area. Wildlife agency in Morgan County is a shambles. They are never around and if you call, they never get back in touch.
• At exit 144 at I75-South there needs to be a sign “beware of elk.” They come all the way to guardrail after a snow for the salt
• I do agree with reintroduction of the elk back into the area. As with any live animal there has to be boundaries.
• I think elk should be restored so we don’t lose a beautiful creature to extinction. • These animals and their descendants were brought here from norther states and
Canada. They’re surviving in a “foreign land.” In their natural/native lands, if I had a rifle and a tag in hand, I’d have no qualms about hunting such an animal. Here, it’s a different equation to me. The species of elk that inhabited this area is extinct. Elk reintroduction is good, but should never take precedence over managing our native wildlife here in the “elk zone.” Bad policy. I attended all the elk restoration meetings. TN’s elk
• Reintroduction program has paled in comparison to KY’s. I see elk frequently in the community where I live. But when I want to go grouse hunting and there are none and all the wildlife professionals want to do is manage for imported elk populations, that leaves this little country feller hot under the collar. But I suppose elk bring in money from tourism and small game doesn’t so the $ wins.

37
• I would love the opportunity to hunt elk. They are beautiful animals and really enjoy watching them.
• What right do you the University of TN or TWRA etc. have to take any traditionally used land by hunters to promote your pet project. The land was used by TWRA license holders. I have seen all sorts of unfairness in the way you address the use of the lad. I have even had people using UT equipment on a private lease interfere with hunting when they were not part of the lease. This area will never support a true huntable population. Why should local people be supportive of all the traffic in the wild areas with no hunting benefits? You can’t turn true wild lands into moneymakers and keep them wild.
• Landowners need hunting seasons to help control population. If not, we will be overpopulated with elk. Deer has already become overpopulated due to all the restrictions on does during hunting seasons
• Let some local hunters be able to hunt elk. Most of the “wildlife professionals” are total pricks. They treat locals like idiots, block roads, and let the R2R riders destroy, litter, and tear trails up.
• In the past you have drawn for 5 hunters to each kill an elk. If 5 is all that can be taken out of the heard, there are not enough elk to have a hunt
• We don’t have the space to run elk here, like they have out west. People are more apt to run into elk here, have them in our hay fields, gardens, county and state roads. There is nothing for them to eat in the mountains therefore they have to eat our food. Also it is too expensive to have food plots in the mountains.
• No hunters on my property allowed. I wish to not participate in surveys • Beautiful animal that need to be protected. Public education is much needed. Viewing
places needed. • My vehicle was hit by a deer. I’m worried about elk population, my family, and children.
We lived decades without elk. Yes they are beautiful I’d like to see one. But over population is my main concern.
• In my opinion I feel that since elk have been introduced to this area the TWRA have neglected their duties toward other wildlife. I would also add that since elk have been more prominent that there has been an increase of fatal diseases to wildlife.
• In the next decade or less I would like to see a large enough elk population to have a public hunt. I believe that hunters in our region would enjoy a public elk hunt, I also believe that only local hunters should be considered for the elk lottery.
• I lived in Colorado for 24 years, hunting elk, deer, and antelope. I have killed 9 elk, I do not hunt here but would for elk if the opportunity would come to me .I and my wife enjoy the wildlife that comes on our property. I hope this state has many more years of elk in this area.
• I have no problem with the elk. TWRA does not believe that mountain lions are in east TN. I have seen them and my wife. Have seen on state 116. There are coyotes all around my property. I live in North Anderson County near Briceville.
• Expand hunting when population is high enough

38
• I would like TWRA to manage the elk the best that they can in this region. I would love or my children to grow up seeing elk and other wildlife as I have. I don't hunt but I do not have problem with someone else hunting to feed their family. Shooting to just kill an animal should be illegal and face prison time for it.
• Our elk program needs to go forward with more WMA in the north cumberland region. This would provide additional elk habitat and could be upgraded. We need lower speed limits and they should be enforced. I am opposed to private (leased land) hunting.
• In knox county( KY) we had a private area lk lookout. It was very neat and brought a lot of tourism to our area very neat for the school ids. May benefit something like this here.
• Once elk are strong enough; they should add to ig game license I would hunt elk, but only 1 per year either sex but females can't be with calfs or pregnant. Elk are beautiful and amazing animals they should be protected but also controlled. The belong here, and should be. I wouldn't allow hunting on my property. Although I would love to hunt them on my own property I am not quite sure how strong and healthy the herd is. The bed to be large and strong before they get hunted. One per year per hunter with restrictions. They should continue to grow and expand throughout.
• I would like to see more elk released in this area • TWRA has destroyed prime whitetail habitat for elk food plots. That they don’t keep up
and are now overgrown and only good for small game. They bring no money into these counties for tourism. No one comes to these 5 counties for just elk viewing.
• need additional elk (females) for bull on farm • I appreciate the efforts by everyone to reintroduce elk in TN; I hunt deer and don’t feel
like I will ever be able to hunt elk, because lack of #’s. I would prefer more efforts/money go towards a replacement of the deer population!!! Our deer population is becoming non-existent!!!!!! I saw one deer in the stand this year!!!!!
• Need to keep gates open on Highway 63. Who can view them when gates are locked??? You pull over to look at an elk and game warden runs you through the ringer. They think they rule us. Always hassling and treat you like a convict for only looking.
• Q. 17 No hunting on my property, period • Clarify “hunt” I hunt on rare occasion nuisance animals that are destructive or are killing
the wild turkey and deer that I like to feed and watch. • They don’t bother me, but they are present on backroads. People tend to cause traffic
jams due to stopping, especially in school zone. • In the last 20 years young hunters in the stinking creek area have killed almost all the
game. The elk stay away from this area because of this. • My present age and health does not permit me to hunt any type of game; however,
having elk in Tennessee in my opinion is profitable to the state and its licensed hunter.
Favorable towards Elk
• I think it would be great to have elk back in the world again. I am not a hunter so I don’t believe it should just be for hunter people. Let them back into the wild and leave them

39
alone is my motto. I think my grandkids would love to see one roaming around in the back yard just as much as they enjoy seeing deer in the backyard. I believe most people would say the same thing. Thank you. I also don’t think farmers should be compensated (for damage) as I do not believe elk will cause any more damage than deer or bear in the wild.
• I’ve lived in the Stinking Creek area my whole life and I love that we have elk now. Thank you for your hard work.
• I would love to watch or see elk around or near my property. They are beautiful animals! I work 2nd shift and I always see deer on my way home, up to 15 sometimes. It is awesome!!! Now I will watch for elk also.
• My husband has worked with the restoration program since 2003 and fully supports it. Unfortunately we have farmers and cattle growers that want to eradicate them.
• There should be more advertisements for elk viewing. • My husband and I enjoy wildlife tremendously and do plan to try to see the elk herd in
Campbell County. Not being property owners I couldn’t respond to questions about damage, control, etc. We would love to see elk and do feel having them is important.
• I love to see elk in TN. Would like to have a relocated animal released on my land. • I think having elk here is a wonderful idea all around. I grew up in Oregon and our family
bow hunted every year. The revenue to all business related to hunting and camping is great.
• Me and my family love to just sit and watch wildlife. • I think it is an awesome thing to reintroduce the elk in regions where they were
considered a native species before they were mismanaged. Moving forward in this endeavor is I think very critical to restoring an ecosystem as it once was and in doing so keeping balance in predator prey ratios. I think also to help the elk herds, the TWRA should allow free hunting of nuisance species of the hog population that is devastating to the fauna and forage that the elk can use instead of the hogs.
• I do not see elk anymore in my area. I used to see two day (illegible) day. Bull and doe both were off of Hot Fork Road in Waitburg area. We no longer see them. Someone killed the bull elk and the doe died, I would love to see them again. I love wildlife of any kind. Thank you.
• I would like to see more elk introduced into Tennessee. • People love to watch the elk. • I would like to see more elk in more of Tennessee. • Elk are regularly seen in Dutch valley. Most residents would like to see the elk
population continue to grow in our community. • Let’s try to keep the elk in Tennessee. I would love to see more opportunities for
hunting them in the future. I never thought I would be able to see one in the wild and appreciate the efforts to bring them back into the state of Tennessee.
• My wife’s mom has almost 4 acres. Late evenings in spring and summer or early mornings a bull elk, 3 cows, and 2 young elk come the Cumberland Mountains – cross Hwy 63 E and eat on the apples down in the bottom. They are quiet and cautious – then they leave as they came – quiet. They are beautiful large quiet animals. It should be

40
years to come before any (hunting) seasons are put on them. The elk up here in the valley travel. They go to Claiborne County then a couple week they are back here. There is a large farm to the west of us, my brother and I used to work for them. They raise cattle. Late fall and during the winter, they feed silage and hay to the cattle. The big bulls stays out from the herd more so. The elk cows and young elk mingle with the cows. The cows act as if the elk were cows. Grandpa told us young kids back 58 years ago that elk would finally be brought back! They are beautiful animals. I believed that open season on them should be postponed for several years.
• My boyfriend and I love to fish and drive and see elk and deer but not kill them. • Enjoy elk and all wildlife. I just like to watch them. • I live in Newcomb, TN. I don’t see elk here. I would love the elk population to grow. • Would love to see more elk in my area. • I enjoy viewing elk and hope the elk population increases. • They’re beautiful animals of god. • I enjoy nature and promote any and all animal/ nature habitats • I look forward to seeing elk in Campbell County • As a native species Elk have many rights to live and flourish in my region and the state of
TN in general. Any negative effects such as property damage are countered by positive effects such as tourism, biodiversity, and native species reintroduced in their original home.
• I really want to go see them. Friends have said it’s wonderful. Can’t be any worse than the deer, turkeys, skunks, raccoons, possums, snapping turtles, foxes, etc. that we already have.
• I think elk in the area is nice. Don’t remember when elk were not in this area. Don’t think tax dollars should be used. If people want to contribute to the effort, more power to it.
• In the past my husband and I killed 3 elk in Colorado. Great fun and great food. • I have visited Yellowstone Park and enjoyed watching elk and other animals. • Most of my land is located in the bear creek section of Scott County. I would be willing
for my land to be used for elk. • I would like to see a lot more around. Love watching and eating them. • I love seeing, learning, and teaching tourists about the nature activities in our area. I
love the area and would love to see more support for it. • Only saw elk 3 years ago, would love to see more. • As long as the elk population is maintained at reasonable levels, elk should be a great
addition to the local wildlife community. • I think this is a worthy effort. Love seeing wildlife. It’s why I live here. • Elk are beautiful. I will be happy to share my space with them. • I enjoy elk on my property. They usually stay on my field but I have them in my field but
I have then in my front yard and close enough to look in my window. I had a family of them for years but they have moved on the past two years. I did see one this past week
• I think we are very blessed for having a great animal such as elk and where they once roamed

41
• Several years ago there was an elk near our house we loved to see her - our family named her “Lucille”. She was so beautiful, would love to see more :)
• Q. 21 If they even came to my property. The elk are beautiful animals and I hope you continue to help them in the area.
• We had one grazing in our yard and it was great to watch • I know elk existed in my area but I have not made the effort to go and see but I will now! • I think elk are a beautiful animal just like deer. They are nice to watch etc. • My income has nothing to do with this survey; however I fully support the elk. We have
a problem with poaching in my area and nothing is done. We’re spotlight is even a bigger problem.
• Love looking at elk at a distance. See them on 75 south. • Seen an elk at Peabody Cemetery last spring. Very beautiful. It was as surprised to see
me and my friend, as we were to see it. It let us video it with our phones. At a safe distance. Very enjoyable meeting.
• The elk used to be here a long time ago, became extinct. So amazed when see elk. Seen them on side road. I wish elk would come on my property. I love watching wildlife, I have deer on my property, my neighbor’s field has elk, but I have never seen them on my property. Where I like is called “Elk Valley”, a long time ago “elk” lived here, that’s how my community received its name, then they became extinct, not sure if from disease or hunters.
Elk Concerns
• We already have deer, bears, coyotes, fox, and bobcats to contend with – do not need elk. We also have poisonous snakes which the elderly and children should not have to be worried about while outdoors. If I knew they (elk) would not do damage to property, crops, shrubs, or flowers, maybe I would not mind seeing elk. Deer, so far, have done no damage.
• I already have a moderate problem with deer and am not particularly anxious to add elk to the problem.
• I am more concerned about hitting an elk, there are so many spotted near mm 141. • I am concerned that the natural biomass is not enough to sustain large animals such as
elk. The loss of the American chestnut has greatly reduced the amount of forage available.
• There is no place for elk where I live. I have the largest plot of land in my area and am surrounded by subdivisions. No place for elk here!
• We know very little about elk. Being retired and disabled I hope we will not have to worry about elk eating our fruit in the orchard or garden vegetables and plants.
• I have been watching and waiting to see an elk on or around my land, still have not seen any. I hope to see them in the future; I do live near a dangerous road so I would fear for their safety and the drivers.
• Elk’s destroying deer.
42
• My main concern is car/elk accidents. We have had 3 or 4 in the last 2 years on Hwy 63. No injury or death is worth all of the elk or deer in the world to me.
• I do not know much about elk. I wouldn’t want them around my home. I wouldn’t hurt them.
• Really don’t have a problem with the elk until they get on private property and damage fences and crops that we are trying to make a living with. Also injure cattle
• I have not observed any elk in my area but neighbors have and they have seen car wrecks due to the elk. To my knowledge they have not damaged crops or been a nuisance other than car/elk collisions.
• Have concern the landowner’s rights stay intact. And the nuisance control should be encouraged to stay within large firecrackers and BB guns if possible. We live with healthy population of deer and elk shouldn’t be much different.
• We have had damage to our fences with no help from wildlife management. We had a garden destroyed by elk while wildlife offered a much smaller fence that the one we already had that they jumped and a portable radio for a deterrent. The garden was right beside my house. The radio did nothing.
• I have never experienced any issues with elk. I used to see them (5 or less) in the fields across the road from my house, nut not in over a year now. Head that neighbors complained about elk eating hay/ grain for cow, now I haven’t seen any in quite some time. An elk was hit by a car approximately 200 feet from my driveway 2-3 years ago.
• I don’t think we need elk or bears. I am afraid to go outside at night for fear of a bear. We also need to get have a lot less deer. We have already had 3 or 4 car accidents because of deer and my insurance don’t pay for that.
• I don’t see why we need Elk in this area. Deer are bad enough to dodge, where there are so many of them, before you know it, elk will be running everywhere and when you hit one it would be bad and maybe even fatal. My opinion on elk is we do not or did not need them in here after we have a bunch of fatalities due to the elk maybe you guys will see my point. Lord help us the elk don’t cause the deaths of our loved ones.
• I am 66 years old and have only had knowledge of elk for the last 10 years. We have done well without elk in the past and why do we need them now. The elk will be as bad as the deer. In a few years or even worse. We have enough trouble it deer in this area and elk will only add to the problem. They need to have a fenced in area for elk in a wildlife management area.
• Q. 27 Don’t want any elk, deer’s are bad enough. Q. 28 Deer have caused 4 car accidents for our family. I don’t think we need elk in our county.”
• I have seen what deer can do to row crops and hogs also can do if not keep in control elks could do some real damage.
• Tough area for elk to grow due to people poaching and lack of education. Many locals do not know the difference between deer or elk and many hunt year round for food due to poverty. Also trespassing and hunting in illegal areas is very common in this area. Thank you for the survey. God bless and good hunting
Other Management Concerns

43
• Quit logging our timber woods • I have also noticed a decline in deer and turkey populations, since living here for the
past 23 years. • Please do not stop OHV or lose OHV trails. • Put that money toward putting in fish for our lakes like waleye, crappie, no rockfish.
Also put in wild birds like grouse quail. Something people like to hunt. • We have a bear in Union County in Speedwell, TN and one time I saw a Black Panther
and bobcat. When are you going to restock Norris Lake in Campbell County?? At Powell Valley Resort?? P.S. you can put elk at overlook bay or “Chuck Swan Wildlife Management Area.”
• I don’t have an elk problem, I have a deer problem. How to stop them from eating my flowers. Also what happened to the raccoons? They drove me nuts for over three years digging up flowers, raiding the bird feeders and trying to get to the cat food on the porch then this year they are gone. Don’t want them back but wondered where they went
• Some wildlife agency professionals are exceptional. Some are not so caring for animals or people like any other profession. So depending on specific professional, they will be very good or just there for a paycheck.
• I really don’t care about this. Poachers break onto our property and have erased the deer and squirrels. All we have left is rabbits and the coyote are thinning them. If there were elk on my property they would not be here long.
• I live in Oak Ridge city limits and no one seems capable of managing the deer population!
• I have quit hunting and fishing since you have to provide social security number to obtain a license. I have expressed my distain of this to all my legislators
• Breed elk, buffalo, and cows to feed this poor state and country. • I think having elk is okay but after my son's accident he's in a wheelchair. He loves
hunting and fishing we notice there is no hunting for handicap or trails for wheelchairs so I would like to see money now go for that instead
• More attention to small game • Survey complete with my son in law who gave some of his opinions about thing I was
not familiar with. Also get RID of the Hogs first. They are tearing up my property • Elk are nice to look at but with the coyote population and possibility the elk population.
I have been seeing less deer each year. Also the small game population seems to have decreased (ex: squirrels, rabbits, etc.). I am more concerned now about the coyotes at this time. If the elk population increases then I may have more concerns about them but as for now I don’t see a huge concern yet.
• I wonder why a survey because it is a foregone conclusion that elk management strategies will establish a large killing field, stock it will elk, issue hunting license, and kill elk like shooting cows in a pasture. The years we have lived in east TN we have seen the slaughter in the smokies thousands of acres rooted and destroys, There is no problem for WMA just issue licenses and kill kill kill hta is their strategies so much for my attitudes

44
• Did they (TWRA) introduce “wild hogs” into our area? Not good! I have had to install fixed fencing around my gardens to keep deer and wild hogs out of my gardens. So far the fence has kept these two animals out. I’m not sure the fencing could keep elk out. The “wild hogs” that were introduced into our area several years ago are totally out of control and doing much damage to fields and gardens.
• Q. 26 We pay enough in taxes and licenses. More education and hands on with the public. Most don’t care - because most don’t know.
Elk survey
• I feel that some questions are time sensitive. For instance, hunting opportunities should be based on population and not popularity. Census of elk should be addressed more to enhance quality of information used to facilitate hunting.
• My father was a TN forestry employee for years. I would be willing to help in any further areas or surveys.
• I hope this survey is not generated by a private entity to be used for fund raising or information being shared. Would like to have info or just what is currently being done and for the elk in this program. Thank you.
• Thank you for providing the opportunity to participate in this survey as a property owner in the elk zone.
• Too many irrelevant questions • I do not do surveys • Section D Not one of these questions is relevant to the subject of the survey. • I have spoken with a few people that have gotten similar surveys as this one. The
number one reason you are not getting more replies is solely due to the demographics questions you ask. They all think it’s just plain nosiness, and I agree with them. We will gladly answer any and all wildlife questions, but the rest is best left to the census.
• Q. 40 Not important! • Don’t contact me again or ever. Not interested in survey. Don’t send any more. • Good luck on your research! So cool that you are from Nepal. A number of years ago we
welcomed a few Nepali students in Williamsburg, KY. • Kudos to you for going full Dilman method; good survey! I am originally from Idaho, so I
like seeing the elk. Yes, they damage landscaping, but that’s what we get for living in the country. Note that those who live in the resort areas (like us) will be different than the other country people. Your survey will only kind of capture that difference. Also, I am not anti-hunting, but this shouldn’t be the focus on herds this small. They do very little damage.
• My husband and I appreciate your concerns. Good luck in your efforts! Thanks for preserving wildlife
Miscellaneous

45
• The elk at frozen head, a doe, was run to death by kids on four wheelers, I don’t know if they were caught or not. It was heart-breaking
• I was aware elk were present in the area but was not aware of viewing areas. • I know they are here in the county but I have personally only seen them in Cherokee,
NC. I have several friends and co-workers that live in elk valley and see them quite frequently.
• I’ve seen a big elk bull go up the street in front of my home about 3 or 4 years ago. • Please feel free to contact me if volunteer work is needed any time! • I honestly did not even know there was elk in our area so my interest is now peaked. I
am looking forward to researching this more. • I have never seen elk in my area. • I would like to in the future [for 9] • Dear Sirs, I received your survey. I enjoy seeing wildlife in our neighborhood. We do not
own the land it belongs to the Coal Creek Company. No one plants large gardens or have live livestock. All together we have seen maybe 10 Elk since the release. A few coyotes and wild pigs. P.S. I am 72 and was born in the community I live in. A lot of people ride our mountain looking for elk.
• You already tax a man to death so get out of his wallet. • We have driven to North Carolina several times just to watch the elk. Elk have appeared
within 8 miles of my house however they have damaged fences in those areas. • I live in an area with a lot of 4 wheelers. I don’t expect to see much wildlife. Thanks! • Would need to know that’s where mu money goes! Is it tax deductible? (25) • The only place I have seen Elk is Yellowstone • I do not know anything about elk or hunting. But do not agree with people hunting
animals for sport • There is no elk around here • I don’t believe in hunting unless it for food • Don't make pets out of elk • Where we live at 253 walls hollow road( coalfield) we have a herd of approx number in
the mid teens of elk. We see this herd quite often. We have not have any problems of damage from the elk. We plant food plots for all the game and include the elk. We protect the elk the best we can.
• Keep up the good work. I’ve seen elk but 10 years ago. Disappointed • I can afford $50 a year • Haven't seen any elk • People are overcrowding nature. I ride dirt bikes and enjoy seeing the elk. We give them
space and slow down or turn down. • Our family enjoys the Hatfield Knob Viewing Area. We always take relatives (that are
visiting from other states) to the viewing tower. • We don’t live on a farm so we don’t know the issues farmer are having with elk. • When we went to the elk viewing, many people were walking the distance to enjoy the
sight. It is such a popular sight for tourists. The elk were very busy that day and making
46
the bugle noise they make, it was a beautiful experience. I have heard farmers complain of the damage to crops.
• Have seen elk on Hwy 63 near Huntsville, in location known to local residents as Elk Valley. Before that I had only seen elk in pictures. Have been told they are a good food source.
• Q. 18 I live within city limits • Total 2.5 Trailer Park 4.5 vacant lot 1 acre 9 live on I own Principle Trailer Park, I own
land at New Comb TN. I love some wildlife • Have not seen elk on my property but have seen what I believe to be tracks 5 or more
years ago.
Acknowledgements We are thankful to Tennessee Wildlife Resource Agency for funding this project. We are grateful to Brad Miller (Tennessee Elk Program Leader), John Mike (TWRA Region IV Wildlife Manager), Joe Benedict (Assistant Chief, TWRA Wildlife and Forestry Division) for their input during the survey development phase.
References Dillman, D. A. 2009. Mail and internet surveys: The tailored design method (2nd ed.). John Wiley
and Sons, Hoboken, NJ. Donovan, G. and P. Champ. 2009. The economic benefits of elk viewing at the Jewell Meadows
Wildlife Area in Oregon. Human Dimensions of Wildlife 14, 51-60. Duffield, J. W. 1991. Elk economics: implications for managing elk security. Pages 55-59 in A. G.
Christensen, L. J. Lyon, and T. N. Lonner, compilers. Proceedings of the Elk Vulnerability Symposium. Bozeman Montana.
Fried, B. M., R. M. Adams, R. P. Berrens, and O. Bergland. 1995. Willingness to pay for a change in elk hunting quality. Wildlife Society Bulletin 23(4): 680-686.
Loomis, J. 1982. Use of travel cost models for evaluating lottery rationed recreation: application to big game hunting. Journal of Leisure Research 14: 117-124.
Pelham, B. and H. Blanton. 2012. Conducting research in psychology: Measuring the weight of smoke. Cengage Learning Publisher, Belmont, CA. 512 p.
Rosenberger, R.S. 2016. Recreation Use Values Database. Oregon State University, College of Forestry. Retrieved from http://recvaluation.forestry.oregonstate.edu/database
Scrogin, D., R. P. Berrens, and A. K. Bohara. 2000. Policy changes and the demand for lottery-rationed big game hunting licenses. Journal of Agricultural and Resource Economics, 501-519.
Stevens, T. H., J. Echeverria, R. G. Glass, T. Hager, and T. A. More. 1991. Measuring the existence value of wildlife: what do cvm estimates really show? Land Economics 67(4): 390-400.

47
Tennessee Wildlife Resources Agency. 2000. Proposal: elk restoration in the northern Cumberland Plateau, Tennessee. Tennessee Wildlife Resources Agency, Nashville, Tennessee USA.
UT Human Dimension Research Lab. 2015. Visitatoin at Hatfield Knob Elk Viewing Area, 2010-2013. UTIA-HD-2015-001. Knoxville, TN.
Vaske, J. 2009. Survey research and analysis. Venture Publishing, Inc. State College, PA.

48
Appendix A: Survey questionnaire

Local Residents’ Attitudes towards Elk in Tennessee (A survey of residents in Anderson, Scott, Campbell, Morgan, and Claiborne County)
Department of Forestry, Wildlife, and Fisheries University of Tennessee
2018
You are one of the few randomly selected residents from the 5-county region in Tennessee to participate in this survey. Your help is critical for understanding how local residents value and perceive the benefits and impacts of elk in the region. Regardless of elk presence on your property, the answers you provide will help agencies in effectively restoring and managing elk in Tennessee. Your responses will be fully confidential and not shared with anyone.
A study conducted by University of Tennessee with the support of Tennessee Wildlife Resource Agency.

1
Section A. Property Characteristics
1. Do you live or own property in the elk restoration zone as indicated on the map above?
_____Yes _____No, please go to Q. 3
2. How long have you lived or owned this property inside the elk restoration zone? __________ years
3. How many acres do you own or lease in the 5 county region of Anderson, Scott, Campbell, Morgan, and Claiborne County? Own: ________acres Lease or rent: ________acres I live in the region but do not currently own or rent land, Skip to Q. 5
4. Which of the following describes your uses for the largest tract of land you own in this region? (check all that apply)
_____A residence for myself/family _____Cropland (other than hay or pasture land) _____Commercial horticulture _____Growing plants for non-commercial use _____Hay or pasture land _____Orchards _____Timber production _____Operating a commercial business _____Cattle production _____Other (please specify) _____Other livestock production _______________________________________
5. Before receiving this survey, did you know that there are elk present in Tennessee? _____Yes _____No

2
6. How interested are you in the following activities related to elk in Tennessee? (circle one number for each row)
Not at all Interested
Interest Very Interested
Watching elk 1 2 3 4 5 Hunting elk 1 2 3 4 5 Having elk in Tennessee 1 2 3 4 5 Learning more about elk management 1 2 3 4 5 Providing input for decisions about elk management 1 2 3 4 5
7. Have you visited the Hatfield Knob elk viewing tower in Campbell County?
_____Yes _____No, go to Q 9
8. How many times did you or others in your family visit this tower in 2017? _____ times
9. Have you visited any other places in Tennessee to view or photograph elk? _____Yes, please specify where (……………………………………………………………………..) _____No, go to Q 12
10. How many times did you or others in your family visit this other place to view elk in 2017? _____ times
11. Approximately, how far (in miles) is this other place from your residence? _____miles one way
12. To what extent do you agree or disagree with the following statements about elk in Tennessee? Strongly
disagree Somewhat
disagree Neutra
l Somewhat
agree Strongly
agree Even if I never see an elk in the wild, it is important for me to know they exist in Tennessee
1 2 3 4 5
Elk bring economic benefits to our communities through tourism 1 2 3 4 5
No need to protect elk in Tennessee because there are healthy populations elsewhere
1 2 3 4 5
Elk have the right to exist wherever they may occur 1 2 3 4 5
Elk are a valuable part of nature 1 2 3 4 5 Future generations should be able to see elk in Tennessee. 1 2 3 4 5
Elk threaten the economic prosperity of farmers in Tennessee 1 2 3 4 5
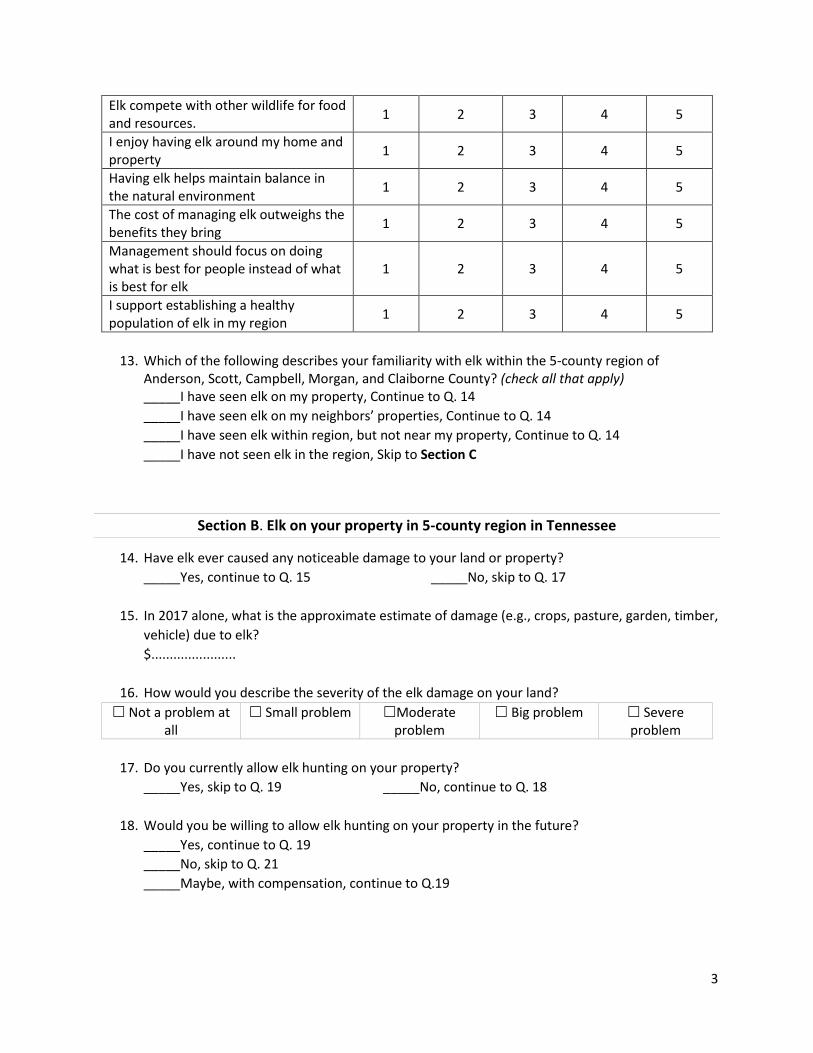
3
Elk compete with other wildlife for food and resources. 1 2 3 4 5
I enjoy having elk around my home and property 1 2 3 4 5
Having elk helps maintain balance in the natural environment 1 2 3 4 5
The cost of managing elk outweighs the benefits they bring 1 2 3 4 5
Management should focus on doing what is best for people instead of what is best for elk
1 2 3 4 5
I support establishing a healthy population of elk in my region 1 2 3 4 5
13. Which of the following describes your familiarity with elk within the 5-county region of
Anderson, Scott, Campbell, Morgan, and Claiborne County? (check all that apply) _____I have seen elk on my property, Continue to Q. 14 _____I have seen elk on my neighbors’ properties, Continue to Q. 14 _____I have seen elk within region, but not near my property, Continue to Q. 14 _____I have not seen elk in the region, Skip to Section C
Section B. Elk on your property in 5-county region in Tennessee
14. Have elk ever caused any noticeable damage to your land or property? _____Yes, continue to Q. 15 _____No, skip to Q. 17
15. In 2017 alone, what is the approximate estimate of damage (e.g., crops, pasture, garden, timber, vehicle) due to elk? $.......................
16. How would you describe the severity of the elk damage on your land? Not a problem at
all Small problem Moderate
problem Big problem Severe
problem
17. Do you currently allow elk hunting on your property? _____Yes, skip to Q. 19 _____No, continue to Q. 18
18. Would you be willing to allow elk hunting on your property in the future?
_____Yes, continue to Q. 19 _____No, skip to Q. 21 _____Maybe, with compensation, continue to Q.19
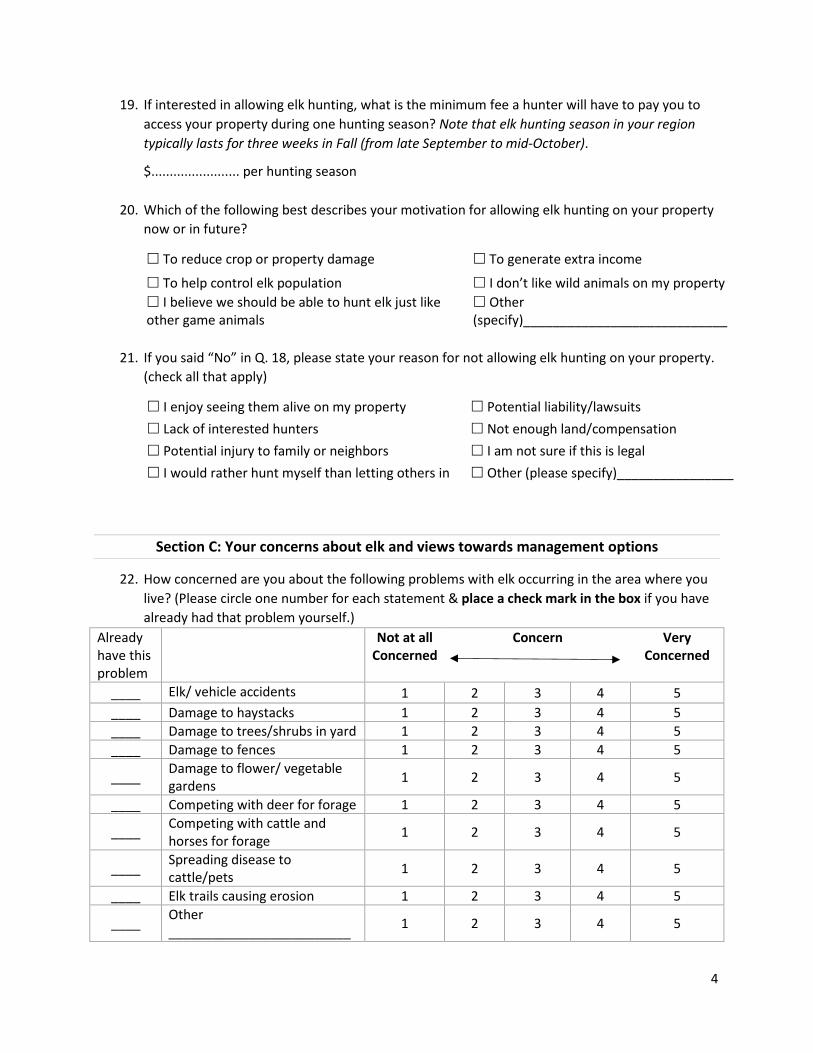
4
19. If interested in allowing elk hunting, what is the minimum fee a hunter will have to pay you to access your property during one hunting season? Note that elk hunting season in your region typically lasts for three weeks in Fall (from late September to mid-October).
$........................ per hunting season
20. Which of the following best describes your motivation for allowing elk hunting on your property now or in future?
To reduce crop or property damage To generate extra income
To help control elk population I don’t like wild animals on my property I believe we should be able to hunt elk just like other game animals
Other (specify)____________________________
21. If you said “No” in Q. 18, please state your reason for not allowing elk hunting on your property.
(check all that apply)
I enjoy seeing them alive on my property Potential liability/lawsuits Lack of interested hunters Not enough land/compensation Potential injury to family or neighbors I am not sure if this is legal I would rather hunt myself than letting others in Other (please specify)________________
Section C: Your concerns about elk and views towards management options
22. How concerned are you about the following problems with elk occurring in the area where you live? (Please circle one number for each statement & place a check mark in the box if you have already had that problem yourself.)
Already have this problem
Not at all Concerned
Concern Very Concerned
____ Elk/ vehicle accidents 1 2 3 4 5 ____ Damage to haystacks 1 2 3 4 5 ____ Damage to trees/shrubs in yard 1 2 3 4 5 ____ Damage to fences 1 2 3 4 5
____ Damage to flower/ vegetable gardens 1 2 3 4 5
____ Competing with deer for forage 1 2 3 4 5
____ Competing with cattle and horses for forage 1 2 3 4 5
____ Spreading disease to cattle/pets 1 2 3 4 5
____ Elk trails causing erosion 1 2 3 4 5
____ Other _________________________ 1 2 3 4 5
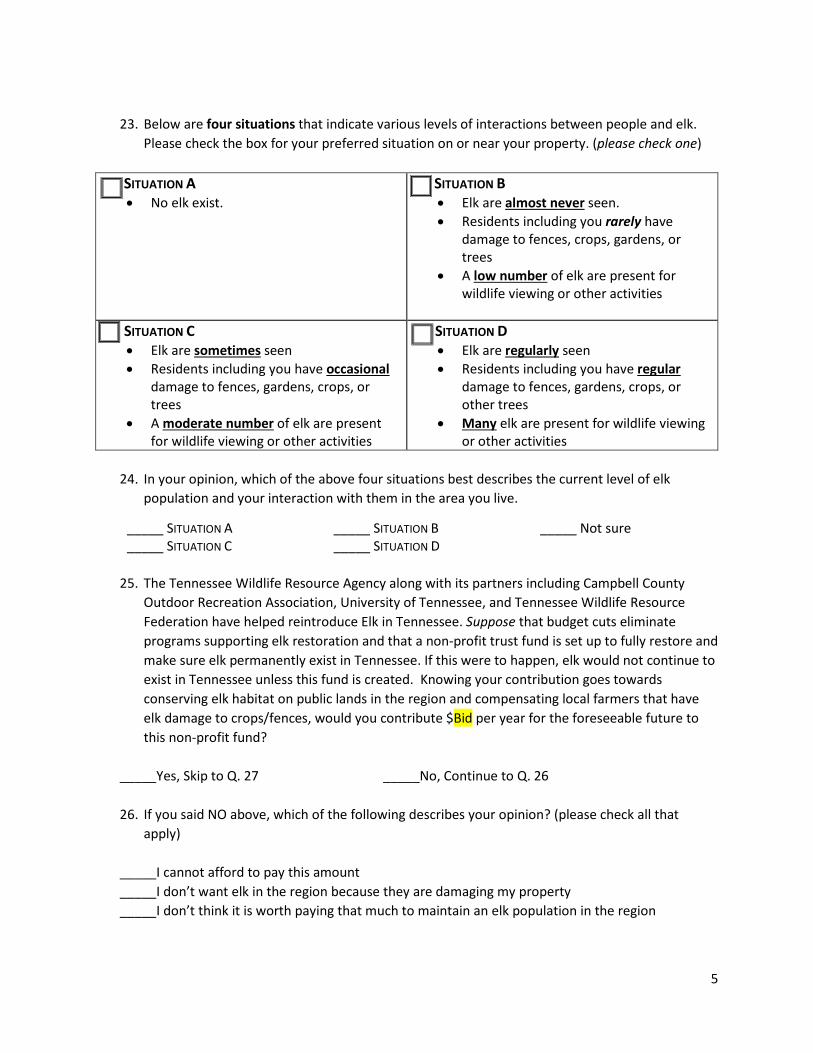
5
23. Below are four situations that indicate various levels of interactions between people and elk.
Please check the box for your preferred situation on or near your property. (please check one)
SITUATION A • No elk exist.
SITUATION B • Elk are almost never seen. • Residents including you rarely have
damage to fences, crops, gardens, or trees
• A low number of elk are present for wildlife viewing or other activities
SITUATION C • Elk are sometimes seen • Residents including you have occasional
damage to fences, gardens, crops, or trees
• A moderate number of elk are present for wildlife viewing or other activities
SITUATION D • Elk are regularly seen • Residents including you have regular
damage to fences, gardens, crops, or other trees
• Many elk are present for wildlife viewing or other activities
24. In your opinion, which of the above four situations best describes the current level of elk
population and your interaction with them in the area you live.
_____ SITUATION A _____ SITUATION B _____ Not sure _____ SITUATION C _____ SITUATION D
25. The Tennessee Wildlife Resource Agency along with its partners including Campbell County
Outdoor Recreation Association, University of Tennessee, and Tennessee Wildlife Resource Federation have helped reintroduce Elk in Tennessee. Suppose that budget cuts eliminate programs supporting elk restoration and that a non-profit trust fund is set up to fully restore and make sure elk permanently exist in Tennessee. If this were to happen, elk would not continue to exist in Tennessee unless this fund is created. Knowing your contribution goes towards conserving elk habitat on public lands in the region and compensating local farmers that have elk damage to crops/fences, would you contribute $Bid per year for the foreseeable future to this non-profit fund?
_____Yes, Skip to Q. 27 _____No, Continue to Q. 26 26. If you said NO above, which of the following describes your opinion? (please check all that
apply) _____I cannot afford to pay this amount _____I don’t want elk in the region because they are damaging my property _____I don’t think it is worth paying that much to maintain an elk population in the region
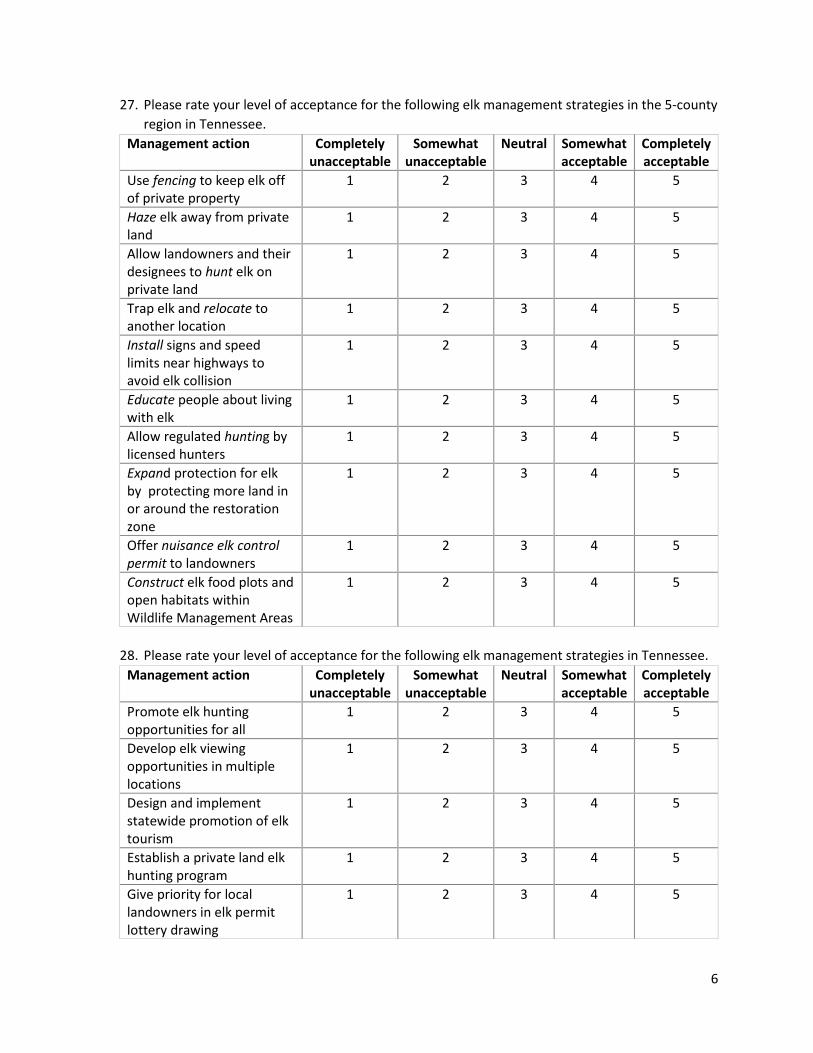
6
27. Please rate your level of acceptance for the following elk management strategies in the 5-county region in Tennessee.
Management action Completely unacceptable
Somewhat unacceptable
Neutral Somewhat acceptable
Completely acceptable
Use fencing to keep elk off of private property
1 2 3 4 5
Haze elk away from private land
1 2 3 4 5
Allow landowners and their designees to hunt elk on private land
1 2 3 4 5
Trap elk and relocate to another location
1 2 3 4 5
Install signs and speed limits near highways to avoid elk collision
1 2 3 4 5
Educate people about living with elk
1 2 3 4 5
Allow regulated hunting by licensed hunters
1 2 3 4 5
Expand protection for elk by protecting more land in or around the restoration zone
1 2 3 4 5
Offer nuisance elk control permit to landowners
1 2 3 4 5
Construct elk food plots and open habitats within Wildlife Management Areas
1 2 3 4 5
28. Please rate your level of acceptance for the following elk management strategies in Tennessee.
Management action Completely unacceptable
Somewhat unacceptable
Neutral Somewhat acceptable
Completely acceptable
Promote elk hunting opportunities for all
1 2 3 4 5
Develop elk viewing opportunities in multiple locations
1 2 3 4 5
Design and implement statewide promotion of elk tourism
1 2 3 4 5
Establish a private land elk hunting program
1 2 3 4 5
Give priority for local landowners in elk permit lottery drawing
1 2 3 4 5

7
29. How important is restoration and conservation of elk in Tennessee to you? Very
Unimportant Somewhat unimportant
Neutral Somewhat Important
Very Important
30. How satisfied are you with the current elk management effort in Tennessee?
Very Unsatisfied
Somewhat Unsatisfied
Neutral Somewhat Satisfied
Very Satisfied
31. Please indicate your level of agreement with each of the following statements.
Statements Strongly disagree
Somewhat disagree
Neutral Somewhat agree
Strongly agree
I am confident in wildlife agency’s capacity to manage elk in the region 1 2 3 4 5
Wildlife agency professionals listen to our concerns 1 2 3 4 5
Wildlife agency professionals know what is best for local residents 1 2 3 4 5
Wildlife agency professionals share similar goals as me 1 2 3 4 5
I trust wildlife agency professionals to effectively manage elk in Tennessee
1 2 3 4 5
Wildlife agency professionals are capable of managing elk-human conflicts
1 2 3 4 5
I trust wildlife agency professionals to help us deal with nuisance elk 1 2 3 4 5
Section D: Demographics: Questions below will help us ensure people being surveyed are representative of all residents in 5-county regions. Answers will be kept confidential.
32. What is your age? ______ years 33. What is your gender? ______ Male ______ Female 34. How many people live in your household? _____ # total _____ # under 18 years _____ # hunters 35. What is the highest level of education you have completed?
_____ Some high school _____ Associate degree _____ High School diploma, GED _____ Bachelor’s degree _____ Some college _____ Post-graduate degree

8
36. What is your current employment status?
_____ Full-time job _____ Unemployed _____ Retired _____ Part-time job _____ Student _____ Military
37. Approximately what percent of your household’s income is derived from farming and ranching?
_____0% _____26-50% _____76-100% _____1-25% _____51-75%
38. Do you hunt for big or small game in Tennessee or elsewhere?
_____Yes _____No 39. Have you applied for elk hunting permit in Tennessee since elk hunting opened in Tennessee?
_____Yes _____No
40. In 2017, what was your approximate annual household income before taxes?
_____Less than $25,000 _____$100,000 to $124,999 _____$200,000 to $224,999 _____$25,000 to $49,999 _____$125,000 to $149,999 _____$225,000 to $249,999 _____$50,000 to $74,999 _____$150,000 to $174,999 _____$250,000 and higher _____$75,000 to $99,999 _____$175,000 to $199,999
Thank you for completing this survey!
Please use the space provided below for any additional elk related comments.
If you have any additional questions, please contact Dr. Neelam Poudyal – 865.974.8771; [email protected]
Please return this survey in the enclosed postage-paid envelope. If you have misplaced the envelope, send the completed survey to:
Dr. Neelam C. Poudyal ID Associate Professor Department of Forestry, Wildlife, & Fisheries University of Tennessee 274 Ellington Plant Science Bldg., Knoxville, TN 37996

58
Appendix B: Pre-notification Invitation

Dear FIRST_NAME MI LASTNAME ADDRESS1 CITY, STATE_ABBR ZIP ZIP4
In the next few days, you will receive in the mail a request to complete a brief survey for an
important project that is being conducted by researchers at the University of Tennessee. The
project, supported by the Tennessee Wildlife Resource Agency (TWRA), is an effort to learn
how local residents, like yourself, feel about the presence of elk in the region.
In 2000, elk were released in the North Cumberland Wildlife Management area to restore their
population in the region and are now in various parts of Anderson, Scott, Campbell, Morgan,
and Claiborne counties. You are one of the very few residents being randomly selected from
these counties to help in this study. Whether you see elk regularly near your home or even if elks
are not currently present on or near your land, your response is extremely important in designing
programs to effectively manage elk in the region. Once you receive the survey, please complete
as many questions as you can and return it in the prepaid envelope being provided.
Sincerely,
Dr. Neelam C. Poudyal
Associate Professor
Department of Forestry, Wildlife, & Fisheries
The University of Tennessee
274 Ellington Plant Sciences
Knoxville, TN 37996
(865) 974-8771

60
Appendix C: Cover Letter with Invitation
January 26, 2018
Dear FIRST_NAME MI LASTNAME ADDRESS1 CITY, STATE_ABBR ZIP ZIP4 We are contacting you to ask for your help in a study that is very important for elk management in the 5- county region of Morgan, Scott, Anderson, Campbell, and Claiborne counties. This study is an effort to learn how residents of these counties value elk and what concerns they have regarding elk management. You are one of a small number of residents chosen at random and invited to participate in this study. Your response is extremely important. Even if elk are currently not present on your land, please answer as many questions as you can and return the survey in the enclosed postage paid envelope. While the North Cumberland Wildland Management Areas (WMAs) serve as prime habitat for elk herds, some elk may roam outside the WMAs, specifically on surrounding private farms and ranchlands. This leads to a variety of situations where elk interact with local residents like you in many ways. Your answers will be critical in understanding local residents’ views and experience with elk, and help wildlife agencies develop effective elk management programs in your area. Once the survey is returned, your name will be deleted from our contact list. Completing this survey takes about 15 minutes, is voluntary, and the information you give us is strictly confidential. Your name will not be placed on the survey or associated with your responses. Return of this survey constitutes consent to participate in this study. If you are below 18 years old, please do not complete this survey. If you have any questions about this study, please feel free to contact me at the address given below. If you have questions about your rights as a research participant, contact the University of Tennessee’s Office of Research Compliance Officer at (865) 974-7697. Thank you very much for your assistance in this research project. Sincerely,
Dr. Neelam C. Poudyal Associate Professor Email: [email protected] (865) 974-8771

62
Appendix D: Reminder Post Card
Survey Reminder
Dear NAME
STREET ADDRESS
CITY, STATE ZIP
Recently, we invited you to participate in a research survey regarding your opinion and attitudes
regarding elk in five county region of Anderson, Scott, Campbell, Morgan, and Claiborne. If you
have already completed the survey, please accept our sincere thanks. If not, please complete and
return it as soon as possible.
In case your survey was misplaced or lost, you will be receiving another copy in a few days. You
are one of the very few randomly selected residents in your county to participate in this study
and your response is extremely important. Once you receive the survey, please complete as many
questions as you can and return it in a prepaid, self-addressed envelope being provided.
Sincerely,
Dr. Neelam C. Poudyal
Associate Professor
Department of Forestry, Wildlife, and Fisheries
The University of Tennessee
274 Ellington Plant Sciences
Knoxville, TN 37996
Email: [email protected]
(865) 974-8771

64
Appendix E: Follow up letter with reminder
February 15, 2018
Dear FIRST_NAME MI LASTNAME ADDRESS1 CITY, STATE_ABBR ZIP ZIP4 Recently, we invited you to participate in a research survey regarding elk in Tennessee. If you have already responded, please accept our sincere thanks. If not, we would like to renew our invitation. We are contacting you to ask for your help in a study that is very important for management of elk in five county region of Morgan, Scott, Anderson, Campbell, and Claiborne in Tennessee. This study is part of an effort to learn how local residents in these counties value elk and feel about elk management. You are one of a small number of residents chosen at random and invited to participate in this study by completing the enclosed survey. Your response is extremely important. Even if Elk are currently not present on your land, please answer as many questions as you can and return the survey in enclosed business reply envelope. While North Cumberland Wildland Management Areas (WMAs), serve as prime habitat for elk herds, it is natural for some to roam outside the WMAs, specifically on private farms and ranchlands in the surroundings. This leads to a variety of situations where elk interact with local residents like you in many ways. Your answers will be critical in understanding the opinions of local communities about elk, and help wildlife agencies develop effective elk management programs in your area. Once the survey is returned, your name will be deleted from our contact list. Completing this survey takes about 15 minutes, is voluntary, and the information you give us is strictly confidential. Your name will not be placed on the survey or associated with your responses. Return of this survey constitutes consent to participate. If you are younger than 18 years, please do not complete this survey. If you have any questions about this study, please feel free to contact me at the address given below. If you have questions about your rights as a research participant, contact the University of Tennessee’s Office of Research Compliance Officer at (865) 974-7697. Thank you very much for your assistance in this research project. Sincerely,
Dr. Neelam C. Poudyal Associate Professor Email: [email protected] (865) 974-8771

66
Appendix F: Economic Analysis Methodology

Economic Estimation Methodology
There are many ways to characterize economic importance of wildlife-based recreation and
tourism opportunities. One way would be to analyze expenditures brought in by hunters and other
visitors (e.g. viewers) in the region in some economic input-output analysis framework. Such an analysis
would allow estimating how expenditures in certain sector of the economy (e.g. restaurants, lodging)
may ripple through the economy and create additional economic impacts in terms of jobs, value added,
and tax revenue created. The other approach would be to use non-market valuation techniques such as
travel cost methods and contingent valuation method to analyze revealed or stated preference data and
estimate some measure of economic value beneficiaries place on resource. Such measures may include
net benefit of having opportunity to access a site for recreation (e.g. hunting, viewing) or willingness to
pay for conserving the resource (existence).
This study combined a number of non-market valuation techniques to estimate the use and non-use
values of elk in Tennessee. Each method used in this analysis have already been applied elsewhere by
economists to characterize the economic value of elk or other wildlife resources. The methodology
(estimation techniques, assumptions, data sources, benefit estimation, aggregation etc.) used in
estimating of each type of values (hunting, viewing, and existence) are discussed below.
A. Value of opportunity to hunt
Travel cost method of valuing recreation site access
Travel cost method (TCM) is a commonly used revealed preference valuation method to
estimate the net economic value of recreation access (Haab & McConnell, 2002; Parsons, 2003). It is a
demand-based model (Parsons, 2003) where the number of trips taken by an individual is modeled as a
function of the cost of accessing the site and other social and demographic characteristics of the
recreationist. The net benefit a recreationist derives by accessing the site is generally expressed in terms
of net economic benefit or consumer surplus (CS). It is the difference between how much an individual is
willing to pay and the actual cost she or he actually incurs in accessing the site (Freeman, Herriges, Kling,
2014). Hence, the net benefit or CS represents the monetary value of benefit a user loses in case the site
is no longer available for recreation.
Since the elk hunting in Tennessee is regulated through a lottery-based system, a typical
individual travel cost model of trip demand is not feasible. In such case, economists have relied on elk
permit applications at zip code levels to represent the demand for elk hunting access (Loomis, 1982;
Scrogin et al., 2000)). Accordingly, this study used zonal travel cost method (ZTCM) to model the
demand for elk hunting permits, in which permit applications by zip codes were analyzed along with
travel cost, and the demographics of each zip code using different regression models. The estimated
measure of the expected benefit or the value of the opportunity of receiving an elk hunting access was
estimated and then aggregated across all zip codes to derive the total benefit of elk hunting in
Tennessee.
Zonal travel cost model of elk permit demand
Loomis (1982) and Dwyer, Kelly, and Bowes (1977) stated that the recreation site should have
sufficient capacity to accommodate all the demand to visit a recreation site and travel cost and
recreation use measured do not show the actual recreation benefit if this condition does not hold.

Because the benefits from the recreationists repealed in the lottery (those who were not selected) are
not included in benefit estimation and the demand curve only represents the demand and benefits of
successful lottery applicants, applications for the recreation rather than actual trip should be used to
satisfy the assumption that observations of site use reflect unconstrained demand (Loomis, 1982).
Following Loomis (1982), the empirical zonal travel cost model for lottery rationed elk hunting was
specified as follows:
𝐿𝑛(𝐴𝑃𝑃𝐿𝐼𝐶𝐴𝑇𝐼𝑂𝑁𝑆𝑖/𝐶𝐴𝑃𝐼𝑇𝐴𝑖)
= 𝑇𝐶𝑖 + 𝐼𝑁𝐶𝑖 + 𝐼𝑁𝐶𝑆𝑄𝑅𝑖 + 𝐻𝑈𝑁𝑇𝐸𝑅𝑁𝑖 + 𝐴𝐺𝐸𝑖 + 𝐴𝐺𝐸𝑆𝑄𝑅𝑖 + 𝜇𝑖 (1)
Where APPLICATIONi represents the number of applications applied from zip code i for elk permit to
hunt elk in NCWMA for year j, TCi is the cost required from zip code i to reach the NCWMA, INCi is the
average household income of the zip code i, INCSQRi is the quadratic for variable INCi, HUNTERNi is the
average number of big game hunters of the zip code i, AGEi is the average age of applicants from zip
code i, AGESQRi is the quadratic term for variable AGEi, and the term 𝜇𝑖 is random error.
The estimated parameters of the travel cost from the demand function can be used to calculate
consumer surplus (CS), which is the area under the demand curve between the choke price and the
individual’s price line and is also known as the net benefit of a trip (Parsons, 2003). Mathematically, the
surplus is the area equal to the negative inverse of the estimated travel cost coefficient in the demand
equation. Using the regression results with a transformed dependent variable from equation (4.3), the
CS can be easily calculated from reciprocal of the travel cost coefficient (-1/βTC) (Creel & Loomis, 1990;
Loomis et al., 2009).
Variables and data sources
The number of elk permit applicants per zip code was calculated by summing the applications
from each zip code for a year. The approximate expected travel cost, in case the applicants were
successful in the lottery, was calculated using the CDXZipStream, an Excel add-in, which analyzes zip
code data and calculates the driving distance and time of applicant’s resident and the NCWMA. Only the
cost of gas, depreciation, and upkeep costs such as oil, repairs, maintenance, tires were considered for
mileage rate following previous hunting studies (Knoche & Lupi, 2007) and fixed costs such as insurance
was not included in the mileage rate. The average vehicle operating cost per mile between 2015 and
2017 was $ 0.45 for a pickup truck (American Automobile Association [AAA], 2018) and the mileage rate
is within the range of values used in other recreation studies (Hussain et al. 2016, Knoche & Lupi, 2013;
Knoche & Lupi, 2007; Smith & Moore, 2012). The most commonly used practice in travel cost studies is
to value travel time at the full or a third of the hourly wage rate (Knoche & Lupi, 2007; Parsons, 2003;
Phaneuf & Smith, 2005). Therefore, two travel cost variables were constructed based on two different
assumptions of wage rate (no wage rate and a portion (1/3) of reported wage rate) to calculate the
opportunity cost of time. The first travel cost variable (TCOST1) was constructed using cost required to
travel without considering the opportunity cost of time (i.e. travel cost was the product of round-trip
driving distance and mileage rate plus application fee and license fee). The second travel cost variable
(TCOST2) was constructed by summing TCOST1 and one third of the wage rate multiplied by the total
time spent for round trip, where the wage rate was calculated by dividing zip code level average annual
household income by total number of working hours (2080) in a year (Loomis & McTernan, 2014).
Following Parsons (2003), the application and permit fees were included in the travel cost variable. The
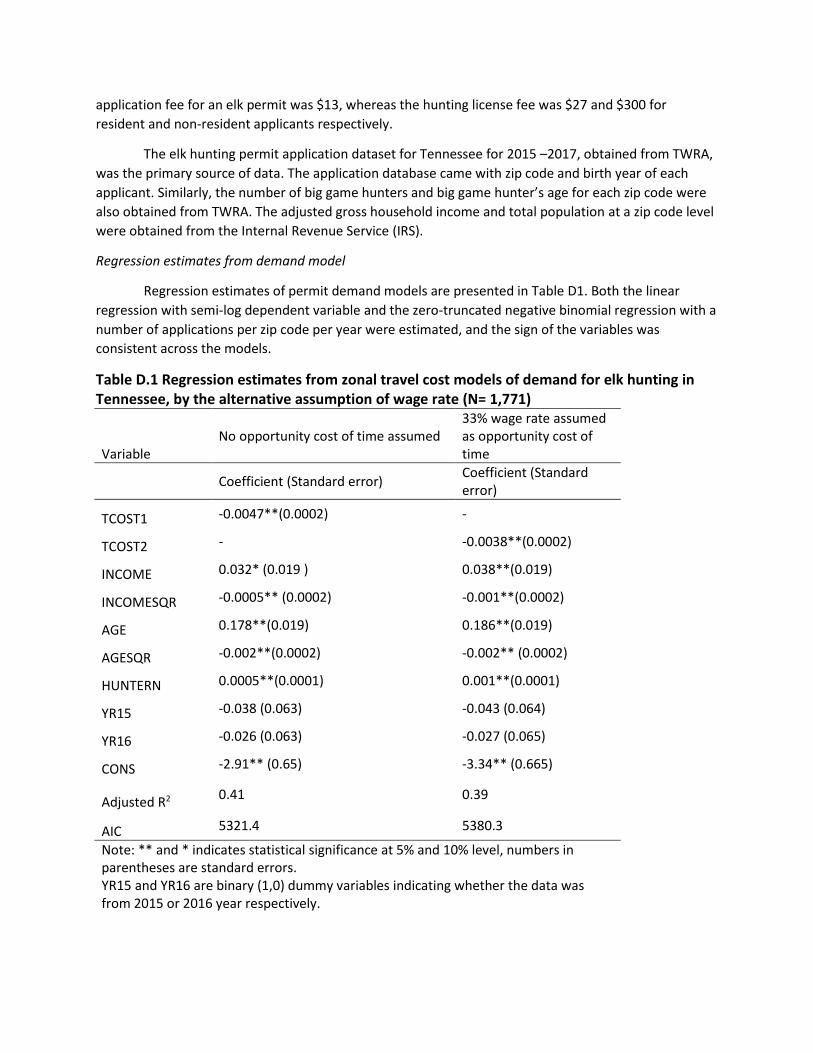
application fee for an elk permit was $13, whereas the hunting license fee was $27 and $300 for
resident and non-resident applicants respectively.
The elk hunting permit application dataset for Tennessee for 2015 –2017, obtained from TWRA,
was the primary source of data. The application database came with zip code and birth year of each
applicant. Similarly, the number of big game hunters and big game hunter’s age for each zip code were
also obtained from TWRA. The adjusted gross household income and total population at a zip code level
were obtained from the Internal Revenue Service (IRS).
Regression estimates from demand model
Regression estimates of permit demand models are presented in Table D1. Both the linear
regression with semi-log dependent variable and the zero-truncated negative binomial regression with a
number of applications per zip code per year were estimated, and the sign of the variables was
consistent across the models.
Table D.1 Regression estimates from zonal travel cost models of demand for elk hunting in Tennessee, by the alternative assumption of wage rate (N= 1,771)
Variable No opportunity cost of time assumed
33% wage rate assumed as opportunity cost of time
Coefficient (Standard error)
Coefficient (Standard error)
TCOST1 -0.0047**(0.0002) -
TCOST2 - -0.0038**(0.0002)
INCOME 0.032* (0.019 ) 0.038**(0.019)
INCOMESQR -0.0005** (0.0002) -0.001**(0.0002)
AGE 0.178**(0.019) 0.186**(0.019)
AGESQR -0.002**(0.0002) -0.002** (0.0002)
HUNTERN 0.0005**(0.0001) 0.001**(0.0001)
YR15 -0.038 (0.063) -0.043 (0.064)
YR16 -0.026 (0.063) -0.027 (0.065)
CONS -2.91** (0.65) -3.34** (0.665)
Adjusted R2 0.41 0.39
AIC 5321.4 5380.3
Note: ** and * indicates statistical significance at 5% and 10% level, numbers in parentheses are standard errors. YR15 and YR16 are binary (1,0) dummy variables indicating whether the data was from 2015 or 2016 year respectively.

Benefit estimation
The CS value or the net benefit was estimated by taking the negative inverse of the regression
coefficient on the cost variable. Following past studies (Kling & Sexton, 1990; Martínez-Espiñeira &
Amoako-Tuffour, 2008), the lower and upper bounds of the confidence interval of the price coefficient
were calculated through bootstrapping the standard errors. The per person benefit estimates and the
average number of applications (13.2) were multiplied by the number of zip codes from where TWRA
received elk permit applications (742) to derive the total net economic benefits of elk hunting
opportunity in NCWMA.
B. Value of elk viewing
Travel cost method for economic valuation of access for elk viewing
Travel cost method (TCM) is widely used in estimating the economic value of accessing a site for
recreation such as elk viewing (Haab & McConnell, 2002; Parsons, 2003). The number of trips taken by
an individual to the site of interest is modeled as a function of the cost of accessing the site and other
social and demographic characteristics of the recreationist. The welfare measure or the net benefit a
recreationist derives by accessing the site is generally expressed in terms of net economic benefit or
consumer surplus (CS). In other words, it is the difference between how much an individual is willing to
pay and the actual cost she or he actually incurs in accessing the site (Freeman, Herriges, Kling, 2014).
Mathematically, this measure of net benefit per trip or CS is equal to the negative inverse of the
estimated travel cost coefficient from the demand function (Parsons, 2003).
Following Freeman (1992, p. 443-447), the empirical demand model for elk viewing in NCWMA in
Tennessee was specified as follows:
𝑇𝑅𝐼𝑃𝑆𝑖𝑘 = 𝑓 (𝑇𝐶𝑂𝑆𝑇𝑖𝑘, 𝑆𝑈𝐵𝐷𝐼𝑆𝑖𝑘, 𝐼𝑁𝐶𝑂𝑀𝐸𝑖 , 𝐴𝐺𝐸𝑖, 𝐺𝐸𝑁𝐷𝐸𝑅𝑖,
𝐻𝑂𝑈𝑆𝐸𝐻𝑂𝐿𝐷𝑖, 𝐻𝐼𝐺𝐻𝑆𝐶𝐻𝑂𝑂𝐿𝑖, 𝐹𝑈𝐿𝐿𝑇𝐼𝑀𝐸𝑖, 𝐿𝐼𝑉𝐸𝑖) + 𝜇𝑖𝑘 (2)
Where, TRIPSik represents the annual trip taken by respondent i to site k in 2017, TCOSTik is the trip cost
associated with respondent i’s to site k, SUBDISik is the distance between individual i’s origin to the
closest elk viewing sites outside of 5-county region other than site k, INCOMEi is the household income
of the respondent, AGEi is the age of the respondent, GENDERi is the dummy variale to respesent the
gender of the respondent (MALE=1), HOUSEHOLDi is the family size of the respondent i, HIGHSCHOOLi is
the dummy variable if the respondent i has completed the highschool only, FULLTIMEi is the dummy
variable if the respondent i is a fulltime employee, LIVEi is the dummy variable if the respondent i lives
or owns land within the 5-county region, and the term uik is random error.
Variables and data sources
The annual number of elk viewing trips in 2017 was used as the dependent variable in model
shown in eq (2). The dependent variable was computed based on their responses to multiple questions.
First, the respondent was asked whether they went to the Hatfield Knob tower or any other sites within
5-county region for elk viewing. Next, those who indicated that they went for elk viewing were asked to
indicate the number of elk viewing trips taken in 2017. Those who reported taking elk viewing trips
within the NCWMA region were also asked to provide the number of trips taken to other.

The CDXZipStream, an Excel add-in to analyze ZIP code data in Microsoft Excel, was used to
calculate driving distance and time between the ZIP code of respondent’s residence (i.e. the origin of the
trip) and the elk viewing site they visited. Following Parsons (2003), the mileage rate of the vehicles was
estimated by adding cost of gas and upkeep (such as cost of oil, maintenance, tires) and following
Knoche and Lupi (2007), the fixed costs such as insurance and depreciation cost were not included in the
mileage rate. The average vehicle operating cost per mile of the medium sedan was $0.1697 for 2017
(American Automobile Association [AAA], 2018). Estimating the cost of travel time is the most
challenging issue in computing trip cost (Parsons, 2003), and there is still no consensus on treatment of
time in travel cost studies. The most commonly used practice is to value travel time at the full or a third
of the hourly wage rate (Knoche & Lupi, 2007; Parsons, 2003). Therefore, two travel cost variables were
constructed based on two different assumptions regarding the opportunity cost of time involving in
travelling (no opportunity cost of time, and a portion (1/3rd) of wage rate as the opportunity cost of
time).
The first travel cost variable (TCOST1) was the product of round-trip driving distance and
mileage rate. The second travel cost variable (TCOST2) was a sum of TCOST1 and opportunity cost of
time. The opportunity cost of time was a product of total time (hour) spent on two-way travel and 1/3rd
of wage rate ($/hour). Per hour wage rate was imputed by diving annual household income by a total
number of working hours (2080) in a year (Loomis & McTernan, 2014). In travel cost modeling, trip cost
is the sum of the expenses required to make a trip including travel cost, equipment cost, access fees to
the recreation site, and the opportunity cost of time (Parsons, 2003) but entry or access fee was not
charged to any elk viewing sites in 5-county region. The substitute site information was not collected
during the survey and it is suggested that substitute prices/goods should be included in the demand
model (Parsons, 2003) as the valuation of the site will be biased without substitute information
(Rosenthal, 1987). Various substitute information have been used in TCM studies but a heuristic rule
was used to assume the nearest elk viewing sites outside of 5-county region to be a proxy for substitute
site and the distance between the resident of the respondent and that site was calculated.
Of 1005 that responded to the survey, only 372 respondents mentioned that they visited the
Hatfield Knob tower or other places in 5-county region for elk viewing in 2017 (146 went to Hatfield
knob viewing tower only, 95 went to other sites only, and 131 visited both the tower and other sites).
After trimming the observations (missing number of visits, location of visits, dropping observations with
missing values of the variables used in the regression mode), a total of 314 observations were available
for final analysis.
The elk viewing information about the respondent was available from household survey
conducted as part of this study. The number of annual trips varied from 1 to 50 and the average
number of times they reported visiting Hatfield Knob Tower in 2017 was 2.95. The information of the
household population of the study area was obtained from the database of U.S. census bureau to
calculate aggregate consumer surplus (United States Census Bureau, 2018).
Regression estimates from demand model
Truncated Poisson and truncated negative binomial models were estimated, but results
from Poisson are not reported because the equality of the mean and variance was rejected. The results
are presented in Table 2.The sign and significance of the coefficients on most variables was consistent
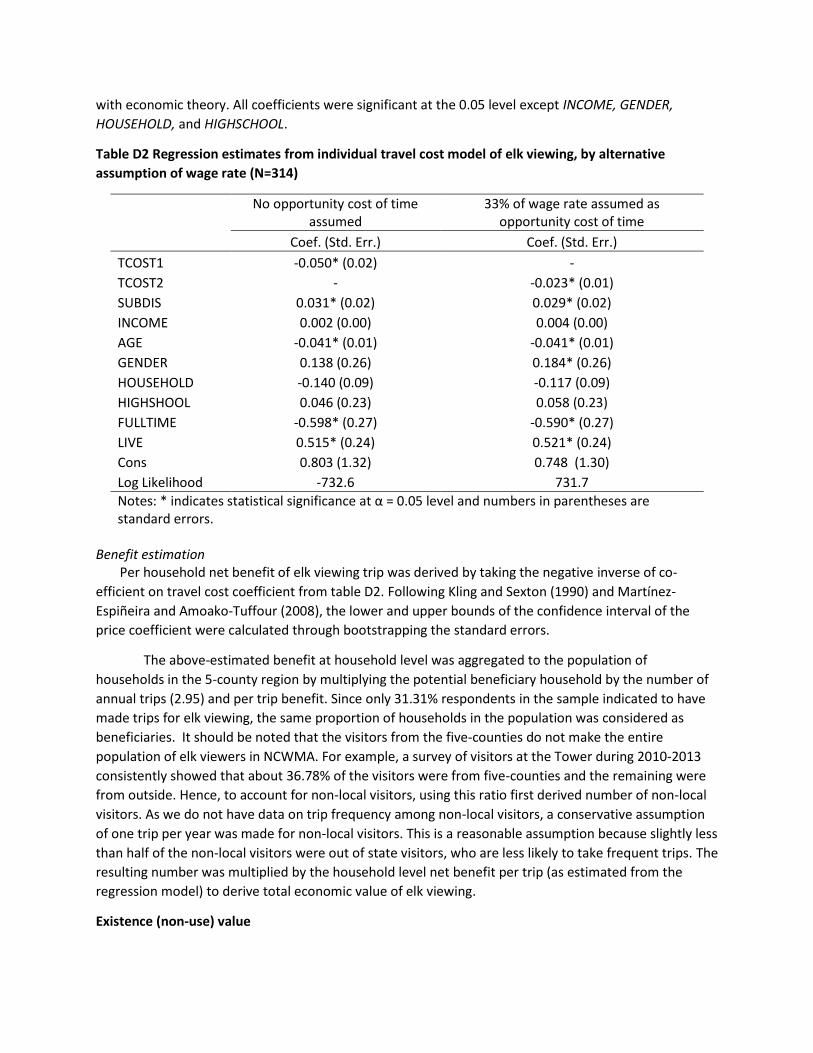
with economic theory. All coefficients were significant at the 0.05 level except INCOME, GENDER,
HOUSEHOLD, and HIGHSCHOOL.
Table D2 Regression estimates from individual travel cost model of elk viewing, by alternative
assumption of wage rate (N=314)
No opportunity cost of time assumed
33% of wage rate assumed as opportunity cost of time
Coef. (Std. Err.) Coef. (Std. Err.)
TCOST1 -0.050* (0.02) -
TCOST2 - -0.023* (0.01)
SUBDIS 0.031* (0.02) 0.029* (0.02)
INCOME 0.002 (0.00) 0.004 (0.00)
AGE -0.041* (0.01) -0.041* (0.01)
GENDER 0.138 (0.26) 0.184* (0.26)
HOUSEHOLD -0.140 (0.09) -0.117 (0.09)
HIGHSHOOL 0.046 (0.23) 0.058 (0.23)
FULLTIME -0.598* (0.27) -0.590* (0.27)
LIVE 0.515* (0.24) 0.521* (0.24)
Cons 0.803 (1.32) 0.748 (1.30)
Log Likelihood -732.6 731.7
Notes: * indicates statistical significance at α = 0.05 level and numbers in parentheses are standard errors.
Benefit estimation
Per household net benefit of elk viewing trip was derived by taking the negative inverse of co-
efficient on travel cost coefficient from table D2. Following Kling and Sexton (1990) and Martínez-
Espiñeira and Amoako-Tuffour (2008), the lower and upper bounds of the confidence interval of the
price coefficient were calculated through bootstrapping the standard errors.
The above-estimated benefit at household level was aggregated to the population of
households in the 5-county region by multiplying the potential beneficiary household by the number of
annual trips (2.95) and per trip benefit. Since only 31.31% respondents in the sample indicated to have
made trips for elk viewing, the same proportion of households in the population was considered as
beneficiaries. It should be noted that the visitors from the five-counties do not make the entire
population of elk viewers in NCWMA. For example, a survey of visitors at the Tower during 2010-2013
consistently showed that about 36.78% of the visitors were from five-counties and the remaining were
from outside. Hence, to account for non-local visitors, using this ratio first derived number of non-local
visitors. As we do not have data on trip frequency among non-local visitors, a conservative assumption
of one trip per year was made for non-local visitors. This is a reasonable assumption because slightly less
than half of the non-local visitors were out of state visitors, who are less likely to take frequent trips. The
resulting number was multiplied by the household level net benefit per trip (as estimated from the
regression model) to derive total economic value of elk viewing.
Existence (non-use) value

Stated preference method of estimating existence value of wildlife
Literature in natural resource economics suggest that people enjoy both use and non-use values
from wildlife resources. Unlike use values that are derived by directly using wildlife (e.g. hunting,
viewing), non-use values refer to the value people place on just the existence of wildlife in the
landscape. It is often argued to be the most important component of total economic value of wildlife
(Stevens et al. 1991). The theoretical foundation supporting the idea of existence value is based on the
argument that some people have intrinsic value or prefer to value wildlife as part of pristine nature,
which they never intend to use directly, and others may like to leave a bequest to future generations
(Krutilla 1967).
Unlike direct use such as hunting or viewing, characterizing existence value is challenging
because how households value existence of wildlife cannot be observed. However, economists use
various forms of stated preference survey to elicit such value by conducting a willingness to pay survey
of households that are considered to be potential beneficiaries of resource. Previous studies in wildlife
economics have used this approach to estimate existence value of wildlife. For example, Stevens et al.
(1991) conducted a survey of residents in New England to estimate existence value of various wildlife
species and Duffield (1992) used a contingent valuation survey of Montana residents to estimate their
willingness to pay for elk winter range. Survey question asking people to indicate their maximum
willingness to pay for helping conserve elk habitat in North Cumberland region was incorporated in the
household survey conducted as part of this study.
Regression model of willingness to pay
Typically, willingness to pay survey involves soliciting yes or no response from respondents
regarding a given bid amount (i.e. a randomly stated amount asked to contribute). Although the bid
amounts are limited and fixed, different individuals facing different budget constraints, tastes and
preference respond differently to either accept or reject the offered bid. The econometric modeling of
binary response to bid distribution allows exploiting this variation to estimate the mean willingness to
pay at household level. Following Welsh and Poe (1998), the willingness to pay model can be written as
shown below. The willingness to pay a given amount was denoted using a discrete choice variable. A
bivariate logit model (Greene, 2003) can be used to explain this dependent variable. Assuming that a
household’s utility is Yi , which in turn is a function of a vector of explanatory variables including the
payment made to enjoy elk’s presence in the landscape, Yi = 1 if the respondent is willing to contribute
the amount being asked, and Yi = 0 if not willing to do so.
Then,
k
k
ikiki XY1
0
* (3)
Where Y* is the latent variable, which was not observed. However, the observable dummy variable was represented, so
Y = 1 if Y* > 0 = 0, otherwise Yi
* ~ N(0,1) The Xki represent the response of the ith respondent to the explanatory variable. Similarly, β0 represents the intercept of the equation, βk is a vector of regression coefficients corresponding to each of the k
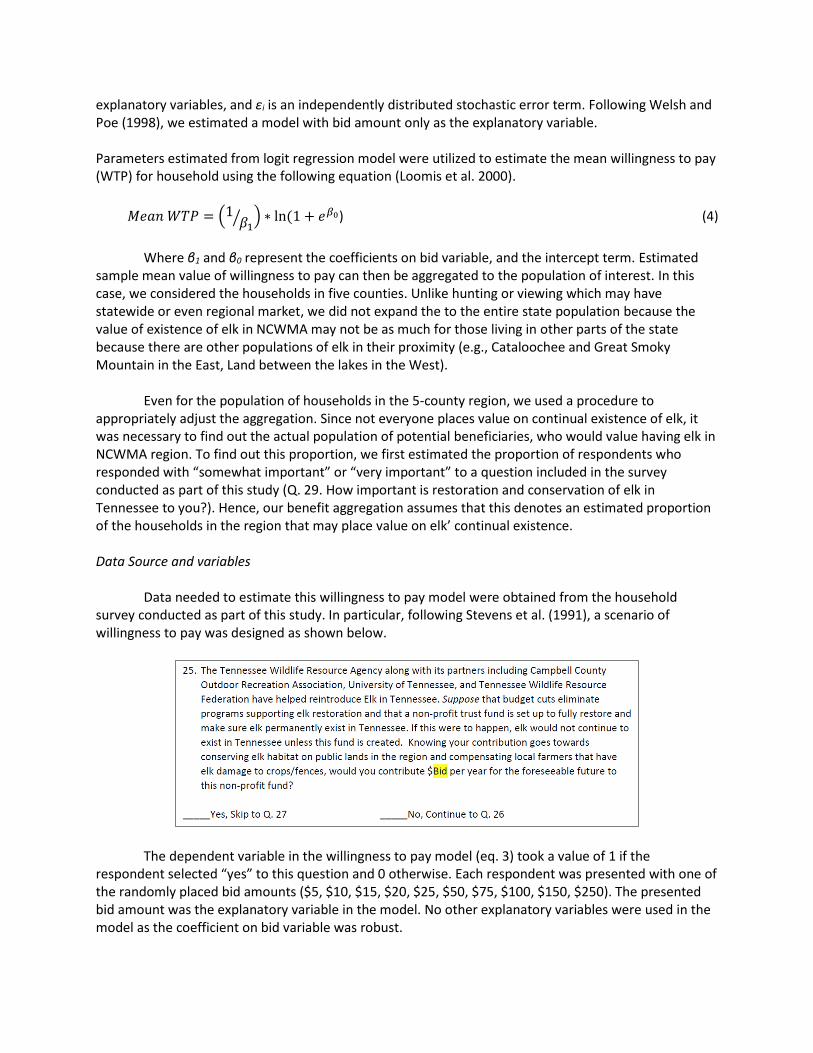
explanatory variables, and εi is an independently distributed stochastic error term. Following Welsh and Poe (1998), we estimated a model with bid amount only as the explanatory variable. Parameters estimated from logit regression model were utilized to estimate the mean willingness to pay (WTP) for household using the following equation (Loomis et al. 2000).
𝑀𝑒𝑎𝑛 𝑊𝑇𝑃 = (1𝛽1
⁄ ) ∗ ln (1 + 𝑒𝛽0) (4)
Where β1 and β0 represent the coefficients on bid variable, and the intercept term. Estimated
sample mean value of willingness to pay can then be aggregated to the population of interest. In this case, we considered the households in five counties. Unlike hunting or viewing which may have statewide or even regional market, we did not expand the to the entire state population because the value of existence of elk in NCWMA may not be as much for those living in other parts of the state because there are other populations of elk in their proximity (e.g., Cataloochee and Great Smoky Mountain in the East, Land between the lakes in the West).
Even for the population of households in the 5-county region, we used a procedure to
appropriately adjust the aggregation. Since not everyone places value on continual existence of elk, it was necessary to find out the actual population of potential beneficiaries, who would value having elk in NCWMA region. To find out this proportion, we first estimated the proportion of respondents who responded with “somewhat important” or “very important” to a question included in the survey conducted as part of this study (Q. 29. How important is restoration and conservation of elk in Tennessee to you?). Hence, our benefit aggregation assumes that this denotes an estimated proportion of the households in the region that may place value on elk’ continual existence. Data Source and variables Data needed to estimate this willingness to pay model were obtained from the household survey conducted as part of this study. In particular, following Stevens et al. (1991), a scenario of willingness to pay was designed as shown below.
The dependent variable in the willingness to pay model (eq. 3) took a value of 1 if the respondent selected “yes” to this question and 0 otherwise. Each respondent was presented with one of the randomly placed bid amounts ($5, $10, $15, $20, $25, $50, $75, $100, $150, $250). The presented bid amount was the explanatory variable in the model. No other explanatory variables were used in the model as the coefficient on bid variable was robust.

Results
Results from logit regression are presented in table D3. The coefficient on bid variable was negative and significant, suggesting that the respondents were less likely to agree to pay higher amount of contribution to help preserve elk habitat.
Table D3. Regression estimates from logit regression of willingness to pay for elk conservation in
Tennessee (N=937)
Variables Coef. (Std. Err.)
Bid -0.008413*** (0.001)
Cons -0.5230*** (0.101)
Log Likelihood -512.13
Notes: * indicates statistical significance at α = 0.05 level and numbers in parentheses are standard errors.
Benefit estimates
Based on the regression estimate, the mean willingness to pay for household was estimated by plugging in parameters into eq. (4). The total number of estimated households in the region that value preserving elk in the landscape was then multiplied by the sample mean of willingness to pay to derive the total economic value of elk existence. References American Automobile Association. (2018). Your Driving Costs. Retrieved from http://
exchange.aaa.com/automotive/driving-costs/#.WbIuBsiGNPZ
Creel, M. D., & Loomis, J. B. (1990). Theoretical and empirical advantages of truncated count data
estimators for analysis of deer hunting in California. American journal of agricultural economics,
72(2), 434-441.
Duffield, J. W., & Holliman, J. (1988). The net economic value of elk hunting in Montana: Montana
Department of Fish, Wildlife and Parks.
Dwyer, J. F., Kelly, J. R., & Bowes, M. D. (1977). Improved procedures for valuation of the contribution of
recreation to national economic development. Water Resources Center Research Report 128.
Urbana, III, University of Illinois at Urbana-Champaign.
Freeman, A.M. (1992). The measurement of Environmental and Resources Values: Theory and Methods.
Resources for the Future, Baltimore M.D. Johns Hopkins University Press.
Freeman, A.M., Herriges, J.A., & Cling, C.L. (2014). The measurement of environmental and resource
values: Theory and methods, Rutledge.
Greene, W. H. (2003). Econometric analysis. 5th edition, Prentice Hall, New Jersey.
Haab, T. C., & McConnell, K. E. (2002). Social norms and illicit behavior: An evolutionary model of
compliance. Journal of environmental management, 66(1), 67-76.
Hussain, A., Munn, I. A., Edwards, S. L., & Hunt, K. (2016). Economic Valuation of Hunter Access on
Mississippi Wildlife Management Areas: Discrete-Count Data Modeling. Forest Science, 62(5),
513-524.
Kling, C. L., & Sexton, R.J. (1990). Bootstrapping in applied welfare analysis. American Journal of
Agricultural Economics, 72(2), 406-418.
Knoche, S., & Lupi, F. (2007). Valuing deer hunting ecosystem services from farm landscapes. Ecological
Economics, 64(2), 313-320.
Krutilla, J. V. (1967). Conservation reconsidered. The American Economic Review, 57(4), 777-786.
Loomis, J. (1982). Use of travel cost models for evaluating lottery rationed recreation: Application to big
game hunting. Journal of Leisure Research, 14(2), 117-124.
Loomis, J., & McTernan, J. (2014). Economic value of instream flow for non-commercial whitewater
boating using recreation demand and contingent valuation methods. Environmental
management, 53(3), 510-519.
Loomis, J., Kent, P., Strange, L., Fausch, K., & Covich, A. (2000). Measuring the total economic value of
restoring ecosystem services in an impaired river basin: results from a contingent valuation
survey. Ecological economics, 33(1), 103-117.
Loomis, J., Tadjion, O., Watson, P., Wilson, J., Davies, S., & Thilmany, D. (2009). A hybrid individual—
zonal travel cost model for estimating the consumer surplus of golfing in colorado. Journal of
Sports Economics, 10(2), 155-167.
Martínez-Espiñeira, R., & Amoako-Tuffour, J. (2008). Recreation demand analysis under truncation, over
dispersion, and endogenous stratification: An application to Gros Morne National Park. Journal
of environmental management, 88(4), 1320-1332.
Parsons, G. R. (2003). The travel cost model A primer on nonmarket valuation (pp. 269-329): Springer.
Phaneuf, D. J., & Smith, V. K. (2005). Recreation demand models. Handbook of environmental
economics, 2, 671-761.
Rosenthal, D. H. (1987). The Necessity for Substitute Prices Recreation Demand Analyses. American
journal of agricultural economics, 69(4), 828-837.
Scrogin, D., Berrens, R. P., & Bohara, A. K. (2000). Policy changes and the demand for lottery-rationed
big game hunting licenses. Journal of Agricultural and Resource Economics, 501-519.
Smith, J.W., & Moore, R.L. (2012). Social-psychological factors influencing recreation demand. Evidence
from two recreational rivers. Environment and Behavior. 45(7), 821-850.
Stevens, T. H., Echeverria, J., Glass, R. J., Hager, T., & More, T. A. (1991). Measuring the existence value
of wildlife: what do CVM estimates really show? Land Economics, 67(4), 390-400.
United States Census Bureau (2018). Quick Facts. Retrieved from
https://www.census.gov/quickfacts/fact/table/farraguttowntennessee,TN,US/PST045217
Welsh, M. P., & Poe, G. L. (1998). Elicitation effects in contingent valuation: comparisons to a multiple
bounded discrete choice approach. Journal of environmental economics and
management, 36(2), 170-185.