local regulation and land-use change: the effects of wetlands bylaws in massachusetts
TRANSCRIPT
Regional Science and Urban Economics 39 (2009) 409–421
Contents lists available at ScienceDirect
Regional Science and Urban Economics
j ourna l homepage: www.e lsev ie r.com/ locate / regec
Local regulation and land-use change: The effects of wetlandsbylaws in Massachusetts☆
Katharine R.E. Sims a,⁎, Jenny Schuetz b,c
a Department of Economics, Amherst College, Amherst, MA 01002-5000, United Statesb NYU Furman Center for Real Estate and Urban Policy 40 Washington Square South, Suite 314-H, New York, NY 10012-1099, United Statesc Department of Economics, City College of New York, United States
☆ The authors thank Richard Arnott and two anoLori Bennear, WilliamClark,NancyDickson, AmyDain, InErzo Luttmer, Erich Muehlegger, Robert Stavins, particWiener Center Work in Progress seminar, EnvironmeSustainability Science Program for helpful comments agratefully acknowledges financial support from the NationResearch Fellowship and Harvard University. J. Schuetz gCenter for Real Estate and Urban Policy for financial supp⁎ Corresponding author. Tel.: +1 413 542 2902.
E-mail address: [email protected] (K.R.E. Sims).1 According to the USDA, in the five years between
11.2million acres (more than 2 million per year) wereKolankiewicz and Beck (2001) estimate that of the total o1970 and 1990, roughly half was due to populationincreased per-capita land consumption. The environminclude the loss and fragmentation of wildlife habitapollution and energy use that result from expanding ur
0166-0462/$ – see front matter © 2009 Elsevier B.V. Adoi:10.1016/j.regsciurbeco.2008.12.004
a b s t r a c t
a r t i c l e i n f oArticle history:
As urban areas across the U Received 21 February 2007Received in revised form 2 October 2008Accepted 18 December 2008Available online 20 February 2009JEL classification:Q24R14R31R52
Keywords:Environmental regulationOpen spaceLand useUrban policy
.S. grow, open-space lands providing wildlife habitat and ecosystem services arelost to development. In response, many communities have experimented with local regulations to encourageland conservation, but little is known about their effects on land-use change or housing supply. Wetlandsprotection bylaws are a potentially important and highly controversial form of local land-use regulation inMassachusetts. This paper uses conditional variation in the timing of adoption of these bylaws acrosscommunities to analyze their effects on rates of land-use change and housing growth from 1971 to 1999. Wefind that bylaws significantly reduced the rate of land conversion from open space to residential uses incommunities where they were enacted, but did not significantly reduce growth in housing units, housingvalues or housing density in those communities. We do not find strong evidence that land-use conversionwas displaced to neighboring communities, but supply constraints may have encouraged additionaldevelopment at alternate sites within communities or additional higher density housing development incommunities where it was allowed.
© 2009 Elsevier B.V. All rights reserved.
1. Introduction
The rapid conversion of open space to developed land uses is apolicy issue debated by both environmental and affordable housingadvocates.1 In the U.S., local governments play a key role, as most land-use decisions are made at the town, city, or county level. Communities
nymous referees, Vicki Been,gridGould Ellen,David Luberoff,ipants in Harvard University'sntal Economics Program, andnd suggestions. K. R. E. Simsal Science Foundation Graduateratefully thanks NYU's Furmanort.
1992 and 1997 an estimateddeveloped throughout the U.S.pen space conversion betweengrowth and half was due toental costs of land conversiont as well as the increased airbanized areas.
ll rights reserved.
across the country have used an array of policy tools for protectingopen space, including zoning regulations, land development taxes,impact fees, public land acquisitions, and private land trusts. Althoughlarge numbers of communities are in essence experimenting withdifferent local land-use policies, it is currently difficult to learn fromthis experience because there are few systematic evaluations of localpolicies (see Section 2). Restrictions on land developmentmay protectwildlife habitat and maintain valuable ecosystem services such aswater filtration or flood control, but potentially impose high costs byreducing the growth of housing supply and increasing prices or byencouraging inefficient development patterns.
In this study, we examine the case of local wetlands protectionbylaws,2 which give towns and cities in Massachusetts the power toregulate land use near wetlands more strictly than baseline state andfederal environmental protection laws.Wetlands bylaws areparticularlyimportant and controversial because they are one of the few forms oflocal regulation that cannot be superseded by a statewide affordablehousing law that allows developers to override other forms of local
2 Local laws adopted by towns are called bylaws, those adopted by cities are calledordinances. In this paper, we use the term bylaws to refer to both bylaws and ordinances.

410 K.R.E. Sims, J. Schuetz / Regional Science and Urban Economics 39 (2009) 409–421
zoning.3 Supporters of bylaws such as the Massachusetts Association ofConservation Commissions have stressed the various environmentalbenefits of wetlands.4 The Massachusetts Homebuilders Association,however, points to “local environmental regulations (regarding set-backs, wetlands, and related issues)” as one of the “major factors thatlimit their ability to permit new homes” (MHBA, 2004).
Our studyconsiders threedimensionsof the consequencesof this localland-use policy. First, were wetlands bylaws effective in achieving theirprimary policy objective: did they slow development of wetlands or theconversion of undeveloped land to residential uses? Second, did bylawsaffect the quantity or price of housing in the communities where theywere enacted? Third, what were the pathways through which bylawsmay have changed development patterns: did bylaws displace develop-ment to nearby communities, shift the locations of development withinthe same community, or induce changes in the density of new housing?
To estimate policy impacts, we combine new data on wetlandsbylaws and other local-level housing regulations with statewidecoverage of land use at three points in time (1971, 1985 and 1999) forcommunities in eastern and central Massachusetts. To identify effects,we take advantage of plausibly exogenous conditional variation in thetiming of adoption of wetlands bylaws. We rely only on residualvariation in timing, after controlling for potentially confoundingfactors that could reflect different underlying preferences for devel-opment or environmental protection. We control for communitydifferences in two ways: first, with community-level fixed effects andsecond, with direct control variables including other zoning regula-tions, citizen environmental preferences, geographic determinantsand demographic characteristics. The remaining residual variation inbylaw timing is assumed to result from factors exogenous to thecommunity, such as increased press attention, single high profileprojects, and the idiosyncrasies of local politics (see Section 4.1).
To test for potential displacement of development to neighboringcommunities, we construct a measure of bylaw adoption by eachcommunity's nearest neighbors. To test for changes in the location ofdevelopment within communities, we use GIS analysis to constructvariables for the distance from converted lands in each period in eachtown to the nearest wetlands area, the proportion of converted landsthat intersect with wetlands, and the proportion that are within a 100foot buffer of wetlands areas.
We find that each additional year of having a wetlands bylaw isassociated with an estimated 7.9–10.1 fewer acres of land converted toresidential use. Taking into account the number of years bylaws were ineffect, this suggests more than 10,000 acres protected from 1971–1999(approximately 6% of the total converted in study communities).However, we find no effect on changes in housing prices and a negativebut not statistically significant effect on changes in the number ofhousing units and the number of new construction permits issued. Wealso do not find significant effects on the amount of land used per newunit of housing, a proxy for the density of new development. In general,we restrict our analysis to communities that had at least 50 acres ofwetlands in 1971, excluding communities with little possibility todevelop near wetlands. The magnitudes are robust, however, toincluding all communities in eastern and central Massachusetts.
Our results suggest that wetlands bylaws have indeed slowedsome conversion of open space lands to residential uses. Thisreduction has not been accompanied by corresponding significantincreases in local housing prices or reductions in housing supplygrowth. The potential reduction in housing supply from land-userestrictions appears to have been mitigated partially by shifts in
3 For more information on Chapter 40B of Massachusetts General Law, see http://www.mass.gov/dhcd.
4 Wetlands bylaws should “protect the wetlands, water resources, and adjoining landareas…by controlling activities. . .likely to have a significant or cumulative effect upon…public or private water supply, groundwater, flood control, erosion and sedimentationcontrol, storm damage prevention…water quality, water pollution control, fisheries,shellfisheries,wildlife habitat, rare species habitat…and recreationvalues. . .” (MACC, 2002).
development location within communities. After adopting bylaws,development within communities is more likely to occur on landpatches which are further from wetlands and newly converted landsare less likely to overlap with wetlands. We do not find strongevidence for displacement of land conversion across towns, however:having more neighbors who adopt bylaws does not increase landconversion in the home community and has a positive but notstatistically significant effect on construction permits. We do find thatif neighboring communities adopt bylaws, this increases housingprices in the home community, suggesting possible supply constraintswithin housing sub-markets in different regions of Massachusetts.
Wetlands bylaws are likely to reduce allowable density on directlyaffected parcels, but might induce higher density development onother properties within the same community through price effects.We do not find significant evidence for increased density withintowns due to bylaws. This is not surprising, since zoning regulationsare a binding constraint on density in most of these communities, andthe amount of land converted to residential use per new housing unitvaries considerably within our sample. However, we do observe thatduring this period of time a large share of new construction in theregion occurred in already dense areas with few remaining wetlandsand less restrictive zoning. To the extent that wetlands bylawscontributed to higher land or housing prices across the entire region,they may have increased the relative profitability of high densitydevelopment in places where that was permitted by zoning.
The paper proceeds as follows: Section 2 briefly reviews previousresearch; Section3presents ourdata sources, trends in land-use change inMassachusetts, background onwetlands bylaws and a discussion of theirexpected effects. Section 4 outlines our empirical strategy to use variationin timing of bylaws; Section 5 discusses results, and Section 6 concludes.
2. Previous research
Local governments in the United States play a significant role indecisions regarding land use change. However, the effects of localland-use regulation on land-use change have not been studiedextensively because of the difficulty of obtaining data at the locallevel on regulations and land-use change. Likewise, few studies in thehousing literature have considered the effects of environmentalregulations instead of conventional zoning restrictions.
2.1. Land-use regulations and housing supply
The theoretical question of howregulationmayaffect landvalueshasbeen explored in a number of papers employing variations on amonocentric city model (see, for example, Capozza and Helsley, 1989;Fujita, 1982; Wheaton, 1982a,b). In general, the literature finds thatgrowth controls—such as greenbelts or urban growth boundaries—willdrive up the average values of existing developed land and housing byconstraining the supply of additional land for development. Brueckner(1990) and Fischel (1985) argue that the effect of growth controls on thevalue of undeveloped land might be ambiguous. If controls reduce theallowable density of development below what would have been theprofit-maximizing density, values of undeveloped land should decrease.Mild growth controls could theoretically increase undeveloped landvalues by ensuring that future negative population externalities arelimited, although this is also likely to lead to inefficient leapfrogdevelopment patterns, as modeled by Wu and Plantinga (2003).
Although the magnitudes of the effects differ across studies, mostempirical studies of the effects of regulations find that regulationincreases housing prices and reduces the amount of new construction(see, for instance, Fischel, 1990; Glaeser and Gyourko, 2005, 2002;Green, 1999; Landis et al., 2002; Malpezzi, 1996; Pollakowski andWachter, 1990; Quigley and Raphael, 2005; Rosen and Katz, 1981).Studies specifically concernedwith supply response to regulations haveconcluded that heavily regulatedmetropolitanareashave lower levels of

411K.R.E. Sims, J. Schuetz / Regional Science and Urban Economics 39 (2009) 409–421
new construction and more inelastic supply (Green et al., 2005; Levine,1999; Malpezzi and Green, 1996; Mayer and Somerville, 2000).
Two recent studies examined the effects of land-use regulations onhousing outcomes in Massachusetts, using the same database ofregulations as this study. Glaeser and Ward (2006) find that single-family minimum lot size is negatively associated with number of newhousing permits from 1980–2004 and with overall housing density in2004. They find no significant impact of the presence of wetlandsbylaws alone on the number of annual housing permits, but an indexcombining wetlands bylaws with septics and subdivision regulationsyields a significant negative association. Schuetz (2008b) finds thatstrict regulation of multifamily housing is associated with lower levelsof new permitting for multifamily and single-family housing but findsno significant effect on housing rents.
Our research adds to these existing studies in two ways. First,although the LHRDatabasewas assembled partly because developers inMassachusetts believe that non-zoning regulations, including wetlandsbylaws, have substantially constrained their ability to develop newhousing, the effects of these non-zoning regulations have not beenstudied in detail. Second, both Glaeser and Ward (2006) and Schuetz(2008a) consider housing-related outcomes but do not focus on thepotentially important outcomes with respect to land-use change.
2.2. Land-use regulations and land-use change
Several studies to date have considered how regulations willinfluence the pace of land-use change, usuallywithin the framework of
Table 1Key variables and summary statistics (N=158 communities).
Variable Description
DEPENDENT VARIABLESResidential development Acres of land converted to residential development (1971–85, 19Change in housing values Change in median housing values ($), inflation adjusted (1971–85,Change in housing units Change in number of housing units (1971–85, 1985–99)Land used / new hsg Residential dev./new housing unitsHousing permits Number of housing permits issued (1971–85, 1985–99)Patch distance Avg. distance converted land to wetlands / avg. dist. available laIntersects wetlands Percent converted land overlapping with wetlands
WETLANDS BYLAWYears bylaw Number of years wetlands bylaw in effect (1971–85, 1985–99)Bylaw stringency Index of stringency of wetlands bylaw
GEOGRAPHIC & DEMOGRAPHIC CONTROLSWetlands Acres of fresh and saltwater wetlandsTotal area Land area of communityLand available Undeveloped land in forest, fields, or other open space that is noGreenvote Pct of ballots voting “yes” on statewide environmental referendaPopulation size Number of residentsPercent has BA Percent of population with BA, graduate or professional degreePercent white Percent of population that is whitePercent kids Percent of population under age 18Distance to Boston Distance to Boston in milesDist. to satellite city Distance to other nearest city in MA# Major routes Major roads intersecting community# Exits Highway exits
OTHER LAND USE REGULATIONSSingle family minimumlot size
Average single-family minimum lot size (sq ft),weighted by district size
Multi family lots Predicted no. of lots on which multifamily units could be builtCommuter rail stops Number of commuter rail stopsRep. town mtg Governed by representative meetingCouncil Governed by city councilCluster index Index of stringency of cluster zoningGrowth mgmt index Stringency of growth managementExclude wetlands Wetlands excluded from min. lot sizeShape rule Zoning imposes regular lot shape ruleSeptic index Stringency of septic system regs.Subdivision index Stringency of subdivision rulesPercent sewer Index percent houses served by sewer
models of the optimal allocation of land across potential uses (e.g.Miller and Plantinga, 1999; Stavins and Jaffe, 1990). Focusing onnational policies, Lubowski et al. (2008) find that transition prob-abilities across six categories of land use were influenced by nationalcrop payments programs and the Conservation Reserve Program. CRPpayments may also have enduring effects on land use in some areas bygenerating conservation beyond the contract period (Roberts andLubowski, 2007), but where agricultural lands are close to metropo-litan areas, these programs likely have little effect because of therelatively higher returns to residential or commercial uses (Parks andSchorr, 1997).
A limited number of previous studies directly examine the effects oflocal land-usepolicies or regulations on rates of conversion. Carrión-Floresand Irwin (2004)find that conversion fromagricultural to residential landin the Cleveland suburbs reflects both market forces, such as populationdensity, proximity to infrastructure and quality of land, and governmentpolicies, such as minimum lot sizes. Kline and Alig (1999) conclude thatOregon's statewide land-use planning law has done little to reduceconversion of designated farm and forest land, although land inside urbangrowth boundaries is significantly more likely to be converted. Cho et al.(2003) use a structural simultaneous equations model to estimate howurbanization, land-use regulations, and public finance interact acrosscounties of five western states, finding that regulations significantlyreduced the total developed area. Our study adds to this literature byexploiting variation in regulations across local jurisdictions in Massachu-setts andexamining anunexplored but potentially important formof localregulation.
Source Mean S.D.
85–99) Mass GIS Landuse (1971, 1985, 1999) 532 4281985–99) U.S. Census (1970, 1980, 1990, 2000) 70154 40698
1208 13070.647 0.496
U.S. Census New Residential Construction Index 1276 1226nd Calculated from Mass GIS Landuse and DEP Wetlands 118 18.5
35.9 13.3
Local Housing Regulation Database 3.39 5.165.36 5.06
Mass GIS Landuse (1971, 1985, 1999) 515 63612642 7430
t protected Mass GIS Landuse + Protected/OS (1971, 1985) 6791 5338Mass Election Statistics (1972, 1982) 71.3 12.1U.S. Census (1970, 1980, 1990) 18211 21522
21.4 13.197.8 2.8232.2 6.52
Mass GIS (Towns) 23.7 9.1915.1 7.42
Mass GIS (Eotmajroads) 1.54 1.251.58 2.16
Mass GIS (Zoning, 2000) 43077 20895
Schuetz, 2008a −44.1 65260.570 0.876
DHCD community profiles (2004) 0.152 0.3590.133 0.340
Calculated from Local Housing Regulation Database(2004)
4.31 3.581.44 2.710.987 0.8130.456 0.4992.25 2.1213.57 4.922.05 1.77
8 The 1972 vote is to approve the adoption of an amendment “. . .which declares thatthe people have the right to clean air and water, freedom from excessive andunnecessary noise, and the natural, scenic, historic and esthetic qualities of theirenvironment. It further declares that the protection of the right to the conservation,development and utilization of the agricultural, mineral, forest, water, air and other
412 K.R.E. Sims, J. Schuetz / Regional Science and Urban Economics 39 (2009) 409–421
This paper also contributes to the small literature examining thespatial effects of regulations.McConnell et al. (2006) conclude that bothzoningandeconomicvariablesdeterminedensitywithin subdivisions ina suburban Maryland county, and calculate that about 10 percent morelots would have been added in the absence of zoning limits on density.Lichtenberg et al. (2007) find some evidence that lot size standards andforest conservation regulations crowd out voluntarily provided sharedopen spacewithin suburban residential subdivisions inMaryland. Irwinand Bockstael (2004) estimate a hazard model of land-use conversionusing data from suburban Calvert County, Maryland, and find that thepresence of public sewers, location within the state's Priority FundingAreas, and proximity to open space also speed up conversion, whilecluster zoning and large minimum lot sizes decrease the probability ofearly conversion. Previous research in Massachusetts using case studiesfrom a small number of towns finds that wetlands bylaws do influencewhere residential units are sited within a developable parcel, condi-tional on housing permits having been granted (Meyer and Konisky,2007, 2005). We add to this literature by combining new sources ofspatial and regulatory data and by explicitly considering how regula-tionsmay have displaced development within and across communities.
3. Land-use patterns and local regulation in Massachusetts
3.1. Data sources
Data on land-use patterns and local regulations in Massachusettswas compiled from several sources (see Table 1). The key source ofregulatory data, including the timing of adoption of wetlands bylaws, isthe Local Housing Regulation Database. This database on land-useregulations in eastern and central Massachusetts was assembled by thePioneer Institute for Public Policyand theRappaport Institute forGreaterBoston (2005).5 In addition to data on wetlands bylaws, the resultingdatabase contains detailed information on zoning practices, includingsingle- and multi-family dimensional requirements, cluster zoning,growth management practices, subdivision rules, and septic systemregulations. Tomeasure overall stringency of regulations, we created anindex for each type of regulation listed above. More information on thecreation of the wetlands stringency index can be found in Appendix A.6
The communities included in the database, and thus in our study, arecities and towns roughly within a 50-mile radius of Boston (but notincluding Boston itself), as shown in Fig. 1. This geographic area spansseveral types of communities including older inner-ring suburban areas,industrial (or formerly industrial) satellite cities, bedroomcommunities,and relatively undeveloped towns on the urban fringe. The combinedpopulation of all communities in our study area was over 4 million in2000, or just under two-thirds of the total population of Massachusetts.
Data on land-use patterns and other geographic variables come fromthe Massachusetts Geographic Information System. The land-useclassifications available in this system were interpreted from 1:25,000aerial photographyof the state; complete statewide coverage is availableonly for 1971, 1985, and 1999. Within our sample communities, thisdataset contains more than 126,000 patches7 of land and their landclassifications across theperiods. Fig. 2 illustrates the spatial distributionof patches for a section of suburban land. The land-use layer includeseasily visible patches of wetlands (non-forested freshwater wetlandsand salt-water wetlands) and is used to calculate variables measuringwetlands area and land available for development at the start of eachperiod and changes in residential land use. We also use a more detailedwetlands layer to calculate distances from patches converted to
5 For the methodology used to construct the Local Housing Regulation Database, see:http://www.masshousingregulations.com/.
6 Methodology of the indices created for other types of regulation is available fromthe authors.
7 Parcel level data corresponding to ownership boundaries is not available state-wide.
residential use to wetlands (“Wetlands DEP”; scale 1:12,000). Thislayer includes smaller patches ofwetlands thatmay be coveredby forestand thatoverlapwithother primary land-use classifications, as shown inFig. 2.
Demographic and economic characteristics of communities in oursample were assembled from the Decennial Census of Population andHousing, the Massachusetts Department of Housing and CommunityDevelopment, and the Massachusetts Municipal Profiles (Garwood,1986). To measure the environmental preferences of local citizens, wecollected data on the percentage of votes in favor of state-widereferenda on environmental issues conducted in 1972 and 1982(Secretary of the Commonwealth of Massachusetts 1972, 1982).8
3.2. Patterns of land-use change in Massachusetts
Using the patch-level land-use data, we calculate an aggregatetransition matrix for 8 major categories of land use between 1971–85and 1985–99, shown in Table 2. By far the largest transitions in bothperiods were the conversion from forests, fields and other open spaceland use to residential land use. Between 1971 and 1985, residentialland use expanded by more than 73,000 acres and between 1985 and1999 by more than 106,000 acres. We will focus on the effects ofwetlands bylaws on the expansion of residential land use, which is thelargest transition and could potentially be affected by bylaws across allcommunities.9 Conversely, we ignore potential transitions fromresidential to open space uses; this matches the reality that landalready converted to residential use is very unlikely to be convertedsubsequently to other uses: 99.7 percent of residential land in 1985was still in that use in 1999. Finally, this transition matrix reveals thatbaseline state and federal laws do seem to be preventing mostconversion of visible (non-forested) wetlands across time. Between1971–1985, 0.5 percent of wetlands were converted to residential orcommercial use, and 0.3% were converted between 1985–1999.
3.3. Wetlands bylaws: regulatory meaning and context
InMassachusetts, decisions to allownewconstruction aremade at thecity or town level, in accordancewith local zoning bylaws/ordinances andother regulations that govern the development process. All land inMassachusetts is incorporatedwithin city or town boundaries; there is noregulation of land by county governments.
Massachusetts has a statewide Wetlands Protection Act, originallypassed in 1972, that regulates development activities in and near certaintypes of wetlands.10 While the state Department of EnvironmentalProtection provides oversight of the law, primary responsibility forimplementation is granted to local conservation commissions, volunteerboards of three to seven citizens who are appointed by the board ofselectmen or city council. By state law, conservation commissions reviewapplications for development in or near (within 100 feet of) designatedwetlands areas and decide whether the proposed development wouldviolate the wetlands protection law (Dain, 2006). The commissions mayreject applications or impose conditions on thebuilding project in order toprotect wetlands resources. Conservation commissions have leeway in
natural resources is a public purpose. . .” The 1982 vote is on the “Bottle Bill” whichrequired that a refundable deposit be paid for certain beverage containers sold inMassachusetts (Secretary of the Commonwealth of MA, 1972, 1982).
9 Conversion from undeveloped uses to commercial or industrial land is generallyconcentrated in a few communities along major transportation corridors and issubstantially restricted by zoning.10 Specifically, state law protects wetlands that border surface waters (also called“bordering wetlands”), land subject to flooding, riverfront areas, and submerged land.

Fig. 1. Studyarea and spatial variation in the timingofwetlands bylawadoption. Data source: Office ofGeographic and Environmental Information (MassGIS), Commonwealth ofMassachusetts.
413K.R.E. Sims, J. Schuetz / Regional Science and Urban Economics 39 (2009) 409–421
termsof details, but are bound toupholdminimumprotection as specifiedby the state law (Meyer and Konisky, 2005, 2007).11
In addition to the state law, cities and townsmay adopt local wetlandsregulations that expand jurisdiction in various ways. For instance, statelaw only protects wetlands that border bodies of water, but local bylawsmay extend protection to isolated vegetated wetlands or may regulatedevelopment in larger buffer zones around the wetlands.12 Communities
11 In addition, federal law under the Clean Water Act specifies that any dumping offill material into wetlands requires a certification from the state that the project wouldnot violate state water quality standards. The major costs of developing in wetlandsareas are likely to be the costs of the permitting process. Physically filling and buildingon wetlands would also create direct costs, but given the large amount of land nearBoston that has been filled and built on in the city's history, it seems probable that itwould be profitable to fill wetlands if that were allowed. Meyer and Konisky's (2005,2007) review of individual projects found only 10% that involved any directdisturbance to wetlands. Conservation Commissions can also stipulate that if projectsfill in wetlands, these wetlands must be replicated in another location, which addsadditional cost. For a study that assesses whether replication policies are environmen-tally effective, see Brown and Veneman (2001).12 Although the contents of local bylaws may vary, there is considerable agreementon a number of provisions. Nearly two-thirds of communities with wetlands bylawsgranted buffer zones to vernal pools, almost 90% regulated buffer zones aroundisolated vegetated wetlands. Over three quarters expanded the state's definition of“land subject to flooding,” created “no-build” zones around wetlands, or allowed theconservation commission to delay certification of wetlands during certain seasons orweather conditions.
cannot adopt a bylaw unless it offers additional protection beyond thestate law.
Wetlands bylaws are just one piece of the complex local regulatoryframework governing new residential construction in Massachusetts(Altshuler and Gomez-Ibanez,1993). The Pioneer/Rappaport Initiative onLocalHousingRegulation collecteddata onmore than100different detailsof local regulations pertaining to new residential construction. Every cityor town has a local zoning bylaw/ordinance that enumerates wheredifferentuses andstructure typesmaybebuilt, setsminimumlot sizes andother dimensional requirements, and outlines procedures for obtainingbuilding permits for eachuse type. Besides zoning bylaws, all but sixof thecommunities in our sample have subdivision regulations that set designstandards for roadconstruction innewresidential subdivisions, andnearlysixty percent of the cities and towns in our study have rules regulatinginstallation of septic systems.13 We control for these other forms ofregulation both directly and with community fixed effects.
3.4. Potential effects of wetlands bylaws
Before turning to our empirical strategy, we consider briefly howwetlands bylaws might be expected to influence land-use change and
13 This is only a partial list of land use regulations commonly used in the state; formore detailed discussion see Dain (2006), Glaeser, et al. (2006) or Glaeser and Ward(2006).

Fig. 2. Illustration of land use categories and detailed wetlands layer. Data source: Office of Geographic and Environmental Information (MassGIS), Commonwealth of Massachusetts.
414 K.R.E. Sims, J. Schuetz / Regional Science and Urban Economics 39 (2009) 409–421
housing development outcomes in Massachusetts. Although shapedby local policies and constraints, most decisions to convert land toresidential uses are made by private actors. Two potential frameworksare useful for thinking about these private decisions: the optimalallocation of a parcel of land to different land-use shares (e.g.Lubowski et al., 2008), and the optimal timing and density of urbandevelopment (e.g. Arnott and Petrova, 2006).14 The first framework ismost useful for understanding howwetlands bylawsmay impact ratesof conversion from open space to residential land use, while thesecond provides additional insight on how bylaws may influence thequantity, price and density of newly developed housing.
We assume that the direct effects of wetlands bylaws on anindividual property owner (with land in or near wetlands) are likely
14 In the first framework, landowners face a choice in each period of how much landto allocate to different uses, such as agriculture, forestry, residential development, etc.Landowners consider the net present value of returns from each type of land use aswell as the conversion costs of switching from one use to another. These models havebeen used to explain the probabilities of parcel-level conversions (Lubowski et al.,2008; Irwin and Bockstael, 2002; Kline and Alig, 1999; McMillen, 1989), the aggregateshares of land converted in larger jurisdictions (e.g., Stavins and Jaffe, 1990; Hardieet al., 2000), and the existing equilibrium shares of land in particular use categories ata single point in time (e.g., Miller and Plantinga, 1999; Parks and Murray, 1994). In thesecond framework, landowners decide at what time to develop and choose a capital-land ratio for development. These models have been used to explain the chronologicaland spatial patterns of urban growth and redevelopment (Arnott et al., 1999; Braid,2001; Brueckner, 1980; Capozza and Helsley, 1989; McGrath, 2000; Rosenthal andHelsley, 1994; Turnbull, 1988; Wheaton, 1982). This framework has also been adaptedto explain the impacts of housing and land use policies, including rent regulation,impact fees and land taxation, on housing growth and prices (Arnott and Petrova,2006; Brueckner, 1997; McFarlane, 2003).
to be twofold: bylaws will increase construction costs and decreasethe proportion of a parcel potentially available for development. Asnoted in the previous section, bylaws will potentially reduce theproportion of a parcel available for development by expanding bufferzones and land defined as “wetlands.” Conversion costs are likely to behigher because bylaws add time and complexity to the permittingprocess, bring additional lands under conservation commissionreview, and increase rejection risk. Meyer and Konisky (2005) alsosuggest that local bylaws in Massachusetts significantly increasetransactions costs by changing the permitting appeals process.15
We consider first the potential impact of increasing constructioncosts. In the context of optimal land allocation models, greaterconstruction costs mean a higher hurdle to overcome in transitioninga share of land from undeveloped use to residential use. This will tendto lower the equilibrium share of land allocated to residential use andthe probability of conversion in each time period. In the context ofdecisions about the optimal timing of development, higher construc-tion costs will reduce the expected returns to development and thustend to delay housing construction on parcels affected by wetlandsbylaws. The immediate direct effect of higher construction costs isthus to reduce the probability of land-use conversion or residentialdevelopment on parcels with wetlands. In communities that enactbylaws (and have wetlands), we therefore expect that the supply of
15 When there is no local bylaw, permit applicants or neighbors can make appeals tothe Massachusetts Department of Environmental Protection and go through the stateadministrative court system. When a local bylaw is in effect, appeals are made throughthe Massachusetts Superior Court; these judicial appeals tend to have higher costs forall parties (Meyer and Konisky, 2005).

Table 2Land use transitions 1971–1985 and 1985–1999.
The table shows how land that was in a given land use in 1971(1985) was allocated in 1985(1999). The diagonals (highlighted) represent no change. The categories correspond tothe following Mass GIS categories (“21 land use classification”):Agriculture = cropland (1), pasture (2).Forest/wp = forest (3), woody perennial (21).Other land = open land (6), mining (5), participation recreation (7), spectator recreation (8), water rec. (9), urban open space (17), waste disposal (19).Wetlands = non-forested wetlands (4), salt-water wetlands (14).Residential = multifamily (10), single-family b0.25 acre (11), single-family 0.25–0.5 acres (12), single-family N0.5 acres (13).Comm/ind = commercial (15), industrial (16).Transportation = transportation (18).Water = water (20).
415K.R.E. Sims, J. Schuetz / Regional Science and Urban Economics 39 (2009) 409–421
developable land shifts in. However, this will then have an indirecteffect of raising the equilibrium price of land within that community,thereby increasing the price of housing.
The second channel through which wetlands bylaws may have adirect effect is through restricting the “footprint” available for residentialdevelopment within a parcel. In a model of land-use allocation this willreduce the equilibrium shares allocated to residential use and constrainsupply in a similar fashion to raising construction costs. In the durablestructures model, the direct effect would be to decrease density byshrinking the allowable footprint. However, if density is assumed to bevariable, developers might respond by building higher structures tocompensate for the reduced footprint (maintaining the capital-landratio on that parcel). In reality, most communities in our sample havezoning restrictionswhichwould not allow increased height. In that case,restrictions on the footprint sizewould again result in an inward shift insupply and higher housing values.16
Both higher construction costs and restricted footprints areexpected to lead indirectly to higher housing values. This mightthen induce conversion of marginal properties that otherwise wouldhave remained undeveloped (this inducement occurs through higherhousing rent in the durable structures model and through higherreturns to residential land use in the land allocation model).17 Higher
16 The inward shift due to restricting density might be partially offset: e.g. in theArnott and Petrova (2006) model, a constraint on density should make it profitable todevelop earlier.17 Bylaws could also raise housing values within a community by ensuring thatnearby wetlands with amenity value will not be developed in the future. Previoushedonic studies have found limited amenity values of proximity to wetlands. Doss andTaff (1996) find that only scrub-shrub and open-water wetlands increase propertyvalues, while much of the Massachusetts wetlands are forested. Mahan et al (2000)find significant but substantively very small (0.003% of median house price) positiveimpacts of wetlands in Portland, OR.
housing values would also tend to encourage greater density on otherproperties in the community with the bylaw. (Since developers inmany communities face limits from zoning, we may not actuallyobserve large changes in density as a result of the bylaws). Both ofthese responses would mitigate the initial reduction in supply ofhousing.
Higher housing values in one community would also be expected toincrease demand for substitutes: e.g. housing in nearby communities.Wecould potentially observe increased land conversion or housing devel-opment in communities where several neighboring communities haveadopted bylaws. Higher housing values might also encourage greaterdensity in neighboring communities, conversion of existing industrial orcommercial land to housing or re-development at higher densities.
Although price signals are likely to induce shifts in the pattern ofdevelopment as a result of bylaw adoption, it may be difficult to observeprice effects directly. To the extent that surrounding communities areclose substitutes and buyers are mobile, equilibrium prices should besimilar across townswith andwithout bylaws.18 A price effectmight stillbe felt within housing submarkets (e.g. South Shore vs. North Shore) ifhome buyers are tied to specific work or family locations and there isdifferential adoption of bylaws across regions.
4. Estimating the effects of wetlands bylaws
4.1. Using variation in the timing of wetlands bylaws
In order to estimate the effects of wetlands bylaws in Massachu-setts, we take advantage of the natural experiment created by having
18 For example Schuetz (2008b) finds that local multifamily zoning restrictionssignificantly decrease permits for new units within the restrictive locality but do notlead to significant rent differences by town.
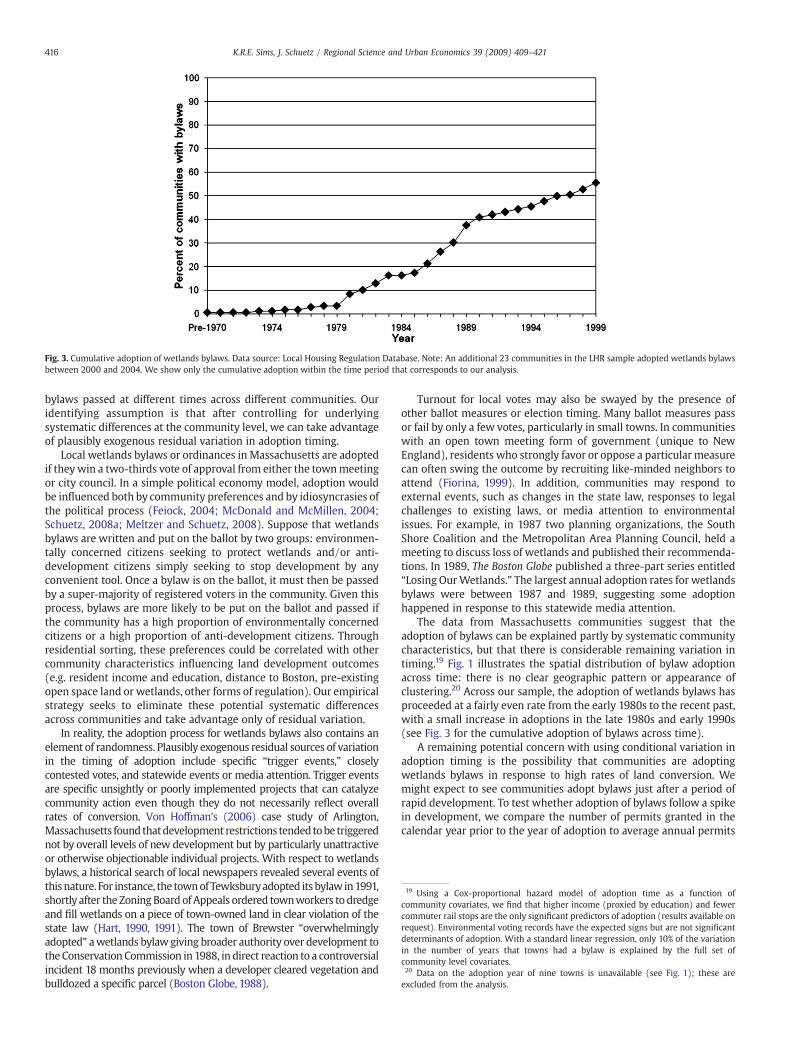
Fig. 3. Cumulative adoption of wetlands bylaws. Data source: Local Housing Regulation Database. Note: An additional 23 communities in the LHR sample adopted wetlands bylawsbetween 2000 and 2004. We show only the cumulative adoption within the time period that corresponds to our analysis.
19 Using a Cox-proportional hazard model of adoption time as a function ofcommunity covariates, we find that higher income (proxied by education) and fewercommuter rail stops are the only significant predictors of adoption (results available onrequest). Environmental voting records have the expected signs but are not significantdeterminants of adoption. With a standard linear regression, only 10% of the variationin the number of years that towns had a bylaw is explained by the full set ofcommunity level covariates.20 Data on the adoption year of nine towns is unavailable (see Fig. 1); these areexcluded from the analysis.
416 K.R.E. Sims, J. Schuetz / Regional Science and Urban Economics 39 (2009) 409–421
bylaws passed at different times across different communities. Ouridentifying assumption is that after controlling for underlyingsystematic differences at the community level, we can take advantageof plausibly exogenous residual variation in adoption timing.
Local wetlands bylaws or ordinances in Massachusetts are adoptedif theywin a two-thirds vote of approval from either the townmeetingor city council. In a simple political economy model, adoption wouldbe influenced both by community preferences and by idiosyncrasies ofthe political process (Feiock, 2004; McDonald and McMillen, 2004;Schuetz, 2008a; Meltzer and Schuetz, 2008). Suppose that wetlandsbylaws are written and put on the ballot by two groups: environmen-tally concerned citizens seeking to protect wetlands and/or anti-development citizens simply seeking to stop development by anyconvenient tool. Once a bylaw is on the ballot, it must then be passedby a super-majority of registered voters in the community. Given thisprocess, bylaws are more likely to be put on the ballot and passed ifthe community has a high proportion of environmentally concernedcitizens or a high proportion of anti-development citizens. Throughresidential sorting, these preferences could be correlated with othercommunity characteristics influencing land development outcomes(e.g. resident income and education, distance to Boston, pre-existingopen space land or wetlands, other forms of regulation). Our empiricalstrategy seeks to eliminate these potential systematic differencesacross communities and take advantage only of residual variation.
In reality, the adoption process for wetlands bylaws also contains anelement of randomness. Plausibly exogenous residual sources of variationin the timing of adoption include specific “trigger events,” closelycontested votes, and statewide events or media attention. Trigger eventsare specific unsightly or poorly implemented projects that can catalyzecommunity action even though they do not necessarily reflect overallrates of conversion. Von Hoffman's (2006) case study of Arlington,Massachusetts found thatdevelopment restrictions tendedtobe triggerednot by overall levels of new development but by particularly unattractiveor otherwise objectionable individual projects. With respect to wetlandsbylaws, a historical search of local newspapers revealed several events ofthis nature. For instance, the townof Tewksburyadopted its bylaw in1991,shortly after the Zoning Board of Appeals ordered townworkers to dredgeand fill wetlands on a piece of town-owned land in clear violation of thestate law (Hart, 1990, 1991). The town of Brewster “overwhelminglyadopted” awetlands bylawgiving broader authority over development tothe Conservation Commission in 1988, in direct reaction to a controversialincident 18 months previously when a developer cleared vegetation andbulldozed a specific parcel (Boston Globe, 1988).
Turnout for local votes may also be swayed by the presence ofother ballot measures or election timing. Many ballot measures passor fail by only a few votes, particularly in small towns. In communitieswith an open town meeting form of government (unique to NewEngland), residents who strongly favor or oppose a particular measurecan often swing the outcome by recruiting like-minded neighbors toattend (Fiorina, 1999). In addition, communities may respond toexternal events, such as changes in the state law, responses to legalchallenges to existing laws, or media attention to environmentalissues. For example, in 1987 two planning organizations, the SouthShore Coalition and the Metropolitan Area Planning Council, held ameeting to discuss loss of wetlands and published their recommenda-tions. In 1989, The Boston Globe published a three-part series entitled“Losing OurWetlands.” The largest annual adoption rates for wetlandsbylaws were between 1987 and 1989, suggesting some adoptionhappened in response to this statewide media attention.
The data from Massachusetts communities suggest that theadoption of bylaws can be explained partly by systematic communitycharacteristics, but that there is considerable remaining variation intiming.19 Fig. 1 illustrates the spatial distribution of bylaw adoptionacross time: there is no clear geographic pattern or appearance ofclustering.20 Across our sample, the adoption of wetlands bylaws hasproceeded at a fairly even rate from the early 1980s to the recent past,with a small increase in adoptions in the late 1980s and early 1990s(see Fig. 3 for the cumulative adoption of bylaws across time).
A remaining potential concern with using conditional variation inadoption timing is the possibility that communities are adoptingwetlands bylaws in response to high rates of land conversion. Wemight expect to see communities adopt bylaws just after a period ofrapid development. To test whether adoption of bylaws follow a spikein development, we compare the number of permits granted in thecalendar year prior to the year of adoption to average annual permits

Table 3Testing for a spike in permits prior to bylaw adoption.
Years prior to bylaw adopted Total permits, year before bylaw adopted Avg. annual permits period before bylaw adopted Difference N
3 years 104.3 (12.5) 104.9 (12.6) −0.6 (−0.088) 1165 years 104.3 (12.8) 101.5 (13.4) 2.8 (0.284) 11310 years 107.3 (14.0) 95.9 (10.8) 11.4 (1.193) 102
Columns 1 and 2 show the mean and standard error (in parentheses) of housing permits issued. Column 3 shows the difference in means and t-statistics from two-tailed t-tests fordifference in means between columns 1 and 2. T-tests exclude communities for which permit data are not available for the full period.
417K.R.E. Sims, J. Schuetz / Regional Science and Urban Economics 39 (2009) 409–421
granted over several longer periods prior to adoption.21We do not findevidence that adoption of bylaws follows a sudden increase indevelopment. The numbers of permits granted in the year prior toadoption are statistically indistinguishable from the average annualpermits over the preceding three, five, and ten-year periods (Table 3).If however, it is still the case that higher levels of development in theearly part of one of the periods do significantly influence the timing ofadoption, this will bias our estimates towards zero (making it lesslikely that we would see an effect on land conversion rates). Ideally,we would have instruments for wetlands bylaws, but unfortunatelywe do not have convincing instrumental variables in this case. Giventhe situation described above, however, our results can be interpretedas a lower bound on the effectiveness of bylaws in slowing conversion.
4.2. Empirical specifications
4.2.1. Estimating effects on land conversion and housing developmentWe estimate a reduced form model where conversion of land to
residential use is a function of factors affecting returns to develop-ment and conversion costs:
Δ residential landiΔt = β1 YrsBylawð ÞiΔt + α VZit + γΔt + γi + e
iΔt ð1Þ
Residential development22 from time t-1 to t (e.g. Δt) is assumedto be a function of the number of years that bylaws were in effectduring that period (YrsBylaw), a vector of other characteristics (Z) ofthe community environment affecting the relative utility of conver-sion, measured at time t, time-period fixed effects (γΔt), andjurisdiction-level fixed characteristics (γi).
We estimate this function using two strategies. The first takesadvantage of the panel structure of the data and includes jurisdiction-level fixed-effects. In this case effects are identified from differenceswithin jurisdictions across time (Table 4, columns 1–4). Fixedcharacteristics across communities which could affect timing ofadoption and conversion rates, such as geographic location orgovernment structure, are differenced out. We also control for severalpotentially confounding time-varying factors: we include the amountof land in wetlands and the remaining land potentially available fordevelopment (unprotected open space23). These variables are mea-sured at the start of each period (1971, 1985) to avoid endogeneityconcerns. To control for local environmental preferences, we includethe proportion of “green” voters, based on results from two stateenvironmental referenda near the start of each period and theproportion of the population that has a bachelor's degree or more
21 We look for a spike in the previous calendar year, since new bylaws are typicallyadopted in annual town meetings held in May or June, making it difficult for acommunity to pass a bylaw in the same year.22 This variable is measured as the number of acres converted to residential land usein each period. We also constructed a version that subtracts any land that waspreviously in commercial or industrial uses (relevant only for a few communities). Theresults are very similar; we present here the more conservative estimates given byusing all land converted. The results are also robust to using the percent change inresidential land use or the log of acres as dependent variables.23 We exclude protected land, such as state and federal parks, since this land is onlymade available for development under unusual circumstances (by intersecting theMassGIS “Open Space” layer, accounting for dates of protection with the “Landuse”layer.)
(also a proxy for permanent income). Other demographics commonlyincluded in housing models to measure housing demand are added asrobustness checks, although none are significantly correlated with thetiming of adoption after adding the controls above: population size,percent of the population that is white non-Hispanic and percent ofpopulation under age 18.
The second estimation strategy (Table 4, columns 5–6) uses pooledcross-sectional regressions.24 This allows us to estimate coefficientsfor fixed characteristics that are differenced out by the first set ofmodels, including distance to Boston, transportation access, govern-ment structure, and other regulatory measures that are likely to becorrelated with both the adoption of wetlands bylaws and conversionof open space.
To estimate the effects of wetlands bylaws on housing develop-ment, we use similar models to those described above, with measuresof housing prices, new housing production and the amount of landused per new housing unit as dependent variables (Table 5). Theseprovide alternative measures of whether wetlands bylaws haverestricted housing supply.
4.2.2. Testing for shifts in location of developmentRestrictions on land use in particular locations are likely to result in
changes or displacement in the locations of development. There are anumber of possible pathways through which such displacement couldoccur. First, as previously mentioned, restrictions could result inspillovers of development to nearby communities without bylaws.Second, development might shift to different parcels, presumablyfarther away from wetlands, within the same jurisdiction. Third,developers may build on the same parcel of land, but alter thelocations of individual houses on that parcel.
To explore questions of potential spillover effects across jurisdic-tions, we include a spatial lag for bylaws in neighboring communitiesin our basic model (Table 6, columns 1–3). This is measured as theaverage of the YrsBylaw variable for each of the community's fivenearest neighbors (defined by distance between centroids). Themodified model is shown in Equation 2:
Δ residential landiΔt = β1 YrsBylawð ÞiΔt + β2 YrsBylawNNð ÞiΔt+ α VZi
t + γΔt + γi + eiΔt
ð2Þ
where YrsBylawNNmeasures the behavior of neighbors; other variablesare the same as in Eq (1) above.
To test for whether development shifts to new locations fartherfrom wetlands within the same jurisdiction, we use GIS analysis tomeasure the distance from the centroids of each of the convertedpatches of land in each of the periods to the nearest wetlands area. Wethen normalize this measure by dividing by the average distance ofland available for development at the start of each period to thenearest wetlands area. If in towns with wetlands bylaws, developersare choosing parcels further away fromwetlands out of all the parcelsavailable, then we should expect to see higher values of this ratiowhere wetlands bylaws have been adopted (Table 6, column 4).Finally, to test for whether there might be changes in housing locationwithin parcels, we measure the distance from the edges of new
24 Random effect models produce similar results (available from authors).

Table 5Housing development measures and bylaws.
Dependent variable: Change inhousing values
# Permitsissued
Change inhousing units
Land usedper new unit
(1) (2) (3) (4)
Years bylaw −111.6 −17.84 −27.44 −0.002(316.3) (16.03) (23.40) (0.006)
Wetlands −123.0 2.680 8.270 −0.001(104.1) (3.801) (5.542) (0.002)
Land available 13.56⁎⁎⁎ 0.002 −0.107 0.000(3.61) (0.240) (0.177) (0.000)
Green vote −607.7 71.72 102.72 −0.031(1304.3) (93.96) (71.70) (0.038)
Percent has BA degree 1252.4⁎⁎⁎ 13.80 −14.38 0.007(373.7) (19.36) (14.95) (0.009)
Community fixed effects Yes Yes Yes YesTime period dummy Yes Yes Yes YesN 314 274 316 309Communities 157 137 158 155
2
418 K.R.E. Sims, J. Schuetz / Regional Science and Urban Economics 39 (2009) 409–421
residential development to wetlands areas. We construct variablesmeasuring the proportion of newly converted parcels that overlapwith wetlands (Table 6, column 5) or are within 100 feet of a wetland.
5. Results
5.1. Wetlands bylaws, land conversion and housing development
Regression results show that wetlands bylaws have slowed theconversion of open space to residential land, although the size of theeffect is relatively modest. Each additional year of having a wetlandsbylaw is associated with a 10.0–10.1 acre decrease in the amount ofopen space converted to residential land, controlling for communityand time fixed effects and a number of community-level character-istics (columns 1–2 of Table 4). This is approximately 2% of the averageacreage converted by communities in each 14 year period. Theseresults suggest a moderate impact of wetlands bylaws on the
Adj. R 0.890 0.753 0.530 0.686
⁎⁎⁎ pb .01 ⁎⁎ pb .05 ⁎ pb .10. Parentheses show robust standard errors.Levels variables (wetlands, land available for development, green vote, percent BA) aremeasured at the start of each period. Green vote is normalized to a standard normaldistribution.
Table 4Conversion to residential use and bylaws.
Dependentvariable:
Residential development (acres)
(1) (2) (3) (4) (5) (6)
Years bylaw −10.11⁎⁎ −10.05⁎⁎ −13.45⁎ −11.19⁎⁎ −5.19 −7.92⁎⁎(4.55) (4.52) (7.54) (4.64) (3.63) (3.52)
Wetlands 0.717 0.734 0.713 0.770 −0.068⁎⁎⁎ −0.073⁎⁎⁎(1.078) (1.070) (1.076) (1.076) (0.025) (0.025)
Land available −0.101 −0.101 −0.100 −0.100 0.033⁎⁎ 0.034⁎⁎⁎(0.075) (0.075) (0.076) (0.076) (0.013) (0.013)
Green vote −21.56 −20.57 −20.48 −21.34 −54.84⁎⁎⁎ −56.62⁎⁎⁎(21.61) (20.87) (20.94) (21.08) (19.72) (20.08)
Percent hasBA degree
−0.850 −1.26 −0.763 3.75⁎ 3.43(6.23) (6.35) (6.27) (2.24) (2.39)
Years bylaw ⁎
stringency0.381(0.700)
Years bylaw ⁎
wetlands0.002(0.003)
Distance toBoston
52.72⁎⁎⁎ 51.17⁎⁎⁎(9.64) (9.72)
Distance toBoston sq.
−1.072⁎⁎⁎ −1.045⁎⁎⁎(0.186) (0.190)
Distance tosatellite city
10.86 3.57(15.99) (2.79)
# Major routes −2.67 10.45(9.49) (16.32)
# Road exits 218.3⁎⁎ −1.08(90.8) (11.49)
Log total landarea
−12.29 177.5⁎(20.64) (98.53)
Commuter railstops
2.742 −17.87(2.70) (21.28)
Rep. townmeeting
−12.02 7.45(53.26) (56.97)
Council −60.82 −22.64(99.95) (100.59)
Cluster zoningindex
−10.31⁎⁎(4.57)
Communityfixed effects
Yes Yes Yes Yes No No
Time perioddummy
Yes Yes Yes Yes Yes Yes
Other landuse regs?
– – – – No Yes
N 316 316 316 316 287 287Communities 158 158 158 158 144 144Adj. R2 0.707 0.705 0.703 0.703 0.592 0.598
⁎⁎⁎ pb .01 ⁎⁎ pb .05 ⁎ pb .10. Parentheses show robust standard errors.Levels variables (wetlands, land available for development, green vote, percent BA) aremeasured at the start of each period. Green vote is normalized to a standard normaldistribution. The sample is the 158 communities (out of the 187 communities in theLocal Housing Regulation database) that had more than 50 acres of wetlands in 1971and reported the adoption date of wetlands bylaws. Additional demographic controls incolumns 5 and 6 are log of the population size, percent white, and percent kids.
conversion of land to residential uses. Taking into account the numberof years that community bylaws were in effect across the two timeperiods (for the 158 communities), this equals approximately 10,710acres protected, compared to 168,039 acres converted in thosecommunities (about 6% of the total).
Results of pooled specifications without community fixed effectsbut including direct measures of geographic characteristics and theregulatory environment are shown in columns 5–6 of Table 4. Theseconfirm the importance of controlling for the broader land-useregulatory framework, as the results are similar to the fixed effectsmodels but give a slightly more conservative estimate of a 7.9 acredecrease. Of the regulation measures added, the only significantdeterminant of decrease in residential land use is more generouscluster zoning regulations (Table 4, column 6). Cluster zoningprovisions allow higher density development in exchange for settingaside a portion of the land as protected open space. The change in thecoefficient on bylaws with the inclusion of this variable suggests thatcluster zoning may have been used by communities as a substituteform of regulation to protect open space.
We do not find statistically significant impacts of wetlands bylawson several measures of housing supply and density (Table 5): thechange in housing prices, the number of new permits issued, thechange in the overall number of housing units, or the average landconverted per new housing unit. If wetlands bylaws were constraininghousing supply, we would expect to see smaller numbers of permitsand new housing units, as well as perhaps greater density of newhousing or greater increases in housing prices. The coefficients onpermits, change in housing units and land converted per new unit allshow the expected signs (columns 2–4, respectively), but none arestatistically significant. The sign on change in housing prices(column 1) is unexpected but also not significant, and the size ofthe standard errors suggests that this is a very imprecise estimate. Thelack of significant results with respect to housing supplymay be partlya function of the large amounts of variation in the density of newhousing developed in communities with wetlands bylaws.25 Forinstance, between 1985 and 1999, Revere, MA added more than 2000housing units while converting 65 total acres of open space; Plympton,MA added less than 200 new housing units while losing 330 acres of
25 Correlation coefficient=0.328 for amount of land used for new residential housingvs. change in housing units.
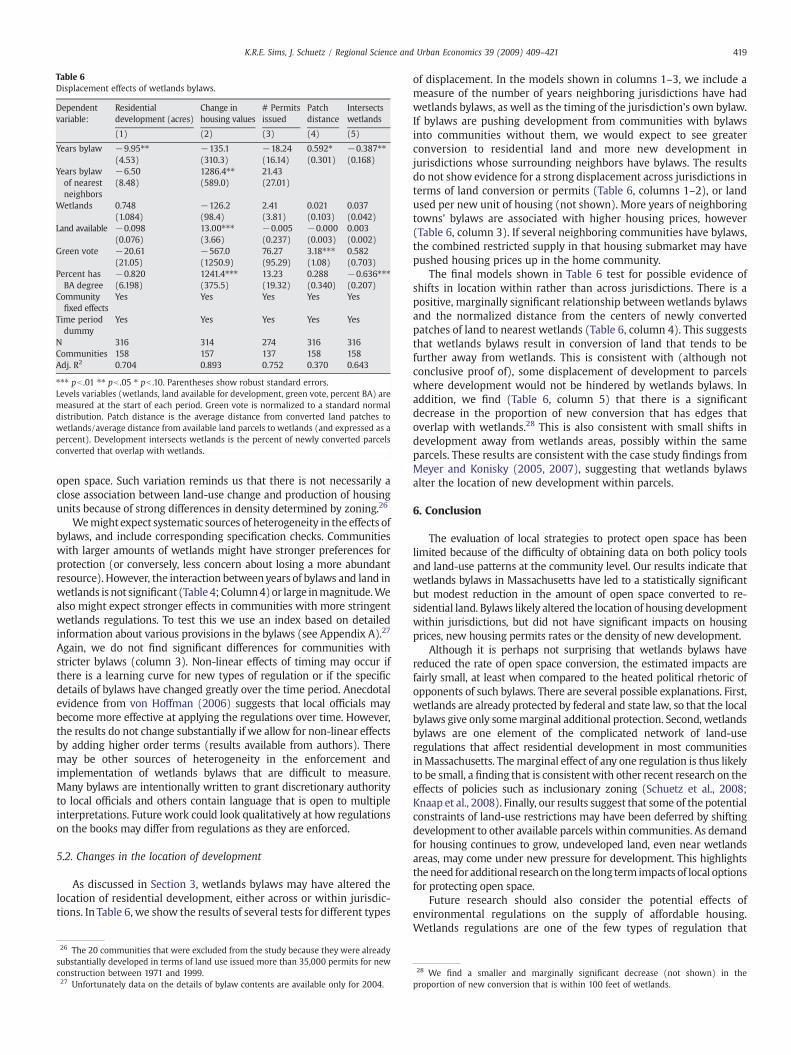
Table 6Displacement effects of wetlands bylaws.
Dependentvariable:
Residentialdevelopment (acres)
Change inhousing values
# Permitsissued
Patchdistance
Intersectswetlands
(1) (2) (3) (4) (5)
Years bylaw −9.95⁎⁎ −135.1 −18.24 0.592⁎ −0.387⁎⁎(4.53) (310.3) (16.14) (0.301) (0.168)
Years bylawof nearestneighbors
−6.50(8.48)
1286.4⁎⁎(589.0)
21.43(27.01)
Wetlands 0.748 −126.2 2.41 0.021 0.037(1.084) (98.4) (3.81) (0.103) (0.042)
Land available −0.098 13.00⁎⁎⁎ −0.005 −0.000 0.003(0.076) (3.66) (0.237) (0.003) (0.002)
Green vote −20.61 −567.0 76.27 3.18⁎⁎⁎ 0.582(21.05) (1250.9) (95.29) (1.08) (0.703)
Percent hasBA degree
−0.820 1241.4⁎⁎⁎ 13.23 0.288 −0.636⁎⁎⁎(6.198) (375.5) (19.32) (0.340) (0.207)
Communityfixed effects
Yes Yes Yes Yes Yes
Time perioddummy
Yes Yes Yes Yes Yes
N 316 314 274 316 316Communities 158 157 137 158 158Adj. R2 0.704 0.893 0.752 0.370 0.643
⁎⁎⁎ pb .01 ⁎⁎ pb .05 ⁎ pb .10. Parentheses show robust standard errors.Levels variables (wetlands, land available for development, green vote, percent BA) aremeasured at the start of each period. Green vote is normalized to a standard normaldistribution. Patch distance is the average distance from converted land patches towetlands/average distance from available land parcels to wetlands (and expressed as apercent). Development intersects wetlands is the percent of newly converted parcelsconverted that overlap with wetlands.
419K.R.E. Sims, J. Schuetz / Regional Science and Urban Economics 39 (2009) 409–421
open space. Such variation reminds us that there is not necessarily aclose association between land-use change and production of housingunits because of strong differences in density determined by zoning.26
Wemight expect systematic sources of heterogeneity in the effects ofbylaws, and include corresponding specification checks. Communitieswith larger amounts of wetlands might have stronger preferences forprotection (or conversely, less concern about losing a more abundantresource). However, the interaction betweenyears of bylaws and land inwetlands is not significant (Table4; Column4)or large inmagnitude.Wealso might expect stronger effects in communities with more stringentwetlands regulations. To test this we use an index based on detailedinformation about various provisions in the bylaws (see Appendix A).27
Again, we do not find significant differences for communities withstricter bylaws (column 3). Non-linear effects of timing may occur ifthere is a learning curve for new types of regulation or if the specificdetails of bylaws have changed greatly over the time period. Anecdotalevidence from von Hoffman (2006) suggests that local officials maybecome more effective at applying the regulations over time. However,the results do not change substantially if we allow for non-linear effectsby adding higher order terms (results available from authors). Theremay be other sources of heterogeneity in the enforcement andimplementation of wetlands bylaws that are difficult to measure.Many bylaws are intentionally written to grant discretionary authorityto local officials and others contain language that is open to multipleinterpretations. Future work could look qualitatively at how regulationson the books may differ from regulations as they are enforced.
5.2. Changes in the location of development
As discussed in Section 3, wetlands bylaws may have altered thelocation of residential development, either across or within jurisdic-tions. In Table 6, we show the results of several tests for different types
26 The 20 communities that were excluded from the study because they were alreadysubstantially developed in terms of land use issued more than 35,000 permits for newconstruction between 1971 and 1999.27 Unfortunately data on the details of bylaw contents are available only for 2004.
of displacement. In the models shown in columns 1–3, we include ameasure of the number of years neighboring jurisdictions have hadwetlands bylaws, as well as the timing of the jurisdiction's own bylaw.If bylaws are pushing development from communities with bylawsinto communities without them, we would expect to see greaterconversion to residential land and more new development injurisdictions whose surrounding neighbors have bylaws. The resultsdo not show evidence for a strong displacement across jurisdictions interms of land conversion or permits (Table 6, columns 1–2), or landused per new unit of housing (not shown). More years of neighboringtowns' bylaws are associated with higher housing prices, however(Table 6, column 3). If several neighboring communities have bylaws,the combined restricted supply in that housing submarket may havepushed housing prices up in the home community.
The final models shown in Table 6 test for possible evidence ofshifts in location within rather than across jurisdictions. There is apositive, marginally significant relationship betweenwetlands bylawsand the normalized distance from the centers of newly convertedpatches of land to nearest wetlands (Table 6, column 4). This suggeststhat wetlands bylaws result in conversion of land that tends to befurther away from wetlands. This is consistent with (although notconclusive proof of), some displacement of development to parcelswhere development would not be hindered by wetlands bylaws. Inaddition, we find (Table 6, column 5) that there is a significantdecrease in the proportion of new conversion that has edges thatoverlap with wetlands.28 This is also consistent with small shifts indevelopment away from wetlands areas, possibly within the sameparcels. These results are consistent with the case study findings fromMeyer and Konisky (2005, 2007), suggesting that wetlands bylawsalter the location of new development within parcels.
6. Conclusion
The evaluation of local strategies to protect open space has beenlimited because of the difficulty of obtaining data on both policy toolsand land-use patterns at the community level. Our results indicate thatwetlands bylaws in Massachusetts have led to a statistically significantbut modest reduction in the amount of open space converted to re-sidential land. Bylaws likely altered the location of housing developmentwithin jurisdictions, but did not have significant impacts on housingprices, new housing permits rates or the density of new development.
Although it is perhaps not surprising that wetlands bylaws havereduced the rate of open space conversion, the estimated impacts arefairly small, at least when compared to the heated political rhetoric ofopponents of such bylaws. There are several possible explanations. First,wetlands are already protected by federal and state law, so that the localbylaws give only somemarginal additional protection. Second, wetlandsbylaws are one element of the complicated network of land-useregulations that affect residential development in most communitiesinMassachusetts. Themarginal effect of any one regulation is thus likelyto be small, a finding that is consistentwith other recent research on theeffects of policies such as inclusionary zoning (Schuetz et al., 2008;Knaap et al., 2008). Finally, our results suggest that some of the potentialconstraints of land-use restrictions may have been deferred by shiftingdevelopment to other available parcels within communities. As demandfor housing continues to grow, undeveloped land, even near wetlandsareas, may come under new pressure for development. This highlightsthe need for additional research on the long term impacts of local optionsfor protecting open space.
Future research should also consider the potential effects ofenvironmental regulations on the supply of affordable housing.Wetlands regulations are one of the few types of regulation that
28 We find a smaller and marginally significant decrease (not shown) in theproportion of new conversion that is within 100 feet of wetlands.

420 K.R.E. Sims, J. Schuetz / Regional Science and Urban Economics 39 (2009) 409–421
cannot be bypassed or altered in the course of applying for permissionto develop affordable housing under the state's Chapter 40B law.Anecdotal evidence of early attempts to develop affordable housingunder 40B in several Suburban Boston communities indicate thatsome proposed developments were effectively blocked by environ-mental regulations, but systematic quantitative impacts are notknown.29
Our results also emphasize the potential divergence betweendevelopment as measured by the amount of land used for newhousing and development as measured by the production of newhousing units. Some communities with wetlands bylaws mayencourage building at high densities and preserve large parcels ofopen space with wetlands, while others force higher per-unit landconsumption by excluding wetlands from minimum lot size calcula-tions. Future research should work to understand the local processesand policies that determine these divergent density outcomes.
Finally, while limiting the ability to develop greenfields may meanhigher housing costs for new consumers, it also may increase therelative returns to redeveloping already dense urban areas. From anenvironmental perspective, redeveloping areas and building close toexisting infrastructure likely means net gains in environmentalbenefits. If there are clear gains from developing more densely insome areas while preserving contiguous areas of open space inanother, there may be scope for a tradable development rights systemthat would work across communities. Such policy solutions willdepend in part on increased future attention to how ecologicalbenefits varywith different patterns of housing (e.g. Lenth et al., 2006;Pejchar et al., 2007) across site and community level landscape scales.
Appendix A: Methodology for creating wetlands bylawstringency index
Communities have a number of different tools by which they canexpand the regulation of wetlands beyond protections offered by thestate law; the more tools used in a bylaw, the more restrictive thatbylawwill be. Thus to capture the overall stringency of each bylaw, wecreate an index that sums the number of components by which thebylaw exceeds state regulations. Results of principal componentsanalysis suggest that each component should be given roughly equalweight in this index, so for simplicity of interpretation we createdunweighted indices, standardizing individual variables (set to meanzero and variance one) before summing them. The index ranges fromzero to sixteen, with zero indicating the lowest possible level ofstringency.
WETINDEX = VERNAL + VERNWIDE + NEWBUFF + LSF + NOBUILD + DELAY
VERNAL is ameasure of local regulation of vernal pools. Values rangefrom 0 to 3, indicating the number of ways inwhich the bylaw expandsthe regulated jurisdiction around vernal pools beyond the state'sstandards: (1) listing vernal pools as a resource area, (2) regulating abuffer zone around vernal pools, or (3) defining the pool's “habitat” aspart of the resource area. VERNWIDE is the width (in feet) of bufferzones around vernal pools. NEWBUFF is a categorical variable increasingin stringency, indicating whether the bylaw regulates buffer zonesaround isolated vegetated wetlands. LSF is a measure counting thenumber of ways in which the bylaw expands regulation over landsubject to flooding: (1) adding terms to “land subject to flooding”; (2)extending a buffer zone around land subject to flooding; or (3)expanding the definition of land subject to flooding beyond state'sdefinition (i.e. shallower depth or smaller volume). NOBUILD is acontinuous variable indicating whether the jurisdiction creates “no
29 Case studies of some of the early 40B challenges are described in Haar and Iatridis(1974); a more recent summary of the interaction between 40B and wetlandsregulations is offered in Courchesne (2003).
building” or “no disturbance” zones that limits the type or amountdevelopmentactivitiesnearwetlands, and if so, thewidth (in feet) of theno-build zone. DELAY is a dummy variable that indicates whether thebylawgives theConservationCommission the right to delay certificationof wetlands during certain times of the year or weather conditions.
References
Altshuler, A.A., Gomez-Ibanez, J., 1993. Regulation for Revenue. Brookings Institution,Washington, DC.
Arnott, R., Petrova, P., 2006. The property tax as a tax on values: deadweight loss.International Tax and Public Finance 13 (2), 241–266.
Arnott, R.J., Braid, R.M., Davidson, R., Pines, D., 1999. A general equilibrium spatial modelof housing quantity and quality. Regional Science and Urban Economics 29,283–316.
Boston Globe, 1988. Brewster Voters Put Commission in Driver's Seat on Development.May 29.
Braid, R., 2001. Spatial growth and redevelopment with perfect foresight and durablehousing. Journal of Urban Economics 49 (3), 425–452.
Brown, S.C., Veneman, P.L.M., 2001. Effectiveness of compensatory wetlands mitigationin Massachusetts, USA. Wetlands 21 (4), 508–518.
Brueckner, J.,1990.Growth controls and landvalues inanopencity. LandEconomics 66 (3),237–248.
Brueckner, J., 1997. Infrastructure financing and urban development: the economics ofimpact fees. Journal of Public Economics 66 (3), 383–407.
Brueckner, J., 1980. A vintage model of urban growth. Journal of Urban Economics 8,389–402.
Capozza, D., Helsley, R., 1989. The fundamentals of land prices and urban growth.Journal of Urban Economics 26, 295–306.
Carrión-Flores, C., Irwin, E.G., 2004. Determinants of residential land use conversionand sprawl at the rural–urban fringe. American Journal of Agricultural Economics86 (4), 889–904.
Cho, S., Wu, J., Boggess, W.G., 2003. Measuring interactions among urbanization, land useregulations, and public finance. American Journal of Agricultural Economics 85 (4),988–999.
Courchesne, C., 2003. What regional agenda? Reconciling Massachusetts's affordablehousing law and environmental protection. Harvard Environmental Law Review 28,215–247.
Dain, A., 2006. Residential Land Use Regulation in Eastern Massachusetts: A Study of187 Communities. Pioneer Institute for Public Policy/Rappaport Institute forGreater Boston Working Paper, Boston, MA.
Doss, C.R., Taff, S.J., 1996. The influence of wetland type and wetlands proximity onresidential property values. Journal of Agricultural and Resource Economics 21 (1),120–129.
Feiock, R.C., 2004. Politics, institutions, & local land-use regulation. Urban Studies 41(2), 363–375.
Fiorina, M.P., 1999. Extreme voices: the dark side of civic engagement. In: Skocpol,T., Fiorina, M.P. (Eds.), Civic Engagement in American Democracy. BrookingsInstitution Press, Washington, DC.
Fischel, W.A., 1985. The Economics of Zoning Laws: A Property Rights Approach toAmerican Land Use Controls. Johns Hopkins University Press, Baltimore, MD.
Fischel, W.A., 1990. Do Growth Controls Matter? A Review of the Empirical Evidence onthe Effectiveness and Efficiency of Local Government Land Use Regulation. LincolnInstitute of Land Policy, Cambridge, MA.
Fujita, M., 1982. Spatial patterns of residential development. Journal of UrbanEconomics 12, 22–52.
Garwood, A.N., 1986. Massachusetts Municipal Profiles 1986–1987. InformationPublications, Wellesley Hills, MA.
Glaeser, E., Gyourko, J., 2002. The Impact of Zoning on Housing Affordability. NBERWorking Paper No. W8835, Cambridge, MA.
Glaeser, E., Gyourko, J., 2005. Urban decline and durable housing. Journal of PoliticalEconomy 113 (2), 345–375.
Glaeser, E., Ward, B., 2006. The Causes and Consequences of Land Use Regulation:Evidence from Greater Boston. NBER Working Paper W12601, Cambridge, MA.
Glaeser, E., Schuetz, J., Ward, B., 2006. Regulation and the Rise of Housing Prices in GreaterBoston. Rappaport Institute for Greater Boston Working Paper, Cambridge, MA.
Green, R.K., 1999. Land use regulation and the price of housing in a suburbanWisconsinCounty. Journal of Housing Economics 8 (2), 144–159.
Green, R.K., Malpezzi, S., Mayo, S.K., 2005. Metropolitan-specific estimates of the priceelasticity of supply of housing, and their sources. American Economic Review 95 (2),334–339.
Haar, C., Iatridis, D.S., 1974. Housing the Poor in Suburbia. Ballinger Publications,Cambridge, MA.
Hardie, I., Parks, P., Gottlieb, P., Wear, D., 2000. Responsiveness of rural and urban landuses to land rent determinants in the US South. Land Economics 76 (4), 659–673.
Hart, J., 1990. Alleged wetlands violations spur action in Tewksbury. The Boston Globe.May 6.
Hart, J., 1991. Tewksbury under scrutiny. The Boston Globe. January 27.Irwin, E.G., Bockstael, N.E., 2002. Interacting agents, spatial externalities and the
evolution of residential land. Journal of Economic Geography 2 (1), 31–54.Irwin, E.G., Bockstael, N.E., 2004. Land use externalities, open space preservation, and
urban sprawl. Regional Science and Urban Economics 34 (6), 705–725.Kline, J.D., Alig, R., 1999. Does land use planning slow the conversion of forest and farm
lands? Growth and Change 30, 3–22.

421K.R.E. Sims, J. Schuetz / Regional Science and Urban Economics 39 (2009) 409–421
Knaap, G., Bento, A., Lowe, S., 2008. Housing Market Impacts of Inclusionary Zoning.National Center for Smart Growth Research and Education, University of Maryland,College Park MD.
Kolankiewicz, L., Beck, R., 2001. Weighing Sprawl Factors in Large U.S. Cities. Arlington,VA. http://sprawlcity.org.
Landis, J.D., Deng, L., Reilly, M., 2002. Growth management revisited: a reassessment ofits efficacy, price effects, and impacts onmetropolitan growthpatterns. University ofCalifornia, Working Paper No. 2002–02. Institute of Urban & Regional Development,Berkeley, CA.
Lenth, B.A., Knight, R.L., Gilgert, W.C., 2006. Conservation value of clustered housingdevelopments. Conservation Biology 20 (5), 1445–1456.
Levine, N.,1999. The Effects of local growth controls on regional housing production andpopulation redistribution in California. Urban Studies 36 (12), 2047–2068.
Lichtenberg, E., Tra, C., Hardie, I., 2007. Land use regulation and the provision of openspace in suburban residential subdivisions. Journal of Environmental Economicsand Management 54 (2), 199–213.
Lubowski, R.N., Plantinga, A.J., Stavins, R.N., 2008. What drives land use change in theUnited States? A national analysis of landowner decisions. Land Economics 84,529–550.
Mahan, B.L., Polasky, S., Adams, R.M., 2000. Valuing urban wetlands: a property priceapproach. Land Economics 76 (1), 100–113.
Malpezzi, S., 1996. Housing prices, externalities, and regulations in U.S. MetropolitanAreas. Journal of Housing Research 7 (2), 209–241.
Malpezzi, S., Green, R.K., 1996. What has happened to the bottom of the US housingmarket? Urban Studies 33 (10), 1807–1820.
Massachusetts Association of Conservation Commissions, 2002. Our Model Bylaws forWetlands Law, Science, and Policy. http://www.maccweb.org/resources_bylaws.html.
Massachusetts Department of Housing and Community Development, 2004. Commu-nity Profiles. http://www.mass.gov/dhcd/.
Massachusetts Geographic Information System. Executive Office of EnvironmentalAffairs. http://www.mass.gov/mgis/laylist.htm.
Massachusetts Home Builders Association, 2004. Statistics Show Limited Growth inMassachusetts Housing Starts. Updated, June 25. Available at: http://www.hbama.com/content/page.php?id=58&st=Building_Issues.
Mayer, C.J., Somerville, C.T., 2000. Land use regulation and new construction. RegionalScience and Urban Economics 30 (6), 639–662.
McConnell, V., Walls, M., Kopits, E., 2006. Zoning, tdrs, and the density of development.Journal of Urban Economics 59, 440–457.
McDonald, John F., McMillen, Daniel P., 2004. Determinants of suburban developmentcontrols: a Fischel expedition. Urban Studies 41 (2), 341–361.
McFarlane, A., 2003. Rent stabilization and the long-run supply of housing. RegionalScience and Urban Economics 33 (3), 305–333.
McGrath, D., 2000. Urban industrial land redevelopment and contamination risk.Journal of Urban Economics 47 (3), 414–442.
McMillen, D.P.,1989. An empirical model of urban fringe land use. Land Economics 65 (2),138–145.
Meltzer, R., Schuetz, J., 2008. The most popular kid in the class: diffusion of inclusionaryzoning across San Francisco Bay area governments. New York University, FurmanCenter for Real Estate and Urban Policy, Working Paper.
Meyer, S.M., Konisky, D.M., 2005. Community-Based Environmental Protection: A StatusReport and Some New Evidence. Dept. of Political Science, MIT, Cambridge, MA.
Meyer, S.M., Konisky, D.M., 2007. Local institutions and environmental outcomes: evidencefromwetlands protection in Massachusetts. Policy Studies Journal 35 (3), 481–502.
Miller, D.J., Plantinga, A.J., 1999. Modeling land use decisions with aggregate data.American Journal of Agricultural Economics 81 (1), 180–194.
Parks, P.J., Murray, B.C., 1994. Land attributes and land allocation: nonindustrial forestuse in the Pacific Northwest. Forest Science 40 (3), 558–575.
Parks, P.J., Schorr, J.P., 1997. Sustaining open space benefits in the Northeast: an evaluationof the Conservation Reserve Program. Journal of Environmental Economics andManagement 32, 85–94.
Pejchar, L., Morgan, P.M., Caldwell, M.R., Palmer, C., Daily, G.C., 2007. Evaluating thepotential for conservation development: biophysical, economic, and institutionalperspectives. Conservation Biology 21 (1), 69–78.
Pioneer Institute for Public Policy and Rappaport Institute for Great Boston, 2005. LocalHousing Regulation Database. Prepared by A. Dain and J. Schuetz. Located at:http://www.masshousingregulations.com/.
Pollakowski, H.O., Wachter, S.M., 1990. The effects of land use constraints on housingprices. Land Economics 66 (3), 315–324.
Quigley, J.M., Raphael, S., 2005. Regulation and the high cost of housing in California.American Economic Review 95 (2), 323–328.
Roberts, M.J., Lubowski, R.N., 2007. Enduring impacts of land retirement policies:evidence from the Conservation Reserve Program. Land Economics 83 (4), 516–538.
Rosen, K.T., Katz, L.F., 1981. Growth management and land use controls: the SanFrancisco Bay area experience. Real Estate Economics 9 (4), 321–344.
Rosenthal, S., Helsley, R.W., 1994. Redevelopment and the urban land price gradient.Journal of Urban Economics 35, 182–200.
Schuetz, J., 2008a. Guarding the town walls: motives and mechanisms for restrictingmultifamily housing in Massachusetts. Real Estate Economics 36 (3), 555–586.
Schuetz, J., 2008b. No Renters in My Suburban Backyard: Land Use Regulation and theRental Housing Market in Massachusetts. Furman Center for Real Estate and UrbanPolicy, New York University, New York.
Schuetz, J., Meltzer, R., Been, V., 2008. Silver Dagger or Trojan Horse? The effects ofinclusionary zoning on local housing markets. Furman Center for Real Estate andUrban Policy, New York University, New York.
Secretary of the Commonwealth of Massachusetts, 1972. Election Statistics. Boston, MA.Secretary of the Commonwealth of Massachusetts, 1982. Election Statistics. Boston, MA.Stavins, R.N., Jaffe, A.B., 1990. Unintended impacts of public investments on private
decisions: the depletion of forested wetlands. American Economic Review 80 (3),337–352.
Turnbull, G., 1988. Residential development in an open city. Regional Science and UrbanEconomics 18, 307–320.
von Hoffman, A., 2006. Creating an Anti-Growth Regulatory Regime: A Case fromGreater Boston. Rappaport Institute for Greater Boston, Cambridge, MA.
Wheaton, W., 1982a. Urban residential growth under perfect foresight. Journal of UrbanEconomics 12 (1), 1–21.
Wheaton, W., 1982b. Urban spatial development with durable but replaceable capital.Journal of Urban Economics 12, 53–67.
Wu, J., Plantinga, A.J., 2003. The influence of public open space on urban spatialstructure. Journal of Environmental Economics and Management 46 (2), 288–309.
U.S. Census Bureau, 1970, 1980, 1990, 2000. Decennial Census of Population and Housing.U.S. Census Bureau. New Residential Construction Index. http://www.census.gov/
const/www/newresconstindex.html.