local preferences and place of death in regions … · local preferences and place of death in ......
TRANSCRIPT
Local preferences and place of death in regions within England 2010
Barbara Gomes, Natalia Calanzani, Irene J HigginsonAugust 2011
Cicely Saunders International was established in 2002 in the name of Dame Cicely Saunders, a foundertrustee and its President. Dame Cicely is widely acknowledged as the founder of the modern hospicemovement and is credited with "mentoring some of the great world leaders in this field" (ProfessorEduardo Bruera).The mission of Cicely Saunders International is to promote research to improve thecare and treatment of all patients with progressive illness and to make high-quality palliative careavailable to everyone who needs it.There is no other charity specifically concerned with carrying outwork to identify and promote best practice in palliative care. www.cicelysaundersinternational.org
Comments about this report should be addressed to Barbara Gomes at Cicely Saunders Institute,Bessemer Road, London SE5 9PJ ([email protected]), and copied to the National End of LifeCare Intelligence Network at [email protected].
Foreword
This report, published a few days ahead of the End of Life Care Strategy Third Annual Report, representsan important step in improved national intelligence about end of life care across England. It provides us –health care professionals, care managers, policy makers and politicians – with the most updatedinformation aimed at understanding people’s choice on place of death when approaching the end of life.Each year about 460,000 people die in England.
The research team from Cicely Saunders International has been conducting pioneering work on place ofdeath since the very beginnings of this charity, in 2002, when it was founded by Dame Cicely. Reviewedby an international scientific panel of experts, which I am honoured to be part of, the research outputsstrive to make a substantial contribution, with rigour and quality.This report is no exception.
Those of us working in palliative care know how important it can be for patients to spend their last dayswhere they want to, often at home with their families. For many people their second choice would be toend their days in a hospice, yet there is still a long way to go until the majority in society live the closingdays of their life and die where they wish to.The report provides data on which national and localpolicies and services can build – showing variations within the country, unveiling the preferences ofdifferent groups in our society, quantifying the gap between preferences and reality for place of death.Sensible recommendations are drawn from the data. As a result, I am confident that real improvementsin care will follow to support people through better care wherever they want to be at the end of life,now and for generations to come.
Baroness Finlay of LlandaffProfessor of Palliative Medicine FRCP FRCGP Member of the Cicely Saunders International Scientific Expert Panel
National end of life careINTELLIGENCE NETWORK
4 Local preferences and place of death in regions within England 2010
Contents Page
Executive summary 5
1 Introduction 6
2 Methodological notes 72.1. Death registration data 72.2. PRISMA survey of preferences 72.3. PRISMA sample in England 8
3 Importance of dying in the preferred place 10
4 Preferences for place of death 114.1. Most preferred place of death 114.2. Least preferred place of death 14
5 Actual place of death 15
6 Limitations and discussion 186.1. Preferences for home and hospices 186.2. Care homes and hospitals 196.3. Older people 20
7 Recommendations 21
8 References 22
Acknowledgements 23
Local preferences and place of death in regions within England 2010 5
This report shows publicpreferences for place of death inthe nine English GovernmentOffice Regions (GORs), obtainedfrom a population-basedtelephone survey in 2010. Itcompares the results with asimilar survey carried out in 2003to understand how preferencesare evolving over time. It goes onto contrast these preferences withactual place of death (as reportedfor that region) in order to shedlight on how people’s wishesrelate to reality and to aid careplanning so that preferences aremore frequently met.
Priorities for end of life careThe proportion for whom dying inthe preferred place was either thefirst or the second mostimportant care-related prioritywas lowest in London (55%) andhighest in the North East (75%).
Most and least preferredplaces of deathThe majority of participants in allregions said that they would preferto die at home if circumstancesallowed, ranging from 60% in WestMidlands to 67% in the North East.Hospice was the second mostfrequent choice, especially in theSouth East and the East of England(where about a third of participantschose this). Home and hospicestogether accounted for thepreferences of at least 89% ofparticipants in every region. As ageincreased, a preference to die athome decreased while a preferenceto die in a hospice increased(except for the group aged 55-64).Preferences for home death rangedfrom 45% (for those aged 75+) to75% (for those aged 25-34).
When compared with 2003data, a preference to die at homehas increased in most regions(except in the West Midlands and
the South East).This increase from2003 to 2010 was largest inLondon (49% to 63%) and theNorth East (55% to 67%) and wasevident across all age groups,except the oldest (65+). Apreference for hospice death hasalso increased, except in theNorth East.This increase waslargest in the East of England(rising from 15% in 2003 to 32% in2010) but there were considerableage variations since a hospicepreference decreased amongst theyounger sector of the populationand increased amongst the oldestsector over these years (exceptfor the 55-64 group).
Hospital was the leastpreferred place of death in allregions except for the North East,where 34% reported care homeas their least preferred place(against 31% for hospital).
Quantifying gaps betweenpreferences and actual deathsComparisons of survey data onpreferences with contemporaryofficial statistics on place of deathsuggest that most people are stilllikely to see their preferencesunmet regardless of where theylive.The majority of deaths in 2010took place in hospitals (53%) andonly 21% died at home. Acrossthe country, there is a major gapbetween the proportion whoprefer to die at home and theproportion of actual home deaths– this gap is smaller in the WestMidlands (39%) and larger in theNorth East (46%), but remainswide whichever area is reviewed.The gap between the proportionwho prefer to die in a hospiceand the proportion of actualhospice deaths is smallest in theNorth West (20%) and largest inthe East of England (27%). Forthose aged 75+, there is a largegap between a preference to die
in a hospice (41%) and hospicedeaths (3%).This age groupaccounts for 67% of all deaths inthe country in 2010.
Addressing gaps betweenpreferences and realityIt is crucial to address these gapsbetween preferences and reality.Maximum impact is derived fromfocusing future investment andservice developments in extendingand improving care at home and inhospices.This supports thepreferences of the large majority ofthe population. It requiresincreased collaborations betweenNHS and non-NHS institutionssuch as independent, voluntary andsocial care organisations. Servicessuch as Hospital at Home, forexample, expand the provision ofpalliative care into home settingsand have been found to significantlyincrease people’s chances of dyingat home.
It is also imperative tounderstand people’s views of carein hospitals and care homes, todefine quality standards for endof life care and ensure these arefollowed, since the majority stilldie in hospitals and more may diein care homes in the context ofan ageing population. Preventingunnecessary hospital admissionswhile delivering better care athome should, however, remainthe priority.
The oldest population (75+)deserves special attention.Greater access to hospice bedsneeds to be ensured since thisgroup has the highest hospicepreference, yet the lowest chanceof hospice death than any otheradult age group. Policies andbenefits should also be consideredto enable more older people todie at home as this is still themost frequent preference amongstthe aged 75+. n
Executive summary
6 Local preferences and place of death in regions within England 2010
The National Health Service(NHS) End of Life CareProgramme (established in 2004)and the End of Life Care Strategy(published in 2008) (1) have beenworking to increase the number ofhome deaths based on availableevidence that most people preferto die at home, but also guided bythe idea that a “good death” isabout being respected, dying withdignity and as comfortable aspossible, no matter who one is,where one lives and irrespective ofcare setting.
A previous report from theNational End of Life CareIntelligence Network showed thatin 2005-2007 most people inEngland died in hospital buthighlighted some regionalvariations in place of death –hospital deaths ranged from 54% inthe South West to 66% in London(2). More investigation was neededto examine whether thesevariations reflected differences inpreferences for where to die.
From a financial point of view, it isnot possible to keep the same highnumbers of deaths occurring inhospitals. Moreover, mortalityprojections from the Office forNational Statistics (ONS)predicted a dramatic rise of totalnumbers of deaths from 2012-16onwards (3). Projections for placeof death alerted for theimplications of past trendscontinuing, and the need to planahead for increasing numbers ofpeople in need of end of life care,particularly in older ages (4).
In 2008, two-thirds of deathsoccurred at ages of 75 and over,and it is known that in Englandpeople dying in this age group havefewer chances to die at home (5-6).It is unclear whether this is theresult of complex clinical and socialcircumstances associated witholder age or of differentpreferences amongst older people.Care commissioners are thereforeleft with the decision of how muchto invest in home care for older
people at the end of life and in carein alternative settings, in particularcare homes. In order to guide careplanning, it is necessary tounderstand the preferences ofdifferent age groups and how thesevary within England.
Population-based studies onpreferences for place of death arescarce in England (7). In 2003, astudy conducted by CicelySaunders International andpublished by the National Councilfor Palliative Care surveyed 1000adults (in England, Scotland andWales) on where they would liketo be cared for if they were dying.The study found the majoritypreferred home (56%), followed byhospice (24%), but there weregeographical variations (8). Thestudy also found age differences,with a preference for home fallingwith increased age although smallnumbers of participants within theage group of 65+ precludedfurther analysis.
The present report buildsupon this previous work; itdescribes people’s preferencesfor place of death in Englandobtained as part of a cross-national survey in Europeconducted in 2010 (9). It alsocontrasts people’s wishes withwhere deaths take place in theirregion. Furthermore, it comparesthe preferences in 2010 with thosefrom the 2003 survey.Geographical and age variationsare examined. Implications forcare, limitations of the study andrecommendations are discussed.n
Introduction
SECTION 1
Local preferences and place of death in regions within England 2010 7
2.1 Death registration data ____________________________
The mortality data presented inthis report on numbers of deathsby GORs and place of deathinformation are provided inaggregated tables by the ONS(10).These statistics derive fromdeath registration records.Wereport provisional data to thosepublished in the autumn 2011 onall deaths registered in England in2010.This was kindly provided bythe ONS Mortality Statistics team.The nine English GORs are theNorth East, the North West,Yorkshire & the Humber, EastMidlands,West Midlands, East ofEngland, London, the South East,and the South West.
For the purposes of clarity andcomparison with survey data, wereport place of death in four ONSrecently re-designed categories (10):1) home; 2) hospice (includingNHS and non-NHS); 3) hospital(including NHS and non-NHS); and4) care homes (including localauthority and non-local authority).Note that some of these new ONScategories are not directlycomparable to categories used inprevious years (e.g. many carehomes were previously coded as“hospitals and other communalestablishments for care of the sick”together with hospitals, but arenow coded into a separatecategory).We do not report thenumbers and percentages of deathstaking place in “other communalestablishments” (which include“aged persons’ accommodation”and other communal facilities suchas “assessment centres”,“schools”and “prisons”) and ”elsewhere”.However, we took all ONScategories into account whencalculating the proportions ofdeaths in the four places examined.
2.2 PRISMA survey of preferences ____________________________
The data on preferences for placeof death derive from the PRISMAsurvey - conducted in 2010 byKing’s College London inpartnership with 11 partnerorganisations.The work was fundedby the European Commission underthe Seventh Framework Programme(FP7) as part of the PRISMAproject.This was a three-yearintegrated programme (2008-2011)to coordinate research prioritiesand practice about end of life careacross Europe and Africa (9).
The questionnaire wasadministered on the telephone to9,344 participants (aged ≥16)randomly selected in sevenEuropean countries, includingEngland. Other regions wereFlanders, Germany, Italy, theNetherlands, Portugal and Spain.The survey included only privatehouseholds (this excludedcommunal establishments such ashospitals and care homes).Thequestionnaire included questionson the importance attached todying in the preferred placecompared to other two care-related aspects on information anddecision-making (Box 1).
Methodological notes
SECTION 2
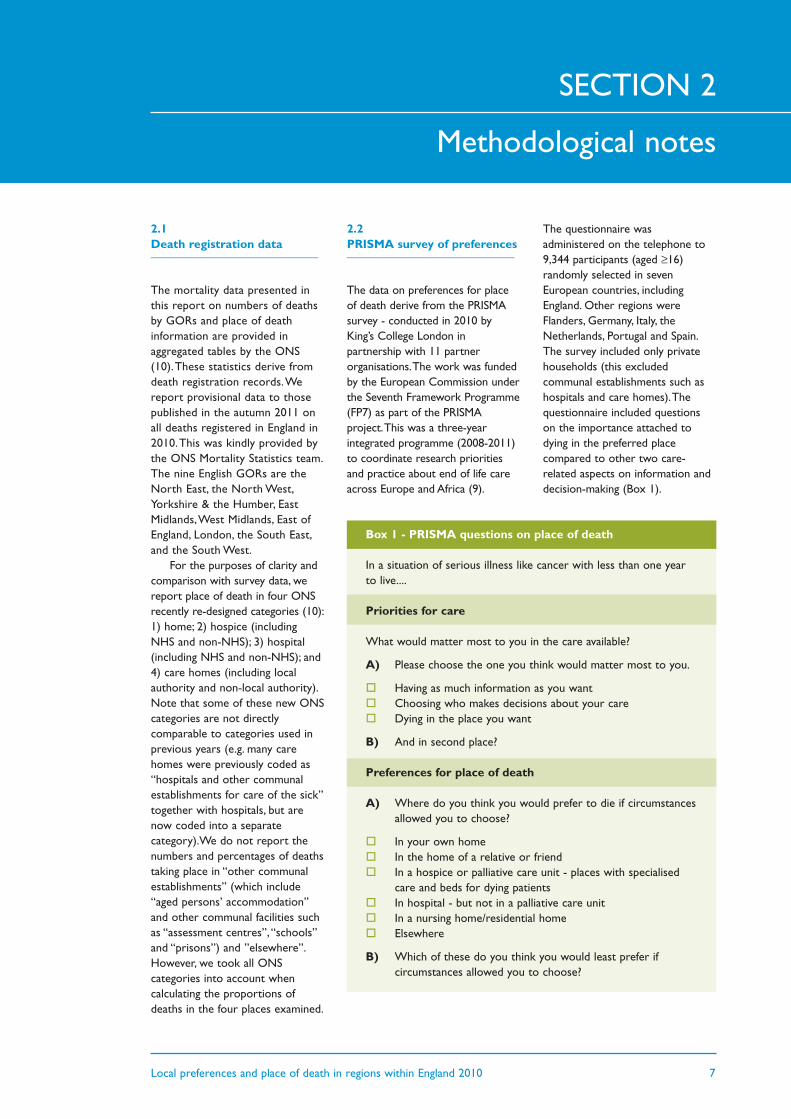
Box 1 - PRISMA questions on place of death
In a situation of serious illness like cancer with less than one yearto live....
Priorities for care
What would matter most to you in the care available?
A) Please choose the one you think would matter most to you.
o Having as much information as you want o Choosing who makes decisions about your care o Dying in the place you want
B) And in second place?
Preferences for place of death
A) Where do you think you would prefer to die if circumstances allowed you to choose?
o In your own homeo In the home of a relative or friendo In a hospice or palliative care unit - places with specialised
care and beds for dying patientso In hospital - but not in a palliative care unito In a nursing home/residential home o Elsewhere
B) Which of these do you think you would least prefer if circumstances allowed you to choose?
8 Local preferences and place of death in regions within England 2010
North WestParticipants = 161
Deaths = 67,738
South WestParticipants = 165
Deaths = 52,149
West MidlandsParticipants = 133
Deaths = 50,379
North EastParticipants = 70Deaths = 25,825
South EastParticipants = 254Deaths = 75,156
LondonParticipants = 160Deaths = 48,297
Yorkshire & the HumberParticipants = 125Deaths = 48,726
East MidlandsParticipants = 106Deaths = 40,970
East of EnglandParticipants = 157Deaths = 51,776
Participants were also asked wherethey would most and least preferto die if they had a serious illnessand less than one year to live. Inthe present report, we abbreviatethe categories “hospice or palliativecare unit” to hospice and “nursing/residential home” to care home.
We compare PRISMA data onpreferences for home death byGOR and age group to the findingsfrom the 2003 survey for England(8).There are three methodologicaldifferences: 2003 data areweighted, questions related to place
of end of life care rather than placeof death and the available optionswere home, hospice, hospital,nursing/ residential home andother/don’t know. In addition, theage group 65+ was further brokendown into 65-74 and 75+ in 2010.We contrast people’s preferenceswith actual place of death in theirregion in 2010 to see the extent ofthe gap in the different regions andage groups. Quotes regarding placeof death included in the reportwere provided by participants inthe PRISMA survey.
2.3 PRISMA sample in England ____________________________
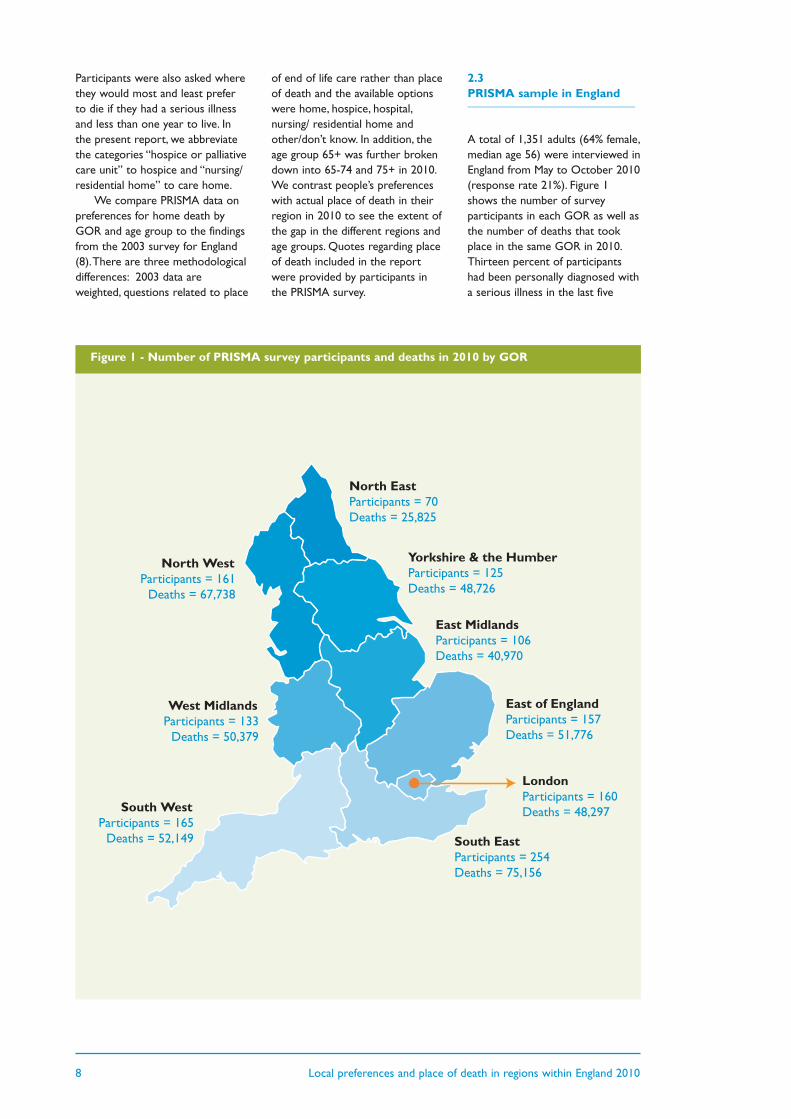
A total of 1,351 adults (64% female,median age 56) were interviewed inEngland from May to October 2010(response rate 21%). Figure 1shows the number of surveyparticipants in each GOR as well asthe number of deaths that tookplace in the same GOR in 2010.Thirteen percent of participantshad been personally diagnosed witha serious illness in the last five
Figure 1 - Number of PRISMA survey participants and deaths in 2010 by GOR
Local preferences and place of death in regions within England 2010 9
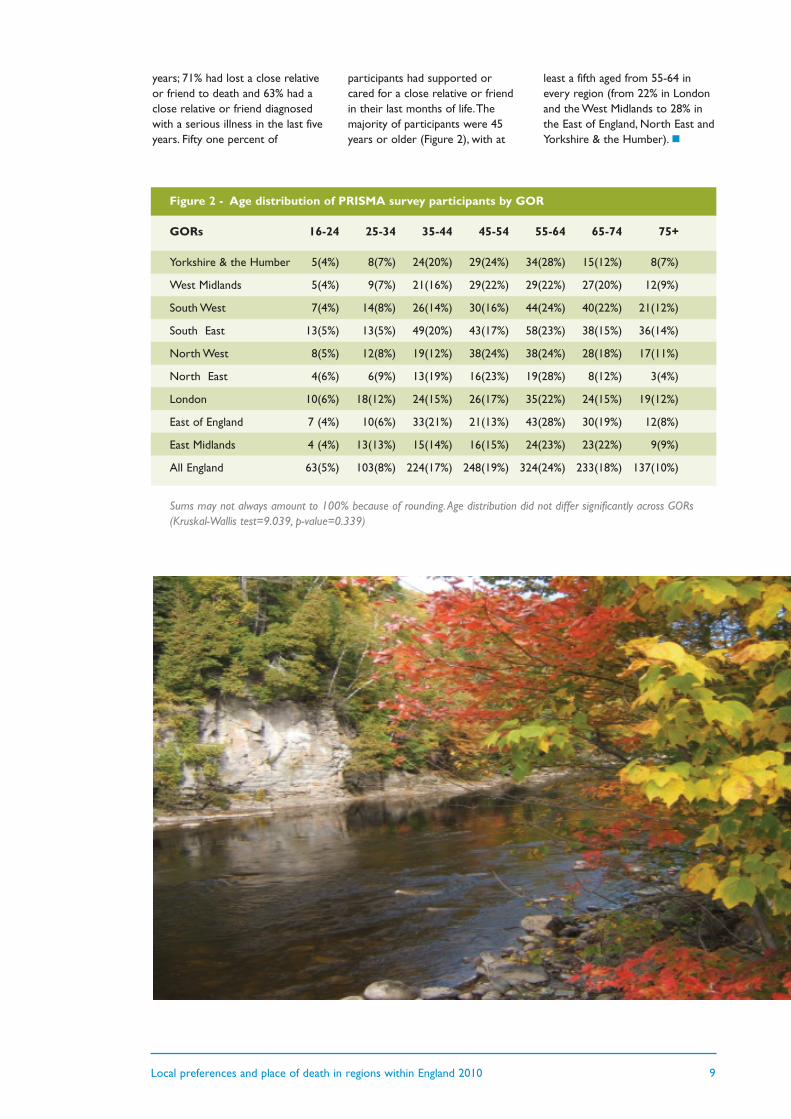
Figure 2 - Age distribution of PRISMA survey participants by GOR
GORs 16-24 25-34 35-44 45-54 55-64 65-74 75+
Yorkshire & the Humber 5(4%) 8(7%) 24(20%) 29(24%) 34(28%) 15(12%) 8(7%)
West Midlands 5(4%) 9(7%) 21(16%) 29(22%) 29(22%) 27(20%) 12(9%)
South West 7(4%) 14(8%) 26(14%) 30(16%) 44(24%) 40(22%) 21(12%)
South East 13(5%) 13(5%) 49(20%) 43(17%) 58(23%) 38(15%) 36(14%)
North West 8(5%) 12(8%) 19(12%) 38(24%) 38(24%) 28(18%) 17(11%)
North East 4(6%) 6(9%) 13(19%) 16(23%) 19(28%) 8(12%) 3(4%)
London 10(6%) 18(12%) 24(15%) 26(17%) 35(22%) 24(15%) 19(12%)
East of England 7 (4%) 10(6%) 33(21%) 21(13%) 43(28%) 30(19%) 12(8%)
East Midlands 4 (4%) 13(13%) 15(14%) 16(15%) 24(23%) 23(22%) 9(9%)
All England 63(5%) 103(8%) 224(17%) 248(19%) 324(24%) 233(18%) 137(10%)
Sums may not always amount to 100% because of rounding. Age distribution did not differ significantly across GORs(Kruskal-Wallis test=9.039, p-value=0.339)
years; 71% had lost a close relativeor friend to death and 63% had aclose relative or friend diagnosedwith a serious illness in the last fiveyears. Fifty one percent of
participants had supported orcared for a close relative or friendin their last months of life.Themajority of participants were 45years or older (Figure 2), with at
least a fifth aged from 55-64 inevery region (from 22% in Londonand the West Midlands to 28% inthe East of England, North East andYorkshire & the Humber).n
10 Local preferences and place of death in regions within England 2010
34%
37%
38%
31%
43%
36%
29%
33%
32%
36%
30%
34%
27%
24%
32%
35%
30%
32%
27%
33%
36%
28%
36%
45%
25%
29%
41%
34%
40%
32%
0% 20% 40% 60% 80% 100%
All England
East Midlands
East of England
London
North East
North West
South East
South West
West Midlands
Yorkshire & the Humber
First most important prioritySecond most important priorityThird most important priority
“In an ideal world wewould like to die in ourbed surrounded by ourfamily. To achieve thiswe need specific care”67 years old, female resident inthe East of England
“I believe that peopleshould be able to diewhere they want, interms of location”42 years old, female resident inthe North West
“I think it's very goodthat there is anopportunity to discusshow we want to die.Hopefully we will beable to choose”58 years old, female resident inthe East Midlands
Importance of dying in the preferred place
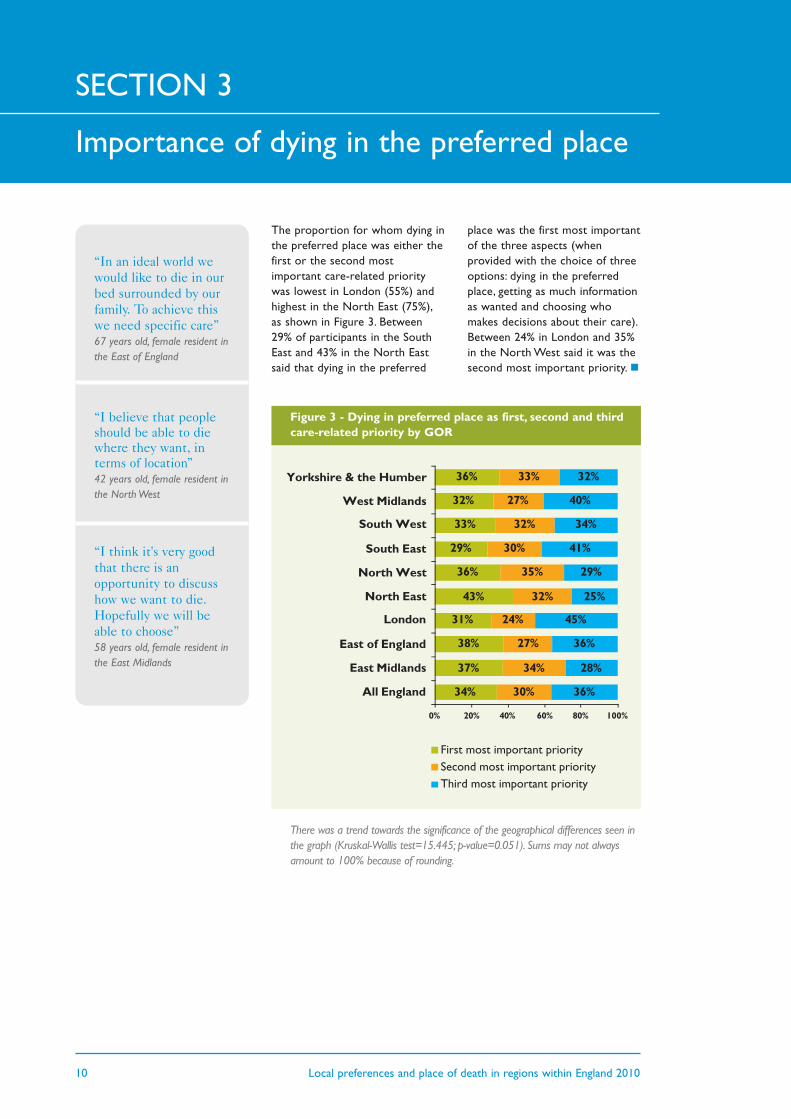
Figure 3 - Dying in preferred place as first, second and thirdcare-related priority by GOR
There was a trend towards the significance of the geographical differences seen inthe graph (Kruskal-Wallis test=15.445; p-value=0.051). Sums may not alwaysamount to 100% because of rounding.
The proportion for whom dying inthe preferred place was either thefirst or the second mostimportant care-related prioritywas lowest in London (55%) andhighest in the North East (75%),as shown in Figure 3. Between29% of participants in the SouthEast and 43% in the North Eastsaid that dying in the preferred
place was the first most importantof the three aspects (whenprovided with the choice of threeoptions: dying in the preferredplace, getting as much informationas wanted and choosing whomakes decisions about their care).Between 24% in London and 35%in the North West said it was thesecond most important priority.n
SECTION 3
Local preferences and place of death in regions within England 2010 11
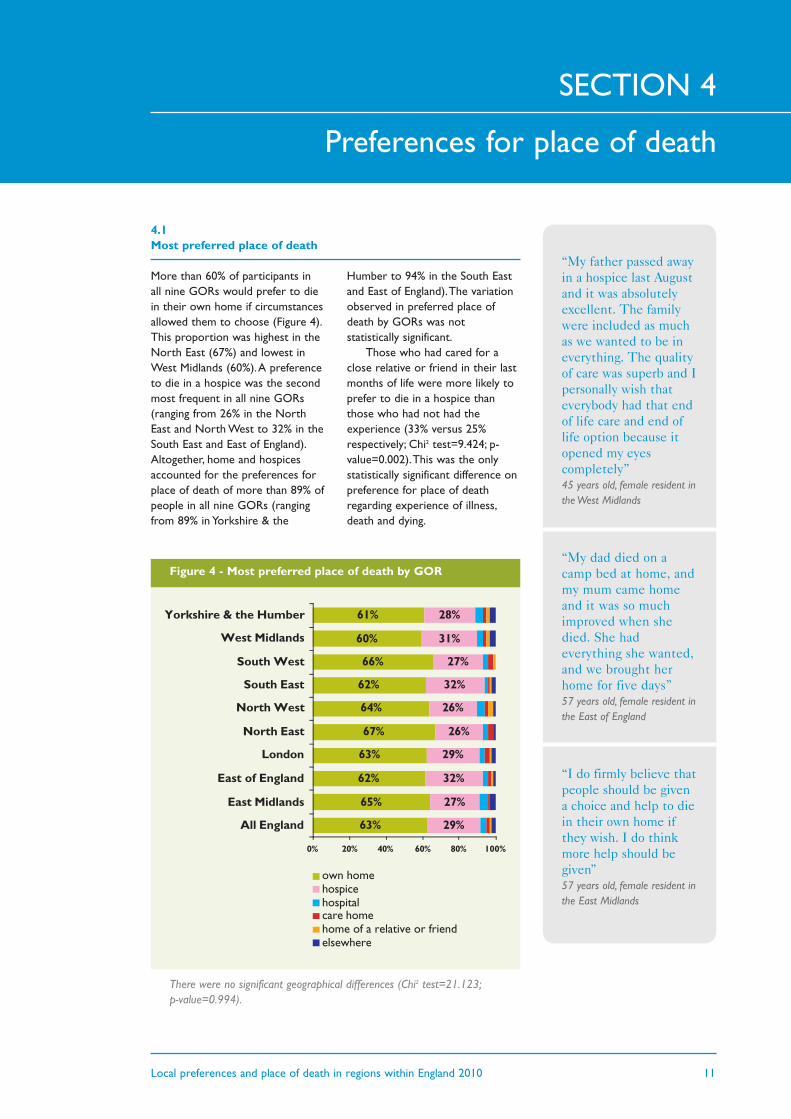
4.1 Most preferred place of death
More than 60% of participants inall nine GORs would prefer to diein their own home if circumstancesallowed them to choose (Figure 4).This proportion was highest in theNorth East (67%) and lowest inWest Midlands (60%).A preferenceto die in a hospice was the secondmost frequent in all nine GORs(ranging from 26% in the NorthEast and North West to 32% in theSouth East and East of England).Altogether, home and hospicesaccounted for the preferences forplace of death of more than 89% ofpeople in all nine GORs (rangingfrom 89% in Yorkshire & the
Humber to 94% in the South Eastand East of England).The variationobserved in preferred place ofdeath by GORs was notstatistically significant.
Those who had cared for aclose relative or friend in their lastmonths of life were more likely toprefer to die in a hospice thanthose who had not had theexperience (33% versus 25%respectively; Chi2 test=9.424; p-value=0.002).This was the onlystatistically significant difference onpreference for place of deathregarding experience of illness,death and dying.
Preferences for place of death
63%
65%
62%
63%
67%
64%
62%
66%
60%
61%
29%
27%
32%
29%
26%
26%
32%
27%
31%
28%
0% 20% 40% 60% 80% 100%
All England
East Midlands
East of England
London
North East
North West
South East
South West
West Midlands
Yorkshire & the Humber
own homehospicehospitalcare homehome of a relative or friendelsewhere
Figure 4 - Most preferred place of death by GOR
There were no significant geographical differences (Chi2 test=21.123;p-value=0.994).
SECTION 4
“My father passed awayin a hospice last Augustand it was absolutelyexcellent. The familywere included as muchas we wanted to be ineverything. The qualityof care was superb and Ipersonally wish thateverybody had that endof life care and end oflife option because itopened my eyescompletely”45 years old, female resident inthe West Midlands
“My dad died on acamp bed at home, andmy mum came homeand it was so muchimproved when shedied. She hadeverything she wanted,and we brought herhome for five days”57 years old, female resident inthe East of England
“I do firmly believe thatpeople should be givena choice and help to diein their own home ifthey wish. I do thinkmore help should begiven”57 years old, female resident inthe East Midlands
12 Local preferences and place of death in regions within England 2010
27%
32%
29%
26%
26%
32%
27%
31%
28%
25%
15%
27%
34%
23%
26%
26%
21%
23%
0% 20% 40% 60% 80% 100%
East Midlands
East of England
London
North East
North West
South East
South West
West Midlands
Yorkshire & theHumber
hospice in 2003
hospice in 2010
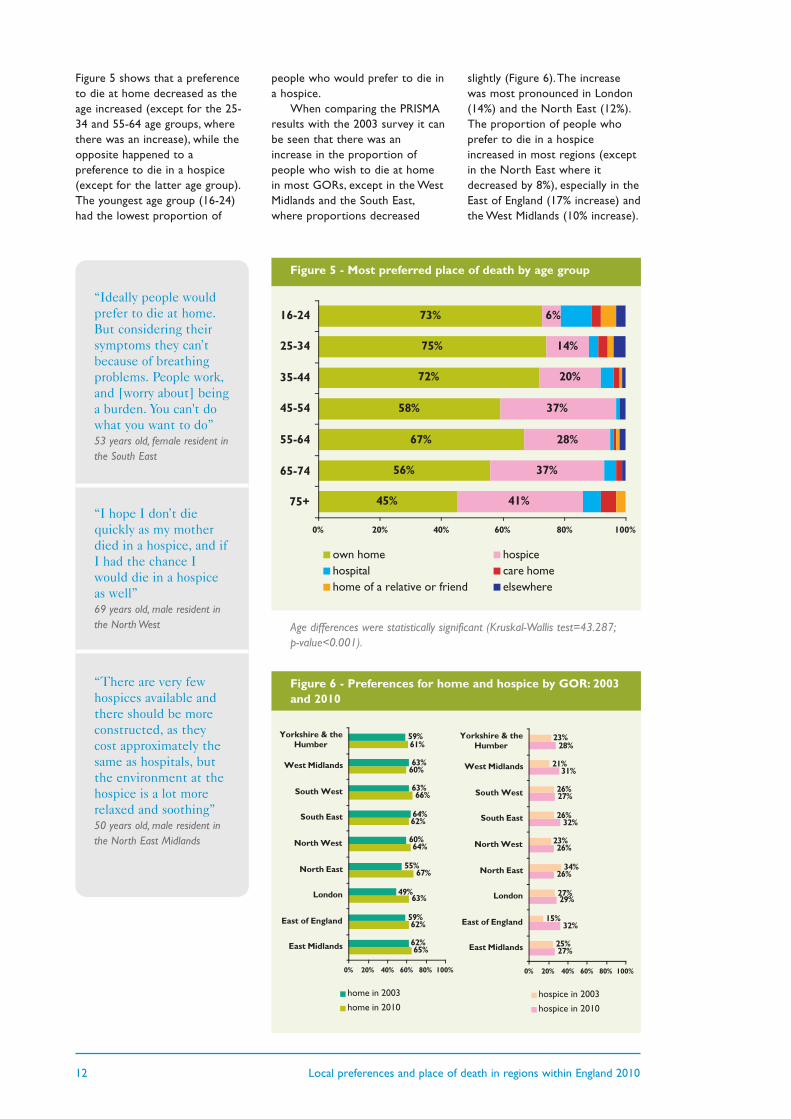
Figure 5 shows that a preferenceto die at home decreased as theage increased (except for the 25-34 and 55-64 age groups, wherethere was an increase), while theopposite happened to apreference to die in a hospice(except for the latter age group).The youngest age group (16-24)had the lowest proportion of
people who would prefer to die ina hospice.
When comparing the PRISMAresults with the 2003 survey it canbe seen that there was anincrease in the proportion ofpeople who wish to die at homein most GORs, except in the WestMidlands and the South East,where proportions decreased
slightly (Figure 6).The increasewas most pronounced in London(14%) and the North East (12%).The proportion of people whoprefer to die in a hospiceincreased in most regions (exceptin the North East where itdecreased by 8%), especially in theEast of England (17% increase) andthe West Midlands (10% increase).
“Ideally people wouldprefer to die at home.But considering theirsymptoms they can’tbecause of breathingproblems. People work,and [worry about] beinga burden. You can't dowhat you want to do”53 years old, female resident inthe South East
“I hope I don’t diequickly as my motherdied in a hospice, and ifI had the chance Iwould die in a hospiceas well”69 years old, male resident inthe North West
“There are very fewhospices available andthere should be moreconstructed, as theycost approximately thesame as hospitals, butthe environment at thehospice is a lot morerelaxed and soothing”50 years old, male resident inthe North East Midlands
45%
56%
67%
58%
72%
75%
73%
41%
37%
28%
37%
20%
14%
6%
0% 20% 40% 60% 80% 100%
75+
65-74
55-64
45-54
35-44
25-34
16-24
own home hospicehospital care homehome of a relative or friend elsewhere
Figure 5 - Most preferred place of death by age group
Age differences were statistically significant (Kruskal-Wallis test=43.287;p-value<0.001).
65%
62%
63%
67%
64%
62%
66%
60%
61%
62%
59%
49%
55%
60%
64%
63%
63%
59%
0% 20% 40% 60% 80% 100%
East Midlands
East of England
London
North East
North West
South East
South West
West Midlands
Yorkshire & theHumber
home in 2003
home in 2010
Figure 6 - Preferences for home and hospice by GOR: 2003and 2010

Local preferences and place of death in regions within England 2010 13
Figure 7 shows that preferencesfor home increased over timeacross almost all age groups(except in the aged 65+),particularly amongst the 55-64 agegroup (from 51% to 67%, anincrease of 16%). Preferences forhospice showed a wider variationaccording to age. The proportion
with a preference for hospicedecreased in the younger agegroups (up to 44 years), especiallyin the 16-24 age group (from 13%in 2003 to 7% in 2010).They alsodecreased in those aged 55-64. Incontrast, they increased in the 45-54 age group and in the 65+ (inthe latter from 25% in 2003 to
38% in 2010). A preference fordying in hospital decreased inevery age group, with the greatestdecrease in the 55-64 group (from12% to 1%). Although the numberswere small, the proportion ofthose who wished to die in a carehome also decreased in all agegroups except for the 35-44 group.
52%
67%
58%
72%
75%
73%
54%
51%
57%
61%
64%
62%
0% 50% 100%
65+
55-64
45-54
35-44
25-34
16-24
home in 2003
home in 2010
38%
28%
37%
20%
14%
7%
25%
31%
33%
27%
20%
13%
0% 50% 100%
65+
55-64
45-54
35-44
25-34
16-24
hospice in 2003
hospice in 2010
Figure 7 - Preferences for place of death by age group: 2003and 2010
5%
1%
1%
4%
3%
10%
12%
12%
6%
9%
12%
20%
0% 50% 100%
65+
55-64
45-54
35-44
25-34
16-24
hospital in 2003
hospital in 2010
3%
1%
1%
2%
3%
3%
8%
3%
3%
2%
4%
5%
0% 50% 100%
65+
55-64
45-54
35-44
25-34
16-24
care home in 2003
care home in 2010
“Residential places arehard to find for elderlypeople. If someone wasto provide us withbetter residential placesthat would be a lotbetter”60 years old, female resident inthe East Midlands
“I would give greatcredit to Macmillannurses. When myhusband was to die, theMacmillan nurses cameto my husband andasked for his input onhow he would like todie. My husband washappy to speak aboutthis but it was moredistressing to me thanto my husband”75 years old, female resident inthe East of England
Home Hospice
Hospital Care home
14 Local preferences and place of death in regions within England 2010
4.2 Least preferred place of death
“I see this every day inmy work. It's a goodthing that you are doingthis research. Peoplewith a terminal illnessshould be able to die ina peaceful environmentas opposed to ahospital”36 years old, female resident inthe South West
“Round the end of ourroad there is an oldpersons’ home. It is soold and depressing. I'ma very touch feelyperson. It would not bejust the level of care, itwould be theenvironment too. (...)The chair, thewallpapers. I wouldnever like being in anold persons’ home”60 years old, female resident inin the East Midlands
42%
45%
41%
36%
31%
40%
39%
46%
53%
38%
28%
33%
27%
31%
34%
32%
27%
24%
21%
28%
0% 20% 40% 60% 80% 100%
All England
East Midlands
East of England
London
North East
North West
South East
South West
West Midlands
Yorkshire & the Humber
hospital care homehome of a relative or friend hospiceown home elsewhere
Figure 8 - Least preferred place by GOR
There were no significant geographical differences (Chi2 test=45.942;p-value=0.240).
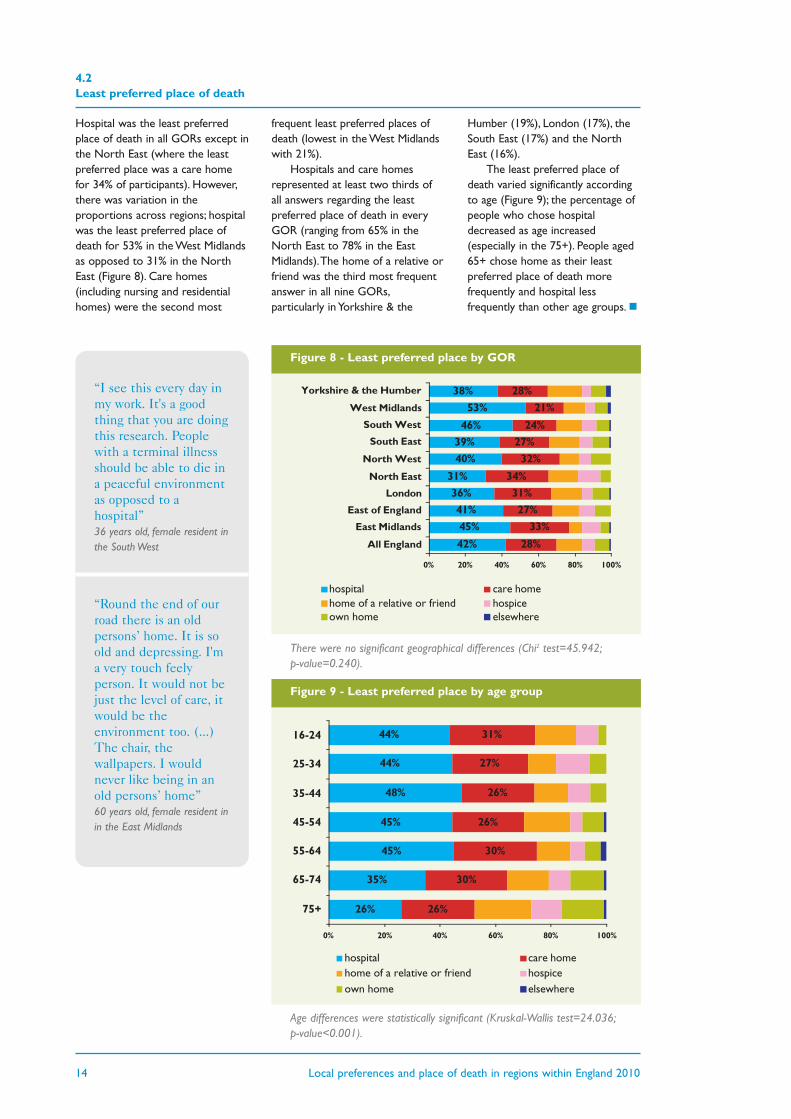
Hospital was the least preferredplace of death in all GORs except inthe North East (where the leastpreferred place was a care homefor 34% of participants). However,there was variation in theproportions across regions; hospitalwas the least preferred place ofdeath for 53% in the West Midlandsas opposed to 31% in the NorthEast (Figure 8). Care homes(including nursing and residentialhomes) were the second most
frequent least preferred places ofdeath (lowest in the West Midlandswith 21%).
Hospitals and care homesrepresented at least two thirds ofall answers regarding the leastpreferred place of death in everyGOR (ranging from 65% in theNorth East to 78% in the EastMidlands).The home of a relative orfriend was the third most frequentanswer in all nine GORs,particularly in Yorkshire & the
Humber (19%), London (17%), theSouth East (17%) and the NorthEast (16%).
The least preferred place ofdeath varied significantly accordingto age (Figure 9); the percentage ofpeople who chose hospitaldecreased as age increased(especially in the 75+). People aged65+ chose home as their leastpreferred place of death morefrequently and hospital lessfrequently than other age groups.n
26%
35%
45%
45%
48%
44%
44%
26%
30%
30%
26%
26%
27%
31%
0% 20% 40% 60% 80% 100%
75+
65-74
55-64
45-54
35-44
25-34
16-24
hospital care homehome of a relative or friend hospiceown home elsewhere
Figure 9 - Least preferred place by age group
Age differences were statistically significant (Kruskal-Wallis test=24.036;p-value<0.001).
Local preferences and place of death in regions within England 2010 15
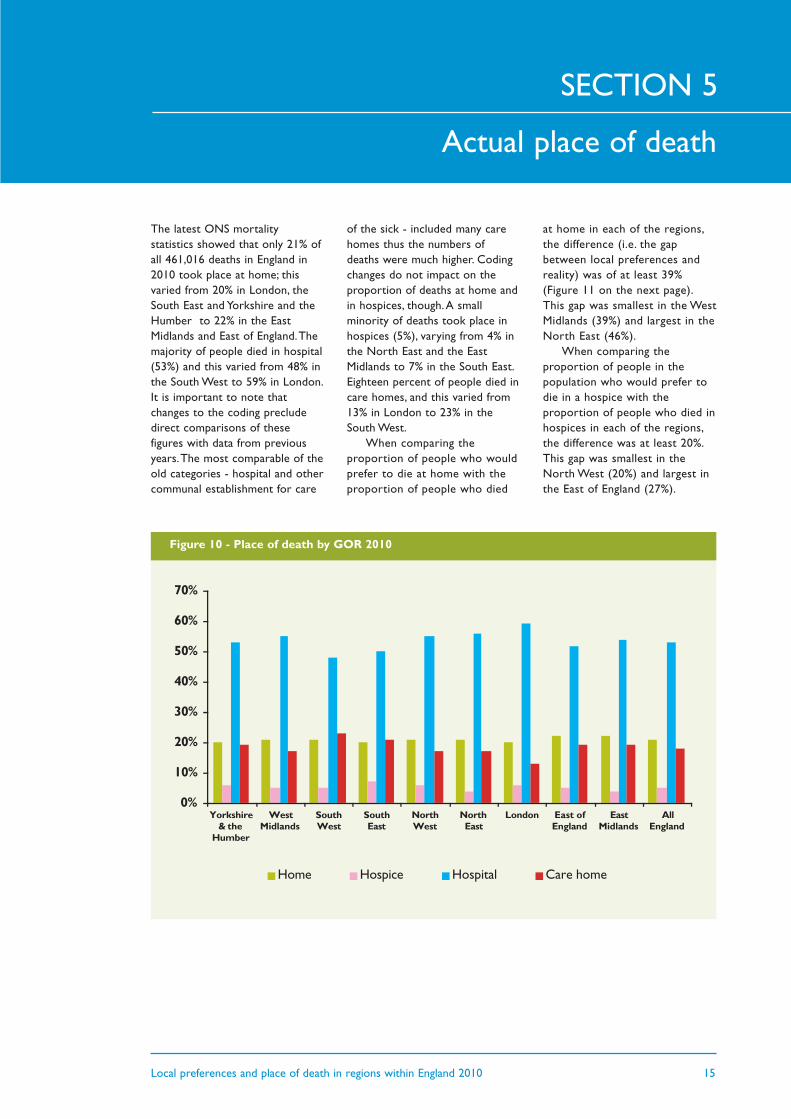
The latest ONS mortalitystatistics showed that only 21% ofall 461,016 deaths in England in2010 took place at home; thisvaried from 20% in London, theSouth East and Yorkshire and theHumber to 22% in the EastMidlands and East of England.Themajority of people died in hospital(53%) and this varied from 48% inthe South West to 59% in London.It is important to note thatchanges to the coding precludedirect comparisons of thesefigures with data from previousyears.The most comparable of theold categories - hospital and othercommunal establishment for care
of the sick - included many carehomes thus the numbers ofdeaths were much higher. Codingchanges do not impact on theproportion of deaths at home andin hospices, though.A smallminority of deaths took place inhospices (5%), varying from 4% inthe North East and the EastMidlands to 7% in the South East.Eighteen percent of people died incare homes, and this varied from13% in London to 23% in theSouth West.
When comparing theproportion of people who wouldprefer to die at home with theproportion of people who died
at home in each of the regions,the difference (i.e. the gapbetween local preferences andreality) was of at least 39%(Figure 11 on the next page).This gap was smallest in the WestMidlands (39%) and largest in theNorth East (46%).
When comparing theproportion of people in thepopulation who would prefer todie in a hospice with theproportion of people who died inhospices in each of the regions,the difference was at least 20%.This gap was smallest in theNorth West (20%) and largest inthe East of England (27%).
Actual place of death
SECTION 5
0%
10%
20%
30%
40%
50%
60%
70%
Yorkshire& the
Humber
WestMidlands
SouthWest
SouthEast
NorthWest
NorthEast
London East ofEngland
EastMidlands
AllEngland
Home Hospice Hospital Care home
Figure 10 - Place of death by GOR 2010
16 Local preferences and place of death in regions within England 2010
21%
43%
Home
6%
20%
Hospice
21%
46%
Home
4%
22%
Hospice
20%
41%
Home
6%
22%
Hospice
22%
40%
Home
5%
27%
Hospice
20%
43%
Home
6%
23%
Hospice
21%
39%
Home
5%
26%
Hospice
20%
42%
Home
7%
25%
Hospice
21%
45%
Home
5%
22%
Hospice
22%
43%
Home
4%
23%
Hospice
%
%
Place
- Gap between local preferencesand actual deaths
- Actual deaths in 2010
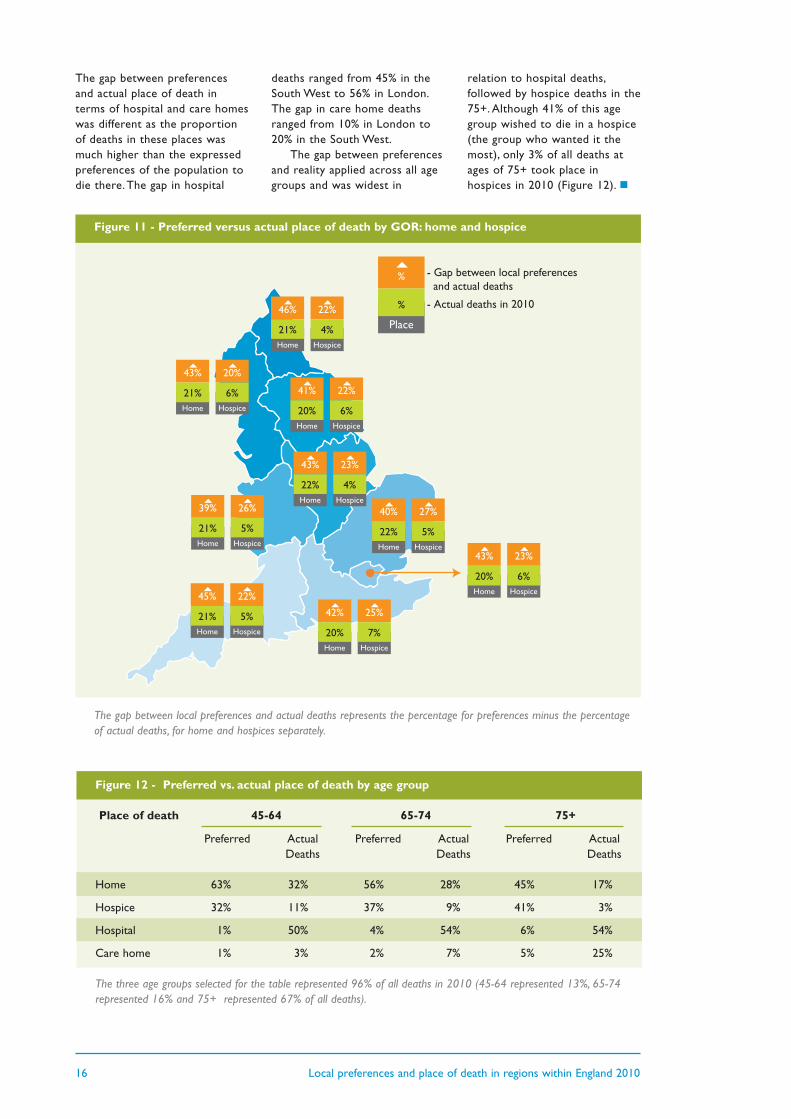
The gap between preferencesand actual place of death interms of hospital and care homeswas different as the proportionof deaths in these places wasmuch higher than the expressedpreferences of the population todie there.The gap in hospital
deaths ranged from 45% in theSouth West to 56% in London.The gap in care home deathsranged from 10% in London to20% in the South West.
The gap between preferencesand reality applied across all agegroups and was widest in
relation to hospital deaths,followed by hospice deaths in the75+. Although 41% of this agegroup wished to die in a hospice(the group who wanted it themost), only 3% of all deaths atages of 75+ took place inhospices in 2010 (Figure 12). n
Figure 12 - Preferred vs. actual place of death by age group
Place of death 45-64 65-74 75+
Preferred Actual Preferred Actual Preferred Actual Deaths Deaths Deaths
Home 63% 32% 56% 28% 45% 17%
Hospice 32% 11% 37% 9% 41% 3%
Hospital 1% 50% 4% 54% 6% 54%
Care home 1% 3% 2% 7% 5% 25%
The three age groups selected for the table represented 96% of all deaths in 2010 (45-64 represented 13%, 65-74represented 16% and 75+ represented 67% of all deaths).
Figure 11 - Preferred versus actual place of death by GOR: home and hospice
The gap between local preferences and actual deaths represents the percentage for preferences minus the percentageof actual deaths, for home and hospices separately.

Local preferences and place of death in regions within England 2010 17
Box 2 - Summary points
4 Most people are likely to see their preferences for place of death unmet regardless which GOR theylive in England.
4 Fifty-three per cent of deaths in all GORs in 2010 occurred in hospitals, the least preferred place ofdeath in all but one region (North East). London had the highest proportion of hospital deaths (59%),despite seeing the largest increase in preferences to die at home (from 49% in 2003 to 63% in 2010).
4 Although preferences to die at home and hospices seem to have increased from 2003 to 2010, in whichyear together they covered the preferences of at least 89% in every English region with no significantvariation across the nine GORs, only 26% of all deaths in 2010 took place in these places (21% at homeand 5% in hospices).
4 Regions where local preferences are likely to be more often met are the West Midlands (for thosewishing to die at home) and the North West (for those wishing to die in a hospice); however, even inthese regions there is still a large gap between preferences and reality.
4 The largest gap between local preferences and place of death is in the North East for those wishing todie at home, in the East of England for those wishing to die in a hospice, and for people aged 75+wishing to die in a hospice.
18 Local preferences and place of death in regions within England 2010
This report provides health careprofessionals, managers and carecommissioners with the latestintelligence on local preferencesand place of death.The datasuggest that there is still a long wayto go until the majority in societyhave their preferences for whereto die fulfilled.To support thisprocess and the work championedby the National End of Life CareProgramme and Strategy, we haveprovided local baseline informationto monitor the impact of futurechanges, we have identifiedvariations within the country(flagged regional nuances toexplore reasons why they exist),and we have unveiled someconcerns that groups within thesociety have about certain placesof care and death.
Four main limitations:
4 Using a telephone surveyapproach to surveyingpreferences resulted in arelatively low response rate(typical of telephone surveys)and selection biases towardswomen and older people (i.e.groups that are often at homewhen calls are made). Knowingwhere the gender and agedifferences lie, we are likely tohave underestimated the overallhome preference andoverestimated the hospicepreference.The age bias,however, enabled a betterexamination of the views ofthose who are potentially closerto reaching the end of life. Sinceolder people are likely to bemore aware of their mortalitythrough illness, their views maybe more accurately reflectivethan those of younger people.Selection biases apply to allGORs and do not affect regionaland age group comparisons.
4 Comparisons of 2010 and2003 data on preferences and2010 data on place of death arelimited by the differences detailedin the methodological notes.Moreover, these are indirectcomparisons; although the datareport to the same regions, itrelates to different groups ofpeople.A longitudinal study wouldallow testing whether preferenceschange over the years forindividuals until death.This reportis concerned with societalpreferences and reality at a givenpoint in time.
4We did not survey thepreferences of terminally illpatients and the findings reflectlargely the views of healthy people;however, the sample included 13%who had been diagnosed with aserious illness in the last five yearsand their preferences did notsignificantly differ from thosewithout a serious illness. Still,individual preferences may changeas people become unwell andapproach the end of life. It is alsoimportant to note that havingcared for a close relative or friendin their last months of life affectedsignificantly a hospice preference(increasing it), which suggests thatknowledge and experience ofservices may inform choices. Noneof the other aspects on experienceof serious illness, death and dyinginfluenced preferences.
4 In the PRISMA 2010 survey wesurveyed private households; carehomes residents were thereforenot included.Therefore we do notknow the views of people whohave moved into care homes.Further research with thispopulation group is much needed,as one in every four deaths ofpeople aged 75 years and over takeplace in care homes.
6.1 Preferences for home andhospices ____________________________
By studying the evolution ofpreferences from 2003 to 2010we saw that both preferences todie at home and in hospices seemto have increased, that these twoplaces accounted for at least 89%of preferences in all regions in2010 and that despite this, only26% of all deaths take place athome and in hospices takentogether, with no significantvariation across the nine GORs.Since there were no significantdifferences in the age distributionof participants in the PRISMAsurvey across GORs, it is unlikelythat age masked any importantvariations in preferences acrossGORs.This indicates that inorder to narrow the gap betweenpreferences and reality for placeof death at both national andlocal levels, maximum impact isderived from focusing futureinvestment and servicedevelopments in extending andimproving care at home and inhospices.This supports choice fora large majority (at the same timeaddressing variations inexperiences of care at home), andmaximises the impact of newservice developments on meetingpreferences for place of death forpopulations.
Such strategy requiresincreased investment but alsoclose cooperation of NHS andnon-NHS institutions such asindependent, voluntary and socialcare organisations. Hospital atHome services, for example,extend the reach of palliativecare into home settings and arefound to significantly increasepatients’ chances of dying athome (11). Other case study
Limitations and discussion
SECTION 6
Local preferences and place of death in regions within England 2010 19
examples, such as the RoyalMarsden Hospital2Home service,aiming to support patients andfamilies in a choice to be caredfor at home can be found at theNational End of Life CareProgramme website(www.endoflifecareforadults.nhs.uk).
We flag the case of London.Bearing in mind the region’s uniquechallenges (e.g. densely populated,significant population growth dueto births and migration and anextremely ethnically diversepopulation) (12), this GOR hasseen the largest increase in homepreferences (from 49% in 2003 to63% in 2010) and yet, despiteefforts and an array of serviceprovision, London continues tohave the lowest proportion ofhome deaths (20%, along with theSouth East and Yorkshire and theHumber).This is partially shaped bybeing an urban/suburban area andwhat is known to be one of thestrongest determinants of death athome (proximity to hospital beds)(13), but it is important to find outwhat else is shaping the mismatchbetween preferences and reality inLondon (e.g. ethnicity, cultural andsocial issues may play a role).Alarge-scale study (called theQUALYCARE study), funded byCicely Saunders International andsupported by the Department ofHealth and local NHS authorities,is now examining variations withinLondon (14).The region accountsfor 15% of the 51 million peoplewho live in England and for 10% ofall deaths (10).A betterunderstanding of London willbenefit other urban/suburbanregions in England (where 80% ofpeople live) (15).
6.2 Care homes and hospitals ____________________________
Although the data support a focuson home and hospices, it isimportant to investigate furthersome geographical variations.
4 Whilst the sample was small inthe North East, the findingssuggest that the importance
attached to dying in the preferredplace and a preference to die athome (67%) is currently highest inthis region than elsewhere.Because the proportion of homedeaths is not greatly differentfrom other regions, the NorthEast has the largest gap betweenpreferences and home death. Itdoes not seem that hospicepreferences are particularly highin the region (in fact, theproportion is the lowest of allGORs at 26% along with theNorth West) but it is of concernthat care homes are the leastpreferred place of death in theNorth East (for 34%), when in allother regions it is hospital.
4 The West Midlands is a case ofinterest for different reasons.Here, a preference to die at homedecreased since 2003 (to 60% in2010, the lowest of all nineGORs); this might be partiallyexplained by the relatively highpreference for hospice (31%) butit is worth noting that the regionhad the highest percentage ofpeople who would least prefer todie in a hospital (53%).
Issues related to care homes andhospitals as settings of end of lifecare and where death takes placeare also present in the quotes fromsurvey participants, where aspectsrelated to the level of care,environment and peacefulnesstranspire. It is therefore imperativeto better understand people’s viewsas they may underlie preferences(both hypothetical and real) andexplain how important it is forpeople to choose where they die.Despite the fact that altogethercare homes and hospitals are theleast preferred places of death forat least two thirds of people in allregions, improving end of life carein these two settings remains veryimportant.
4 In the context of a rapidlyageing population with increasingnumbers of people living alonetowards the end of life with acomplex condition and co-morbidities, more may need to becared for in care homes (16). It istherefore urgent to understand
why people do not wish to die inthese places to identify if andwhat improvements need to bemade (e.g. the development of ahome and hospice-likeenvironment within care homes).Until such investigation is done,caution is recommended if andwhen considering care homes asequivalent to people’s own home(the first being the second leastpreferred place of death and thesecond being the most preferredplace of death).
4 Hospitals are still the mostcommon place of death; at least48% of the population die inhospital in every English GOR anddespite the fact that for manypeople the last hospital admissionbefore death may have beenpreventable, for others it isinevitable and appropriate (17).Alongside policy changes andservice developments to helpprevent undesired hospitaladmissions (often via EmergencyDepartments), it is crucial tosecure good palliative care for thelarge number of people who die inhospitals. Mobile hospital palliativecare teams are key champions ofgood practices and care acrosshospital wards, helping to identifypeople who need palliative careand to ensure a safe return homeif they wish (18). Concerns withthe lack of peacefulness in hospitalcan in part be addressed by theexistence of wards of dedicatedpalliative care in quieter and family-friendly areas within hospitals. Inthis analysis we were not able toseparate community hospitals fromacute hospitals, which mightusefully be examined in the future.
Considering our data alongsiderecent reports of abuse andneglect of people towards theend of life in care homes andhospitals (19;20), indicating thatthere are some issues to betackled in these settings, thedefinition and monitoring ofquality standards for end of lifecare in these settings and thework of the Care QualityCommission and the NHSCommissioning Board becomeeven more important.
20 Local preferences and place of death in regions within England 2010
6.3 Older people ____________________________
Although home is the mostfrequent preference for place ofdeath in all age groups, it isimportant to consider separatelythe group of older people forthree reasons:
4 Aligned with previous results(8), we found that a homepreference decreases with age(except for the 25-34 and 55-64age groups) as a hospicepreference increases, particularlyin the 75+. Reasons for thisdifference are not fully known,but might be related with thefear of being a severe burden toothers when reaching older age(21), although this needs to befurther investigated.
4 Despite being the age groupwith the highest hospicepreference (41%), people aged75+ have fewer chances ofdying in hospice (3% versus 9-11% in other age groups).
4 The gap between preferencesand reality is widest for the75+ wishing to die in hospicethan for any other age groupand preference.
It is important to remember thatthe aged 75+ account for 67% of alldeaths (53% of all cancer deaths)(10) and that this percentage is
projected to increase rapidly anddramatically in the future (4).Despite being focal to end of lifecare and wanting to die in hospicesmore than any other age group, theaged 75+ account for less than half(41%) of all hospice deaths (92% ofwhich are caused by cancer) (10).Ensuring greater access of olderpeople to hospice beds is thereforevital to narrow the gap betweenpreferences and reality for themand for all. National and local actionis needed.
Ensuring assessment of needand referrals of older people fromcommunity services and hospitalsto hospices may help to tackle theissue. Data on hospice referrals,users and number of deaths by agegroup can be investigated byhospices to help identify barriers,differences and solutions. Othermeasures such as advancedtraining so that hospice staffdevelop further competencies tocare for the specific needs of olderpatients may be considered.Greater access of older people tohospice beds goes hand in handwith greater hospice provision innon-malignant conditions such asdementia which are increasingcauses of death for older people.Persisting age and cancer/non-cancer differences suggestinequities (4) that are urgent totackle (i.e. older people and non-cancer patients are less likely todie at home).
It is important to note that apreference to die at home is stillthe most common among olderpeople, slightly more than apreference to die in hospice. Since1974, older people have always hadfewer chances to die at home thanany other adult age groups (4).This may reflect their complexclinical situations, oftenlongstanding and with trajectoriesthat are hard to predict, as well asa lack of social support. However,it is neither a universal nor aninevitable fact that older peopledie less often at home. Older agehas been found to be associatedwith increased odds of dying athome for those diagnosed withcancer in New York but decreasedodds of dying at home in London(22).The difference wasmaintained when adjusting forother factors, and was not easilyexplained by symptom profiles orfamily structures. Cancer diagnosesand the proportions of personsliving alone were similar and NewYork had more acute beds thanLondon. It is possible that theincreased odds of older peopledying at home in the USA mayreflect the intensive home caresupport provided by the Medicarehospice program (mainly providedat home) to people aged 65+.Policies or benefits targeting olderpeople may be considered toenable more older people to dieat home in England.n
Local preferences and place of death in regions within England 2010 21
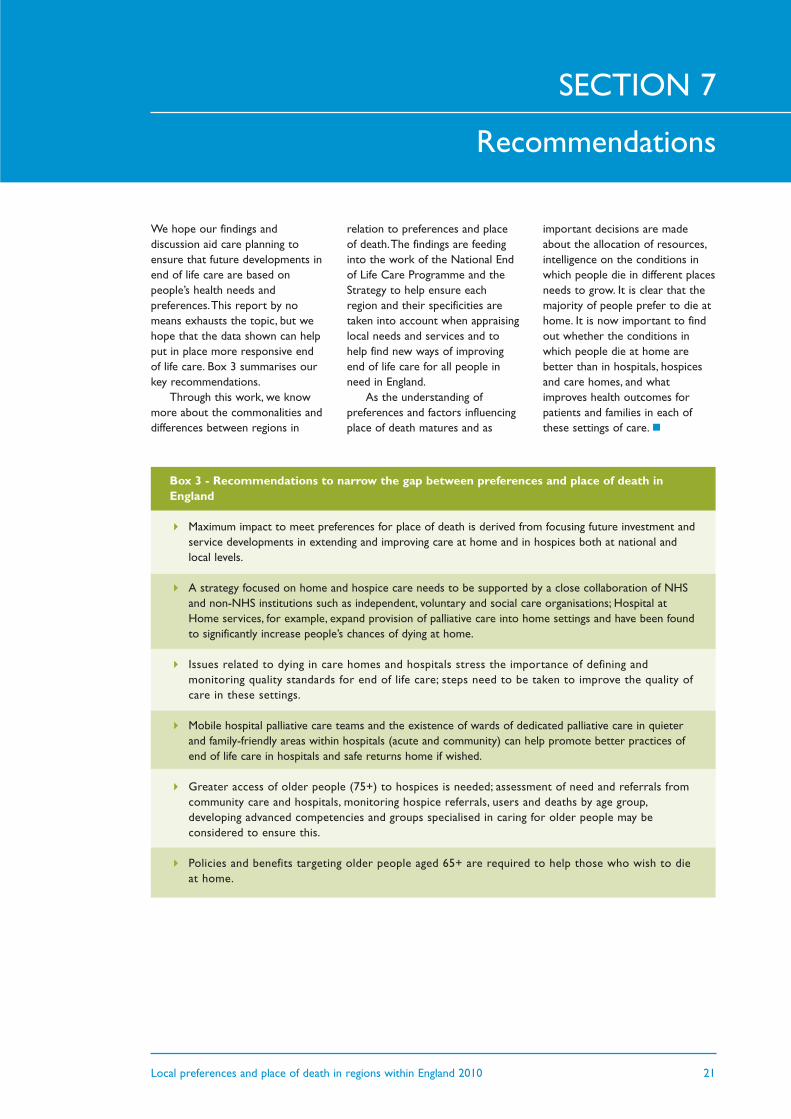
We hope our findings anddiscussion aid care planning toensure that future developments inend of life care are based onpeople’s health needs andpreferences.This report by nomeans exhausts the topic, but wehope that the data shown can helpput in place more responsive endof life care. Box 3 summarises ourkey recommendations.
Through this work, we knowmore about the commonalities anddifferences between regions in
relation to preferences and placeof death.The findings are feedinginto the work of the National Endof Life Care Programme and theStrategy to help ensure eachregion and their specificities aretaken into account when appraisinglocal needs and services and tohelp find new ways of improvingend of life care for all people inneed in England.
As the understanding ofpreferences and factors influencingplace of death matures and as
important decisions are madeabout the allocation of resources,intelligence on the conditions inwhich people die in different placesneeds to grow. It is clear that themajority of people prefer to die athome. It is now important to findout whether the conditions inwhich people die at home arebetter than in hospitals, hospicesand care homes, and whatimproves health outcomes forpatients and families in each ofthese settings of care.n
Recommendations
SECTION 7
Box 3 - Recommendations to narrow the gap between preferences and place of death inEngland
4 Maximum impact to meet preferences for place of death is derived from focusing future investment andservice developments in extending and improving care at home and in hospices both at national andlocal levels.
4 A strategy focused on home and hospice care needs to be supported by a close collaboration of NHSand non-NHS institutions such as independent, voluntary and social care organisations; Hospital atHome services, for example, expand provision of palliative care into home settings and have been foundto significantly increase people’s chances of dying at home.
4 Issues related to dying in care homes and hospitals stress the importance of defining andmonitoring quality standards for end of life care; steps need to be taken to improve the quality ofcare in these settings.
4 Mobile hospital palliative care teams and the existence of wards of dedicated palliative care in quieterand family-friendly areas within hospitals (acute and community) can help promote better practices ofend of life care in hospitals and safe returns home if wished.
4 Greater access of older people (75+) to hospices is needed; assessment of need and referrals fromcommunity care and hospitals, monitoring hospice referrals, users and deaths by age group,developing advanced competencies and groups specialised in caring for older people may beconsidered to ensure this.
4 Policies and benefits targeting older people aged 65+ are required to help those who wish to dieat home.
22 Local preferences and place of death in regions within England 2010
References
SECTION 8
1 Department of Health.End of Life Care Strategy -Promoting high quality care ofall adults at the end of life.Department of Health; 2008.
2 Ruth K, Pring A,Verne J.Variations in place of death inEngland.National End of Life Care IntelligenceNetwork; 2010.
3 Office for National Statistics.2008-based NationalPopulation Projections.Office for National Statistics; 2009.
4 Gomes B, Higginson IJ.Where people die (1974-2030):past trends, future projectionsand implications for care.Palliative Medicine 2008;22(1):33-41.
5 Ruth K,Verne J.Deaths in older adults inEngland.National End of Life Care IntelligenceNetwork; 2010.
6 Lock A, Higginson IJ.Patterns and predictors ofplace of cancer death for theoldest old.BMC Palliative Care 2005;4:6.
7 Higginson IJ, Sen-Gupta GJ.Place of care in advancedcancer: a qualitativesystematic literature review ofpatient preferences.Journal of Palliative Medicine 2000;3(3):287-300.
8 Higginson IJ.Priorities and preferences forend of life care in England,Wales and Scotland.The Cicely Saunders Foundation, ScottishPartnership for Palliative Care and theNational Council for Hospice andSpecialist Palliative Care Services; 2003.
9 Harding R, Higginson IJ, PRISMA.PRISMA: a pan-European co-ordinating action to advancethe science in end-of-lifecancer care.European Journal of Cancer2010;46(9):1493-1501.
10 Office for National Statistics.Mortality Statistics - Deathsregistered in 2010.[unpublished provisional data to thesepublished by the ONS in the autumn2011]. Office for National Statistics;2011.
11 Shepperd S,Wee B, Straus SE.Hospital at home: home-basedend of life care.Cochrane Database of SystematicReviews 2011, Issue 7. Art. No.:CD009231.
12 Office for National Statistics.Focus on London 2007.Palgrave Macmillan; 2007.
13 Gomes B, Higginson IJ.Factors influencing death athome in terminally ill patientswith cancer: systematic review.BMJ 2006;332(7540):515-521.
14 Gomes B, McCrone P, Hall S,Koffman J, Higginson IJ.Variations in the quality andcosts of end-of-life care,preferences and palliativeoutcomes for cancer patientsby place of death: theQUALYCARE study.BMC Cancer 2010;10:400.
15 Office for National Statistics.The UK's major urban areas.Palgrave Macmillan; 2005.
16 World Health Organization.Palliative care for olderpeople: best practices.World Health Organization; 2011.
17 Beynon T, Gomes B, Murtagh FE,Glucksman E, Parfitt A, Burman R,et al.How common are palliativecare needs among olderpeople who die in theemergency department? Emergency Medicine Journal2011;28(6):491-495.
18 Higginson IJ, Finlay I, Goodwin DM,Cook AM, Hood K, Edwards AG,et al.Do hospital-based palliativeteams improve care forpatients or families at the endof life? Journal of Pain & SymptomManagement 2002;23(2):96-106.
19 Health Service Ombudsman.Care and compassion? Reportof the Health ServiceOmbudsman on teninvestigations into NHS careof older people. Fourth reportof the Health ServiceCommissioner for England -Session 2010-2011.London:The Stationery Office;2011.
20 Devlin K.Almost 50,000 patients a year'die in hospital while sufferingfrom malnutrition'.Telegraph 2010 Feb 26.
21 Gott M, Seymour J, Bellamy G,Clark D,Ahmedzai S.Older people's views abouthome as a place of care at theend of life.Palliative Medicine 2004;18(5):460-467.
22 Decker SL, Higginson IJ.A tale of two cities: factorsaffecting place of cancer deathin London and New York.European Journal of Public Health2007;17(3):285-290.
We are most grateful to all theparticipants in the PRISMA surveyand to the ONS Mortality Statisticsteam (Claudia Wells and colleagues)for providing the data on actualplace of death.We thank theNational End of Life CareIntelligence Network and theNational End of Life CareProgramme for making this reportpossible, and the EuropeanCommission for the financialsupport needed to undertake thePRISMA survey.This report reflectsonly the authors’ views. Neither theNational End of Life CareIntelligence Network nor theEuropean Commission are liable forany use that may be made of theinformation contained therein.
Barbara Gomes and NataliaCalanzani are researchers of CicelySaunders International, working atthe Cicely Saunders Institute, King’sCollege London. Professor Irene JHigginson is Scientific Director ofCicely Saunders International,Director of the Cicely SaundersInstitute, Professor of Palliative Care& Policy at King’s College Londonand Senior NIHR Investigator.
PRISMA was funded by theEuropean Commission’s Seventh
Framework Programme (contractnumber: Health-F2-2008-201655)with the overall aim to co-ordinatehigh-quality international researchinto end-of-life cancer care.PRISMA aimed to provide evidenceand guidance on best practice toensure that research can measureand improve outcomes for patientsand families. PRISMA activitiesaimed to reflect the preferencesand cultural diversities of citizens,the clinical priorities of clinicians,and appropriately measuremultidimensional outcomes acrosssettings where end of life care isdelivered. Principal Investigator:Richard Harding. ScientificDirector: Irene J Higginson.
We thank all our colleaguesfrom PRISMA: Gwenda Albers,Barbara Antunes,Ana Barros Pinto,Claudia Bausewein, DorotheeBechinger-English, Hamid Benalia,Emma Bennett, Lucy Bradley, LucasCeulemans, Barbara A Daveson,Luc Deliens, Noël Derycke,Martine de Vlieger, Let Dillen, JuliaDowning, Michael Echteld, SusieEdwards, Natalie Evans, DagnyFaksvåg Haugen, Nancy Gikaara,Marjolein Gysels, Sue Hall, RichardHarding, Stein Kaasa, Jonathan
Koffman, Pedro Lopes Ferreira,Arantza Menaca, Johan Menten,Fliss Murtagh, Bregje Onwuteaka-Philipsen, Roeline Pasman,Francesca Pettenati, Robert Pool,Richard A. Powell, Miel Ribbe,Katrin Sigurdardottir, SteffenSimon, Franco Toscani, Bart Van denEynden, Paul Vanden Berghe,Trudievan Iersel.We also thank BMGResearch and Zentrum fürEvaluation und Methoden (ZEM)for assistance in surveyadministration and data collectionfor the 2010 survey; JoachimCohen for his advice and support;Gao Wei, Joana Cadima and VickySimms for statistical advice.Theinvaluable work of Ron Irwin, SianBest and Mike Gover at King’sCollege London and Brenda Fernsat Cicely Saunders International isalso highly appreciated.
We thank Lukas Radbruch forthe photograph on page 6,AlexDionysiou for his design work withthe report and Susan Chandler forproofreading. Finally, we thankKatie Lindsay, Claire Henry,Katherine Sleeman, BarbaraDaveson, Claudia Bausewein, FlissMurtagh and Kirstie Newson fortheir comments and discussion.n
Acknowledgements