local impact online ptpa fall meeting houston, tx october 21, 2008
TRANSCRIPT
LOCAL IMPACT ONLINE
PTPA FALL MEETING
Houston, TX
October 21, 2008
WHAT IS IMPACT?
To provide a public service, we must deliver significant programming to
significant audiences.
David Giovannoni, Remarks Upon the Acceptance of the
Edward R. Murrow AwardApril 1994
KEY INDICATORS
Most web activity is measured using a small set of key metrics:
o Unique Visitorso Visitso Page Viewso Time-on-site
These metrics work well for public broadcasters—with one reservation. We also need to measure streaming media.
PROBLEM:RESULTS VARY WITH TOOL Web Metrics vary dramatically depending on
the measurement system: Server side Client side Panel based Hybrid systems
ESTABLISHING AN INDUSTRY STANDARD In 2006 – 2007, IMA led a system-wide effort
to establish a standard method of measuring web activity: Google Analytics
o Widely accepted and deployedo Provided by a stable serviceo Supported by a large corps of analystso Likely to one of several national standardso Freeo Easily installed
APPLYING THE RESULTS Public Media Metrics combines and analyzes
the data collected by Google Analyticso Whole sites or single pages are “tagged”o 120 sites now being monitored dailyo Stations have access to data on demando Data is downloaded daily for off-line analysiso PMM provides quarterly reports and analysis
WHAT ARE WE SEEING?For the vast majority of public broadcast sites:
Relatively low traffic Infrequent visits: more than 70% of visitors
are once-per-monthVisitors most often come only for utilities
(program schedules , playlists, pledge)
Streaming media is our primary asset
WEB STATS ARE DIFFERENT Compared with Broadcast Ratings
(Nielsen or Arbitron)…
Web stats are monthly (vs. weekly or daily) Web stats reflect a large number of transient
events
For most station sites well over half the registered “visits” last under 10 seconds.
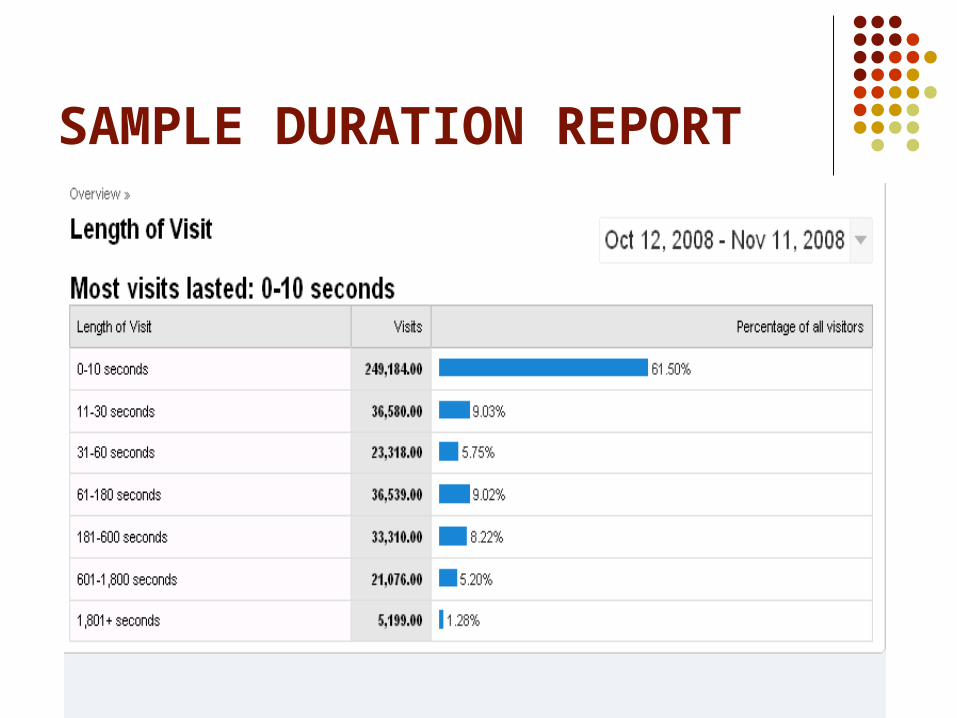
SAMPLE DURATION REPORT
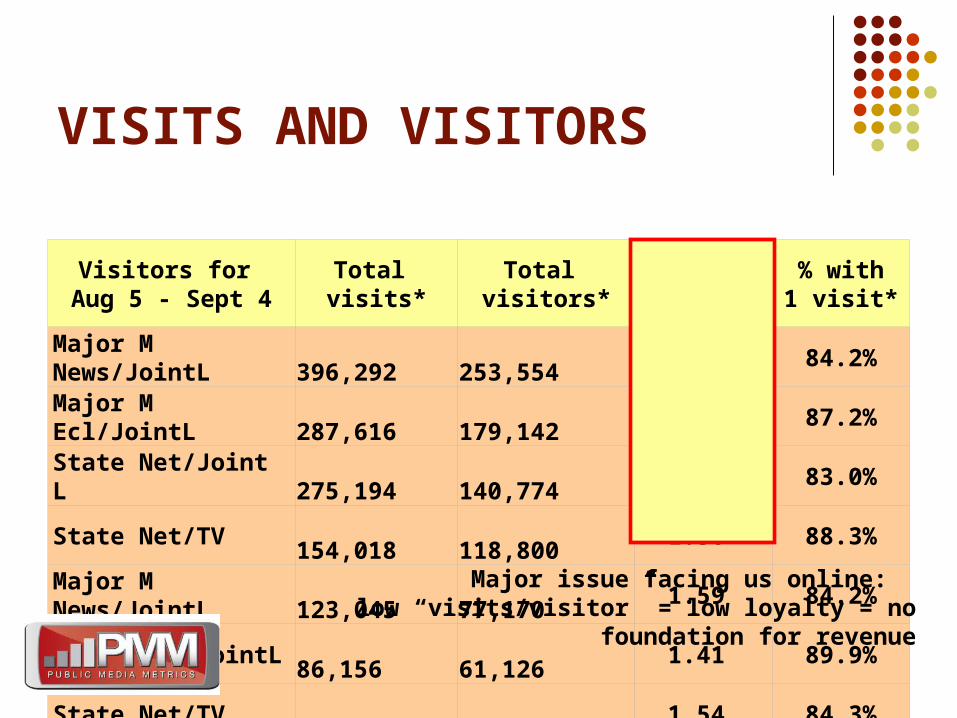
VISITS AND VISITORS
Visitors for Aug 5 - Sept 4
Total visits*
Total visitors*
visits/ visitor*
% with1 visit*
Major M News/JointL 396,292 253,554 1.56 84.2%Major M Ecl/JointL 287,616 179,142 1.61 87.2%State Net/Joint L 275,194 140,774 1.95 83.0%State Net/TV 154,018 118,800 1.30 88.3%Major M News/JointL 123,045 77,170 1.59 84.2%State Net/JointL 86,156 61,126 1.41 89.9%State Net/TV 26,645 17,314 1.54 84.3%
Major issue facing us online: low “visits/visitor” = low loyalty = no foundation for revenue
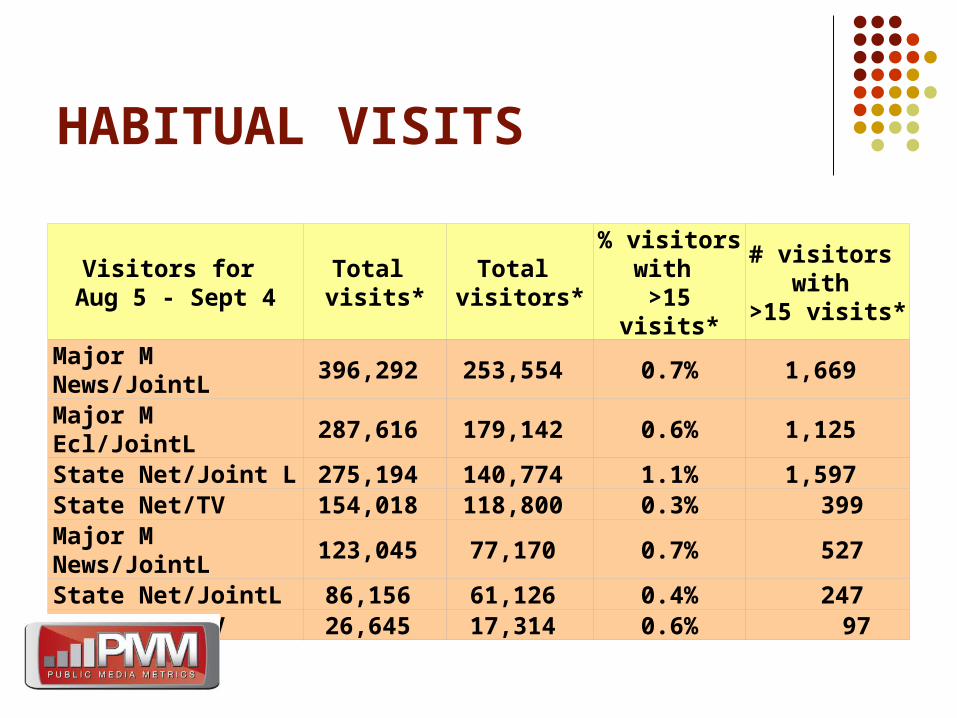
HABITUAL VISITS
Visitors for Aug 5 - Sept 4
Total visits*
Total visitors*
% visitors with
>15 visits*
# visitors with
>15 visits*
Major M News/JointL 396,292 253,554 0.7% 1,669 Major M Ecl/JointL 287,616 179,142 0.6% 1,125 State Net/Joint L 275,194 140,774 1.1% 1,597 State Net/TV 154,018 118,800 0.3% 399 Major M News/JointL 123,045 77,170 0.7% 527 State Net/JointL 86,156 61,126 0.4% 247 State Net/TV 26,645 17,314 0.6% 97
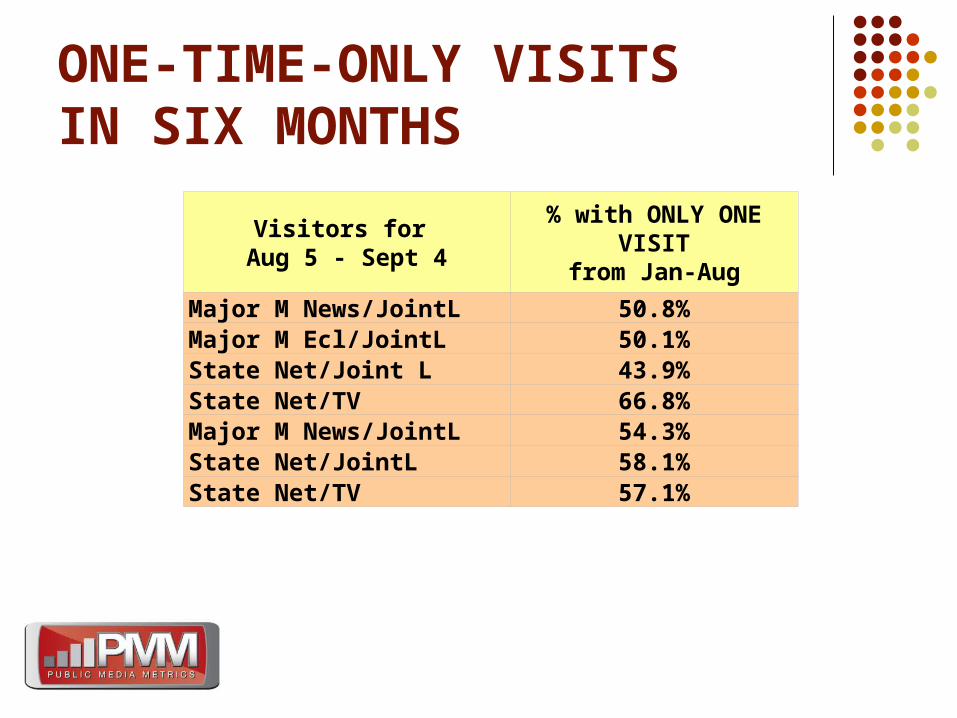
ONE-TIME-ONLY VISITS IN SIX MONTHS
Visitors for Aug 5 - Sept 4
% with ONLY ONE VISITfrom Jan-Aug
Major M News/JointL 50.8%Major M Ecl/JointL 50.1%State Net/Joint L 43.9%State Net/TV 66.8%Major M News/JointL 54.3%State Net/JointL 58.1%State Net/TV 57.1%
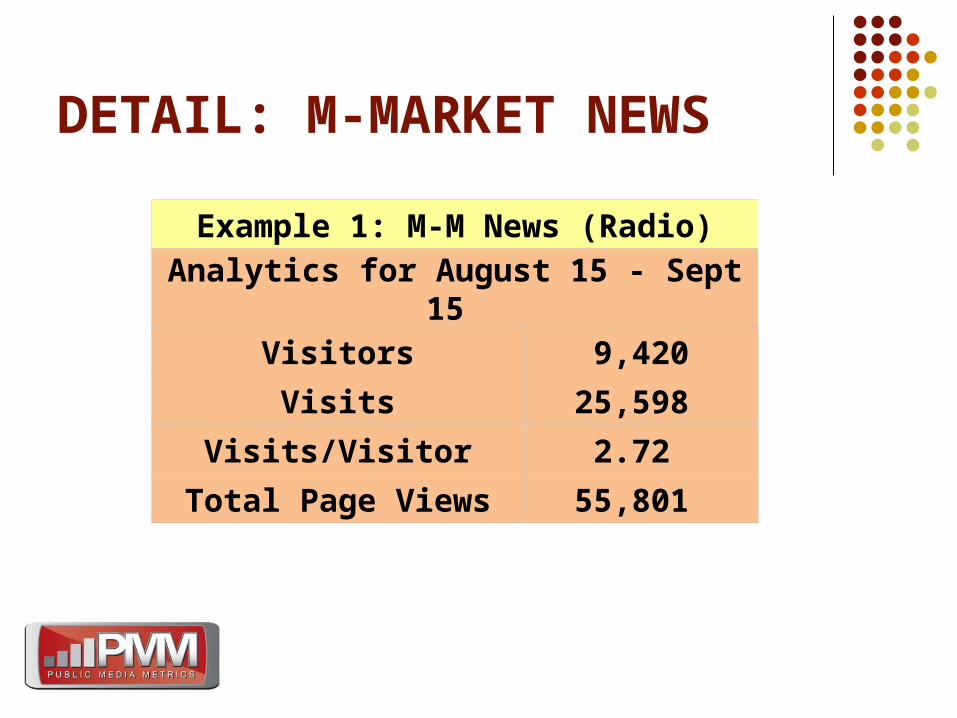
DETAIL: M-MARKET NEWS
Example 1: M-M News (Radio)
Analytics for August 15 - Sept 15
Visitors 9,420
Visits 25,598
Visits/Visitor 2.72
Total Page Views 55,801
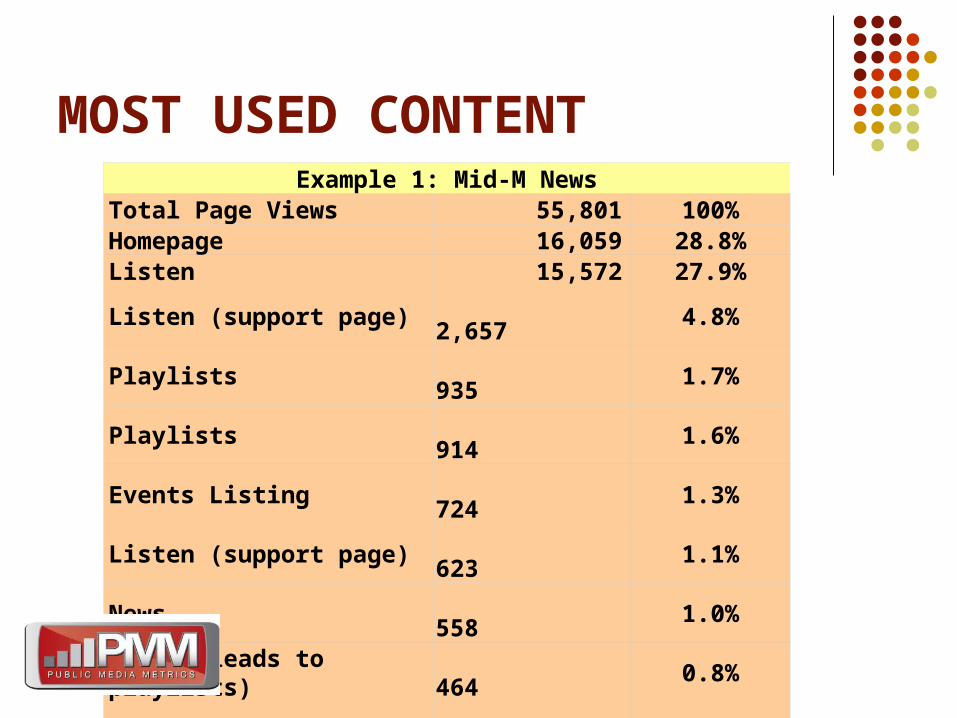
MOST USED CONTENTExample 1: Mid-M News
Total Page Views 55,801 100%Homepage 16,059 28.8%Listen 15,572 27.9%Listen (support page) 2,657 4.8%Playlists 935 1.7%Playlists 914 1.6%Events Listing 724 1.3%Listen (support page) 623 1.1%News 558 1.0%Music (leads to playlists) 464 0.8%Programs 1,893 3.4%Total top 10 content pgs: 40,399 72.4%
RESOURCES FOR EX. 1 1+ person staff Budget over $150,000 Very creative use of open source software A “wait and see” approach
Ex. 2MAJOR MARKET JOINT-L
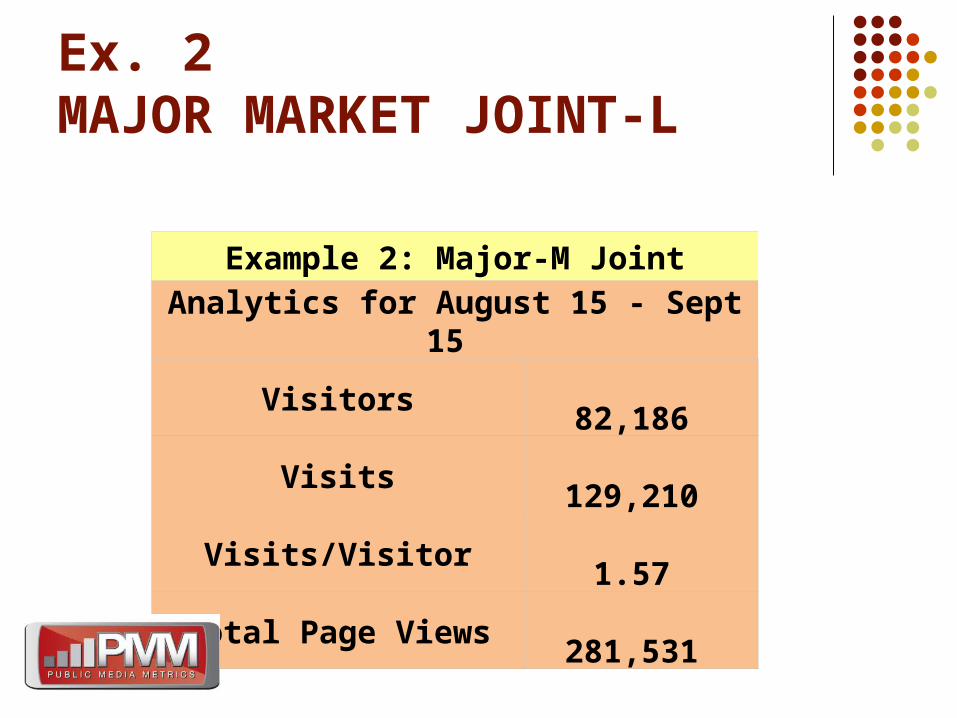
Example 2: Major-M Joint
Analytics for August 15 - Sept 15
Visitors 82,186
Visits 129,210
Visits/Visitor 1.57
Total Page Views 281,531
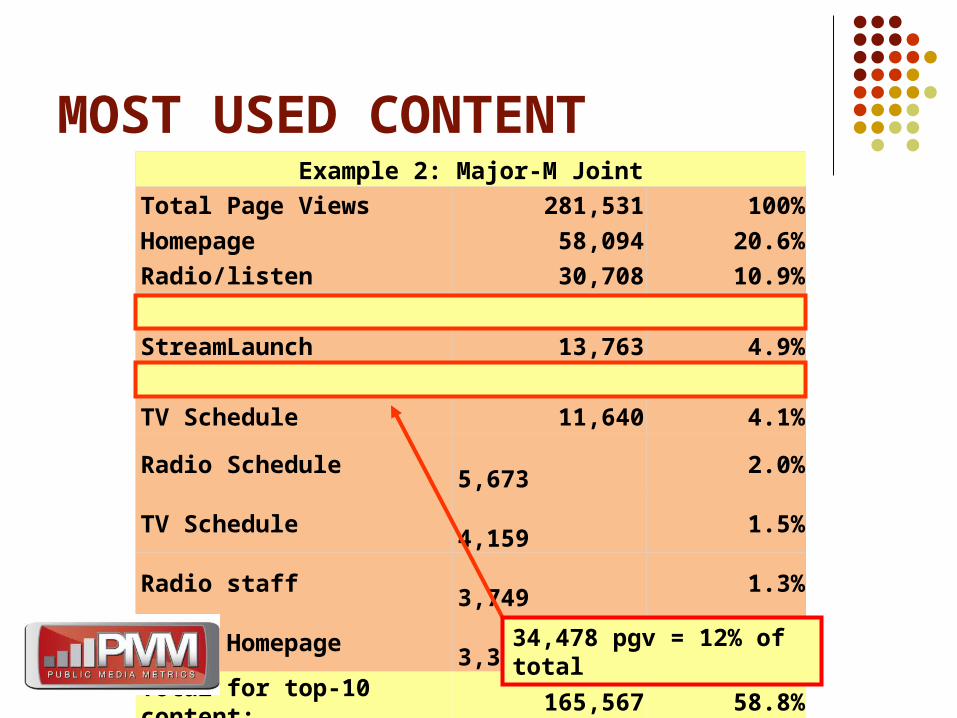
MOST USED CONTENTExample 2: Major-M Joint
Total Page Views 281,531 100%
Homepage 58,094 20.6%
Radio/listen 30,708 10.9%
News/Local 20,715 7.4%
StreamLaunch 13,763 4.9%
Weekday Talkshow 13,763 4.9%
TV Schedule 11,640 4.1%
Radio Schedule 5,673 2.0%
TV Schedule 4,159 1.5%
Radio staff 3,749 1.3%
Radio Homepage 3,303 1.2%
Total for top-10 content: 165,567 58.8%
34,478 pgv = 12% of total

Ex. 2 RESOURCES 6 person staff Budget over $500,000 Leadership from the top Ability to Attract and Nurtures Web Talent
ANALYSIS OF BOTH CASES Overall… relatively low traffic Overall… infrequent visits More than 70% of visitors are once-per-month Many visitors come for support utilities
(program schedules , playlists, pledge)
Streaming media is their primary asset.
Recommendations
1. If you don’t promote it, don’t do it.
2. Put the basics in place: good navigation, program schedule, community events.
3. Get the PBS COVE player up and running.
4. Choose one or a very small number of local projects and concentrate your effort.
5. Personally, I would pick from public affairs or education.
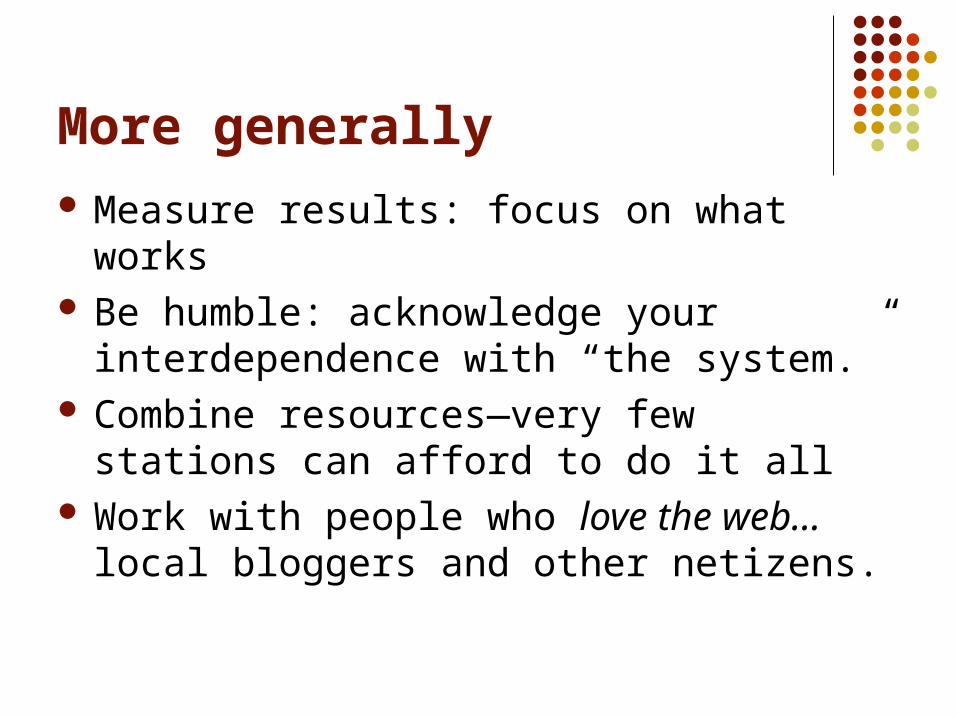
More generally Measure results: focus on what works Be humble: acknowledge your
interdependence with “the system.” Combine resources—very few stations can
afford to do it all Work with people who love the web… local
bloggers and other netizens.
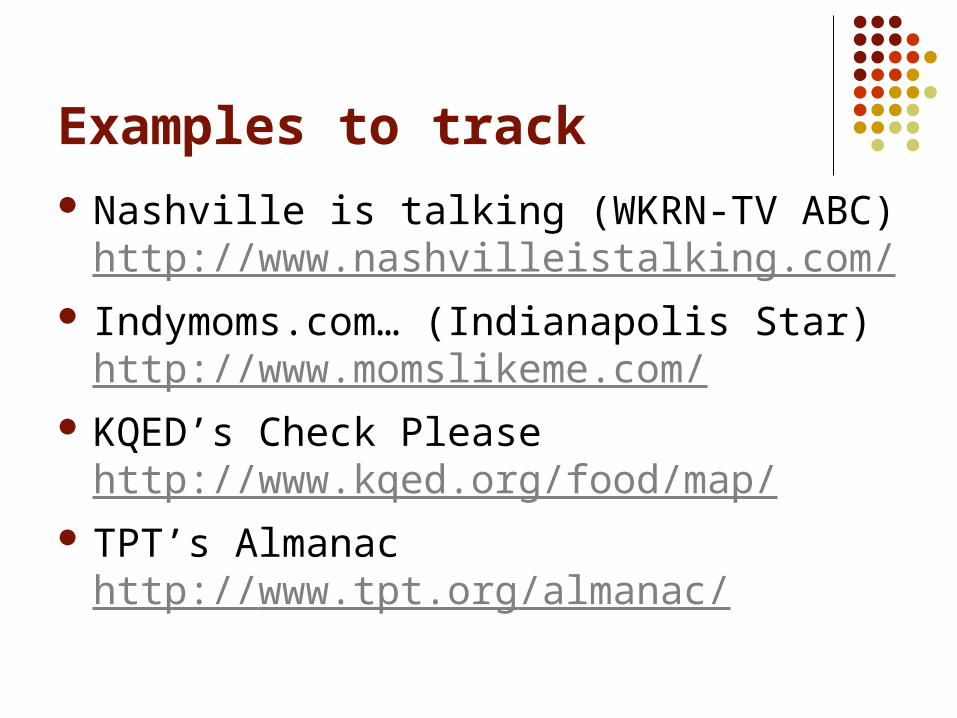
Examples to track Nashville is talking (WKRN-TV ABC)
http://www.nashvilleistalking.com/ Indymoms.com… (Indianapolis Star)
http://www.momslikeme.com/ KQED’s Check Please
http://www.kqed.org/food/map/ TPT’s Almanac
http://www.tpt.org/almanac/
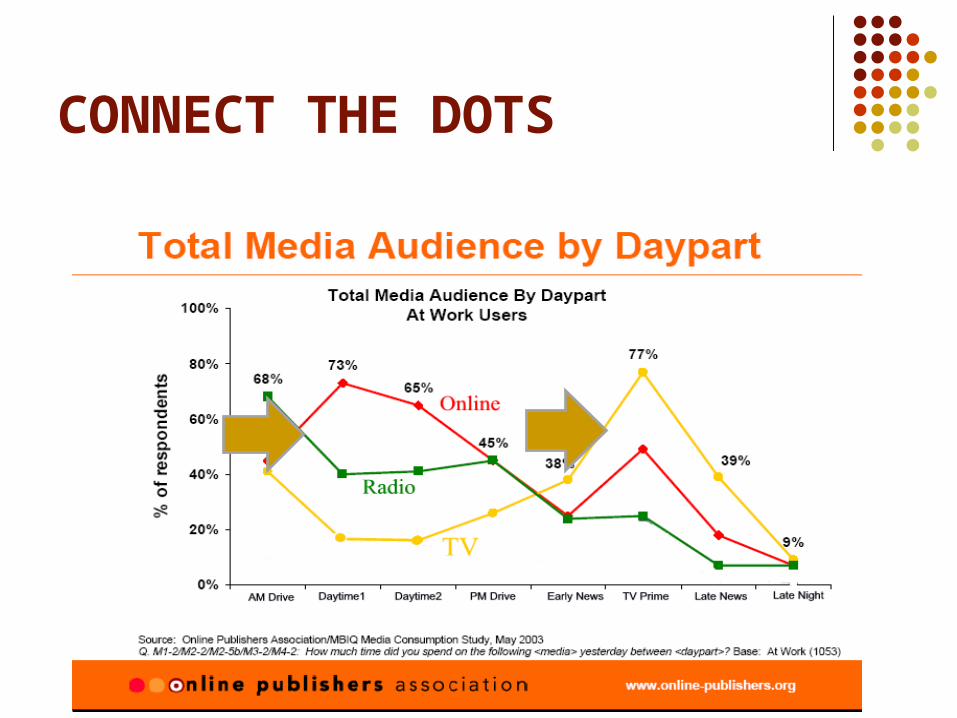
CONNECT THE DOTS