local government, fiscal autonomy and fiscal stress: the case of
TRANSCRIPT
Local Government, Fiscal Autonomy and Fiscal Stress:
The Case of California
Jeffrey I. Chapman
© 1999
Lincoln Institute of Land Policy Working Paper
The findings and conclusions of this paper are not subject to detailed review and
do not necessarily reflect the official views and policies of the Lincoln Institute of Land Policy.
After printing your initial complimentary copy, please do not reproduce this paper in any form without permission of the author.
Contact the author directly with all questions or requests for permission.

Lincoln Institute Product Code: WP99JC1

Abstract
This working paper defines and extends the concepts of local government autonomy and local government fiscal autonomy, examining them as potential necessary conditions for a Tiebout equilibrium. It then uses these concepts to investigate the effects of fiscal stress on local governments in California as they attempt to maintain their autonomy. The revenue and expenditure patterns of California counties and a sample of California cities are then examined, both before and after fiscal stress. In order to more closely understand the state/local fiscal relationships in the light of stress, a detailed examination of development fees and school financing is undertaken. Finally, the paper describes, in a series of seven mini-case studies, city and county actions to mitigate stress and maintain fiscal autonomy.

About the Author
Jeff Chapman is currently the Director of the School of Public Affairs at Arizona State University. He previously was Professor of Public Administration in the School of Policy, Planning and Development at the University of Southern California Sacramento Center. His area of interest is state and local public finance. He has written extensively about the effects of fiscal stress on local governments, with particular emphasis on the effects of stress on California jurisdictions. He has a doctorate in economics from the University of California, Berkeley; and a bachelor’s degree from Occidental College. He can be reached at:
School of Public Affairs Arizona State University P.O. Box 870603 Tempe, AZ 85287-0603
Phone: (480) 965-1046 Fax: (480) 965-9248 Email: [email protected]
The author would particularly like to thank the following individuals for their participation in the interviews, critique of the work, and their suggests for improvement: Michael Dennis, Gene Rogers, Tom Lando, Grant Brimhall, Carlos Urrutia, William parsons, Don Ishikawa, Glen Fisher, Al Sokolow, Fred Silva.

Contents
Local Autonomy 1
Extensions of the Definition of Local Autonomy 2
The Importance of Local Autonomy 3
Some Conditions for Local Government Autonomy 7
Efficiency 7
Constraints on Local Government Autonomy 7
Ways of Mitigating Fiscal Stress in an Attempt to Gain a Measure 13 of Local Government Autonomy—Some California Examples
Initiative Impacts 13
Immunity Impacts 16
Some Empirical Work Examining California Counties and Cities 17
The County as the Unit of Analysis 17
The City as the Unit of Analysis 20
A Different Way of Examining Local Government Fiscal Autonomy— 22 A Study of Development Fees
Development Fees 22
Points of Dispute 25
The Incidence of Fees and Exactions 28
Proposition 218—One More Time 29
Financing School Facilities 31
Case Studies of California Cities and Counties 42
Rocklin 42
Chico 44
Thousand Oaks 46
Moreno Valley 49

Santa Monica 52
Santa Clara County 54
Yolo County 57
Case Study Summary 59
Some Conclusions 60
Endnotes 61
Bibliography 68
Tables 72
Appendix 79
Appendix Tables 80
1
Local Government, Fiscal Autonomy and Fiscal Stress: The Case of California
There has been a recent and engaging debate concerning “big questions” in the fields of public policy and administration. Behn (1995) argues that big questions revolve around micro-management, motivation, and measurement. In turn, Neumann (1996) suggests that the big questions revolve around the structure and dynamics of public organizations that exist in an environment of complexity and chaos.
Perhaps the most insightful set of questions—at least for this work—comes from the formulation by John Kirlin (1996). Kirlin argues that for a question to be “big” it must address the issues of achieving a democratic polity, understanding social values and complexity, and the encouragement of social learning. From these criteria, he defines a series of questions, several of which directly address the institutional design of local government. In particular, he argues that the major concerns that face our communities are questions of the design of the instruments of collective action, tradeoffs between governmental structures based on function and geography, how society gains knowledge of choices, and consequences, and how to achieve goals. The extent of the existence of local government autonomy influences the answers to these questions.
Local Autonomy
There are multiple definitions of local government autonomy (LGA).1 The simplest, from Wolman and Goldsmith, (1990), defines local autonomy in terms of politics and essentially defines this concept as the government’s ability to have an independent impact on the welfare of the residents of the local jurisdiction. Some years later, Boyne (1996) expanded this definition by explicitly including within local government powers the ability to innovate, experiment, and develop policies that can vary by jurisdiction. Boyne argued that local governments should have enough autonomy to compete with each other in terms of service quality and quantity. Also in 1996, Kirlin further expanded the concept by changing government to governance, and defining governance capacity as the ability to make and carry through collective choices for a geographically defined group of people.2 Kirlin also argued that governance capacity includes more than any single government, but rather it is shaped by public laws, the interaction with other governments, and the availability of civic infrastructure.
The first part of this paper will continue the extension of the definition of local autonomy, and then examine why this concept is important with respect to Tiebout models. Within this part will be an explanation and extension of the theoretical constraints on local autonomy. The second part of this paper will discuss one of the necessary conditions for local autonomy to exist—local fiscal autonomy. This concept will be defined and elaborated and then utilized to illustrate the effects of fiscal stress on local autonomy. The third part of the paper will empirically examine the effects of fiscal

2
stress on local autonomy in California after the passage of Proposition 13, a dramatic tax cutting law. Parts four and five of the study will examine the state-local-judicial-private sector roles in the establishment of development fees and then take an even closer look at school facility fees as one component of development fees. Part six of the paper will examine some short case studies of five cities and two counties in order to elaborate upon some of the broad findings of the first five parts. Finally, the last part of the paper will explore some conclusions and suggest some additional future research.
Extensions of the Definition of Local Autonomy
Local government autonomy and governance
It is important to understand the differences between LGA and governance capacity as used above. Governance capacity deals with the ability of governments to make and carry through collective choices. This capacity is shaped by the other extant institutions in the geographic area—institutions such as constitutional rules (both state and federal), other governments at the same level, tiered governments, the courts, and the civic infrastructure, defined broadly to include such elements as the media, civic associations, and neighborhood associations. There is no summary quantitative efficiency or normative index available to measure governance. It is perfectly possible for a high level of governance capacity to lead to inefficient choices or choices that lead to a regressive distribution of output. This paper will defer an analysis of the normative dimension of governance issues, but rather will emphasis the efficiency dimension. Finally, this paper will principally address the implementation implications of the definition, since LGA is a necessary condition for the ability of local governments to implement governance decisions.
Aggregate local autonomy v. individual jurisdiction local autonomy
Boyne (1993), while accepting the Wolman and Goldsmith definition, extends the local autonomy concept by implicitly differentiating between local autonomy in the aggregate (that is all local governments are empowered to make certain types of decisions) from local autonomy at the individual jurisdiction’s level (there are differences in the abilities of jurisdictions to make some types of decisions). For example, in the context of the United States (Boyne applies his analysis to Wales), all incorporated jurisdictions have the power to ensure that some public protection is provided: however, not all jurisdictions have the same land use codes.3 Boyne argues that both types of autonomy need to be explicitly considered in any analysis.
Legal Autonomy
In the United States, there have been two basic and divergent theories regarding the division of power and responsibilities between states and units of local government: the local government as a creature of the state and the local government exists with inherent rights. The former theory argues that units of local government are created by and exist at
3
the pleasure of the state and traces its heritage to the 1868 ruling by the Iowa Supreme Court Justice John F. Dillon. In this ruling, Dillon, in supporting the rights of the railroads over locally enacted land use controls, argued that municipal corporations were mere “tenants at will of the legislature.”4 The second theory is based on the Jeffersonian principle that local officials can best manage local affairs, and thus units of local government have independent authority and autonomy. Dillon’s rule, which was the narrower line of reasoning, dominated because the popular culture at that time supported the rights of private property, as championed by the railroads and sustained the authority of the state legislature over city rights, as stereotypically exemplified by bossism, corruption, the spoils system and machine politics (Klaphake, 62).
Today, however, state supreme courts appear to be moving toward acknowledging the importance of the inherent rights doctrine, and are increasing supporting local control even in the context of presumptive state power. It may be that there is a beginning of the equating of local government autonomy with individual and family autonomy. The doctrine of the inherent right of local government may not be dead but merely dormant (Klaphake, 69).
Local government fiscal autonomy
Fiscal autonomy relates to the ability of the local jurisdiction both to raise enough revenues from the local economy and then to determine how to spend those revenues. While a later section of the paper will expand on these concerns, for the present, local government fiscal autonomy (LGFA) refers to the ability of the jurisdiction to set tax rates and establish the revenue base without outside influence as well as having the ability to provide the service levels that are demanded by the jurisdiction’s citizens.
Land use autonomy
Cities often incorporate in order to control their development patterns. They believe that they can utilize various land use tools to structure a community to reflect their tastes and preferences. To the extent that they are successful, they have land use autonomy. Logan and Molotch (1987, pp. 154-166) identify several land use tools that are used to implement aspects of local government fiscal autonomy: zoning, growth controls, mandating rigorous environmental impact reports, and tax increment financing. They argue that local power brokers use these tools not in the Wolman and Goldsmith context of improving the well-being of citizens, but rather to maximize the wealth of certain social classes in the jurisdiction. In this vein, Hamilton (1976) argues that the use of zoning can convert the property tax into a benefit charge for new residents. The property tax/zoning nexus is an implicit tool to maximize community wealth.
While it is possible for a local jurisdiction to have either fiscal autonomy or land use autonomy without the other, it is important to recognize their connection. In particular, land use controls can be used to augment fiscal autonomy in at least two ways. First, through the appropriate use of these controls, the jurisdiction can raise additional

4
revenues. For example, redevelopment finance can be used to stimulate commercial activities and thus increase sales taxes. Second, zoning can be used to prevent low-income residents from living in the jurisdiction, and thus there may be a reduced demand for some public services. If a jurisdiction loses the ability to raise taxes, it may push to increase its ability to control land use.
The Importance of Local Autonomy
Local government autonomy is important because it is a necessary condition for three crucial roles that local government plays: a value maximizer; an institution that potentially allows citizens to reveal their preferences for public expenditures; and, as a competitor with other jurisdictions so that efficiency conditions are satisfied.
Value maximization
Local government autonomy is important because it allows local jurisdictions to undertake activities that move to maximize the value (typically land value) of that community. Kirlin, (1996), following a broad stream of economics literature (see for example Sonstelie and Portney, 1978) argues that a function of local government is to make decisions in a variety of arenas that add value to place for each jurisdiction. In order to be able to make these decisions, the jurisdictions must have the political and fiscal autonomy necessary to allow them to differentiate themselves from other jurisdictions through the use of their maximizing activities.
Preference revealing mechanisms
The Tiebout model (1956) explaining the preference revealing activities of citizens is one of the crucial models of local public finance (Dowding, John, and Biggs, p. 767). Crucial to this model is the assumption that local jurisdictions have the ability to offer bundles of expenditures and taxes to attract a particular subset of the population who want the bundle. Although Tiebout models have been somewhat controversial (see Sharpe and Newton (1984), Lowery, Lyons, and DeHoog (1995), or Dye (1990) for typical examples) there is a large amount of evidence that confirms many of the implications of the model (Dowding, John, and Biggs (1994) and Teske, Schneider, Mintrom, and Best (1993), (1995) are examples). Without the capacity for autonomy, local jurisdictions may not have the ability to differentiate themselves from one another, and thus the Tiebout sorting mechanisms will not work. At least some degree of autonomy is therefore a necessary (but not sufficient) for a Tiebout equilibrium.
Dowding, et al. derive eleven implications from the Tiebout model and then review over 200 articles that can be examined as potential tests for these implications. The only implication that is both uncorroborated and falsified is that municipal integration is justified only if more of any service is provided at lower cost with no reduction in any other service. They urge additional research on the question of “do city managers provide the goods consumers want or do city mangers attract the consumers they want by the

5
goods they produce? Note that if local autonomy doesn’t exist, the second part of the question is irrelevant, since cities do not have the ability to change the bundle of expenditures and taxes.5
On the surface, it may appear as if there is a conflict between local government autonomy and the Tiebout model. After all, Tiebout maintains that competitive jurisdictions offer a fixed bundle of goods, services, and revenue sources to mobile citizens who choose among the jurisdictions. Given that these bundles must already exist, why is autonomy important? This paper argues that it is important in at least two time periods.
Essentially, Tiebout argues that the bundle of goods and services that is offered by a jurisdiction reflects the tastes and preferences of the citizens who live within the jurisdiction. Further, the jurisdiction will attract only those citizens who have tastes and preferences that match the existing inhabitants. The original citizens within a geographic area determine the original bundle. Implicit in this argument is the power of the government to provide and finance services that reflect the tastes and preferences of these original citizens. Local government autonomy is needed to match these original-state desires of the citizens. If nothing else changes, then autonomy becomes less important since only like-minded citizens will be attracted to the jurisdiction and the bundle will not have to change.
However, if an exogenous event occurs that effects this bundle, then it may no longer reflect the tastes and preferences of the jurisdiction’s citizens.6 This event may be of several types; for example, a new mandate for a specific type of service provision (e.g., the American Disabilities Act), an increase in an earmarked federal grant that skews service patterns (e.g., the crime prevention act which offered cities money for hiring police); a natural disaster (e.g., an earthquake that forces government to spend money for temporary shelters rather than for new parks) or a tax constraint that removes the option of increasing certain types of revenues (e.g., a tax limitation measure such as California’s Proposition 13). With this changed bundle, the current residents may become dissatisfied.
Citizens express this dissatisfaction by putting pressures on government to change back to the original bundle. To the extent that government has this ability, it is a manifestation of its autonomy. Governments with a high degree of autonomy have the ability to rearrange their affairs so the bundle appears similar to the earlier offerings that first attracted the citizens.7 However, governments with a low degree of autonomy do not have this ability. If the local government can return to the initial bundle, its citizens will become satisfied and the Tiebout model works as before. If governments are unable to return, the citizens remain unhappy. In this case, some will move, some will attempt to change government through the voting process, and some will remain unhappy.8 An additional confounding phenomenon is that the exogenous events that disturbed the initial bundle of services and revenues may also impact a jurisdiction’s ability to respond to these changes. For example, changed property assessment rules might reduce revenues as well as create financial barriers for citizens who desire to move.

6
Ultimately, there may be two conflicting forces that a formal change in local government autonomy might engender. With a decline in formal local autonomy, revenue and expenditure patterns among the same type of local government can no longer vary in the future, and, over time, may become more similar. However, to the extent that jurisdictions can find legal ways around the autonomy constraints, their revenue and expenditure patterns would differ, reflecting not only the tastes and preferences of the citizens, but also the ability of local managers to find ways around the formal constraints. Under this scenario, local government autonomy has been formally diminished, but in reality, it may not have changed.
There may be an additional complexity. If local governments compete in certain revenue areas, for example property taxes, the equilibrium levels of the importance of the tax may be very similar, analogous to one equilibrium price existing in a competitive market. It might be that there would be little variance among local governments on the controllable revenue side of the budget.
In order for a Tiebout equilibrium to be reached, jurisdictions need the ability to act in a Tiebout manner. In particular, they need to be able to change their bundle of goods, services, and financing mechanisms as events occur that potentially necessitate these changes. This paper addresses a tax limitation measure as the particular event which affects the jurisdiction’s autonomy and thus potentially affects its ability to react to changes.9
Local autonomy is a necessary condition for interjurisdictional competition. In turn, this leads to more avenues for consumer choice, which leads to a potential economically efficient solution.
Enhancement of competition and consumer choice
Boyne (1996, p.704) identifies three types of competition: among local agencies within a local government (budgetary competition); among alternative service providers (privatization v. jurisdictional provision); and, competition among jurisdictions. This is a competition for jobs and capital, both of which are mobile in today’s world. It is not necessarily a Tiebout type competition for population, but rather for providing the set of services that the resident population wants in the most economically efficient manner. It is this last type of competition that this paper addresses.
Given the existence of local autonomy, Boyne (1996, 708) argues that interjurisdictional competition is a function of the structure of the system and the extent of central funding. However, some elaboration of these variables is necessary for a more detailed understanding of the concept.
Boyne’s structural discussion centers on number and tiers of local government. The greater the number of each, the more competitive is the structure of the governance system. In addition, the lower the governmental level of the principal source of funding,
7
the more potentially competitive is the system. However, in terms of structure, without the existence of local autonomy, mere numbers and levels will not be sufficient for competition to exist. In fact, if the number of tiers is not a function of either spillovers or scale economies, there is a good chance that the number of tiers is inversely related to competition because of the political dynamics of a federalist system. In addition, the extent of central funding would affect local governments far more if it came with strings than as a block grant. But, even if the grant came with strings, the local jurisdiction, if local autonomy exists, still has the ability to turn the grant down. For example, although police protection in the United States is a highly valued service, some jurisdictions accepted money from the national government to be used to employ more police while other jurisdictions declined the grant because of the strings. Note that the concept of centralized funding is different from the parallel component on the expenditure side of the budget—the degree of existence of mandates from higher levels of government that dictate expenditure decisions. If every jurisdiction must provide the same level of a particular service because of service mandates, then regardless of the extent of centralized funding, there is a lessening of competition.10
Even if interjurisdictional competition exists, it will not be a sufficient condition for efficiency unless consumers are able to implement their choice of a jurisdiction. In order to be able to make choices, household consumers must confront three problems.
The first is whether consumers actually know about the different bundles of revenues and services that are being offered by the competitive cities. Although this is a controversial assumption, there is some evidence that indicates, at least for the marginal mover, the existence of knowledge (Teske, Schneider, Mintrom, and Best, 1993, 1995). It is probably reasonable to assume that labor and capital are aware of different expenditure and revenue bundles.
A second concern is whether or not there are enough governments(or bundles of revenues and expenditures) from which to choose. This is assumed to occur because of the competition discussion of above,
Finally, it is legitimate to ask if the household is able to move into a jurisdiction if it discovers that the jurisdiction offers a bundle of revenues and expenditures that would increase its utility. Even assuming that employment concerns are negligible (following Tiebout), there are still the existing problems of land use controls. For example, if a jurisdiction adopts large lot zoning in order to keep low-income potential residents from entering, the resulting equilibrium is likely to be different from one in which land use controls were different.11
Some Conditions for Local Government Autonomy

8
Efficiency
Allocative and productive efficiency require some heroic assumptions concerning inter-jurisdictional competition and the consumers’ ability to make and implement jurisdictional choices. However, a key concept underlying the entire analysis, is that of local autonomy. If local government autonomy (LGA) does not exist, then there are significant problems with the rest of the analysis of the benefits of preference revealing behavior and competition. The next section of this paper will examine the constraints on LGA and amplify the concept of local government fiscal autonomy.
Constraints on Local Government Autonomy
Local governments have substantial capacity to act to further their interests. Even the most constrained have some control over resources, have some regulatory powers, and have some administrative capacity. (Gurr and King, p. 24) Thus, even though local governments face the constraints listed below, they should not be considered impotent, although their local government autonomy represents constrained maximization.
Exogenous constraints
Local governments do not exist in isolation. Rather, there is a contextual framework that affects their activities. There are three types of over-arching exogenous constraints on local autonomy.
The first is a political philosophy constraint which represents the necessary trade-off between the citizens’ freedom to undertake any activity and the government’s responsibility (as derived from citizen preferences) to regulate some of those activities. To the extent that citizens would prefer to be unregulated, they will attempt to ensure that local government has less legal or economic power to constrain their activities.12 There is, then, a trade-off between individual autonomy and local government autonomy. This trade-off is a function of the prevailing political philosophy, the extent of citizen desire for equity concerns, and the need for safety regulations, open space, and a variety of other quality of life or economic distribution variables. The other side of this argument is that citizens’ constraints are part of the Tieboutian bundle. In this case, they are not part of the constraints facing the jurisdiction, but are rather preference revealing mechanisms. Further, it is quite possible that this relationship would be different when the citizen examines his role with respect to the national government as opposed to the local government.
A second constraint on local government autonomy is technical (Gurr and King, p. 21). In this case, there are both physical and knowledge limits to what government can do. For example, government cannot zone for a nursing home and a residential development on the same piece of land, or build a dam on a known earthquake fault. Nor does society yet have the knowledge as to how to eliminate crime or prevent the need for welfare. Local governments often have to engage these problems, yet do not have the knowledge or
9
ability to fully solve them. Their Tiebout bundles might not be the appropriate mixture to address the problems that jurisdiction faces, although the jurisdiction may think that the bundles are appropriate.
The final exogenous constraint are the leadership limits that local government administrators face as they manage complex organizations (Gurr and King, 22). There are always internal rivalries within organizations, potential waste in service deliveries, and competition with other local organizations, Sometimes referred to as X-inefficiencies, they imply that optimality is not likely to occur.13
In addition to these exogenous environmental constraints on LGA, there are two other types of constraints: these are based on extensions of Clark’s initiation and immunity components of autonomy (Clark, 198; Gurr and King, 57, 62). Initiation refers to the ability of local governments to devise new ways to carry out their responsibilities. The powers of initiation can be very broad or very constrained, depending upon the initial specification of the abilities of the local government compared to higher levels of government of the state. Immunity is the power of local governments to act without fear of the oversight authority of higher levels of government in the state. With no immunity, every local decision made would be reviewed, and potentially changed by the higher tier of government, even if the local decision was made within the limits of its initiative powers. As will be seen, although these are separate concepts, they are often interdependent.
Initiation based constraint components
Initiation measures the ability of a local government to attempt to try out new programs, methods of delivering programs, raise new revenues or utilize different methods of raising revenues. The greater the initiation measure, the greater the local government’s autonomy. The principal constraint on initiative powers is the set of formal and informal regulations that mandate or constrain ways of financing and providing services. In this sense, initiation may be a concept that is closely related to local government fiscal autonomy.
A necessary, but not sufficient, condition for local government autonomy is local government fiscal autonomy (LGFA). There is a difference between the local government autonomy of Wolman and Goldsmith and Boyne and local government fiscal autonomy. Local government autonomy is a far broader examination of the jurisdiction’s politics, its ability to respond to changes in socio-economic characteristics of the population, and its ability to respond to relative changes in aggregate community preferences. LGFA is a narrower concept. For the rest of this paper, it is this narrower concept that will be examined; once this is done, additional research can be implemented to examine LGA.
10
Command and spend resources The ability to command resources and the ability to spend those resources in ways that reflect citizen tastes and preferences are measures of local government fiscal autonomy. The greater these abilities, the greater the degree of local autonomy. There is local government revenue autonomy as well as local government expenditure autonomy. These variables are closely connected, but yet do not completely overlap. It is possible to have one type of autonomy without the other.
In earlier work for the Lincoln Institute (Chapman, 1998), it was argued in more detail that there are two components to fiscal autonomy: a gaining resource component and a spending resource component. While a jurisdiction does not need to have total control over each of the components. it should have the ability, at a minimum, to influence each of the components at the margin. Jurisdictions should be able to both choose and fund service levels.
The gaining resource component costs of: �� the ability to determine a revenue base �� the ability to change the revenue base �� the ability to set tax rates as well as prices for government services �� the ability to issue debt
The spending resource component consists of: �� the ability to determine initial expenditure patterns �� the ability to change expenditure patterns
Special interest groups Special Interest Groups can influence the ability of a local government to initiate activities.14 These groups can be of a variety of types. For example, if internal departments of the jurisdiction coalesce into special interest groups, they may begin to fight against each other in order to ensure adequate resources for their agency. This is not the same concept as the X-inefficiency exogenous constraint that refers to waste. Rather, this is Olson’s (1982) seizing behavior at the local level. For example, it is not unusual for the police department to argue the crucial need for funds at the expense of funding parks and recreation. A second type of special interest group would involve those in the community who are not employed by the local government. These private sector special interest groups, through their political power, attempt to shape the activities of local governments, and thus affect local government’s ability to initiate public policies. The NIMBY syndrome is an example of this.
11
Complexity Complexity is a third type of constraint that fits under the initiation rubric. Complexity involves both agency and bureaucratic problems and affects the ability of local government to implement many of its desired activities. In particular, agency problems revolve around the continuous multiple roles of both principals and agents—it is often the norm for any individual to be in both roles simultaneously because any local administrator is often involved in a multiple number of projects.15 As the organization of government moves from a strict hierarchical form to one that is flatter, this phenomena could become less pervasive. Agency problems are not completely separate from other problems of bureaucracy. If any action needs to be vetted within a hierarchical structure, and there are many checkpoints where analysis must be done in order to allow continuation, then there is an increasing likelihood that the project will never be implemented. Even if each principal and each agent in this bureaucratic hierarchy has a deep commitment to success, the odds are still very high that implementation will be unsuccessful, especially if there are a large number of checkpoints.16 Note that this argument relates to decisions within the local government. Tiered governments have not yet been introduced.
For the most part, initiative constraints tend to be more micro in character, since they affect local government’s actions within the context of that level of government. The second set of constraints are more macro in nature, since they involve the local government’s position in a relationship with a higher level of government.
Immunity based constraint components
Fiscal immunity constraints Immunity can be defined in terms of a higher-level government mandating expenditures, constraining local revenue-raising ability, and then (perhaps) funding, from central sources, those mandated expenditures. This fiscal type of definition defines the latitude that the local government has in terms of its ability to make autonomous decisions.17 Under this understanding, the greater the extent to which centralized funding, or at least funding from a higher level of government, occurs, the greater is the immunity constraint. Further, as Boyne argues (Boyne, 1996, p. 708), even if local autonomy exists, with a high level of centralized funding, interjurisdictional competition will not occur. This does not imply that if a local government faces declining central funding, or even a lower percentage of central funding, its autonomy automatically increases. Fiscally stressed communities (regardless of whether the fiscal stress comes from voter approved tax limits or deterioration of the economic base) will not necessarily have greater autonomy. Immunity may be an asymmetric concept. As central funding increases, autonomy falls, but not necessarily vice versa.18

12
Non-fiscal immunity constraints In addition to the fiscal definition of immunity constraints, there are also political and judicial dimensions to immunity. Political constraints on local government autonomy, i.e., legislation passed at the state or national level to regulate local government behavior, tends to be centered on issues such as justice or equity. The goal is to ensure that local governments do not mistreat their citizens compared to other citizens of the state or nation. Federal statutes dominate state and local statutes and state statutes dominate local statutes. To the extent that local jurisdictions attempt to engage in not-in-my-backyard behavior, the higher levels of government can overrule local levels. This becomes especially important in the siting of undesirable land use activities, such as dumps, energy plants, or freeways.
The legal autonomy discussion, as earlier referenced in this paper, is another representation of non-fiscal constraints. Here, Dillon’s Rule is the operative value. To the extent that states are willing to relax the powers that they have under this interpretation of the law, and engage in allowing cities and counties to exercise a modicum of home rule, the immunity constraint is somewhat tempered.
Once justice and equity concerns are addressed, the state may grant discretion to local governments through the use of home rule legislation, that is, local governments can undertake a wide variety of activities without receiving formal state approval. However, even in these cases, if local governments push the envelope too far, the state is likely to intervene and take back some of this power. For example, in California, some local governments enacted very draconian rent-control laws. It took about 15 years, but the state finally legislated against some of the most dramatic provisions and thus softened the laws.
Judicial constraints on local government autonomy can also exist. These are closely tied to the political constraints, since without the legal basis (derived through the political process), no judicial action can be initiated. However, if a society is particularly litigious, nearly any new activity by local government will end up in court, and often the fear of the transactions cost of doing something new will prevent the local government from exercising autonomy.
Coasian bargains A subcategory of the immunity constraint discussion involves potential Coasian bargains (Coase, (1960); Myles, (1995)). Even with home rule considerations, in which the state explicitly relinquishes control over the rights of local jurisdictions to levy taxes, there is still the possibility that the state will renege and take those rights away. This can be considered a type of Coasian bargain in which the property rights to the ability to receive tax revenues are the subject of the negotiation. During times of fiscal stress at the state level, there may be a reassertion of these property rights to specific revenue sources by the state to the detriment of the localities. In this bargaining arena, the values of politics

13
and publicity might appear, and local governments might be able to extract concessions (especially if, from the state’s perspective, these concessions can be moved to the future), even though the localities do not formally have the property rights to the revenue source.
This scenario occurred in California during the property tax shifts of 1992-93 and 1993-94.19 These Educational Revenue Allocation Fund, “ERAF” shifts represented the state’s reasserting its property rights over the allocation of the property tax levy. In a small bargaining group consisting of the Governor and the Senate and Assembly majority and minority leaders (the “Big Five”), the decision was reached to take away some of the allocation to local governments (primarily counties) and give it to the schools. This allowed the state to reduce its budget commitment to education. In return, the state allowed voters to decide whether a portion of the state sales tax should be eliminated or should the tax be allowed to become a local tax, earmarked for public safety. Later, the counties continued to negotiate with the state and received funding for trial courts. Ultimately, it now appears as if most counties have recouped most of the ERAF loss (Legislative Analyst, 1999). These final results came from small group bargaining and clearly defined property rights that technically reduced local government immunity, and also demonstrated the political appeal of funding public safety.
There is a distinct relationship between the initiative and immunity constraints. As the local government wishes to undertake more activities, thereby pushing at the initiative constraint, it must have more money. To get this money, it might have to go as a supplicant to the state. This is especially true if the voters have limited the alternatives for local governments to generate locally raised revenues. To the extent that the state funds the new activities, initiative ability has increased, but the immunity constraint has also increased.
Clark (199) develops a typology for local governments such that total local autonomy is defined as initiative autonomy and immunity autonomy (Type 1) while no initiative and no immunity defines no local autonomy (Type 4). In-between, are the initiative and no immunity (Type 2) and vice versa (Type 3). Clark ultimately argues that, in reality, American local governments are closer to Type 4 although ideologically, they are closer to Type 2. (Clark, 205).20
Fiscal stress and fiscal autonomy
Fiscal stress, especially if it is difficult to correct because of the institutional arrangements of the governmental sectors, can place additional constraints on fiscal and thus local autonomy.
There is no definitive definition of local fiscal stress, although there are several definitions that have been used in the literature. Chapman (1998b) defines fiscal stress as occurring when local government revenues fall without a compensating decrease in the demand for local government services; when citizens increase their demand for local government services and local revenues do not or can not increase; or when a higher level

14
of government violates the local governments’ immunity and forces the lower level to increase services without providing the necessary funding for the increased service responsibility. Sokolow (1993) gauges fiscal stress by comparing the percentage change in real revenues and expenditures over an extended time period. Bradbury (1982) defines fiscal stress as either “budgetary fiscal stress” or “citizen fiscal stress.” Budgetary stress occurs when a local government cannot balance its annual budget, with the greater the current account deficit, the greater the fiscal stress. Citizen fiscal stress occurs when residents face an increased tax burden for an average level of locally provided services (i.e., a jurisdiction’s service level changes exactly as the average of the service levels change for other jurisdictions) or as their level and quality of services falls for an average tax burden. Note that in this formulation, citizen and budget fiscal stress are closely related—as jurisdictions increase taxes to solve a budget fiscal stress problem, they cause a citizen fiscal stress problem.
Fiscal stress, under any of these definitions, occurs for two, often interconnected, reasons. The structural cause of fiscal stress relates to the built-in set of rules that the jurisdiction has enacted. These rules, whether formal laws or informal understandings, force the jurisdiction to behave in certain ways, including those that affect the jurisdiction’s fiscal condition. For example, a new development occurs and police must be provided to serve that development. If the revenues raised from the new development do not offset the additional expenditures, fiscal stress can occur. The cyclical cause of fiscal stress relates to the affect of the business cycle on the jurisdiction’s budget. If the jurisdiction has a very pro-cyclical tax structure (for example, a large dependence on sales and income taxes), then as the economy turns down, the jurisdiction will lose proportionally more tax revenues, and encounter fiscal stress. To the extent that the jurisdiction can take actions to offset this fiscal stress, it has fiscal autonomy. To the extent that it is forced to continue doing business in the same manner (low initiative powers) or is mandated by the state to provide certain services (low immunity power), it has limited autonomy.
Ways of Mitigating Fiscal Stress in an Attempt to Gain a Measure of Local Government Autonomy—Some California Examples
Given that fiscal stress exacerbates the inability of local government to attain local government fiscal autonomy and thus local autonomy, it is worthwhile to examine some of the activities that local jurisdictions have undertaken to attempt to alleviate fiscal stress and to maintain their autonomy. While these examples are from California, many of the techniques used are available to local governments in other states.
Proposition 13, a dramatic property tax reduction, was passed by the electorate in June, 1978. This generated a good deal of fiscal stress on local government. Ultimately, it affected both the initiative and immunity constraints on local government.

15
Initiative Impacts
There were at least three consequences of Proposition 13 that occurred as local jurisdictions attempted to maintain autonomy to undertake initiatives. Some of these consequences were unanticipated, at least by the authors of Proposition 13. Further, they were often interrelated and sometimes reflected causality.21
Consequence number 1: The fiscalization of land use22
Although land use decisions have always been recognized as having fiscal consequences, after Proposition 13 caused a reduction in property tax revenues, local jurisdictions began to pay even more attention to the fiscal outcomes of land use decisions. There are at least three specific examples of popular fiscalization activities:
�� Land use changes that generated revenues in addition to property tax revenues became more important. In particular, activities that generated additional sales tax revenues—especially “big-box” retail and car dealerships became popular.
�� Redevelopment activities, using tax increment financing, rapidly expanded; by the end of 1996 there were nearly 750 project areas in the state, generating a $1.4 billion tax increment that was used to support redevelopment debt.23 Much of the redevelopment spending was apparently used to provide new infrastructure for undeveloped land and to attract commercial activities that would generate new sales tax revenues. Redevelopment for the use of low-moderate housing was not emphasized.24
�� Development fees, to internalize the costs of public capital and services, became very important, at least in some communities. Prior to Proposition 13, the entire community would often share in providing infrastructure for new developments. After the proposition, this provision began to be thought of as the responsibility of the new residents and therefore fees were placed on the developers. One study has found that the total of these fees in some jurisdictions (per 2000 square foot dwelling unit) was over $24,000.25
Consequence number 2: The rise of arcane finance techniques
Poorly drafted initiatives lead to a cottage industry populated by very bright and ingenious people who delight in finding legitimate loopholes to enable local governments to maintain their autonomy. But a by-product of this is a public finance system that is very difficult for the public to understand. Some examples of this complexity follow:
�� Proposition 13 did not specify how the allocation of the property taxes that were collected under the one percent rate was to occur. The legislature ultimately responded to this vacuum through AB 8—an initially complex piece of legislation that has been adjusted several times to increase further its complexity. The ERAF shift is an example of this type of tinkering with AB 8. The result of this opaque method of tax allocation is a system that very few fully understand and a tendency for local officials to accept the resulting allocation as an exogenous input into the local

16
jurisdiction’s budgetary process. This also transforms the property tax into a state tax and thus other revenue streams must be discovered.
�� Education finance was difficult to understand even before the passage of Proposition 13 because of the Serrano court cases that mandated school districts to become less dependent on the property tax. The state was forced to became heavily involved in school finance and complex formulas involving both basic support and revenue limits were developed. After Proposition 13, the state took an increased role in financing schools by direct support, thus freeing a portion of the schools’ property tax that could then be reallocated to other local governments. Over time, this led to reduction in school spending, and in 1988 the California Teachers Association successfully sponsored an initiative that established a floor for K-14 funding. However, this floor quickly became an unintended ceiling, with the state funding the minimum and then turning its attention elsewhere. School districts discovered other ways of gaining money (for example, through the development fees as mentioned above or through foundations supported by parents), and ultimately the state engaged in the ERAF shift to reduce its responsibility. Just as AB 8 is now tortuous to understand, the school funding techniques are equally tortuous.
�� Financing capital facilities is now rarely done by debt approved by public votes Rather, for developed areas, much is done through the use of redevelopment techniques, as noted earlier, and through the use of Certificate of Participation (COP) debt instruments.26 These COPs can be issued by the legislative body without a vote of the general public, do not count against any formal debt limitations, and can become quite complex. Although they are not well known by many citizens, they are popular with all levels of government. Mello-Roos debt (named after the two legislators who carried the 1982 authorizing legislation), is typically used in undeveloped land that needs to have infrastructure. This debt can be used to finance both infrastructure and selected services for areas, which can be drawn in irregular shapes (typically excluding pockets of development). Two-thirds of the voters of the area or landowners representing two-thirds of the land of the area (who have votes distributed based on the amount of land that they own) can vote to issue this debt. As homeowners buy property in the area, their share of the debt shows up as an additional line on their property tax bill. The local jurisdiction is not the agency that issues the debt and is therefore not legally responsible for the security of the debt.
�� An additional way of financing some governmental activities is through the use of assessment districts. These districts, which are authorized by more than a dozen specific laws, allow nearly every type of government to establish a district that has the ability to levy a charge that pays for a public facility or service in direct relationship to the benefit that the facility or service confers on a specific property. By definition, the benefits of the infrastructure or service precisely equals the costs. Apparently, there are thousands of different assessment districts throughout the state, financing everything from landscape development to sewer maintenance. Assessments also show up on property tax bills. Slightly over $1 billion of assessment debt was issued during 1997.27

17
�� Local government entrepreneurial activities have also become important. Jurisdictions have now become partners with private developers, are in the tax subsidy business to attract economic development, and have entered into often sophisticated public-private partnerships. In many of these cases, the “deals” are very complex, not all details are revealed to the public (particularly those that involved private sector confidential balance sheet and income statements), and are technical in nature. Sometimes these agreements don’t work out exactly as planned (for example the deal that returned the Raider football team to Oakland from Los Angeles), and the jurisdiction may find itself liable for adverse fiscal consequences. One other type of entrepreneurial activity rarely occurs, but if it dies, fiscal chaos can result—the use of high-risk sophisticated investment techniques by local city or county treasurers. These techniques can generate large sums of money for the jurisdiction, but it must be remembered that they are risky.28
Consequence number 3: The increasing use of high technology
A final example of an attempt to engage in initiative activities to enhance LGA comes from the introduction of computer technology into local governments. There are numerous cases of local governments putting some of their services on-line to allow their citizens to interact with government as well as to access government information. For example, voter registration requirements and property assessments are now available through web pages for some counties. In other counties, the permit application and review process is now computerized which leads to an increase in the ability of local developers to more expeditiously obtain approvals. Ultimately, this technology should lead to an increase in efficiency, with the resulting savings being available for either tax reductions or service increases.29
The net result of these attempts to maintain fiscal autonomy was essentially no or very little change in real, per capita, total revenues and expenditures at each of the levels of government—at least in the aggregate (Chapman, 1998b). This led to a voter reaction.
The voters react
Perhaps because of the increasing use of fees and charges and assessment districts or perhaps because the legal system has been used to temper some of the components of the Proposition 13 restrictions, the voters in November, 1996, passed Proposition 218 (which is now Articles 13C and D of the California Constitution). This proposition will increase the pressure of local government’s General Funds and reduce their financial flexibility—they will thus have less ability to take advantage of their initiative power.
This measure has three major provisions: 1. It expanded the restrictions implemented by the 1986 Proposition 62 on raising taxes
to charter cities. Now, all cities and counties need a two-thirds vote to impose or raise

18
special taxes and all general taxes must obtain a simple-majority voter approval to impose or raise general taxes.
2. It established new procedures for imposing or raising assessments and certain fees. If an existing assessment was previously approved by the voters, with all of the assessment proceeds pledged to bond repayment, and if all the assessment proceeds are used to pay for sidewalks, streets, sewers, water, flood control, drainage systems or vector control, then it is exempt from the Proposition’s requirements. If not, a new election must occur with the votes weighted in proportion to the amount of the assessment each property owner would pay. A weighted majority is needed for the existing assessment to be maintained. All new assessments must be voted upon and must pass the weighted majority rule.
3. The power of the voter to reduce and repeal taxes, assessments and fees through the initiative process is enhanced. If a fee is not property related, it is not covered by the Proposition. If it is property related, it cannot be used to pay for a general governmental service (such as police or fire), it cannot be used for a service not immediately available to the property owner, and it cannot be used to finance programs unrelated to the property-related service. Fees cannot be greater than the proportionate cost to provide the property-related service. For new, property related fees, a voted is needed if the fee is for any service other than water, sewer or refuse collection. The local government can define the electorate as being either property owners (and renters responsible for paying the fee) in the affected area or the electorate in the affected area. The majority of property owners or two-thirds of the general electorate must approve.30
The current legal status of Proposition 218 is constantly being adjusted by relevant court decisions. The section of this paper on development fees discusses some additional subtleties of Proposition 218 as well as the most recent Proposition 218 court rulings.
It is clear that, at least with respect to the ability of raising revenues to provide services, the voters do not want local governments to have much initiative power. Whether or not local governments will be able to have any of this power is an empirical question.
Immunity Impacts
When the state was confronted with its fiscal stress, it reacted by implementing additional service requirements on local governments along with providing additional revenues that potentially affected the local governments’ relationships with the state government. Particularly, the state engaged in a realignment of county programs and revenues in order to sort out a set of convoluted relationships that had been developing for over 100 years.31 As part of realignment, the state transferred mental health, public health, and indigent health care programs to the counties and increased many of the cost-sharing ratios for social services that the counties had to pay. To finance this cost increase, the state raised its sales tax by 1/2 cent and increased the revenues to the counties from vehicle license

19
fees. Revenues were initially short by about $229 million, but there have been no later studies to later examine whether counties were net gainers or losers.
Since there was this shortfall and since the state did not change its eligibility requirements for participation in the programs, it initially appears as if the immunity constraint were increased. But because the counties now received a defined, relatively steady, stream of revenues and because this stability allowed the counties to allocate resources more efficiently (especially in the area of mental health), overall realignment did help to define more clearly the state-county relationships. Ultimately, this clarity should help to relax the immunity constraint.
A second state action that affected local governments’ fiscal ability that would fit under the immunity rubric would be the state’s shift of property tax revenues away from cities and counties to schools through the establishment of the Education Revenue Augmentation Fund (ERAF). As earlier discussed in this paper, this shift first started in an almost ad hoc manner 1992-93, and was formalized in 1993-94. Currently, this is over a $3 billion shift. Part of this shift is mitigated by an additional 1/2 cent sales tax approved by the voters in 1993. However, this money is earmarked for public safety, so local governments have less flexibility in how it is spent and it further reinforces much of the sales tax attracting activities that are engaged in by local governments.32
In addition to the realignment and ERAF consequences on immunity, there has also been a recent direct legislative/initiative action that has effected local government immunity. This serves as a useful example of a Coasian bargain that was ratified by the electorate that directly limited the ability of local governments to increase specific fees on new development.
Prior to Proposition 13, when school districts wanted to build schools, they typically asked for voter approval of bonds that were backed by the property tax. After Proposition 13, this became more difficult33 and school districts utilized their ability to impose fees on developers, have urged cities to establish Mello-Roos Districts to finance new education services and capital, and/or imposed additional charges. As part of a compromise to pass the 1998-99 budget, the “Big 5” agreed to place on the ballot a $9.2 billion bond package to help finance school construction on a matching basis with local school districts.34 In return for this match, the state imposed limits on the amount of charges that the school districts and local governments could levy on developers. The measure passed in November 1998. Taking away this power is a decrease in the immunity that local governments experience.
Some Empirical Work Examining California Cities and Counties

20
The County as the Unit of Analysis
California counties have multiple roles. They are the administrative arm of the state and are thus responsible for ensuring that state programs, such as most public assistance, public protection, and health, are provided to the entitled population. In addition, counties are also responsible for the provision of local services and providing local facilities to the unincorporated area within their boundaries. These services and facilities include law enforcement, wasted collection, and roads and parks. Note that provision is broadly defined, since counties may contract with cities, or other public, not-for-profit or private agencies to provide some of these services. Finally, counties also provide county-wide services, such as tax collection and jail operations.
Revenues
Table 1 shows the basic county revenue sources in 1996-97, while Table 2 shows the revenue sources in 1977-78, the year proceeding Proposition 13.35
Counties are clearly doing poorly with respect to the immunity dimension. The average aid they receive from the state constitutes over 43 percent of their budget while their average aid from the national government is 19.5 percent. Together, this aid constitutes 63.6 percent of their budget. Of course, not all of this aid is strictly exogenous—there are state programs which give aid on a matching basis so the counties do have some control, but the general thrust is that most of the aid is not subject to county discretion. In addition, the property tax must be considered principally exogenous to county decision making—the rate is state by the California Constitution, the acquisition standard to determine the assessed base is also set by the Constitution, and the formula for the allocation of the collected taxes is set by the state legislature.36 Since property taxes compose nearly 13 percent of the county revenue, this implies that about 76.5 percent of county revenue is not under county control. Also, although the coefficient of variation is relatively small, (although see below for a comparison of this coefficient to 1977-78), the largest percentage of the property tax revenues derived (in Mono County with 31.1 percent) is more than five times the smallest ( in Orange County with 5.9 percent).
Analysis of the initiative dimension generates mixed results. Since this dimension measures the ability of a local jurisdiction to generate new activities, it would be expected that high coefficients of variation, indicating a variety of ways of raising revenues, would be associated with a high level of initiative freedom. Most of the coefficients of variation are relatively small—ignoring the small categories of other aid, benefit assessments, and other revenues which generate in total about 2.3 percent of the jurisdictions revenue—there are no coefficients greater than .81 and five are less than .5. However, the range between the high and low for any revenue source is often substantial. With the exception of state and federal aid, which are generally exogenous to the jurisdiction, the lowest multiple (high divided by low) is about five—that is the role of any particular revenue source for the high jurisdiction is about five times that of the low jurisdiction.
21
These 1996-97 results can be compared to the results of a similar set of calculations for the last pre-Proposition 13 year, 1977-78. As Table 2 indicates, aid from other governments was about 51.6 per cent of total revenues. Since the property tax, at that time, was strictly a local tax (the base was determined by the assessor, the rate was determined by the local decision-making body, constrained by voter demonstration of tastes and preferences, and the allocation of the tax was directly to the jurisdiction levying the tax), it appears as if immunity was higher in the pre-Proposition 13 time period. Interestingly enough, examining the initiative dimension, the coefficients of variation were about the same or less in the earlier period. All of the important revenue sources had coefficients less than .76. Further, there were fewer outlyers in terms of the multiples of high versus low importance, where only three of the sources had multiples greater than five. Using this data, it appears as if there was less revenue initiative in the earlier period than in the more recent era.
A potential explanation for this might be the interpretation of the coefficient of variation as a measure of interjurisdictional competition. Just as in a competitive market, there should be less price variation as the degree of competition increases, it may be that there should be less variation among the importance of revenue sources if the jurisdictions were competing with one another. Since the coefficients of variation for property taxes, other taxes, and use of money and property are smaller in the 1977-78 fiscal year than in the 1996-97 fiscal year, it might imply that the tax area was the one in which competition was occurring in the earlier time period. Conversely, when taxes become less important (and the property tax taken out of the local government’s control) in the later year, the arena for competition moves to become that of licenses, permits, and charges. Under this interpretation, it is competition that restrains the initiative dimension, not some exogenous force, at least with respect to revenues. This makes heuristic sense, since local governments do not want to become known for the intricacies or extensiveness of their tax system. This is also consistent with the Tiebout argument since it implies that local government managers (and finance directors) are aware of other jurisdictions revenue systems and react accordingly.
Expenditures
Tables 3 and 4 show the principle components of the expenditure side of the county budgets. Although what is a mandated expenditure is sometimes controversial, it can be reasonably argued that the greater the level of mandated expenditures, the lower the ranking on the immunity scale, since the county will be utilizing its resources to provide packages of services not determined by its specific residents, but rather mandated by the state.
If it can be assumed that all of the health, sanitation, and public assistance expenditures are mandated, than, as Table 3 demonstrates, in 1996-97, at a minimum, slightly over 45 percent of county expenditures were mandated.37 In addition, county officials sometimes argue that protective services are mandated, since the state often defines the criminal code and that courts and prisons are not discretionary. Including public protection, brings

22
the minimum mandate level up to over 75 percent of total expenditures. Of course, since the salary schedules of the county workers (including sheriffs) are not set by the state, but are the result of some sort of collective bargaining agreement, those workers employed in the criminal justice system have a discretionary component as part of their total costs. The variance on pay scales would affect the initiative scale.
The relatively small coefficients of variation are consistent with this argument. With the exceptions of public ways and recreation and culture, about 9.3 percent of the budget, these coefficients are all less than or equal to .65. Interestingly enough, the coefficient is smaller for the total of protective services than for the directly mandated health and welfare components. To the extent that counties compete with each other, it would be expected that protective services would be one element of competition (or at least a surrogate for safety in the minds of the mobile inhabitant), and thus—unlike the price which should show small variation—protective services should show more variability.38 The ranges for the categories again show wide differentials. Most are about five or under, with a strikingly low multiple of about two for protection. The widest ranges are in public ways, health and sanitation, and other categories. With the exception of health, there are significant elements of discretion in these categories.
Since most of the policy decisions are made at the state level, immunity concerns may be an issue for counties.39 There may be more of a desire to do less rather than to expand innovative programs that are new. The county concerns may be to improve how to do what is necessary in a resource constrained environment.
Table 4 provides the statistics for 1977-78 county expenditures. Protection is lower (and still has a very low coefficient of variation), and general government is higher (with a larger coefficient of variation). Smaller changes also appear in the public ways category (higher in the earlier year) and in health and sanitation (higher in the later year). The other categories are about the same proportion of the budget. The coefficients of variation are also small, with no apparent discernible pattern between the two years. As in the later year, the range for the public ways, recreation and culture and other seem to be larger than the other categories (only health drops out), so the interpretation advanced above still may hold.
Overall, counties may have some small degree of autonomy. Over time, they have cut the importance of their general government expenditures by over a third, and have increased their protective expenditure importance by about forty percent. Both of these activities are in response to citizen demands. However, it is close to a zero sum game between these two activities—their total portion of the budget has changed by about 1.8 percent over nearly twenty years. But the coefficient of variation is still small, and these categories have the smallest range, so the level of autonomy for these two categories is not exceedingly high.

23
The City as the Unit of Analysis
Although California cities can be divided into General Law and Charter City classifications, with Charter Cities having more fiscal authority than General Law cities, the distinction has been gradually blurred through state and initiative actions. After Proposition 218, for the purposes of this paper, the distinction becomes trivial. California cities can be full service cities, responsible for providing the full range of municipal functions or contract cities, which provide some services and contract with a variety of service providers (including the county and the private sector) for other services. Although California is a home rule state, the legislature and voters have often significantly restricted these powers. The basis for the empirical work presented in this next section is a stratified (by population) random sample of California cities. The appendix compares the fiscal characteristics of these cities with the aggregate state data for cities.
Revenues
Table 5 shows the relative importance for the sample of the various revenue sources for 1995-96 while Table 6 shows the same sources for 1977-78. In 1995-96, nearly 75 percent of the revenue of these cities comes from sources that are controlled (to some extent) by the city. Only about 16.4 percent of city revenue comes from intergovernmental aid, while another 9.5 percent comes from the property tax, which, as argued above, is no longer a locally controlled revenue source. 40Both sales taxes and other taxes surpass the property tax as a revenue source for this sample of cities. From this perspective, the immunity dimension of local autonomy is at least partially met.
The coefficients of variation are relatively small, with the exceptions of benefit assessments, county and federal aid and other. However, together, these three categories together are only about 3.6 percent of total revenues. The sales tax, other tax, and service charge categories have the smallest coefficients, which under the interpretation advanced above, would indicate that they are the most competitive tax sources. In general, with these low coefficients, it appears as if the cities were somewhat constrained in their ability to initiate different ways of obtaining revenues. Only the benefit assessment category, still a small component of total revenues, but one which was not even itemized in 1977-78, has a relatively high coefficient, which could be interpreted that this source has not yet been constrained by outside sources. However, Proposition 218 significantly increases the constraints on this source.
Somewhat surprisingly for these jurisdictions, unlike counties, the dependence on outside aid was higher prior to the passage of Proposition 13, when over 38 percent of the cities’ revenues came from other governments41 than in the more recent year. It may be that cities have discovered or utilized their initiative powers to reduce the immunity constraint. This is consistent with the finding that in the earlier year, the property tax, and sales tax were much more important than the other sources of revenues. This importance has declined over time.

24
Coefficients of variation increased for three of the revenue sources between these two time periods—property tax, sales tax, and licenses, permits, fines, and forfeitures. Under the argument advanced above, this implies that there is less competition among cities with respect to these three sources. While this makes sense for property taxes, and the licenses, etc. are not an important revenue source, this finding is not consistent with the role of the sales tax, and the competition for sales tax revenues. However, with falling coefficients implying a more competitive environment, service charges, other taxes, and other revenue sources are consistent with this argument.
Expenditures
Tables 7 and 8 show basic expenditure patterns of 1995-96 and 1977-78 respectively. Because cities face far fewer mandates than counties, it is to be expected that they should show greater changes over time as they respond to changing populations as well as large coefficients of variation. Note that on the expenditure side, the larger the coefficient of variation, the more competition and thus the more likely a Tiebout scenario would occur. This is precisely opposite to its interpretation on the revenue side.
In 1995-96, as expected, public safety dominates city expenditures, receiving over one-third of the city’s expenditures. Further, the police component of this category, about 24 percent of the total, has the smallest coefficient of variation, implying that there is relatively little variation among cities in the budgetary importance of police expenditures. Public works receives another 23 percent of city expenditures and has the second smallest coefficient of variation, again implying little competition. City owned enterprises and public utilities is the third most important category, with about 20 percent of total expenditures. Thus, nearly 80 percent of city expenditures takes place in these three categories. Finally note that the general government category takes about 14 percent of the city expenditures.
There are remarkably few differences between 1977-78 and 1995-96 expenditure patterns. The principal differences were in general government, which in 1977-78 was almost 32 percent of city expenditures and was the largest category, and the enterprise and public utility grouping which in 1977-78 was the second smallest category, comprising less than one percent of city expenditure responsibility. Further, general government had a very low coefficient of variation (only the police coefficient of variation was lower) and the enterprise/utility category had a very high coefficient of variation. Between 1977-78 and 1995-96, the general government category fell by more than half (and saw an increase in the coefficient of variation which nearly doubled).42 During this same period, the enterprise/utility category increased by more than 20 times, absorbing nearly all of the percentage decline of general government. As the importance of this category increased, the coefficient of variation declined, implying more of a standardization of services. Finally, despite the often voiced concern about major cutbacks in libraries, parks and recreation, this stratified sample shows negligible change in these categories: libraries fell from 1.3 to .9 percent; parks and recreation fell from 7.9
25
to 7.4 percent. However, both of their coefficients of variations slightly increased, implying a slightly greater degree of variation in the later year.
It does not appear as if there has been much change in city expenditure patterns, although, with the exception of police (where the coefficient of variation is virtually the same) and enterprise/utility (where the coefficient has fallen implying less competition), there is a general increase (albeit small) in the remaining coefficient of variation, implying small increases in competition. This might mean slightly increasing initiative patterns, although additional work is necessary in order to be more definitive in conclusions.
A Different Way of Examining Local Government Fiscal Autonomy— A Study of Development Fees.
The first section of this paper illustrated that there is a considerable complexity in establishing the level of local government autonomy, both in the general definition of the concept and its application. At an aggregate level of analysis, that section demonstrated that counties have lost a great deal of local control of revenues and have also lost a great deal of their ability to make up those revenues, and thus on both the initiative and immunity dimensions have lost ground, at least with respect to local fiscal autonomy. Cities seemed to have maintained at least some of their autonomy, with perhaps declining importance of intergovernmental aid and an increase in the importance of fees and charges.
But this is an aggregate conclusion. It is worthwhile to examine one strand in this multistrand package in the hopes of further refining the concept of local government fiscal autonomy. By tracing through the utilization of developer fees as they have been affected by the electorate, the state, local government, the courts, and developers, a portion of the concept of local government fiscal autonomy can be enhanced. In the first half of this current section, the paper will discuss the complexities of development fees in California and attempt to illuminate the relationship between the way that the fees are set and implemented and local government fiscal autonomy. An even more detailed analysis (but, unfortunately still simplified) of school facility financing through local fees and state matches constitutes the second half of this section.
Development Fees43
Local development fees in California reflect the interaction of state and local government, the judicial system, the electorate, and the private developer. The State both authorizes and constricts through the relevant Government Code sections; the developers lobby at both the local and state levels for legislation that constrains the right of the local government to set the fees, the electorate has passed initiatives that constrain local government in the setting of these fees, and the courts have often ruled in a manner that potentially circumvents the electorate, local governments, and the state. This multiplicity of actors may both enable and constrain local governments in their search for autonomy.
26
It may be that the more actors, the more potential niches in the system in which local governments can escape some of the constraints (although usually once the escapes become apparent, the niches disappear). But, it is more likely that this multiplicity ends up reducing local government autonomy, since each special interest is determined to protect its benefits, even at the price of hurting the other players. Protecting benefits will ultimately lead to more constraints and thus less autonomy.
For most of this discussion, unless otherwise noted, the paper will follow the Office of Planning and Research (OPR) definitions of fees and exactions (OPR, 25)—they are “direct charges or dedications collected on a one-time basis as a condition of an approval being granted by the local government.” Exaction is a broader term, that includes impact fees as well as such requirements as mandating that the developer dedicate land for parks, roads and other improvements. These fees and exactions are designed either to cover the costs of the new infrastructure or facilities that are necessitated by the new development or to mitigate some of the other problems that the new development may cause—for example, school overcrowding. Finally, this paper will not discuss permit and application fees which are designed to cover the costs of permit and development plan processing or regulatory fees.44
Local governments have the ability to impose exactions through the use of their police power (California Constitution, Article XI, Section 7) and/or specific state enabling statutes, such as the Subdivision Map Act (Government Code section 66410, et seq.)45. The courts have held that a taking does not occur as long as the land use regulation both substantially advances a legitimate government interest and does not deny the owner an economically viable use of his land.46 In 1987, under AB 1600 (Government Code 66000, et seq.) procedures and standards for most developer exactions and fees were established. Before a fee is established, increased, or imposed, a city or county must: �� Identify the purpose of the fee �� Identify the use of the fee, including the identification of the public facilities affected
by the fee �� Determine how there is a reasonable relationship between the fee’s use and type of
development project on which the fee is imposed �� Determine how there is a reasonable relationship between the need for the public
facility and the type of development project on which the fee is imposed. �� Determine how there is a reasonable relationship between the amount of the fee and
the cost of the public facility or portion of the public facility attributable to the development on which the fee is imposed.
After collecting the fees, the revenues must be kept in separate accounts; not commingled with other revenues; spent only on the purpose for which they were collected; and, have all of the interest earned by the management of the unspent fees placed back into the specific fee fund and be spent on the purpose for which the fee was originally collected. In addition, the local government must prepare a public report and review that report at

27
public hearing.47 In 1994, the Northern California Building Industries Association surveyed 29 jurisdictions to determine if they were in compliance with AB 1600 and found (Senate Committee, 1995): �� Impact fees were co-mingled �� Interest earned from unspent fee revenues was not remitted back into the correct
account �� fees collected for mitigating impacts from the new development were spent on
community wide projects48 �� basic reporting requirements were not satisfied �� exorbitant administrative costs were sometimes charged �� AB 1600 compliance was treated with indifference
Because there are so many different types of fees and so many different overlapping jurisdictions that can impose fees, two conclusions stand out. The first is that without a very in-depth case study approach, many fees will not be identified. For example, you would need unpublished figures from several different Controllers Reports to capture all of the fees that any new development would face. The second is that the total of these fees can be quite high: the case studies that have occurred indicate that, for example, in San Diego County total development fees in 1994-95 (including permit fees) range from $8,372 to $24,767 (Sen. Comm., 18).49 Dresch and Sheffrin study (49-50) found that, in 1994, Contra Costa County fees ranged from $11,993 (or 6.9 percent of the sales price) to $34,638 (or 19.4 percent of the sales price).
Fee opportunities
The process for obtaining permits for new development gives rise to a large number of opportunities for the local government to require an exaction or fee as a condition for approval. Ultimately, a fee or exaction can be used for a large number of different purposes, for example, streets, sewers, drainage, parks and off-site improvements, fees for building child day care centers in commercial buildings, public art, the financing of a municipal transit system, provision of low- or moderate-income housing, library sites. police stations or fire stations (Curtin, p. 196). In particular, there are four basic opportunities for the local government to impose an exaction or fee.
1. The General Plan: California courts have held that the general plan of the jurisdiction is the “constitution for development” (Curtin, p. 196). Dedication requirements can flow from these plans, since all land use approvals have to be consistent with the general plan, To ensure this consistency, conditions can be attached to any development project. For example, the court has held that a city ordinance requiring smoke detectors be installed in a condominium conversion project based on conformity with the city’s general plan to promote safe housing.50 Some cities have amended their general plans to include a variety of public goods—for example child
28
care centers, libraries, and fire stations and have then adopted ordinances, based on the new general plan, to require developers to pay a fee for these purposes (Curtin, 197).
2. Subdivision exactions: The Subdivision Map Act (Government Code section 66410 et seq.) gives cities and counties the authority to impose fees or exactions for specific uses as a condition for plan approval. In some cases, the local government must pass an enabling ordinance, which the Map Act gives them permission to do. In other cases, exactions can be imposed directly under the Map Act, without the adoption of a local enabling ordinance. Examples of exactions or fees that can be adopted under these two opportunities range widely. They include not only the usual lists of streets, bike paths, transit (for more than 200 dwelling units or 100 acres), parks, school sites, and bridges but also address such concerns as sunlight easements, groundwater storage and recharge facilities, and libraries. In addition, public access provision to public waterways, coastal and bayshore facilities, and lakes and reservoirs may be required (OPR, pp. 26-27). Curtin also notes that environmental mitigations can be imposed through the California Environmental Quality Act (Public Resources Code, Sections 21000-21177) and that some conditions may be mandated through the design and improvement sections of the Map Act. (Curtin, 197).
3. Building permits and certificates of occupancy: The issuance of a building permit is not a right; under certain circumstances that can be treated as discretionary and requirements, typically in the nature of exactions, can be placed as conditions of issuance. For example, the appellate court upheld a transit development fee of $5 per square foot of new office space to benefit the San Francisco municipal railway system.51 The fee was imposed on developers seeking building permits for office development and it was to be paid as a condition to be met before the certificate of completion and occupancy could be issued. (Curtin, 197-198).
4. School district facilities fees: This will be discussed in more detail in the second half of this section. Briefly, however, in 1985, the State Supreme Court held that a city could impose fees on new construction to mitigate impacts on school districts.52 In 1988, under pressure from developers, legislation was passed to cap these fees, but a series of court decisions (Mira-Hart-Murietta) drove significant loopholes into this cap. Proposition 1A, of November, 1998, (a comprise bill heavily affected by developer pressures) closed these loopholes until 2006.
An argument can be made that local governments have a good deal of flexibility in their ability to utilize developer fees. Many of the local governments have taken advantage of this flexibility and have implemented a variety of fees—some quite extensively. This appears to be one area in which local governments can show initiative in developing new revenue sources. Further, for the most part, the courts have upheld their rights to do so. However, it is not always easy for jurisdictions to fully utilize this power, because developers have the ability to develop somewhere else, and, as was demonstrated in the

29
field of educational finance, sometimes have the ability to influence legislation which decreases the immunity power of the local government.
Points of Dispute53
There are several points of contention surrounding development fees. Typically, these points do not involve state-local relationships, but rather private sector developer versus local government in a Coasian bargaining situation. The private developers, however, often invoke their interpretation of state statute, so inadvertently, the state becomes involved. In a certain sense, these points of dispute do not involve local autonomy, but rather how the local bundle of goods and services is constituted and paid for. In any case, a brief mention of a few of the major disputes helps to better understand the multiple interrelationships. Further, the disputes themselves are interrelated—especially the debates concerning development as a privilege or right and the nexus requirement.
Is development a privilege or a right?
The conceptual framework for development exactions is straightforward. The developer recognizes that the development will cause an increase in the amount of necessary services or infrastructure that the local government must provide. The local government understands that it needs additional money to provide the services and infrastructure. The local government, in exchange for allowing the development to occur, will thus force the developer to offset these costs through reasonable fees and exactions as long as there is a legal nexus. The theoretical argument becomes a practical argument over the extent of the exactions, the incidence of the exaction, whether the fees are really special taxes, and whether a taking has occurred.
Exactions, whether fees or land dedications, have been repeatedly upheld to be voluntary in nature by California courts. The argument is that even though the developer cannot legally develop without satisfying the fee or exaction, the act of development is itself voluntary. However, what constitutes a reasonable exaction is not determined by a precise formula but is rather determined by an ad hoc analysis of each case by the court (Curtin, 181). This analysis will include an examination of the development size, the demand for services, the burden created by the development, and its overall effect on the city and the surrounding communities.
Although there has been a great deal of controversy concerning whether development is a privilege or a right, in California the courts have consistently maintained that there is no right to develop, but rather, in most cases development is a privilege, with fees triggered by the voluntary decision of the developer. It is clear, based on court decisions, that a property dedication condition will be upheld if it substantially furthers a legitimate governmental interest (such as view protection, parks, or streets), if the condition furthers the same governmental purpose advanced for regulating it, and if the required nexus exists.54
30
The nexus requirement
The particular issue in this category is to what extent and in what amount can the exaction be imposed. The question is one of relationship (nexus) of the fee to the governmental interest. Generally, California case law has required a nexus, although in 1971, the California Supreme Court rejected the necessity for a direct relationship; rather the nexus could be based on a general and broad public welfare definition.55 The Supreme Court has also required a nexus in a series of cases, culminating in the Nollan decision which was later followed by the Dolan decision.56 In Nollan the California Coastal Commission wanted the owners, who were going to build a two-story house, to dedicate a public access easement to assist the public in viewing the beach and to overcome a perceived “psychological barrier” to using the beach. The Court held that although protection of the public’s ability to see the beach was a legitimate governmental interest, no nexus existed between the impact of the project (obstruction of view) and the easement condition. This would be a taking without just compensation. AB 1600 (Government Code Sections 66000 et seq., discussed above) is the California codification of the Nollan decision.
In 1994, the Dolan decision added an additional test. In a 5-4 decision, the Supreme Court held that there must be a “rough proportionality” between the conditions placed on the development and the development’s impact. If not, then a taking would occur. The focus of the Dolan decision relates to land dedication as a condition of a land use adjudicatory approval (e.g., building permits) as compared to legislative approvals (e.g., rezoning or a development fee ordinance).
The Nollan/Dolan nexus test applies to the imposition of an impact fee. The California Supreme Court, 1996, held that if a city bases a development or impact fee on an ordinance or rule of general applicability, then the fee will be considered an exercise of the police power of the jurisdiction and will not be subject to the increased scrutiny of Nollan/Dolan.57 The Court also noted that if a developer wants to challenge an individually applied fee either statutory or constitutionally, it must follow the framework of AB 1600.
Taxes v. fees
This particular distinction is important in California because of the two initiatives, Proposition 13 and Proposition 218. Fees which do not exceed the reasonable cost of providing the service or activity for which they are charged and which are not levied for general purpose revenues are not special taxes (Government Code section 50076). This means that they do not need a two-thirds vote of the voting electorate, even under Proposition 218, but can be imposed by a simple majority. Development fees are further distinguished from taxes because they are voluntary (since development is voluntary) and are imposed only upon developing land rather than uniformly on all landowners or taxpayers (OPR, 27).58
31
The City of Vallejo passed a property development excise tax imposed on developers as a condition of the issuance of a building permit. This tax was for $3,000 per unit of residential development and $.30 per square foot of nonresidential development and was argued by the city to be a general tax imposed on the privilege of developing property and benefiting from city services (Curtin, 203). The revenue went into the city’s general fund to be used for general purposes. The developer argued that this was really a developer fee and would have to meet the nexus requirement. The Appellate Court upheld Vallejo’s tax arguing that because the money went into the general fund it was not for the purpose of providing services to the new development, in contrast to development fees that are linked to this purpose.59
Although this type of tax falls under the constraints of Proposition 218, it does open the door for cities to impose local excise taxes on new development activity without having to demonstrate the nexus between the need and the amount collected. Technically, this could allow local governments to raise a good deal of money from new development to fund citywide projects—hence another welcome stranger effect. However, it does increase the city’s initiative powers.
Again, the Courts have discovered a potential loophole that would increase local government fiscal autonomy by allowing for imaginative taxes or fees on developers. Although the building industry would like the state to intervene, so far the legislature has declined to do so. This is an example of an increase in the initiative ability that has yet to be offset by a decline in immunity.
The Incidence of Fees and Exactions60
The incidence of development fees and exactions is a somewhat controversial topic among non-economists. After all, developers often argue that fees are unfair to new homebuyers because they automatically are passed on as price increases. Builders often describe how these price increases are financed through 30 year mortgages and can total hundreds of thousands of dollars.61 On the other hand, developers argue that they can’t afford these fees, the Mira-Hart-Murietta court decisions (see below) are forcing them into bankruptcy because the local governments are loading up their projects with tremendous fees. These two statements are contradictory.
The conventional economic view, is that fees are taxes on development because they are payments required to obtain approval for the new construction. In general, this analysis leads to the conclusion that the price of housing will rise and the quantity of new construction will fall. It is likely that the price increase will be less than the tax, so the developer will face a net burden and will supply less housing. Both the buyer and the developer share the burden of the tax. Further, as the price of the new homes increase, some buyers will shift to a purchase of an existing home. This will increase the price of existing homes for a windfall gain to those homeowners.

32
However, these results may change when the sometimes unrealistic assumptions of the classical model are relaxed. In particular, the degree of competition for new housing, the infrastructure that is financed by development fees and exactions, the market for land, and the nature of competition in the building industry all affect the conventional results. Dresch and Sheffrin (25-26) show that under more realistic assumptions, the following key factors determine who bears the incidence of fees and exactions: �� If there are many options for potential new residents, they are less likely to bear the
burden of any fees or exactions. �� New residents will pay extra for infrastructure that provides services that are better
than those available in other communities at comparable housing prices. �� If fees are used to provide valued infrastructure to new residents, the residents will get
what they pay for and there will not be an economic burden �� If new housing prices do not rise with the imposition of fees, landowners are likely to
bear the burden of development fees. �� If the building industry is noncompetitive, builders could absorb some of the
development fee burden.
Dresch and Sheffrin have completed the most recent estimate of fee incidence for California. Examining Contra Costa County, they found that the effects of fees on prices was primarily due to different economic conditions. In the east area of the county, which was in economic distress, a $1 increase in fees raised housing prices by only $.25, implying that $.75 was borne by either developers or landowners. In the more robust and growing area of the county, fees were passed on—a $1 increase in fees lead to $1.88 increase in price, although this was not differentiated statistically from a $1 increase.
Proposition 218—One More Time
As discussed earlier in this paper, Proposition 218 was designed to close what some people (notably the Howard Jarvis Taxpayers Association) considered loopholes in Proposition 13. In particular, this proposition required the voters to approve all new taxes and assessments as well as certain fees and charges imposed by all cities, both general law and charter. From January 1, 1995 (the initiative passed in November, 1996) all new or increased general taxes must be approved by a majority of voters, unless the tax was previously approved by a majority vote. This proposition also prohibits special purpose districts from levying general taxes. Finally, the proposition ensures that special taxes be imposed, extended, or increased only upon a two-thirds vote of approval by the voters.62
Proposition 218 creates procedural requirements for new and increased fees and charges. Fees and charges are defined as “any levy…imposed by an agency on a parcel or a person as an incident of property ownership, including user fees or charges for a property related service”. An “incident of property ownership” is not defined. A “property-related service” is defined as a “public service having a direct relationship to property ownership.” In

33
addition, property related fees and charges cannot be used for general government services (e.g., police, fire, ambulance, or libraries), and fee financed services must be immediately available, charges for future services are not permitted, and programs unrelated to the property related service cannot be financed in this method.
Proposition 218 also changes the procedural requirements for the adoption of fees. A public hearing must be held. If a majority (unweighted by land holdings) of the landowners protest in writing, the fee is blocked. Any new or increased property-related fees (excluding charges for sewer, water and refuse collection) must be approved by a majority vote of the landowners, within 45 days of the close of the public hearing.
Finally, since Proposition 218 explicitly authorizes the use of the initiative to repeal or reduce local taxes, assessments, fees and charges, it now appears as if virtually all sources of local revenue can be repealed or reduced through this process (Curtin, 206). This raises issues of what might happen if voters repeal a revenue source that supports previously issued municipal debt. Curtin (p. 206) argues that it is unclear whether an initiative that affects such a revenue source can withstand a challenge based on an impairment-of-contract theory.63
In October, 1998, nearly two years after the passage of Proposition 218, the California Research Bureau published a summary of the current status of the initiative with respect to California court decisions (Misczynski, 1998). The report cautioned that most of the decisions were at the Superior Court level, with very few appellate decisions. These Superior Court decisions do not provide binding precedent, and since they are unpublished, the list was not considered to be complete. However, the decisions do begin to sketch the outcomes of the legal debate, which, if it follows the pattern of Proposition 13, will last a long period time.
The Research Bureau identified four categories: Cases concerning special and general taxes, cases concerning special assessments, cases concerning water, sewer and flood fees, and cases concerning types levies not directly addressed by Proposition 218. Representative cases follow.
In Coleman v. County of Santa Clara (64 Cal. App. 4th 662, 1998), the Appellate Court ruled that Santa Clara County could impose a 1/2 cent sales tax increase, put the money in the General Fund, with a fifty percent approval rate since it was a general tax. However, concurrent with the tax election was an advisory proposition that identified a detailed list of transportation projects that the tax could fund. It is argued that the voters saw this as a combined proposal and would be unhappy if the tax revenue were not spent on the transportation projects. This generates a loophole in Proposition 62, since it allows advisory-dedicated taxes that need only majority approval. While it seems likely that the court’s reasoning would apply to Proposition 218, the Howard Jarvis Tax Association (HJTA) argues that Proposition 218 is tighter. The California Supreme Court declined to review the decision on August 26, 1998.
34
Since 1989, the City of San Diego had been levying assessments under the Parking and Business Improvement Area Law of 198964 which allows cities to create assessment districts to pay for a variety of improvements such as parking lots, and street lights as well as for activities to promote business in the area, such as advertising or street music. The assessment was levied against the business owners, not the property owners, in the district. The HJTA sued arguing that these assessments violated Proposition 218’s requirements. The Superior Court in San Diego on April 30, 1998, ruled that the levy was not subject to Proposition 218, because the assessment was against business owners not property owners. This could be an immense loophole if further interpreted to allow assessments for residential facilities or services if they are levied against the occupants of houses and apartments rather than against their owners. The case is under appeal.
The Las Virgenes Municipal Water District has a fee structure that forces heavy water users to pay a higher rate for the additional water than light users (apparently designed to encourage conservation). The district was sued by a heavy water user farmer who argued that the 218 requirement that fees be apportioned on actual costs of services to the parcel was violated. The Superior Court concluded that water charges based on metered use are not based on property ownership and thus are not subject to Proposition 21865 It then, surprisingly, further concluded that Proposition 218’s fee restrictions apply only to fees for services, not to fees for natural resources.66
A final example relates to the town of Lindsay, which faced a problem of olive brine leaking from city treatment facilities into groundwater. Nearby farm owners claimed that the city had damaged their property by allowing the brine to salting their wells. The farm owners won but the City refused to pay arguing that the City did not have the authority to raise money to pay the fine because of Proposition 218. The court ruled that the City is free to levy taxes and fees, despite Proposition 218 (and apparently despite Proposition 13), in order to raise the money to satisfy the court order. This could mean that counties that are under court order to improve their jails, or hospitals, or to protect endangered species, could levy taxes or fees to satisfy those orders. As Misczynski concludes, “The possibilities are quite amazing.”67
It is clear that some courts are having an interesting time interpreting Proposition 218. It illustrates the fascinating relationships between local governments, the state constitution and the judicial system. It does appear as if at least some of the decisions are oriented to increasing local autonomy, although it is so early in the judicial proceedings that this conclusion is very tentative. If this trend in court decisions continues, it will affect both the initiative and immunity dimensions of autonomy. These decisions may allow jurisdictions to attempt new types of revenue raising programs and they limit the state constitutional constraints on these revenues.
Overall, the relationships among local governments, the state government, the courts and the private developers are in a constant state of flux, reflecting the constant change in California. The second half of this part will present a more detailed (but still simplified) discussion of one segment of this relationship—school facility fees.

35
Financing School Facilities
School facility financing can be utilized as an example of an even more detailed study of the intricacies and interrelationships of California state and local development fees.68. Although this analysis could begin with the state constitutional change in 1879 that mandated a two-thirds vote approval for local school boards, the examination will only encompass the last fifty years, with nearly all of the discussion focused on the post-Proposition 13 era.
1947-1978
From 1947 until 1972, school construction was financed through a combination of state funds and locally issued school district General Obligation bonds.69 In 1947, the California legislature established the State Allocation Board that had the power to allocate state funds for building and repairing schools. This Board is still the operating mechanism for the allocation of state funds, with the same appointment structure established in 1947.70 The Board had the power to set school facility financing policy and it was apparently common for it to change its policies from meeting to meeting. Often these new policies were not made easily available to the public. It has been maintained that the school districts that contracted with consultants, who were often more aware of these policy changes than the school boards themselves, were more successful in securing funding than those that attempted to gain resources on their own. (Cohen, 6) This process of the State Allocation Board continually changing policies led to classic asymmetric information problems that were solved by the hiring of consultants. This solution might be construed as the school districts’ attempts to increase their initiative ability through the hiring of consultant-agents. The State Allocation Board, by changing policies, might be thought of as attempting to increase its control over school districts and there lead to a decline in the immunity of the districts. As will be seen below, the legislature would later intervene and stop this cycle.
Until 1978, the state school funding programs provided resources through loans, which were repaid through the use of the district’s property taxes. The assets utilized for these loans came from the state issuing General Obligation bonds for education. Of the 24 state bond measures voted upon by the voters between 1949 and 1998, 21 have passed.
School districts that wanted to participate in this program had to receive approval by two-thirds of the district’s electorate in order to borrow the state money. The state money also came with strings—building construction standards and square feet per pupil limitations, maximum cost standards and fiscal controls. The school districts also had to be approaching or were likely to exceed their legal level of bonded indebtedness. However, the state repayment formula provided that the total amount due on some loans would be less than the amount of the actual loan.
Between 1949 and 1970, a period in which K-12 enrollment grew by nearly 300 percent, eight state GO bonds for education passed. However, the total amount of funds needed by

36
the districts was consistently greater than the measures placed on the ballot, and there existed a cycle of chronic under-funding of facilities. In addition, the State Allocation Board administered this program as a bank. With limited resources, rationing occurred. Since some districts were uncomfortable with having to reach their full bond indebtedness limit before applying for state loans, these districts did not participate. Overall, many school districts found themselves with overcrowded schools and then started chasing after dollars to build new schools—a situation not dissimilar to the one existing in parts of the state today.71
Significant changes slowly began to occur in the state funding programs beginning in 1971. The impetus to the changes began with the 1971 earthquake in northern Los Angeles County. Because of the damage that the earthquake caused, the state authorized $30 million for a program to pay for the construction of earthquake proof schools and to renovate the buildings that the earthquake had damaged. This new loan program included provisions to forgive loans for school districts that had reached their bonding capacity. In 1972, a $350 million bond issue was approved, which set aside $250 million for earthquake repairs. This issue required the State Allocation Board to approve first the applications from school districts that would use the money for earthquake repairs. The Board then gave second priority for other types of repairs or upgrades. This began a new system that set formal, published, priorities.
Because of reductions in immigration, in-migration from other states, and a decrease in the birth rate, statewide public school enrollment fell by about one percent per year during the 1970s. There were sufficient resources available from local property tax revenues and the state loan program to meet the rehabilitation needs, especially of those school districts that had enrollment declines (Cohen, 11). The Allocation Board shifted its loan program emphasis from new construction to upgrading unsafe facilities that were damaged. For those school districts that were growing, typically in the suburbs, this change in emphasis accentuated the differences between growing school districts and those that required rehabilitation.
As more people demanded housing in suburban neighborhoods, they were accommodated by developers who build numerous suburban housing units. This large increase in the number of suburban homes added resources to the property tax base, which helped the school districts. In addition, in the years prior to Proposition 13, housing prices were rapidly increasing, which added even more resources to the school district’s tax base.72
Beginning in 1972, at least one suburban school district recognized two facts: in order to fund new school construction they would have to augment the state sources and they could no longer depend entirely on their property tax base because of the growing unpopularity of the increasing property tax levies. The Livermore Valley Joint Unified School District began to collect school fees from developers ranging from $400 to $800 per dwelling unit (Home Builders Association).73This precedent would soon become important, since it formally added a third player to the system—the private sector. In addition, in this same year, the Legislature funded a three-year, $1.2 billion program to

37
help school operations and to serve as property tax relief. In spite of these activities, property taxes remained high to cover local bond debt and continued to be a source of funds for school construction for growing school districts. For non-growing districts, the Allocation Board continued to loan money for rehabilitation purposes.74
The final event in this period occurred in 1977 when the Legislature adopted SB 201, the California Schools Facilities Act (Government Code section 65970 et seq.). This authorized cities and counties to impose fees on developers for temporary school facilities. These fees were limited to the amount necessary to pay five annual lease payments.
1978-1998
During the two decades between the passage of Proposition 13 in 1978 and the passage of Proposition 1A in 1998, the roles of the state, the school district and the private developer all changed, sometimes radically. In addition, local governments, through their land use powers, also began to play a role in the capital financing process.
The state’s role
Because Proposition 13 limited not only the amount of the property tax levy that could be collected, but also eliminated the ability of local governments to increase the property tax to finance debt, school districts were unable to issue new debt for construction or to increase the property tax to pay back the State Allocation Board for any new loans.75 Further, because of the decline in property tax revenues, many school districts were unable to pay back some of their old loans and faced bankruptcy (Cohen, 7). To make these problems even worse, state school construction bonds were defeated in 1978. By 1978, the defeats of the 1976 and 1978 propositions and the increasing suburban enrollment growth, caused a statewide school facilities construction shortfall that was estimated to be $550 million (Cohen, 12). In order to mitigate these problems, in 1979 the Legislature told the State Allocation Board to allow school districts four options: withhold payments on existing loans, temporarily delay payments, pay only a portion of their loans, or completely default and not pay back their loans at all (Cohen, 7). In addition, the Legislature required the State Allocation Board to shift from a loan-based program to a grant-based program. This grant-based program remains in effect today.76 The State also restructured its lease purchase program (see footnote 74) by lowering the rent payments to the state from the districts that received this money to $1 per year (essentially creating a grant program). School districts were expected to contribute up to ten percent of the project’s costs from local funds. But since many school districts could not raise these matching funds through local bonds, they requested that the State fund their entire projects. This led to the State Allocation Board creating a waiting list of projects.
California also experienced a recession between 1982 and 1984. The State’s budget surplus was eliminated. In addition, about 60 percent of the school districts in California

38
once more began to see enrollment increases, with some districts projecting a doubling in enrollment. At the same time, estimates appeared that indicated over one-third of the State’s school buildings were over 30 years old and many of them needed substantial rehabilitation, with the estimates for this being as high as $1.9 billion. The school’s special-interest group, the Coalition for Adequate School Housing (CASH), further estimated that the school districts would need $400 million annually for five years for building and repairing school facilities. Since the State was in a recession, and had no money for these projects, it had to develop a new way of prioritizing school facility projects (Cohen, 13).
Because of the waiting list and the lack of funds, a numerical ranking system was devised that gave priority points to determine school district fund eligibility. School districts with unhoused students received more points and were placed higher on the waiting list. The legislature also authorized $100 million General Fund appropriation for school construction. In addition, the ten percent repayment requirement was lowered to one percent.
In 1983 the Legislature passed Chapter 498, Statutes of 1983 that encouraged rapidly growing but space constrained school districts to use space more efficiently by adopting a multi-track year-round education (MTYRE) programs. Any district that went to this process received a maximum grant of $125 per student to help build new facilities and/or to add air-conditioning and insulation. By 1988, the Legislature required that top priority for financing new construction be given to districts that were using MTYRE programs. Districts that offered MTYRE and could match 50 percent of their construction costs received a funding priority. These requirements poorer districts at a disadvantage.
Fiscal stress in the area of rehabilitation significantly increased in 1986 when the federal government passed legislation that required the removal of friable asbestos. This was followed by California legislation that same year for asbestos removal. By 1986, the demands for new school facilities, modernization of old schools and asbestos removal was large. By June 1986, the State Allocation Board faced applications for new construction, reconstruction, or rehabilitation of nearly $2.3 billion. In 1988 the voters approved an $800 million state bond initiative that ultimately was significantly too small, and by the end of 1988, the shortfall had grown to $4 billion.77
This large shortfall created an extremely competitive environment for the State bond money. Apparently, many school districts contracted with knowledgeable consultants or had staff who were familiar with the State Allocation Boards policies and criteria. Anecdotally, these districts were more successful than others in obtaining funds.
By 1986, the concept of a three legged stool was actively discussed The idea was that the state would provide funds through bonds, the local government would provide its share through special taxes, or proceeds from various types of debt instruments, and that the private sector would provide funds through developers fees. However, the three-legged stool never quite worked.

39
The 1990s saw a massive increase in complexity of the already complex system. Major policy changes occurred in 1990, 1991, 1996, and 1997. Each of these changes involved new complex formulas, different priorities (the 1990 changes, for example, established six priority classes), and sporadic creation of new programs. School districts became even more dependent on outside consultants, who followed and understood the sometimes monthly changes in policy that the Board would enact. While the Board would advise school districts regarding policy changes, it did not provide a centralized source of materials, such as an up-to-date handbook. School districts were often uninformed (Cohen, 17). In the middle of these changes, the electorate approved State school bond initiatives in 1990 for $1.6 billion and in 1992 for $2.8 billion. This was in the light of a Department of Finance report that estimated $3 billion was the annual amount needed for new school construction. In 1994, in the midst of a recession, the electorate rejected a $1 billion bond initiative.78 In 1996, however, the California voters passed a $2.065 billion school facility construction bonding initiative. But, at that same time, the Legislature estimated that school districts would need $7 billion in construction funds in the next five years (this $7 billion did not include the needs of Los Angeles Unified School District, which alone needed $3 billion to upgrade and modernize). Further, the distribution of the funds was complicated by the class size reduction legislation that mandated classes of no larger than 20 for first and second grades. This took $95 million for portable purchases in addition to the new state funds.
Because of the need exceeding the availability of funds, school districts sometimes resorted to creative means to obtain access to the limited funds. Some requested emergency allocations, others used appeal tactics to bump districts ahead of them in the queue, and others used sophisticated analysis to choose among the six programs that the Board was overseeing. This zero-sum “cannibalistic” behavior caused resentment among school districts. By 1998 the Department of Finance estimated that $16 billion will be needed over the next decade for public school construction and rehabilitation. In 1998, Proposition 1A passed which provided $6.7 billion towards the total. Proposition 1A, will be discussed in the 1998 section of the paper.
The Local Role
Local governments, including school districts, attempted to finance schools through three, sometimes overlapping mechanisms—charging the developer (both school districts and cities did this), issuing various types of debt, and utilizing special types of taxes or establishing special assessments.
Fees
School districts do not have police power authority to impose development fees. However, in 1986, the State Legislature approved AB 2926 (which became Government Code Section 53080, OPR, 35).79 School districts under this section can act to charge developers development fees.80 This method of financing immediately came into widespread use. It allowed school districts to directly impose developer fees to pay for

40
new school construction and established that the maximum fees, which can be adjusted for inflation, were $1.50 per square foot of residential development and $0.25 per square foot of commercial and industrial space. By 1998, these caps were $1.93 per square foot and $0.31 per square foot respectively. In addition, AB 2926 prohibited the denial of a project on the basis of the adequacy of school facilities. In a series of legislative actions, the limits on these fees have both expanded and contracted,81 with perhaps the most important clarification that there must be a nexus between school fees and the impacts created by new development (AB 1600 of 1987).
School districts were able to find a loophole around the fee caps. They requested that cities impose a fee on their behalf and some cities imposed rates on some developers that resulted in the limit being exceeded. For example, in 1990 total development fees for some homes reached $30,000 (Cohen, 16). Fees have been allowed to increase because of three cases, decided by separate California Courts of Appeal. These cases have delineated when it is acceptable for city councils or boards of supervisors to not allow development because of lack of school facilities. �� Mira Development Corp. v. City of San Diego (1988) 205 Cal.App.3d 1201. In this
case, the Mira Development Corporation petitioned to rezone property from single family to multi-family in order to develop an apartment project. The City Council denied the rezoning because the proposed development would outstrip the provision of needed public services, in particular school facilities in the area. Mira sued, arguing that the Council could not reject the zoning variance because of an inadequacy of school facilities. The court held that rezoning does not constitute a development project within the meaning of the law and that fee caps only applied to school districts and not to cities or counties.
�� William S. Hart Union School District v. Regional Planning Com. (1991) 226 Cal.App.3d 1612. In this case the school district sought to compel the Los Angeles County Board of Supervisors to set aside its approval of a development project (an approval of a rezoning) because school facilities were inadequate to meet the needs of the proposed development. The Superior Court supported the Supervisors, but was reversed at the Appellate level. In part, the Appellate Court held that the Legislature was concerned about development projects and the requirements that are imposed against them, not about rezoning. It upheld the Mira decision.
�� Murietta Valley Unified School Dist. v. County of Riverside (1991) 228 Cal. App.3d 1212. This third case again involves a school district petitioning the county to set aside a general plan amendment that allowed for an increase in development. The Superior Court upheld the county’s plan but was reversed at the Appellate level. The Court held that the school district had standing to sue, that there was doubt that a general plan amendment is a legislative act, and therefore the amendment at issue was not a development project.
These three decisions (known as the Mira-Hart-Murietta decisions) have given school districts (in cooperation with cities and counties) a distinct financial power over
41
developers. By holding that the fee limitations applied only to those imposed by school districts and not to those imposed by cities and counties, they allowed these latter units of local government to impose fees above the cap in legislative land use decisions, including changes in zoning or specific general plan amendments. Only in adjudicatory acts in which land use decisions such as subdivision approvals or conditional use permits are being considered are the fee caps binding.
The role of the Courts has become quite important in this particular area. They often (but not always) seem to rule in favor of increasing the initiative ability of the jurisdiction. However, as will be seen in the discussion of Proposition 1A, special interest groups ultimately came together to influence the passage of state legislation, which was ratified by the voters, to over-rule the court decisions. Thus, the immunity constraint became more binding.
The practical effect of these cases was to allow local governments to require developers negotiate with school districts. The result of these negotiations could be mitigation payments in excess of the $1.93 cap for residential development; by 1998, at least 20 percent of California school districts were receiving mitigation payments that were in excess of the cap. The statewide impact of the cap was uneven, since school districts in areas which were not experiencing development but yet which need new facilities because of building deterioration, asbestos removal, or growth without new buildings (e.g., urban areas) did not have access to developers to force contributions.
By 1997, the school district-developer relationships with respect to fees had become quite remarkable. For example, in 1997, the Coachella Valley Unified School District objected to the City of Coachella’s general plan amendment in part based on the assertion that increased class sizes (that would occur because of the development) would increase exposure to transmittable diseases, such as tuberculosis. This same year, the Livermore Valley Joint USD determined that full school facilities mitigated necessitated a $5.99 per square foot fee that would increase to $7.52 per square foot in 2003.
As will be seen in the subsequent section, Proposition 1A of 1998, restored the caps for these fees, and gave developers additional freedom from local jurisdiction approval, by putting the Mira-Hart-Murietta rulings in abeyance until 2006.
Debt for Facilities There are a variety of debt instruments that school districts can utilize to finance capital facilities. Most of these have been discussed earlier in this paper, so only brief descriptions of the instruments that are principally used will be given.82 �� General Obligation Bonds: In 1986, school districts (along with cities and counties)
regained the ability to issue G.O. bonds to finance land acquisition and capital improvements. This type of debt cannot be used for school furnishings or school buses. This method needs a two-thirds voter approval and is the cheapest method of

42
tax-exempt financing. Almost $5.4 billion of GO bonds for schools have been successfully issued since 1996.
�� Mello-Roos Community Facilities Districts: Available since 1982, they require approval by two-thirds of the districts voters or if the district has fewer than 12 property owners, by a majority vote of the owners. They can be a complex, but flexible method of levying a tax and can be used for a wide range of facilities, including capital, land, furnishings, equipment, and buses. Under certain conditions, the funds raised by a Mello-Roos district can count towards the school district’s matching requirement for the grants from the State Allocation Board. Another advantage of Mello-Roos is that the boundaries can be drawn to exclude areas that contain voters who might be opposed to the district’s creation. For example, one school district drew Mello-Roos boundaries to exclude mobile home parks where the elderly citizens tended to vote in opposition to school taxes. The school district successful passed the tax (OPR, 38). However, Mello-Roos debt tends to be more expensive than many other types. Since 1983, approximately $2.3 billion of Mello-Roos debt has been issued for school finance (Debt Line, 6).
�� Certificates of Participation (COPs): In this method, the school district leases the property it is acquiring from a third party lessor, usually a nonprofit corporation or a joint powers agency. The lease payments made by the school district to the third-party are assigned to the lenders (who are the COP owners) to repay the debt. Each COP owner is entitled to a proportionate amount of the lease payment made by the school district under the lease. In this type of financing, a portion of each lease payment is designated as interest and thus the owners of the COPs may receive tax-exempt interest. COPs are sold in the same manner as bonds with the proceeds of the sale being used to acquire and construct the school project. Since COPs are not a creature of statute, they are not subject to certain statutory requirements, such as interest rate limits, election restrictions (no election is required)(Orrick, Herrington & Sutcliffe, E-2). Money for the payment usually come from the district’s general fund. COP funds can be obtained quickly and used for a wide variety of facilities. There have been about $1.8 billion of COPs issued for education between 1996 and 1998.83
�� Redevelopment Tax Increment: If the redevelopment agency’s project exists within the school district, and if there is a pass through agreement reached, then this could generate a new revenue stream. There is no election required for the issuance of the redevelopment bonds, but there is likely to be only a small increment in the revenue stream.
Other Instruments used for facilities and/or operating expenditures There are two other instruments that can be used, under some circumstances, to increase the revenue flow to finance school facilities: special taxes and special assessments. Both, however, face significant restrictions. �� Special Taxes: School districts can impose special taxes in the same manner that
cities and counties can impose them, as long as the tax applies uniformly to all

43
taxpayers or all real property within the district. Proposition 218 defined school districts as special districts for purposes of defining the type of taxes that a school district can impose and the voting rules for those taxes (OPR, 39). Under Article XIIIC of the California Constitution, school districts have no power to levy general taxes, even if the receipts from those taxes are placed into a general fund.84 Between 1983 and 1988 only about one-third of these types of taxes were approved by the electorate (OPR, 39). Further, in Grupe Development Co. v. Superior Court (1993) 4 Cal. 4th 911, 16, the California Supreme Court ruled out the use of special taxes in districts that have levied full development fees.
�� Special assessments: In recent years, some school districts have argued that they have the ability in impose assessments under the 1972 Landscape and Lighting Act if they use these assessments for the maintenance of school yards. In Howard Jarvis Taxpayers Association v. Whittier Union School District (1993) 15 Cal.App.4th, 730., the Appellate Court affirmed the ability of two school districts to levy assessments to pay for the maintenance of school auditoriums, meeting rooms, gyms, stadiums, recreation and civic centers for the surrounding community. , and that the school district is a special district for purposes of the 1972 Act.85 Proposition 218 significantly limits the usefulness of this new source of revenue, since it requires mailed notices to all property owners in the district, a public hearing, and than a majority vote of the property owners. It is probably only useful to fund costs by the districts that are attributable to public use of the facilities during non-school hours.
1998
By 1998, the methods of financing school facilities had become quite complex, although there was still never enough money. Further, the estimates of an additional 300,000 K-12 students coming into the system between 1998 and 2002; the continuation of the class size reduction program which was necessitating 32,000 new classrooms, and the pressures to maintain and improve the 55 percent of the public school buildings that were more than 30 years old, continued to strain the public finance system in its attempts to provide more money (Edsource Edfact).86 Proposition 1A was passed to clarify some issues: particularly the relationship between state funding, local matches, fees on developers, and the ability of local jurisdictions to stop development based on insufficient school capacity. As part of this clarification, the Proposition also made available a large amount of money for school facilities
SB 50 was the genesis of Proposition 1A. This Senate Bill was the result of a series of compromises between Democrats who wanted a “clean” bill to increase the amount available for state funding of school construction and Republicans who wanted some relief for developers who felt that they were being overcharged by local governments. A proposed compromise of capping the fees but reducing the necessary vote to pass a local General Obligation bond for the local match (from two-thirds to a majority) failed, but in exchange, the amount of the state bond issue was increased. Ultimately, Proposition 1A provided for the sale of $9.2 billion in state general obligation bonds to fund school

44
construction, reconstruction, and modernization. K-12 school districts were to get $6.7 billion to be used for land purchases, new building construction, reconstruction, modernization, and facilities needed for class size reduction. In addition, up to $1 billion of the amount could be used for local schools that cannot provide local matching funds. Proposition 1A passed in November 1998.87
In addition to increasing the funds for the state share, Proposition 1A had several other components. In particular, the following relate to this discussion of state-local financing constraints:88 �� School construction-related developer fees are limited by prohibiting cities and
counties from charging these fees as a condition of new development approval. This provision expires in 2006, at which point fees can be increased to cover half of the cost of school construction if there is state money available or the entire cost of school construction if there is no state money available.
�� School districts can continue to levy developer fees, capped at the $1.93 for residential and $.31 for commercial (these will be adjusted for inflation).89
�� Funds will be provided to local districts based on a fixed grant per projected unhoused pupil. Any savings a district can realize in constructing new buildings may be kept by the district to be used for additional facilities.
�� Districts would be required to provide a 50 percent match of local funds for any new construction and a 20 percent match for modernization.
�� There is now greater flexibility in the process of construction. In addition, the State Allocation Board is required to compile a stock of standard plans that are appropriate for schools in various climates and geographical conditions. Schools may use these plans.
�� Provides for a separate state appropriation of $160 million over four years to offset some of the costs of developer fees to low-income buyers and developers of low-income rental housing.90
State Implications Proposition 1A’s system of allocating state resources for schools is detailed. Bond proceeds will be allocated in 2 two-year cycles—$3.35 billion will be immediately available and $3.35 billion will be available after July 2, 2000. Of the immediately available funds, $1.35 billion is for new construction, $800 million is for modernization, $700 million is for class-size reduction and $500 million is for hardship cases. In the second round, the class size reduction category is eliminated and the $700 million is allocated for the other purposes. The money will flow to school districts based on a per pupil formula, based on a statewide average cost for construction, adjusted each year for inflation. The amounts are based on unhoused average daily attendance, and range from $5,200 (elementary) to $7,200 (high school) for growth and $2,496 (elementary) to $3,456 (high school) for modernization. Since it is widely believed that the initial $1.35 billion for new construction will not be adequate for the needs of growing school

45
districts, a priority point system was established by Proposition 1A, in which the percentage of currently and projected unhoused students relative to the total district population or attendance area is a component.91
The funding facilities categories that the State Allocation Board utilizes have been changed. In the past, schools received state funds for growth and modernization by applying as either a priority 1 project (50 percent funding from the state) or a priority 2 project (100 percent state funding). Now, growth projects receive 50 percent funding based on the per pupil formula; modernization projects receive 80 percent funding, and hardship projects can receive up to 100 percent funding.92 Buildings can now be modernized after 25 years rather than meet the previous 30-year criteria.
The process of applying for state funds has also been simplified. Because it is a flat grant based on number of unhoused students, the number of school facility financing phases has been reduced from three to one. Under the old program, each phase of the project was independently evaluated, so the state’s cost for any given project could change. Now there is a single grant for a single project and the district cannot request that the state fund additional needs (Cohen, 31).
Prior to Proposition 1A, the State Allocation Board developed and administered as many as 13 programs, which allowed school districts to pursue creative strategies that matched projects to particular programs to obtain funding. Now, with only two programs (along with the hardship cases), there should be less strategizing and clear matching of needs and funds. Since modernization is supported more generously than new construction (previously they were both supported at the same 50 percent level), there should be more attempts to maintain old facilities than to build new ones.
The State Allocation Board must also initiate a public hearing process that notices any policy changes, and it must make available current documentation that explains policies and how the new programs work.
Local Impacts The effect of Proposition 1A on local jurisdictions is more dramatic than on the state. This proposition affects not only school districts but also cities and counties. In all cases, it represents a state override over local decision making, thereby constraining local autonomy for each of these governmental units. This is a decrease in the immunity component. However, if school district, city, and county finance directors are as innovative in the future as they have been in the past, it would not be surprising to recognize an attempt to increase the initiative component of the autonomy definition. There are two important areas in which local governments will be affected.
Developer fee limits: The fees that the school districts can charge, $1.93 per square foot for residential development and the $.31 per square foot for commercial and industrial development are fixed (with inflation adjustments beginning in 2000) until 2006. These

46
are called Level One fees. However, there are two loopholes. Level Two fees allow the school district to impose fees beyond the statutory cap under certain conditions. These conditions appear difficult to meet for small school districts that are rapidly growing. However, if the conditions are met, the school district does not have to go to the city or county to make a case for a higher fee, but can implement it directly.(American Planning Association, 173-175). Level Three fees only come into play if the state runs out of bond funds after 2006. If this occurs, the school districts can impose 100 percent of the cost of the school facility or mitigation less any local dedicated school money.93
Local land use policy: By suspending the Mira-Hart-Murietta court cases, the state has pre-empted the field of school mitigation. Now, local agencies are prohibited from denying land use approvals on the basis that school facilities are inadequate; if the developer pays the statutory fee (or allowable alternative funding requirements), the developer is deemed to be in full and complete mitigation; and school districts are limited to the statutory rule for imposing school facilities mitigation American Planning Association, 168). This is a clear intrusion of the state on local government decision making in the land use arena.
There are several subsidiary issues in Proposition 1A that also affect school facilities. One of the most important is that although the state is expected to pay 50 percent, the state grant is an average per pupil that does not vary across jurisdictions in the state. These averages are quite likely to result in many school districts receiving much less than 50 percent. To further complicate matters, the State Allocation Board cannot apportion funds to any school district unless that district can certify that the sum of the state grant and local funds is enough to complete the school construction project. It is unknown what will happen if the school district determines that the developer fees will not generate enough revenues to house the children adequately. They would then not meet the certification requirements and so would not be able to receive state funds. The question becomes—is local government still prohibited from denying a project when no schools will be built because of inadequate funding (American Planning Association, 171)?
A second subsidiary issue is the role of the Mello-Roos Community Facilities District in providing funds. The development fee is reduced by the amount of any voluntary Mello-Roos participation, although existing Mello-Roos agreements will be grandfathered. Apparently, if the district receives Mello-Roos funds in the future, the money generated from them must go towards the districts 50 percent match. The funds could not be used for other improvements. It is likely that developers will try to satisfy their mitigations through the capped impact fee, and thus will be unlikely to participate in Mello-Roos (Walters, 5).
There must be a series of legislative changes to clarify some of the language in Proposition 1A and the courts have yet to speak. The system has become clearer in some cases—for example, the State Allocation Board’s criteria for allocating the limited funds will be available to all participants. But the system has become more complex in other
47
cases—for example the role of Mello-Roos financing or fee calculations. The next few years will be interesting to watch the shifts in local autonomy in this area.
Case Studies of California Cities and Counties
As can be seen, the California fiscal environment is quite complex, both intellectually and in practice. To add some robustness to the previous descriptions of some of the segments of this fiscal system, seven mini-case-studies were undertaken. Five cities and two counties were the subjects. Table 9 presents the basic data for these jurisdictions.
Rocklin
Rocklin is a relatively small city, located about 20 miles from Sacramento on the way to the north shore of Lake Tahoe.
Rocklin has taken advantage of many of the nooks and crannies in the current revenue system to maintain a smooth revenue flow and city services at a constant level. In 1993-94, a private consulting group helped Rocklin analyze its fee structure through an intensive cost study of services that could be priced. The City Council ultimately choose among three options for each of the services: set the fee for immediate full cost recovery; set the fee for full recovery over a three year time horizon, or if the service generated benefits to the entire city, the Council sets the fee at below full cost and as low as zero. An example of the later would be the Rocklin police department’s practice of not charging for helping Rocklin residents who have locked themselves out of their cars. Rocklin also utilizes voter approved special taxes for parks ($30 per household for park maintenance), with park landscaping and lighting districts covering the entire city. Because of these taxes, park recreation programs are almost entirely self-financing, with the pre-school and after school programs helping to cross-subsidize some of the other parks and recreation programs. Rocklin also has a lighting and landscape maintenance district covering the new areas of town, which costs about $80 per household. In addition, there currently exist two, non-overlapping, Mello-Roos districts that between them cover the entire city for K-6 schools. Because of the revenues these generate, the school district’s development fees are only 90 cents per square foot for the residential sector (which is $1.03 underneath the cap).
Rocklin also carefully ensures that new development will fully mitigate all costs of additional services. It ensures this by requiring all new development to be in Mello-Roos districts which raises money to help in the mitigation, particularly for fire services and infrastructure. There are also benefit assessment districts for street lights, traffic signals, and landscape and parks. Rocklin has recently hired an Economic Development Manager, which seems to be paying-off in terms of increased activity, although the City has discovered that attracting developers through direct incentives seems to be less successful than attracting developers by providing public infrastructure.

48
Rocklin also takes advantage of its ability to utilize indirect cost recovery on state aid and other non-discretionary revenue. For example, when it receives gas tax money from the state, Rocklin takes a certain amount and places it in the General Fund to offset the overhead incurred in obtaining and utilizing the aid (the indirect cost recovery). In addition, the City Manager and the Assistant City Manager charge a percentage of their time to the Redevelopment Agency (which is the City Council). Rocklin also utilizes an internal pricing mechanism for fleet management and building and facilities management and are looking for ways of increasing the use of this technique.
Rocklin also uses Certificates of Participation for financing a variety of projects. New public buildings are often COP financed and some of the new and improved fire equipment was also COP financed. Altogether, there are about $5 million outstanding COPs.
Rocklin is a homogeneous, middle to upper-middle class city, with a diverse economy and many small employers. It has a very low crime rate, and because of this, there has no need to expand greatly public safety services on a per capita level. In fact, the City Manager argues that in general services have been expanded and are now higher than they were 15 years ago. Part of this increase, it is argued comes from having development pay its entire costs (thus generating positive externalities for the rest of the community) and part of the expansion comes from selected contracting for park maintenance and downtown landscaping with private sector firms. The City Manager is also very conservative in allowing the City’s work force to expand, attempting to provide more services with the same level of inputs. Finally, he is an entrepreneur who enjoys putting deals together for the community’s benefit. For example, he was able to develop a community center in a complex transaction that allowed a private developer and the community to both gain.
The City Manager does not find state or court ordered funding restrictions very problematic. Usually there are ways of working within these restrictions that allow the City to get done what it needs to get done. However, restrictions from Federal Regulatory Agencies are another story, particularly those that deal with endangered species and fish and wildlife. Often these environmental constraints force the City to develop conservation plans that have to be implemented with no new money. Another problem that Rocklin faces is the NIMBY attitude of other cities. For example, Loomis, a neighboring city, ultimately forced a potential regional mall out of Rocklin and into Roseville.
The Rocklin budget process is smooth, and while there is contention among projects, the process seems to produce results that are ultimately, for the most part, consensual. There is a management retreat each November, with all management staff mandated to participate. During this retreat, department heads propose projects, and the staff discuss each of the possibilities. The CM meets with the Council in February, and based on the November meeting (and follow-ups), proposes a list of projects for Council consideration. The Council approves and ranks projects and has input into the design of

49
projects and can suggest additional projects. These projects or any new service level changes are considered when the budget is considered for the coming fiscal year. The CM has been quite successful in the past in finding sources of funds for the projects, but ultimately notifies the Council where the money dries up. In terms of land use changes, the General Plan was last revised in 1991 and is expected to last for about 20n years, although changes at the margins are always occurring. Generally, the Council resists developer pressures to change zoning, although both developers and the Council are aware of changing market pressures which the Council takes into account when it analyzes any zoning or other land use changes.
Citizens are generally content—the voter turnout is constant and few citizens appear at city council hearings when the subject is a general city problem; however, for specific, typically neighborhood, problems, there is a relatively large turnout.
In addition to the environmental constraints discussed above, the CM forecasts two other potential financing problems which might lead to increasing fiscal stress: labor gains and infrastructure problems. In terms of labor, there may be changes regarding overtime pay, there may come mandatory and binding arbitration for public safety employees, there may be an increase in retirement benefits, and there may be changes in the rules for contracting out. All of these would lead to increased pressure. In terms of infrastructure, it is clear that there is not enough money to even maintain the existing infrastructure, let alone add to infrastructure that is not paid for by developer fees. Roads and beginning to crack and deteriorate and there is not enough money to fix them. The CM believes that only when a state-wide crises occurs will these problems be addressed.
Chico
Chico is a college town about 100 miles north of Sacramento. It is diversifying its economy and is growing rapidly. Its population is about 54,000 which includes about 15,000 Chico State students and 8,000 Butte Community College students. If the students are not counted, it is a low-middle income, white, community. As the community grows, the liberal students are being more and more off-set by the conservative newcomers. Over time, fees on new development have moved from basically non-existent to now very high. They cover everything from streets, parks police facilities, and bike paths. Prior to the increases, they were about $2,000 per dwelling unit (for serer connections) to now about $18,000 per dwelling unit. In the previous era, the facilities that are now financed by development fees used to come out of the general fund. Processing fees for new development utilize full cost accounting and include indirect costs. Enterprise funds are fully self-supporting and also include indirect costs. Thus, the fees set by the funds for homeowners are including these indirect costs.
The City uses internal transfer pricing among departments, but seems to have little effect on the way resources are used.

50
All new development is in maintenance districts for landscaping and storm drainage. The City is going neighborhood by neighborhood to put developed areas into maintenance districts. About 15 percent of the total (old) community is now in these districts. Sometimes Mello-Roos is used for these districts, and community did get a two-thirds vote for a developed area to set up a park district. The City is using all means to move expenses out of the General Fund and to bring revenue into the General Fund. For example, until recently, it was relatively easy to raise “sin” taxes (e.g., parking fines). Now, however, the Council is more conservative and raising these is more difficult.
The first redevelopment project started in 1980. Today used quite a bit as is important source of funds. For example, in 1994, the city-county put together a project that was 2/3 unincorporated. Since 1980, there has been about $120 million raised from redevelopment. However, over time, the City Manager predicts that redevelopment may have become less important, since much of the service provision burden is being shifted to new development.
Together, the redevelopment money, the fees and charges from enterprise funds, and the capital funds take a $20 million General Fund budget and turn it into a $50 million city budget.
Chico does not use COPs and does not use TRANs, although they are considering using the later.
Services have been slightly reduced over time. Since both commercial activity and population are rapidly growing, there is a generation of additional sales tax revenues (now one-half the revenue). So, services are increasing, but not in proportion to the population growth, so therefore, slight deterioration. For example, the police department no longer investigates traffic accidents if there are no injuries. Or, the City used to maintain trees in the entire public right of way, which is both in front of and behind sidewalks. Now, the City is considering changing its service responsibility so that the maintenance of trees behind the sidewalk (that is in the front yard) is the homeowners responsibility. The City used to trim trees every 7-10 years; now it will be trimming trees every 27-30 years. So far, there have been no real objections from citizens.
The City is aware of the possibilities of developing new programs. For example, the City is working with the county to develop a new program for fire fighting in which the closest engine, regardless of whether a city or county location, responds. Another example is the City working with the County to try to rationalize transit services. Or, finally, there now is private garbage pick-up; the City is investigating the possibility to move to a regional agency, which appears to be cheaper. The City is not adverse to making deals—for example, in 1985, the City annexed a regional mall and gave the County 5 percent of the sales tax. Chico said they would provide sewer service to any anyone who could show that the business would generate twice the revenue of the sewer costs. (However, this deal is now repealed).

51
With the exceptions below, there are few county or state barriers to activities that the City would like to do. The only barriers come from citizens. However, environmental type barriers have become very important to development. For example, the federal government has struck land use deals with private owners to take their land out of potential development. The City found this out after the deal was concluded, and played no part in the negotiation process. Now, more and more, it appears as if developers and environmentalists lobby their friends at the state or federal level, again cutting out the City in fact, they appear to go to the state and Federal governments before the locals even know about the proposed developments). In addition, environmental approvals have led to increased costs and time. In 1980, it took about 90 days to get development approval; now it takes a minimum of two years for any significant residential development (using a streamlined process) and $500,000 costs for environmental studies.
The process of putting together and presenting the budget has not changed. The budget presentations are quite open (2 to 3 budget presentations per budget). Coleman’s hypothesis on special districts is wrong for Chico—Their parks and recreation district is really hurting, even with the property tax share, and in fact is being helped by the City.
The Chico general plan was last adopted in 1994. It is done through the traditional neighborhood design manner, and is examined fully every ten years. They have autonomy in putting the plan together. There is little controversy (although some) over zoning changes. The entire community is pre-zoned. There is controversy over subdivision mapping.
The City works well with the school district—relations are excellent. The district was able to pass school bonds and now is eligible for Proposition 1A money. The Schools help the City by building and maintaining the streets in from of the schools and the City helps the schools by ensuring that there are well-maintained streets leading to the schools. There is also cooperation with the redevelopment agency. Ultimately, the schools get full mitigation of their costs imposed by the new development. But—an aside—the school district planned to build a new high school in an area filled with wetlands. This will take some time to resolve.
The courts have been cooperative—they have allowed the City to change its bail schedule, supported the City on noise and zoning issues.
Ultimately, the City feels that it can get around most constraints, although Propositions 13 and 218 and the federal environmental constraints are binding.
Over the next decade, the principal problems will revolve around labor issues. The City Manager sees potential workers compensation cost increases and potential problems with length of day rules for police and fire. He also sees a statewide increase in sexual harassment litigation. It has hit police now in the state and it may be moving to the non-sworn and other city workers. There is a potential for a large liability in this area. Finally,

52
he sees the binding arbitration measure that is currently under consideration to be a potential problem.
Thousand Oaks
Thousand Oaks is a relatively new incorporated city, being incorporated in 1964. It is located in Ventura County, about 50 miles northwest of Los Angeles. Its city council consciously decided that they would not utilize the property tax as a source of revenue, prior to the passage of Proposition 13. Consequently, its immediate property tax receipts after the AB 8 allocation, were zero. The City complained that they were being punished because of their previous fiscal responsibility, and combined with the other “no and low” tax cities, lobbied the legislature to change the allocation formula so that they would receive some of the allocation. They were aware that this was a zero sum game. Finally, they managed to get some help as part of the Trial Court Funding changes. As part of this legislation, the counties had to transfer some funds to the no and low property tax cities. It was assumed that the state would backfill the counties’ losses. Over time, this resulted for many of the no and lows to receive about six percent of the allocation. However, because the majority of the population of Ventura County lived in no and low cities or in the unincorporated areas, the new reallocation was capped at four percent. Currently, Thousand Oaks gets about 4.5 percent and which generates about $5 million a year.
The City has a tradition of excellent land use planning. There were originally between three and five major private sector landowners who had a long term commitment to the region and who were large enough that they could weather economic fluctuations. Thus, development could proceed in an orderly manner.
Thousand Oaks uses fees to pay the operating costs for as many services as it can. They consciously worked through AB 1600 to set the fees and used an outside consultant. They used full cost accounting. However, there is a concern for the incidence of the fees on low income households, and so for some of the basic services, the consumer does not pay the full costs. Developer fees are very high. They finance all new capital construction for new development. New developments also have to form Mello-Roos districts to pay the incremental costs for park services that are not covered by the city share of the property tax. Fees, although high, are considered “adequate ” and the City believes that it doesn’t over or under charge. There was an attempt to implement a Mello-Roos district to cover all incremental operating costs, but it was rejected.
When the County instituted a booking fee, this lead to some city/county fights. Those have all been settled, and now the city believes that cooperation between Ventura County and its cities is the best in the state. For example, there is now an agreement that the County will never charge these booking fees.
Thousand Oaks has only one major assessment district—Street Lighting and maintenance. After Proposition 218’s mandatory election, 74 percent of the voters voted

53
in favor of continuing the district. In this election, the voters approved an escalator clause, so that the district should be in acceptable shape for the next 20 to 30 years.
At about the same time that the fee schedules were being revised, the library district was detached. It now gets 1 1/4 percent of the property tax allocation (the approximately 4 percent that the city receives) as well as some sales taxes. Now, for every dollar that the city spends on police, it spends 45 cents on the library, and so the city believes that its library system is funded at an acceptable level.
A major regional mall opened in 1978. The City Council decided (and has held to) using the sales tax increment generated by the mall to develop capital and “meaningful” services. On the other hand, the major business district had some problems of deterioration. The City established a redevelopment project that now contains about 6-7 percent of the city land area. This redevelopment project aimed to be well balanced, with a conscious desire to finance industrial development, infrastructure and low income housing, with the argument that low income housing was necessary for the low income workers in the newly redeveloped areas. In addition, ten percent of the redevelopment revenues went to school revitalization—this translates into between $500,000 and $750,000 per year to schools with the school district having to come up with an equal match in order to get the redevelopment money. (The schools in Thousand Oaks were considered to be the stepchild of the Oxnard School District, so the Thousand Oaks city council/redevelopment agency felt that the schools needed help). The money went towards stadiums, auditoriums, and so forth. Schools are now considered excellent.
The goal of the City is to keep a strong reserve, because of the low property tax receipts and the potential for fluctuating sales tax revenues.
There is an on-going and concerted effort to attract industry by investing in infrastructure such as schools and libraries rather than offering direct financial inducements to desired firms. Thus the cites provide mixed housing, including low income, good parks and libraries, excellent schools, and a large amount of zoned open space. For example, there were 1000 acres of deed restricted or zoned open space in 1978; now there are about 14,000 acres out of 39,000. This seems to work, since desirable industry is staying and new industry is coming (AmGen is staying and growing; Rockwell came). Of course, some of this is also due to the geographical location of the City.
Prior to Proposition 1A, developers paid full mitigation for schools. Now, because of the “unholy alliance” between the teacher‘s union and developers, there will be problems and probable deterioration in schools.
The City does not use COPs and has only one conduit bond (for community centers) outstanding.
With the recession of the early 1990s, the City cut back between 20-25 percent of its work force. Most of the cutbacks were accommodated through attrition, and most of the

54
fired were hired back. However, the work force is still smaller today than it was then. However, because of increased efficiency, the City believes that there were no service cut backs. The reductions in work force were essentially unnoticed by the public (although at the time, there was some political flack).
There are a few programs to work with increasing community diversity. The City works with non-profit agencies to help provide low income housing and housing shelters for homeless mothers. The City believes that home ownership is the best way to deduce overcrowding and other social problems, including crime). The City has also worked with the schools to help fund an ESL program as well as improving the school environment, particularly for schools in the worst areas.
Thousand Oaks adopts a two-year operating budget and a five-year capital budget. Over time, public input into the process has increased. About six years ago, the City established a Community Budget Task Force, which consisted of three people appointed by each City Council member and which is staffed by the finance department. This task force had the power to analyze all city revenues and services, and then give advice to the City Council. This has turned out to be a very responsible process, and not political although expectations were that it might be. Its advice is considered very helpful and insightful. Although it sounds similar to a grand jury, the presumption of wrong-doing is not there.
City Council meetings are televised and apparently watched, at least in part, by a large percentage of the City’s population. The City believes that about 30 percent of the City’s population sees part of the meeting. Every four-five years, 25 percent of the households in the City are surveyed. It takes about one hour to complete the written survey and they have a response rate of about 30 percent. This is principally an attitude and suggestion type of survey, and gives very good feedback to the City Council and staff.
Over time, the general plan has been changed to lower the build-out population. Originally, before incorporation, the County had planned for 250,000 people in the area. The original city land use plan called for 175,000 inhabitants. Now, the build-out calls for 135,000. This has mostly come because of the increase in open space. There was a growth control measure passed in 1978, but it excluded affordable housing, so the City can maintain balanced growth.
The City feels that the fire district receives more property tax revenues than it spends, and thus there may be some inequities in this area.
The principal problem facing the City in the next decade is e-commerce. The loss of sales tax revenue will hurt the city, state and school district financially. In addition, it is inequitable, since low income, which probably don’t have internet access, can’t take advantage of e-commerce and the local “brick and mortar” merchants will be hurt. There doesn’t seem top be any way around these controls.

55
Moreno Valley
Moreno Valley is located in western Riverside County, about 25 minutes from the Ontario Airport. It is on the eastern border of the City of Riverside, next to March Air Reserve Base. It was incorporated in 1984, partially in response to a large number of subdivision approvals that were granted by the Riverside County and partially in response to the City of Riverside’s annexing some areas encroaching east of the I-215 freeway into the area under cityhood consideration. In 1984, the newly incorporated city had about 45,000 inhabitants; by 1990 it had over 120,000. It was considered by the national media to be the fastest growing city (for its size) in the United States, and there have been articles in newspapers throughout the United States that discuss the phenomena.
Moreno Valley is mostly a single family home jurisdiction. Much of its population originally came from either Los Angeles or Orange Counties, who are looking for affordable and nice homes—both of which exist in Moreno Valley. There is a high ratio of residents to unit (3.2-3.5), implying young families with over 60,000 youth. It is middle class, ethnically diverse and relatively conservative in a conservative county.
1990 was a watershed year (remembering that the city did not exist in 1978). At that time, the City was rapidly growing and property values were increasing, and there was broad speculation in property. There was a growth control initiative that failed in 1988, but the possibility of its passing caused the developers to expedite their plans and apply for more permits than they might have needed at that time.
The recession of the early 1990s was a major blow to the region and the City in particular. In addition to the slow down of economic activity, the aerospace industry was significantly cut back (which was a source of employment for many Moreno Valley commuters), and this was also the time of the BRAC closings. Norton Air Force Base in Riverside County was closed and March Air Force Base was re-aligned, with employment at the base falling dramatically. Construction, in this formerly rapidly growing community, stopped. For this area, the California recession was an actual depression.
Prior to 1990, Moreno Valley was approving several thousand housing permits per year. In 1991, it dropped to about 100-200 per year. (Currently, it has grown to several hundred). Prior to 1990, the city finances were based on growth. The large revenue flow from development processing fees masked any city financial problems—in fact, the flow from these fees was used to finance the needed expansion of police and fire operations. In fiscal year 1990-91, the city budget projected the receipt of $9 million from processing fees while actually received only $2 million. (Note that the City receives relatively low property taxes since it was incorporated after Prop. 13 and, by the nature of its predominantly “bedroom suburb” role, also receives relatively low sales tax revenues. In addition, the State allowed the County to charge booking fees for those that the city police arrest and within the next few years, there was the ERAF shift of about 9 percent of Moreno Valley’s property taxes. The loss of development fees, the enhancement of

56
public safety and state funding shifts converged to create an unprecedented budget problem. This led to a combination of local tax increases and expense reductions in the General Fund. Ultimately, the City had to cut $9 million on-going operating expenditures out of a $30 million general fund budget. None of these cuts came from public safety.
Despite the conservative nature of the citizens of the City, it dealt with this problem by raising the utility users tax and the business license tax in 1992. The utility tax of 6 percent generated about $5.25 million in revenues and continues as the number one tax revenue source in the City. In June 1997, the business tax and utility tax (together generating $7.5 million or 25 percent of the operating budget) were put on the ballot for voter approval. If they did not pass, they would be discontinued on December 31. They failed, with a 17 percent voter turnout, the taxes received 47 percent of the vote. The City Manager left in July 1997. Major cuts were identified by the City Council, including cuts in public safety. A new citizens’ group emerged to generate support for the taxes. After a bitter campaign, 53 percent of the voters approved the taxes in November 1997, so they never disappeared.
There was also a fee study that shored up some fees, as the city attempted to go to full cost pricing. This was also supported by the City Council. However, these increases were relatively small, since most of the fees were already very close to full cost recovery. (Note that the City does use internal pricing, and is a contract city for police and fire).
The City has gone to one-stop permitting for development and other services whenever possible.
The City uses a citywide community services district to assesses for parks and recreation, street lighting and landscaping. This was previously a county service area. The City is divided into five zones, two of which are strict geographically defined benefit assessment districts, while the other three are community wide. Together, they raise almost $10 million. Zone A fees for parks and recreation generate about $4 million per year. In the early 1990s, these fees were generating $1 million for capital in the early 1990s. They are used to fully fund parks and recreation, but now, because the parcel fees have not been increased over the last several years, parks and recreation is running an operating deficit of about $400,000. Proposition 218 would allow an increase in these fees, but the voters defeated a measure in 1998 that would have increased fees by approximately $8 per parcel.
Since the time of the voter approval of the business and utility tax, there has been some slight increasing in staff, particularly in police. Revenues are now covering operating expenses. Annual budget savings are used to finance capital facilities. The city finances are still very vulnerable to attacks on revenue sources under 218 referendums. This was demonstrated when an $8 per parcel park fee increase was voted down (receiving only 41 percent of the vote).
57
There is an emerging funding problem for landscape maintenance. Each new development project forms a landscape assessment district (not citywide). Each district’s parcels pay the same fee, approximately $50-55. If they went to a true benefit-assessment, the fees would range from $250 to $20. But, to change, they would have to go back to the property owners because of 218. As long as there is no incentive for the fee, there is no argument for a property owner vote. The fund, however, is expending its resources and a fee change will be necessary within two years. For new tracts, developers provide parks but not enough money for maintenance. The Council is currently opposed to new tracts paying an added $150/month for maintenance of new neighborhood parks.
There are no city Mello-Roos districts, but school district uses Mello-Roos (one of which costs $1000/unit/per year). The City did cooperate with schools to ensure full mitigation prior to 1A.
Redevelopment generates about $5 million per year, which is principally used for providing infrastructure in the old, previously county, areas. Infrastructure is lights, streets, and gutters. A priority goal is to improve public safety and improve areas. Redevelopment provides some assistance for economic development projects. The maintenance facility is used for rehabilitation and construction of affordable housing units.
There is some use of COPs—for infrastructure, building city hall and public safety building.
Moreno Valley has an ethnically diverse population. The school district is over one-half minority.
In the past two years, the City has implemented a citywide community policing program to develop a better working relationship with neighborhoods. To date, special city programs have been implemented specifically because of the development changes.
The City believes that the State’s actions (ERAF in particular) have taken local sources of revenue away and have forced local taxes to increase. This puts the City at more risk. Further, as the State continues to talk about reducing the motor vehicle license fee, and continues to backfill, it makes the City more dependent upon the State. In addition, there is a great deal of concern about the potential enactment of binding arbitration. This would be a “devastating” policy since the local officials might be more willing to grant increases rather than risk arbitration.
In terms of the budget process, the City has found that long term financial planning is becoming more effective. There are now formal projections of a ten-year capital improvement plan and a five-year operating budget. The actual budget is a two-year budget, which has resulted in large productivity savings. There are surveys of citizens, which indicate that they are satisfied with public safety, parks and libraries (libraries were taken over from the county). Over fifty percent of the citizens watch at least a portion of
58
the City Council meetings on cable. The two areas in which there seems to be low satisfaction are economic development (the citizens want to see more results) and financial management (the citizens are puzzled).
A new General Plan is currently being developed, which would maintain part of the City for rural development and perhaps maintain much of the City’s favorable development. The City is re-examining the job growth target. The current General Plan imagines two jobs per household—this is an intense job growth. Now, there is some questioning of this—does the City really want so many jobs and what about the character of the City.
The City has been working with other California cities, particularly through the League of California Cities, to protect existing revenue sources from state interference. In addition, city officials have been lobbying state legislators for a return of the property taxes taken by the state and relief from the requirement to pay booking fees. Though many citizens watch Council meetings on cable television, attendance of the public at Council meetings is generally low. The level of citizen participation for a city of nearly 140,000 is relatively low.
The City took over the library special district and received that district’s share of the property tax. This action led to service improvement.
The City Manager believes that the state legislature will continue to undertake actions that will act to threaten the City’s economic well-being. There will be more restrictions on contracting and concerns about binding arbitration. The State is also considering tax breaks for the entertainment industry. The general feeling is that the State is encroaching rapidly upon traditional areas of local control, making cities more and more dependent upon the state. Finally, the City Manager believes that e-tax relief can cause some major economic changes, as it gives favored status to only certain types of commerce. This will also reduce city sales tax revenues.
Santa Monica
Santa Monica is a beach city, located next to Los Angeles. It is a full service, charter city, with little or no vacant land, although there is constant new development. Until recently, it had stringent rent controls, with no vacancy decontrol and no taking rental units off the market, either by destruction or by condo-conversion. Santa Monica has a strong financial and management base, as exemplified by its debt receiving an AAA rating from all three rating agencies.
Santa Monica has a full set of full-cost service charges, although not all charges are implemented at 100 of costs. The decision as to how much of the charge to implement is done by the Council, with some equity considerations. The City has just completed a five-year re-evaluation to the city council. Five years ago, a similar re-evaluation established the set of charges, and included a CPI escalator clause. The Council keeps adjusting fees, and so now, some fees are up and some fees are down.
59
Santa Monica has implemented a benefit-assessment district to help the Third Street Promenade. The assessment district was used to refund the COPs that were issued to provide parking and to provide both capital and operating services for landscaping. The City would like to institute an additional assessment district for the Promenade, but, because of 218, might go to a Business Improvement District, which would not fall under the 218 restrictions.
The City would also like to implement a street and sidewalk assessment, but is not confident of passing the 218 restrictions. If the district is not successful, the City would have to confront an annual costs between $500,000 and $700,000.
Between the early 1980s and 1992-93, there were significant changes in the City’s revenue sources, as instigated by the City. There was an increase in the utility uses rate and base, the transient occupancy tax was increased, the business license tax was made more rational, which translated into increased revenues, the parking facility tax was increased and the property transfer tax was greatly increased. The guiding principle behind all of these increases was to set tax rates less than the surrounding districts, so that on a tax by tax or total tax liability comparison, Santa Monica would always look best. The absolute dollars revenues received from taxes is larger than that received from fees and charges. Further, there is an attempt to keep the taxes counter-cyclical, to consciously cushion against the possibility of bad times. The net result, in the City’s opinion is a diversified tax base. Prior to 218, all of the tax changes were passed by city council ordinance.
The City has a close relationship with its schools. Initially, there was a flat grant from the city to schools of $500,000. This has now grown to a year assistance grant of $2.25 million (used this year to refinance bonds) and there is an additional $1.9 million in school based services, such as after school activities, that the City provides free of charge. Altogether, including some other aid, the City estimates that it gives approximately $5 million a year to schools.
While there are no mitigation fees on developers for schools, there are developer fees for waste water recycling, as well as fees for parks, affordable housing, and housing the homeless. There are also existing developer agreements for storm drains and traffic mitigation.
Since 218, there have been no new taxes or fees. There has also been no re-validation yet after 218. The City anticipates that the only significant impact of 218 will be on streets and sidewalks. They are more fearful of what might happen if the state cuts the motor vehicle license fees and then gets into trouble so that it won’t be able to backfill.
There are three redevelopment areas in the City, two of which started in the 1970s. The first was for 10 acres downtown, and the proceeds were used mostly for parking; the second was for 25 acres in the Ocean park section of town, which was in need of redevelopment; the third came about after the earthquake in 1994. This area covers about

60
90 percent of the earthquake damming, or about 4.5 square miles out of the cities total 8 square miles. The City has no Mello-Roos districts and has sometimes used COP financing, for example on the 3rd street Promenade. The City has approved $43 million for a new public safety facility, but needed to issue only $11 million in debt and was able to pay cash for the rest. The have also the ability to issue $25 million in GO for libraries, but have only issued $4 million so far.
There have been no lay-offs, even during the early 1990 recession; however, there have been freezes on positions. The City tried to increase productivity through efficiency gains. There has only been one year when there have been no salary increases. Most of the time, there have been service increases. There are now more police, a greater use of information technology, and increase in parks, and better zoning enforcement.
Santa Monica has seen an increase in income levels, as rent controls have been lifted. Further, average homes are being demolished and replaced by much larger homes. There is a growing Latino population because of family size increases, but the city is sure that the vacancy decontrol may influence the ultimate number of Latinos within the City. The struggle is how to control development but as to scale and livability. With the impact of vacancy decontrol, the potential for increased rents is very high. There are stories of landlords offering tenants payments up to $25,000 to voluntarily vacate their apartment.
The State has affected Santa Monica’s housing policy principally by affecting the City’s ability to charge an in-lieu fee. The courts have made it more difficult to charge developer full mitigations, and LA traffic patterns affect Santa Monica congestion. However, service increases are more a function of income and community expectations than other governments or courts intrusions.
Santa Monica attempts to involve its citizens as much as possible in the government structure. City Council meetings are not only broadcast through cable, but they will be also broadcast on the Internet. The City pro-actively discussed the budget by giving briefings at four farmers’ markets, and 291 people attended. Citizens are encouraged to suggest budget changes through e-mail and are given feedback as to what department ultimately receives the suggestion and what ultimately happened to the suggestion. The City engaged in a major budget reform in 1997 when it invited finance people from ten cities across the U.S. to a think tank on how to successfully undertake multi-year budgeting and performance measures. This turned out successfully, and the Santa Monica budget is a very sophisticated budget and planning instrument. For example, Santa Monica now provides four years of information, rather than the traditional three years.
The City has also instituted, as part of the budget, key community concerns that cross department lines (e.g., livability). This, in theory, gets the departments to collaborate on dealing with the issue. This has had a mixed success record, and some retooling is going on, particularly in the tracking costs and performance of collaborative system. The collaboration also includes schools, non-profits, and the private sector. The goal of the entire process is to de-emphasize the “widget” mentality—input/output measures and

61
move to customer satisfaction measures. This would include benchmarking based on satisfaction measures, the City Council moving away from line item. The community is not apathetic. The public has the sense that it can pressure the City into doing what it wants.
The current General Plan was adopted in 1984, and there has been little change, although there has been some downzoning. There have been no changes in the uses, and the developers who wanted increased density have failed. There has been a conscious use of General Plan changes to direct development into certain parts of the City.
Santa Monica has no special district relationships.
The two particular problems mentioned by the City with respect to the future are e-tax and the role of the state potentially affecting its labor relations and potentially not being able to backfill the motor vehicle tax if there is a recession.
Santa Clara County
Santa Clara County is at the heart of “Silicon Valley.” The residents tend to be affluent and housing is expensive. It is about 40-50 miles south of San Francisco and its largest city is San Jose. Most of the population lives in incorporated areas, so there is little need for the County to worry about additional infrastructure. The finance director believes that the County has a strong financial base. The Board of Supervisors is fiscally conservative. Santa Clara County is the County with the largest number of exports in the United States, with much of it going to Asia. In addition, venture capital is enormous: during 1998, there was $3.4 billion of venture capital just in the County. The County has a low crime rate (even when the City of San Jose is included with the highest median buying income—that is income that includes non- wage and salary income—in the State). Research and Development funding, per occupation, is about three times the national average while the average R&D per employee is about $50,000 (the national average per employee is about $31,000-$32,000).
The County had significant financial problems after Proposition 13, and was forced to make cuts of $59 million, which was about 10 percent of the County’s budget. Since the board believes that it has a small amount of discretion, these 10 percent cuts have major consequences and should really be interpreted as having an impact beyond 10 percent.
Fees in Santa Clara County are attempted to be calculated as full cost-recovery fees and are adjusted from time to time. The principal fees are in the planning, building permits, and sanitation areas. There are also fees for parks, but the Board of Supervisors tempers them for social equity reasons.
Perhaps the most important revenue item in the Santa Clara finance area relates to a 1982 California Supreme Court decision that essentially said that under certain conditions, debt issue for retirement was voter approved debt. Under Proposition 13, financing this type of

62
debt was exempt from the Property tax limit. So in June 1982, the County began levying a tax for retirement. Santa Clara is the only County (at least in Bill’s knowledge) that does this, and the procedure raises a lot of money. In its first year it raised $10 million dollars; now, it is raising about $50 million. In 1984, the state legislature closed the door on this technique and capped the tax rate. Even so, the technique for Santa Clara County, covers the net cost of retirement, thereby easing a large strain on the Santa Clara County budget.
Santa Clara County does not have any GO debt. Most of the major capital projects are financed by COPs or Pay-As-You Go. Some of the PAYG projects are quite large, for example, the County constructed a $60 million county jail based on PAYG.
The County is well on the way toward funding the retiree’s health obligations. Pensions are overfunded by $600 million.
The County has also implemented a Transient Occupancy Tax which brings in about $300,00 per year which is given to various promote-the-arts-activities. The County receives little sales tax revenue and business license fees and utility taxes were considered but then rejected by the Board of Supervisors.
Even without these taxes, the County has built up a $24 million contingency fund, or about two percent of the General Fund revenues (less pass-through revenues).
The County does not fund any school district program per se, although the County, through its School Link Programs, does work with Schools to help them deal with problems. This is particularly true for probation and law enforcement activities. The County hopes to use some Proposition 10 money (increased cigarette tax) for a violence prevention task force to impact young children The County has no Mello-Roos debt, and so it has not, in the past, forced Developers to pay mitigation fees through this technique.
A particular problem in Santa Clara County is housing—the median housing value is between $300,000 and $398,000. The County is creating a housing trust fund to work with a federal agency so together there will be a $2 billion investment for affordable housing.
The County has no redevelopment projects and maintains that the City of San Jose’s projects has a very large negative impact on the County’s funds, on the order of $100 million per year.
The principal benefit assessment district is for libraries. Library fees were approved by a 2/3 vote within the last five years, but prior to Prop. 218. The libraries serve the County and some of the smaller incorporated cities.

63
The property assessment roll has risen by at least ten percent on each of the past two years. And, until this year, there was also double digit growth in sales tax revenue. There is no conclusive explanation for the later event.
Under the fiscal pressures of Proposition 13, the recession of the early 1990s and the ERAF program, the county did engage in significant service cut-backs. Nearly all of the departments were affected, in particular mental health, health, probation, the Sheriff and the courts. However, these cuts were deliberated by service (i.e., there were no across the board cutbacks) and by the financial implications of the cutbacks. That is, if a program was receiving either state or federal funding, and that funding would have been lost under a cut back, that service was spared. The library system would have been severely impacted if it hadn’t had the Benefit-Assessment fee revenues. Between 1990 and 1997, there was a cut of $300 million in service funding. In 1998, the County had some ability to begin to restore some of these cuts, but the forecast is for a very tight 1999-2000 budget, and it is unlikely that these cuts will continue to be restored. The County thinks that it is hamstrung by state and federal controls, since about 66 percent of its revenues come from these intergovernmental sources.
Santa Clara County has a history of being willing to tax itself to fund highways, and in 1984 did pass a tax to help build state highways. In a complex maneuver, on the same ballot has Proposition 218, in November 1996, the county increased its sales tax by 1/2 cent. It has since earmarked the revenues for transportation. This will raise $1.3 billion over nine years. This tax measure was in two parts. The first was a citizen advisory vote on whether the citizens though that any sales tax increases should go to the particular list of transit projects; the second was whether the sales tax should be increased and put in the General Fund. This later action would make the increase a general tax and subject to only a 50 percent majority.
The County has moved to a Comprehensive Performance management budget, which in theory engages management, the Board, and employees in a partnership. This particularly method is still evolving.
Although the public as a whole may be apathetic (the Board does not televise hearings and no one seems to care), individual constituencies are definitely not apathetic, in particular social services and mental health. These are articulate and effective special interest groups. The County has a very successful CalWORKS project and has seen caseloads fall and even General Assistance is down.
There is little fiscal pressure on the County in terms of development, principally because, for at least the last ten years, any development must be annexed to a city. This way the County does not have to worry about infrastructure finance. There is little pressure on the County for development, although every now and then, a golf course is proposed that would necessitate a change in the general plan. The County has little interaction with special districts since most of the population lives in the cities so there is little demand for county service provision. There are dependent fire and sanitation districts. The largest
64
special district is the independent transit district, which receives no property tax revenues but a 55 percent portion 1/2 cent sales tax increase.
The major problem that he County faces revolves around the county hospital. It is very vulnerable because the federal sources for running it are at risk.
The second problem relates to the lack of flexibility of revenue sources because of prop. 13, prop. 218 and ERAF. These are out of the control of the County and there is a great deal of uncertainty associated with them. Actually, the big concern is about the role of the federal government—the finance director believes that the state has already constrained the County so much that there is little left for them to do. Apparently, the federal government could still hurt the County.
Concerns about mandatory binding arbitration are not as pronounced as these other concerns.
Yolo County
Yolo County is primarily a rural county, located to the north and west of Sacramento, with a strong agricultural base. It has only a few cities94, within which most of the county’s population lives. Only 17,000 out of 150,000 live in the unincorporated area. The County gets very little property tax money—after ERAF, the County receives about 8 cents out of every property tax dollar collected. The Board of Supervisors is collegial and willing to step out in certain areas.
Yolo County has a formal fee policy, with an attempt to have the fees cover all of the relevant costs. There are fees for service as well as fees for permits. A master fee schedule is evaluated each year. When fees are not at 100 percent cost recovery or when they are reduced, it is done principally through an appeal process from the affected party. An example is when the fees for porta-pottys for farm workers were reduced because the farmers objected to the level of the fee. The largest fees are for development impacts, and are designed for full mitigation of the impacts of growth. However, these fees are not for existing infrastructure improvement, some of which may be made necessary because of the growth. The County’s policy, which is part of a city/county agreement, is that the major portion of development should occur in the cities. This protects the County from most of the additional costs of development. In dealing with cities on topics of annexation and redevelopment, the County’s goal is to make itself “whole.” The County feels that it has been generally successful in this attempt. An example of creativity in this area is the revenue sharing agreement between the County and Woodland, made in 1992-93. Under this agreement, the City increased its documentary transfer tax and shared the increase with the County. The amount of the increase was determined by an independent consultant.
The County has very little long term debt (in fact, until recently, it had zero long term debt) and what it has is for facilities. Most capital is funded under a pay-as-you-go plan.

65
There is very little use of COPs. For new capital, development fees generate about $500,000 a year, which allows for the pay-as-you-go financing ability,
The principal service cutback occurred when the County closed its hospital and contracted with the private sector to provide hospital services. There has been very little cuts in social services; however, there has not been growth in this area, so in real terms, there may have been some hidden cuts. There has also been aggressive management in the General Assistance area, leading to a drop in the GA budget from $1,000,000 to $500,000. The County’s goal in social service provision is to ensure that the services Yolo County provides are not more attractive than the services that surrounding counties provide, since Yolo County does not want to be a magnet. The County has engaged in some innovative internal consolidation activities in an attempt to save money. The superior and municipal courts have been consolidated, both intellectually and physically, and this has lead to cost savings. Over time there has also been significant consolidation of departments within the County; over the last several years, the number of departments has fallen from eight to four. This is done almost always by attrition—the County guarantees that there will be no loss of employment and no one will be financially hurt—if a consolidation occurs. Reorganization is always accompanied by a promise that service quality standards will not be lowered. Typically, when a department head leaves, that is considered to be an opportunity to examine potential merger activities. Because PERS (California’s state run retirement system for government—state and local—employees) has been so successful, this has generated savings for the county since its contribution would be less. There is also savings in the worker compensation program, principally because of a conscious effort of the CAO’s office working with the individual departments. The County has also tightened up on controlling phone and utility costs. The County does utilize some internal pricing, following OMB rules, for garage services, information technology, and liability insurance.
There are no county fees for school districts, with the Cities and developers expected to cover any additional costs. The County has no Mello-Roos districts, no benefit assessment districts, and has implemented no new taxes. The Board has chosen not to look at sales tax increases or utility taxes. There is no redevelopment activity in the County and minimal impact of Proposition 218 (only some fire districts may be effected in the longer run if they utilize assessments).
The major change in service delivery patterns occurred in the area of juvenile activity—that is out of county placements for perpetrators, and juvenile hall detainees. Realignment funds have paid for these changes. (Realignment hurt the first two years, but now seems to be working. Any new programs are due to the availability of new federal or state grants. For example, the adult drug court is funded by federal funds. This court is for drug dependency cases (not criminal cases). It involves the judges, the district attorney, the public defender, the probation depart and treatment providers. The judge is the case manager in this part of the system. Yolo County is currently out there searching for grants to fund additional services.

66
One exogenous barrier that the County identifies as hampering their ability to provide services is the way the funding stream is tied to administrative regulations. Often, it appears as if the County is serving the same people in multiple programs, but the County does not know where the recipients are because the reporting formats are so different. In addition, confidentially rules prevent inter-agency communications, which adds to the difficulty. The “system” makes it very difficult to cut across programs to coordinate services.
Currently, the budget is a strict Budget of Accounts, with the Supervisors seeing a simplified version, with aggregate numbers. It is not a program budget. The budget process is changing to involve more departmental inputs. The budget used to be a CAO budget; now the CAO and departments have similar responsibilities. However, this process is just at the beginning. Departments and the CAO are working on mission statements and value identification. Once these are in place, the department contribution to the budget will increase. As this process unfolds, some departments have citizen advisory groups working with them on these statements. The input of the advisory group occurs when the department is formulating the budget. Members of the advisory groups are appointed by members of the Board of Supervisors.
Currently, there is little citizen interest in the budget process or outcomes, primarily since so few people are affected by it. Council hearings have just started to be broadcast on a delayed basis. However, interested citizens can force action. Land use issues generate far more interest. There have been some General Plan changes, principally in the areas of where high density housing is to be located and the preservation of agricultural land. If agricultural land is taken out o agriculture, the County is now asking for mitigation. For each acre of agricultural land taken out of agriculture, there has to be the dedication of one acre preserved. This leads to the question of the quality of the preservation—how does the County preserve the best type of agricultural land and develop on the not-so-good type of agricultural land. The major recent rezoning question revolved around gravel mining outside of a creek channel . Ultimately the Board allowed out of channel mining, but set standards and established a land conservancy. This decision was actually more innovative and complex beneath the service, since it also involved the Winton Indian tribe that was building a casino. The tribe made a donation to improve sheriff services and the County used a portion of this donation to mitigate some of the environmental problems caused by the mining and restored the Creek.
There is an independent fire district in the County, which is not receiving more in property taxes than what it would cost the city to provide the service. There are also four community service districts, in water and sewers, which have minimal county involvement.
The principal future problems that the County identifies as crucial involve the dependence on the state for so much money, In particular, health and human services are too dependent on state financing. In addition, the public safety sales tax (Proposition 172) is not generating enough revenue for needed public safety.

67
Because it is a rural county, any time a city incorporates, for example, West Sacramento, there are potential fiscal problems. The West Sacramento incorporation, from the County’s perspective, had significant negative impact on the County’s finances.
Finally, the County worries that it is invisible to its citizens, and thus does not know how to meet public expectations.
Case Study Summary
Each of these five cities attempt to provide service levels that are constant or increasing, even in the light of fiscal constraints. To do so, they often utilize fees, development agreements, and Mello-Roos (if they can) or COPs (if they want). The city managers each take different approaches to their cities, but all are constantly looking for the revenue and service niches that would allow them to improve their city. All of the cities were conscious of school district finances and were attempting to help the school district improve. Each of the cities is concerned about losing a portion of their immunity to the state and federal governments, particularly in the form of the state meddling in the collective bargaining process and the federal government’s affecting their tax revenues through allowing e-commerce to be tax free.
The two counties were far more constrained. They were hesitant to undertake many new programs, were distrustful of the state and federal government’s willingness to continue funding, and were very incremental in their decision making because of their fears of poor behavior of the higher levels of government.
There is one other difference between the two types of jurisdictions. With the exception of Moreno Valley, the City Councils were at least willing to entertain the notion of tax increases, especially utility taxes or transient occupancy taxes. The Boards of Supervisors were far more hesitant to travel along this road. This raises the question of whether stress can be self-induced. If the voters or elected officials cut taxes (or don’t raise fees when other revenues fall), and then are forced to cut (or not expand) services, is this true fiscal stress or is it an example of a Tiebout activity, in which the costs are only transition costs.
Some Conclusions
There are several interrelated concepts—local autonomy, fiscal autonomy, initiative, and immunity, that affect the ability of the local community to react to citizens’ tastes and preferences, especially if these preferences are changing or if there is an exogenous impact on the community. These concepts seem to have some theoretical validity, and can help explain some of the activities that counties have engaged in during the last twenty years. Certainly, counties demonstrate little variation among themselves as they raise money, take money, and provide services. They do appear to have very limited fiscal autonomy and therefore have little local autonomy to reflect these potentially

68
changing preferences. Future research needs to be done, starting with cities, to determine if this pattern holds.

69
Endnotes
1 This paper will not investigate the interactions between local government autonomy and the autonomy of the local citizen. However, they clearly act as constraints upon each other.
2 With the advent of the Internet, this geographical restriction should be reexamined. Unfortunately, that is beyond the scope of this paper. Note that in feudal Europe, lords and monarchs ruled by virtue of control of agriculture and by military, but shared rule with the religiously based authority exercised by the non-territorial Roman Catholic Church. (Gurr and King, 11).
3 Boyne actually phrases his argument in terms of constraints.
4 City of Clinton v. Cedar Rapids and Missouri River Railroad Co., 24 Iowa 455 (1868), p. 145. In a separate case, the U.S. Supreme Court upheld this reasoning. See Atkins v. Kansas, 191 US 207 (1903), pp. 220-221.
5 As will be seen in the case studies, at least some cities routinely engage in “deal-making” with the private sector. It may be that some local autonomy is a necessary condition in order for these deals to be made.
6 Note that by implicit assumption, in equilibrium, all of the citizens of a jurisdiction are homogeneous. Thus, median voter models are not necessary to analyze outcomes.
7 Or, at a minimum, keeps them on the same indifference curve.
8 For a similar type of analysis see Hirschman, (1970).
9 A second category of event is the constant demographic change that occurs within the community. For example, as the population in the community ages, it would be expected that the demand for education changes. For this paper, the simplifying assumption that as people’s tastes and preferences change, they leave the community for one that more closely matches their new preferences. Thus, while there will always be variance around the mean level of preferences, the mean will not change and the model can be applied.
10 See Dye (1990) pp. 12-15 on political versus economic competition. Dye also explicitly includes adequate information as a necessary condition for political competition.
11 Note the similarity to the problem of where equilibrium will occur on the contract curve in an Edgeworth Box

70
12 To the extent that the power to tax is equivalent to the power to regulate, tax limitation movements can be incorporated into the analysis.
13 See Harvey Leibenstein (1976), Beyond Economic Man.
14 See Mancur Olson, The Rise and Decline of Nations (1982).
15 Projects may range from service delivery alternatives to revenue raising alternatives.
16 See Pressman and Wildavsky, Implementation 1973.
17 Including the decision not to fund a particular service.
18 Even when it appears as if local governments have a high percentage of their revenues coming from the state, it may not given a true indication of the level of autonomy that the local governments have. There are some cases, e.g., Norway and Israel, where some local governments have been able to be autonomous even with large state contributions. See Carlsen 1995 and Kalchheim and Rozevitch, 1990.
19 Even prior to the passage of Proposition 13, the control of the property tax was with the state. Earlier legislation, SB 90 of 1971, capped the property tax rate and the state mandated a single roll system, with the value of assessed to market value being maintained at 35 percent. Only the base was unconstrained. Proposition 13 gave control over the base to the State Constitution, with property being reassessed principally during changes of ownership. However, the state did not control the allocation of property tax receipts under SB 90, although it does under Proposition 13.
20 Clark also argues that the Tiebout hypothesis does not have a theory of local government as a political institution. Rather, Tiebout assumes that local governments respond to local preferences and thus have the power of initiation. However, local governments cannot coerce residents to remain, and thus there must be less than perfect immunity to allow the citizens to leave. Clark believes that Tiebout’s local jurisdiction would be a Type 2 local government (202)
21 For more detail on some of these consequences, see Chapman (1998c).
22 See Dean Misczynski (1986) for the first use of this term.
23 There were 300 project areas in 1980.
24 1993 legislation attempted to force a more rigorous definition of blight and encourage the provision of more low-moderate income housing.

71
25 These fees included water and sewage charges, permit fees, traffic mitigation fees, fire fees, park fees, and school fees (imposed by school districts), Dresch and Sheffrin, 1997.
26 Between 1985 and 1995, about $28 billion of General Obligation bonds were issued by California state and local governments compared to about $40 billion of COPs; an additional $7 billion in COPs were issued in 1996 and 1997).
27 These have also been restricted by Proposition 218 and their use is expected to decline.
28 See Chapman, 1996.
29 In the City of Santa Monica, the city council uses these types of technologies to obtain citizen input on some city level decision making.
30 Local governments may weight ballots in proportion to fee liability.
31 For more detail on realignment, see Chapman, 1998a and 1998b
32 For more detail on ERAF and the sales tax increase (Proposition 172) see Chapman, 1998a and 1998b.
33 From 1978 to 1986, it was impossible under Prop. 13. In 1986, voter approved G.O. debt became feasible with a 2/3 vote (identical to the Pre-Proposition 13 requirements). However, by this time, the state had taken over so much of the school finance that they was a disconnect between school finance and the local voter. This disconnect is slowly being mitigated, and school districts are not sometimes successfully issuing debt, although the pass rate is usually around 50 percent).
34 Technically, the legislature agreed with the “Big 5” decision.
35 These data are for 57 California counties—San Francisco is excluded from the analysis because it is both a city and a county. The tables are slightly different because the Controller changed reporting formats during this time period.
36 Counties, (as well as cities) might have some control over the composition of the property tax base through the use of zoning and redevelopment activities.
37 There are several qualifications to this method of analysis. For example, even though General Assistance is fully funded by the county, the State determines the level that the county must offer. Or, to the extent that the federal government imposes cross-cutting mandates (safety standards, disability access standards, etc., this costs are also mandates, but are very difficult to ascertain. The above percentages must be considered as probably biased down.

72
38 However, the coefficient of variation for the sheriff is greater than the coefficient for the aggregate of protective services.
39 According to the Legislative Analyst, the counties have total policy control only over libraries, parks and recreation, and roads. All of the other principal programs are under joint state-county control (LAO, December 1998).
40 Coleman (1999) argues that service charges and enterprise revenues should not be counted as discretionary revenues. If this argument is accepted, then cities control less than half of their revenue sources.
41 This includes federal revenue sharing, a program that did not exist in 1995-96.
42 Note the similarity to the county results, which show approximately the same phenomena. Perhaps the voters were correct when they argued that the bureaucracy was too large in local governments.
43 For a general discussion of development fees, principally focused at the national level and without the discussion of local autonomy, see Altshuler and Gomez-Ibanez (1993).
44 For an analysis of the processing application fees, see California State Legislature, Senate Committee on Housing and Land Use, (1995).
45 For a list of exactions that can be imposed under the Subdivision Map Act, (see OPR, 26).
46 See Curtin (1998) for numerous court citations and expansion of much of what is discussed in this section.
47 This section is based on Senate Committee, (1995) p. 14.
48 This phenomena is sometimes known as the welcome stranger effect.
49 These are normalized for a three bedroom, two bath 2000 square foot home.
50 Sonderling v. City of Santa Monica, 142 Cal. App. 3d 501, 506 (1983).
51 Russ Bldg. Partnership v. City and County of San Francisco (199 Cal. App. 3d 1496 (1987).
52 Candid Enterprises, Inc. v. Grossmont Union High School District., 39 Cal. 3d 878 (1985).
53 Much of the following section is based on Curtin and OPR.

73
54 Also, the government cannot deny an owner an economically viable use of the land
55 Associated Home Builders, Inc. v. City of Newark, 18 Cal. App. 3d 107, 111 (1971).
56 See Curtin for a more detailed explanation of these two decisions: Nollan v. California Coastal Commission (483 U.S. 825 (1987) and Dolan v. City of Tigard (512 U.S. 374 (1994).
57 Ehrlich v. City of Culver City, 12 Cal. 4th 854 (1996). Again, see Curtin for a detailed explanation.
58 The Courts seem to be lenient in deciding when a fee is a tax and when it is a fee. For a good discussion of when a fee is a fee rather than a special tax, see the Sinclair Paint Company v. State Board of Equalization 15 Cal 4th 866 (1977). In this Supreme Court decision, the Court decided that fees imposed on manufacturers under the Childhood Lead Poisoning Prevention Act were not taxes, and so did not have to be enacted by a two-thirds vote of the legislature. Rather, the fees were regulatory fees imposed as an exercise of the state’s police power to mitigate the anticipated adverse effects of the fee payers’ operations and because under this act, the fees were required to bear a reasonable relationship to the adverse effects. Note the close relationship of this interpretation to development fees,
59 Centex Real Estate Corp. v. City of Vallejo, 19 Cal. App. 4th 1358 (1993).
60 For an excellent extended discussion of this topic, see Dresch and Sheffrin. For a more formal model that is quite sophisticated, see Yinger.
61 This argument shows up in the popular press as a given, with no introspection or analysis. See, for example, Craft and Les, 1998)
62 Although not considered in this section which is focused on developer fees and exactions, Proposition 218 significantly affected special assessments which have often been used to provide infrastructure.
63 The July, 1997 clean-up legislation (SB 919, Chapter 38) did not flatly prohibit such initiatives although it did bolster the impairment of contract argument. (Curtin, 206-207)
64 State and Highways Code Section 36500 et. seq.
65 This is in agreement with the Attorney General’s opinion 97-302, July 14, 1997.
66 Los Angeles County Superior Court Case No. VC153057

74
67 98 Daily Journal D.A.R. 8501
68 Financing operating expenditures for schools is also a complex illustration of state and local interrelationships—see for example the preceding ERAF discussion.
69 Developers could also build schools or voluntarily contribute funds towards school construction, but there is no mention in the literature of this occurring during this time period.
70 The board consists of two state Senate members appointed by the Senate Rules Committee, two state Assembly members appointed by the Speaker of the Assembly; the Director of the Department of General Services (or designee), the Director of the Department of Finance (or designee) and the Superintendent of Public Instruction (or designee). The four legislatively appointed members provide a strong policy influence. See Cohen, 5.
71 Cohen, 10.
72 Because California does not have a split roll, most jurisdictions could not lower the tax rate because only about one-third of the base was rapidly growing. A lower rate would apply to both the growing basis and the relatively static base.
73 There may have been the use of this technique outside of California prior to 1972 since a 1964 Yale Law Journal article Heyman and Gilhool challenged the concept that exactions for school facilities was unconstitutional (Home Builders Association).
74 In 1976 the state passed a school funding program that would have provided loans to school districts for reconstruction, modernization, and replacement of facilities that were more than 30 years old. Under this legislation, the state would hold a lien on the property for the duration of the loan, so that the school districts would not be able to speculate on land purchases funded by the state. The bond initiative that was necessary to fund this program did not pass. However, the Act did create a point system that was to be used for creating a queue of approved projects. Points were based on the number of unhoused students, rate of enrollment growth, and the amount of needed rehabilitation. In addition, a first-come, first-served policy was implemented in which each accepted school district’s application was time and date stamped (Cohen, 12).
75 General Obligation debt financed by the property tax became legal in 1986 when the voters approved an initiative (Proposition 46) that allowed GO debt to be issued with a two-thirds property tax override.

75
76 The State also has a “bailout” plan for local governments and schools. In exchange for this money, the State expected school districts to conform to its programs and projects (Cohen, 12).
77 There was an additional amount of $150 million per year for 1984 and 1985 from Tidelands Oil revenues.
78 In 1991 the State Auditor General reported significant mismanagement of state funds allocated to schools. It found unrecovered construction loan funds, overpayment with no attempt to recover the overpaid costs, dispersal of funds with proper documentation, and the non-conducting of close out audits on construction projects (Cohen, 17).
79 This became Education Code section 17620 in 1998.
80 This right to charge development fees was unanimously held to be constitutional by the California Supreme Court in 1985. See Candid Enterprises. Inc. v. Grossmont Union High School District (1985) 39 Cal.3d 878, 705 P.2d 876; 218 Cal. Rptr.303. But also see constraints of California Bldg. Industry Assn. v. Governing Bd. (1988) 206 Cal.App.3d 212; 253 Cal. Rptr. 497.
81 See OPR, 35-37.
82 This will be debt for primarily capital facilities.
83 A variation on the vanilla COP lease structure is an Asset Transfer/Equity strip lease financing. Under this process, the school district leases existing school district property to a third party, for example a nonprofit corporation, for a one-time payment of rent. The third party sublets the property back to the school district. The third party’s right to receive the school district lease payment is assigned to a trustee who delivers the COPs to the investors. The sale of the COPs are used to make the one-time suite lease rental payment to the school district, which then uses this money for a capital project (which may have no relationship to the leased property).
84 This is an important distinction, since under Proposition 13, special taxes need a two-thirds majority to pass.
85 In addition, this levy would not violate the Serrano principle, since the assessment is not based on property value but on the degree of benefit received by a particular parcel.
86 In addition, there was the pressure to invest resources to improve the technological capacities of the schools.
87 It is now Section 16, Part 68 (beginning with Section 100400 and ending with Section 100560) of the Education Code.

76
88 For a more detailed summary, see “Analysis of November 1998 Ballot Measures” pp. 14-15.
89 These caps can be exceeded under certain conditions, involving school crowding, debt limits and bond elections.
90 The implication is that all fees will be shifted forward to the consumer.
91 In addition, school districts that receive state bond proceeds are required to set aside three percent of their general funds each year for twenty years for deferred maintenance purposes.
92 Hardship is based on three broad categories: financial, physical, and excessive costs (Cohen, 29)
93 The previous discussion of the Mira-Hart-Murietta cases highlighted the differences between legislative acts that establish land use policy and adjudicatory acts that apply land use policy to a specific project. The Courts allowed fees to be in excess of statute if there were derived from legislative land use decisions. SB 50 expanded the prohibition to include any legislative or adjudicative act, thereby preventing local governments from imposing fees under either of these conditions (Strauss, 156).
94 One of which is Davis, the home of a University of California campus.
Bibliography
Altshuler, Alan A., and Jose A. Gomez-Ibanez. 1993. Regulation for Revenue. Cambridge, MA: The Lincoln Institute of Land Policy.
American Planning Association. 1999. “Can the New School Fee Bill Be Implemented?” in Implementing Proposition 1A: What School Districts, Cities, Counties, and Developers Need to Know. UCLA Extension Public Policy Program (January 21): 166-187.
“Analysis of November 1998 Ballot Measures.” 1998. Cal-Tax Digest 2, 8 (October): 14-28.
Behn, Robert D. 1995. “The Big Questions of Public Management,” Public Administration Review 55, (July/August): 313-324.
Boyne, George A. 1993. “Central Policies and Local Autonomy: the Case of Wales,” Urban Studies 30, 1: 87-101.
Boyne, George A. 1996. “Competition and Local Government: A Public Choice Perspective,” Urban Studies 33, 4-5: 703-721.
Bradbury, Katherine L. 1982. “Fiscal Distress in Large U.S. Cities,” New England Economic Journal, (November/December): 33-44.
California State Legislature, Senate Committee on Housing and Land Use. 1995. Developer Fee. Sacramento.
Carlsen, Fredrick. 1995. “Why is Central Regulation of Local Spending Decisions So Pervasive? Evidence from a Case Study.” Public Budgeting and Finance 15, 1 (Spring): 43-57.
Chapman, Jeffrey I. 1996. “The Challenge of Entrepreneurship: An Orange County Case Study,” Municipal Finance Journal 17: 16-32.
Chapman, Jeffrey I. 1998a. Proposition 13: Some Unintended Consequences. San Francisco: Public Policy Institute of California.
Chapman, Jeffrey I. 1998b. “The Continuing Redistribution of Fiscal Stress: the Long Run Consequences of Proposition 13,” Working Paper. Cambridge, MA: Lincoln Institute of Land Policy.
Chapman, Jeffrey I. 1998c. “Proposition 13: Tax Limitations and Unintended Consequences,” Lincoln Institute of Land Policy, Chairman’s Roundtable.
Chapman, Jeffrey I. 1980. Proposition 13 and Land Use. Lexington, MA: Lexington Books.

78
Clark, Gordon L. 1984. “A Theory of Local Autonomy,” Annals of the Association of American Geographers 74, 2: 195-208.
Cohen, Joel. 1999. School Facility Financing. Sacramento: California Research Bureau, (February).
Coleman, Michael. 1999. “A Voyage into the Strange World of California Municipal Finance.” Sacramento: League of California Cities (June 4).
Craft, Cynthia H., and Kathleen Les. 1998. “School Bonds,” California Journal, (November).
Curtin, Daniel J., Jr. 1998. Curtin’s California Land Use and Planning Law, 18th Edition. Point Arena, CA: Solano Press Books.
Coase, R. H. 1960. “The Problem of Social Cost,” The Journal of law and Economics 3, (October): 1-44.
Dowding, Keith, Peter John, and Stephen Biggs. 1994. “Tiebout: A Survey of the Empirical Literature,” Urban Studies 31, 4/5: 767-797.
Dresch, Marla, and Steven M. Sheffrin. 1997. “The Role of Development Fees and Exactions in Local Public Finance,” State Tax Notes, (December 1): 1411-1416.
Dye, Thomas R. 1990. American Federalism: Competition Among Governments. Lexington, MA: Lexington Books.
Edsource Edfact. www.edsource.org/htmfiles/efct_facilities.htm
Gurr, Ted Robert, and Desmond S. King. 1987. The State and the City. Chicago: University of Chicago Press.
Hamilton, Bruce W. 1976 “Capitalization of Interjurisdictional Differences in Local Tax Rates,” American Economic Review 66, (December): 743-753.
Hirschman, Albert O. 1970. Exit, Voice, and Loyalty. Cambridge: Harvard University Press.
Home Builders Association. 1999. Handout at UCLA conference on “Implementing Proposition 1A,” (January 21).
Edsource Edfact. www.edsource.org/htmfiles/efct_facilities.htm
Kalchheim, Chaim, and Shimon Rozevitch. 1990. “Deficits in Local Government Budgets in Israel: A Reflection of Political Cycles and an Expression of Local Autonomy,” Public Budgeting and Finance 10, 1 (Spring): 67-76.

79
Kirlin, John J. 1996. “The Big Questions of Public Administration in a Democracy,” Public Administration Review 56, 5 (September/October): 416-4320.
Kirlin, John J. 1997, “The Impact of Fiscal Limits on Governance,” Presented at the meetings of the National Academy of Public Administration, (June 6-8, 1998).
Klaphake, Ron. 1998. Montana’s Local Government Review Process: Innovative Constitutional Theory and Civic Practice. DPA Dissertation. University of Southern California.
Legislative Analyst. 1998. “Cal Facts,” Sacramento: State of California (December).
Legislative Analyst. 1999. “Shifting Gears: Rethinking Property Tax Shift Relief,” Sacramento: State of California, (February 2).
Leibenstein, Harvey. 1976. Beyond Economic Man. Cambridge: Harvard University Press.
Logan, John R., and Harvey L. Molotch. 1987. Urban Fortunes: The Political Economy of Place. Berkeley, CA: The University of California Press.
Lowery, David, W.E. Lyons, and Ruth Hoogland DeHoog. 1995. “The Empirical Evidence for Citizen Information and a Local Market for Public Goods,” American Political Science Review 89, 3 (September): 705-707.
Misczynski, Dean. 1986. “The Fiscalization of Land Use,” in John J. Kirlin and Donald R. Winkler (eds.) California Policy Choices, Vol. 3. Sacramento, CA: University of Southern California.
Myles, Gareth D. 1995. Public Economics. New York. Cambridge University Press.
Neumann, Francis X. Jr. 1996. “What Makes Public Administration a Science? Or, Are Its ‘Big Questions’ Really Big?” Public Administration Review 56, 5 (September/October): 409-415.
Oakland, William H. 1979. “Proposition 13—Genesis and Consequences,” National Tax Journal 32, 2-Supplement (June): 387-409.
Office of Planning and Research. 1997. A Planner’s Guide to Financing Public Improvements. Sacramento: Governor’s Office of Planning and Research, (June).
Olson, Mancur. 1982. The Rise and Decline of Nations. New Haven: Yale University Press.
Orrick, Herrington & Sutcliffe. 1996. The XYZs of School District Debt Financing. San Francisco: Orrick, Herrington & Sutcliffe

80
Pressman, Jeffrey L., and Aaron B. Wildavsky. 1973. Implementation. Berkeley: University of California Press.
Sharp, L.J., and K. Newton. 1984. Does Politics Matter? The Determinants of Public Policy. Clarendon Press, Oxford.
Sokolow, Alvin D. 1993. “State-Local Relations in California: What Happens When They Take Away the Property Tax,” Working Paper, Department of Community Development, University of California, Davis.
Sonstelie, Jon and Paul R. Portney. 1978. “Profit Maximizing Communities and the Theory of Local Public Expenditures,” Journal of Urban Economics 5: 263-277.
Shannon, John. 1991. “Federalism’s Invisible Regulators: Interjurisdictional Competition,” in Daphane Kenyon and John Kinkaid (eds.) Competition Among States and Local Governments. Washington D.C.: Urban Institute Press: 117-125.
Strauss, Betsy. 1999. “The Leroy F. Greene School Facilities Act of 1998, the Role of Cities and Counties: New Limitations on Local Land Use Authority for School Facilities,” in Implementing Proposition 1A: 150-165.
Teste, Paul, Mark Schneider, Michael Mintrom, and Samuel Best. 1993. “Establishing the Micro Foundations of a Macro Theory: Information, Movers, and the Competitive Local Market for Public Goods,” American Political Science Review 87: 702-713.
Teste, Paul, Mark Schneider, Michael Mintrom, and Samuel Best. 1995. “Reply,” American Political Science Review 89: 707-709.
Tiebout, Charles. 1956. “A Pure Theory of Local Expenditure,” Journal of Political Economy 64, 5 (October): 416-424.
Walters, Dennis. 1999. “Districts, Cities, Counties Discuss New School Funding: From Bonds to Planning, Witnessing an ‘Oceanic Change’,” California Municipal Finance Journal 5, 4 (February 22).
Wolman, Harold, and Michael Goldsmith. 1990. “Local Autonomy as a Meaningful Analytic Concept,” Urban Affairs Quarterly 26, 1 (September): 3-27.
Yinger, John. 1998. “The Incidence of Development Fees and Special Assessments,” National Tax Journal 51, 1(March): 23-42.

81
Table 1: Relative Importance of County Revenue Sources—1996-97
Source Average Percent
Standard Deviation
Coefficient of Variation Range Low Range High
Property Tax 12.9 5.3 .41 5.9 (Orange)
31.1 (Mono)
Other Tax 4.9 3.5 .72 .8 (Solano)
25.1 (Mariposa)
Benefit Assessment
.2 .6 2.76 0 (42 Counties)
3.4 (Tuolome)
Licenses and Permits
1.6 .7 .46 .3 (Alameda)
3.3 (Tuolome/
Colusa) Fines and Forfeitures
1.4 .8 .55 .3 (Trinity)
4.4 (Napa)
Use of Money and Property
2.1 1.2 .55 .5 (Humboldt)
5.8 (Orange)
State Aid 43.2 5.8 .13 26.0 (Alpine)
53.4 (Kings)
Federal Aid 19.5 5.5 .28 9.5 (Mono)
34.6 (Trinity)
Other Aid .9 1.4 1.49 0 (11 Counties)
4.4 (Mariposa)
Charges 8.4 3.2 .38 3.6 (Lassen)
16.0 (Contra Costa)
Miscellaneous 3.7 3.0 .81 .3 (Stanislaus)
18.5 (Alpine)
Other 1.2 3.4 2.75 0 (21 Counties)
7.4 (Placer)

82
Table 2: Relative Importance of County Revenue Sources—1977-781
Source Average Percent
Standard Deviation
Coefficient of Variation Range Low Range High
Property Tax 30.0 .7 .23 14.0 (Trinity)
41.0 (San Mateo)
Other Tax 6.1 3.5 .58 2.0 (Alameda)
19.6 (Mono)
Licenses and Permits
1.5 .9 .61 .2 (Alameda)
5.9 (Nevada)
Fines and Forfeitures
1.4 .5 .35 .5 (Trinity and
Los Angeles)
2.9 (Colusa)
Use of Money and Property
2.3 1.0 .45 .9 (Modoc)
6.8 (Amador)
State Aid 23.2 3.7 .16 14.6 (Mono)
28.4 (San Joaquin)
Federal and Other Aid
28.4 8.0 .28 14.2 (Nevada)
53.8 (Trinity)
Charges 6.1 4.7 .76 .7 (Trinity)
20.0 (Modoc)
Other 1.3 1.4 1.1 0 (Sierra)
7.9 (Solano)
1 Since the Controller slightly changed classification schemes, the categories are not identical. However, the differences are quite small.

83
Table 3: Relative Importance of County Expenditures—1996-97
Source Average Percent
Standard Deviation
Coefficient of Variation Range Low Range High
General Government
11.9 4.8 .405 5.2 (San Joaquin)
21.9 (Mono)
Protection (Total)
29.9 4.5 .150 21.9 (Humboldt and
Modoc)
45.7 (Amador)
Sheriff 7.0 2.5 .361 2.6 (Alameda)
15.5 (Placer)
Detention and Corrections
7.7 2.2 .288 3.1 (Santa Clara)
13.0 (Lassen)
Public Ways 8.6 6.6 .768 1.4 (Orange and Stanislaus)
26.8 (Alpine)
Health and Sanitation
13.6 3.8 .277 3.2 (Yuba)
26.3 (Santa Cruz)
Public Assistance
31.6 10.4 .330 11.3 (Alpine)
48.0 (Fresno)
Recreation and Culture
.7 .8 1.044 0 (10 Counties)
3.1 (Santa Clara)
Other 3.6 2.3 .65 .8 (Sierra)
9.8 (Calaveras)
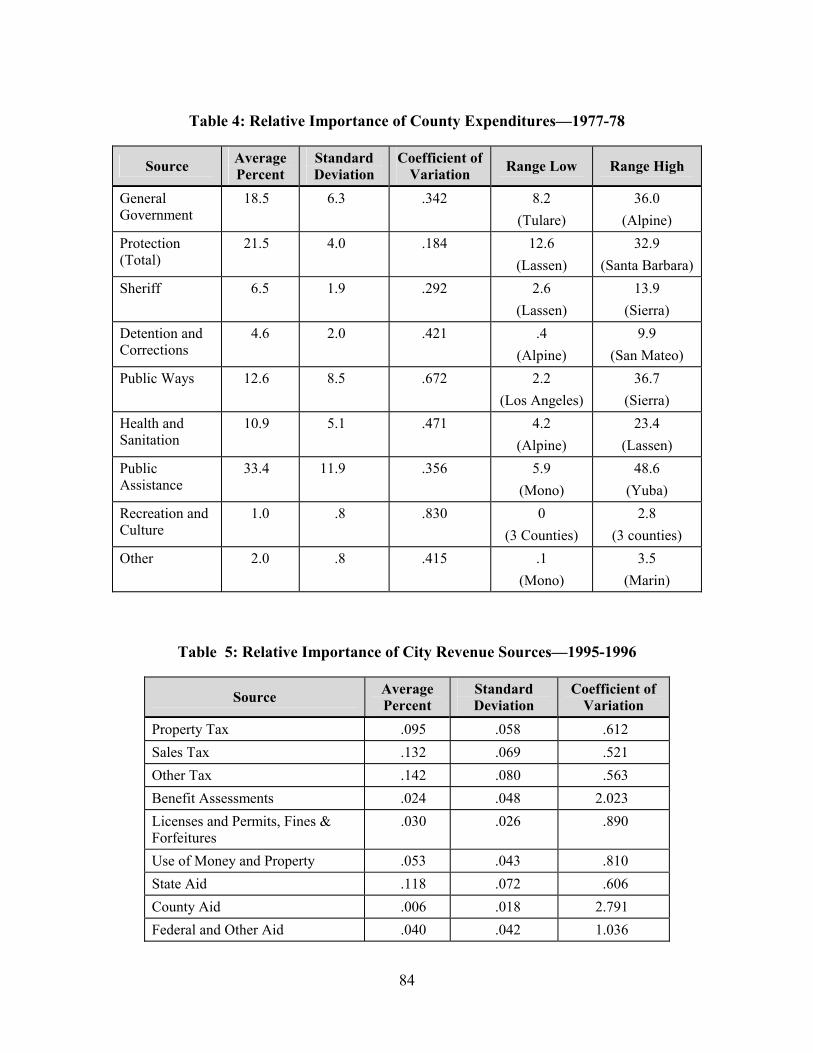
84
Table 4: Relative Importance of County Expenditures—1977-78
Source Average Percent
Standard Deviation
Coefficient of Variation Range Low Range High
General Government
18.5 6.3 .342 8.2 (Tulare)
36.0 (Alpine)
Protection (Total)
21.5 4.0 .184 12.6 (Lassen)
32.9 (Santa Barbara)
Sheriff 6.5 1.9 .292 2.6 (Lassen)
13.9 (Sierra)
Detention and Corrections
4.6 2.0 .421 .4 (Alpine)
9.9 (San Mateo)
Public Ways 12.6 8.5 .672 2.2 (Los Angeles)
36.7 (Sierra)
Health and Sanitation
10.9 5.1 .471 4.2 (Alpine)
23.4 (Lassen)
Public Assistance
33.4 11.9 .356 5.9 (Mono)
48.6 (Yuba)
Recreation and Culture
1.0 .8 .830 0 (3 Counties)
2.8 (3 counties)
Other 2.0 .8 .415 .1 (Mono)
3.5 (Marin)
Table 5: Relative Importance of City Revenue Sources—1995-1996
Source Average Percent
Standard Deviation
Coefficient of Variation
Property Tax .095 .058 .612 Sales Tax .132 .069 .521 Other Tax .142 .080 .563 Benefit Assessments .024 .048 2.023 Licenses and Permits, Fines & Forfeitures
.030 .026 .890
Use of Money and Property .053 .043 .810 State Aid .118 .072 .606 County Aid .006 .018 2.791 Federal and Other Aid .040 .042 1.036

85
Service Charges and Enterprise Contribution
.295 .165 .558
Other .066 .093 1.415
N = 117

86
Table 6: Relative Importance of City Revenue Sources—1977-1978
Source Average Percent
Standard Deviation
Coefficient of Variation
Property Tax .171 .084 .495 Sales Tax .190 .081 .424 Other Tax .067 .058 .868 Licenses and Permits, Fines & Forfeitures
.039 .023 .599
Use of Money and Property .031 .037 1.196 State Aid .163 .074 .455 County Aid .012 .023 1.962 Federal and Other Aid .208 .132 .637 Service Charges and Enterprise Contrib.
.105 .071 .674
Other .014 .037 2.611
N = 104
Table 7: Relative Importance of City Expenditures—1995-96 (Operating Expenditures Only)
Average Standard Deviation Coefficient of Variation
General Government .139 .091 .656 Police .238 .076 .319 Non-Police Public Safety .097 .075 .775 Public Works .230 .094 .409 Health Services .003 .012 4.353 Library Services .009 .019 2.188 Parks and Rec. .074 .051 .681 City Owned Enterprises & Public Utilities
.201 .151 .751
Other .009 .057 6.308
N = 117

87
Table 8: Relative Importance of City Expenditures—1977-78 (Operating Expenditures Only)
Average Standard Deviation Coefficient of Variation
General Government .318 .110 .344 Police .234 .075 .320 Non-Police Public Safety .103 .072 .699 Public Works .229 .106 .463 Health Services .003 .011 4.216 Library Services .013 .024 1.896 Parks and Rec. .079 .045 .574 City Owned Enterprises & Public Utilities
.009 .023 2.629
Other .013 .043 3.212
N = 104

88
Table 9: Characteristics of Case Study Jurisdictions
Jurisdiction 1996 Population
1978 Population
1995-96 Per Capita
Revenues
1977-78 Per Capita Revenues
(in 1996 dollars)
1995-96 Per Capita Operating
Expenditures
1977-78 Per Capita Operating Expenditures
(in 1996 dollars) Rocklin 27,199 5,613 $627 $705 $552 $458 Chico 48,442 25,239 $723 $986 $534 $571 Thousand Oaks 112,600 64,849 $712 $432 $557 $315 Moreno Valley 135,635 $372 $299 Santa Monica 90,262 93,000 $2,433 $907 $1,877 $748 County of Santa Clara 1,653,061 1,222,835 $728 $792 $711 $804 County of Yolo 154,582 106,000 $868 $926 $841 $840

Appendix
A stratified, by population, sample of cities was utilized. This was done for two reasons: one theoretical and the other pragmatic. The theoretical reason relates to the heavy weight that the relatively few large cities have in the aggregate data. By stratifying the sample, the smaller cities can be more accurately represented. The pragmatic reason is that although the Controller’s reports give printed data for each of the cities, it is in disaggregated form (in terms of categories) and it would be an immense undertaking to make the entire set of cities user friendly.1 The following tables (Appendix Tables 1 and 2) compare the budget characteristics of the sample to the aggregate state total.
There are some interesting differences between the stratified sample and the aggregate which includes all of the very large cities (the sample only included Fresno and Sacramento as representing large cities) for the most recent year. In particular, state aid is far more important for the sample, while service charges and enterprise contributions are more important for the total. Additional research is necessary to explain these differences.
A few additional notes regarding expenditures are necessary. The Controller significantly changed classification systems between 1977-78 and 1995-96. This paper attempted, with one exception, to revise the Controller’s 1995-96 aggregates to make them consistent with the 1977-78 data. The following are the changes to the 1995-96 report to make it consistent with the 1977-78 report:
1. Promotion is included with general government
2. Public Works includes the following 1995-96 components: Planning, construction, redevelopment, housing, employment, solid waste, streets and highways, trees and landscaping, parking, other transportation, and other community development.
3. Health includes only physical and mental and other health.
4. Enterprise and Public Utilities include: hospitals, public transit, airports, ports and harbors, sewers, cemeteries and all public utilities.
The exception relates to non-police public protection. Weed abatement was suppressed in the 1977-78 Controller’s Report and street lighting was included in public works. Both are included in the 1995-96 category of public protection, obviously for the generation of Proposition 172 funds. For the analysis in the paper, these two categories were left in public protection.
1 It is in aggregated form by city size.

90
Apparently the only major difference is in the enterprises and public utilities category, in which the state aggregate numbers are considerably larger than the sample, again only in the most recent year. This is consistent with the revenue findings.

Appendix Table 1: Revenue Source Importance—Cities (Percent)
Revenue Source 1977-78 Sample 1977-78 State Aggregate
1995-96 Sample
1995-96 State Aggregate
Property tax 17.1 21.9 9.5 7.8 Sales Tax 19.0 15.4 13.2 9.6 Other Tax 6.7 10.2 14.2 13 Benefit Assessments 3.9 -- 2.4 1.3 Licenses, Permits, Fines, Forfeitures
-- 3.6 3.0 2.2
Use of Money and Property
3.1 3.1 5.3 4.7
State Aid 16.3 12.5 11.8 6.6 County Aid 1.2 0.6 0.6 0.7 Federal and Other Aid 20.8 20.1 4.0 5.9 Service Charges and Enterprise Contributions
10.5 10.6 29.5 40.5
Other 1.4 2.0 6.6 8.0
Appendix Table 2: Expenditure Source Importance—Cities (Percent)
Expenditure 1977-78 Sample 1977-78 State Aggregate
1995-96 Sample
1995-96 State Aggregate
General Government 31.8 34.4 13.9 8.6 Police 23.4 17.4 23.8 19.9 Non-Police Public Safety 10.3 11.3 9.7 10.0 Public Works 22.9 20.3 23.0 20.9 Health Services 0.3 2.3 0.3 0.5 Library Services 1.3 2.1 0.9 1.7 Parks and Rec. 7.9 9.2 7.4 7.0 Enterprises and Public Utilities
0.9 1.5 20.1 30.5
Other 1.3 1.6 0.9 0.9

92