local government budgeting overview
TRANSCRIPT

Local Government Budgeting Overview
Prepared by Sandy Carlson Flathead County Finance Director

BARS Chart of Accounts◦ Designed to meet uniform reporting requirements across all entities within the State of Montana.
Fund: General Fund (1000) Special Revenue Fund (2xxx) – (Library Operating Fund) Debt Service Fund (3xxx) Capital Project Fund (4xxx) – (Library Depreciation Reserve Fund) Enterprise Fund (5xxx) – Operating revenues generally = Operating expenses (non-tax revenues) Trust/Agency Fund (7xxx) – (Library Gifts & Memorials)
Department : (We use for department head and/or projects) Activity
1xxxxx-Assets 2xxxxx-Liabilities & Fund Balance 3xxxxx-Revenues 4xxxxx-Expenditures – (Libraries generally start with 46xxxx because their function is Culture & Rec) 5xxxxx-Internal Service and/or transfers
Object – categorizes expenditures Personal Services (1xx) – salaries and benefits Supplies (2xx) - product Purchased Services (3xx) – someone provides services Fixed Charges (4xx & 5xx) – all other Debt (6xx) - repayment of debt Contributions/Donations (7xx) Transfers (8xx) – move funds from one to another Capital (9xx) – Over $5k and life of 5 years or more
Framework for Financial Reporting
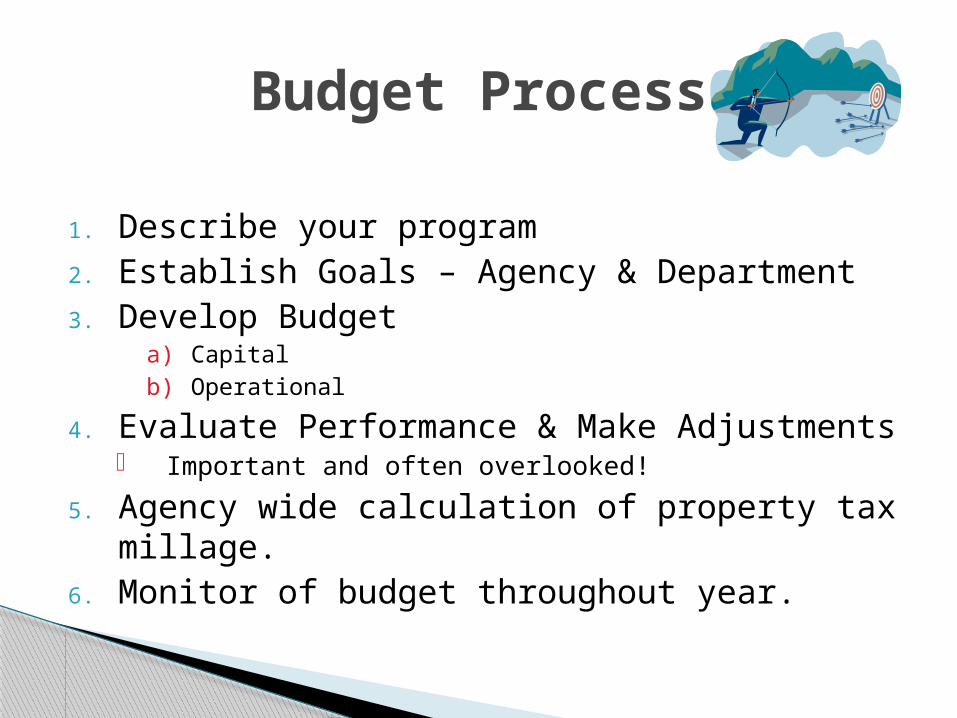
1. Describe your program2. Establish Goals – Agency & Department3. Develop Budget
a) Capital b) Operational
4. Evaluate Performance & Make Adjustments Important and often overlooked!
5. Agency wide calculation of property tax millage.
6. Monitor of budget throughout year.
Budget Process
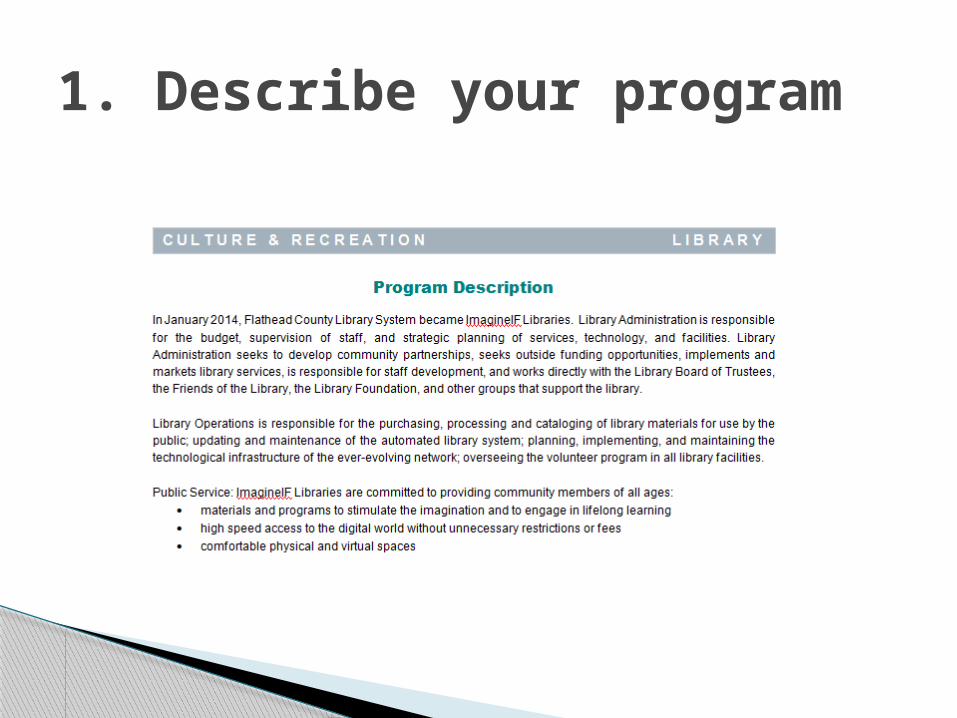
1. Describe your program
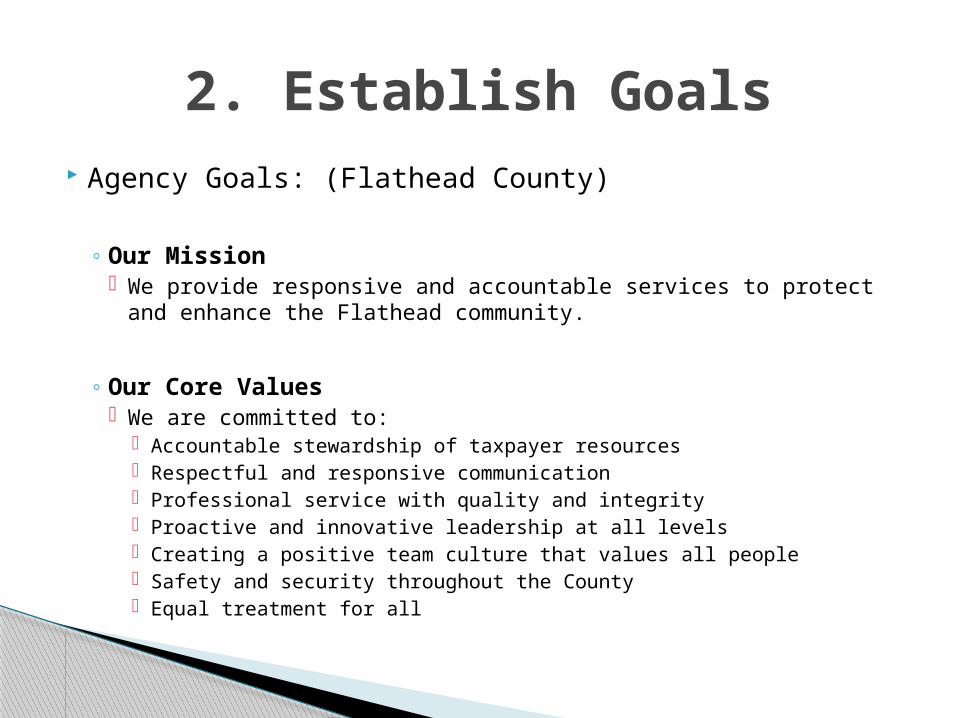
Agency Goals: (Flathead County)
◦ Our Mission We provide responsive and accountable services to protect and
enhance the Flathead community.
◦ Our Core Values We are committed to:
Accountable stewardship of taxpayer resources Respectful and responsive communication Professional service with quality and integrity Proactive and innovative leadership at all levels Creating a positive team culture that values all people Safety and security throughout the County Equal treatment for all
2. Establish Goals
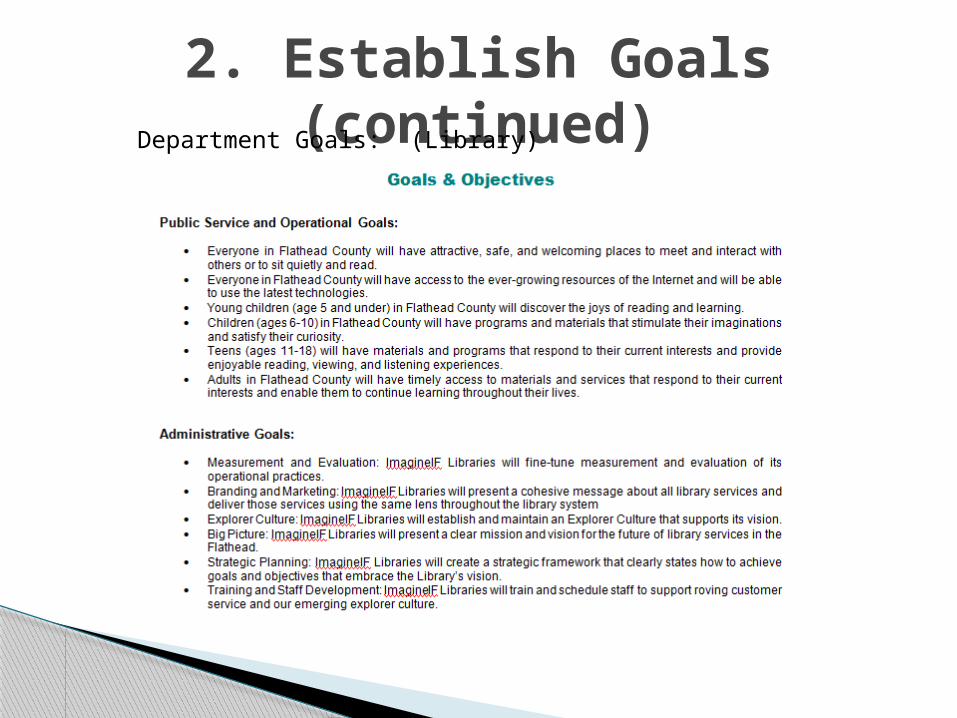
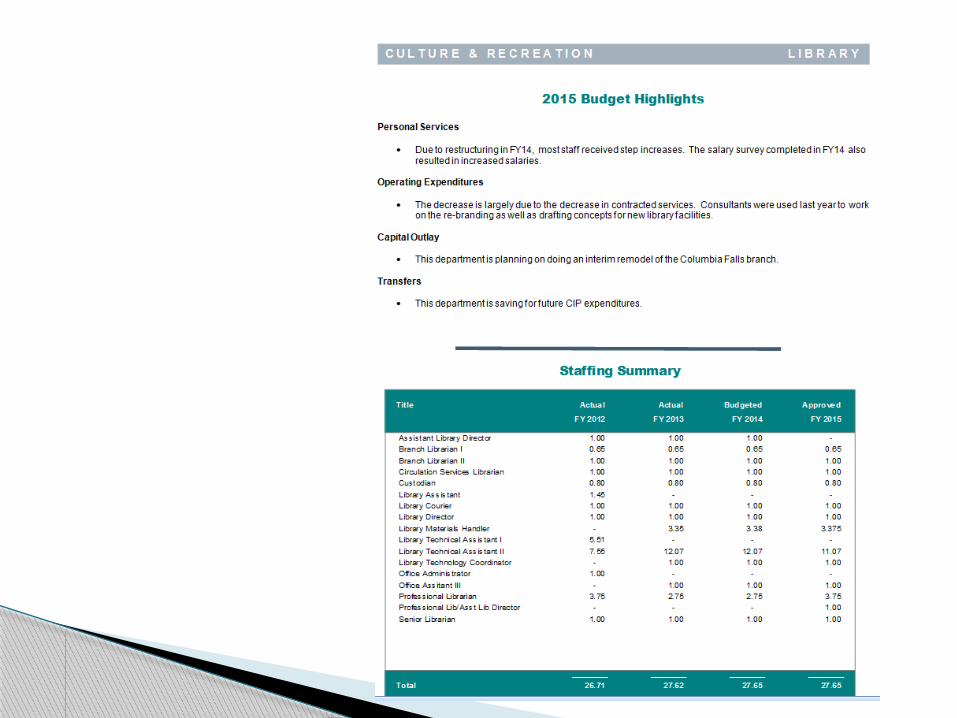
2. Establish Goals (continued)Department Goals: (Library)
Library Depreciation Reserve Fund
MCA 22-1-305 or MCA 22-1-716 (districts)
◦ May establish a library depreciation reserve fund for the replacement and acquisition of property, capital improvements, and equipment necessary to maintain and improve library services.
3a. Develop Budget: Capital Budget

What is a Capital Improvement Plan (CIP)?◦ A multi-year document that summarizes capital projects
for a specified time period. (Generally 5 to 20 years).◦ Used as a planning guide for capital purchase or
replacement. (Not authoritative)◦ Reviewed annually, prioritized and updated
What is considered capital?
◦ Generally defined by the governing agency. (Flathead County is $5,000 or more and at least a five year life)
3a. Develop Budget: Capital Improvement Plan (CIP)
(continued)
How to create or update?
1. Identify need & define it (5 to 20 year)2. Justify it (advantages & consequences)3. Quantify it (estimate capital and operating
cost/year)4. Identify funding source (i.e. bonds, saving,
special revenue, donations etc…)5. Prioritize
3a. Develop Budget: Capital Improvement Plan (CIP) (continued)

Definition: Financial plan of current (annual) spending and means to pay for it. ◦ Once adopted it is a legal binding document that
is changed (amended) by the same formal process it was adopted. (notice, hearing, resolution)
◦ Expenditures are limited to appropriations.◦ Officials are personally liable if exceeded.◦ Beginning cash balances can’t exceed 33% of
appropriations in funds where property taxes are levied.
3b. Develop Budget: Operational (annual) Budget
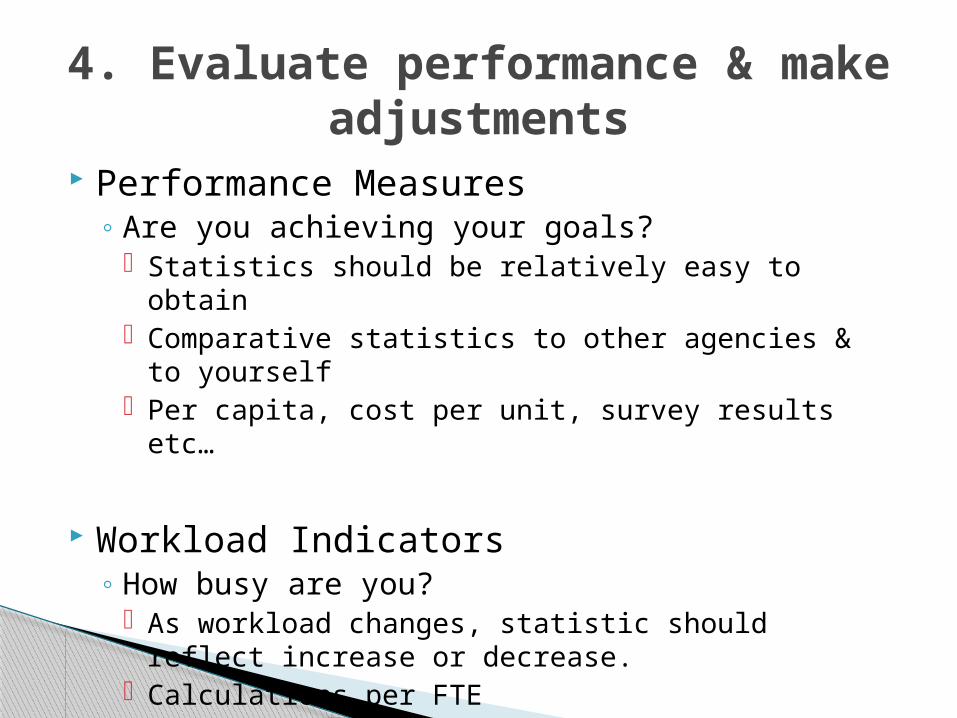
Performance Measures◦ Are you achieving your goals?
Statistics should be relatively easy to obtain Comparative statistics to other agencies & to
yourself Per capita, cost per unit, survey results etc…
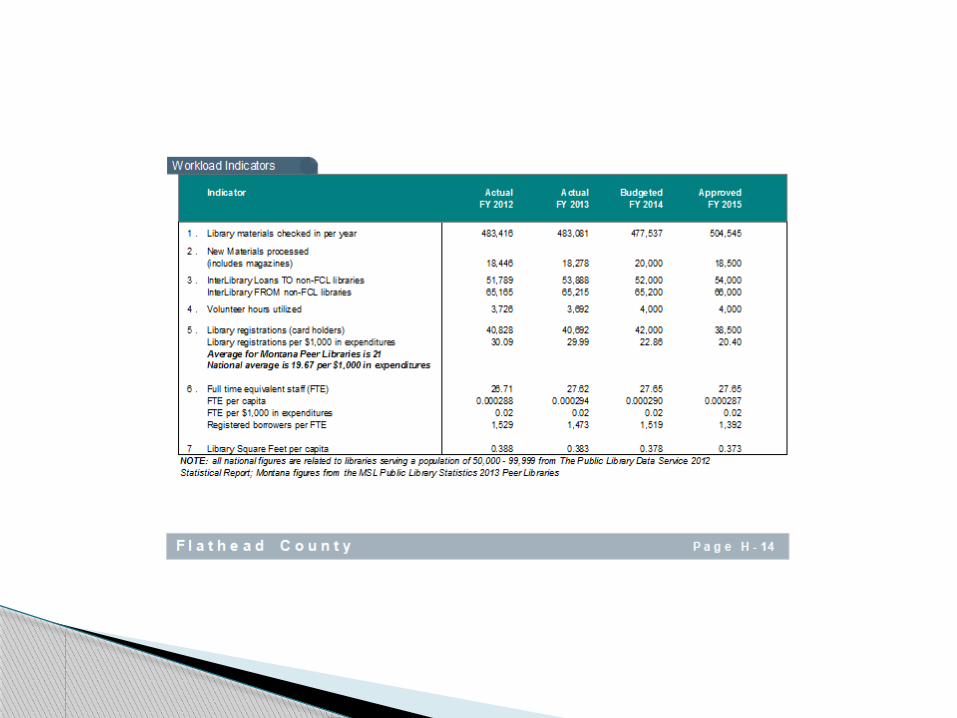
Workload Indicators◦ How busy are you?
As workload changes, statistic should reflect increase or decrease.
Calculations per FTE
4. Evaluate performance & make adjustments


Levies that are voted or specifically exempted in statute are not included in agency wide limits.
MCA 15-10-420 spells out the mechanics◦ Start out with what was levied last year◦ Add:
new property Inflation adjustment
◦ Subtract: TIF districts
◦ = Maximum amount agency can mill
5. Agency wide calculation of Property Tax millage
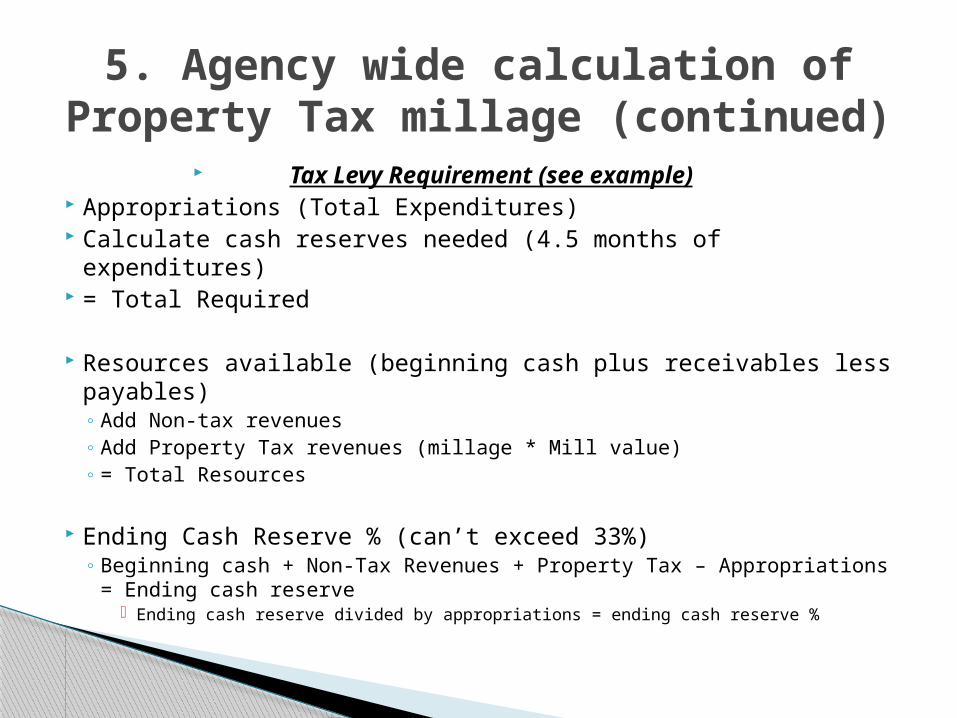
Tax Levy Requirement (see example) Appropriations (Total Expenditures) Calculate cash reserves needed (4.5 months of expenditures) = Total Required
Resources available (beginning cash plus receivables less payables)◦ Add Non-tax revenues◦ Add Property Tax revenues (millage * Mill value)◦ = Total Resources
Ending Cash Reserve % (can’t exceed 33%)◦ Beginning cash + Non-Tax Revenues + Property Tax – Appropriations =
Ending cash reserve Ending cash reserve divided by appropriations = ending cash reserve %
5. Agency wide calculation of Property Tax millage (continued)
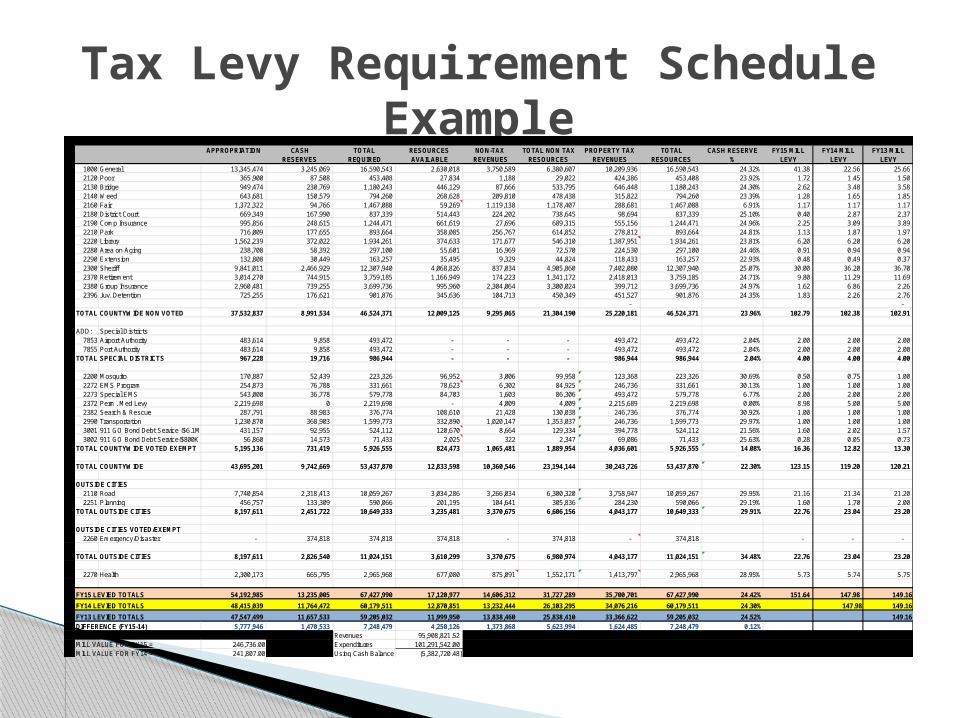
Tax Levy Requirement Schedule Example
APPROPRIATION CASH TOTAL RESOURCES NON-TAX TOTAL NON TAX PROPERTY TAX TOTAL CASH RESERVE FY15 MILL FY14 MILL FY13 MILLRESERVES REQUIRED AVAILABLE REVENUES RESOURCES REVENUES RESOURCES % LEVY LEVY LEVY
1000 General 13,345,474 3,245,069 16,590,543 2,630,018 3,750,589 6,380,607 10,209,936 16,590,543 24.32% 41.38 22.56 25.66 2120 Poor 365,900 87,508 453,408 27,834 1,188 29,022 424,386 453,408 23.92% 1.72 1.45 1.50 2130 Bridge 949,474 230,769 1,180,243 446,129 87,666 533,795 646,448 1,180,243 24.30% 2.62 3.48 3.58 2140 Weed 643,681 150,579 794,260 268,628 209,810 478,438 315,822 794,260 23.39% 1.28 1.65 1.85 2160 Fair 1,372,322 94,766 1,467,088 59,269 1,119,138 1,178,407 288,681 1,467,088 6.91% 1.17 1.17 1.17 2180 District Court 669,349 167,990 837,339 514,443 224,202 738,645 98,694 837,339 25.10% 0.40 2.87 2.37 2190 Comp Insurance 995,856 248,615 1,244,471 661,619 27,696 689,315 555,156 1,244,471 24.96% 2.25 3.09 3.89 2210 Park 716,009 177,655 893,664 358,085 256,767 614,852 278,812 893,664 24.81% 1.13 1.87 1.97 2220 Library 1,562,239 372,022 1,934,261 374,633 171,677 546,310 1,387,951 1,934,261 23.81% 6.20 6.20 6.20 2280 Area on Aging 238,708 58,392 297,100 55,601 16,969 72,570 224,530 297,100 24.46% 0.91 0.94 0.94 2290 Extension 132,808 30,449 163,257 35,495 9,329 44,824 118,433 163,257 22.93% 0.48 0.49 0.37 2300 Sheriff 9,841,011 2,466,929 12,307,940 4,068,826 837,034 4,905,860 7,402,080 12,307,940 25.07% 30.00 36.20 36.70 2370 Retirement 3,014,270 744,915 3,759,185 1,166,949 174,223 1,341,172 2,418,013 3,759,185 24.71% 9.80 11.29 11.69 2380 Group Insurance 2,960,481 739,255 3,699,736 995,960 2,304,064 3,300,024 399,712 3,699,736 24.97% 1.62 6.86 2.26 2396 Juv. Detention 725,255 176,621 901,876 345,636 104,713 450,349 451,527 901,876 24.35% 1.83 2.26 2.76
- - TOTAL COUNTYWIDE NON VOTED 37,532,837 8,991,534 46,524,371 12,009,125 9,295,065 21,304,190 25,220,181 46,524,371 23.96% 102.79 102.38 102.91
ADD: Special Districts7853 Airport Authority 483,614 9,858 493,472 - - - 493,472 493,472 2.04% 2.00 2.00 2.00 7855 Port Authority 483,614 9,858 493,472 - - - 493,472 493,472 2.04% 2.00 2.00 2.00
TOTAL SPECIAL DISTRICTS 967,228 19,716 986,944 - - - 986,944 986,944 2.04% 4.00 4.00 4.00
2200 Mosquito 170,887 52,439 223,326 96,952 3,006 99,958 123,368 223,326 30.69% 0.50 0.75 1.00 2272 EMS Program 254,873 76,788 331,661 78,623 6,302 84,925 246,736 331,661 30.13% 1.00 1.00 1.00 2273 Special EMS 543,000 36,778 579,778 84,703 1,603 86,306 493,472 579,778 6.77% 2.00 2.00 2.00 2372 Perm. Med Levy 2,219,698 0 2,219,698 - 4,009 4,009 2,215,689 2,219,698 0.00% 8.98 5.00 5.00 2382 Search & Rescue 287,791 88,983 376,774 108,610 21,428 130,038 246,736 376,774 30.92% 1.00 1.00 1.00 2990 Transportation 1,230,870 368,903 1,599,773 332,890 1,020,147 1,353,037 246,736 1,599,773 29.97% 1.00 1.00 1.00 3001 911 GO Bond Debt Service ($6.1M) 431,157 92,955 524,112 120,670 8,664 129,334 394,778 524,112 21.56% 1.60 2.02 1.57 3002 911 GO Bond Debt Service($800K) 56,860 14,573 71,433 2,025 322 2,347 69,086 71,433 25.63% 0.28 0.05 0.73
TOTAL COUNTYWIDE VOTED EXEMPT 5,195,136 731,419 5,926,555 824,473 1,065,481 1,889,954 4,036,601 5,926,555 14.08% 16.36 12.82 13.30
TOTAL COUNTYWIDE 43,695,201 9,742,669 53,437,870 12,833,598 10,360,546 23,194,144 30,243,726 53,437,870 22.30% 123.15 119.20 120.21
OUTSIDE CITIES2110 Road 7,740,854 2,318,413 10,059,267 3,034,286 3,266,034 6,300,320 3,758,947 10,059,267 29.95% 21.16 21.34 21.20 2251 Planning 456,757 133,309 590,066 201,195 104,641 305,836 284,230 590,066 29.19% 1.60 1.70 2.00
TOTAL OUTSIDE CITIES 8,197,611 2,451,722 10,649,333 3,235,481 3,370,675 6,606,156 4,043,177 10,649,333 29.91% 22.76 23.04 23.20
OUTSIDE CITIES VOTED/EXEMPT2260 Emergency/Disaster - 374,818 374,818 374,818 - 374,818 - 374,818 - - -
TOTAL OUTSIDE CITIES 8,197,611 2,826,540 11,024,151 3,610,299 3,370,675 6,980,974 4,043,177 11,024,151 34.48% 22.76 23.04 23.20
2270 Health 2,300,173 665,795 2,965,968 677,080 875,091 1,552,171 1,413,797 2,965,968 28.95% 5.73 5.74 5.75
FY15 LEVIED TOTALS 54,192,985 13,235,005 67,427,990 17,120,977 14,606,312 31,727,289 35,700,701 67,427,990 24.42% 151.64 147.98 149.16
FY14 LEVIED TOTALS 48,415,039 11,764,472 60,179,511 12,870,851 13,232,444 26,103,295 34,076,216 60,179,511 24.30% 147.98 149.16
FY13 LEVIED TOTALS 47,547,499 11,657,533 59,205,032 11,999,950 13,838,460 25,838,410 33,366,622 59,205,032 24.52% 149.16DIFFERENCE (FY15-14) 5,777,946 1,470,533 7,248,479 4,250,126 1,373,868 5,623,994 1,624,485 7,248,479 0.12%
Revenues 95,908,821.52 MILL VALUE FOR FY15 = 246,736.00 Expenditures 101,291,542.00 MILL VALUE FOR FY14 = 241,807.00 Using Cash Balance (5,382,720.48)

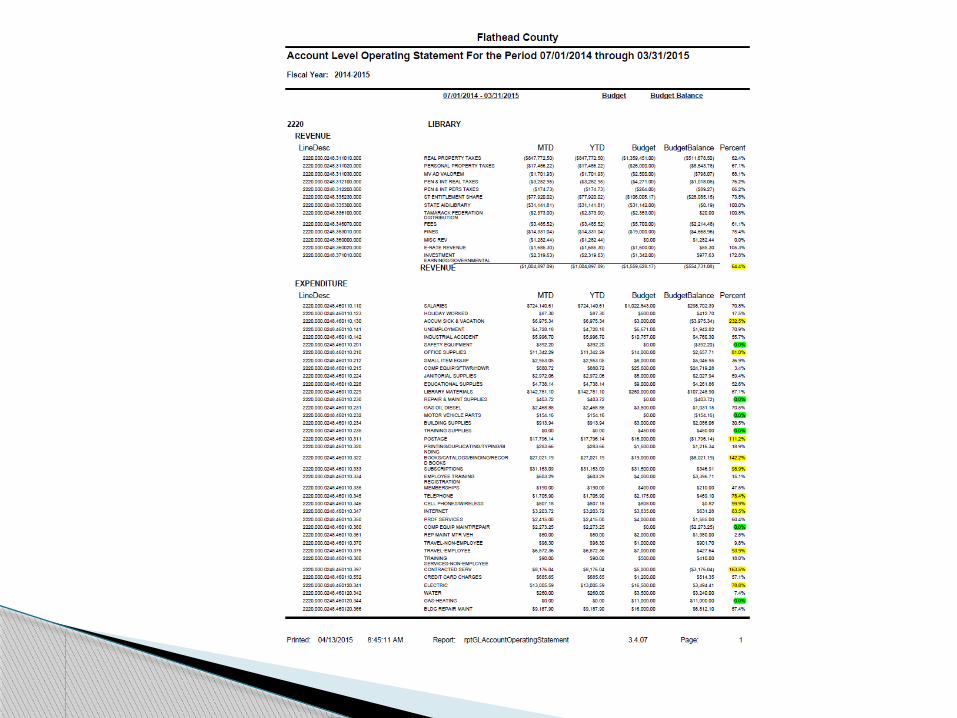
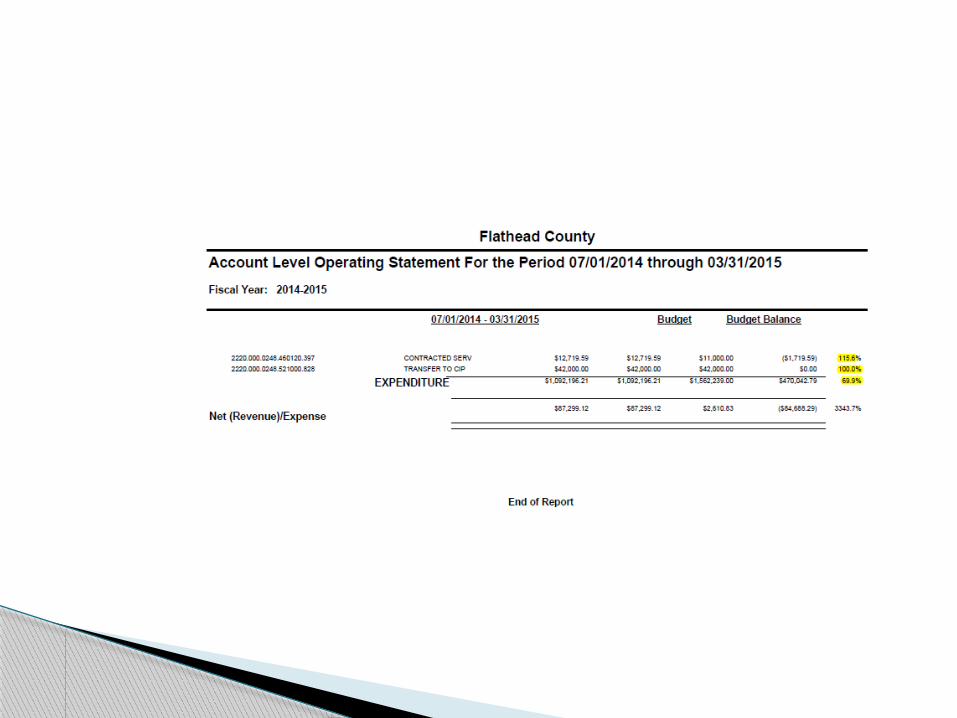
Review reports monthly Reports should include Budget, Actual YTD, variance and
% of variance. Unless operations are seasonal, should be able to take
YTD number of months within the year and divide by total to determine average %. (i.e. March is 9/12 or 75%)
If line items vary from this percentage, should have explanation. If overall above this percentage on expenditures or below on revenue, could signal a problem.
Depends on the department head authority given in the budget resolution. ◦ (Flathead County – not personal services, capital expenditures or
capital funding)
6. Monitor of Budget throughout the year

https://flathead.mt.gov◦ Department List
Finance Financial Documents
Budget Reports FY2015 Budget
FY 2015 Flathead County Budget.pdf (This is a large file and might take awhile to load)
My Contact Information:Sandy Carlson, Flathead County Finance Director
800 South Main Room 214Kalispell, MT 59901(406) [email protected]
Flathead County Budget Document is online at:

Questions?