local food supply chains in alberta
TRANSCRIPT
LO C A L FO O D S U P P LY C H A I N S
I N A L B E RTA
Becky Lipton, Tera SpyceBecky Lipton Research & Consulting Ltd.
February 2011
Case Studies from the Differentiated Beef Sector

Dear Mimi Lee,
New Venture Economist,
Alberta Agriculture and Rural Development,
Please find herein the final report on Local Food Supply Chains in Alberta: Case Studies
from the Differentiated Beef Sector.
The research in this report was conducted for Alberta Agriculture and Rural Development
(ARD) Explore Local Initiative. The Initiative had identified a need to develop case studies
in Alberta to compare the structure, size, and performance of local food supply chains.
In particular the analysis of the study was to focus on three performance indicators: 1.
producer share of final product sale price, 2. the food miles and fuel use per product
unit, and 3. economic benefits to the regional area. It was anticipated that the case
studies would provide rich detail about specific situations that helps in understanding
the operation and performance of local food value chains in the province. I was requested
to build on the case study methodology adopted by the recent USDA study (King et al.,
2010). We acknowledge that without the USDA study, we would have been starting from
a much earlier and less sophisticated point. We earnestly appreciate the work that the
USDA has done with their pioneer study and feel that it has allowed us to discover much
more about local markets than otherwise would have been possible.
If you have any further questions, please do not hesitate to contact me via email at
[email protected] or by phone at 780-271-1116.
AC K N OW L E D G E M E N TS
I want to thank those who participated in this
research for their cooperation and for sharing
their invaluable insights. I sincerely appreciate
everyone’s contribution and their wonderful
stories. Although I cannot name each of you
here due to confidentiality, you know who you
are and I sincerely thank you.
I would also like to thank you, Mimi Lee, for
providing me with this opportunity. I genuinely
enjoyed speaking with the producers and the
others involved in the supply chains in Alberta.
Aussi disponible en français.
Becky Lipton Principal
Becky Lipton Research & Consulting Ltd.
February 21st 2011
SUPPLY CHAIN PERFORMANCE ANALYSIS
Economic Benefits to the Regional Area 15
Cow-Calf Production 15
Intermediary 15
Mainstream 16
Summary 16
Producers Share 17
Food Miles and Fuel use 18
OTHER BUSINESS CONSIDERATIONS
Growing Differentiated Beef 20
Other Business Considerations for
Direct Sales to End Consumers (boxed beef delivery) 21
Other Business considerations for the
Intermediated Supply Chain 21
Other Business Considerations for the
Mainstream Supply Chain 22
Summary 22
WHERE TO FROM HERE
Key Lessons and Recommendations 23
REFERENCES 26
APPENDICES
Appendix A 27 Local and Mainstream Alberta Food Supply Chains Informed Consent
Appendix B 28 Primary Producer Interview Guide – Local and Mainstream Alberta Food Supply Chains
Appendix C 32 Primary Producer/Aggregator Interview Guide – Local and Mainstream Alberta Food Supply Chains
Appendix D 37 Processor Interview Guide – Local and Mainstream Alberta Food Supply Chains
EXECUTIVE SUMMARY 1
INTRODUCTION
Research Parameters 4
Differentiated Beef 4
Definitions 5
Research Questions 5
Methodology 6
UNDERSTANDING THE ALBERTA CONTEXT
Local Food Production and Demand 7
Consumer Constraints and Challenges 8
Producer Constraints and Challenges 8
Overview of Differentiated Beef Markets 8
General Trends across Canada 8
Trends in Differentiated Beef in Canada 9
Overview of Differentiated Beef Markets in Alberta 10
Demand and Production within Alberta 10
Local Food Supply Chains 10
Producers Profit Share 10
Economic Impact of Local Food 11
Food Miles and Fuel Usage 11
THE CASE STUDIES
Hanlen Family Farm 12
– Direct Market Supply Chain (Figure 1)
Laughlin Family Farm 13
– Intermediated Supply Chain (Figure 2)
Peak Valley Beef 14
– Mainstream Supply Chain (Figure 3)
Table of Contents

1
This research project has been commissioned by Alberta
Agriculture and Rural Development (ARD) in order to provide
insights into the functioning of Alberta local food supply chains.
As the demand for local food grows in the province, ARD is
looking for ways to encourage the development of supportive
infrastructure that is necessary in order to meet the growing
demand. The study design was based on a recent USDA study
which examined 5 different products in local food supply chains
in five regions of the US. Adapted to the Alberta context, this study
is a pilot to examine one local food product – differentiated beef
– across three types of local supply chains in Alberta. The supply
chains are: a direct marketing supply chain, an intermediated
supply chain and a mainstream grocery supply chain. This pilot
study will help to determine if future expansion of the research to
other local products would be fruitful in terms of informing future
ARD policy and programs.
The three supply chains were chosen because they represent
different supply chain at varying levels of complexity. In the
direct marketing supply chain the producer follows the animal
from calving to final sale. In the intermediated supply chain the
aggregator purchases animals from 10-20 cow-calf producers
at varying stages of backgrounding and finishing, sends them
to an external processor for slaughter, and then integrates the
butchering and retail within his business. The mainstream supply
chain includes an aggregator who purchases animals from 40-
45 cow-calf operators, finishes the animals and then sells the
product into the mainstream grocery market.
Differentiated beef was chosen for the focus of this study because
at mainstream grocery retail locations differentiated beef was the
product that allowed for traceability and at the farmers’ markets
across Alberta, a main outlet for selling local Alberta products, the
vast majority of beef sold is differentiated.
For the purposes of this study differentiated beef was defined as
any product which sets itself apart from commodity beef and in this
study carries the designation of grass-fed, natural, or organic. We
also defined the term local to mean products raised or grown and
sold within Alberta, and supply chain as a network of interconnected
businesses involved in the provision of a product or service.
Executive SummaryThe research focused on the following aspects of the supply chains:
structures and business connections/relationships; business models
and stages of development; benefits to the regional economy;
environmental impact as it relates to food miles and fuel use; and
producers share of the price paid by consumer.
The major findings of this research include:
1. ECONOMIC BENEFITS TO THE REGIONAL AREA AND DEVELOPMENT OF SOCIAL CAPITAL:
a. At the cow-calf level all three supply chains involved primarily the farm family itself to fulfill labour requirements. This was necessary in order to stay viable as a farming business. However, when hiring services or labour was required they primarily contributed to the regional rural economy by hiring within the community unless the needed products and services were not available. The producers were also drivers of the larger economic activity within the region through the generation of economic activity that then flowed through supply chains to the consumer.
b. The intermediated supply chain from the finishing of animals through processing and retail also relied primarily on products and services from within the surrounding communities. The mainstream supply chain from finishing to retail contributed to the regional economy but also employed (outside of Alberta) Canada based companies to do some of their distribution. Another aspect of both the intermediary and the mainstream supply chains in terms of regional impact is the significance of them acting as aggregators. They enable many other smaller producers to have access to a market for their products.
c. All three supply chains contributed to the development of social capital. Social capital is the productive asset and resource that is found in networks of social relationships. At the production level social capital was created as networks were reinforced as they were drawn upon by the farmers and community product and service providers. Social capital was created within the intermediated and mainstream supply chain as the development of relationships created a more successful supply chain. Social capital was also created between the producers and the consumers, although this was much stronger at the direct marketing and the intermediated supply chain where it contributed towards the loyalty shown on behalf of the consumer.
2
2. PRODUCERS’ SHARE:
a. The producer’s share was highest for the direct marketing supply chain, where the producer retained 74.5% of the final product sale price, 11.6% of which went to marketing costs.
b. The producers’ share in the intermediated supply chain was 31.9% of the final product sale price if the producer supplied yearlings and 51.4% if the animals were finished. The primary processor retained 14.7% and the secondary processing and retail retained 33.9%.
c. In the mainstream supply chain the cow-calf producer received 38.8% of the final product sale price and the finisher received 12.3%. The distributor/aggregator received negative 1.3% and the retailer received between 30-45%. The mainstream supply chain is much more strongly affected by the fluctuations in the marketplace than either of the other two supply chains, which affects the producers’ share over time. At the time of this research, cattle prices were high. Because the producers receive a premium above the market price for their product at the time of sale, they received a much higher percentage of the final product sale price than they would receive when cattle prices are lower. Due to this factor, the aggregator therefore lost money at the point in time of the research. The costs throughout the rest of the supply chain are also influenced to a greater degree by outside forces than the other two supply chains because of the multiple outside intermediaries involved.
3. FOOD MILES AND FUEL USAGE/KG OF PRODUCT TRANSPORTED:
a. The food mile analysis has been accompanied by a fuel economy per kg of product transported analysis in order to determine the actual carbon footprint of a product over its transportation.
b. The average distance that the product was shipped from farm to retail shelf in the mainstream supply chain was 949km; in the intermediary chain, 485km; and in the direct marketing supply chain, 625km. In the direct marketing supply chain the distance includes from the farm to the processor, back to the farm and then to the city where his market is. In the intermediary supply chain the distance includes from the cow-calf operation to the aggregator, then to the processor and then to the retail location. For the mainstream supply chain the distance includes travel from the cow-calf to the aggregator, then to the processor, then to the distributor/warehouse facility and then on to the end grocery location.
c. Incorporating fuel use of different types of vehicles, we found that the direct marketing supply chain uses 0.0271l/kg, the intermediated supply chain uses 0.0074l/kg, and the mainstream uses 0.0037l/kg. There was a significantly larger amount of overall product shipped in the mainstream supply chain, and the vehicles used for both the mainstream and intermediated supply chains were more efficient than that used in the direct marketing supply chain.
4. OTHER BUSINESS CONSIDERATIONS
a. Those involved in each supply chain incorporated differentiated beef aspects into their operations because of their fundamental values and beliefs. The size of the producers’ herds was influenced by the desire to maintain a manageable and financially viable operation.
b. The direct marketer prefers to sell his animals direct to consumer because he receives a higher return for his product. However, it is hard to market all of his animals through this market channel and sold only 1/3 of his animals through this route. He finds the marketing challenging and if he is not able to sell more beef through direct marketing in the future he is “prepared to look at other avenues”. Although these particular details are specific to this case study, there are very few options for selling differentiated beef in Alberta. If you are not part of the few supply chains that exist, your only option may be to direct market. Direct marketing can be difficult and requires very specific marketing skills, therefore making it challenging for some producers to move their entire product.
c. The intermediary supply chain is flexible enough to work with producers that background their animals to various stages, and is able to purchase all of the animals that the producers have for sale. Trust is an important aspect of the relationship between the producers and the aggregator and has built a stronger supply chain that is synergistic and symbiotic for both parties.
d. The mainstream supply chain works well for the producer because he finds that it is producer and animal friendly – something he did not find in the auction market. Although he could sell all his animals through either auction or the Peak Valley supply chain, the latter allows him more control over the process and the price he receives. He knows his price before his animals are sold, he knows where his animals are going, and receives feedback on his product. He also feels that there is an important
3
degree of trust which includes shared values.
5. OTHER KEY LESSONS
a. Each supply chain offers different benefits to producers; increased control over pricing, the ability to demand a higher/fairer price for a premium product and the ability for the consumer to appreciate their product for its particular attributes. In general there appears to be benefits across the whole supply chain for the intermediary and the mainstream supply chains. The efficiencies gained in working together help to overcome some of the challenges they face, such as marketing, storage, fuel economy and the ability to move more products. Each producer however, must determine which strategies work best for their operation.
b. For moving forward we recommend that future studies attempt to learn what aspects of which supply chains involve the greatest benefits to the producers and the health and viability of the supply chains. Areas to be investigated include producer return, consistency of demand, sharing of risk, development of longer term relationships/partnerships. They should also focus on a general exploration of what other benefits producers receive from different types of supply chains.
c. We also recommend that future research investigate what factors lead to successful local food supply chains in general, and what factors present challenges to the success of those supply chains. Questions could include: What types of partnerships contribute best to which types of supply chains? How do these partnerships develop? What can be done to encourage and support their development? What circumstances need to be nurtured in order to achieve success in terms of supply chain development? What challenges need to be addressed for the supply chain to overcome constraints? What aspects of the supply chains are set by outside factors (such as grocery retail systems)? How do these factors affect the development of the supply chain?
These questions should be pursued through an in-depth case study approach in order to obtain the rich detail necessary to understand these factors. Furthermore, they should be done across different products as characteristics of supply chains vary by product. We strongly encourage the supply chain performance analysis focus on similar types of products, including similar product attributes and
production techniques wherever possible.
A further exploration of local food supply chains which incorporates these key lessons will allow Explore Local initiative and ARD to make strong policy decisions about how to encourage the development of local food supply chains. These analyses will not only allow for greater benefit to the producers, but also others involved in the supply chains, and ultimately the consumer and larger community.

4
Demand for local products is growing in Alberta. As the consumer
appetite for locally produced food grows supply chains that
provide those products must also grow. The industry in Alberta
is working hard to meet the demand with new products and
initiatives. A deficit exists in terms of supply chain infrastructure
including production, storage, distribution, and marketing
options. In order to find new ways to encourage the development
of supportive infrastructure it is necessary to understand what
is currently in place. Alberta Agriculture and Rural Development
(ARD) recognizes this need and has commissioned this study to
examine existing supply chains for local food.
ARD asked that we build upon a recent study conducted in the US
that looked at a series of 5 different products in local food supply
chains in five regions of the US (King et al, 2010). In particular,
ARD are interested in the valuable insights in terms of producer’s
share, food miles, and economic benefits to the regional area.
They also approved of the case studies approach as a way to
provide a more in depth understanding of the supply chains
opportunities and challenges. The current study serves as a pilot
to determine if this research approach is applicable in the Alberta
context, and to determine if a larger study would provide ARD
with the knowledge and insights it needs to inform future policy.
The research as outlined in this report focuses exclusively on
one product, differentiated beef, and three corresponding supply
chain case studies. The case study approach permits in-depth
analysis of the three supply chains and provides rich detail
about the drivers, development, relationships, and functioning of
differentiated beef supply chains in the province.
The supply chains chosen for this research vary in terms of their
complexity and the number of parties involved. Each was chosen
because it represents a typical supply chain for differentiated beef
at the direct marketing, intermediated, and mainstream level. The
direct marketing supply chain includes a producer and processor.
The producer follows the animal from calving to final sale,
retaining ownership of the animal through external processing.
The intermediated supply chain involves multiple producers at
varying stages of backgrounding and finishing, an aggregator
and a processor. The aggregator purchases from multiple cow-
Introductioncalf operators, finishes the animals, sends them to an external
processor for slaughter, and then integrates the butchering and
retail within his business. The mainstream supply chain includes
multiple cow-calf operators and an aggregator who purchases
and finishes the animals. The aggregator then sells the product
into the mainstream grocery market.
Research ParametersDIFFERENTIATED BEEF
Alberta producers supply a very large quantity of beef cattle, the
vast majority of which is sold into the auction market and then
moved through the conventional food system as commodity beef.
In mainstream supermarkets beef is generally sold as an un-
differentiated product. Although the traceability of these products
has become increasingly possible because of programs such as
Age-Verification Incentive and Traceability Cattle Identification
Regulation, beef products usually contain little or no information
about the producers, the production methods, or place of origin.
Currently there are no properly identifiable products from within
Alberta being sold as Alberta product except the small quantity of
differentiated beef sold direct to consumers, at farmers markets
or small retail and grocery stores.
Farmers’ markets are a main outlet for those selling local products
in Alberta. Many farmers’ market beef vendors sell their product
based on some particular attribute such as hormone free, without
use of antibiotics, natural, organic, grass-fed etc. The relationship
of these attributes with consumer perceived benefits of buying local
food may be a factor reducing the presence of conventional beef at
the farmers’ markets (Alberta Agriculture and Rural Development,
2008). In addition, research indicated that it is difficult to receive a
premium price when local is the only differentiating characteristic
(King et al., 2010). This has encouraged farmers’ market vendors
to practice and promote additional attributes of their products.
Upon analysis of the marketplace for local beef products in
Alberta, we chose to consider differentiated beef because it
showcases the options available to Alberta producers at each
level of complexity of supply chains. We did not choose one
particular production method within the category of differentiated

5
beef such as natural, or grass-fed, or organic because there are
very few supply chains that exist within each category and would
have prohibited anonymity amongst our case studies. We have
however integrated a normalizing factor during the discussion of
producer share in order to allow for comparison between these
sectors. Within the larger category of differentiated beef, there
are many small producers who fall into the category of direct
marketers. For more complex supply chains the numbers are
fewer but increasing. At the mainstream level there are few
large operations but they move a significant number of Alberta
differentiated beef cattle. Choosing a case study at these three
levels provides an opportunity to explore how local differentiated
beef is currently supplying the Alberta market.
DEFINITIONS
Two main parameters that we are dealing with in this study
are local and supply chain. A wide variety of definitions exist
particularly as they relate to the term local. Local for the
purposes of this study refers to products produced and sold
within Alberta. The definition for supply chain used in this
research is a network of interconnected businesses involved in
the provision of a product or service.
Another set of parameters that we deal with in this research
is related to differentiated beef. As outlined above, the focus
is on local differentiated beef supply chains, in other words,
any product that sets itself apart from commodity beef and in
particular carries the designation grass-fed, natural or organic.
Grass-fed refers to livestock that have been raised on pasture
and not confined to a feedlot/grain-fed system. Grass fed animals
take longer to mature and spend their final weight-gain stage
on grass. Natural refers to a product grown or raised without
hormones or antibiotics. Organic refers to products that are
certified organic and are grown or raised without hormones or
antibiotics and without the use of synthetic fertilizers, synthetic
pesticides, or genetically modified organisms. Because of the
small pool of supply chains that fall within each of these three
categories and the need to protect confidentiality, we are unable
to identify which case study falls into the natural, grass-fed or
organic category and consequently use term differentiated beef
when referring to the products in the case studies.
RESEARCH QUESTIONS
Several research questions were selected for this study. The
questions are based on those used in the USDA study, but have
been adapted to meet the particular focus of this project. They
relate primarily to producers’ share of the final product sale
price, economic benefits to the regional area, and food miles
and fuel use within the Alberta context. The following are the
overall questions being explored:
• What are the structures and business connections/relationships found in local food supply chains?
• What are the business models and stages of development within local food supply chains?
• How do local food supply chains interact with and benefit the regional economy?
• What are the environmental impacts related to fuel use and food miles of local food supply chains?
• What is the percentage of end retail price retained at each level of the supply chain including a breakdown within each major component of the supply chain (producer, processor, distributor, and retailer)? What affects the amount retained at each level and how do market advantages specific to local supply chains affect the development of the chain?
LOCAL
A product raised or grown and sold within Alberta.
SUPPLY CHAINA network of interconnected businesses involved in the provision of a product or service.
GRASS-FEDLivestock that have been raised on pasture and not confined to a feedlot/grain-fed system. Grass fed animals take longer to mature and spend their final weight-gain stage on grass.
NATURALA product grown or raised without hormones or antibiotics.
ORGANICA production system which is certified organic and therefore grown or raised without hormones or antibiotics and without the use of synthetic fertilizers, synthetic pesticides, or genetically modified organisms.
6
METHODOLOGY
The research was broken down into three phases. The first
phase included a broad examination of the product types that
could be chosen for this study, as well as an exploration of the
types of supply chains within these sectors. This preliminary
research included website research and initial exploratory
discussions with potential participants. Recommendations
were made to the ARD research team and the product and
supply chains chosen. The informed consent and interview
guides were developed and approved by both the Freedom
of Information and Protection of Privacy (FOIP) office and by
the Assistant Deputy Minister for Alberta Agriculture and Rural
Development, Jason Krips (Appendix A to D). A pilot interview
was conducted to test the suitability of the interview questions
and procedures and minor modifications were made. It should
be noted that at all stages of this research the identity of
the supply chains and their participants were kept confidential
and ARD was presented with only an overview of their
structures. Participants have also been given pseudonyms and
all identifying attributes have been altered.
Interviews were conducted in phase two. Seven interviews lasting
30 minutes to 1.5 hours were completed. To accommodate the
participants, three interviews were done in person and four
were done over the phone. For the direct marketing supply
chain the producer and processor were interviewed. Two
producers and the aggregator/retailer were interviewed for the
intermediary case study and one producer and the aggregator
were interviewed for the mainstream supply chain.
Phase two also included secondary research including
examining websites, articles, and direct observation of the case
study’s products in their retail locations (i.e. - farmers’ markets
and grocery stores) in order to determine product availability
and prices. A cross-comparison of other similar products was
also completed.
Phase three included the in-depth analysis and writing of this
final report. The data was analyzed based on the following
parameters: economic share within the supply chain; regional
economic impact; food miles and fuel consumption; impact of
supply chains on business including growth and profitability,
and other business considerations.

7
Local Food Production & DemandThe demand for local food in Alberta is widespread and continuing
to grow. A survey conducted by ARD (2008) showed that 90
percent of Alberta households purchased local food (defined as
food grown/produced in Alberta) in 2008 and about one-third of
the households said they intended to increase their local food
consumption in the future. The study found that the largest quantity
of Alberta households purchased local food at supermarkets
(56%), they also purchased local food from farmers’ markets
(45%), farm retail channels (15%), small grocery stores, (11%),
community supported agriculture (CSA) and food box programs.
The ARD (2008) study determined that consumers in Alberta
are choosing local food because they feel that it is healthier,
fresher, and better tasting. Local food is thought to have less
environmental impacts because it is believed to have been
produced using less herbicide, pesticides, and other chemicals
and travels fewer miles than non-local food. Albertans are
also consciously making local food purchases as a means
of supporting the regional economy and/or local farmers. In
addition, many consumers believe that knowing the origin of
their food and the farmer, who produced it, helps build trust and
provides added assurance of safety and quality.
This growing interest in local food and local food producers
can be seen in the popularity of farm direct markets and other
local food related initiatives. For example, in 2010 there were
over 100 approved farmers’ markets and the Alberta Farmers’
Market Association (2010) suggest that there are more than
3,000 local vendors across the province. In addition, the market
value of farmers’ markets rose 63 percent between 2004 and
2008, to an estimated $380 million and farm gate or farm retail
sales remained significant with an estimated market value of
$181 million (ARD, 2008). The Alberta Farm Fresh Producers
Association’s (2010) Come to Our Farms 2010 guide lists over
140 producers and markets that offer local food, activities,
and u-pick opportunities. Other consumer driven websites
and online networks such as Edmonton’s Live Local (2010)
service and the province wide Eat Well Guide (2010) portal are
Understanding the Alberta Context
connecting producers with consumers and encouraging people
to eat, shop, and buy local. There is also increased development
of local food related infrastructure such as the Eat Local First:
Good Food Box (2010) and The Organic Box (2010) local food
delivery programs in Edmonton and the popular SPUDS (2010)
“buy local” urban grocery delivery business in Calgary. The
number of community supported agriculture initiatives have also
increased and there are now programs in Edmonton, Calgary,
Red Deer, and numerous smaller locations across Alberta
(Community Supported Agriculture in Alberta, 2010). With the
support of programs such as ARD’s Dine Alberta (2010), more
than 100 restaurants, cooking schools, caterers, and bistros are
now offering local food on their menus year round (ARD, 2010).
Furthermore, farmers’ markets are the number one tourist
attraction in the province and farm or ranch activities had an
estimated market value of $62 million in 2008 (ARD, 2008).
The business models found in local food distribution have
become more complex, with an increase in sophistication
and number of supply chain partners, and larger in scale.
An example of this is the shift that is occurring in the CSA
model. Traditionally this would be one farm whose consumers
enter into a contract to ‘share the harvest’. This means that
the consumers pay in advance, and in a good year they would
receive a lot of product, and in a bad year they would share in
the decreased harvest. This system allows the farmer to share
the risk with the customer. Although these traditional CSAs
still exist, new models where farmers are working together or
where a coordinator is brought in to manage the project are
popping up. Some also give the option for people to pay on a
weekly basis and select the products and quantities they want.
These models allow for greater flexibility and convenience for
the customer. They also allow the distribution capacity of local
food to grow. The impact on the farmer is both positive and
negative. The farmer gains the ability to move more products
while losing the risk sharing with the consumer that existed in
the traditional format.

8
Consumer Constraints & ChallengesAlthough there is increased demand for local food, consumers
in the ARD (2008) survey identified a number of issues related
to access, availability, and affordability of local food in Alberta. In
supermarkets where the majority of all food purchases are made,
local food is often not available, difficult to find, and/or lacks clear
labeling about the origin of the food, who produced it, and by what
means. However, some consumers found that making a special
trip to a farmers’ market to buy local food inconvenient and
cited location, parking, scheduling, and traffic as major barriers.
The seasonality of locally produced food and lack of year round
variety limits purchases and for budget conscious shoppers, the
perceived higher cost of local food is a deterrent.
Producer Constraints & ChallengesLittle is known about the specific constraints and challenges
facing local food producers in the province, however, producers
in other regions have identified several common limiting factors.
Martinez et al. (2010) found that the majority of farmers involved
in direct sales have small to mid-size operations and have
limited production capacity and access to mainstream markets.
In order to sell their products, farmers assume the marketing,
processing, packaging, and distribution responsibilities that are
typically handled by intermediaries in the mainstream system
and sell direct to consumers through channels such as farm
gate and farmers’ markets. This strategy allows producers
higher returns and an opportunity to develop important social
relationships with their customers but the effort involved
reduces the amount of time and labor that can be dedicated to
production. This is especially true for many farmers who must
also work off-farm to supplement their incomes.
For small and mid-size farmers who attempt to sell their local
products to restaurants, institutional procurement programs, and
mainstream grocery outlets there are additional barriers. Major
food retailers are streamlining their supply chains, and making
it more difficult for small producers to gain market access
(Conference Board of Canada, 2010). Local producers are often
unable to meet the volume, packaging, and delivery requirements
of these markets and there is a lack of aggregation, processing,
and distribution centres that would enable a group of producers
to pool their products to consistently supply larger outlets. In
addition, food safety and regulatory requirements designed
for larger competitors may be prohibitive to small independent
producers (Babcock, 2008; Carter-Whitney, 2009; FamilyFarmed.
org, 2010a; & FamilyFarmed.org, 2010b).
Overview of Differentiated Beef MarketsGENERAL TRENDS ACROSS CANADA
Not only are Albertans and other Canadians seeking food and
food experiences close to home, but they are also becoming
increasingly concerned about the relationship between the food
they eat and their health and wellbeing. There is growing distrust
for the large-scale commercial food production with its reliance
on growth hormones, antibiotics, chemical herbicides and
pesticides, and genetically engineered food stocks. Furthermore,
environmental concerns, higher rates of diabetes and obesity,
and the recent high profile incidents of food contamination
have heightened consumers’ interest in not only what is in their
food but also how their food has been produced and processed
(Agriculture & Agri-Food Canada, 2009a, 2009b, 2010; Ontario’s
Local Organic Food Co-operatives, 2010).
According to Agriculture & Agri-Food Canada (2009a) the health
and wellness food products on the market can be grouped into
distinct subcategories. The better-for-you (BFY) products are
foods containing lower levels of saturated fats, less sugar or salt,
higher fiber content, etc. Fortified/functional foods are foods with
specific physiological benefits such as probiotic and antioxidant
properties. Intolerance foods are specifically developed for people
with allergies and food sensitivities. Naturally healthy foods are
unprocessed or minimally processed and remaining close to their
natural state. The final category is organic food which is produced
without chemical fertilizers, synthetic pesticides, hormones,
irradiation or genetic engineering.
Consumer demand for natural, less processed, and chemical-free
organic food has now outpaced domestic supply in Canada and
the organic food industry is one of the fastest-growing sectors in
Canadian agriculture. There are very few studies that look directly
at growth in natural sales, largely because natural is not a defined
or regulated category in Canada with many different attributes
applied to it and therefore difficult to study. In organics, in 2008,
there were 3,600 certified organic producers across the country
and production was growing at a rate of 15 to 20 percent annually
9
(Agriculture & Agri-Food Canada, 2009b). Sales of all organic food
in conventional retail outlets was an estimated $925.8 million
including $400 million by direct sales, and an additional $712
million in specialty retail stores, health food stores and other food
services, in 2008. Total sales through all retail channels were
an estimated $2 billion dollars showing a 66 percent increase
over the estimated 2006 sales of $1.2 billion. However, only 38
percent of the organic products sold in retail outlets were grown,
packaged or processed in Canada and the majority were imported
from the United States, Chile, Mexico, China, Italy, and Germany
(Agriculture & Agri-Food Canada, 2009a).
The growing demand for organic products in Canada is also
part of a world-wide increase in consumer health awareness
(Agriculture & Agri-Food Canada, 2009a, 2010). According
to market research conducted by Euromonitor (2008), global
demand for organic food and beverages will rise by 43 percent
and 54 percent respectively and reach combined sales of
US$30.5 billion by 2012. Agriculture & Agri-Food Canada,
(2009a) reports that North America, Western Europe, and Japan
are major markets for health and wellness food products and
Brazil, Russia, India, China, and Mexico are also emerging as
significant markets. Around the world food manufacturers are
re-formulating their products and developing new healthier
options to adjust to changing consumer demand. Even large
supermarket chains are developing private label health and
wellness products including organics and “free from” products,
in order to compete in domestic and international markets.
Although the global economic crisis that began in 2008 has
made consumers more price conscious, sales of natural and
organic food have remained steady in major markets such as the
United States (Hartman Group Inc., 2010). As the global economy
rebounds, consumers are seeking high quality food at competitive
prices but they are also showing even greater awareness and
demand for local sourcing, nutrition, environmental sustainability,
simplicity, and authenticity (Agriculture & Agri-Food Canada,
2010). Market research indicates that consumers are moving
back-to-basics and are now looking for natural and clean-label
foods with simple natural ingredients and no additional additives
or unnatural alterations (Conference Board of Canada, 2010).
There is also increased global demand for “free from” food
products as is evident in the signing of the 2010 landmark Duty-
free Beef agreement between Canada and the European Union.
The trade agreement is specifically for beef that is “free from”
growth hormones and will be worth an estimated $10 million/year
(Government of Canada, 2010).
TRENDS IN DIFFERENTIATED BEEF IN CANADA
Based on over 20 years of research on consumer behaviour and
market trends in the US Hartman Group Inc. (2010) suggests
that the organic and natural market is maturing and becoming
mainstream. However, consumers’ willingness to pay varies
across product categories in mainstream retail outlets and
is based on the difference between the cost of conventional
products and that of natural or organics. The wider the price
range the lower the willingness to pay. Meat appears to be a
particularly price-sensitive product.
In Canada, studies have focused primarily on organic products
as they are clearly defined and regulated and therefore easier
to examine. These studies show that the production of organic
beef is limited, but has dramatically increased. Nichols Applied
Management (2010) reports that the sale of organic meats
represents CDN $26.5 million in Canada or three percent of
overall organic retail sales with organic beef sales accounting
for 1.2 percent. Organic beef and pork are a rarity in most
Canadian supermarkets due to their premium price compared
to the price of conventional meat products (Agriculture and
Agri-food Canada, 2009a). Organic meat costs more to produce
because of higher organic feed costs and the rigorous Canadian
organic certification standards. The higher wholesale costs
of organic meats are a major disincentive for large retailers
who are seeking lowest price products and highest retail sale
volumes (Agriculture and Agri-Food Canada, 2009b).
Strategic Vision Consulting (2009) notes that most organic
producers are small to mid-size operators and direct sell
their products through farm gate, farmers markets, and/or
small specialty retailers to capture a greater percentage of
the consumer dollar. Many are unwilling or unable to operate
in mainstream markets. In addition, the lack of access to
certified organic abattoirs, processing, storage, packaging, and
distribution infrastructure is impacting efficiency, costs, and
producers’ ability to supply the domestic market in Canada.
10
Overview of Differentiated Beef Markets in AlbertaDEMAND AND PRODUCTION WITHIN ALBERTA
The Alberta Beef Producers’ Association (2010) states that
Alberta is the largest cattle producer in Canada with an
estimated cow and calf inventory of 5.5 million head as of July
1, 2010. The total annual beef production in the province was
over 773 thousand tonnes-equivalent of beef on the hoof in
2009, of which 16 percent was sold in Alberta, 45 percent to
other provinces, 31 percent to the United States, and 8 percent
sold internationally. The average herd size/farm was 189 head.
There is no official tracking of the amount of natural and
organic beef being produced, the cost of operation, the
volume being sold or its value through direct market channels
or intermediaries in Alberta. Based on producer interviews,
Nichols Applied Management (2010) estimated that there were
between 95 and 115 organic beef producers in Alberta with
an organic beef cow inventory of between 11,500 and 13,000
in January/February 2010. There are currently no statistics
on the number of natural cattle raised in the province. At the
moment, most organic producers are small scale and have a
domestic market focus but many also sell their organic calves
through conventional markets because they lack a market
channel for their animals. Many organic producers who certify
their other farm products do not certify their cattle because of
the lack of market. As markets become more developed and
more organic cattle are able to be moved through the organic
system, the number of animals certified will grow considerably.
Nevertheless, the demand for both organic and natural products
is growing significantly. Organic and natural beef are among the
top ten fastest growing products in terms of consumer demand
(Hartman Group Inc., 2010). If improvements are made to the
local food distribution systems, the sectors will see important
growth over the next five years.
Nichols Applied Management (2010) reports that in Alberta
demand for natural and organic beef is increasing, but that
the business case for non-conventional beef remains neutral
to at best only moderately positive when based on mainstream
markets. To some extent this may be due to a lack of retail
promotion and consumer knowledge about the attributes and
benefits of differentiated beef products (i.e. grass fed, hormone
free, certified organic, natural, etc.). Higher retail costs for
natural and organic beef necessitated by higher producer
costs and lack of infrastructure, and direct competition from
lower priced conventional beef are also affecting the amount of
organic beef sold in mainstream markets in Alberta.
LOCAL FOOD SUPPLY CHAINS
The majority of local food supply chains for natural and organic
beef that currently exist in Alberta are fairly simple with limited
numbers of interconnected businesses involved throughout the
chain. Indeed the majority are direct marketing supply chains,
in which the producer is doing the production, marketing,
distribution and retail, selling directly to consumer. Most of the
products are sold farm gate or through farmers’ markets. Over the
past several years there has been development of intermediated
supply chains as a result of an increase in infrastructure and an
increase in collaboration. Several mid-size producers have begun
to purchase from other operators in order to fulfill their demand
at the farmers’ market and smaller chain retail stores. Some
producers are now working together, especially in natural beef,
in order to develop a beef box delivery program. Furthermore, a
number of companies have developed a branded beef program
based on particular differentiated beef attributes and sell to the
mainstream supermarket supply chains across Canada. These
collaborative or cooperative companies tend to work with the
same group of producers to supply their markets; however, as
demand increases more new producers are brought into the fold.
PRODUCERS PROFIT SHARE
The longer and more complex that supply chains are and the
greater the number of partners involved, the fewer the dollars
that are retained by the primary producers and/or the higher
the final retail price of the product is. A market price survey
conducted in Winnipeg in 2010 estimated that a farmer’s
share of the retail price of meat and meat alternatives was
only 25 percent. 75 percent went to the supermarket chain
and middlemen (Keystone Agricultural Producers et al., 2010).
Higher production costs associated with natural and organic
beef, and relatively high retailer and value chain margins, mean

11
that the producers receive an even smaller share of the retail
price in the mainstream system (Nichols Applied Management,
2010). In addition, there is increased competition at the
mainstream level from private label brands and imports from
other countries as well as lower priced conventional products
(Agriculture & Agri-Food Canada, 2009a).
ECONOMIC IMPACT OF LOCAL FOOD
Local sourcing is becoming increasingly valued but we have
little economic information about local food and locally directed
spending in Alberta. Economic development programs often focus
on urban employment; however, supporting rural agricultural
communities can lead to even greater, more sustainable economic
gains (Region of Waterloo Public Health, 2003). The purchase of
non-local food represents economic leakage; conversely, when
food dollars are retained by local producers, the money circulates
within the local economy and there is a local multiplier effect
(Sonntag, 2000, December 5). Every job in the agriculture sector
creates two to four jobs in the region; every dollar of farm income
generates an additional $2.40 to $3.00 in the region (Region of
Waterloo Public Health, 2003; Sonntag, 2000). Even a 20 percent
increase in spending at farmers’ markets, therefore, could be
worth millions of dollars to the local economy.
Besides economic impact, Sonntag (2000) argues that locally
directed spending strengthens the linkages in a community
and fosters cooperation and sharing of information resources,
which leads to a more sustainable, adaptable, and resilient local
economy. A local food system creates a web of interactions that
links local resources to local needs in a way that the industrial
export driven system cannot. Furthermore, “[t]he emerging
local food economy represents a fundamentally different
way of organizing production and consumption…it reflects a
significant change in the goals, strategies and practices of local
food businesses”. Above all, local food sourcing improves food
security. Proponents of food security initiatives have recognized
that protecting and preserving critical farm land and the
knowledge base necessary for the sustainable production of
food is key to achieving long term food security.
Local sourcing also places control of and responsibility for
environmental stewardship in the hands of the nearby community
and reduces the distance food travels.
FOOD MILES AND FUEL USAGE
One of the defining characteristics of local food is the distance
food travels from its production point to its point of final
purchase. In recent years, the term “food miles” has been
used to represent this distance (Pirog, 2001). It is commonly
assumed that the number of food miles through the supply
chain is directly proportional to its overall carbon footprint.
There are several reasons why this assumption is an
oversimplification of foods’ environmental impact. Firstly food
miles are only one part of the life cycle of a product that make
up its total environmental impact (Hayashi et al., 2005). In North
America, transportation emissions may be responsible for only
11% of total food-related greenhouse gas emissions (Weber
& Matthews, 2008; Hendrickson, 1997). Differences in food
production systems, such as difference in climate and electricity
usage can have a larger effect on a food product’s overall carbon
footprint than transportation distance (Edward-Jones et al., 2008;
Canals et al., 2007; Weber & Matthews, 2008).
To determine the carbon footprint during transportation we have
also incorporated an analysis of fuel economy of kg of product
transported rather than just examining food miles alone. This is
because the quantity of product shipped and the fuel efficiency
of the vehicle used plays an important role in the carbon footprint
during transportation. For example, transporting food in a cube
van may result in average greenhouse gas emissions of 679
gCO2e/T-km. In contrast, transporting food in a semi-truck may
result in average greenhouse gas emissions of 141 gCO2e/T-km
(DEFRA 2009).

12
Hanlen Family FarmDIRECT MARKET SUPPLY CHAIN (FIGURE 1)
Greg Hanlen’s family has been farming for multiple generations
and Greg has been running his operation for over 30 years
now. This last year he had 35 cows but he has had a herd of
twice that size in the past. He cut his herd over the past few
years due to drought. He is currently holding back his heifers
to increase his herd. Greg runs a grass-fed operation which is
more sensitive to weather than grain finished operations. The
carrying capacity of his 1000 acres of pastureland fluctuates
and is severely reduced by drought. The timing of moisture
is especially important because without timely rains and
abundant natural feed the animals take longer to develop. This
increases costs and the risks.
Despite the challenges, Greg feels strongly about having a grass
based farm. “We are basically doing what nature would do.”
Although he hesitates to peg himself as an environmentalist he
admits that he runs a grass-fed operation because he believes
that it is better for the environment and says that it “just makes
sense to do the right thing.”
Greg sells his beef through several direct market channels including
a nearby rural farmers’ market (5%), other producers who sell into
local markets (15%), and boxed beef deliveries in the city (30%).
This last year he also had to sell about 50% of his animals into
the conventional auction market. The boxed beef deliveries are the
supply channel that we are examining in this study.
Greg’s supply chain is very simple and Greg does most of
the work. He does, however, work with his abattoir to ensure
that he is supplying the cuts that his customers want. He also
sells animals through his abattoir from time to time. They have
also considered going into business together to create a retail
location but thus far have not gone down that route.
The Case Studies
Producer / Farm
OtherProducers
Farmer’sMarkets
ConventionalAuction Market
Processor
ConsumerHub
Consumer
Consumer Consumer
Three primary case studies were chosen for this study. They include a direct market supply chain, an intermediated supply chain, and a mainstream supply chain. All names used in the document are fictitious and have been chosen to protect the identity of the people and businesses involved.
FIGURE 1: DIRECT MARKET FOOD SUPPLY CHAINS
Direct to Customer: Animals are taken from the farm to the
abattoir where they are killed, cut, and wrapped. The products
are then returned to the farm for storage and then delivered as
boxed beef to the consumer or taken to the farmers’ market to
be sold with unsold product returned to the farm. Deliveries of
boxed beef are sometimes taken directly to the consumer, or
taken to a consumer hub where other consumers pick up the
product. Boxed beef delivered to the consumer is the supply
chain used for purposes of this research.
Feature supply chain is in black, alternative supply chain are marked in blue.
13
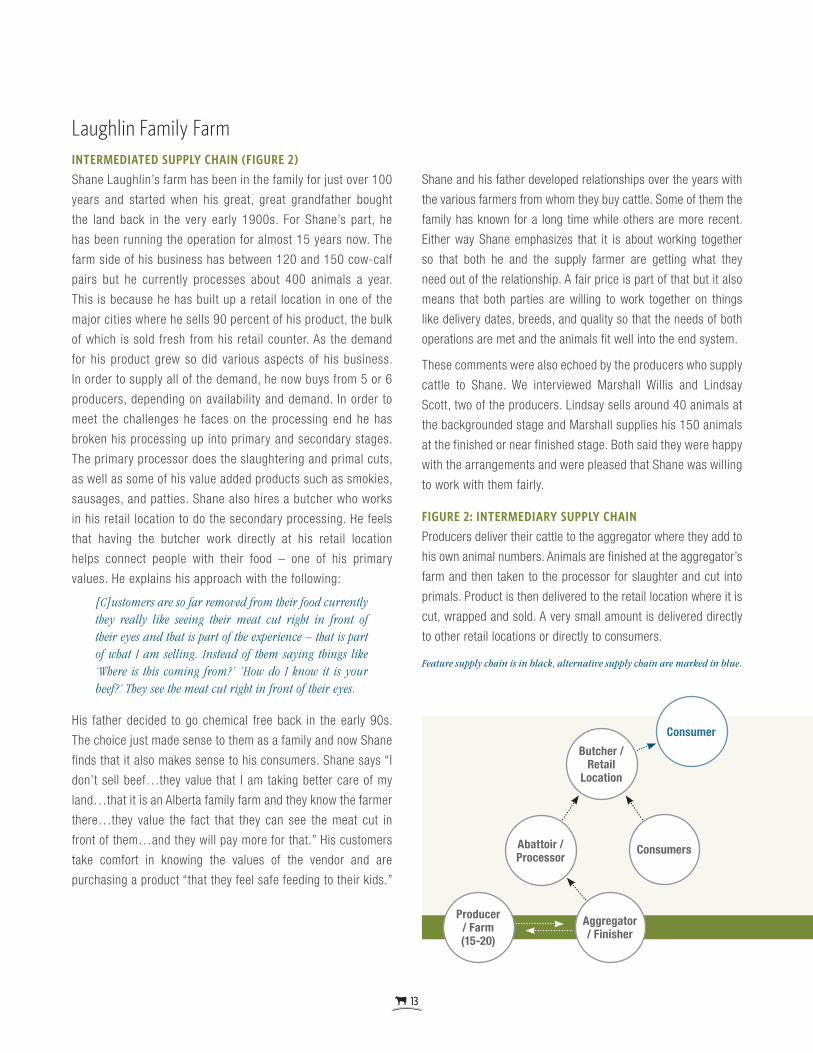
Laughlin Family FarmINTERMEDIATED SUPPLY CHAIN (FIGURE 2)
Shane Laughlin’s farm has been in the family for just over 100
years and started when his great, great grandfather bought
the land back in the very early 1900s. For Shane’s part, he
has been running the operation for almost 15 years now. The
farm side of his business has between 120 and 150 cow-calf
pairs but he currently processes about 400 animals a year.
This is because he has built up a retail location in one of the
major cities where he sells 90 percent of his product, the bulk
of which is sold fresh from his retail counter. As the demand
for his product grew so did various aspects of his business.
In order to supply all of the demand, he now buys from 5 or 6
producers, depending on availability and demand. In order to
meet the challenges he faces on the processing end he has
broken his processing up into primary and secondary stages.
The primary processor does the slaughtering and primal cuts,
as well as some of his value added products such as smokies,
sausages, and patties. Shane also hires a butcher who works
in his retail location to do the secondary processing. He feels
that having the butcher work directly at his retail location
helps connect people with their food – one of his primary
values. He explains his approach with the following:
[C]ustomers are so far removed from their food currently they really like seeing their meat cut right in front of their eyes and that is part of the experience – that is part of what I am selling. Instead of them saying things like ‘Where is this coming from?’ ‘How do I know it is your beef?’ They see the meat cut right in front of their eyes.
His father decided to go chemical free back in the early 90s.
The choice just made sense to them as a family and now Shane
finds that it also makes sense to his consumers. Shane says “I
don’t sell beef…they value that I am taking better care of my
land…that it is an Alberta family farm and they know the farmer
there…they value the fact that they can see the meat cut in
front of them…and they will pay more for that.” His customers
take comfort in knowing the values of the vendor and are
purchasing a product “that they feel safe feeding to their kids.”
Aggregator/ Finisher
Producer / Farm(15-20)
Abattoir /Processor
Butcher /Retail
Location
Consumers
Consumer
Shane and his father developed relationships over the years with
the various farmers from whom they buy cattle. Some of them the
family has known for a long time while others are more recent.
Either way Shane emphasizes that it is about working together
so that both he and the supply farmer are getting what they
need out of the relationship. A fair price is part of that but it also
means that both parties are willing to work together on things
like delivery dates, breeds, and quality so that the needs of both
operations are met and the animals fit well into the end system.
These comments were also echoed by the producers who supply
cattle to Shane. We interviewed Marshall Willis and Lindsay
Scott, two of the producers. Lindsay sells around 40 animals at
the backgrounded stage and Marshall supplies his 150 animals
at the finished or near finished stage. Both said they were happy
with the arrangements and were pleased that Shane was willing
to work with them fairly.
FIGURE 2: INTERMEDIARY SUPPLY CHAIN
Producers deliver their cattle to the aggregator where they add to
his own animal numbers. Animals are finished at the aggregator’s
farm and then taken to the processor for slaughter and cut into
primals. Product is then delivered to the retail location where it is
cut, wrapped and sold. A very small amount is delivered directly
to other retail locations or directly to consumers.
Feature supply chain is in black, alternative supply chain are marked in blue.
14
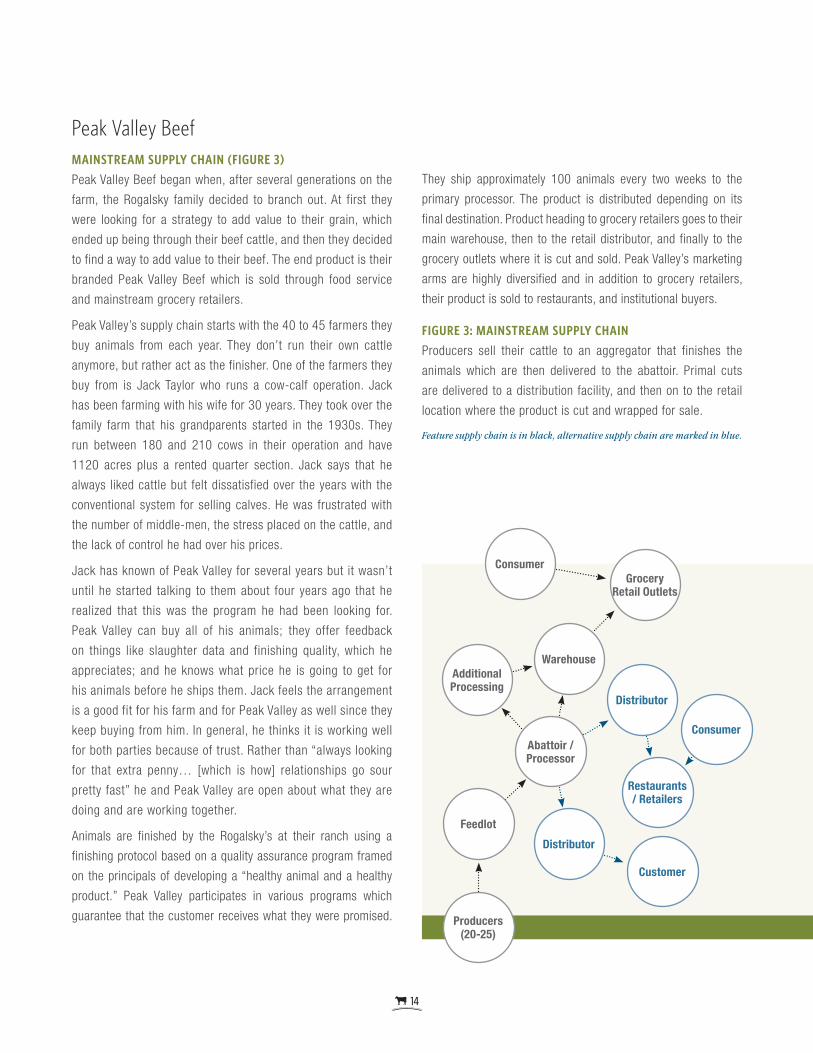
Peak Valley BeefMAINSTREAM SUPPLY CHAIN (FIGURE 3)
Peak Valley Beef began when, after several generations on the
farm, the Rogalsky family decided to branch out. At first they
were looking for a strategy to add value to their grain, which
ended up being through their beef cattle, and then they decided
to find a way to add value to their beef. The end product is their
branded Peak Valley Beef which is sold through food service
and mainstream grocery retailers.
Peak Valley’s supply chain starts with the 40 to 45 farmers they
buy animals from each year. They don’t run their own cattle
anymore, but rather act as the finisher. One of the farmers they
buy from is Jack Taylor who runs a cow-calf operation. Jack
has been farming with his wife for 30 years. They took over the
family farm that his grandparents started in the 1930s. They
run between 180 and 210 cows in their operation and have
1120 acres plus a rented quarter section. Jack says that he
always liked cattle but felt dissatisfied over the years with the
conventional system for selling calves. He was frustrated with
the number of middle-men, the stress placed on the cattle, and
the lack of control he had over his prices.
Jack has known of Peak Valley for several years but it wasn’t
until he started talking to them about four years ago that he
realized that this was the program he had been looking for.
Peak Valley can buy all of his animals; they offer feedback
on things like slaughter data and finishing quality, which he
appreciates; and he knows what price he is going to get for
his animals before he ships them. Jack feels the arrangement
is a good fit for his farm and for Peak Valley as well since they
keep buying from him. In general, he thinks it is working well
for both parties because of trust. Rather than “always looking
for that extra penny… [which is how] relationships go sour
pretty fast” he and Peak Valley are open about what they are
doing and are working together.
Animals are finished by the Rogalsky’s at their ranch using a
finishing protocol based on a quality assurance program framed
on the principals of developing a “healthy animal and a healthy
product.” Peak Valley participates in various programs which
guarantee that the customer receives what they were promised. Producers(20-25)
Feedlot
Abattoir / Processor
Warehouse
GroceryRetail Outlets
Consumer
Distributor
Distributor
Restaurants/ Retailers
AdditionalProcessing
Customer
Consumer
They ship approximately 100 animals every two weeks to the
primary processor. The product is distributed depending on its
final destination. Product heading to grocery retailers goes to their
main warehouse, then to the retail distributor, and finally to the
grocery outlets where it is cut and sold. Peak Valley’s marketing
arms are highly diversified and in addition to grocery retailers,
their product is sold to restaurants, and institutional buyers.
FIGURE 3: MAINSTREAM SUPPLY CHAIN
Producers sell their cattle to an aggregator that finishes the
animals which are then delivered to the abattoir. Primal cuts
are delivered to a distribution facility, and then on to the retail
location where the product is cut and wrapped for sale.
Feature supply chain is in black, alternative supply chain are marked in blue.
15
Supply Chain Performance AnalysisThe following analysis explores the performance that each of the three supply chains has in terms of benefits to the economy, fuel usage and food miles, and producer returns. The case studies provide detail and context for three examples of supply chains that exist in the differentiated beef market in Alberta. The direct market case study markets 35 to 70 animals/ year, the intermediated markets 500 animals/year, and the mainstream supply chain markets 2500 animals/year. Each supply chain tends to employ family and people and services from within their community. However, as the mainstream supply chain is much larger, they employ a much larger number of employees. The mainstream supply chain also has a portion of the profits that leaves the province as they sell into a nationally owned retailer. However, before the end retail stage many local Albertans and Alberta businesses benefit from the supply chain.
Economic Benefits to the Regional AreaCOW-CALF PRODUCTION
There were many similarities in terms of the impact of primary
producers on the regional economy regardless of the supply
chain. The impacts from the direct marketing supply chain largely
fall into this category as well because the supply chain is largely
made up of the primary producer. All of the producers contribute
to the regional rural economy by using community resources,
services, and products. The primary labourers on each of the
farms are the producers themselves. Each of them did need an
extra hand from time to time for activities such as handling the
cattle or fencing. The majority of this extra labour came from
family members. At least one of the producers specifically
mentioned that she tries to keep the farm a size she can handle
on her own. However, when outside services and product were
needed, it was generally farms and businesses from the rural
community that were hired or purchased from. This included:
• Buying feed, hay and silage from nearby farmers. • Contracting a nearby farmer to do bailage, cutting hay, or cropping. • Purchasing minerals from nearby feed stores. • Buying fuel. • Using vaccines and regional veterinarians when needed. (Several mentioned they rarely used a vet.)
• Employing nearby heavy duty mechanics. • Renting land from nearby farmers. • Tub grinding of hay or straw. • Hauling manure. • Trucking grain, hay, cattle. • Renting equipment.
There were some circumstances where the farmers went beyond
the community to purchase products and services, such as when
weather conditions meant that they had to leave the region
to find anyone with hay for sale, buying pellets from southern
Alberta and Saskatchewan because they were cheaper than what
could be produced in the community, sourcing feed and mineral
supplies from outside the community because they were not
available there, and using abattoirs outside their region because
there were none operating in their area.
It was also mentioned by several of the farmers that they have
a strong community network of people who will come and help
out when needed. For example, Marshall Willis helps his neighbour
pour concrete and in return the neighbour helps him move and load
cattle. Lindsay Scott has a neighbour who helps her castrate bulls,
and Jack Taylor has a “pretty good circle of friends and neighbours
here and we go back and forth quite a bit… usually [during] cattle
processing time.” Jack also has a synergistic relationship with the
farmers he hires to do much of his cropping work. Jack does not
need to invest in new equipment and the owners are happy to have
the extra work to help pay for their equipment investments.
INTERMEDIARY
Once we leave primary production and move down the supply
chain towards finishing, processing, and retail we found that
many of the products and services used were also from within
their communities (rural and urban). Shane Laughlin said that he

16
had very few suppliers for products but those that he used, for
products such as label and butcher supplies, came from nearby
cities. He also employed people and services from the community
including one 3/4 time farm employee, an abattoir 55 km from
his farm, the abattoir’s trucking service to move his primal cuts
to the retail location, two full-time meat cutters, and several retail
employees. Shane added that one of the key factors to having a
successful operation was having good people and he values the
skills and contribution of his team.
MAINSTREAM
Peak Valley Beef because of its size is more complex. At the
feeding operation, the farm family manages the operation and
employs multiple full-time people including office staff and farm
laborers. The farm labourers are all from the community. In the
marketing branch of the company a family member and staff from
within the nearby community perform marketing duties.
The services and products that Peak Valley Beef use include several
regional suppliers such as the farmers that supply them with their
cattle and feed, the Alberta feed mill that provides minerals and
salts, and a federally inspected, independently owned, processor
that is a couple hundred kilometers from the farm. They source
packaging materials from slightly further afield, purchasing labels
from British Columbia and boxes from Manitoba. They use a small
independently owned Alberta based company for the majority
of their trucking within the province and a larger Alberta owned
company for their trucking from the packing plant to the warehouse
and delivery outside of the province. They rent space at a storage
facility that is run by a Canadian owned national company. They
also work with a number of Alberta based and national distributors.
The retail location where they sell their product is a nationally
owned mainstream grocery store. It should be noted, however, that
Peak Valley also supplies many local restaurants and other Alberta
based market channels.
SUMMARY
In all three supply chains there was a significant contribution
to the regional economy. On the primary production level, the
majority of products, services, and human resources were from
the community (rural). Profit margins at the production level are
relatively small. In order to remain profitable farmers typically
must ensure a streamlined system where those within the family
unit are able to accomplish the majority of the work.
Beyond the direct impact that the primary producers had within
their rural communities, the producers were also drivers of a larger
economic impact which is more difficult to quantify. For example,
once you left the primary production, both the intermediary and
the mainstream supply chains relied on the farmers to provide the
products that form the basis of their business. Also as mentioned
in the section above entitled ‘Economic Impact of Local Food’
research shows that the agriculture sector contributes to both
social and economic impact in the regional economy. A strong
sense of community contributes to social cohesion and community
identity that comes from working within the community, working
with neighbours and nearby businesses, and raising children who
may remain in the community.
The mainstream and intermediated supply chains also had a
significant impact on the regional economy. The vast majority of
employees and purchased products and services originating from
within the regional community for the mainstream supply chain,
and even a larger proportion did so for the intermediated chain.
Another aspect of both the intermediary and the mainstream
supply chains in terms of regional impact is the significance of
them acting as aggregators. They enable many other smaller
producers to have access to a market for their products. Shane
Laughlin buys from 10 to 20 other local farmers and Peak Valley
buys from 40 to 45 other farmers. This is a significant contribution
to the local agricultural economy.
Finally it must be mentioned that each of the supply chains are
meeting a demand by the consumer for a differentiated beef
product. The decision to fulfill this demand is a driver of local
economic activity which benefits the region.
Regional economic impact can also be examined in terms of the
contribution made towards social capital. Social capital is defined
as a productive asset and resource that is found in networks
of social relationships and which can contribute towards social
capacity and economic and community development (Reimer,
2006, Tiepoh & Reimer 2004). At the production level social
capital was created as networks amongst the farmers and
community product and service providers were reinforced through
their use. This was particularly strong where other producers
within the community were relied upon in a reciprocal fashion to
ensure that the farm activities were done. Between the producers
who participated in the intermediated and mainstream supply
17
chain very little social capital was drawn upon or developed.
The producers have very little interaction amongst themselves
and this therefore limited the ability for these producers to build
social capital that could be drawn on for further supply chain
development or community development beyond the supply chain.
Vertically within the two supply chains the development of social
capital however was very strong and important; the producers
in particular felt that the degree of trust that they had developed
between themselves and the aggregators led to the continued
success of their involvement in the supply chain. The direct
marketer used his social capital to reach further markets, but
had not yet successfully drawn on his social networks to further
develop the success of his supply chain. The development of
social capital between the producer and the consumer was also
strongly evident in the intermediated supply chain where the
consumers put a strong value on the connection between where
their food came from, how it was produced and their decision
to continue to buy the product. The development of this social
capital was present but much less strong at the mainstream
supply chain, where the consumer was able to connect with
the aggregator through educational materials only. In terms of
creating social capital within the community beyond the supply
chain – consumer relationship, not enough information was
obtained to determine the level of civic engagement that was
created through the activities of each supply chain.
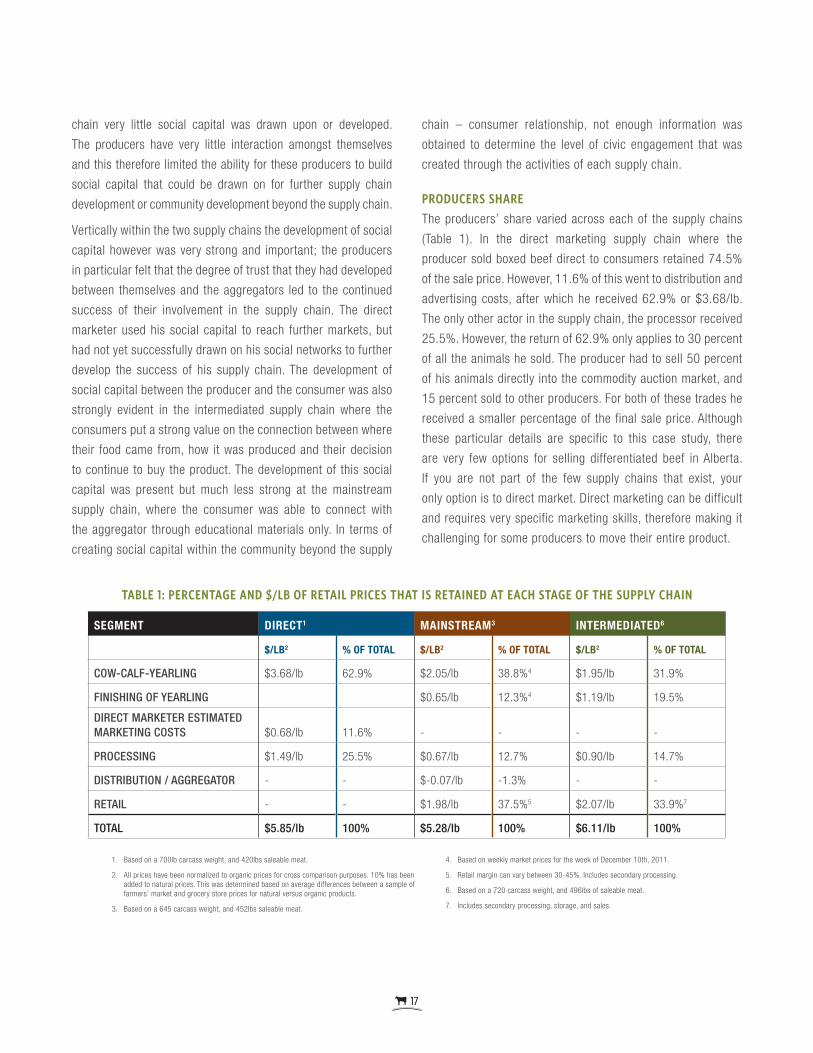
PRODUCERS SHARE
The producers’ share varied across each of the supply chains
(Table 1). In the direct marketing supply chain where the
producer sold boxed beef direct to consumers retained 74.5%
of the sale price. However, 11.6% of this went to distribution and
advertising costs, after which he received 62.9% or $3.68/lb.
The only other actor in the supply chain, the processor received
25.5%. However, the return of 62.9% only applies to 30 percent
of all the animals he sold. The producer had to sell 50 percent
of his animals directly into the commodity auction market, and
15 percent sold to other producers. For both of these trades he
received a smaller percentage of the final sale price. Although
these particular details are specific to this case study, there
are very few options for selling differentiated beef in Alberta.
If you are not part of the few supply chains that exist, your
only option is to direct market. Direct marketing can be difficult
and requires very specific marketing skills, therefore making it
challenging for some producers to move their entire product.
TABLE 1: PERCENTAGE AND $/LB OF RETAIL PRICES THAT IS RETAINED AT EACH STAGE OF THE SUPPLY CHAIN
SEGMENT DIRECT1 MAINSTREAM3 INTERMEDIATED6
$/LB2 % OF TOTAL $/LB2 % OF TOTAL $/LB2 % OF TOTAL
COW-CALF-YEARLING $3.68/lb 62.9% $2.05/lb 38.8%4 $1.95/lb 31.9%
FINISHING OF YEARLING $0.65/lb 12.3%4 $1.19/lb 19.5%
DIRECT MARKETER ESTIMATED MARKETING COSTS $0.68/lb 11.6% - - - -
PROCESSING $1.49/lb 25.5% $0.67/lb 12.7% $0.90/lb 14.7%
DISTRIBUTION / AGGREGATOR - - $-0.07/lb -1.3% - -
RETAIL - - $1.98/lb 37.5%5 $2.07/lb 33.9%7
TOTAL $5.85/lb 100% $5.28/lb 100% $6.11/lb 100%
1. Based on a 700lb carcass weight, and 420lbs saleable meat.
2. All prices have been normalized to organic prices for cross comparison purposes. 10% has been added to natural prices. This was determined based on average differences between a sample of farmers’ market and grocery store prices for natural versus organic products.
3. Based on a 645 carcass weight, and 452lbs saleable meat.
4. Based on weekly market prices for the week of December 10th, 2011.
5. Retail margin can vary between 30-45%. Includes secondary processing.
6. Based on a 720 carcass weight, and 496lbs of saleable meat.
7. Includes secondary processing, storage, and sales.

18
The producers` shares in the intermediated supply chain varied
depending on whether they sold the cattle as yearlings or
finished animals. At the yearling stage the producer received
31.9% of the sale price, and at the finishing stage the producer
received 51.4%. The primary processor retained 14.7% and
the secondary processing and retail retained 33.9%. A major
difference between those involved in the intermediary and the
direct marketing supply chain is that both producers in the
intermediary supply chain received lower producer share but
were able to sell all of their animals through their supply chains
and they received premiums above the auction market prices
for all the animals they sold.
In the mainstream supply chain the cow-calf producer received
38.8% and Peak Valley received 12.3% for the finishing stage.
The processor received 12.7%. Peak Valley then received
-1.3% for coordinating the marketing of the products, and the
retailer received between 30-45%. All of these numbers are
variable. Peak Valley negotiated the price they received for their
products from the retailer and then retail margins varied; an
average of 37.5% was estimated. The percentages across this
supply chain are constantly changing as they are influenced
much more strongly by the fluctuations in cattle markets. Peak
Valley pays their producers a price premium above the market
price and at the time of this analysis prices for beef cattle were
very high. It is not easy to carry this additional cost onto the
retailer and therefore they ended up losing money on the beef
they purchased at this time.
The price per kilogram to the consumer in the mainstream supply
chain, when averaged across all cuts in the animal, was slightly
lower than those in the direct and intermediated supply chain.
The mainstream supply chain only sells select premium cuts at
the mainstream grocery store, but those cuts are sold at a higher
price per kilogram than for a similar cut at either the retail location
owned by the intermediary, sold by the direct marketer, or than
prices observed at farmers’ markets. Meanwhile the rest of the
cuts from each animal are sold through alternate market channels
and the average price per pound for the whole animal ends up
being slightly lower than the price for the direct marketing and
intermediated supply chain. It should also be noted that, as was
the case with the intermediary supply chain, the producers were
able to sell all of their animals to the aggregator and also received
a premium above the market prices for all of those animals.
The direct marketing supply chain was influenced very little
by the commodity market and, therefore, prices are set based
on costs and an analysis of the consumer’s willingness to pay.
The intermediary supply chain was somewhat affected by the
market as the price that the producer received was set in part
by the average auction market price. However, the aggregator
in this supply chain still retains a fair amount of control because
they own all stages, except for primary processing, from the
finishing to the secondary processing and retail. Also because
the intermediary has a direct relationship with the consumer,
the consumers’ willingness to pay remains more consistent over
time. The mainstream supply chain on the other hand was highly
influenced by the market. The producers’ price is based on a
premium over the auction market and costs throughout the rest
of the supply chain are influenced to a greater degree by outside
forces because of the multiple intermediaries involved.
Another factor which varied significantly between each supply
chain was the cost for processing. The processing for the direct
marketing supply chain was significantly higher per animal
than for both of the other two supply chains. This is due to both
number of animals processed at any given time, as well as the
extent of processing services used. For both the intermediary and
the mainstream supply chain the processor was slaughtering and
cutting the animals into primal cuts only, whereas for the direct
marketing supply chain the processor was providing all services
from slaughter to cutting and wrapping individual cuts.
FOOD MILES AND FUEL USE
The food mile analysis has typically been used to compare import
versus domestic products. However, we have appropriated the
analysis in order to compare across the three types of supply
chains that exist within Alberta alone. The analysis looks at the
average number of kilometers that a unit of product travels
from the beginning of its journey at the farm to the retail shelf.
Furthermore we have added the component of fuel usage per kg
of product shipped in order to gain a more in-depth understanding
of the environmental impact of each product. The fuel usage
calculation was based on the total amount of fuel used to travel
the distance from point A to point B, and then divided this by the
total kilograms of product shipped over that distance.
The average distances for each supply chain include cow-calf to the
retail market. In the mainstream supply chain the average distance

19
MAINSTREAM1 DISTANCE / TRIP (KM)2
AVERAGE WEIGHT / TRIP (KG)
FUEL USE / TRIP (L)
FUEL USE / KG SHIPPED
COW-CALF TO FINISHER 250KM (AVG) 18,427KG 90.5 LITRES
FINISHER TO ABATTOIR 225KM 53,505KG 81.45 LITRES
ABATTOIR TO WAREHOUSE
174KM 22,049KG 51.54 LITRES
WAREHOUSE TO ALBERTA GROCERY RETAIL OUTLETS
165KM (AVG) 481KG 123.75 LITRES
TOTAL 949KM 94,462KG 374.3 LITRES 0.0037L/KG
INTERMEDIATED SUPPLY CHAIN3
DISTANCE / TRIP (KM)
AVERAGE WEIGHT / TRIP (KG)
FUEL USE / TRIP (L)
FUEL USE / KG SHIPPED
COW-CALF TO FINISHER 300KM (AVG) 550KG 70.5 LITRES
FINISHER TO ABATTOIR 55 KM 4536KG 13 LITRES
ABATTOIR TO RETAIL LOCATION
130KM 1389KG 20.6 LITRES
TOTAL 485KM 16,865KG 124.60 LITRES 0.0074L/KG
DIRECT MARKET SUPPLY CHAIN4
DISTANCE / TRIP (KM)
AVERAGE WEIGHT / TRIP (KG)
FUEL USE / TRIP (L)
FUEL USE / KG SHIPPED
FARM TO PROCESSOR 60 KM 2041KG 7.2 LITRES
PROCESSOR TO FARM 60 KM 573KG 6 LITRES
FARM TO CONSUMER 505KM (AVG) 318KG 50.5 LITRES
TOTAL 625KM 2932KG 83.2 0.0217L/KG
was 949km. This is almost twice as much as the intermediary chain
at 485km, and just over a third more than the direct market supply
chain at 625km. However, upon examination of the fuel use per
kg, calculated for the route of the supply chains analyzed, it is the
direct marketing supply chain at 0.0217l/kg that has the highest
fuel usage per kg of product shipped. The intermediated chain uses
0.0074l/kg and the mainstream uses 0.0037l/kg. (Table 2)
There are several factors that affect the number of kilometers that
a product travels before it reaches the consumer. For the direct
marketer a major factor was the distance between the farm, and
the hub of consumers who were willing to pay the premium for
the product. In the intermediary and mainstream situations the
distances between the producers they buy from and the finisher
plays a large role. This distance can vary significantly depending
on the availability of producers willing to raise the products.
For all three supply chains, a major factor was the distance to
an abattoir that will work with the market specifications, such
as particular cuts, and other certifications including humane
handling techniques, chemical product restrictions or organic
certification. Finally, for the mainstream market, the distance to
storage facilities and then ultimately to market destinations plays
an important role. However, the type of vehicle used and its fuel
economy equally had an important influence on the overall carbon
footprint of those kilometers travelled.
TABLE 2: FOOD KILOMETERS AND FUEL USE PER KG OF PRODUCT TRANSPORTED
1. The calculations account for only those products sold within Alberta. A transport truck with a full liner load was used between cow-calf and finisher and finisher and abattoir with an average fuel economy of 36.2l/100km. A transport truck with a fuel economy of 39.5l/100km was used between the abattoir and the warehouse and a truck with a fuel economy of 75l/100km was used between the warehouse and the grocery retail location. The beef between the abattoir and the warehouse only fills ¾ of the truck on average, and it is always filled with other product, therefore only ¾ of the fuel was used for this calculation.
2. All calculations are based on one way travel. Some transport vehicles return with other product, while others return empty. Full details across all supply chains were not able to be obtained, and therefore only kilometers with product are included.
3. An F150 diesel with a stock trailer was used for 6 of the 13 trips between the cow-calf producer and the finisher with an a fuel economy of 23.5l/10km. A transport truck with a liner load was used for the other 7 trips with a fuel economy of 36.2l/100km. An F150 and stock trailer was used between the finisher and the processor with an average of 9 animals transported per trip and a fuel economy of 23.5l/100km. A refrigerated cargo van was used between the abattoir and the retail location. The fuel economy for this vehicle is assumed to be 31.7litres/100km (Refrigerator Transporter, 2002). The beef fills only half of the truck, and it is always full with other product, therefore only half of the fuel was used for this calculation.
4. Only those products sold though deliveries to the consumer were used for this analysis. An F150 vehicle with a stock trailer was used to transport the animals to the abattoir, and the same F150 was used to move the product from the processor to the storage at the farm, and then on to the customer in the city. The fuel economy with the stock trailer is 12 litres/100km and with the frozen product it is 10 litres/100km.

20
Other Business Considerations
Growing Differentiated BeefThis section explores the strategies and experiences of the supply
chains as they relate to selling a differentiated beef product,
and in particular highlights factors that influence production
and marketing strategies of differentiated beef producers in the
province. For the producers in this study, the decision to focus
on natural/organic beef was based on both their fundamental
values and beliefs and their desire to maintain a manageable
and financially viable farming operation. All of the producers
shared a common passion for raising cattle and a love of
ranching. They also had similar concerns about the impacts of
conventional farming practices on human and animal health and
the environment. Natural/organic beef production is seen as an
alternative; producer Lindsay Scott adds, “It is a healthier lifestyle
and I think it is much better for you but I also felt that…[there
was a need] to capture the benefits of it.” By differentiating their
beef as natural/organic, producers can supply a quality product
and receive a premium price for their efforts.
The benefits come with a number of challenges. Some of the
interviewees felt that the standards for organic certification
are becoming “too burdensome.” The increasing regulations
concerning fencing, organic feed requirements, vaccination
and vitamins, etc., along with the increasing record keeping
responsibilities are acting as a deterrent for some small-scale
producers. It is also a difficult, expensive, and time consuming
process to transition to a certified organic herd. Cows cannot be
certified unless they were raised under the certification standards;
therefore, it takes years to develop a totally certified herd.
Marshall Willlis, Greg Hanlen, Lindsay Scott and Jack Taylor
all mentioned that once the herd (either natural or organic) is
established it is equally difficult to maintain the herd size over
time. Factors such as drought and late winter storms can limit
the production capacity of their farmland. Without access to
quality low cost feed, producers are faced with the decision to
purchase higher cost imported feed from outside their area or
culling their herd to a level that their land can support under
these stressed conditions. The following comments illustrate how
culling decisions impact the herd size and the bottom line:
Our biggest problem is that we didn’t have the feed and if you don’t have the feed you cannot maintain these animals and I wasn’t going to go out and buy expensive feed that possibly wouldn’t match what I need so we had to make a decision. We sold them into market…very cheap. About 50 percent we dumped (Greg Hanlen).
[My cow/calf pairs] fluctuate between 45 and 60. I would like to stay around the 60 mark but right now I am around the 45 mark because I had to sell a couple of years ago when we had that drought, so I am hoping to be up to 60 by next year and I will keep going (Lindsay Scott).
We have just gone through the worse drought this area has seen in 50 years or more and we have had to really shrink back which is why our costs have gone through the roof – which we can’t pass on to the customers (Jack Taylor).
The need to be flexible and to adjust herd size to the changing
production capacity of the land while managing costs, planning
for the future, and preparing for the unexpected can be difficult
as these producers explained:
One of the things that I always have to consider is balancing costs with my income and it is because [prices of] equipment and things like that are so high and for me it’s the breakdowns…because I don’t fix equipment (Lindsay Scott).
I guess the major challenge is trying to be profitable. The last ten years have just been really rough on the industry and as the industry goes poor – it is stressful. BSE is one thing that is pretty incredible but the dry years really take a toll on a person. You really worry about what you are doing some days- a lot of days…(Jack Taylor).
All of the producers interviewed emphasized that in order to be
profitable you have to develop a marketing strategy that fits your
operation, maximizes your returns, and eliminates the middleman
whenever possible. As Lindsay Scott said, “You can’t just farm –
you have to have a market.” For the producers in this study their
marketing strategies all include some form of direct sales to
customers although the customer may vary from the end consumer,
to an intermediary or a supplier for mainstream outlets.

21
Other Business Considerations for Direct Sales to End Consumers (Boxed Beef Delivery)Greg Hanlen has a small herd of 35 mature cows now. He has had
to ``liquidate a lot of the herd” over the last few years because of
the drought and this has left him with limited volume. In addition,
he raises his cattle on grass and seasonally harvests, so he
does not have fresh product to sell on a weekly basis but rather
processes his animals from August to November each year.
Greg takes great pride in the quality of his premium beef and
has become disillusioned with selling through the auction market
because once all the market fees and discounting are added up
there is little left for the farmer. In his words, ``You might as well
just go there and say here come and take them. That`s how bad
it is.” In order to have some control and receive a fairer return he
has explored a number of alternative marketing strategies.
He purchased a large insulated trailer and started selling direct to
consumers at farmers’ markets and through boxed beef deliveries
in the city. The challenge he faces is deciding how many cattle to
finish because with retail sales it is hard to determine just how
much product will move and sales are impacted by the economy.
At times “it is pretty tough to find homes for them all” and Greg
has sold some to other producers who have run short of beef,
some to a nearby processor, and unfortunately he has also had to
“dump some in the market” again and take a loss.
He has developed his boxed beef delivery customers over time,
through word of mouth and the reputation of his product. Greg
does, however, admit that he “prefers doing the farming not the
marketing. It is a real skill and some people are very, very good
at it…but I don’t know if I am really cut out for that side of it.” He
has tried to partner with another nearby producer to open a retail
outlet in a larger centre. The retail store would allow him to move
more beef and reduce his transportation costs but as yet they
have not been able to find a suitable location. He is keeping his
options open though and if he “can’t get more direct marketing
then [he] is prepared to look at other avenues” such as selling
more through an intermediary or working with the [European]
“export thing if it does come to anything.” At the moment though,
there are few of these options available for differentiated beef
products such as his, making direct marketing his primary option.
Other Business considerations for the Intermediated Supply ChainSelling to an intermediary is a strategy that both Marshall Willis
and Lindsay Scott are using to market their animals. Although
they have slightly different operations their intermediary Shane
Laughlin has been able to accommodate their production
schedules because he needs a continuous supply of beef for his
retail outlet. The arrangement seems to work well for all parties.
Marshall ships about 55 semi-finished cattle in June and 55 in
November. Because the animals vary in the degree to which they are
fattened, Shane can stagger the processing to meet his customers’
demand for beef. Lindsay, on the other hand, does not finish her
animals but sells Shane about a dozen 1000 lb. cattle in June,
August, and November and he finishes them on his farm when he
needs them. This arrangement works out well for Shane, who is then
able to finish the animals as his marketing schedule dictates.
These buyer/seller relationships are based on trust and there is no pre-
sale contract only an “over-the –phone handshake agreement” (Marshall
Willis). That is fine with Marshall because he has been stuck with animals
in the past even when he has had more formalized agreements and
believes that it is the relationship that is important. He is also very happy
to be involved in this type of supply chain because he has a lot more trust
in this system than he has with the more conventional routes. Lindsay,
too, is very happy to sell all her animals to Shane, in part because the
relationship works well for her, “He gives me his word.” She adds, “I have
a fairly secure market. Because my market is set up so well…my time
to market is very minimal.” She feels she has some control over pricing
and gets a fair price because she receives market value plus a premium
and that makes a real difference to her bottom line.
The relationship appears to be synergistic and symbiotic in that Shane
gets high quality beef that he needs for his retail outlet at a manageable
volume and both Marshall and Lindsay receive a stable and fair return
on their investment. It is a mutually beneficial arrangement and it allows
all parties to do something together that they could not accomplish
alone. They “share the responsibility” (Lindsay Scott) and the benefits.
For now the arrangement is working well, but as Lindsay explains,
“If there comes a time when I produce more than he buys…I will
probably do direct sales or work with other intermediaries.” Marshall
too is keeping his options open. He may purchase a reefer truck and
sell frozen boxed beef in a nearby community or do some custom
feeding for other producers if he has a surplus of feed in the future.

22
Other Business Considerations for the Mainstream Supply ChainJack Taylor runs a cow/calf operation and he, too, has looked at
a number of different marketing strategies. He tried the auction
market system but said, “The auction mart works for some people
but I just don’t care for it. I don’t think [the auction marts] are
producer friendly really although they are improving. Their business
seems to be geared more towards the buyer and the feedlots.”
He was looking for a way to keep more control over the process
and the price. He argues that you can’t “just send the cattle off
to the auction mart and just hope for the best price for that day”
and that is why he decided to sell his animals to Peak Valley.
He ships his cattle in November or early December and they are
finished by Peak Valley as needed. Jack receives a selling price
based on a weekly market price plus a premium. If his cattle
grade out at AAA there is also an additional bonus. That level
of stability is important to Jack, “I like to know what I’m getting
before I leave the farm.”
Jack has known the people at Peak Valley for a long time and has
been watching how they have developed their business. He feels
that they shared the same values and that his participation in the
program could be what he was looking for.
I guess it is something that I have always kinda valued, if a guy could go straight from the farmer to consumer it is one way of doing it. [However this arrangement with Peak Valley also has benefits]. Economically it has been helpful to me and it is nice to work with someone along the way. To know that your cattle are going there and where they are heading off to on some other program. Someone else to work with is kinda nice.
Jack also enjoys the feedback he receives about the quality of
his cattle and suggestions about how to alter breeding programs
to produce animals that finish well. Changing your herd through
breeding takes time and Jack is not certain about what the future
will hold. He feels that the industry as a whole is struggling and
has started wondering if there is something else out there. His
children are leaving home now and although he has tried to find
someone who is interested in partnering with him to run his
operation few young people are interested in beef anymore.
Within the next ten years something is going to have to change. I am the 3rd generation and it looks like it is maybe coming to an end – there are some tough decisions to be made although we are still fairly young but you just never know do ya.
SummaryAs the different case studies illustrate, each producer must find
a marketing strategy or combination of strategies that match
their abilities and their production capacity. They also have
to be flexible and ready to adjust their approach in order to
compensate for changing conditions and to take advantage of
opportunities. Overall, the producers insist that it is critical to
keep the size manageable and the work doable. Lindsay Scott
sums it up with the following:
Because we were quite a bit larger than what I am now and I can honestly say that bigger is not better – it is not always the case. It is what you are getting for what you are producing and what your input costs are because when you are talking bigger you are talking more labor, more manpower, more equipment, and more hours of work – whereas I have time now to take vacation where I never was before. I can’t say that I am any worse off because when you are bigger the expenses eat up most of the extra that you are producing…I look at what we used to spend on fuel and equipment maintenance and repairs and stuff compared to what I have to now and the change is so drastically different – it kinda makes you wonder why you were that big in the first place!

23
Key Lessons and Recommendations1. All three supply chains have value to producers. They offer
the opportunity for increased control over pricing, the ability
to demand a higher or fairer price for a premium product,
and enable consumers to appreciate their product for its
particular attributes. Trust is built into the value chains.
2. Different supply chains worked best for different producers.
The direct marketer appreciated the connections he was
able to make with the customers and his increased ability to
charge a fairer price for his products, but he found marketing
to be a challenge and was not able to sell all his animals
through this market channel.
3. Those involved in the intermediary supply chain were very
happy because they were able to move all of their cattle. For
Lindsay Scott in particular the fact that she did not need to
finish the animals worked very well with her system as this
was not something she was interested in taking on. Marshall
Willis was grateful to have a buyer that would purchase his
animals at the fattened stage because he could charge a
higher amount for his product. Both are pleased to be part
of a supply chain that has someone who is extremely adept
at marketing, able to move their entire inventory, and flexible
enough to incorporate their different types of animals and
production methods.
4. The mainstream supply chain worked best for Jack Taylor.
His cow-calf operation needed someone who was willing to
do all of the finishing and marketing; Peak Valley bought
all of his animals, gave him a premium for his product and
allowed him to have a higher degree of trust in the system.
Where to from here?
5. All three supply chains provided an important contribution
to the regional economy. The producers themselves serve
as a driver of both economic activity and community
development. Both the intermediary and the mainstream
supply chain provided an outlet for cattle that supported
many small scale beef producers, as well as contributed
to the regional economy. Furthermore, all three supply
chains focused on environmental stewardship and humane
treatment of livestock. They shared these values across
the supply chains right to the consumer. The bridge was
stronger at both the direct and intermediary levels but all
three filled a demand for environmentally responsible and
healthy products, and also played an educational role which
benefits the consumers, and the larger communities.
6. All three supply chains contributed to the development
of social capital. At the production level social capital
was created as networks were reinforced as they were
drawn upon by the farmers and community product and
service providers. Social capital was also created within
the intermediated and mainstream supply chain as the
development of relationships created a more successful
supply chain. Social capital was also created between the
producers and the consumers, although this was much
stronger at the direct market and the intermediated supply
chain where it contributed towards the loyalty shown on
behalf of the consumer. In terms of creating social capital
within the community beyond the supply chain – consumer
relationship, not enough information was obtained to
determine the level of civic engagement that was created
through the activities of each supply chain.

24
7. Another important contribution is that many of the farms
have children who are seriously interested in coming back
to take over the farm. The others also had hopes of family
interest, but were not sure if it would happen or not. Several
share the desire to have the children go out and get further
education and other skills such as a trade before they came
back to the farm. By planning for farm succession and
attracting their young family members back to the farm they
are contributing to the long term agricultural economy.
8. The analysis of the producers share is useful in terms of
determining opportunity for return in each supply chain.
However, several factors must be considered when examining
these numbers. The producers share does not represent the
amount of profit that the farmer is receiving because the
cost of production can fluctuate between different farms.
The amount of time and effort needed to participate in each
supply chain also varies greatly in degree of involvement. The
producer in direct marketing takes a much greater time and
effort to manage the entire supply chain. In this particular
case study, the direct marketer was also struggling to market
all of his animals through this market channel and had to sell
approximately two thirds of his animals to streams where
he received a smaller portion of the overall market price.
In both the intermediary and the mainstream supply chains
the producers were able to sell all of their animals. However,
we can conclusively state that all three provided a “greater”
return to the producers than the commodity market.
9. In general there appeared to be benefits across the whole
supply chain for the intermediary and the mainstream
supply chain that are worth mentioning. The efficiencies
gained in working together helped to overcome some of the
challenges in their supply chains. For example, by having
someone in the chain dedicated to marketing, a greater
volume of product was able to be moved which included
a larger number of animals being sold at the premium
price from the farm. This also helped create efficiencies in
terms of storage. The mainstream supply chain was able
to rent space within a much larger storage facility helping
to reduce costs, and the intermediary was able to cost
effectively build his own storage facility at the retail location.
The larger quantity of products transported helped reduce
the environmental impact of fuel use per kilogram shipped.
Working together across the supply chain appeared to have
helped each segment achieve success.
10. Another area which future research may want to consider
is incorporating a cost of production analysis. This would
determine not only the percentage return of the end retail price
to the producer, but also the degree to which these returns
translate into profit. It could be the case that one producer is
receiving a net higher return above cost of production in one
supply chain over another due to characteristics particular to
that supply chain or to the producers’ production methods.
11. Another factor which influences producer share over time
is the degree to which the supply chain is affected by
fluctuations in the market. Beef prices are continually
fluctuating. For example prices at the time of this research
prices were significantly higher than overall averages
and have a significant impact on both supply chains and
producers (CBC, 2011, Feb 9). In order to obtain an accurate
picture, an analysis over an extended period of time could
be incorporated.
12. A food mile analysis determines the distance traveled by a
product, however, in order to determine the environmental
impact based on fuel usage over that distance, a fuel usage
per unit of product shipped analysis should be included.
The average distance that the product was shipped in the
mainstream supply chain was 949km which was almost twice
as much as the intermediary chain at 485km, and just over
a third more than the direct market supply chain at 625km.
In the direct marketing supply chain the distance includes
from the farm to the processor, back to the farm and then
to the city where his market is. In the intermediary supply
chain the distance includes from the cow-calf operation to
the aggregator, then to the processor and then to the retail
25
location. For the mainstream supply chain the distance
includes travel from the cow-calf to the aggregator, then to the
processor, then to the distributor/warehouse facility and then
on to the end grocery location. However, upon examination
of the fuel use per kg shipped it is the direct market supply
chain at 3.76l/kg that has the highest environmental impact
in terms of fuel usage. The intermediated supply chain uses
0.172l/kg and the mainstream uses 0.31l/kg.
13. For moving forward we recommend that future studies attempt
to learn what aspects of which supply chains involve the
greatest benefits to the producers and the health and viability
of the supply chains. Areas to be investigated include producer
return, consistency of demand, sharing of risk, development of
longer term relationships/partnerships. They should also focus
on a general exploration of what other benefits producers
receive from different types of supply chains.
14. We also recommend that future research investigate what
factors lead to successful local food supply chains in general,
and what factors present challenges to the success of
those supply chains. Questions could include: What types
of partnerships contribute best to which types of supply
chains? How do these partnerships develop? What can be
done to encourage and support their development? What
circumstances need to be nurtured in order to achieve success
in terms of supply chain development? What challenges need
to be addressed for the supply chain to overcome constraints?
What aspects of the supply chains are set by outside factors
(such as grocery retail systems)? How do these factors affect
the development of the supply chain?
15. These questions should be pursued through an in-depth case
study approach in order to obtain the rich detail necessary
to understand these factors. Furthermore, they should be
done across different products as characteristics of supply
chains vary by product. We strongly encourage the research
focus on supply chains that incorporate similar types of
products, including similar product attributes and production
techniques wherever possible.
16. A further exploration of local food supply chains which
incorporates these key lessons will allow Explore Local
initiative and ARD to make strong policy decisions about how
to encourage the development of local food supply chains.
These analyses will not only allow for greater benefit to the
producers, but also others involved in the supply chains, and
ultimately the consumer and larger community.
26
ReferencesAgriculture and Agri-Food Canada. (2009a). Health and wellness trends for Canada and the world. Retrieved from http://ats.agr.gc.ca/info/4367-eng.htm
Agriculture and Agri-Food Canada. (2009b). The Canadian organic beef industry: Competitiveness, capacity, and opportunity. Presentation commissioned by and presented to the Organic Value Chain Round Table.
Agriculture and Agri-Food Canada. (2010). Agri-Food 2010 hot trends report: United States. Retrieved from http://www.ats-sea.agr.gc.ca/amr/5483-eng.htm
Alberta Agriculture and Rural Development. (2008). Alternative agricultural markets in Alberta, 2008. Retrieved from http://www1.agric.gov.ab.ca/$department/deptdocs.nsf/all/apa547/$FILE/ReportAlternativeAgMarkets2008FinalRevised.pdf
Alberta Agriculture and Rural Development. (2010). Dine Alberta. Retrieved from http://www1.agric.gov.ab.ca/$Department/deptdocs.nsf/All/apa8941?opendocument
Alberta Beef Producers Association. (2010). Alberta cattle industry statistics. Retrieved from http://albertabeef.org/consumers/new-page/
Alberta Farmers’ Market Association. (2010). Retrieved from http://www.albertamarkets.com/
Alberta Farm Fresh Producers Association. (2010). Come to our farms, 2010 Edition. {Brochure}. Edmonton.
Babcock, J. (2008). Redeveloping a Montana food processing industry: The role of food innovation centres. Retrieved from http://www.growmontana.ncat.org/docs/Babcock_Food_Innovation_Ctrs_12.08.pdf
Canals, M., Cowell, L., Sims, S., & Basson, L. (2007). Comparing domestic versus imported apples: A focus on energy use. Environ. Sci. Pollution, 14(5), 338-44.
Carter-Whitney, M. (2009). Bringing local food home: Legal, regulatory and institutional barriers to local food. Retrieved from http://www.cielap.org/pdf/CIELAP_FoodLegalBarriers.pdf
CBC. (2011, Feb 9). Rising beef prices predicted. Retrieved from http://license.icopyright.net/user/viewFreeUse.act?fuid=MTE2OTgyOTk=
Community Supported Agriculture in Alberta. (2010). Retrieved from http://www.csaalberta.com/
Conference Board of Canada. (2010). Canadian industrial profile 2010: Food and beverage. Retrieved from http://www.conferenceboard.ca/temp/1951b733-f588-451a-aa92-b25581a51a56/11-107_CIPS-FoodBeverage_Autumn2010_WEBr.pdf
Department of Environment, Farming and Rural Affairs. (2009). 2009 guidelines to Defra/DECC’s GHG conversion factors for company reporting. Retrieved from http://www.defra.gov.uk/environment/business/reporting/pdf/20090928-guidelines-ghg-conversion-factors.pdf
Eat Local First: Good Food Box. (2010). Retrieved from http://eatlocalfirst.com/
Eat Well Guide. (2010). Eat Well Guide Alberta. Retrieved from http://www.eatwellguide.org/localguides/ab_2_guide.pdf
Edwards-Jones, G., Canals, M., Hounsome, N., Truninger, M., Koerber, G., Hounsome, B., et al. (2008). Testing the assertion that ‘local food is best’: The challenges of an evidence-based approach. Trends in Food Science and Technology, 19, 265-74.
Euromonitor. (2008). Consumer lifestyles in the United States. Retrieved from http://www.portal.euromonitor.com/Portal/ResultsList.aspx
FamilyFarmed.org. (2010a). Virginia food system assessment for northern Virginia. Retrieved from http://www.familyfarmed.org/wpcontent/uploads/2010/10/Northern-VA-Local-Food-Assessment_FINAL_10.1.10.pdf
FamilyFarmed.org. (2010b). Ready to grow: A plan for increasing Illinois fruit and vegetable production: Action plan and feasibility study. Retrieved from http://www.familyfarmed.org/wpcontent/uploads/2010/07/IllinoisProduceReportfinal.Pdf
Government of Canada. (2010). New duty-free access for Canadian beef in European Union market. Retrieved from http://news.gc.ca/web/article-eng.do?m=/index&nid=575589
Hartman Group Inc. (2010). Beyond organic & natural: Resolving confusion in marketing foods and beverages. Retrieved from http://www.hartman-group.com/downloads/beyond-organic-natural-report-overview.pdf
Hayashi, K., Gaillard, G., & Nemecek, T. (2005). Life cycle assessment of agricultural production systems: Current issues and future perspectives. Paper presented at the International Seminar on Technology Development for Good Agriculture Practice in Asia and Oceania, October 25-26.
Hendrickson, J. (1997). Energy use in the U.S. food system: A summary of existing research and analysis. Sustainable Farming-REAP-Canada 7(4).
Keystone Agriculture Producers, Agricultural Producers Association of Saskatchewan, Wild Rose Agricultural Producers. (2010). The farmer’s share media event. Retrieved from http://www.wrap.ab.ca/news/documents/Farmers_Share_2010_Presentation.pdf
King, R., Hand, M., DiGiacomo, G., Clancy, K., Gomez, M., Hardesty, S., et al. (2010). Comparing the structure, size, and performance of local and mainstream food supply chain. Retrieved from http://www.ers.usda.gov/publications/ERR99/ERR99.pdf
Live Local. (2010). Retrieved from http://www.live-local.ca/
Martinez, S., Hand, M., Da Pra, M. Pollack, S., Ralston, K., Smith, T., et al. (2010). Local food systems concepts, impacts, and issues. USDA Economic Research Service Report #97. Retrieved from http://www.ers.usda.gov/Publications/ERR97/ERR97.pdf
Nichols Applied Management. (2010). Organic beef opportunities assessment. Report written for Alberta Agriculture and Rural Development. Unpublished. Edmonton: S. Pospisil. To obtain a copy contact Pat Ramsey, Business Development Specialist – Beef at 403-652-8303
Ontario’s Local Organic Food Co-operatives. (2010). Baseline market research: The state of organic food and co-operatives. Retrieved from http://www.newfarmproject.ca/wp-content/uploads/2010/06/Baseline-Market-Research-Final-2010.pdf
Pirog, R., Van Pelt, T., Enshayan, K., Cook, E., (2001). Food, fuel, and Freeways: An Iowa perspective on how far food travels, fuel usage, and greenhouse gas emissions. Ames, Iowa: Leopold Center for Sustainable Agriculture.
Refrigerated Transporter. (2002). Road tests prove fuel economy projections. Retrieved from http://refrigeratedtrans.com/mag/transportation_road_tests_prove/
Region of Waterloo Public Health. (2003). Growing food and economy: Economic impact study of the agriculture and food-related sectors in Waterloo region. Retrieved from http://chd.region.waterloo.on.ca/web/health.nsf/4f4813c75e78d71385256e5a0057f5e1/4bb1aceaadd5d9e885256dce006768da!OpenDocument
Reimer, Bill. (2006). The rural context of community development in Canada. Journal of Rural and Community Development 1, 155-175. Retrieved from http://nre.concordia.ca/__ftp2004/reports/jrdc/JRCD-2005-31.pdf
Sonntag, V. (2000). Why do local linkages matter? Extracted from DANDA workshop papers: Improving the urban environment and reducing poverty. Retrieved from http://www.scribd.com/doc/14215480/Why-Do-Rural-Urban-Linkages-Matter
SPUDS. (2010). Retrieved from http://www.spud.ca/albertaorganicdelivery.html
Strategic Vision Consulting Ltd. (2009). Canadian organic research group SWOT analysis. Retrieved from http://www.organicagcentre.ca/Docs/SurveyReports/Organic_SWOT_Feb2009.pdf
Tiepoh, M. G. N., & Reimer, B. (2004). Social capital, information flows, and income creation in rural Canada: A cross-community analysis. Journal of Socio-Economics, 33, 427-448. Retrieved from http://nre.concordia.ca/__ftp2004/reports/tiepoh-reimer.pdf
The Organic Box. (2010). Fresh, local and direct from the farm. Retrieved from http://www.theorganicbox.ca/faq.htm
Weber, C. & Matthews, S. (2008). Food-miles and the relative climate impacts of food choices in the United States. Environ. Sc. Technol., 42, 3508-14.
27
On behalf of Alberta Agriculture and Rural Development (ARD), Becky Lipton Research
& Consulting Ltd. (herein after referred to as ‘the researcher’) has been commissioned
to conduct interviews that will result in the development of generalized Alberta case
studies, comparing the structure, size, and performance of local and mainstream food
supply chains on an independent and confidential basis. The case studies will be used
by ARD in an effort to increase the understanding of the operation and performance of
various business models, describe each supply chain interaction with public policy and
identify barriers to growth or potential increases in cost structures.
We invite you to participate in this case study. The interview will focus on three
performance indicators: producer share of revenue paid by the final consumer, the food
miles and fuel use per unit, and economic benefits to the local area.
Your participation is encouraged and important. The interview will be scheduled at your
convenience and will take approximately one hour to complete, depending on the length
of your answers and the level of detail required. At any time during the interview you
may request that we break and finish the interview at another time. Also, at any time
during the interview, you can ask for the tape recorder to be turned off, refuse to answer
a question, or refuse to participate further.
Every effort is being made to ensure confidentiality and anonymity, subject to the
provisions of the Freedom of Information and Protection of Privacy Act. No one will have
access to your survey responses or the interview information you provide except the
researcher. Only the finalized case studies will be included in the final research report
being provided to ARD. The survey, tapes, and transcripts will all be securely stored in
the researcher’s office for a period of three years after which they will be shredded and
destroyed. The researcher will provide you with an opportunity to see the write-up of
your portion of the case study before it is in its final draft for you to ensure its accuracy.
You will receive an electronic version of the final publicly available document.
If you have any questions or concerns about the survey or how your information will be
used, please feel free to contact Becky Lipton at Becky Lipton Research & Consulting
Ltd. by e-mailing [email protected] or by calling 780-271-1116.
If you have any concerns regarding the overall project or the collection of data, please
contact one of the ARD project team members at 310-0000 or directly:
Mimi Lee 780-968-3552 or [email protected]
Eileen Kotowich at 780-853-8223 or [email protected]
Karen Goad at 780-538-5629 or [email protected]
This study has been approved by ARD Assistant Deputy Minister, Jason Krips.
Signature of Participant
Date
Signature of Becky Lipton
Date
Signature of Research Assistant
Date
This project was sponsored by Growing Forward, a federal-provincial-territorial initiative.
AAPPENDIX
As a participant:
• I understand the purpose of the research and what my participation will entail.
• I understand I can stop the interview process at any time
• I understand the information I provide is subject to the Freedom of Information and Protection of Privacy Act and if I have any questions about how my personal information will be used, I can contact Mimi Lee, Economist, Alberta Agriculture and Rural Development, Tel: 780-968-3552.
• I give my permission to Becky Lipton Research & Consulting Ltd. to use the information in a non-identifying way and included in a final research report prepared for Alberta Agriculture and Rural Development.
Informed ConsentLocal and Mainstream Alberta Food Supply Chains

28
BAPPENDIX
Primary Producer Interview GuideLocal and Mainstream Alberta Food Supply Chains
PRELIMINARY DETAILS (TO BE FILLED IN BY INTERVIEWER)
File Number
Date and time of interview
Contact number
Interviewee’s name
Interviewer’s name
Length of interview
Name of the operation
Name of the owners of the operation
Location of operation
INTRODUCTORY MESSAGE – INTERVIEWER TO READ TO INTERVIEWEE
In the Consent form we discussed the reasons behind why we are doing the study, and how
the information is going to be used. Do you have any questions about this?
The consent form also indicated that your information will be held confidential, subject
to the provisions of the Freedom of Information and Protection of Privacy Act. If you have
any questions or concerns about how your personal information will be used please
phone Mimi Lee, Alberta Agriculture and Rural Development at 780.968.3552 or email
We are going to be talking a lot about local products/ markets and supply chains. Before we
get going I want to let you know what we mean by each of these.
A supply chain is a network of interconnected businesses involved in the provision of a product or service. We will also be talking about value chains which, for the purposes of this study, are closely related. In a value chain, the businesses work together to add value to the product through a shared relationship where all parties understand the benefits and costs to each player. For example, a supply chain in the Peace country was created when a bison producer contracted a processor to be their exclusive processor. They shared in the profits and the processor provided the operator the service they needed before serving others.
By the term local we mean a product grown/raised and sold within Alberta.
29
PLEASE DESCRIBE YOUR OPERATION
1. Describe the different aspects of your operation. (grain, cattle, custom services)
2. What is the overall size of your farm? (acres) How many acres do you use for your operation (size for each aspect listed above)
3. How long have you been farming, and how long has the farm been in your family?
4. How many cow-calf pairs do you have on the farm? How many animals do you typically market each year (cows versus heifers/steers)?
5. Do you ever purchase calves from other operations? Tell me about your relationship with these producers, including how often you buy from them, and how long you have been doing so.
6. How did you decide to focus your operation on cattle and in particular organic/grass fed/ natural beef?
MARKETING CHANNELS
7. Do you have several different ways that you market your beef/ steers and heifers?
A. If yes, over the last three years, estimate what percentage of your beef/steers and heifers went through each marketing channel for each year?
i. For Direct Marketer
1. � Farmers’ Markets: year 1______% year 2______% year 3______%
2. � Farm Gate: year 1______% year 2______% year 3______%
3. � Delivery Into City to individual consumers: year 1______% year 2______% year 3______%
4. � Restaurants: year 1______% year 2______% year 3______%
5. � Other: year 1______% year 2______% year 3______%
B. If you have only one marketing channel, has this been the case for the past three years, and if not, what other channels did you use before?
8. Do you have plans to expand your marketing channels? If yes, which ones? Tell me a little bit about your decision.
RELATIONSHIPS
9. For Direct Marketer: Have you ever worked with any other operations in terms of marketing or adding value to your product? If so, in what way and how did that come about? (cooperatively to increase economy of scale, marketing capacity, to market with another company, to develop a value chain etc)
10. For Intermediary and Mainstream: How long have you been working with ___________? Tell me about the process of beginning to work with them, and setting up the terms of your relationship (contract/ handshake/ understanding, pricing).
A. How often do you interact with ___________? Tell me about what you talk about, do etc during that interaction.
B. How is it determined how many animals you sell to ______________? How far in advance is this decided?
C. Do you ever have to make changes to your production practices to meet your sales deadlines, and what weights are your animals when you sell them to them?
D. Do you ever work or interact with any of the other farmers that also sell to ______________? If so, in what ways?
i. How often do you interact with ________________? Tell me about the type of interaction you have.
BUSINESS DEVELOPMENT
11. Tell me about the history of your business. When did you get started and what stages of development have you gone through since then? (changes in business model, changes in size of operation, sales volumes, marketing channels, major infrastructure changes)
12. What would you say have been major challenges along the way (regulatory challenges – which ones and how, access to processing, other challenges related to processing, labour, market access, production capacity, transportation, distribution, storage facilities, policies, financing, land, food safety best practices, etc).
13. What challenges would you say are specific to your marketing channels, if any? How has this affected business decisions that you have made?
14. In the future are you considering any changes to your operation including a scaling up or down of your production, or modifying your marketing strategies? If so, in what ways?
BAPPENDIX
Primary Producer Interview GuideLocal and Mainstream Alberta Food Supply Chains

30
LOCAL ECONOMIC IMPACT
15. Let’s go through who works on your farm.
16. Where do you buy your inputs such as feed, hay, supplements, salt blocks, etc?
17. What services do you typically use on your operation? (custom grazing, veterinary, slaughter and processing) Where are these people/services located?
FOR DIRECT MARKETER: ENVIRONMENTAL CONSIDERATIONS
18. What abattoir do you use?
a. What is the distance to the abattoir?
b. How do you transport your animals there (hire, drive truck, what type of vehicle).
c. How often do you take animals to slaughter, and how many do you typically take at a time?
19. Do your customers pick up directly from the abattoir or do you pick up the beef and deliver it to the customer?
d. If your customers pick up the product, where do they travel from to pick up the product? Give me a few examples of different customers.
Is this an ideal breakdown of who you would like to have working on the farm, and why? (prompts: easy or difficult to find
workers, understaffed and if so why?, local interest in operation etc).
LIST THE JOB/ROLE:
(eg. farm worker, delivery, administrative, farmer’s market seller etc)
ARE THEY: SEASONAL/PART TIME/ FULL TIME/ VOLUNTEER?
WHO ARE THEY? (family, local, temporary foreign worker, apprentice, etc)
HOW MANY FIT THIS DESCRIPTION?
Eg. farm worker Seasonal Temporary foreign workers 4
e. If you pick up the product, where do you deliver it to afterwards? What is the distance? Give me a few examples of different customers you deliver to.
i. What type of vehicle do you use for delivery? (reefer truck, generator and freezer in the back of a pick up, pull a trailer etc).
ii. How often do you make these trips?
f. Does your product get to market any other way? Please explain.
FOR INTERMEDIARY AND MAINSTREAM: ENVIRONMENTAL CONSIDERATIONS
20. How do you transport your animals to the next stage in the supply chain? (hire, drive truck, what type of vehicle)
21. What is the distance from your farm?
22. How often do you make this trip?
BAPPENDIX
Primary Producer Interview GuideLocal and Mainstream Alberta Food Supply Chains

31
PRODUCTION COSTS AND PROFITABILITY
23. What percent of your time do you spend on production, marketing, transportation and distribution?
24. We would like to know the costs of moving your product through the supply chain.
a. Please outline the costs related to moving your product from your farm to the point of sale (time, fuel, packing, employees, marketing time, costs associated with selling (table fees, etc), unpaid labour, packaging etc.)
b. For Direct Marketers: Given the total costs of your operation, what portion is spent on the marketing and on production?
c. For operations that direct market bulk and cuts, or for operators who sell direct and to another company which finishes/processes and markets the beef:
i. Please provide a comparison of the costs related to direct marketing versus wholesaling (fuel, storage, packaging, are these fixed or variable)
ii. Why have you chosen to pursue one versus the other, and how did you decide what portion of your operation to dedicate to one versus the other?
25. What is your pricing structure (ensure they respond to this as it relates to the various marketing channels within their operation including selling by the cut versus in bulk, and farm gate versus farmers’ market etc) and does it vary throughout the year?
CUSTOMERS/MARKET
26. Describe your relationship with your customers. Why do they buy your products? (main attributes (health, environment, support local economy) and values they place on the products).
27. Have they ever come to visit the farm, or wanted to help out your operation in some way? (promote the product, work a market stall)
OTHER
28. Please describe any other challenges that you have faced in your operation which we have not already talked about. (Prompts only to be used for items not already discussed in interview: On farm, slaughter (abattoir close enough), processing (abattoir who will cut to specifications and develop that relationship with you), distribution, regulation etc., competition from other producers with similar marketing channels, competition from large suppliers)
29. Please describe the lessons you have learned when dealing with challenges and constraints in your operation?
BAPPENDIX
Primary Producer Interview GuideLocal and Mainstream Alberta Food Supply Chains

32
CA P P E N D I X
Primary Producer/Aggregator Interview GuideLocal and Mainstream Alberta Food Supply Chains
PRELIMINARY DETAILS (TO BE FILLED IN BY INTERVIEWER)
File Number
Date and time of interview
Contact number
Interviewee’s name
Interviewer’s name
Length of interview
Name of the operation
Name of the owners of the operation
Location of operation
INTRODUCTORY MESSAGE – INTERVIEWER TO READ TO INTERVIEWEE
In the Consent form we discussed the reasons behind why we are doing the study, and how
the information is going to be used. Do you have any questions about this?
The consent form also indicated that your information will be held confidential, subject
to the provisions of the Freedom of Information and Protection of Privacy Act. If you have
any questions or concerns about how your personal information will be used please
phone Mimi Lee, Alberta Agriculture and Rural Development at 780.968.3552 or email
We are going to be talking a lot about local products/ markets and supply chains. Before we
get going I want to let you know what we mean by each of these.
A supply chain is a network of interconnected businesses involved in the provision of a product or service. We will also be talking about value chains which, for the purposes of this study, are closely related. In a value chain, the businesses work together to add value to the product through a shared relationship where all parties understand the benefits and costs to each player. For example, a supply chain in the Peace country was created when a bison producer contracted a processor to be their exclusive processor. They shared in the profits and the processor provided the operator the service they needed before serving others.
By the term local we mean a product grown/raised and sold within Alberta.

33
CA P P E N D I X
Primary Producer/Aggregator Interview GuideLocal and Mainstream Alberta Food Supply Chains
PLEASE DESCRIBE YOUR OPERATION
1. Describe the different aspects of your operation. (grain, custom services, cow-calf, backgrounding, finishing, aggregation, processing (if any), storage, distribution/wholesaler, marketing)
2. How long have you been farming, and how long has the farm been in your family?
3. What is the overall size of your farm? (acres)
a. How many acres do you use for your operation (size for each production aspect listed above)?
b. Do you house your distribution facilities on your farm, and what size of facilities are they? If not, where are these located?
c. (if applicable) Where do you house your processing facilities? What size of facilities do you have?
4. How many animals move through your operation in one year?
a. How many cow-calf pairs belong to your farm?
b. How many different producers do you buy from, how often do you buy from them and how many animals do you typically buy?
c. At what stage do you typically buy from other producers (calves, yearlings/backgrounded, finished)?
i. How many do you buy of each stage?
ii. Do these numbers vary over time, and if so, what influences these variations?
5. How did you decide to focus your operation on cattle and in
particular organic/grass fed/ natural beef?
MARKETING CHANNELS
6. Tell me about the different marketing channels that your operation uses (locations where product is sold, auction market ever used (steers/heifers and cows).
a. What percentage of your animals has been marketed through the different channels over the past three years?
i. � Farmers’ Markets: year 1______% year 2______% year 3______%
ii. � Farm Gate: year 1______% year 2______% year 3______%
iii. � Retailers:
1. _____________________________________ year 1______% year 2______% year 3______%
2. _____________________________________ year 1______% year 2______% year 3______%
3. _____________________________________ year 1______% year 2______% year 3______%
4. _____________________________________ year 1______% year 2______% year 3______%
5. _____________________________________ year 1______% year 2______% year 3______%
iv. � Delivery into the City to individual consumers: year 1______% year 2______% year 3______%
v. � Restaurants: year 1______% year 2______% year 3______%
vi. � Auction: year 1______% year 2______% year 3______%
vii.� Other:_____________________________ year 1______% year 2______% year 3______%
b. (If Applicable) If you have only one marketing channel, has this been the case for the past three years, and if not, what other channels did you use before?
7. Does demand by each of your marketing channels vary over time (monthly, yearly)?
8. How often do your customers place beef orders and how far in advance do they place the orders? How do you forecast the demand and do your customers inform this process (commitments, advance notice, contracts etc)?
a. Is this process quite different between your smaller scale and larger scale/institutional customers? In which ways?
9. How important has the development of your brand been to your ability to market and scale of sales to each of your marketing streams? Why?
10. Do you have plans to expand your marketing channels? If yes, which ones? Tell me a little bit about your decision.
11. Are there different attributes of your product that you sell to different customers (frozen versus fresh, local, grass fed, natural, hormone and pesticide free, organic, etc.
34
CUSTOMERS/MARKET
12. Describe your relationship with the end consumer. What do you think is driving them to buy your product? (main attributes (health, environment, support local economy) and values they place on the products).
13. Tell me about the process of developing your relationship with the retailers you work with?
a. How long have you been selling to them?
b. Has your relationship changed over time?
c. What challenges have you faced in selling to retailers?
RELATIONSHIPS
14. Tell me about your relationship with the producers that you buy from (how long you have known them, depth of relationship, etc)
a. With the first producers you started working with, how did you determine the terms of your relationship (contract/ handshake/ understanding, pricing). Has this process changed over time?
15. How often are you in contact with your various producers, and what is the nature of the interaction?
a. Do you work with the producers so that they meet the grade, quality, and other specific aspects of your brand? Do you have a way of verifying these standards?
b. Do you work with the producers to manage supply and deal with the limits of seasonality?
c. Have you had significant fluctuations in the demand for your product, and if so, how have you managed this in terms of purchased animals, and inventory on farm?
16. How do you set prices with your producers?
a. What do you pay them per pound? Does this vary? Based on what?
17. How do you decide how many animals you will buy from your various producers?
a. Do they sell their animals through other channels? If so, approximately what percentage of their animals
are sold through your company?
BUSINESS DEVELOPMENT
18. Tell me about the history of your business. When did you get started and what stages of development have you gone through since then? (changes in business model, changes in size of operation, sales volumes, marketing channels, major infrastructure changes)
a. Do you offer both frozen and fresh product? Has the proportion of sales changed with the development of your business?
19. What would you say have been major challenges along the way (consistency/quality/etc from producers, regulatory challenges – which ones and how, access to processing, other challenges related to processing, labour, market access, production capacity, transportation, distribution, storage facilities, financing, land, food safety best practices, etc).
20. What challenges would you say are specific to your marketing channels, if any? How has this affected business decisions that you have made?
21. In the future, are you considering any changes to your operation including a scaling up or down of your production, or modifying your marketing strategies? If so, in what ways?
a. How much room for expansion of your company or others like yours do you feel exists currently in the marketplace?
CA P P E N D I X
Primary Producer/Aggregator Interview GuideLocal and Mainstream Alberta Food Supply Chains

35
LOCAL ECONOMIC IMPACT
15. Let’s go through who works on your farm.
23. Where do you buy your inputs and materials for your operation? (feed, hay, supplements, salt blocks, packaging, additives, packing supplies etc)?
24. What services do you typically use in your operation? (custom grazing, veterinary, slaughter and processing,
distributors) Where are these people/services located?
ENVIRONMENTAL CONSIDERATIONS
25. Where are the producers you buy from located?
a. How are the animals transported to your operation? (hire, drive truck, what type of vehicle).
b. How many are typically shipped at once, and how often?
26. What is the distance to your abattoir and processor?
a. How do you transport your animals there (hire, drive truck, what type of vehicle).
b. How often do you take animals to slaughter, and how many do you typically take at a time?
LIST THE JOB/ROLE:
(eg. farm worker, delivery, administrative, farmer’s market seller etc)
ARE THEY: SEASONAL/PART TIME/ FULL TIME/ VOLUNTEER?
WHO ARE THEY? (family, local, temporary foreign worker, apprentice, etc)
HOW MANY FIT THIS DESCRIPTION?
Eg. farm worker Seasonal Temporary foreign workers 4
CA P P E N D I X
Primary Producer/Aggregator Interview GuideLocal and Mainstream Alberta Food Supply Chains
27. What is the distance to your storage facilities?
a. How do you transport your animals there (hire, drive truck, what type of vehicle)?
28. If you work with a distributor (central distributor, retail centre distributors), what is the distance to this location?
a. How are the product delivered to the facilities (hire, drive truck, what type of vehicle)?
b. What size shipment is typically delivered, and how often?
29. What is the distance between the distribution facilities and your end market?
a. How are the product delivered to the facilities (hire, drive truck, what type of vehicle)?
b. What size of a shipment is typically delivered,
and how often?
Is this an ideal breakdown of who you would like to have working on the farm, and why? (prompts: easy or difficult to find
workers, understaffed and if so why?, local interest in operation etc).

36
CA P P E N D I X
Primary Producer/Aggregator Interview GuideLocal and Mainstream Alberta Food Supply Chains
PRODUCTION COSTS AND PROFITABILITY
30. We would like to know the costs of moving your product through the supply chain.
c. Please outline the costs related to moving your product from your farm to the point of sale (finishing animals, slaughter and processing (per animal), packing and distribution, marketing).
i. Have these costs changed over time (with growth, streamlining, changes in your operation)?
d. If you market your beef through different channels, please outline the difference in costs related to each channel.
i. Why have you chosen to pursue one versus the other, and how did you decide what portion of your operation to dedicate to one versus the other?
31. What price do you charge for your product (ensure they respond to this as it relates to the various products (fresh versus frozen), cuts/average for whole animal, average when sell whole or half animal (if applicable), marketing channels within their operation including between different retailers, etc)
a. Do all retailers charge the same price for your product?
b. Do prices fluctuate throughout the year?
PROCESSING
32. Describe your relationship with your processor?
a. Do you have a formal contract with them?
33. What does it cost to process an animal?
34. Have you faced any challenges directly related to processing over the life of your business? Describe.
OTHER
35. Has your company been involved in developing the local food system in Alberta? In what ways? And what do you think the benefit has been to local agri-businesses and also to your company?
36. Please describe any other challenges that you have faced in your operation which we have not already talked about. (Prompts only to be used for items not already discussed in interview: On farm, slaughter (abattoir close enough), processing (abattoir who will cut to specifications and develop that relationship with you), distribution, regulation etc., competition from other producers with similar marketing channels, competition from large suppliers, contracts etc)
37. Please describe the lessons you have learned when dealing with challenges and constraints in your operation?
37
DA P P E N D I X
Processor Interview GuideLocal and Mainstream Alberta Food Supply Chains
PRELIMINARY DETAILS (TO BE FILLED IN BY INTERVIEWER)
File Number
Date and time of interview
Contact number
Interviewee’s name
Interviewer’s name
Length of interview
Name of the operation
Name of the owners of the operation
Location of operation
INTRODUCTORY MESSAGE – INTERVIEWER TO READ TO INTERVIEWEE
In the Consent form we discussed the reasons behind why we are doing the study, and how
the information is going to be used. Do you have any questions about this?
The consent form also indicated that your information will be held confidential, subject
to the provisions of the Freedom of Information and Protection of Privacy Act. If you have
any questions or concerns about how your personal information will be used please
phone Mimi Lee, Alberta Agriculture and Rural Development at 780.968.3552 or email
We are going to be talking a lot about local products/ markets and supply chains. Before we
get going I want to let you know what we mean by each of these.
A supply chain is a network of interconnected businesses involved in the provision of a product or service. We will also be talking about value chains which, for the purposes of this study, are closely related. In a value chain, the businesses work together to add value to the product through a shared relationship where all parties understand the benefits and costs to each player. For example, a supply chain in the Peace country was created when a bison producer contracted a processor to be their exclusive processor. They shared in the profits and the processor provided the operator the service they needed before serving others.
By the term local we mean a product grown/raised and sold within Alberta.
38
DA P P E N D I X
Processor Interview GuideLocal and Mainstream Alberta Food Supply Chains
1. Tell me about the history of your operation (how long in business, different owners, stages of business development).
2. How many part time and full time staff does your business have? Does this vary throughout the year?
a. Do they live nearby the facility?
b. Do you work full time in the business?
i. Do you live nearby the facility?
3. What is your processing capacity (per week or month)?
4. How many different species do you process?
5. How many different businesses do you process for? Does this fluctuate over time?
a. Do you process both larger and smaller quantities? Do you process for a larger supplier as well as for producers who direct market?
6. What percentage of your total processing capacity is beef, and of that what percentage belongs to ____________.
7. How do bookings work for processing? Does _____________ process regularly, and if so do you schedule them in regularly or do they have to book on a case by case basis?
a. How far in advance do bookings need to be made (if applicable)?
8. Do you have any (other) businesses which have a regular processing schedule with you?
a. Are there seasonal variations? If yes, please describe.
9. Do you have any formal contracts with any of the businesses you work with?
a. Do you have a formal contract with the ___________. If yes, please describe.
10. What is the cost to process an animal (per animal/per pound)?
a. Does this vary between businesses? If so, what factors influence this variation?
11. Do you prepare primal cuts or case ready beef, or both?
a. Who gives you direction as to how to prepare the cuts (consumer directly, farmer, supplier/retailer etc)
b. Do you prepare the packaging and labeling? Does your customer provide you with specifications, labeling graphics or anything else?
12. Do you receive feedback from the businesses you work with?
a. Are there particular demands related to __________? Are these related to how the product is marketed, and do these specifications differ from your other customers?
13. Do you retail any of the products you process? If so, how?
14. What are the major challenges that you have encountered over the development of your business?
a. Have there been major challenges that you can identify related to working with clients such as _____________.
b. Are there any challenges directly related to regulations?
15. Have you considered expanding or scaling up your business? What are the opportunities and challenges related to doing so?
a. If yes, would you/ have you considered doing so through expanding the processing of products aimed at local markets?
16. Please describe the lessons you have learned when dealing with challenges and constraints as they relate to the local food supply chains you work with?
17. Has your company been involved in developing the local food system in Alberta or the marketing of local products? In what ways? And if so, what do you think the benefit has been to local agri-businesses and also to your company?