local environmental influences on uveal melanoma : vitreous humor promotes uveal melanoma invasion,...
TRANSCRIPT

Local Environmental Influences on Uveal MelanomaVitreous Humor Promotes Uveal Melanoma Invasion, Whereas the AqueousCan Be Inhibitory
David Canovas, MScIan G. Rennie, MBChBCarmel E. Nichols, BScKaren Sisley, PhD
Academic Unit of Ophthalmology and Orthoptics,Section of Oncology, School of Medicine and Bio-medical Sciences, University of Sheffield, RoyalHallamshire Hospital, Sheffield, United Kingdom.
BACKGROUND. Uveal melanomas of the choroid and ciliary body are aggressive
tumors causing the death of approximately 50% of patients. In contrast, iris mel-
anomas only infrequently metastasize; why these differences exist is not known.
The local environment can regulate cancer growth and development, and it is
probable the aqueous and vitreous humors have an important role in regulating
uveal melanoma behavior.
METHODS. To explore this possibility cultures of uveal melanoma were exposed
to aqueous and vitreous and the effects investigated using invasion and prolifera-
tion assays. ChemiArrays (Chemicon International, Temecula, Calif) were per-
formed to determine which regulatory factors might influence the process.
RESULTS. The vitreous universally promoted uveal melanoma invasion, whereas
the aqueous mainly had no effect or was inhibitory. Tumor location, and the
baseline invasion of the melanoma, affected the ability of aqueous and vitreous
from different patients to regulate invasive behavior. Proliferation was not signifi-
cantly altered as a result of exposure to the aqueous or vitreous. The ability of
the humors to regulate uveal melanomas may involve TIMP-2, TIMP-3, and TGF-
b2, as high expression was found by ChemiArray analysis and there were differ-
ences in the levels of the regulators in the aqueous compared with the vitreous.
CONCLUSIONS. The findings suggest that in situ uveal melanoma development
reflects an interaction between the tumor and the environment of the eye. Exposure
to the aqueous would therefore contribute to the benign nature of iris melanomas,
whereas potential interaction with the vitreous appears to promote the aggressive
behavior of posterior uveal melanomas. Cancer 2008;112:1787–94. � 2008 American
Cancer Society.
KEYWORDS: uveal melanoma, invasion, metastasis, aqueous, vitreous.
T he interaction of tumor cells with the surrounding microenvir-
onment has been shown to be influential to tumor progression
and is mediated by soluble factors, cell-cell, or cell-matrix contacts.1
Uveal melanomas, the commonest primary eye cancer in adults, are
highly aggressive, characteristically metastasizing to the liver and
causing the death of approximately 50% of patients within 10
years.2,3 There are, however, well-recognized differences in the met-
astatic propensities of uveal melanomas, dependent on tumor loca-
tion. Anterior uveal melanomas (iris), representing 5% of all cases of
uveal melanoma,4 are relatively benign and only metastasize in 5%
of patients within 10 years of follow-up.5 In contrast, posterior uveal
melanomas (choroid and in particular ciliary body) are highly
aggressive and produce metastasis in 61% of the cases, with 90% of
deaths occurring within 15 years, thus accounting for the high rates
Address for reprints: Karen Sisley, PhD, AcademicUnit of Ophthalmology and Orthoptics, Universityof Sheffield, K-Floor, School of Medicine & Bio-medical Sciences, Beech Hill Road, Sheffield,S10 2RX, UK; Fax: (011) 0044 114 2766381;E-mail: [email protected]
Supported by Yorkshire Eye Research (grant num-bers 008 and 013) and Yorkshire CancerResearch pump priming.
Received May 31, 2007; revision received August31, 2007; accepted October 30, 2007.
ª 2008 American Cancer SocietyDOI 10.1002/cncr.23358Published online 25 February 2008 in Wiley InterScience (www.interscience.wiley.com).
1787

of metastatic death from this disease.3 Why there is
this behavioral variation is not known, but it is possi-
ble that environmental influences may play a part.
The aqueous and vitreous humors of the eye are
known to contain numerous growth factors and cyto-
kines that have been linked to other ocular diseases.6
Specifically, concentrations of hepatocyte growth fac-
tor/scatter factor (HGF/SF) increase in the vitreous
of patients with diabetic retinopathy,7 and TGF-b in
the aqueous humor has been associated with both
uveitis and glaucoma.8,9 Both HGF and TGF-b have
been implicated in uveal melanoma, with HGF hav-
ing been shown to increase uveal melanoma invasion
and potentially assisting in targeting metastatic
spread to the liver.10,11 In contrast, TGF-b inhibits
growth of uveal melanocytes, and also the prolifera-
tion and invasion of uveal melanomas.11–13 Other
regulators are also likely to exert an effect, including
vascular endothelial growth factor (VEGF), which is
raised in the humors of patients with uveal mela-
noma.14 It is therefore possible that the relatively be-
nign iris melanomas arising in the anterior chamber
could be directly exposed to a number of regulators
within the aqueous that are inhibitory to their
growth. In contrast, posterior uveal melanomas may
be positively influenced by components of the vitre-
ous, which is in close proximity, either through a lack
of inhibition or active promotion of their aggressive
behavior. To investigate this possibility we studied the
effect of exposure to aqueous and vitreous on uveal
melanoma invasion and proliferation. Using ChemiAr-
ray (Chemicon International, Temecula, Calif) we also
looked for differences in the levels of a panel of 70
growth factors and cytokines in the aqueous and vit-
reous from patients with uveal melanoma.
MATERIALS AND METHODSUveal Melanoma Cell Lines and Short-Term CulturesEstablished Sheffield ocular melanoma (SOM) cell
lines SOM 177 (invasive) and SOM 157d (low-inva-
sive) were used as positive and negative controls,
respectively.11,15 Short-term cultures were established
from a total of 12 primary uveal melanomas as
detailed previously.16 All samples were removed after
informed patient consent and protocols followed the
principles of the Declaration of Helsinki. The clini-
cal-pathologic details of the patients are presented in
Table 1. Cells were maintained in RPMI-1640, sup-
plemented with penicillin (100 U/mL), streptomycin
(100 lg/mL), glucose (0.2%), epidermal growth factor
(0.1%), and fetal calf serum (20%), at 378C in an in-
cubator with 5% CO2. All cultures were used experi-
mentally before passage 5. The aqueous and the
vitreous were collected from patients with primary
uveal melanoma at the time of enucleation, centri-
fuged to eliminate tissue particles, and stored at
2208C until required. Samples contaminated with
blood were not used experimentally. The clinicopath-
ologic details of the patients whose aqueous and vit-
reous was used singly in the ChemiArray and
chemoinvasion assay are presented in Table 1.
Patients whose samples were used in proliferation
assays or as part of the pooled aqueous and vitreous
standards have not been detailed.
Chemotaxis and Chemoinvasion AssayStandardization of the protocolThe chemoinvasion assay was performed in tripli-
cate, as detailed previously.11 The maximal effects of
the aqueous and vitreous were determined using the
2 established cell lines (SOM 157d and SOM 177)
and 2 short-term cultures (SOM 433 and 436) (data
not shown). Samples of aqueous were rarely greater
than 150 lL; therefore, both aqueous and vitreous
were diluted in the assay to a final concentration of
10%. The effect of freshly isolated aqueous and vitre-
ous was assessed when included in the upper cham-
ber with the cell line, in the lower chamber as a
chemoattractant, or when added to both. The aque-
ous produced a variable response, but was consis-
tently inhibitory when included directly in the upper
chamber with the cells. The vitreous was a potent
stimulator whether included in the upper or lower
chamber, or both, but maximal effect was seen when
added to the lower chamber (P < .05).
It was necessary to store the aqueous and vitre-
ous before use; recovery from 2208C was therefore
tested to determine whether the ability to regulate
invasion would be affected. Assays were performed
on the 2 established cell lines using freshly acquired
aqueous and vitreous, and subsequently the same
aqueous and vitreous samples were recovered from
2208C and retested. No significant differences were
seen in the ability of frozen samples to elicit a
response when compared with freshly acquired sam-
ples (data not shown). The study was subsequently
designed to address 2 issues: first, if different tumors
responded comparably to the same sample of aque-
ous and vitreous, and second to see if the aqueous
and vitreous from different patients had varying
effects. To test a series of 10 primary uveal melano-
mas for variations in their response after exposure to
the same aqueous and vitreous standard, it was
therefore necessary to use pooled aqueous and vitre-
ous samples previously collected from 10 patients
and stored at 2208C. To investigate if the aqueous
and vitreous from uveal melanoma patients differed,
1788 CANCER April 15, 2008 / Volume 112 / Number 8
the same tumor cell lines needed to be tested against
the aqueous and vitreous from different patients.
Chemoinvasion of uveal melanomasTen freshly derived cultures of primary uveal mela-
nomas were tested against a pooled sample of aque-
ous and vitreous (frozen as aliquots and recovered as
required). The assay was performed as detailed
previously,11 and was modified accordingly. Where
required vitreous was added to the lower chamber at
a final concentration of 10%, and aqueous humor
(final concentration 10%) was added to the top
chambers and the assay was left for 16 hours at 378Cin 5% CO2. As a contrast, additional assays were
undertaken to establish whether the aqueous and vit-
reous from different patients with uveal melanoma
was capable of inducing varying responses. In these
assays the established cell lines (SOM 157d and 177)
were used as the standard against which was tested
the aqueous and vitreous from 2 ciliary body and 4
choroid melanomas. Finally, the invasion of 2 pri-
mary uveal melanomas tested against their respective
aqueous and vitreous samples was measured in
assays.
The invasive cell line (SOM 177) and noninvasive
cell line (SOM 157d) were included in every assay as
positive and negative assay controls, respectively.
The effect of the aqueous or vitreous on the invasion
of uveal melanomas in the chemoinvasion assay was
compared with the appropriate control invasion, and
analyzed using a Student t-test. In all cases P < .05
was taken as significant (Figs. 1, 2).
Proliferation of Uveal Melanomas (MTT Assay)The proliferation of 7 cultures of uveal melanoma
was investigated, and pooled aqueous and vitreous at
TABLE 1Clinicopathologic Details of Patients
SOM Sex Age at diagnosis Tumor location Cell type M T D (mm)* Statusy
330 M 27 Choroid S 14.4 Alive 62 mo
349 F 66 Choroid SB 17.3 Alive 55 mo
368 F 53 Ciliary body/Choroid M 11.25 Alive 41 mo
377 M 63 Ciliary body M — Died liver metastases 15 mo
380 F 63 Ciliary body M 11.5 Alive 44 mo
389 F 68 Choroid M 10.3 Alive 42 mo
450 M 73 Ciliary body M 19.75 Alive 15 mo
453 M 70 Choroid SB 8.5 Alive 21 mo
455 M — Choroid M 18.95 Alive 20 mo
457 F 78 Choroid M 14.95 Alive 20 mo
458 M 60 Choroid M 16.95 Alive 13 mo
459 F 75 Choroid E 12.75 Alive 20 mo
462 F 73 Metastatic cancer to choroid — 11.9 Alive 19 mo
464 M 45 Choroid S 14.5 Alive 17 mo
467 F 56 Choroid SB 9.8 Alive 17 mo
474 M 49 Ciliary body/choroid M 14.7 Alive 15 mo
477 M 64 Ciliary body/Choroid M 14.4 Alive 14 mo
486 M 59 Choroid S 11 Alive 12 mo
494 F 73 Choroid M 14.85 Alive 9 mo
The clinicopathologic details for the patients investigated in the invasion assays and ChemiArray. Also included are those patients for which samples of the aqueous and vitreous were tested individually (SOM
453, 455, 457, 459, 474, and 477). The clinical details of patients used in proliferation assays and whose samples contributed to the pool standards are not presented. All patients were treated by enucleation.
* MTD indicates mean tumor diameter.y Mean follow-up time of 25 months.
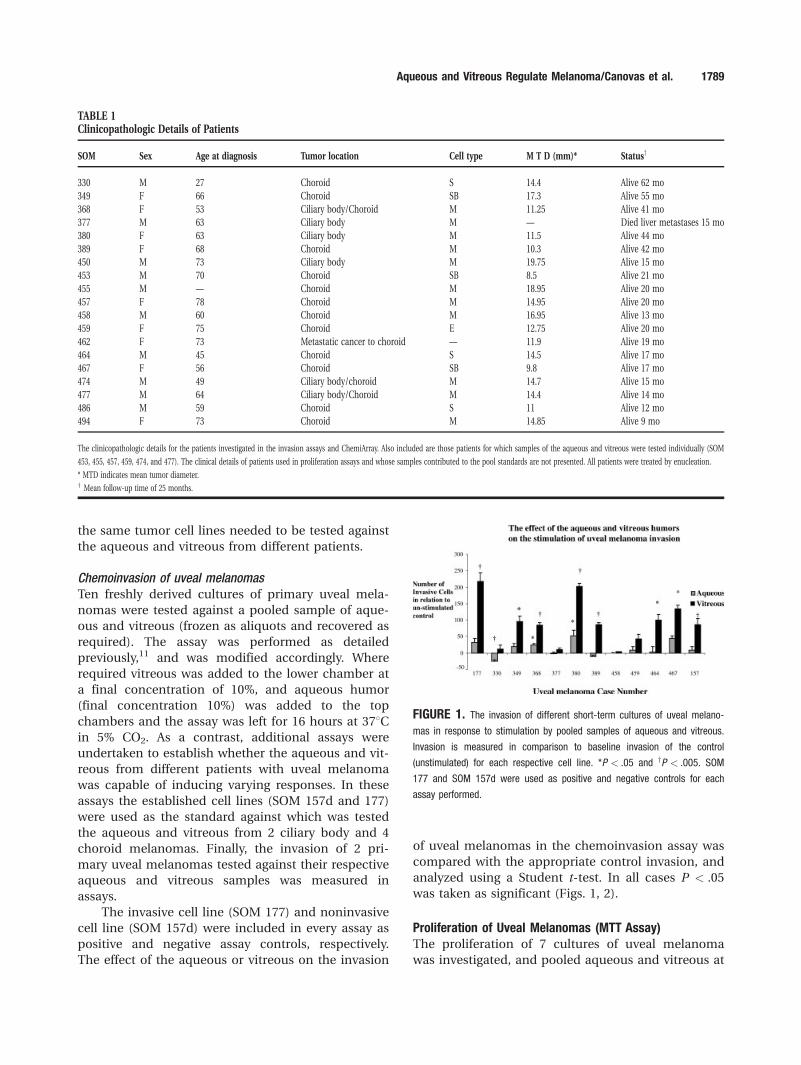
FIGURE 1. The invasion of different short-term cultures of uveal melano-mas in response to stimulation by pooled samples of aqueous and vitreous.
Invasion is measured in comparison to baseline invasion of the control
(unstimulated) for each respective cell line. *P < .05 and yP < .005. SOM
177 and SOM 157d were used as positive and negative controls for each
assay performed.
Aqueous and Vitreous Regulate Melanoma/Canovas et al. 1789
a final concentration of 10% was used. Proliferation
was assessed over 4 days, with triplicates for each
day. To a 96-well plate, 2000 cells in 150 lL serum-
free RPMI-1640 with 0.1% BSA, with aqueous or vit-
reous as required was added per well. On Days 1, 2,
3, and 4, 50 lL of media was removed from the rele-
vant triplicates and substituted with 100 lL of 4, 5-
dimethyl-2-thiazolyl)-2,-5-diphenyl-2H-tetrazolium
bromide (MTT) (1 mg/mL) and incubated at 378C for
4 hours. The media was removed and 200 lL of
DMSO to dissolve the formazan crystal was added.
Absorbance was measured at 560 nm with an MRXII
plate reader (Dynex UK). The means were calculated
for each triplicate and the overall mean and standard
deviation of the mean (SEM) were calculated for
each day.
Cytokine Quantification (ChemiArray)The aqueous and vitreous from a ciliary body, 2
choroid melanomas, and as a comparison a meta-
static bowel cancer to the choroid were investigated
using ChemiArray analysis for over 70 cytokines.
ChemiArrays (ChemiArray Human Cytokine Antibody
Array V Map, Chemicon International, Temecula,
Calif) were prepared following the manufacturer’s
instructions. Briefly, ChemiArray membranes were
incubated with 2 mL ChemiArray blocking buffer for
30 minutes at room temperature. One mL of aqueous
or vitreous (1:10 dilution in ChemiArray blocking
buffer) was placed onto membranes for 2 hours.
After incubation membranes were washed 33 with
2 mL of washing buffer I (5 minutes each wash), and
32 with washing buffer II (5 minutes each wash).
One mL of biotin-conjugated anti-cytokines primary
antibody was added to each membrane and left for
2 hours at room temperature. Membranes were
washed 33 in washing buffer I and 32 in buffer II (5
minutes). Horseradish peroxidase-conjugated strepta-
vidin (1 mL) was added for 2 hours at room tempera-
ture. Finally, membranes were washed, as detailed
previously, and 250 lL of detection buffer I and II
were mixed together, added to the membranes, and
left for 2 minutes. Membranes were allowed to dry
and exposed to x-ray film and the expression of cyto-
kines was measured by densitometry and compared
as a percentage of the positive control. To confirm
that the aqueous and vitreous studied by ChemiArray
were capable of regulating uveal melanomas, che-
moinvasion assays with SOM 177 and 157d were
undertaken using the same aqueous and vitreous
samples.
RESULTSProliferation of Uveal MelanomasThe uveal melanomas tested had wide variation in
their levels of proliferation, but there were no major
differences in the ability of the aqueous and the vit-
reous to regulate proliferation, and the responses
were nonsignificant, reflecting the proliferative ability
of the tumor (data not shown).
Chemotaxis and Chemoinvasion AssayThe regulation of different primary uveal melanomas
by pooled samples of aqueous and vitreous is pre-
sented in Figure 1. The control invasion of the pri-
mary uveal melanomas naturally varied. It was
apparent that the vitreous universally stimulated
invasion, compared with baseline control invasion,
whereas the effects of the aqueous were more mixed.
Stimulation by the vitreous ranged in magnitude
from minimal effect to an 11-fold increase, and it
was noted that low-invasive melanomas (SOM 157d,
389, 458) were proportionally more highly stimulated
than the naturally more invasive melanomas. Results
for the aqueous varied, with tumors inhibited (SOM
330, 377, and 389) unaffected (SOM 458 and 464), or
stimulated at a reduced level compared with the vit-
reous (SOM 349, 368, 380, 459, and 467). The find-
ings did not correlate with the baseline invasion of
the melanoma and both low and highly invasive mel-
anomas could be inhibited by the aqueous. In the
assays where 2 melanomas were tested against their
own aqueous and vitreous (486 and 494), the aque-
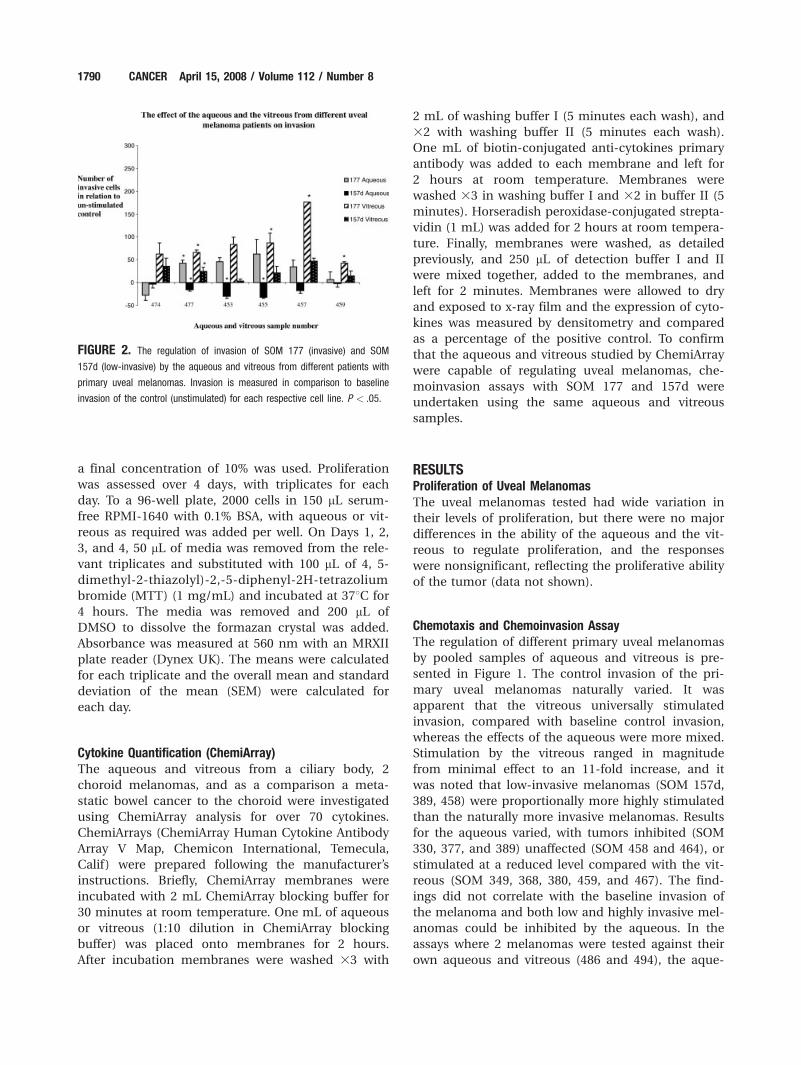
FIGURE 2. The regulation of invasion of SOM 177 (invasive) and SOM
157d (low-invasive) by the aqueous and vitreous from different patients with
primary uveal melanomas. Invasion is measured in comparison to baseline
invasion of the control (unstimulated) for each respective cell line. P < .05.
1790 CANCER April 15, 2008 / Volume 112 / Number 8
ous inhibited, whereas the vitreous stimulated (data
not shown).
Regulation of invasion by the vitreous and aque-
ous from different patients with uveal melanoma is
presented in Figure 2, and includes samples from
SOM 453 and 457 which were also studied in the
ChemiArray assay. The vitreous from all patients
studied was always stimulatory, as were most of the
aqueous samples tested on SOM 177. In contrast,
the aqueous samples always inhibited to some extent
the low-invasive SOM 157d cell line, and the invasive
SOM 177 was also inhibited by 1 aqueous sample
(474).
ChemiArray Analysis for Cytokine QuantificationAs an initial screen to identify potential regulators,
only 4 samples of aqueous and vitreous were ana-
lyzed, and it was not possible to undertake statistical
analysis. All cytokines were detectable in the aque-
ous and vitreous samples from all cases. There were
variations in the amount detected, and in general
vitreous samples had the same or higher levels for
the majority of cytokines, compared with the aque-
ous samples. Only a few cytokines were found in
greater levels in the aqueous, such as MIP-1b (cases
450 and 462). The most highly expressed cytokines
were consistently TIMP-2, TIMP-3, TGF-b2, PIGF,
NAP-2, HGF, GDNF, CKB8-1, OSM, ANG, TNF-a,TNF-b, and RANTES. Others were highly expressed
in some samples but not all, including GRO, GRO-a,
IL-8, IL-10, MCP-1, MCSF, MIP-1b, and MIP-1 DEL.
There was also variation in the content of the aque-
ous and vitreous from different patients. Lower
levels for most regulators were found for the meta-
static cancer patient (462) and from case 450, and it
is of interest that these were the only cases to have
higher levels of some regulators in the aqueous com-
pared with the vitreous (MIP-1b). Insufficient aque-
ous humor remained from SOM 450 and 462 after
the ChemiArray analysis had been performed; there-
fore, only SOM 453 and 457 could be tested by both
ChemiArray analysis and invasion assay. The
response in the invasion assay confirmed that the
vitreous was stimulatory and the aqueous could be
inhibitory.
DISCUSSIONAfter standardization of the chemoinvasion assay
the vitreous was included in the lower chamber,
whereas the aqueous was most inhibitory when
added directly to the upper chamber. In its simplest
form this arrangement mimics in situ exposure of
uveal melanomas, as tumor cells in the anterior
segment are directly in contact with the aqueous,
whereas posterior uveal melanomas in early stages
are anatomically separated from direct contact with
the vitreous by the neuro-retina and pigment epi-
thelium. We have found pathologic evidence that
suggests that the aqueous and vitreous can alter
uveal melanoma behavior in situ. Through examina-
tion of tumors extending from the posterior section
to the anterior chamber we observed alterations in
cell morphology, with cells directly in contact with
the aqueous adopting a benign appearance (data
not shown).
Pooled vitreous was found to universally stimu-
late different uveal melanomas (Fig. 1), but in a
smaller study we previously showed that the vitreous
had little or no effect.15 This difference probably
reflects the filtration of the vitreous before use in the
earlier study, a procedure which could remove con-
stituents of the vitreous, whereas in this study cen-
trifugation of the vitreous was used. The effects of
the pooled aqueous on invasion, however, were more
diverse, but in the assays where 2 melanomas were
tested with their own respective aqueous and vitre-
ous (data not shown) the aqueous was found on
both occasions to be inhibitory. These findings sug-
gest that the resultant invasion is a manifestation
of how the tumor itself interacts and responds to
regulation by aqueous. As pooling of the samples
would equalize any regulatory differences the effect
of aqueous and vitreous from individual patients
was also considered (Fig. 2). The vitreous from all
patients was again consistently stimulatory. In con-
trast, the high invasive cell line (SOM 177) was both
inhibited and stimulated by the different aqueous
samples, implying variation in the levels of a regula-
tory factor or factors in the humors. The finding,
however, that all aqueous samples inhibited or had
little effect on the low-invasive SOM 157d again sug-
gests that tumor phenotype affects how uveal mela-
nomas respond to regulation by the aqueous (Fig. 2).
As greater variability was observed in response to the
aqueous and vitreous samples from patients with
choroid melanomas (SOM 453, 455, 457, and 459), it
seems likely that the melanomas themselves contri-
bute to differences in the aqueous and vitreous. It is
possible that as tumors from different locations de-
velop they influence the ability of the aqueous and
vitreous to modulate invasion as a mechanism of
self-regulation. For further confirmation of this point,
iris melanomas should ideally be investigated, but
because of their infrequency and small size none
were available during the course of the study. Like-
wise, to extend these comparisons it is important to
consider that all melanomas studied were removed
Aqueous and Vitreous Regulate Melanoma/Canovas et al. 1791
from patients with large tumors treated by enuclea-
tion; smaller tumors may, of course, behave differ-
ently. Finally, as all tests in this study were
performed with a dilution of 1:10 aqueous and vitre-
ous, it is likely that in vitro the localized effects could
be amplified.
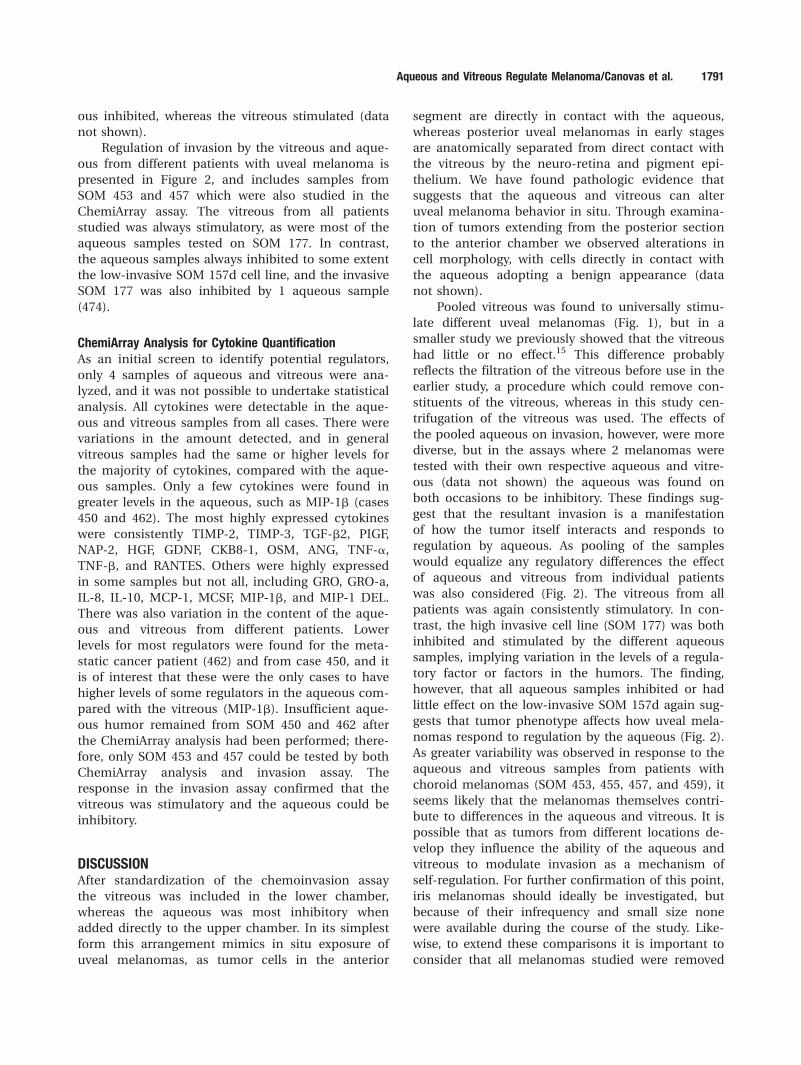
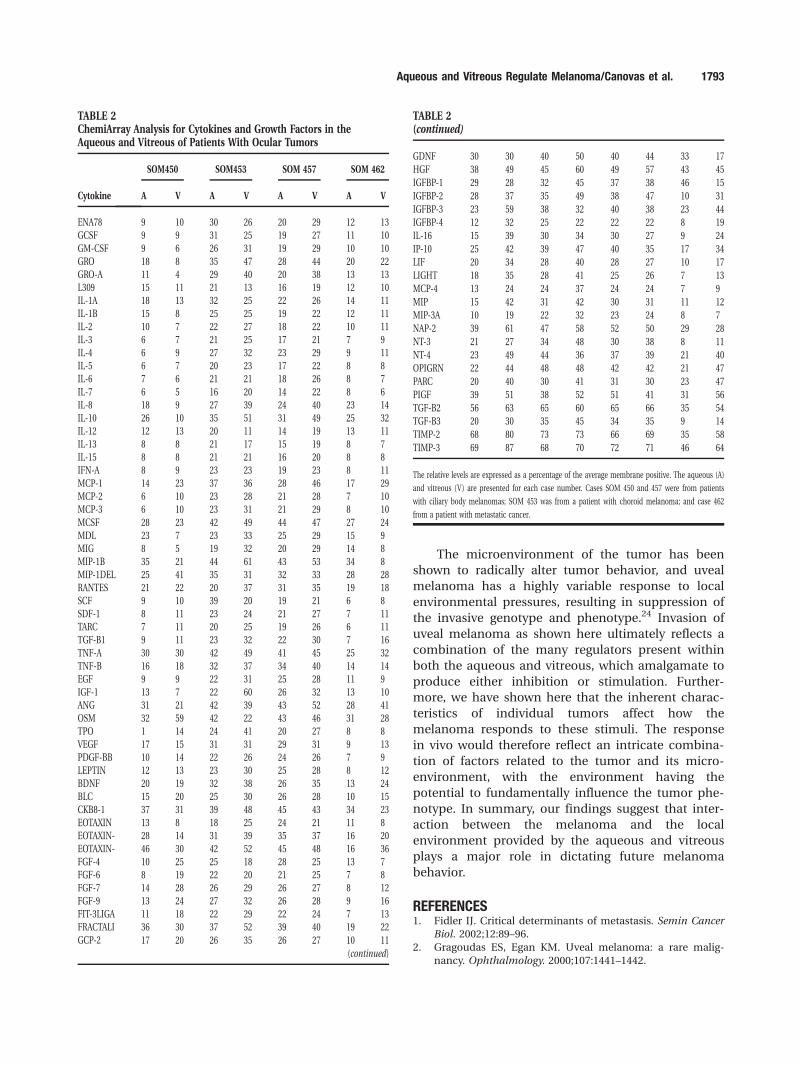
In this investigation ChemiArray analysis (Fig. 3)
established that the same patterns of cytokines were
detectable in all samples, but that levels varied (Ta-
ble 2). Despite these similarities chemoinvasion anal-
ysis confirmed that the aqueous and vitreous of SOM
453 and 457 were still capable of inhibiting and sti-
mulating invasion, respectively (Fig. 2). Differences
in the amount of the regulators present could contri-
bute toward control of invasion; however, in what
manner is unclear, as the aqueous and vitreous from
the same patient tended to have comparable levels
of any given regulator. The aqueous and vitreous
from SOM 450 and the patient with metastatic bowel
cancer (462) did, however, have lower levels of many
regulators when compared with SOM 453 and 457
(Table 2), but as neither case could be analyzed in
the chemoinvasion assay it was therefore not possi-
ble to establish whether the lower levels translated
into regulatory differences.
The high expression of TIMP-2, TIMP-3, and
TGF-b2 observed by ChemiArray is of interest, as
all have been directly associated with uveal mela-
noma development and/or progression. TIMP-3
gene expression has been identified as down-regu-
lated in Class II aggressive uveal melanomas,17,18
probably through hypermethylation,18 and translat-
ing to differential protein expression19 by tumors
with and without disomy of chromosome 3.
Improved survival has been reported for patients
with TIMP-2 melanomas,20 and its up-regulation
correlates with decreased migratory ability.22 Lastly,
TGF-b2 has been found to decrease uveal mela-
noma invasion, regulate adhesive interactions with
hepatic endothelium,11,22 and abnormalities in its
pathway have been associated with the develop-
ment of uveal melanoma.13 The high levels detecta-
ble for these regulators in all samples of aqueous
and vitreous from patients with uveal melanoma
could imply a direct association, possibly as a
method of self-regulation, as the aqueous and vitre-
ous from the patient with metastatic bowel cancel
contained comparatively half the levels for TIMP-2,
TIMP-3, and TGF-b2 (Table 2).
Other regulators of potential interest include
HGF, which increases uveal melanoma invasion and
assists in preferential targeting of the liver.10,11
Increased uveal melanoma invasion has also been
observed in response to stimulation from MIP-1b,GRO, and RANTES,11 and expression of these regula-
tors in the ChemiArray was higher than average and
showed sample variation (Table 2). In contrast, it
was of interest that VEGF, a potent angiogenic stimu-
lator, was not comparatively more highly expressed
(Table 2), as studies have shown raised VEGF in the
aqueous and vitreous from patients with uveal mela-
noma.14,23 It is expected that the aqueous and vitre-
ous contain a myriad array of other factors not
tested for in this preliminary study, and the relatively
low comparative expression of VEGF in this study
may suggest that the aqueous and vitreous of
patients with uveal melanoma show a dramatic rise
in a large number of other potentially more influen-
tial regulators. Further studies comparing the levels
of regulators found in the aqueous and vitreous from
a larger series of uveal melanomas, with comparison
of the levels seen in patients with other ocular con-
ditions, such as those undergoing vitrectomy and
cataract surgery, will be required to confirm this
hypothesis.
FIGURE 3. ChemiArray analysis for cytokines and growth factors of pairedaqueous and vitreous samples from SOM 453. Positive controls top left and
bottom right.
1792 CANCER April 15, 2008 / Volume 112 / Number 8
The microenvironment of the tumor has been
shown to radically alter tumor behavior, and uveal
melanoma has a highly variable response to local
environmental pressures, resulting in suppression of
the invasive genotype and phenotype.24 Invasion of
uveal melanoma as shown here ultimately reflects a
combination of the many regulators present within
both the aqueous and vitreous, which amalgamate to
produce either inhibition or stimulation. Further-
more, we have shown here that the inherent charac-
teristics of individual tumors affect how the
melanoma responds to these stimuli. The response
in vivo would therefore reflect an intricate combina-
tion of factors related to the tumor and its micro-
environment, with the environment having the
potential to fundamentally influence the tumor phe-
notype. In summary, our findings suggest that inter-
action between the melanoma and the local
environment provided by the aqueous and vitreous
plays a major role in dictating future melanoma
behavior.
REFERENCES1. Fidler IJ. Critical determinants of metastasis. Semin Cancer
Biol. 2002;12:89–96.
2. Gragoudas ES, Egan KM. Uveal melanoma: a rare malig-
nancy. Ophthalmology. 2000;107:1441–1442.
TABLE 2ChemiArray Analysis for Cytokines and Growth Factors in theAqueous and Vitreous of Patients With Ocular Tumors
Cytokine
SOM450 SOM453 SOM 457 SOM 462
A V A V A V A V
ENA78 9 10 30 26 20 29 12 13GCSF 9 9 31 25 19 27 11 10
GM-CSF 9 6 26 31 19 29 10 10GRO 18 8 35 47 28 44 20 22GRO-A 11 4 29 40 20 38 13 13L309 15 11 21 13 16 19 12 10IL-1A 18 13 32 25 22 26 14 11IL-1B 15 8 25 25 19 22 12 11IL-2 10 7 22 27 18 22 10 11IL-3 6 7 21 25 17 21 7 9IL-4 6 9 27 32 23 29 9 11IL-5 6 7 20 23 17 22 8 8IL-6 7 6 21 21 18 26 8 7
IL-7 6 5 16 20 14 22 8 6IL-8 18 9 27 39 24 40 23 14IL-10 26 10 35 51 31 49 25 32IL-12 12 13 20 11 14 19 13 11IL-13 8 8 21 17 15 19 8 7IL-15 8 8 21 21 16 20 8 8IFN-A 8 9 23 23 19 23 8 11MCP-1 14 23 37 36 28 46 17 29MCP-2 6 10 23 28 21 28 7 10MCP-3 6 10 23 31 21 29 8 10
MCSF 28 23 42 49 44 47 27 24MDL 23 7 23 33 25 29 15 9MIG 8 5 19 32 20 29 14 8MIP-1B 35 21 44 61 43 53 34 8MIP-1DEL 25 41 35 31 32 33 28 28RANTES 21 22 20 37 31 35 19 18SCF 9 10 39 20 19 21 6 8SDF-1 8 11 23 24 21 27 7 11TARC 7 11 20 25 19 26 6 11TGF-B1 9 11 23 32 22 30 7 16TNF-A 30 30 42 49 41 45 25 32
TNF-B 16 18 32 37 34 40 14 14EGF 9 9 22 31 25 28 11 9IGF-1 13 7 22 60 26 32 13 10ANG 31 21 42 39 43 52 28 41OSM 32 59 42 22 43 46 31 28TPO 1 14 24 41 20 27 8 8VEGF 17 15 31 31 29 31 9 13PDGF-BB 10 14 22 26 24 26 7 9LEPTIN 12 13 23 30 25 28 8 12BDNF 20 19 32 38 26 35 13 24
BLC 15 20 25 30 26 28 10 15CKB8-1 37 31 39 48 45 43 34 23EOTAXIN 13 8 18 25 24 21 11 8EOTAXIN- 28 14 31 39 35 37 16 20EOTAXIN- 46 30 42 52 45 48 16 36FGF-4 10 25 25 18 28 25 13 7FGF-6 8 19 22 20 21 25 7 8FGF-7 14 28 26 29 26 27 8 12FGF-9 13 24 27 32 26 28 9 16FIT-3LIGA 11 18 22 29 22 24 7 13FRACTALI 36 30 37 52 39 40 19 22
GCP-2 17 20 26 35 26 27 10 11
(continued)
TABLE 2(continued)
GDNF 30 30 40 50 40 44 33 17
HGF 38 49 45 60 49 57 43 45
IGFBP-1 29 28 32 45 37 38 46 15
IGFBP-2 28 37 35 49 38 47 10 31
IGFBP-3 23 59 38 32 40 38 23 44
IGFBP-4 12 32 25 22 22 22 8 19
IL-16 15 39 30 34 30 27 9 24
IP-10 25 42 39 47 40 35 17 34
LIF 20 34 28 40 28 27 10 17
LIGHT 18 35 28 41 25 26 7 13
MCP-4 13 24 24 37 24 24 7 9
MIP 15 42 31 42 30 31 11 12
MIP-3A 10 19 22 32 23 24 8 7
NAP-2 39 61 47 58 52 50 29 28
NT-3 21 27 34 48 30 38 8 11
NT-4 23 49 44 36 37 39 21 40
OPIGRN 22 44 48 48 42 42 21 47
PARC 20 40 30 41 31 30 23 47
PIGF 39 51 38 52 51 41 31 56
TGF-B2 56 63 65 60 65 66 35 54
TGF-B3 20 30 35 45 34 35 9 14
TIMP-2 68 80 73 73 66 69 35 58
TIMP-3 69 87 68 70 72 71 46 64
The relative levels are expressed as a percentage of the average membrane positive. The aqueous (A)
and vitreous (V) are presented for each case number. Cases SOM 450 and 457 were from patients
with ciliary body melanomas; SOM 453 was from a patient with choroid melanoma; and case 462
from a patient with metastatic cancer.
Aqueous and Vitreous Regulate Melanoma/Canovas et al. 1793
3. Kujala E, Makitie T, Kivela T. Very long-term prognosis of
patients with malignant uveal melanoma. Invest Ophthal-
mol Vis Sci. 2003;44:4651–4659.
4. Conway RM, Chua WC, Qureshi C, Billson FA. Primary iris
melanoma: diagnostic features and outcome of conserva-
tive surgical treatment. Br J Ophthalmol. 2001;85:848–854.
5. Shields CL, Shields JA, Materin M, Gershenbaum E, Singh
AD, Smith A. Iris melanoma: risk factors in 169 consecutive
patients. Ophthalmology. 2001;108:172–178.
6. Patel JI, Tombran-Tink J, Hykin PG, Gregor ZJ, Cree IA.
Vitreous and aqueous concentrations of proangiogenic,
antiangiogenic factors and other cytokines in diabetic reti-
nopathy patients with macular edema: implications for
structural differences in macular profiles. Exp Eye Res.
2006;82:798–806.
7. Nishimura M, Ikeda T, Ushiyama M, Nanbu A, Kinoshita S,
Yoshimura M. Increased vitreous concentrations of human
hepatocyte growth factor in proliferative diabetic retinopa-
thy. J Clin Endocrinol Metab. 1999;84:659–662.
8. de Boer JH, Limpens J, Orengo-Nania S, de Jong PT, La
Heij E, Kijlstra A. Low mature TGF-beta 2 levels in aqueous
humor during uveitis. Invest Ophthalmol Vis Sci. 1994;
35:3702–3710.
9. Ozcan AA, Ozdemir N, Canataroglu A. The aqueous levels
of TGF-beta 2 in patients with glaucoma. Int Ophthamol.
2004;25:19–22.
10. Hendrix MJ, Seftor EA, Sefter RE, et al. Regulation of uveal mel-
anoma interconverted phenotype by hepatocyte growth factor/
scatter factor (HGF/SF). Am J Pathol. 1998;152:855–863.
11. Woodward JKL, Elshaw SR, Murray AK, et al. Stimulation
and inhibition of uveal melanoma invasion by HGF, GRO,
IL-1alpha and TGF-beta. Invest Ophthalmol Vis Sci. 2002;
43:3144–3152.
12. Hu DN, McCormick SA, Lin AY, Lin JY. TGF-beta 2 inhibits
growth of uveal melanocytes at physiological concentra-
tions. Exp Eye Res. 1998;67:143–150.
13. Myatt N, Aristodemon P, Neale MH, et al. Abnormalities of
the transforming growth factor-beta pathway in ocular
melanoma. J Pathol. 2000;192:511–518.
14. Boyd SR, Tan D, Bunce C, et al. Vascular endothelial growth
factor is elevated in ocular fluids of eyes harbouring uveal
melanoma: identification of a potential therapeutic window.
Br J Ophthalmol. 2002;86:448–452.
15. Canton I, Eves PC, Szabo M, et al. Tumor necrosis factor
alpha increases and alpha melanocyte-stimulating hor-
mone reduces uveal melanoma invasion through fibronec-
tin. J Invest Dermatol. 2003;121:557–563.
16. Elshaw SR, Sisley K, Cross NA, et al. A comparison of ocu-
lar melanocyte and uveal melanoma cell invasion and the
implication of a1b1, a4 b1, and a6 b1 integrins. Br J
Ophthalmol. 2001;85:732–738.
17. Tschentscher F, Husing J, Holter T, et al. Tumor classifica-
tion based on gene expression profiling shows that uveal
melanomas with and without monosomy 3 represent two
distinct entities. Cancer Res. 2003;63:2578–2584.
18. van der Velden PA, Zuidervaart W, Hurks MH, et al. Expres-
sion profiling reveals that methylation of TIMP3 is involved
in uveal melanoma development. Int J Cancer. 2003;106:
472–479.
19. Nareyeck G, Zeschnigk M, von der Haar D, Schilling H,
Bornfeld N, Anastassiou G. Differential expression of tissue
inhibitor of matrix metalloproteinases 3 in uveal mela-
noma. Ophthalmic Res. 2005;37:23–28.
20. El-Shabrawi Y, Ardjomand N, Radner H, Ardjomand N.
MMP-9 is predominantly expressed in epithelioid and not
spindle cell uveal melanoma. J Pathol. 2001;194:201–206.
21. Klisovic DD, Klisovic MI, Effron D, Liu S, Marcucci G, Katz
SE. Depsipeptide inhibitis migration of primary and meta-
static uveal melanoma cell lines in vitro: a potential stra-
tedy for uveal melanoma. Melanoma Res. 2005;15:147–
153.
22. Woodward JKL, Rennie IG, Elshaw SR, Burn JL, Sisley K.
Invasive and non-invasive uveal melanomas have different
adhesive properties. Eye. 2005;19:342–348.
23. Missotten GS, Notting IC, Schlingemann RO, et al. Vascular
endothelial growth factor a in eyes with uveal melanoma.
Arch Ophthalmol. 2006;124:1428–1434.
24. Folberg R, Arbieva Z, Moses J, et al. Tumor cell plasticity in
uveal melanoma: microenvironment directed dampening
of the invasive and metastatic genotype and phenotype
accompanies the generation of vasculogenic mimicry pat-
terns. Am J Pathol. 2006;169:1376–1389.
1794 CANCER April 15, 2008 / Volume 112 / Number 8