local authority performance indicators - laois.ie · local authority performance indicators 2 ......
TRANSCRIPT


Local Authority Performance Indicators
2 December, 2017
Table of Contents
1. Introduction ................................................................................................................................ 4
Summary of Results – At A Glance .......................................................................................... 4
Methodology ........................................................................................................................... 5
Comparing Local Authority Performance ................................................................................ 6
Reporting Averages ................................................................................................................. 6
Context .................................................................................................................................... 6
2. Housing ....................................................................................................................................... 9
Housing Management ............................................................................................................. 9
Homelessness .......................................................................................................................... 9
Private Rented Sector .............................................................................................................. 9
3. Roads ......................................................................................................................................... 10
Pavement Surface Condition Index ....................................................................................... 10
Road Grants Works ................................................................................................................ 11
Motor Tax Online ................................................................................................................... 12
4. Water & Environment ............................................................................................................... 13
Water Services ....................................................................................................................... 13
Environment .......................................................................................................................... 13
Pollution & Litter ................................................................................................................... 13
5. Planning..................................................................................................................................... 15
New Buildings Inspected ....................................................................................................... 15
Appeals to An Bord Pleanála ................................................................................................. 15
Cost Per Capita of Planning Services ..................................................................................... 15
6. Fire Services .............................................................................................................................. 16
Fire Scenes ............................................................................................................................. 16
Non-Fire Scenes ..................................................................................................................... 17
Cost Per Capita ...................................................................................................................... 18
7. Library Services, Youth & Community ...................................................................................... 19
Library Services ...................................................................................................................... 19
Public Participation Networks ............................................................................................... 19
Youth ..................................................................................................................................... 19

Local Authority Performance Indicators
3 December, 2017
8. Corporate .................................................................................................................................. 20
Staffing ................................................................................................................................... 20
Working Days Lost To Sickness .............................................................................................. 20
Use of Websites and Social Media ........................................................................................ 20
Cost Per Capita of ICT ............................................................................................................ 20
9. Finance ...................................................................................................................................... 21
Commercial Rates .................................................................................................................. 21
Rents & Annuities .................................................................................................................. 21
Housing Loans ........................................................................................................................ 21
10. Economic Development ............................................................................................................ 22

Local Authority Performance Indicators
4 December, 2017
1. INTRODUCTION
1.1. This commentary prepared by the Local Government Management Agency (LGMA) provides the
context on the 2016 performance indicators for the local government sector in Ireland. The
indicators are collected and analysed by the LGMA on behalf of the National Oversight and Audit
Commission (NOAC) as part of the Commission’s role in monitoring the performance of local
authorities. This report presents the performance of local authorities in 2016 using 34 indicators
identified by NOAC. The performance indicators are categorised by local government functions;
housing, roads, water, waste/environment, planning, fire services, library/recreation,
youth/community, corporate, finance and economic development. While the indicators address
the core functions of local authorities, it is acknowledged by NOAC that they do not reflect the
extensive range of services delivered by city and county councils throughout the State.
1.2. This section presents a summary of the key results, the methodology used to gather the
indicators, and provides an overview of the financial and economic context in which local
authorities operated. The remainder of the report provides a commentary on the indicators for
a range of functions including housing, roads, water waste/environmental management,
planning, fire services, library/recreation, youth/community, corporate, finance and economic
development.
SUMMARY OF RESULTS – AT A GLANCE 1.3. The highlights of the 2016 performance indicators are:
➢ The median time to re-let a social house reduced from 22.6 in 2015 weeks to 20.9 weeks
in 2016. However, the median cost of repair of a unit increased from €10,522 in 2016 to
€12,552 in 2016.
➢ The number of tenancies in the private rented sector increased by almost 1% between
2015 and 2016 to 311,295 units.
➢ Local authorities manage and maintain 94,405km of regional and local roads.
➢ 70.1% of motor tax transactions were conducted online.
➢ The median value of areas surveys that are unpolluted/litter free/slightly polluted was
85%.
➢ 63,587 pollution complaints were made to local authorities.
➢ 58,806 samples were taken at private water schemes.
➢ There was a 36.9% increase in new builds notified to local authorities.
Local Authority Performance Indicators
5 December, 2017
➢ Almost 17.2million visits to libraries where 18.2million items were borrowed.
➢ 26,858 people working in local government, a reduction from 35,007 in 2008.
➢ There were over 59.1million visits to local authority websites. The number following local
authority via social media increased by 80.4% to 1.6million in 2016.
➢ The Local Enterprise Offices assisted the creation of 3,355 whole time equivalent jobs. In
addition, local authorities play a key role in job creation and economic development, such
as planning, infrastructure, tourism and enterprise space. A Broadband Officer has been
assigned in each local authority to support the rollout of broadband infrastructure.
METHODOLOGY 1.4. To ensure that the performance indicators are valid and reliable, a very thorough approach is
taken to collating and analysing the data:
• 34 performance indicators requird 83 data entries inputted by each local authority. This
involved 2,573 individual data entries1;
• 31 Heads of Implementation coordinated this activity locally;
• A total of 741 people were involved in inputting the data reflecting the range of services
being measured;
• The data was inputted to a software system, ‘LG Returns’;
• The data was inputted by local authorities between March and April 2017;
• Once input, the LGMA and NOAC validated and audited the data between;
• The LGMA collates further datasets from external sources including the Central Statistics
Office (CSO), the Department of Housing, Planning and Local Government (DHPLG), the
Department of Transport, Tourism and Sport (DTTAS), the Road Management Office
(RMO), the Residential Tenancies Board, the National Waste Collection Permit Office
(NWCPO), Enterprise Ireland (EI), the Environmental Protection Agency (EPA) and Tobin
Consulting;
• Following validation of the data, the LGMA prepared this commentary on the data; and
• NOAC audits the results and uses the data to analyse the performance of local authorities.
1 While 34 indicators are collected, NOAC published results for 32 indicators.

Local Authority Performance Indicators
6 December, 2017
COMPARING LOCAL AUTHORITY PERFORMANCE
1.5. Each local authority is different. While local authorities provide a similar range of services they
must take account of national policies, local needs and the democratic priorities of a particular
area. In addition, the diversity between local authorities has an impact on performance
measurement. For example, geographic spread, population density, resources and socio-
economic profiles are among a range of factors that will affect the demand for different services
locally. Thus, rather than make comparisons between local authorities, it is more appropriate
to measure performance of individual local authorities addressing local priorities over time.
REPORTING AVERAGES 1.6. Where possible mean or average figures are used to illustrate the performance of the local
government sector in aggregate. This raises a number of methodological challenges. Mean or
average figures are only available where volumetric data is available. Where this is not the case,
or where use of an average is not appropriate, median values are used to show the mid-point
between the lowest and largest number reported by local authorities. This is sometimes a more
accurate reflection of performance because the divergent scores can disproportionately bias
the mean, making it unrepresentative. The report clearly states whether average, mean or
median is used.
CONTEXT 1.7. The paragraphs that follow provide the economic and financial context in which local authorities
operated in 2016.
The Irish Economy
1.8. The Irish economy experienced significant growth with GDP increasing by 5.1% and GNP
increasing by 9.6%2 in 2016. By December 2016, the seasonally adjusted monthly
unemployment rate fell to 7.2%, a decline from 8.9% in December 20153.
2Central Statistics Office (July 2017), National Income and Expenditure Annual Results 2016. 3 Central Statistics Office (January 2017), Monthly Unemployment.
Local Authority Performance Indicators
7 December, 2017
Local Government Resources
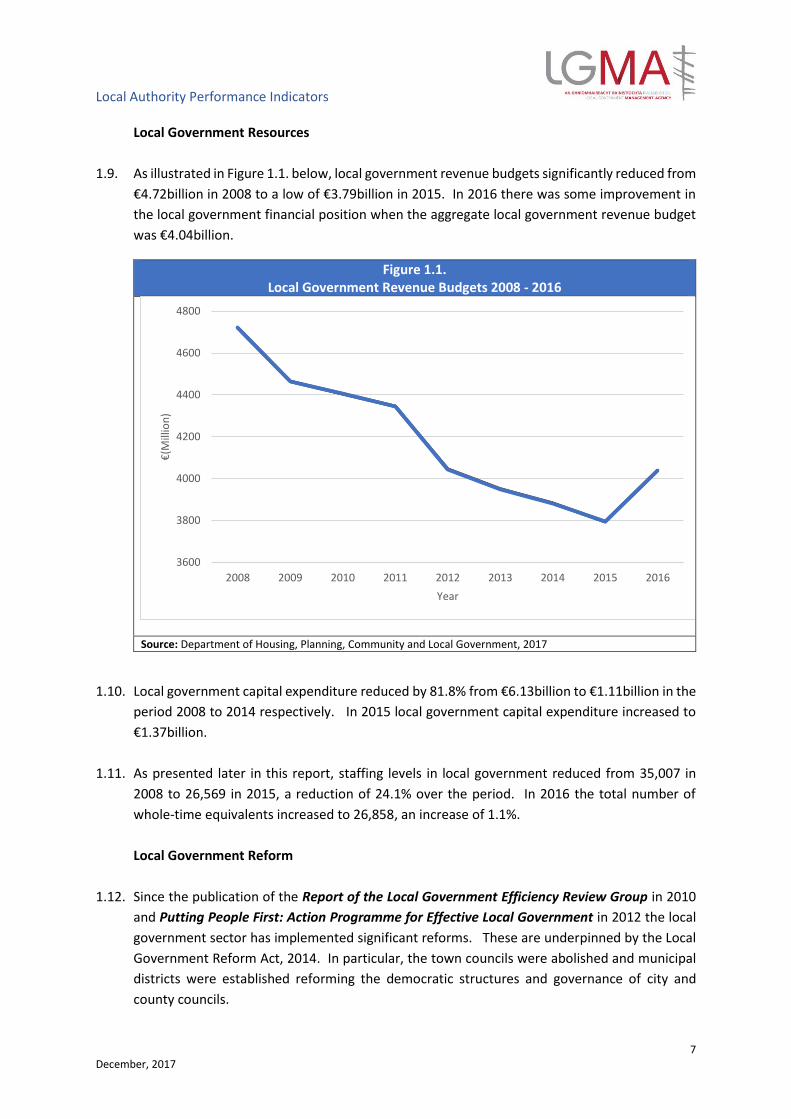
1.9. As illustrated in Figure 1.1. below, local government revenue budgets significantly reduced from
€4.72billion in 2008 to a low of €3.79billion in 2015. In 2016 there was some improvement in
the local government financial position when the aggregate local government revenue budget
was €4.04billion.
Figure 1.1. Local Government Revenue Budgets 2008 - 2016
Source: Department of Housing, Planning, Community and Local Government, 2017
1.10. Local government capital expenditure reduced by 81.8% from €6.13billion to €1.11billion in the
period 2008 to 2014 respectively. In 2015 local government capital expenditure increased to
€1.37billion.
1.11. As presented later in this report, staffing levels in local government reduced from 35,007 in
2008 to 26,569 in 2015, a reduction of 24.1% over the period. In 2016 the total number of
whole-time equivalents increased to 26,858, an increase of 1.1%.
Local Government Reform
1.12. Since the publication of the Report of the Local Government Efficiency Review Group in 2010
and Putting People First: Action Programme for Effective Local Government in 2012 the local
government sector has implemented significant reforms. These are underpinned by the Local
Government Reform Act, 2014. In particular, the town councils were abolished and municipal
districts were established reforming the democratic structures and governance of city and
county councils.
3600
3800
4000
4200
4400
4600
4800
2008 2009 2010 2011 2012 2013 2014 2015 2016
€(M
illio
n)
Year

Local Authority Performance Indicators
8 December, 2017
1.13. Local authorities play an expanded role in community and economic development, with the
establishment of the Local Community and Development Committees and the adoption of the
Local Economic and Community Plans. These plans set out an integrated approach to social,
cultural and economic development of local areas. Local Enterprise Offices were set up to
support entrepreneurship in each local authority area. In parallel, water services have been
transferred to Irish Water under a Service Level Agreement with each local authority.
1.14. In addition to the changes in the democratic and functional structures, the local government
sector implemented a series of efficiency reforms. Shared services were established to deliver
back office services such as payroll and procurement and a range of other functions such as
environmental services, road management and building control.
1.15. The Programme for Partnership Government commits to continued reform of local government
and the sector continues to meaningfully participate on the national public services reform
agenda that is led by the Department of Public Expenditure and Reform.

Local Authority Performance Indicators
9 December, 2017
2. HOUSING
2.1. The local government sector, working with the DHPLG, is committed to the delivery of the
Rebuilding Ireland Action Plan for Housing and Homelessness, which was published by the
Government in July, 2016. The Action Plan commits to delivering 47,000 units by 2021. This
represents an investment of €5.35billion in housing by the Government over the period 2016
to 2021. The housing performance indicators measure housing stock, housing maintenance
and management, private rented inspections and homelessness. In addition to these important
services, housing services of local authorities provide disability grants, are responsible for estate
management, administer the tenant purchase scheme, housing loans and rents and provide
traveller accommodation.
HOUSING MANAGEMENT 2.2. In 2016, 3.0% of local authority social housing stock was vacant, a reduction from 3.5% in 2015.
2.3. The median time from vacation of the dwelling to commencement of a new tenancy shortened
from 22.6 weeks in 2015 to 20.9 weeks. The median cost of repair and maintenance of a unit
increased by 19.3% from €10,522 in 2015 to €12,552 in 2016. The median cost of housing
maintenance in 2016 increased by 32.4% to €969 per unit.
HOMELESSNESS 2.4. The performance indicators use data as at 31st December 2016 when there was a total of 4,186
adults homeless and in emergency accommodation, of which 58.5% were in emergency
accommodation for 6 months continuously. Subsequently, according to statistics published by
the DHPLG by October 2017 there was a total of 5,298 homeless adults and 1,463 homeless
families, with 3,194 dependents. In 2016 3,000 people exited homelessness into independent
tenancies. In the first six months of 2017 over 1,800 exited homelessness into independent
tenancies.
PRIVATE RENTED SECTOR 2.5. Between 2015 and 2016 the total number of registered tenancies increased from 308,729 to
311,295, an increase of less than 1%. This illustrates the pressures on the private rented sector.
A total of 13,603 units were inspected by local authorities, of which 75% were found to be not
compliant with current standards regulations.

Local Authority Performance Indicators
10 December, 2017
3. ROADS
3.1. Local government is responsible for a total of 94,405km of regional, local primary, local
secondary and local tertiary roads in Ireland. With the exception of a number of urban local
authorities, road maintenance is primarily funded through grants from the Department of
Transport, Tourism and Sport (DTTAS). Between 2007 and 2017 the roads grants maintenance
from DTTAS reduced from €607.5million to €321.5million.
3.2. The performance indicators present information on the road surface ratings, and the road
maintenance programme. Local government plays a key role in relation to roads and
transportation, including public lighting, traffic management, pedestrian pathways, parking
management, road safety, safety in severe weather conditions such as flooding and cold
weather, and traffic management for festivals and events.
PAVEMENT SURFACE CONDITION INDEX 3.3. The Pavement Surface Condition Index (PSCI) is a standardised means to assess and rate the
surface conditions for roads. The data on road surfaces is derived from a central system called
MapRoad. Improvements to MapRoad in 2016 enabled a more accurate reporting of the data.
In 2016, there were:
• A total of 13,119 km of regional roads in Ireland, of which 98.4% were PSCI rated.
• A total of 23,791km of local primary roads, of which 90.4% were PSCI rated.
• A total of 33,382km of local secondary roads 82.4% of which were PSCI rated.
• A total of 24,113km of local tertiary roads of which 65.6% of local tertiary roads were PSCI
rated.
3.4. For the purpose of the performance indicators, the roads that have a PSCI rating are categorised
as follows:
• Category 1-4: Structural Distress
• Category 5-6: Surface Defect; Localised Distress
• Category 7-8: Surface Defect
• Category 9-10: No/Minor Defects
Local Authority Performance Indicators
11 December, 2017
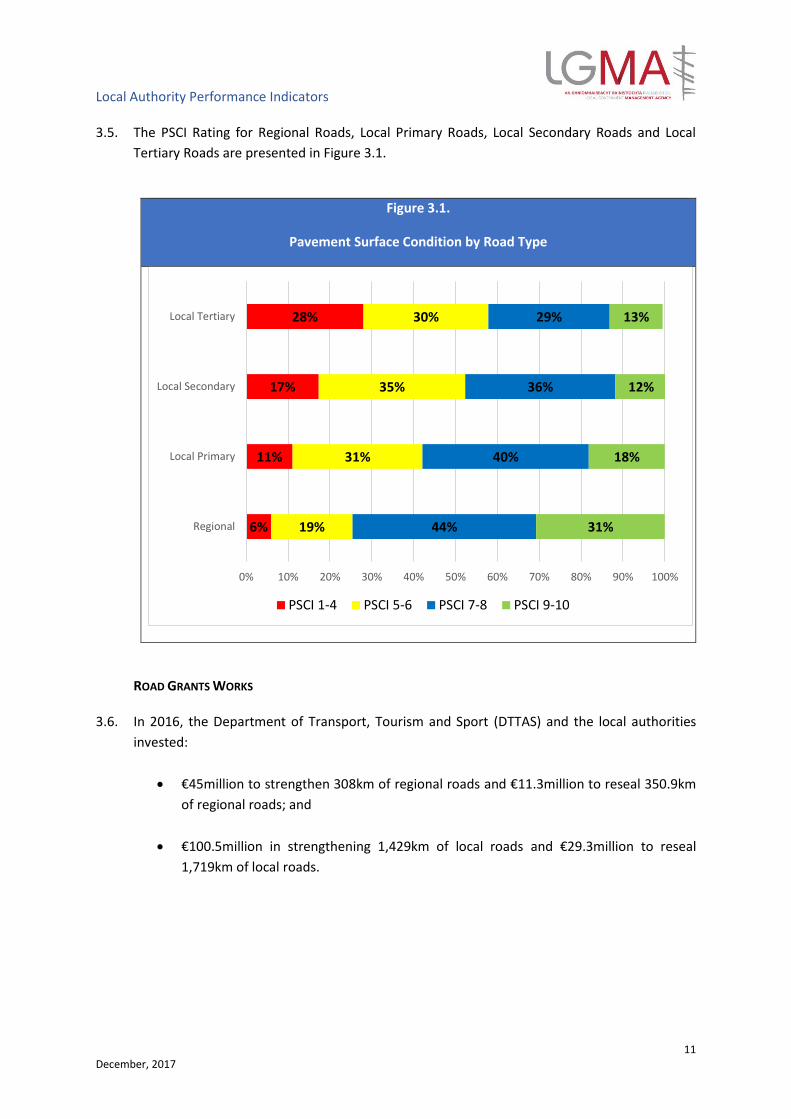
3.5. The PSCI Rating for Regional Roads, Local Primary Roads, Local Secondary Roads and Local
Tertiary Roads are presented in Figure 3.1.
Figure 3.1.
Pavement Surface Condition by Road Type
ROAD GRANTS WORKS 3.6. In 2016, the Department of Transport, Tourism and Sport (DTTAS) and the local authorities
invested:
• €45million to strengthen 308km of regional roads and €11.3million to reseal 350.9km
of regional roads; and
• €100.5million in strengthening 1,429km of local roads and €29.3million to reseal
1,719km of local roads.
6%
11%
17%
28%
19%
31%
35%
30%
44%
40%
36%
29%
31%
18%
12%
13%
0% 10% 20% 30% 40% 50% 60% 70% 80% 90% 100%
Regional
Local Primary
Local Secondary
Local Tertiary
PSCI 1-4 PSCI 5-6 PSCI 7-8 PSCI 9-10
Local Authority Performance Indicators
12 December, 2017
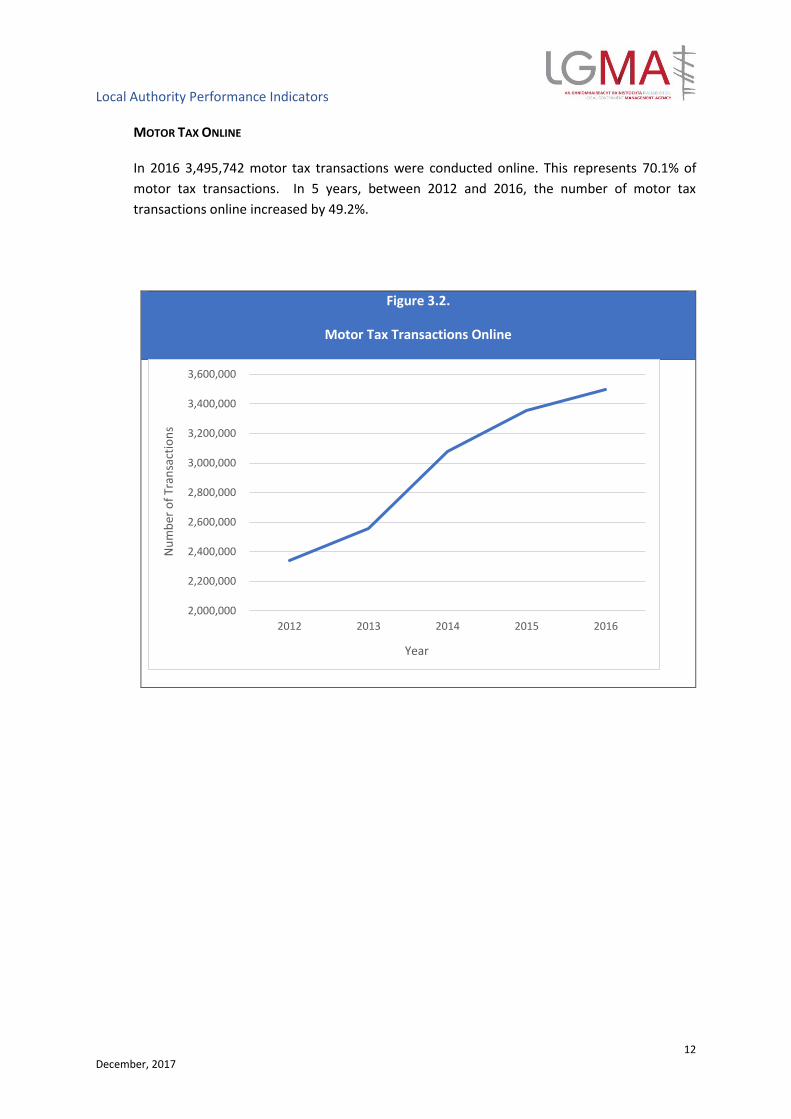
MOTOR TAX ONLINE
In 2016 3,495,742 motor tax transactions were conducted online. This represents 70.1% of
motor tax transactions. In 5 years, between 2012 and 2016, the number of motor tax
transactions online increased by 49.2%.
Figure 3.2.
Motor Tax Transactions Online
2,000,000
2,200,000
2,400,000
2,600,000
2,800,000
3,000,000
3,200,000
3,400,000
3,600,000
2012 2013 2014 2015 2016
Nu
mb
er o
f Tr
ansa
ctio
ns
Year
Local Authority Performance Indicators
13 December, 2017
4. WATER & ENVIRONMENT
WATER SERVICES 4.1. As previously stated, water services are transferred from local authorities to Irish Water under
a Service Level Agreement with each local authority. In 2016 a total of 58,806 samples were
taken at private water schemes, an increase of 6.6% over the number of samples taken in 2015.
In 2016 97.8% of samples were compliant with statutory requirements.
ENVIRONMENT 4.2. Local authorities carry out a broad range of environmental services including street, park and
beach cleaning, litter services, veterinary services, cleaning graffiti, road cleaning, management
of recycling centres and civic amenity sites, and management of landfill sites. Local authorities
play a regulatory role in relation to waste collection. Three Waste Enforcement Regional Lead
Authorities (WERLAs) for the Southern, Eastern and Midlands and Connacht/Ulster Regions
were established at the end of 2015. The objective of the WERLAs is to support improved
performance and greater consistency in waste enforcement.
4.3. The total number of households with a 3-bin service increased by 11.3% from 575,078 in 2015
to 640,227 in 2016. By 2016 37.7% of households availed of a 3-bin service, an increase from
33.9% in 2015.
POLLUTION & LITTER
4.4. In 2016 a total of 63,587 pollution complaints4 were made to local authorities, an increase of
15% above the number of complaints made in 2015.
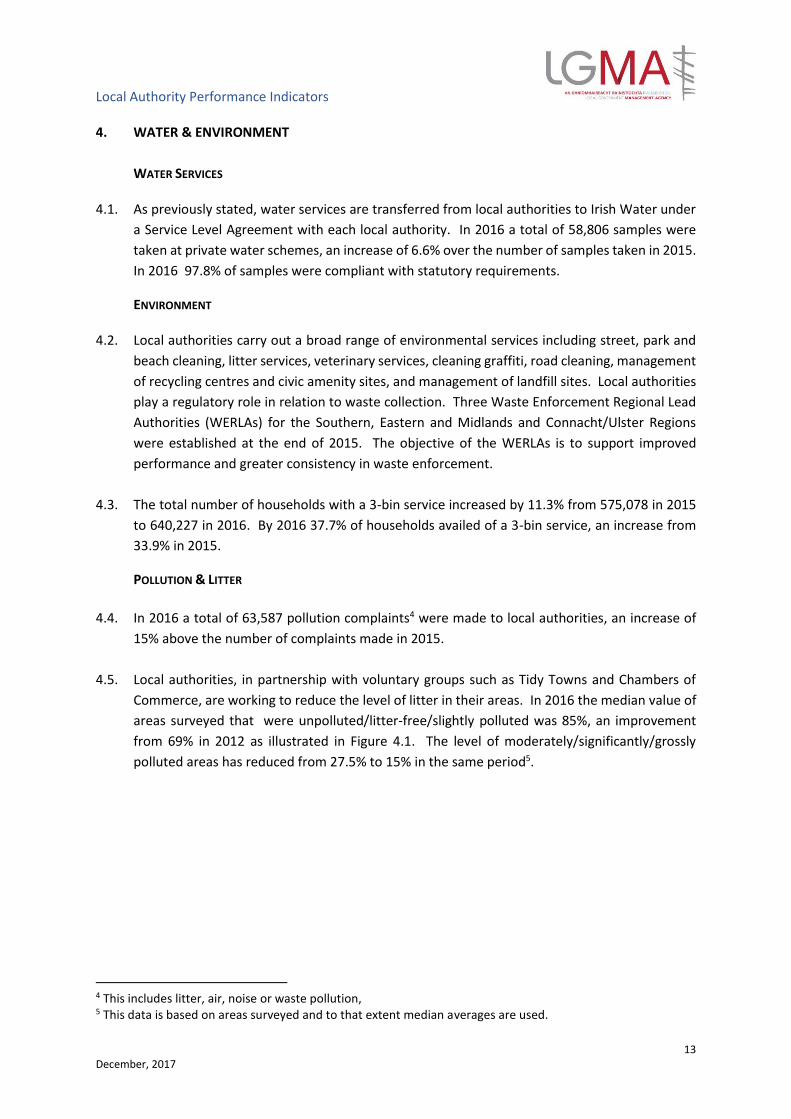
4.5. Local authorities, in partnership with voluntary groups such as Tidy Towns and Chambers of
Commerce, are working to reduce the level of litter in their areas. In 2016 the median value of
areas surveyed that were unpolluted/litter-free/slightly polluted was 85%, an improvement
from 69% in 2012 as illustrated in Figure 4.1. The level of moderately/significantly/grossly
polluted areas has reduced from 27.5% to 15% in the same period5.
4 This includes litter, air, noise or waste pollution, 5 This data is based on areas surveyed and to that extent median averages are used.
Local Authority Performance Indicators
14 December, 2017
Figure 4.1. Trends in Median Levels of Litter Pollution 2012 - 2016
0
5
10
15
20
25
30
35
40
45
50
55
60
65
70
75
2012 2013 2014 2015 2016
%
Unpolluted or Litter Free Slightly Polluted Moderately Polluted
Significantly Polluted Grossly Polluted
Local Authority Performance Indicators
15 December, 2017
5. PLANNING
5.1. Local authorities play forward planning, regulatory, development management and
enforcement roles for their areas.
NEW BUILDINGS INSPECTED 5.2. In 2016 local authorities were notified of a total of 12,922 new buildings, an increase of 36.9%
over 2015 figures. Of these local authorities inspected 3,222 in 2016, representing an annual
increase of 26.1% of inspections of new buildings carried out by local authorities.
APPEALS TO AN BORD PLEANÁLA 5.3. A total of 1,451 planning decisions made by local authorities were appealed to An Bord Pleanála
in 2016. Of these, 77.6% of decisions made by local authorities were confirmed by An Bord
Pleanála, an improvement over 2015 when 74.3% of decisions made by local authorities were
upheld by An Bord Pleanála.
COST PER CAPITA OF PLANNING SERVICES 5.4. The cost of planning services includes forward planning, development management and
enforcement. In 2016 the cost per capita of planning services across the sector was €26.96.

Local Authority Performance Indicators
16 December, 2017
6. FIRE SERVICES
6.1. In addition to fire emergency services, local authorities conduct inspections on buildings for fire
safety and provide a range of fire prevention services. The performance indicators focus on
mobilisation of fire emergency services. For the purpose of the performance indicators there is
a distinction made between mobilisation and attendance to fire scenes and non-fire scenes.
FIRE SCENES 6.2. In the case of fire, in 2016 the median number of minutes taken to mobilise the fire brigade in
full-time stations was 1 minute 31 seconds, while the time in part-time fire stations was 5
minutes 38 seconds. This compared with 1 minute 36 seconds and 5 minutes 27 seconds
respectively in 2015.
6.3. Figure 6.1. below compares the median times of first attendance at a fire scene in respect in
2015 and 2016. This highlights relatively consistent attendance times between 2015 and 2016.
Almost 41% of fire scenes are attended within 10 minutes while 86% are attended within 20
minutes. This compares with 40% and 85% respectively in 2015.
Figure 6.1. Median Times to Attendance at Fire Scenes
2015 & 2016
39.32
45.25
13.39
40.65
45.36
13.37
% of Fire Cases in Within10 Minutes
% of Fire Cases Between10 and 20 Minutes
% of Fire Cases After 20Minutes
% 2015
2016

Local Authority Performance Indicators
17 December, 2017
NON-FIRE SCENES 6.4. In 2016 it took a median of 1 minute 43 seconds to mobilise from full-time fire stations and 5
minutes 54 seconds to mobilise from part-time fire stations. This compares with response times
of 1 minute 44 seconds and 5 minutes 40 seconds respectively in 2015.
6.5. Attendance to non-fire scenes is presented in Figure 6.2 below, showing that in 2016 on average
almost 31% of non-fire scenes were attended within 10 minutes and 81% were attended within
20 minutes.
Figure 6.2. Median Times to Attendance at Non-Fire Scenes
2015 & 2016
29.95
50.00
13.68
30.60
50.75
14.29
% of Non-Fire CasesWithin 10 Minutes
% of Non-Fire CasesBetween 10 and 20
Minutes
% of Non-Fire Cases After20 Minutes
%2015
2016

Local Authority Performance Indicators
18 December, 2017
COST PER CAPITA 6.6. The per capita cost of fire services across the local government sector in 2016 was €56.07. The
cost of operating fire services is influenced by whether the fire service operates a full-time or
part-time fire brigade. Cork City is the only fire authority operating a full-time brigade with no
retained fire-fighters. Dublin City provides the service for the Dublin local authorities, Dublin
City, Fingal, South Dublin and Dún Laoghaire Rathdown. Galway County Council operates a
shared service for Galway City and County Councils6.
6 17,226 of the population receiving its first response from the Northern Ireland Fire Service has been excluded from the cost calculation.

Local Authority Performance Indicators
19 December, 2017
7. LIBRARY SERVICES, YOUTH & COMMUNITY
LIBRARY SERVICES
7.1. In 2016 there were a total of 17,178,052 visits to libraries run by local authorities, a reduction
of 1.8% over 2015. A total of 18,173,449 items7 were borrowed, a decrease of 0.1% since 2015.
In addition to borrowing, people visit libraries to find information, get help from a librarian,
participate in events and courses, access PCs and Wi-Fi, and for study and community space.
7.2. The cost per capita of operating the library service in 2016 was €30.05. In 2015, this was €30.04.
PUBLIC PARTICIPATION NETWORKS 7.3. Public Participation Networks enable the public to take an active and formal role in the policy
making activities of local authorities that will affect their own communities. In 2016 a total of
11,915 community organisations were included in the County Register, an increase of 778 since
2015. Of these, 19.2% opted to be part of the Social Inclusion College of their respective Public
Participation Network. Community organisations may opt to participate in one of the two other
Colleges of the PPN; the Community and Voluntary College, or the Environmental College.
YOUTH 7.4. Comhairle na nÓg are local councils for young people to provide them with an opportunity to
be involved in the development of local policies. In 2016, 68.1% of second level schools
participated in the Youth Councils/Comhairle na nÓg, an increase from 67.6% in 2015.
7 Library borrowings include books, dvds, audio, ebooks, e-magazines, e-audio and ProQuest etc.,
Local Authority Performance Indicators
20 December, 2017
8. CORPORATE
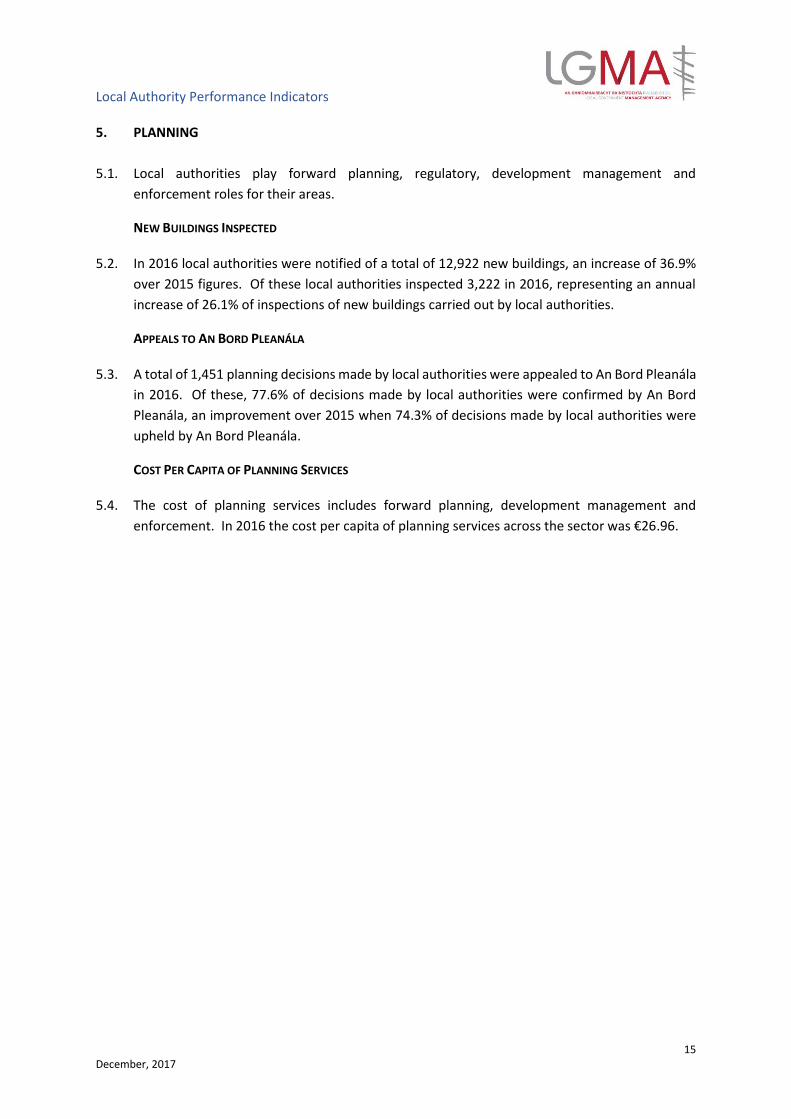
STAFFING 8.1. The number of whole time equivalent staff working in local authorities fell from 35,007 in 2008
to 26,858 in 2016, a reduction of 23.3%. The reduction rate slowed between 2013 and 2015
and in 2016 there was a small increase of 1% in the number of whole time equivalent staff
employed in the local government sector to 26,858. As a result of the public sector recruitment
embargo, by 2017 75% of staff working in local authorities are over 41 years of age. Only 4% of
staff of local authorities are under 30 years.
Figure 9.1. Staffing in Local Authorities 2008 - 2016
WORKING DAYS LOST TO SICKNESS 8.2. The mean paid working days lost to medically certified leave rose from 3.52% in 2015 to 3.76%
in 2016 and the mean paid working days lost to self-certified was 0.38%.
USE OF WEBSITES AND SOCIAL MEDIA 8.3. In 2016 there were a total of 59,149,740 page views of local authority websites, an increase of
6% over 2015 figures. In the same period there was a significant increase of 80.5% in followers
of social media pages of local authorities from 644,521 to 1,163,551. These increases may in
part be attributed to new online services, re-branding of services or greater public awareness
of local authority online presence.
COST PER CAPITA OF ICT 8.4. In 2016, the mean cost per capita of ICT provision per whole time equivalent across the local
government sector was €2,680.80.
26,500
27,500
28,500
29,500
30,500
31,500
32,500
33,500
34,500
35,500
2008 2009 2010 2011 2012 2013 2014 2015 2016

Local Authority Performance Indicators
21 December, 2017
9. FINANCE
9.1. As outlined in Section One, local authorities operated in a particularly challenging financial
environment between 2008 and 2015, with a very modest recovery in local government finance
in 2016. As a result, by 2012 the majority of councils were operating at a revenue deficit.
However, by 2016 the number of local authorities operating at a deficit reduced to 13 from 16
in 2015.
9.2. The total revenue expenditure by local authorities in 2016 is budgeted to be €4.04bn, which
represents a spend of €842 per capita based on 2016 Census data.
COMMERCIAL RATES
9.3. The local government sector implemented a comprehensive debt management programme
that involved improved processes, alignment in reporting with methods used by other public
sector bodies and a focused debt management training programme. Furthermore, rates
collection targets were set for each local authority. In 2016, the collection of Commercial Rates
improved in 28 local authorities, remained static in 1 local authority and declined in 2 local
authorities. The mean level of rates collection increased from 82.5% in 2015 to 84.4% in 2016.
RENTS & ANNUITIES 9.4. The median collection rate for Rents and Annuities remained the same in 2016 at
88%. Collection rates improved in 11 local authorities, remained static in 8 local authorities and
declined in 12 local authorities.
HOUSING LOANS 9.5. In 2016 the collection of housing loans improved in the case of 19 local authorities, remained
static in 5 local authorities and declined in 7 local authorities. The median reduced slightly from
71%8 in 2015 to 70% in 2016. It should be noted that the loan book of a local authority who
loaned as a ‘lender of last resort’ will be slower to recover than the loan books of a bank or
building society. The Mortgage Arrears Resolution Process (MARP) is a statutory framework for
customers to pay arrears over a long period of time and will therefore increase the period of
loan repayments while reducing the value of individual repayments.
8 In 2015, the median reported of 73% was based on unaudited figures and was subsequently revised to 71%.
Local Authority Performance Indicators
22 December, 2017
10. ECONOMIC DEVELOPMENT
10.1. Local authorities play a significant role in relation to economic development. In addition to
adopting and coordinating the implementation of the Local Economic and Community Plans
(LECPs) and the Regional Action Plans for Jobs, the sector provides planning and development
services, physical infrastructure, and supports social enterprises. It delivers a range of festivals,
events and place branding, bringing tourism into cities and towns throughout Ireland.
10.2. The Local Enterprise Offices (LEOs) are central to local economic development. This support
structure contributes to the creation and sustainability of jobs in local communities,
strengthening new and existing business development nationwide. In 2016 the LEOs assisted
businesses to create an additional 3,355 whole time equivalent jobs9, an increase of 203 over
2015. Three new performance indicators were measured in 2016, focusing on Trading Online
Vouchers and Mentoring Recipients. The number of Trading Online Vouchers approved by the
LEOs in 2016 was 1,141, while 658 were drawn down during the year. The total number of
participants that received mentoring in 2016 was 7,564.
10.3. In addition to the data captured by the Performance Indicators, the value in the LEO structure
also lies in supports such as core business training, networking events, advice and referral for
start-ups, micro enterprises and small businesses locally.
9 Where part-time jobs were created they were counted as 0.5 of a whole time equivalent. This represents a net increase in jobs created by LEO clients, and takes into account job losses. A total of 7,883 jobs were created by LEO clients and total employment by the 6,846 LEO client companies stood at 34,634 at end 2016.