loan document i 0
TRANSCRIPT

This microfiche was produced from documents recflived for inclusion in the HCIRS data base. Since NCJRS cannot exercise
control over the physical t:ondition of the documents submitted, the individual frame quality will vary. The resolution cha.rt on
this frame may be used to evaluate the document quality.
I 0 ~~ 11111
2.8 IIIF~
11111._'- rig 111~3.2 ~ ~ ~!I~ w
II 1.1 L ~ I
\\\\\1.25 IIII1 1.4 111111.6
MICROCOPY RESOLUTION TEST CHARi NATIONAL BUREAU OF STANDAROS·1963·A
Microfilming procedures used to create this fiche comply with
the standards set forth in 41CFR 101·11.504
Points of view or OPInions· stated ir. thiS document are those of the authorl sl and do not repreunt the official position or policies of the U.S.,Department of Justice.
U.S. DEPARTMENT Of JUSTICE LAW ENFORCEMENT ASSISTANCE ADMINISTRATION NATIONAL CRIMINAL JUSTICE REFERENCE SERVICE WASHiNGTON, D.C. 20531
AN ANALYSIS OF VICTIMIZATION SURVEY RESULTS
FROM THE EIGHT IHPACT CITIES:
SUMHARY REPORT
by Michael J. Hindelang Project Director
Criminal Justice Research.Center Albany, New York LOAN DOCUMENT
November 1974 RETURN TO:
NCJRS P. O. BOX 24036 S. W. POST OFFICE VifASHINGTONJ D.C. 20024
This project was supported by Grant No. 74-S8-99-6001, awarded to the Criminal Justice Research Center 1 Albany, New York, by the Statistics Division, National Criminal Justice Information and Statistics Service, Law Enforcement Assistance Administration, U.S. Department of Justice, under the Omnibus Crime Control and Safe Streets Act of 1968, as amended; the project, entitled IIAnalysis of National Crime Survey Data,1I is being directed by Michael J. Bindelang and monitored forLEAA by Dawn Nelson. Points df view or opinions stated in this document are those of the author and do not necessarily represent the official position or policies of the U.S. Department of Justice.
LEAA authorizes any person to reproduce, publish, translate, or otherwise use all or any part of the copyrighted material in this publication, with the exception of those items indicating that they are copyrighted by or reprinted by permission of any source other than the Criminal Justice Research Center.
Copyright 1976 by Criminql Justice Research Center
For sale b)' the Superintendent of Documents, U.S. Government Printing Office Washington, D.C. 20402· Price *1.90
Stock No. 027-000-00404-1
If you have issues viewing or accessing this file contact us at NCJRS.gov.

U.S, DEPARTMENT OF JUSTICE Law Enforcement Assistance Administration
Richard W. Velde, Administrator
Harry Bratt, Assistant Administrator National Criminal Justice Infonnation and Statistics Service
...... ~enjamin H. Renshaw, Director :.1-'''''' St t" t" D" i" ;. ~ •. , "i ! a ~s ~cs ~v s~on !O' ., I ", .. "*
" . " . ..
l't .-: ,"- >/'> "" ~ ~ gJ' t" ,"''' r~" '<, ,,-' ;~ ~T 1.;"", • ~.: • " • ,.,.. •
--.....-------------------------.--- - ---:'/
'i
PREFACE
This is a summary report of a more detailed analysis of the victim survey data in the Eight Impact Cities. As a summary, this repoI't necessarily gives only brief attention to (1 number of very complex results and issues. In this summary, many of the more detailed analyses and much of the technical document~tion have been omitted. For additional information the interested reader is referred to the full report: An Analysis of Victimizat;Lon Survey Results from the Eight Impact Cities, by Michael J. Hindeltmg, Law Enforcement Assistance Administration, 1975, available from the National Criminal Justice Reference Service, LEAA, Washington, D.C. 2053l. .
1'his work could not have been initiated without the years of painstaking and creative developmental work designed and implemented by the Statistics Division of the National Criminal Justice Information Statistics Service, Law Enforcement Assistance Administration in conj unc:tion with the Bureau of the Census.
In particular, a debt of gratitude is owed to Anthony G. Turner and George E. Hall for the innovative data collection programs they have initiated in the Statistics Division of LEAA. It was primarily through their efforts that the National Crime Panel series of victimization surveys were initiated.
In conjunction with the grant from LEAA under which the current report was produced, special thanks are due to Dawn. Nelson of LEAA and Linda Murphy and Chet Bowie of the Bureau of the Census for the technical assistance which they have provided throughout the life of the proj ect.
At the Criminal Justice Research Center, all of the project staff worked long and hard to assist in the production of this volume. They include:
Project Coordinators Mark A. Cunniff Terence F. Brennan
Research Analysts Michael Gottfredson James Garofalo John Goldkamp John Gibbs Nicolette Parisi

ii
Computer Programmers I
Steve Werner Ed D' Arcangelis.
Clerical-Statistical
Debbie Mann Larry Steinhart
Clerical-Typing
Susan Gottlieb Susanne Freeman Barbara Robarge Suzette Geary Ruth Moehrle
Chapter I
Chapter I!
Chapter II!
Chapter IV
--------~----- --- -- - - --
TABLE OF CONTENTS
Introduction The Impact Cities Surveys The NCJISS Classification System Standard Error
Personal, Household, And Business Victimization Personal Victimization
Family Income And Race Age Race, Sex, And Age Marital Status
Household Victimization Race And Family Income Age Of Head Of Household
Business Victimization Multiple Victimization
Characteristics Of The Victimization Event Personal Victi~ization
The Victim-Offender Relationship Relationship Between Age Of Offender(s) And Age Of Victim Relationship Between Race Of Offender(s) And Race Of Victim Self-Protective Measures Taken Injury Resulting In Hospital Treatment Property Loss And Recovery
Household Victimization Property Loss And Recovery
Business Victimization Property Loss And Recovery
Characteristics Of The Incident Time Of Occurrence
Personal Household Business
Place Of Occurrence Personal Household
Use Of Weapons Personal Business
Number Of Victims Personal
Page 1 3 6 8
12 12 16 18 21 25 27 30 33 35 41
44
45
46
46 51 58 60
64 69 69
72
72 72 73 74 74 75 77 77 79 81 81
iii

------__ ~~~~~=L~._------------__ -----------
iv
Table Of Contents (Continued)
Chapter V
Appendix A
Appendix B
Appendix C
Appendix D
Number of Offenders Personal Business
Failure To Report Victimizations To The Police Extent Of Non-Reporting
Personal Victimizatiol1S Household Victimizations Business Victimizations
Amount Of Loss Attempted And Completed Victimizations Use Of Weapons Victim Characteristics Reasons Given For Non-Reporting Victim Survey Estimates And The Uniform
Crime Reports
National Crime Panel Classification Of Personal Crimes
National Crime Panel Classification Of Household Crimes
National Crime Panel Classification Of Business Crimes
Standard Error Tables
81 81 82
84 84 84 86 87 89 91 93 94 95
97
107
108
109
110
'.I'able Number
2.1
2.2
2.3
2.4
2.5
2.6
2.7
2.8
3.1
3.2
TABLE LIST
, Title
Estimated Rates (Per 1,000 Persons 12 Years Of Age Or Older) Of Personal Victimization
Eight Impact Cities
E~;timated Rates (Per 1,000 Persons 12 Years Of Age Or Older) And Percentage Distribution Of Personal Victimization, By Age Of Victim
Eight Impact Cities: Aggregate
Estimated Rates (Per 1,000 Persons 12 Years Of Age Or Older) Of Personal Victimization, By Ag~, Race And Sex
Eight Impact Cities: Aggregate
Estimated Rates (Per 1,000 Persons 12 Years Of Age Or Older) Of Personal Victimization, By Marital Status
Eight Impact Cities: Aggregate
Estimated Rates (Per 1,000 Households) Of Household Victimization
Eight Impact Cities
Estimated Rates (Per 1,000 Households) Of Household Victimization, By Race Of Head And Family Income
Eight Impact Cities: Aggregate
Estimated Rates (Per 1,000 Businesses) Of Business Burglary And Robbery
Eight Jmpact Cities
Estimated Rates (Per 1,000 Businesses) And Percentage Distribution Of Business Victimization, By Type Of Business
Eight Impact Cities: Aggregate
Relationship Between The Perceived Race Of Lone And Multiple Offenders And The Race Of The Victim In Personal Victimizations
Eight Impact Cities: Aggregate
Percent Distribution For The Use Of Self-Protective Heasures In Personal Victimizations
Eight Impact Cities: Aggregate
v
14
19
22
26
29
32
37
39
47
52

vi
Table List (Continued)
Table Number
3.3
3.4
3.5
3.6
4.1
5.1
5.2
5.3
5.4
5.5
Title
Percent Distribution For The Use Of Self-Protective Measures Used In Personal Victimizations, By The Age Of The Victim
Eight Impact Cities: Aggregate
Injury And Extent Of Hospital Treatment Received In Personal Victimizgtions
Eight Impact Cities: Aggregate
Value Of Property Stolen In Household Victimizations, By Race Of Head
Eight Imapct Cities: Aggregate
Percentages Of Household Victimizations In Which There Was Partial Or Full Recovery, By Value Of Property Stolen And Race Of Head
Eight Impact Cities: Aggregate
Extent And Type Of Weapon Used In Personal Incidents And Business Robberies
Eight Impact Cities: Aggregate
Percentages Of Non-Reported Personal, Household; And Business Victimizations
Eight Impact Cities
Percentages Of Non-Reported Personal, Household, And Business Victimizations, By Completed Versus Attempted Victimizations
Eight impact Cities: Aggregate
Reasons For Not Reporting Personal, Household, And Business Victimizations
Eight Impact Cities: Aggregate
Comparisons Of Victim Survey Counts And Uniform Crime Reports
Eight Impact Cities: Aggregate
Comparisons Of Rankings Of Eight Impact Cities According To Victim Survey Estimates And Uniform Crime Report Figures, By Offense
55
59
65
68
78
85
90
96
102
104
J
Table List (Continued)
Table Number
D.1
.D.2
D.3
Estimated Standard Errors And 95 Percent Confidence Intervals For Rates (Per 1,000 Persons 12 Years Of Age Or Older) Of Perii,:mal Victimization
Eight Impact Cities
Estimated Standard Errors And 95 Percent Confidence Intervals For Rates (Per 1,000 Households) Of Household Victimization
Eight Impact Cities
Estimated Standard Errors And 95 Percent Confidence Intervals For Rgtes (Per 1,000 Businesses) Of Business Victimization
Eight Impact Cities
vii
111
112
113

Chapter I
INTRODUCTION
In 1965 the President's Commission on Law Enforcement and the
Administration of Justice recognized that statistics on crimes known
to the police which are collected by the Federal Bureau of Investi-
gation and published annually in the Uniform Crime Reports. (UCR) do
not provide a complete picture of the nature and extent of crime in
United States. A9 the Commission noted in :r.s report, The Challenge
of Crime in ..e. Free Society:
Crimes reported directly to prosecutors usually do not show up in the police statistics. Citizens often do not report crimes to the police. Some crimes reported to the police never get into the statistical system. Since better crime prevention and control programs depend upon a full and accurate knowledge abo',. the amount and kinds of crime, the Commission initiated the first national survey ever made of crime victimization. l
The survey sponsored by the Commission--and conducted by the National
Opinion Research Center (NORC) of the University of Chicago--involved
contacting a representative sample of 10,000 households in the United
States. In each household the person questioned was asked whether
any member of the household had been a victim of crime during the
preceding year. In the Commission!s words, the results of this
survey indicated that lithe amount of personal injury crime reported
to NORC is almost twice the UCR rate and the amount of property

2
crime more than twice as much as the UCR rate for individuals.,,2
As a result of the wealth of information provided by the NORC
survey--not only information about ehe amount of cl;'ime, but also
information about the circumstances surrounding the event, the
relationship of the victim and offender, losses and injuries resulting
from crime, reasons for not reporting crimes to the police, and
so on--surveys of victims of crime came to be seen as a vehicle for
providing essential information about crime which is not otherwise
available. Stimulated by the pioneering work of the Presidentls
Comnlission, the National Criminal Justice Information and Statistics
Service (NCJISS) of the Law Enforcement Assistance Administration
(LEAA)--in conjunction with the Bureau of the Census--began a 10ng
term effort to use surveys of victims of crime to complement existing
information from police statistics about certain crimes against
indiViduals, households, and businesses.
The National Crime Panel (NCP), a nationwide program of victimiza-
tion surveys, began in July 1972. A representative national sample of
60,000 households and 10,000 businesses is interviewed every 6 months for
3 years. Each month, 10,000 of these householdS and 2,500 of these
buSinesses is interviewed on a rotating basis. In addition to the
national survey, similar surveys are bein~ conducted in specific cities--
for example, in the eight cities participating in the LEAl\. high-impact
crime reduction program (Atlanta, Baltimore, Cleveland, Dallas, Denver,
3
Newark, Portland, and St. Louis).4 This overview report is a summary
presentation of l;'esnlts from surveys of households and businesses
conducted in each of the Impact Cities. A much more detailed
analysis, complete with technical documentation, appem:s in another
publication. 5
~ Impact Cities Surveys
The procedures and instruments used in the Impact Cities victim
surveys are the product of extensive experimentation and field
testing. During tIle past three years several research and develop
ment projects 6 have resulted in sign:i.ficant methodological improve-
ments over the techniques used in the earlier NORC study. As a
consequence of this careful developmental work conducted jointly
by NCJISS and the Bureau of the Census, there is substantial reason
for confidence in the general procedures and instruments used to
produce the survey results reported herein.
From July to October 1972, representative probability samples
of approximately 10,000 to 12,000 households and commercial estab
lishments in each of the eight Impact Cities 7 were selected for study
by the nureau of the Census. In the household portion of the survey,
a knowledgeable household member (designated the household respondent)
was selected to answer questions concerning the entire household.
In addition, interviews were conducted with each household member 14

4
years of age or older. Finally, information about respondents
12 and 13 years of age was obtainedJby having a knowledgeable hous~
hold member answer questions for these respondents. Since every
household member 12 years of age or older was eligible for study,
approximately 21,000 interviews were conducted in the household
portion of the survey, in each of the eight Impact Cities. The
interviews covered victimizations ocqurring to the respondents
during the previous twelve months. Since the interviews were con-
ducted from July to October 1972, the results presented herein
pertain to victimizations occurring in the latter months of 1971
and most of 1972. For example, interviews conducted in September
1972 would include victimizations happening in the period from
September 1, 197~ until August 31, 1972. It must be emphasized,
therefore, that these results cover victimizations which occurred
before the Impact Cities Crime reduction programs were underway.
In view of this fact, these results obviously cannot address the ef-
fectiveness of the Impact Cities crime reduction programs.
In the household portion of the survey,respondents were asked
a series of "screen" questions, in order to determine whether the
household or the individual ha.d been a victim of a crime during ~
preceding twelve months.. The household screen questions included
queries as to whether (during the preceding twelve months) anyone
1
J
had broken into or had attempted to break into the respondent's
home or garage; anything kept outside of the home had been stolen;
anyone had stolen or attempted to steal any motor vehicle or part
of'a motor vehiclp.; and so on. 8 Individual screen questions--asked
5
9 ' of each respondent 14 years of age and older --were used to ascertain
whether. (during the preceding twelve months) anyone had taken or
attempted to take anything from them by force or threat of force;
anyone had beaten them up, or threatened to beat them up; anyone
had taken any of his or her belongings from inside of a car or truck;
10 and so on. After the respondent had answered each of the screen
questions, the interviewer asked additional questions to elicit
details about any victimizations uncovered in those questions. In
these follow-up questions respondents were asked about the specifics
of the incident such as time and place of occurrence, extent of
injury and/or loss, whether the offense was reported to the police,
etc.
In the commercial portion of the survey, a sample of recognizable
commercial establishments--with the exception of banks and establish-
ments engaged primarily in agricultural production--was selected for
study in each of the eight Impact Cities. An attempt was made to
inter.view the owner or manager of the business, or, failing this,
the accountant, assistant manager, or some other person knowledgeable

6
about the affairs of the business. As in the household survey, a
series of screen questions was first asked. These included whether
anyone had broken into, or had attempted to break into the respondent's
place of business; and whether the respondent or any employee was
held up--or whether an attempt was made to hold the~ up--by anyone
using force or threat of force, either on the premises of the business
or in the course of making deliveries. II
As in the household survey, after the respondent had been asked
each screen question, the interviewer asked additional questions to
elicit details about any victimizations uncovered in those questions.
In the commercial survey, these details included such things as_
circumstances surrounding the event, extent of loss or injury,
whether any stolen items were recovered, and whether the incident
was reported to the police.
The NCJISS Classification System
One of the problems facing a data collection and tabulation task
like the FBI's Uniform Crime Re1?orting program (1. e. a program that
depends on the cooperation of thousands of local agencies in order to
succeed), is that such programs are often forced to use classification
systems .that are based upon a few pieces of very basic information
that is likely to be available to, and provided by, cooperating
, ! , \
! U
7
agencies. Therefore the result often is that the classification system
adopted turns out to be one with a few broad categories which are
12 too gross for many analytical purposes. Fortunately, in surveys
of victims it is possible to obtain the information which is required
to construct rather detailed crime classification ~ystems. A portion
of the developmental work preceding the National Crime Panel involved
the conceptualization of a classification system which would utilize
the richer and more complete information about the nature of victimi-
zations which it is possible to obtain when victim surveys are used
to generate the data.
The NCJISS classification system separates criminal victimizations
into three groups: personal, household, and commercial. Personal
victimi~ations are those in which the victim and the offender come
into contact with each other. Household victimizations are those
thefts, not involving personal confrontation, which--in the main--
can be construed as affecting the entire household. Commercial
victimizations are those in which the commercial establishments are
victims. Within each of these three groups, the victimizations
are further divided into a relatively large number of narrowly de-
fined categories; these sub-divisions are made ,using such criteria
as whether the crime was actually completed or was only attempted,
whether a weapon was used, whether (and the extent to which) injuries
and/or losses resulted p etc. Perhaps the primary advantage of such
i
:J j 'j
i
I !

8
a system is that the fine categories can be reconstituted in many
ways to serve a variety of purposes.
In Appendix A the basic building blocks for personal victimiza-
tions have been stratified into ~ of the schemes which it is pos-
sible to construct, given the fine categories available; Appendices
Band C present similar possible schemes for household and commercial
victimizations, respectively.
Standard Error
All of the data presented in this report were obtained from
probability samples of the popula.tion of those 12 years of age and
older and business establishments in each of the eight Impact Cities.
Whenever samples of a population--rather than the entire population--
are studied, a certain amount of sampling error is introduced into
the results. While the size of this error depends on such factors
as the size of the sample and the variability of the population, the
magnitude of the sampling error can, nevertheless, be estimated.
The sample of particular households or business establishments
actually drawn from any Impact City is only one of an extremely
large number of different samples that could have been drawn in that
city. If all possible samples of a given size were drawn from a
population and the sample results were used to estimate the
population value for a particular characteristic, the estimates
from the samples would differ somewhat from each other. These dif
ferences are distributed in a known way, however, and statistical
sampling theory can give an approximation of how much confidence can
be placed in the estimate of a population characteristic which is
9
derived from a sample of a given size. Using a statistic called the
standard error of the estimate we can specify, at a given level of con
fidence, the range within which the value of a population characteris
tic would be expected to fall a given proportion of the time.
For example, in Appendix D, Table D1 shows the estimated total
personal victimization rates per 1,000 population of those 12 years of
age and older for the eight Impact Cities. The estimated standard
error is also given, along with the 95 percent confidence intervals
for each rate. As noted before, the sample drawn from each city was
only one of a great number of possible samples. The confidence inter
vals in Table D1 tell us that, were we to draw a large number of sam
ples in the manner and of the size actually used in each city, our esti
mate of the population rate would be expected to fall within the con-
fidence interval values 95 percent of the time. For example, Table Dl
indicates that we can be about 95 percent certain that the true total
personal victimization rate for Atlanta falls between 62.53 and 55.01,
while the rate obtained from the specific sample taken was 58.77.
Tables Dl, D2, and D3 presented in Appendix D respectively show
confidence intervals for the total personal, household, and business
I
t II
!

10
victimization rates in each of the eight Impact Cities.
These standard errors are included in order to convey the magnitude
of the sampling errors involved. It is possible to use the sampling
errors in tests of statistical significance in order to establish
whether various subgroups of respondents differ "significantly" from
each other in rates of victimization. For a variety of reasons, it
was decided that for the purposes of this summary report, tests of
significance would not be included. First, because of the large samples
of respondents included in the surveys, many differences of little sub-
stantive interest are found to be statistically significant. Second,
because many important variables to be examined age, income, marital
status, type of business -- are po1ychotomous, the number of possible
pairs for r.omparisons of significant differences is very large; merely
to display the significance levels for all comparisons would greatly
expand the bulk of the work. Third, the fact that subcategories of
personal, household, and business victimizations rather than total
personal, household, and business victimizations are used as the
dependent variables, even further multiplies the number of significance
tests that would have to be reported. Fourth, the significance tests
would not be independent; this would be true both within tables and from
one table to the next, owing to the intercorre1ation of the social and
demographic variables under investigation. Thus, repeated tests of
significance -- of the number that would be required herein -- would
J
have little statistical or conceptual meaning. Finally, the primary
purpose of this summary is to present a brief description of the
nature and the extent of victimization; hypothesis testing in the
conventional sense is of secondary interest here.
lOa
In the following chapters the data gathered in the ei~ht Impact
Cities victimization survey will be described and analyzed. With fe~v
exceptions, the results presented herein are sho~m for the eight Impact
Cities in aggregatpd form. A1thougl1 the e-l ~'ht c-lt-le h b t t' 1 - 1 .r. ..... • Ssm., su s an ~a
variation in levels of victimization, patterns of risk factors associated
with victimization and characteristics of incidents were generally found
to be similar across cities. Because of these similarities, it was
deemed desirable to focus on general findings rather than on city
specific findings.
Chapter II presents a discussion of the three major types of
victimization to be considered here -- personal, household, and business
along with a brief description of some of the salient characteristics
of victims. Chapter III is concerned with elements of victimization ,
including the relationship between the victim and the offender, se1f
protective measures taken by the victim, and the extent of hospitaliza
tion. In Chapter IV some characteristics of the incident will be explored.
The final chapter analyzes the phenomenon of non-reporting with regard to
all three types of crimes under consideration. In addition, the final
chapter includes a discussion of the relationship between the victim sur-
vey results and the Uniform Crime Reports of offenses known to the police.
l f f,
i:
Ii , i III
-1
! t
t,j tJ
I

lob
Footnotes
1 The Challenge of Crime in 'a Free Society. A Report by the
President's Commission on Law Enforcement and Administration of Justice. New York: Avon Books (edition), 1968, p. 97.
2The Challenge of Crime in a Free Society. A Report by the President's Commission on Law Enforcement and Administration of Justice. New York: Avon Books (edition), 1968, p. 97.
3In the national survey, each household and business in the survey is interviewed every 6 months on a continuing basis.
4 About $20 million has been allocated to each of these cities by
LEAA to reduce burglary and stranger-to-stranger (i.e. crimes which do not involve relatives, frie s, or persons well known to the victim) homicide, rape, and robbery.
5 . H~ndelang, M. J., An Analxsis of Victimization Survey Results
from the Eight Impact Cities, Law Enforcement Assistance Administration, 1975.
6See San Jose Methods Test of Known Crime Victims: Statistics Technical Report No.1, U.S. Department of Justice, Law Enforcement Assistance Administration, National Institute of Law Enforcement and Criminal Justice, Statistics Division (June 1972); and Richard W. Dodge and Anthony G. Turner, Methodological Foundations for Establishing a National Survey of Victimization, Presented at the 1971 American Statistical Association Meetings in Fort Collins, Colorado - August 23-26, 1971, and sources cited therein.
7It is important to note here that the samples were drawn from within the city boundaries of the eight Impact Cities and hence do not include respondents from suburban areas outside of the city limits.
8See Appendix B for the classification system used to categorize these responses.
9 Also asked of the proxy respondent for each 12 and 13 year old
respondent.
. I
11
10 See Appendix A for the classification system used to categor~ze
these responses. ~
11 See Appendix C for the classification system used to categorizp._
these responses. -
12 ~or example, the published UCR categories do not generally dif
fere~t~ate between atte~pted and completed crimes, Between crimes of v~olence which also ~nvolve theft and those which do not, etc.
. ~
J
~ ,

12
Chapter II
PERSONAL, HOUSEHOLD, AND BUSINESS VICTIMIZATION
f victimization--personal, This chapter examines three major types 0
1 t · to var ,tOUS demographic charachousehold, and business--in re a ~on
h certain identifiable subteristics in order to determine whet er
the population are victimized more often than other subgoups of
groups. The analysis begins with personal victimization.
Personal Victimization
. . are those suffered As the name implies, personal victim~zat~ons
. sense, come into contact by individual victims who, at least ~n some
. include crimes which threaten with the offender. Per90nal victimizat~ons
the victiml (such as assault), or actually result in personal injury to
the victim and takes property from crimes in which an offender confronts
or threat of force, and crimes in the victim's possession by force
taken from the victim's person by stealth (such as which property is
pocket picking).
d that E--ate tables in this report are based It must be stresse
on victimizations rather than incidents. If two people are robbed in
wh4 le only one incident is counted, two victimizaa single incident, ~
thus the number of victimizations must always be tions are counted;
d In discussing personal than the number of inci ents. equal to or larger
13
victimizations it must be clearly understood that it is quite possible
for a single individual to be the victim of a given crime--or for that
matter to be the victim of different crimes--more than once during
the preceding twelve months. Thus it is theoretically possible (though
unlikely given the relative rarity of victimization) f9r the number
of victimizations to exceed the number of persons in a given category.
It should also be noted that the rates of personal victimization pre-
sented below are calculated by dividing the number of victimizations
by the number of persons in the category being discussed. For example,
the personal victimization rates for females use the number of females
(twelve years of age and older) in the population as the base of the
rate. The analysis presents rates per 1,000 units at risk; Le.,
personal victimization rates will be reported per 1,000 persons 12
years of age and older" household victimization rates will be reported
per 1,000 households and business rates per 1,000 businesses. For
convenience, "per 1,000" will not necessarily be repeated in re:porting
each rate.
Table 2.1 shows that in the eight Impact Cities as an aggregate,
total personal victimization occurred at a rate of about 60 per 1,000--
or about one such victimization for every 16 persons. More thelU half
of these victimizations involved assaultive violence without theft;
I I· t,
I I
I l' i :)
}
1

- ------ --- ---
---- ---- ------~
14
t-i "tI 0 0
'tl ,.. "" e:- r:: '" ~ ~ (II
'" II> >1 ~ ~Cl ,..
"" '" 0 .... .... r:: .... (II ,.. .... 0 1'\ ::I g. ::1" ... ::I '" II> 0 .... 0 ....
til ::I r:: ~~ Cl II> !::l rt
~< III ~ iii ~ (II J < ... I'T .... .... ,.. (II 0
H\ .... n ~ I'T (II I'T
::I ~ .... ... .... go (II N 0
'" r:: ... ,.. .... e 0 ::I
~
w > "'" I'T IJ1 ,.., c..> .!"' ....
"'" Cl \Q W N 0 ::I
"'" rt .po '" (7\ til IJ1
~ (7\ W N ;z' \Q .... '" '" N ...
.." ;l
.." 0 >1 (\)
~. C"l .... (D' (7\ N Vl
wO <: -.,J 0 (7\ (II N (XI .... N co .po a (7\ t:I
co .... .... Vl w '.po .... Vl ~ .... -.,J .... W ...... II>
(XI til
I~
"'" t:I
~ (II
-.,J .... "'" a> ~ Vl (XI \Q
"'" (II
(7\ 11 \Q
, ,.., :z: Vl ~ .... IJ1 IJ1 W ...... IJ1 W '" in co
1'\ .... :0;-(7\
N "" '" 0 .... "'" wlJ1 11 (7\ IJ1 <'T .po ...... N
c:> ..... '
N en (7\ ::I
Co
<Il •
"'" ::r N ..... N IJ1 .!" to' IJ1 '" '" '" 0 0
(XI r:: '" ....
'" w t-i:>
000 .po <'TOO (XI
'" 1'1
'" N W 0 ..... (11 ,.., (7\ 00 0 ,.., .p.
'" .p. ,.. \Q
(II
trl III I'T
It en I'T (II 0.
~ en ,.., (II to
'>d (II 1'\
.... 0 0 0
trl"tl .... (11
~r.l I'T § ~to
't:I .... !I> ,.., (') <'TO<
(II t-i Oco ~ .... 11
"'" .... .... (II 0 CO!
'" H\ '" ~ ~ 0 11
0 ..... 0. (U 11 ....., 0
"" "" It) 1'1 .. 0 ::I en .... < .... " I'T
Iii' .... N, Cl I'T .... 0 ::I lD
15
of those personal victimizations involving theft (assaultive violence
with theft and personal theft without injury), about four out of five
did E£! involve injury •
From Table 2.1 it can be seen that total personal victimizations
vary markedly from city to city. While Dallas had the lowest rate of
total personal victimization (47), Denver had a rate (73) which was
more than one, a half times that of Dallas; in fact, in each of the
three major categories of personal victimization shown, the rate'of
victimization experienced in Denver was much greater than that experienced
in Dallas. The table shows clearly that personal victimizations involv-
ing assaultive violence with theft were much less frequent in each of
these cities than were either assaultive violence without theft or
personal theft without injury. Of the eight Impact Cities, Newark had
the lowest rate for assaultive violence without theft (13) and--along
With Baltimore--the highest rate for assaultive violence with theft -(9); Newark also had the highest rate for personal theft without
assault (35). Denver and Portland experienced the highest rates for
assaultive violence without theft, but ranked lower for assaultive
violence with theft, and for personal theft without injury. Overall,
while Table 2.1 shows substantial vari,ability in rates of personal
victimization among the Impact Cities, the general pattern of relatively
low rates of assaultive violence with theft, moderate rates of personal , ,
t .. ::! f
I j
, ~ "

16
theft without injury, and relatively high rates of assaultive violence
without theft, is in evidence. JIn the analyses below, the. re1ation
sh.ip between rates of victimization and characteristics of victims
will be explored in detail.
Family Income And Race
In general, it was found that for both whites and black/others,
rates of personal victimization decreased as family income increased. 2
Among whites, the rate of total personal victimization decreases from
a high of 83 in the under $3,000 category to 51 in the $7,500-$9,999,
but then increases to 59 in the $10,000-$14,999 category, finally
decreasing gradually to 51 in the $25,000 and over category. Among
black/others, the rate of, total personal victimizations decreases
steadily from 72 in the under $3,000 category to 49 in the $15,000-
$ 24,9'99 category, before rising sharply to 64 in the $25,000 and over
category. 3 In spite of this up-swing in the total personal victimiza
tions rate at the highest income level of the black/others, the gener
ally decreasing pattern in the total personal victimizations rate for
black/others is more consistent than is the pattern for whites.
In connection with the race of the victim, it was found that the
rate of assaultive violence without theft for whites was about one
17
and one-half times greater than for black/others, while for personal
theft without injury the rate for black/others was about one and one-
half times greater than the rate for whites. These differences con-
tinue to exist with about the same strength even when income is con
trolled. 4 Furth:~rmore, rates of assaultive vio1el'\ce with theft were
higher for black/others than for whites and h' t ~s also holds generally
across income categories.
In sum among both racial groups, rates of 1 persona victimizations
involving theft generally decreased as J.·ncome . d J.ncrease --except that
the rate for black/others in the higho_.st . .. J.ncome groups showed an up-
turn. For personal theft without injury in particular, black/others
group--J.n fact, black/ had higher rates than whites in each income .
in the higher income groups endured personal theft without
injury at rates comparable to those endured b y whites in the lower
others
income groups. On the th h d _ 0 er an, rates of assaultive victimization
not involving theft were higher for whites than black/others in each
income category and for both whites and black/others rates of assaul
tive violence without theft showed a U-shaped pattern: the
rate in the $7~500 to $9,999 income groups was the lowest and the
rates at the income extremes were higher.

18 .
III tn, =, "'l 0'" Q
n rt 'TJ
'" ~ ~ I'T >'I ~ ~ 01
0<1 'TJ 0 Q ~ \:l
rt
0; 11 01 ::<'
,"- 01 .... 0
(t> Q = 01 ::l I-,J
rt
II' ::<' I-,J
m .... ~
HI ::<'
<: ~
I"> HI '< l"-
n ~ I">
::l I'T
Age is strongly associated with personal victimizat~un. As
Q
~ I">
I"> ::<'
III Q
N = § II' I"> rt
rt b H
0 ::I e. I"> = 0
11
I"> '<
111 .... c:o. ,.... ...... = 1.0.1 ......... '" ,..., ..... (t> 0030 - ,,",1.0.1
.......... - ..., 0 Na-O
03 I.n a-I'T ~-...~
• ~I» Q ~~N ~-"N
\D ..., >'I '"'
1.0.1
0 'J
§ Qo
b" ..... ...... ,..,
0<1 W~ .... '" ,..., I»
w. -..1 .... 0 • N I» Vl ......
- .... 0 ..., \D 0\ .. ..., 0\
>'I O\~N I-'~N N O\-..J
111 -..J '-' 0\ ~""""N I"> W '-" ~ '-"
'J
III
111 "C "C ,.... ..... ...... ~ 1.0.1""" I-' \D .....
N
II> ~030 .. NN w ......
r; .. ""0 ww ..... .. ' V1 0\
\O.......,~ t;~M I» 03""
b" <:> ~'-'~ .... ..., ...... ... ,
0" 11 01 n :>;' ..... ...... ..... ~ 1.0.1,...., ....
1-" I»
I'T I.n 0\ 0 ......... 0 ......
III .. NUl • 1.0.1 I.n
.. 1»0 ~OW . ~-"'N \0 .... '" a ..... N 0'\\0,0.01 M
03 '" . ..., ..., ...,
Table 2.2 showS, total personal victimization peaks in the 16-19 age
group and declines monotonically5 as age increases beyond that point.
The table reveals, however, that the pattern which is shown for total
personal victimizations is determined almost wholly by the pattern for
assaultive violence without theft; while the rate of assaultive vio-
lence without theft for those in the 16-19 year old group was 76 per
1,000, the rate in the 65 or older group was only six per 1,000. It
might be argued that this gulf between victimization rates for the
age extremes reflects, in payt, relatively minor altercations which
are common among adolescents; however, the fact that the assaultive
violence without theft victimization rate in the 25-34 year old group--
..... ..... ..... I-' I-'
1.0.1 ......... ~ ..... 1»..-. O~O .. NJ:'o
.. \n 0 w .... " .. I-'~
~""N ~""""N J:'o<:CO ~"""'N
I.n ...... ...... ...,
an age group well beyond adolescence--was three times greater than that
in the 50-64 year old group and ~ times greater than that in the 65
,... ...... .... ...... N ,....,,.... W ...... I.nWO .. N Vl
...,,..... .. CD 0 "' .... .I!-
.... W
g}-..a M ~~N 0\ .... 0 ~~~
"'" ..., ...,
or older group, indicates that more than simple lIschoolyard" fights
accounts for generally decreasing rates of assaultive violence without ...,
theft victimization as age increases. ...... ...... ...... .......... .... CD ..... I..>NO .. .... 0\
N
.. '" <:> '" '" Vl
• ...... N
0'\ ....... ;-..! ~'"-'N -..JO\O
'" '
.............. N
,'" '-' -..J
'-' '-'
...... ...... N ,.... 0 ..., .... a" ........ .......... I-'
.. 0\0 .. NW I-' ......
-..JOO .. W I.n
0"' ..... I-'",W ..... -..N ~-"'N CD
N ..... '.N!
'J '-' ..., ...,
For those under 35 years of age, theft without injury shows a
pattern similar to--though much less exaggerated than--that of assaultive
violence without theft. The rate of victimization for theft without
injury increased slightly from the 12-15 to the 16-19 year old groups
,j
W
'TJ 0
>- 't:I
:t:g: = I-' .... 01 01 I'T ~ rt ::'1-' !-'o
I-,Jrt 0 \:l ::<'~
~ ~ td HI 01 I'T<: til
I"- (t> 0 .... (I) ::I n ~
\ ...... N W - ..... I.n Vl ..., 03 .... .... 8'--'M I» .... 1 ..., a- .....
CIl I.n , ,
,.... W N 1.0.1 .... - ~ 0 a-..., CP ...,
c" I N ..... N I-'
'" ~ \D ....., CP
...... W I» '" I» .. ~ '" 0 wa--..J I ~ ..... ~ 1.0.1 I»
-J ~ ..., ...,
..... I.n N .... I» - .... .... I.n CD VI CD I' O\ ..... N ~ w 0\ .... ~ ..., 0\
..... 0\ W ./!. CP Vl . ,..... .... U1 I 0", IoU .I!-W'-' N Vl '" W "'" '-' N
...... 0\ ..c- 0\ I.n .. ,...., .... CIl 0 00\ a- I OJ ....... N 0> 0\
'" .... "'" ..., .....
'P ~ .... ,...., .... .... 00\
'" "'" ~ I-'t.n ~ ...... N N ~
0> (I) Q
'-' 0 t'!t'!
1.0.1 ,.., .. N "'" 0 CD
.. ..... I-' <:> "'l J>oO\O 0 >-~~~ ~ I'TO<I
"'" III ~ 'oJ I.n ....
ttl .... 0<1 :::r ,.. g "" '" n ,.. n .... ,.. .... (t> 01 .. >
OQ 0<1
,r; III
1lQ
'" .... III
~ t'l
0, nj
<: H
~ ~
19
t"I 01 I">
r: M ~ Qo
::u '" rt (t> 01
...... 'TJ ~ 11
I-' .. <:> 0 0
'TJ III >'I III Q ::I III
.... N
0< III
'" t'! 1111
0 .... >-
0<1 (t>
0 >'I
0 I-' p. ~ >-f 11 ~ '-'
I-' g; ~
Co t-.>
'tI '" (0 11 n 1\1 ::l .... III
1lQ ~
t:1 .... 01 ,.. >'I ..... C". e ... I"-Q • ::l
0 HI
'TJ (t> 11 01 0 \:l
'" .... <: .... n ... Iii l"-N II> rt I"-0 ::s .. ~ >-
OQ (II
0 Hi
< l"-I') ... l"-e
111
I
I I
I I
I ! " f
1
I I t I
I ! ! t
I I I 1
I I'
r
I,
r ~ t II!
~ I,
I

20
and then decreased gradually with age for the tie:xt two age gr.oups
before leveling off. Assaultive violence with theft shO't~s a similar
general pattern; the rate of assaultive violence with theft victimi
zation was about twice as great in the 20-24 age group as in the 65
and older age group.
Table 2.2 shows not only that the rates--but also the 2atterns--
of personal victimization are strongly related to age. For the four
age groups made up by those 34 years of age and younger, assaultive
violence without theft was the modal personal victimization suffered;
about six out of ten victimizations involved assaultive violence
without theft. For those in the 35-49, 50-64, and 65 and older age
groups the respective percentages of total personal victimizations
which involved assaultive violence without theft are 40 percent,
30 percent, and 20 percent. \~ile assaultive violence with theft
made up a slightly greater percentage of total personal victimizations
in the older age groups than in the younger age groups, theft without
assault constituted a markedly higher proportion of total victimiza-
tions in the three older age groupS (from about one-half to two-
thirds) than in the four younger age groupS (from about one-quarter
These data suggest, then, that as age increases to one-third).
beyond 35 years, personal victimization tends to be directed in
creasingly against the victim's property rather than the victim's
person. In personal victimizations involving younger persons
, ~ l \
,\
U
21
(under 35 years of a ) . ge , assault~ve violence was much more likely to be
an element of the victimization than it was for the personal victimiza-
tions of older persons. Because of the t s rong relationship between the
age of the victim and personal . .. . v~ct~m~zat~on, age was controlled in
the analysis of victimization rates across the demographic attributes
of race and sex.
Race, Sex, And Age
The simultaneous ff e ects of race, sex, and age are examined in
Table 2.3. In terms of rates f t o otal personal victimization, all
four race/sex groups evidence the same general pattern of total per-
sonal victimization rates: an initial peaking in the 16-19 ~ge ~ group
(for all but the non-,~hite females, for w'hom the peak is in the 2C-24
... the rates as age age group), followed by a monotonic decrease 4n
increases. ... t e white males: This pat~ern is most dramat4c among h
the total personal victimization
group to the peak rate of 177 in
rate moves from 145 for the youngest
the 16-19 age groups, followed
by a sharp decline to 28 in the 65 or older age group. The pattern
is most subdued among the black/other females, whose total per-
sonal victimization rate climbs from 41 in the youngest group to
63 in the 20-24 age groups, and declines gradually to 32 in the
ong a our of the race-sex groups, assaultive 65 and older group. Am 11 f
violence without theft contributes very h eavily to this overall pattern.
I 1
r ! I I ! I 1 I
t ! 1
!
r r'
!
I I I ! I'

1\
[ j
!
M N
~ ~
Estimated ,Rates, (Per
Sex of Victim: Female 12-15 ~
Table 2.3
1,000 Persons l2'Ye~rs Of Age Or Older) Of Personal Victimization, By Age, Race And Sex a
Eight Impact Cities: Aggregate
(Continued) VICTIM'S AGE
16-19 20~24 25-34 35-49 50-64 65 Or Age Older Total ...
I Population Base '.
White 89,638 98,258 135,880 183,040 226,441 268,414 229,664 1,231,332 :-0----- 1------ ~----- ~ ..... ---- 1------ r----- 1------ ------Black/Other 85,667 75,813 84,961 126,104 152,~29
~ i. 104,416 58,654 688,547
Assaultive Violence YJith Theft
White 5 4 3 3 3 4 4 4 1------1------ 1---.---- f...--,..-- .J--'---- ----- ----- ------. Black/Other 3 5 5 6' 5 ,5 3 5
Without Theft ·65 73 52 33 14 8 5 26
Whife 1------ r------ ~----- ~------ 1----- ..... 1-----:- ----- ------. B1B.Ck/Other 29 40 32 22 , . 14 9 5 21
Personal Theft Without Injury
White 11 16 15 12 13 17 19 15 r-- ....... ~- ----- ----- f------ ----- ----- l'-- .... -wo-- 1-------
Black/Other 10 16 25 29 30 33 24 25 J
o.
Total Personal Victimization 1 White 81 93 70 ,48 30 29 28 45
~--~ ... - -.,..---- ----- 1---- ...... -- ........... r- ...... --_ .• -..----- ~--- .... -Black/Other 41 61 63· ~7 48 , 47 32 51 . ..
-~~----------- -
a Subcategories may not sum to total due to rounding.
:.',
Table 2.3
Estimated Rates (Per 1,000 Persons 12 Years Of Age Or Older) Of Fersonal VictimizatioR'
By Age, Race And Sex a Eight Impact Cities: Aggregate
CTIM'S AGE 65 Or Age
l2~15 16-19 20-24 25-34 35-49 50-64 Older Total ,~
Sex of Victim: Male
population Base '. White 90,859 89,350 119,531 180,130 199,051 215,022 139,549 1,033,492
!-t----- ~- -_._- ----- r------ ----- r.. ... ---- -----1------
Black/Other 85,004 67,426 59,003 84,143 107,1,22 80,965 43,413 527,076 ".-
Assaultive Violence With Theft
,
White 13 14 7 4 6 7 5 7
\-0----- 1------- ;------- r------ _0 ___ - r------ ----- ------
Black/Other 12 . 18 11 13 15 12 6 10
- - . - --~~: .:..
Withol,1t Theft 86 123 85 51 28 17 7 47
White 1.------- r-- .... --- r------ ~----=--:----,..-- ----- - ---- I- - - - --I
32 60 55 36 15 .. 9 6 30 .. B1B.Ck/Other
Personal Theft lUthout Injury ~ White 46 40 27 19 17 16 16 23
\-0-_ ..... -- ----- ----- f---- ... - ~---- ~-- .... -- 1------ ........ ----:
Black/Other 39 49 33 27 33 32, 23 34
Total Personal Victimization White
145 . 177 119 .74 51 '. L 40 28 77
~ ... -- ... - r-.---"....- ---_ ..... - ......... ..- -----r:---- -.---- ~.:.----
Black/Other 78 120 98, 72 62 , 54 35 74
~
" . .
a Subcategories may not sum to total due to rounding.
~'::""'~::l

24
In fact, among the female groups, assaultive violence with theft shows
little variation by age, and personal theft without injury actually
shows a gr~dual overall increase as age increases. 6 Therefore, among
the two female groups not only did the proportion of total personal
victimizations which was accounted for by personal theft without
injury increase with age~ but the rate of personal theft without
injury victimizations per 1,000 persons also gener~llly increased
with age. For black/other females this increase is marked--rising
from ten in the 12-15 age group to 24 in the 65 or older age group.
Among the two male groups, while the proportion of total personal vic-
timizations which are accounted for by personal theft without injury
also increases with age, the rate of personal theft without injury
victimizations decreases very markedly. From the youngest to the
oldest age groups among black/other males, the rate of personal theft
without injury victimizations decreases from 39 to 23, and among white
males this rate decreases from 46 to 16.
For both sexes, younger whites had total personal victimization
rates which were higher than younger black/others, while older whites
had rates of total personal victimization which were lower than, or
comparable to, those of older black/others. For example, in the 20-~4
age group, white males had a total personal victimization rate of 119
a.nd black/other males had a rate of 98; in the- 35-49 age group, on the
other hand, white males had a rate of 51 and blaCk/other males had a
1 , t
U
rate of 62. Similarly, among females in the 16-19 age
grou~whites had
a total personal victimization rate of 93 and black/others had a rate
of 61; in the 35-49 age group, white females h d a a rate of 30 and
black/other females had a rate of 48.
In general, as age increases, h t e rates for each of the subcate-
gories of personal victimization for ' the four race-sex groups become
more homogenous. F or example, among th 12 15
e - year olds, the highest
(145--for white males) is about
greater than the lowest rate (4i--for black/ other females), while in h
t e 65 and older age group th
rate of total personal victimization
three and one-half times
e highest rate (35--for black males) is 0 1
n y one and one-quarter times greater than
white males and white females). This the lowest rate (28--for
pattern holds with about the same strength for assaultive Violence
with theft. Thus as age increases, racial and
sexual differences appear to be less important i
n accounting for variability in rates of personal victimization.
Finally with respect to race and sex it
zations which involve an assaultive violence ~an be noted that in victimi-
component, differences in the rates of victimization
across sex are somewhat more k mar ed than are differences across race.
Marital Status
Tab Ie 2. 4 shows that persons who were never marri.ed or who were
25
I I I , I
J
/,
r l' i t,
/;
Ii U I; I,
26
! g rt
QI
5
1
rt o rt o rt \Il I-'
Il-~ (1)
IT 0
t1 0
§ ll-
~ :JQ
o-l 0 rt \Il I-'
>ti (II 11 10 0 ::I
"" ..... <: ~ n .... lr .... N
~ b :;:l
'4 0
U>
'"
'" 0
.I>-N
\J'! 0
>ti (II
'"' Ul 0 ::I PI I-'
o-l ::r (II ,." .... ~ ,... .... ::r 0 ~ .... H 3-~ 11 '<
N co
I
I-' VI
W Q)
N VI
I-' ....
> >ti 10 0 co "0 .~ j:.
i£ :E:I-' PI I-'ort rt
g.tt ~ .... 0 ::r
0 (II :;:l ~ o-l
t:d rt ::r<: (II ,... PI HlO Ul o-l .... 1-' (II ::r
(II (II ,." ::I .... n
(1)
I-'
0 .... VI (Xl .J>. .;:- -I-'
VI .....
l-'
-J N .z;.. 0 """ \Q
.l>-VI co
I
U> I-' VI
.I>- t-' N ~ VI
-..j
0
U> N
I-' U> 0 ...,
0 ct\ N·
t-' Q)
N t-' U> ..... N I-' \J'!
/:'j QI .... [ .... (II Po
~ .... no tI> .,.z
s;'(11
'"' < t1 (1) .... t1
.-. "" ~
(II Il- ....
a 0 0
is t1 t1 .... (II ll-
tilT::)
~tt "" 0 H H PI n .... (11 (II P. Po -.
~ ~ P. 0 .: (II P.
>ti M 11>
~ t:d 1J ~
::r '< 0 rt :l: ;
~ HPI a H I-'
~ "0 ~ N
~tr>< til rt I-' no
~ PI o til 11
........ co c::
.... "" til ........ 0 (1) ~ HI
0 a> 10 tr:( •• >
>OQ <: ::l (II H >1')..0 C') gg > H o-l
~ MOIl (0 (II 0
OIl \Ill-' PI I').. rt (1) (II t1 ....,
0 ... .... z II> 0 ~ .... ::I> !ttl>
n 11> H
"" (II
'"' en 0 ::I PI t-'
I <: ~ n IT
~ 1-'0 N go .... 1-'0 0 ::I
o-l
~ I-' (1)
l" .I:-
I i
t , 1 ...,.
M I - ------~~- -
27
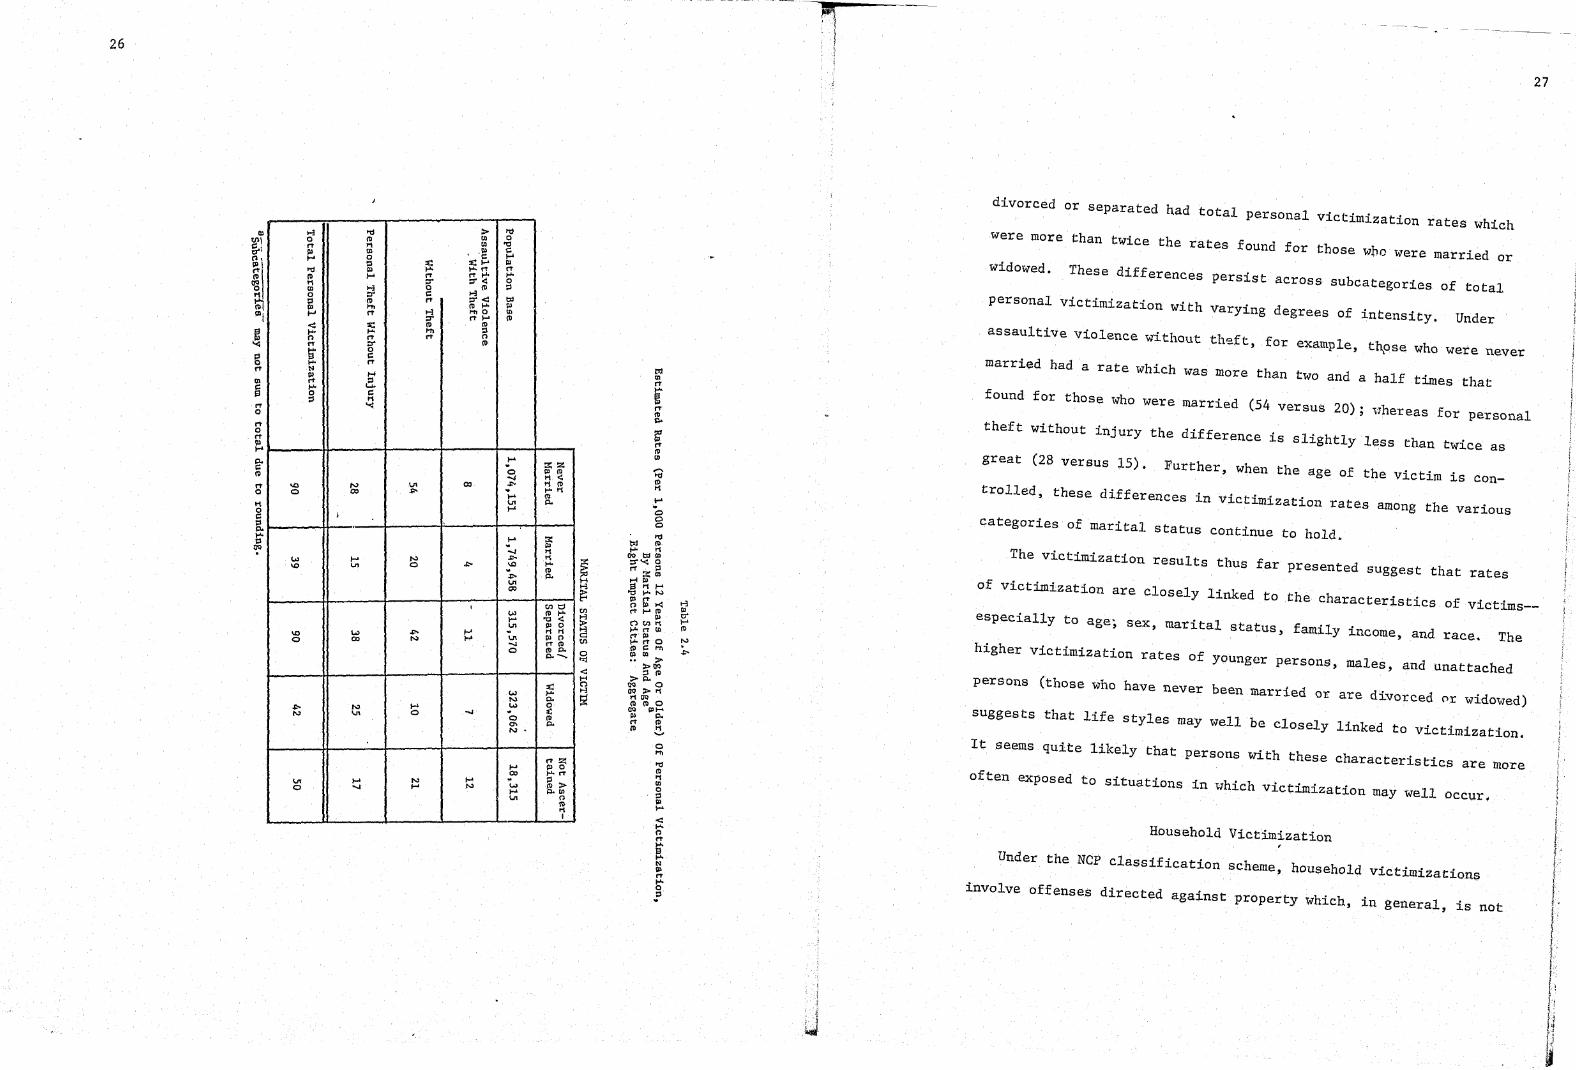
divorced or separated had total personal victimization rates which
were more than twice the rates found for those wbo were married or
widowed. These differences persist across subcategories of total
personal victimization with varying degrees of intensity. Under
assaultive violence without theft, for example, thpse who were never
married had a rate which was more than two and a half times that
found for those who were married (54 versus 20); whereas for personal
theft without injury the difference is slightly less than twice as
great (28 versus 15). Further, when the age of the victim is Con-
trolled, these differences in victimization rates among the various
categories of marital status continue to hold.
The victimization results thus far presented suggest that rates
of victimization are closely linked to the characteristics of victims--
especially to age; sex, marital status, family income, and race. The
higher Victimization rates of younger persons, males, and unattached
persons (those who have never been married or are divorced pr widowed)
suggests that life styles may well be closely linked to victimization.
It seems quite likely that persons with these characteristics are more
often exposed to situations in which victimization may well occur •
Household Victimization
Under the NCP classification scheme, household victimizations
involve offenses directed against property which, in general, is not
j I )

f' 29 I 28
II> , III ~ C 0 f 0' rt 0 ~ <: t"' II> .... It> '" 0'
rt ::r ~ c It>
It> :r: .... Ii Ii Ii
OIl 0 n n OIl
0 C .... It> ..... 0
Ii '" It> ~ ~ 1"11
.... g. Ii
It> ...; '< :x: CD 0 ::r 0
! ..... It>
C p.. 1"11 '" <: "
It> ::r
0 .... 0
n \l: 0 " " ~'
(Il
(Il .... § N
I»
" rt ....
0 0
" 0
0 ... I» ..... p.. C
" It>
" I-'
.e- N I-' VI >
0 OJ N ..... " I.n \0 '" '" .. I-'
Ii VI I-' 0 I»
0 '" 0 C
..... " 0 I»
p..
I I I
I I· ~ I \
I ! !
til CD
" i " It> p..
go;
" It> (Il
under the direct physical control of the owner; thus, in household J
victimizations, the owner of the property is not typically confronted
by the offender. According to the definition used here, if the victim-
ization is to be classified as a household victimization, the owner
must suffer no injury or threat of injury if, during the victimization,
the owner comes upon the offender. If force i.s used or threatened in .... ~ . N txI
.l!- N \:: OJ I»
0 t,.> \JI ~ I-'
0 \,J1 j,.. rt 0 '" ~ I-' ..... 0
Ii It>
""' '" It> Ii
..... 0
t<lo ~o
order to enable the offender to complete the offense or flee, the crime
becomes a personal victimization.
n N .....
"" N I-' w ~ ..... ..... .0
N '" /:: N It>
"" ~ ..... 0 III ~ :::
p..
::r:x: "0 c \i'; ...;
'tl::r ~ I» 0 ..... ("'~ Ito" It> " ,0" co N n-..; .... I.rt "0 .... 1"11 It> co :r:
Thus, household victimizations are distinguished from personal
victimizations in two ways: a) the former always involve some form
of theft or attempted theft; b) the former cannot involve a personal
N t::1 \,J1 W I-'
OJ I»
..... N ~ I-'
I.n ~ ~ ~ I-' ~ ..... W I»
~ CD OJ
I-' t:l
Q\ ~ ~ \0 It>
W ,:,. N :- ~ ..... ,:,. \0 OJ '" It> I-' Ii \JI
I-' Z N I-' ..... 0 It>
OJ W Q\ ~
0 ..... N N . 0 W ...... Ii
~ ?i" I-'
0 c II) It> ::r 0
\l: <: h " ~ N I»
" b' c~
confrontation between the victim and the offender during the commis-
sion of the crime in which force is either used or threatened against
the victim. In addition, household incidents are those which for the
most part, can be constl~ed as affecting the entire household rather
than indiv:!.dual household members. In household victimizations there
is no need to distinguish between incidents and victimizations. since
~ '11 0
the household is considered to be the victim.
Table 2.5 shows that the estimated total household victimization I.n W I-' ..... W "" Ii
W ~ OJ \JI .. " OJ ..... ..... .....
0 I»
"" ::s P-
I-' III
W N I-' I,() ~
Q) ~ :' I,() ..... ..... N S ..... \JI .....
0 C OJ ....
) CD
rate was 465 per 1,000 households, for the twelve-mQnth period covered
by the survey. That is, in the eight Impact Cities as an aggregate
there was about one household victimization for every two households.
t' > "" N .... \JI ...;~ '" .c-
I,()
\JI .... OJ t,.> .!-" o I't ..... ..... " It> "" 1»00
0 ""'Ill '" " It> greater than the total rate of victimizations of persons which was
Clearly, the total rate of victimizations of households was substantially

30
noted in the previous section. d victimizations were accounted
About 60 percent of the househol t b vehicle theft.
O percent by burglary, and ten percen y for by larceny, 3
" d h"c1e thefts were dwarfed by larcenies, Even though burglarLes an ve L
one burglary for every eight households and more than
there was more than households during a twelve month period.
one vehicle theft for every 25
2. 5 that the rates ~f househoU victimiIt is clear from Table
In terms of burglary, zation varied dramatically from city to city.
f 161, with Denver (158), Portland (151) Atlanta is highest with a rate a
b h " d For vehicle theft, on the and Dallas (147) clustered close e Ln .
Cleveland's rate (76) was more than half again as great
other hand,
(47) and Denver (44), the cities with the as the rates in St. Louis
t . hic1e theft rates, respectively; at the second and third greatesve
(24) and Atlanta (29) had relatively small rates other extreme, Dallas
of vehicle theft.
Race And Family Income -- ~s controlled (Table 2.6), households in the When family income ~
aggregate headed by black/others in every income category
eight city category had a total household victimization
except the $25~000 or more
h 1 greater than households headed by rate which was at least slig t Y ~-~~~
the total household victimizawhites. In the lowest income category
while that for whites was 303; tic~ rate for black/others was 324,
the rate for the former was . the $10 000 to $14,999 category, l.n ,
..
, , , W
31
605, while the rate for the latter was 574; but in the highest income
group, the rate for the black/others was 723 while the rate for the
whites was 796.
When the particular subcategories of household victimization in
Table 2.6 are examined, burglary shows the same pattern evidenced for
total household victimization--the rate for black/other households is
greater than the rate for white households in every income group except
the highest. In the five lowest income groups, in fact, the burglary
rate for black/other households was about half again as great as the
burglary rate for white households. For those with incomes under $3,000,
the black/other burglary rate was 168 and the white burglary rate was
109. Differences of similar magnitude and in the same direction were
found for the $7,500-9,999 income group (161 vs. 118) and for the
$15,000-24,999 gr9up (197 vs. 140). In the highest income category
the burglary rate for whites exceeded that for black/others (198 vs.
185).
For larceny in the eight city aggregate, whites in each income
category had rates which exceeded those of black/others in the same
income category. These racial differences--while not as great in
relative terms as the burglary rate differences--show that in each in-
come category the rates for whites were about one-third greater than
the rates for black/others. For example, in the lowest income bracket
white households had a larceny rate of 176 and black/other households
had a larceny rate of 135; in the highest income category, the rate
for the former was 561 and the rate for the latter was 449.
\ .-
!

32 III
CI.I >-i 0 g.
n III ... IV
011 0
rt <: r-' III III .... IV
11 ;:r 0 It1 .... m n 0 ,.... c:: '< !II IV
11 ... IV
. g. .. 1 0 ::f
!II .... ID C. !'<\
! rt <: ... n
tl 0 rt
rt I ~
til fj ... 0
... 0 tr
~
.... b:l t;Q N t;Q .... .... '" .... III III ... '" n 0 n ....
\II;' \II;' \II;' 0 --tl~ --- ~ --- 0 ~ 0 0 I'T I'T .... g. ;:r .... ;:r ....
I'T (1l I'T ID I'T ~ ID 11 III 11 ID
~ IV :1 I I ... 0
11 ,0
c:: tl Ilo ... ~
I .... w'w ~II-' .... \.oJ "-oJ ~18 o \0 1.11 I'" I I ','
f I , 0,1 I I 'j N N -I'- ....
ll:!l ~
-I'- "" W 0
N W I w ""11.n I I I
I , I I '( w . ~ I -I'- N N co I.n "'" Cl I.n 0 .....
,IJ) I "'" I I , .. I I
I I I W "" ~ I '" o:>l~ ~ I' g
-.oJ 0 ' 1.11, ~ N \:II
I I 0' I . I
I I I' C\ I '0' ~I "'"
. co IJ) "-oJ \0 I.n
W 0' ,IJ) I Q'\ ~Io
I I I , J I I -.II ~ I.n .....
col \.oJ ~I Q\ '" \0 co .... "" I Q'\ '" I I I I I I I ~I a-I I-' N w
w e: I N IJ) l.n w a-..... 1 ~ a-
I I I
I I
I N I -1'-1 w ::-
~I ~ 1 ..... -..J W a-
::-"-oJ -.II w
I I
-Z §
~ .,. ~
011 .... 0 III H'I
~ ::e 0 c:: en g. 0 I-' c. en
t;Q t;Q .... I-' III III n n \II;' \II;'
--- "-~ ~ 0 0
I'T g. .... .... ~ ... I'T ~ (1l ID
I .... I I-' 1-'1 .... N 0'
-.oJ N
gjl~ v
l~ a-co 0 -I'-
I I "'I I
\;;1 J N co .... -I'- \0
~ I .. ..... w I 0 0' \0 N
I I.n W
I I I : I .... ,
'" w ..... I-' 1.11 Ib ~ I I-' ·co 0: N
( 1.11
I "'" '
I f N
.... 1 .... 0' I-'
~l co
~l N N ..... Q\
I.n J \0
I I ",I I-'
I-' \0 ~I ..... "-oJ
~ ~ I 0 '" 0 0' I.n
J Q\ Q'\
I , I I J,.. ..... W ~ E" '" ~I '0 co
N
'I Q'\ Q'\
t. I
i ",I .... .... N N
~I ~I -'" 0 lit 0 a-, 0 0
I 0'
I
",I ,..... I 0
00 .... l.n ~l .... bl v N I-' N 0 w I "'j N
-<h we:: v tl 00.. OlD 011
«J> ..... w .. . .&:-00 \00 \0 ? .
<t> ~ .:fJ ... '" H \0'" E< '" 0 \00
H I Z n 0
I f;; -0>
0 ........ "", ~o v v \00 <:, \00 H
n .\0 ? >-l
Ii! -<I>
N"" ~l.n . . \00 \00 \00
I
<t> o N 11 l.n
:3::0 o 0
~ 11
:> en 0
~ z I'T 0 Dl ... .... tl ID c.
>-l 0 I'T Dl I-'
, .l
r'1' 14 t ~
I
Eight-City aggregate vehicle theft rates show a pattern essen-
tially similar to that shown for burglary--in most income categories,
the rate for black/others exceeded that for whites. Only in the low-
est income group (where the black/other and white rates were nearly
identical) is this difference not clear. Beginning with the $3,000-
7,499 income category, the rates for black/others (43) and whites
(35) are discrepant and, as income increases, this discrepancy inten-sifies.
33
In sum, these data show that in the Impact Cities as an aggregate,
whites in each income category had rates of victimization by larceny
in excess of those for black/others; on the other hand, black/others
in most income categories had rates of burglary and vehicle theft vic-
timization which exceeded those of their white counterparts. Among
both whites and black/others, rates of victimization by larceny, bur-
glary, and vehicle theft generally increase with income; the gradient
for rates of larceny in both racial groups is especially steep. Con-
sequently, the proportion of total household victimizations in each racial
group which is accounted for by the larceny rate increases with income.
Age Of Head Of Household
An analYSis of data not shown in tabular form reveals that rates
of total household victimization are strongly related to the age of
the head of household. The total household victimization rate declines
; ,

34
steadily from 665 in the 12-19 age group to 595 in the 35-49 age
t'he total household victimization rate then declines steeply
group;
to 393 in the 50-64 year old group, and even more steeply to 172 in
the oldest group.
An examination of the subcategories of household victimization
show that, with few exceptions, the pattern observed above for total
household victimization is discernable in the subcategories. Rates
of burglary were relatively homogeneous for heads of households whose
ages fell into the 12-19, 20-34, and 35-49 age groups; in these groups
the respective rates of burglary were 194, 182, and 159. For the
50-64 year old age group, the burglary rate fell substantially (to
116) and, in the oldest age group, the burglary rate fell dramatically
to 69. Thus the burglary rate for households headed by those over 65
years of age was only slightly greater than one-third that of the
householdS headed by those in the 12-19 year old age groups.
For rates of larceny, the difference between the l;xtreme age
groups w'as even more pronounced; the larceny rate in the younges t
group (430) was nearly five times that in the oldest gJ:'oup (91).
As was the case for the total household victimization rate and the
burglary rate, households headed by those 50-64 years of age, and
h 65 Of age and older, had rates of larceny especially by t ose years
at levels which were clearly distinguished from those in the younger
n t' 35 \ 1
. , 1 i .
age groups. Finally, before leaving the rates of larceny, it should
be noted that--unlike the burglary rate and the total household vic-
timization rate--the larceny rate is not observed to decline mono-
tonically as the age of the head of household increases; after drop
ping from 430 in the youngest group to 375 in the 20~34 year old
group, the 1arceilY rate rises slightly to 385 in the 35-49 year old
group, before dropping steeply to 240 in the 50-64 year old group.
Rates of vehicle theft also fail to show a perfect decreasing
pattern as age increases. The rate climbs from 41 in the 12-19
age group to 57 in the 20-34 age grQUp, from which it falls to 51
in the 35-49 age group; from this point the vehicle theft rate de-
creases markedly to 36 in the 50-64 year old group, before plummeting
to 13 in the oldest group. Once again, the two oldest age cohorts
show rates which are clearly lower than those of the bulk of younger
respondents. 7
Business Victimization
Business victimizations which fell into the scope of the survey
were limited to burglary and robbery. Larcenies--either in the form
of employee theft or shop1ifting--and other crimes such as malicious
destruction of property were not deemed feasible for study in the
survey. 8
..

36
I
In business victimizations, as in household victimizations, there
is no need to distinguish between incidents and victimizations since
the business is construed to be the victim. Thus, regardless of the
number of employees who are confronted in a single robbery, the ~
ness has suffered one incident and one victimization. If an employee
or customer is robbed of his (her) own personal property or injured in
the course of the business victimization, the individual has indeed
been victimized as well as the business. However, such victimizations
of individuals are picked up in the household portion of the survey
and counted as personal victimizations, and hence are not of central
concern here. The point is that one business victimization is counted
when the business is robbed (or burglarized) regardless of the number 9
of employees who may have been confronted by the offenders.
necause the business is construed as the victim in all business
victimizations, rates of business burglary and robbery are reported
in this chapter as rates per 1,000 businesses.
Table .2.7 shows the rates of burglary and robbery of business
victimizations in each of the eight Impact Cities. The rates of
burglary and robbery--especially the latter--vary considerably from
city to city. Dallas, Portland, and Cleveland all experienced 370
or fewer burglaries per 1,000 business establisbments. At the other
extreme, businesses in St. Louis and Baltimore experienced 530 or more--
~ t ~ Ii i I I . I
i /; !
po en' ~ ~. , 0" 0 n' n pol ~ ~! n O<l 0 0 111 m .... III III CD 11
I n .... a ~ ~ < :I ....
0 n n n
'" ~ m ....
N po
n rt 0 ....
0 rt 0
:I
rt III .... Po ~ III
rt .., 0 0
11 0
0
S Po
~ ~ ..... ....
0
.I>-
.I:-0
.I:-0 0
\J1 0 0
..... w 0
.I:-0 0
C7\ N 0
\J1 ..... 0
37
!:Z:
~ ~ 0 ~
~ III III ~
c' c:
11 '" c' fl)
O<l .... .... ::l 11 II> '<
fl) 11 01 '< 01
fl)
'"
t'l
> to rt
1'</' .... n ..... 0 .... ~ 0\ .I:-0
II> 0 -.J :I
II> n
0 n III 0 II> Po
g' rt
III III
W ~ 01
.... \J1 .I>- rt "'"' .po (XI ~ 0 0 '" 'tl III
0 0 11 0 11
(l) ... 0
n 0 0 .... t'<l
W W III
(XI ... '<
0 ..... . III 0 0 I-'
0 II> 0 P
Po
.... III 00 a c' III n b t;' ro ~
III 0' 'tI III I-' II> III (1) n Ul n '-' N
.l:- t:! n 0 ~ \J1
CJJ '" ~ '" ~
.... ,." n
0 0 '" I-' 0 II>
.... txt III a
0 '" III 01
~ fl) CD III
1'</ t:! III .po
\J1 \J1 II>
.po ~ 0 0 N 0 II> 0 11
a 11
0<1 I-' II>
~ Ei Po ... '"
... !:Z: .., ~ 0 w ~
0 0 N 01 0 1'1 0 ~
~ 0' r" ' c' III 11 '<
II>
I'd 0
W 1'</ 11
.p-N rt
'" . I-' 0 0 0 II>
0 :I 0 Po
CIl N ~ """ \J1 .., W w t"'
0 0 0 0 0 a ....
'" >
N t-3~ .l:-
N w o Ii .., (XI "II>
0 0 '" ~~ (XI 0 " III

38
and those in Atlanta 740--burgla~ies per 1,000 businesses. In terms
of rates of business robberies portland, Dallas, and Cleveland are
joined by Den.ver to make ltp the cities with rates under 90, while
the rate in Baltimore is more than half again as large--and the rate
in Atlanta more than twice as large--as that in any of these four cities
with the lowest rates. The four cities with the lowest burglary rates
were also the four cities with the lowest robbery rates. In each of
the eight cities the burglary rate ,\Tas more than four times greater
than the robbery rate; in fact, for the eight Impact Cities as an
aggregate, the burglary rate was more than five times the robbery rate.
What characteristics of businesses are associated with high
rates of business victimization? Table 2.8 addresses this question.
From this table it can be seen that rates of burglary were highest
for retail businesses (630) and next highest for manufacturing
businesses (550). "Other" businesses, wholesale businesses, real
estate businesses, and service businesses all showed similar and sub-
stantially lower rates of burglary victimization; for every t~n busi-
nesses in these categories about four burglaries occurred during the
twelve-month period.
By examining the rates of robbery shown in this table, it can
be seen that only for retail businesses was the rate of robbery above
that for total businesses. While there were 180 robberies for every
~ \ 1 \ I ,
I I ~
\ \
~r-----Ir-----,------r-~
50 n \l)
" &g o 11 ..... til III
! =' o
" III
~
" o rt o lJ I-'
g-r---tt---+----J---'---til
" o 11 o
"" o lJ1 o V1
§ p..
~r_----~~-----+------+----L---J DQ
11
'" " til III
,.... 1-' ...... ....,~I-'
w ex:> 0 000 N'-'N lJ1
'>oJ
,..... 0\...., w lJ1 '" C)'IlJ1lJ1 cnO:N! 0 ...... ~
U> o lJ1
N N ...... 0\ cx:> o
'"" \l) 3: n III " ;::J (: (: 11 I ..... ;::J
DQ
39

40
1,000 retail business establisruments, there were 50 or fewer robberies
for every 1,000 businesses in each of the remaining categories of
businesses; real estate businesses had an especially small robbery
r~te--there were only ten robberies for every 1,000 businesses in
this category. In toto, retail establishments had a combined burglary
and robbery rate which was about 40 percent greater than the rate for
the type of business (manufacturing) next most likely to be victimized
(810 vs. 580). Further, it is also clear from Table 2.8 that the ~ of business
is closely associated not only with the rates of both burglary and
robbery, but also with the "miX" of robberies and burglaries suffered.
Of the estimated 126,000 burglaries and robberies suffered by total
businesses, Table 2.8 shoWS that 85 percent were burglaries and 15 per-
cent were robberies. However, some types of businesses show percentages
substantially discrepant from these overall figures. Retail businesses
suffered the highest percentage of robbery victimizations (22 percent)
victimizations suffered, the next highest percentages of these combined
incurred by any type of business. In fact, of all robbery and burglary
victimizations which were made up by robberies w'ere 11 percent for
service businesses and ten percent for wholesale businesses; at the
other extreme, only one percent of the robbery and burglary victimi-
zations suffered by real estate businesses were robberies. Hence retail
. ' .
41
establishments not only had by f ar the highest rates of burglary and
robbery, but also the highest proportion of total victimizations
which were robbery victimizations.
Hultiple Victimization
As the Table 2.7 indicated , the 224,000 busines~es ~n the ... eight
Impact Cities suffered a total of about 126,000 burglaries and
robberies. Alth ough the overall business victimization rate was 570,
this does not indicate that 57 ___ percent of the businesses were victi-
mized; that is, some of the businesses were victimized more than once
during the reference period.
From data which do not appear h ere, it was found that of the
224,000 businesses of all types, 59,000 were victims of either burglary
or robbery during the twelve-month period. . Thus, while the rate of
business victimization was 570 for ttl b o a usinesses only 26 percent
(59,000/224,000) of all b . ' us~nesses we~e victimized. I n terms of the
percentage of businesses victimized , retail businesses again headed
the list (36 percent), while "other" (21 ) percent, service (21 percent),
and wholesale (22 ) percent businesses fell at the bottom.
In addition, three out of ten businesses which had been vic~
t:i:m.ized, had been victimized more than once by burglary or robbery
during the twelve.-month period,' f urther, about half of these multiple
victims had their business robbed or burglarized three or more times •

42
, i d businesses which were multiple victims The proportion of vict~ ze
of t hree for retail and \lather" businesses to one varies from one out
out of six for real estate businesses.
£f i burglary only, 75 percent Finally, of those businesses su er ng
were victimized once, 13 percent twice, and 12 percent three or more
h businesses suffering robbery only, 85 percent were times; for t ose
were victimized twice, and five percent victimized once, ten percent
were victimized three or more times. For each type of business, multi-
ple victimization by roboery 10
ization by burglary only.
only was less likely than multiple victim-
focused on rates of victimization and The discussion so far has
of the Vl.'ctims of personal, household, and business characteristics
Varl.'ations in rates of victimization have been found victimizations.
to be associated with numerous characteristics of the victims. In the
characteristics of the victimization events will be des-next chapter,
. uely suited. cribed and analyzed--a task for which victim surveys are unl.q
Footnotes
lSpecifically excluded is murder.
2 f respondents in each racial group, family For about one out 0 ten
income was not a,scertained.
M i I I "
3 It should be noted that a relatively small proportion 5 per-
cent) of black/others have incomes in excess of $25,000; the reliability of the estimated rate for this group is less than that of other rates in the total personal victimization row.
4The only reversal was for total personal victimization in the under $3,000 category, where the rate for black/others was only slightly larger than the rate for whites (35 vs. 31). l
5
43
The term IImonotonic" defines a strictly linear relatinn.c;hin hp..tween two variables in which the dependent variable is a continuously increasing or decreasing function of the independent variable x. Thus, a plot of the regression line of Y on X would be a straight line with no curvature. C.f. tests of linearity in a basic statistics text, e.g. Fundamental Statistics, McGra'v-Hill, 1951, p. 294.
6 Although the data are not shown, this gradual increase in per-
sonal theft without injury is largely accounted for by purse snatch and attempted purse snatch, two subcategories of personal theft without injury.
7The analysis further found that households headed by 12-19 year olds--the group showing the next lowest rate of vehicle theft victimization--constituted 2 percent ,o,f_ the households headed by persons under 50 years of age. For the remaining 98 percent of the households headed by persons under 50--namely those headed by persons 20-49--the rate of vehicle theft was nearly half again as great as the rate for those in the 50-64 year old group.
8 In fact, pilot work indicated that many businesses did not keep
sa tisfactory written records of burglaries and robberies they had suffered.
9It should also be made clear here that qlthough injury tOt or personal robbery of, an employee or customer in the course of a business robbery is counted as a personal victimization, there is not a double counting of the business inCident; care has been taken to count such incidents only once.
100f course, none of those businesses suffering both robbery and burglary were victimized only once.

44
Chapter III
CHARACTERISTICS tF THE VICTIMIZATION EVENT
This chapter examines such characteristics as the relationship
between the victim and the offender, the extent of self-protective
measures taken by the victims during the victimization, and the
extent of hospitalization required to recover from p~rsonal injury.
Personal Victimization
The Victim-Offender Relationship
This section addresses the question of whether the victim and the
offender were known to each other prior to the victimization. In con-
nection with each v'ictimization, victims were asked: "Was the person
(offender) someone you knew or was he a stranger?" For purposes of
analysis strangers were considered to be those offenders whom the vic
tims had never seen before, whom the victims knew by sight only,l or
whom the victims did not even know whether they were strangers or not.
In cases where there were multiple offenders, only if the victim did
not know any of them--or if the victim did not know whether he or she
knew ~ny of them--were the offenders classified as strangers.
In the Impact Cities, four out of five total personal victimizations
involved strangers. An examination ofche major subcategories of personal
45
victimization revealed that there is substantial variation in the
proportions of these victimizations involving strangers. While nearly
19 out of 20 acts of personal theft without injury were committed by
strangers, considerably fewer acts of assaultive violence without theft
(about two out of three) were committed by strangers. Thus, in each
of the three major subcategories of personal victimizati~n a large
majority of the ':'ictimizations involved strangers.
In general, when theft was involved in the victimization, the
clffender was substantially less likely to have been known to the
victim than when theft was not involved.
While the dat~, ~re not shown here, the victim-offender relationship
wat. furth,er examin,..:c along the dimensions of the race and sex of the
victim. This analysis revealed that the race-sex combinations int'ensifY
the heterogeneity in the proportions of assaultive violence without theft
victimizations which involved non-strangers. While only one-quarter of
such victimizations among white males involved non-strangers, about
one-third of these victimizations among white females and black/other
males, and just under one-half among black/other females involved non-
strangers. Within each racial group, victimizations of females involving
assaultive violence without theft were more likely than similar victimi-
zations of males to have been committed by offenders known to the victim.
Within each sex group, assaultive violence without, theft victimizations
of b1uck/ others wel:e more likely than assaultive violence without theft

46
victimizations of whites to have been committed by offenders known to
the victim.
Relationship Between Age Of Offender(s) And Age Of Victim
The data for single and multiple offenders are consistent in
indicating that there is a tendency for offenders to have assaultive
encounters (not involving theft) disproportionately with persons from
their own age group. In victimizations involving theft, younger of-
fenders were slightly more likely to victimize older persons while
older offenders only rarely victimized younger persons. Furthermore,
those offenders who were perceived to be under 21 years of age were
disproportionately found among multiple offenders.
Relationship Between Race Of Offender(s) And Race Of Victim
From Table 3.1 it can be seen that for total personal victimiza-
tions, while 19 out of 20 black/other victims were victimized by lone
offenders whose race was perceived to be black/other, about 13 out of
20 white victims were victimized by lone offenders whose race was per-
ceived to be white. Analyzed from the perspective of the perceived
race of the offender, these same data for total personal victimizations
show that t=>r lone offenders whose race was perceived to be white, 95
percent of their victims were also white, but for lone offenders whose
race was perceived to be black/other, only 56 percent of their victims
ri' o
,....
s ~ :l o rr
ri' o
,.., 0 rr 1\1 I-'
1.111-' "" 0 0\ ~ 0-1>-~NM 0 .....,
".... W 1-'1-' wOW \000\ ONN 0
"""
,...,. 001-'1-' \,COO
w 00 O"\NN 0\ 0 .....,
,.., o M III I-'
-oi;;";J:: g~~ -11 11>
M'r."o.. Illw
ljltj"z 011>0 ~!,"rt
,-. -I>- "" ~ a> 1.11 lrI~~ 0 0 .....,
....... !~ N
v l.11 l.11 IJ'!;-..!!M 0 0 '-'
,-... I-' 0\ 0
w .... 0 O~M 0 0 .....,
47
::<l (\) I-' III rt .... 0 p (I) ::r .... 'tl
t:c 11>
~ 11> 11> P ,.., ::r 11>
'tl 11> 11 (> (\)
~ 11> p..
£' 0 (\)
0 HI
t-' 0 P
t1'jfD
.... > (JQ P :rp.. rt!:( HC S I-'
~ 11' ,.., O'tl III rtl-' 0-(")fD I-'
.... 0 fD
MH\ W .... ,." fD fD ,..... <n ::I ., p..
ft)
>~ (JQ OQ> 11 ::I fD p..
'l:l,.., NO' It> fD
: 0 (\)
tl1":1":10 0 HI
> > I-' I-' ,..,.
01-' I-' ::r rt fD :rt:c 51 11> I-' 11 1\1 t-'<
0 rt
<: .... (>
f 11> rt
\:i' (;l I"T III H ,....
W ,...,.
.1-' 1.11 1.11 t-;> 51 t-;>W\O
::I 'tl
:J:I-' C 'tl
w ..,.N O~N
CON t-'<
\0 J-I~M rt
0 C'I 11> 0 ....., '-'
,.... t:c t-;> ,..., 0000-1>-
I-' I-' ~ \00> w 0\ 00
J)ooiN!it'I! 0\
\OiJ'.eN ;>;"
0 -I>- ......
'-' 0 0 ....., rt
:r (\) Ii
III 11 (I) 0 ::I III I-'
<: t-'< 1'1 I"T
\:i' t-'< N III I"T t-'< 0
I-'(\) rr 11 .... <0 'tl 0 1-'::1 III III
<: I-'
0 H m<: (") mt-'< ,.., III (>
S! ::I rr "' .... .; (\) S 11 t-'<
~ <0 N
III rt
C'.l t-'< tl1 0
II ::I <0
,-... ,..... V1 I-' N I-' ,.., \00\0 ""NO 0
1\1
0\0 w .... 0 rt V1iN!~ ~~O'-J! III C\ 0 ,..... 0 0 ....., '-'

48
were also black/other. These/patterns do not vary substantially across
the subcategories of personal victimization; however for lone offenders
whose race was perceived to be white, 11 percent of the victims of rob-
bery without injury and personal larceny (as compared to five percent
of the victims of total personal victimization) were black/o~her.
Let us noW focus on the races of the victim and the multiple of-
fenders, considering for the moment only those victimizations in which
the races of the offenders were perceived to be either all white or
all black/other. Table 3.1 shows that in about nine out of ten of
these personal victimizations, black/other victims were victimized by
offenders all of whose races were perceived to be black/other; on the
other hand, in only about four out of ten of these personal victimizations
were whites victimized by offenders whose races are all perceived to be
white.
From the perspective of the perceived race of the multiple offenders,
these data present a similar image. When the races of the multiple of-
fenders were all perceived to be black/other, abvut half of the victim~
of total personal victimizations were also black/other. When the mul
tiple offenders were all perceived to be white, more than 90 percent
of the victims of total personal victimizations were also white. Finally,
when the races of multiple offenders were perceived to be mixed, three
out of four of the victims of total personal victimizations were white.
,
\
I
\ L I < j ,
\
yTithin each of
total personal
the multiple offender racial groups, the findings for
victimizations essentially hold for the subcategories
of personal victimization. H owever, analysis of the subcategories
shows that when the offenders were all perceived to be black/other,
the half
49
for
proportion of whHe victims ranges,from slightly less than
robbery without injury and assaultive violence with theft ) to slight-
ly more than three out of five for assaultive violence without theft.
In their entirety, these data for single and multiple offenders
show that black/other victims of personal crimes were overwhelmingly
victimized by offenders whose races were perceived to be black/other,
and white victims of personal crimes were just as likely to have been
victimized by offenders whose races were perceived to be black/other
as by offenders whose races were perceived to be white. This holds
for every major subcategory of victimization except assaultive vio
lence without theft ,committed by lone offenders against white victims ,
in which case a substantial . . (72 maJor1ty percent) of the offenders were
perceived to be white.
It is worth noting that of those personal victimizations involving
lone white offenders and "all white" multiple offenders, just less than
two out of three of these victimizations (44,500 out of 68,000) are
accounted for by lone offenders; of those personal victimizations in
volving lone black/other offenders and "all black/other" mUltiple offen-

50
Personal victimizations (57,530 out of
ders, fewer than half of these 1 black/other offenders. Therefore,
117,070) are accounted for by otj.e who were perceived to be under 21 years of age
just as those offenders found among the multiple offenders, so too
were disproportionately . ed to be black/other.
offenders whose races were perce~v are those
victimization also collected data on The NCP sUrVeys of business
the perceptions of business robbery victims regarding the race and age
of offender(s). the findings for personal victimization
Congruent with
offenders involved in business robberies noted above, the majority of
2 were perceived to be black.
b 'ess 1. ' seven out of ten us~n For ex amp e, ~n
offenders, the race of the lone offender robberies which involved lone
Similarly, eight out of ten bus:i.n(-.':;S robwas perceived to be black.
offenders involved offenders who were beries which involved multiple
all perceived to be black. d of the offender
d ' the perceive race Several observations regar ~ng
that these reflect ~erceptions of d I t must be stress ed are in or ere
has not been adequately hoW <>ccurate these perceptions are
victims; ...
note that in the NCP survey--and in It is also important to studied.
S 'h Amerih Census Bureau counts pan~s-its decennial censuses as well--t e
, ' may be mis--h'tes It is quite possible that some v~ct~s
cans among w ~ •
taking Spanish-American offenders for black/others or simply that some
If this were victims classify Spanish-American as other than white.
51
happening, the effect would, of course, be to inflate the proportion of
offenders \vho were perceived to be black/others.
Self-Protective Measures Taken
During the course of their interviews, victims were asked whether
they did anything to protect themselves or their property in the course
of the victimization, and, if so, what protective measures were taken.
Table 3.2 shows that self-protective measures were taken in about one-
half of all personal victimizations. It is readily apparent from this
table that the extent and nature of self-protective measures taken vary
according to the type of victimization. Self-protective measures are
more likely to be used to fend off assaultive violence (assaultive
violence with theft and assaultive violence without theft) than ~o re-
tain one's property in the absence of personal assault (robbery without
injury and personal larceny). While one-half to three-fifths of the
victims of assaultive violence took self-protective measures, only
one-fifth to two-fifths of the victims of robbery without injury and
persona11arceny took. such measures. It is quite probable that (among
other things) both the nature of the victimization and the circumstances
surrounding it are likely to account for variations in self-protective
measures taken. It should not be surprising that personal larceny, which
relies more on stealth than on force, should provoke relatively few
j".
t

52
r1 o
I
1
I ' I ~ I'
I I I
53
victims to take self-protective measures. Likewise, robbery without
injury, while it uses the threat of force, so often uses the threat
of dead12 force (i.e. a gun) that it is not surprising that few vic-
tims resist by using self-protective measures.
In personal victimizations the most common self-protective
measure taken was to hit, kick, or scratch the offender (34 percent),
followed by leaving the scene (27 percent), "other" (19 percent),
yelling for help (14 percent), reasoning with the offender (12 percent)J
and holding on to property (five percent). It should be noted paren-
thetica1ly that the fact that these percentages SUm to 119 percent in-
dicates that as many as one-fifth of the victims of personal crimes
who took self-protective measures, took more than one measure.
Just as the extent of self-protective measures taken varied ac-
cording to the nature of the victimization, so did the nature of self-
protective measures taken. Among those who used self-protective mea-
sures, hitting the offender was used by a majority (61 percent) of
victims of assaultive violence with theft, but only a small minority
of victims of personal larceny (13 percent); yelling for help, on the
other hand, was used by more than one-third of the victims of per-
sonal larceny, but by only one-tenth of the victims of assaultive
violence without theft; running away from the scene Was used by one-
quarter of the victims of robbe·ry without injury but only by one-eighth

55 54
of the victims of personal larceny and assaultive violence with theft;
holding on to property was used by one-third of the victims of personal tf.I g. n 00 rr ID
~ P-(I) CD
a ~ 1:1 0
" CD
til " 0
" 0
" 00
1
~
Po r: It>
1 ' ,.. 0
11 0
l : [ ~
()Q
I" , r I I
I I
I
la;rceny but only by one-tenth of the victims of robbery without injury
and assaultive violence with theft.
A strong overall relationship between the age of the victim and
the extent of self-protective measures taken is evident in Table 3.3.
For total personal victimizations, while 56 percent of the 12-19 year
old victims and 57 percent of the 20-34 year old victims used self-
protective measures, only 40 percent of the 50-64 year old victims and
30 percent of the victims 65 years of age and older used self-protective
measures. These overall variations are almost entirely determined by
age variations in self-protective measures used in assaultive violence
victimizations, especially those involving theft; variations are less
marked for assaultive violence without theft and robbery without injury,
and virtually non-existent for personal larceny. It can also be noted
from Table 3.3 that in every age category the proportion of victims who
~ H '" r; 0 Il> rt III
1"\ 01 CD ~ 1"- C
'" ::I ""'
~ 00 rt
""' ~ CD 1-3 0 ::r-
(I)
::l (I) <: 00 HI
""' rt t; <: ~ ""' .... ~~
(I)
n t" ~ ~g M' III o::r ~ 1"\
.... ....(1) 0'0 I"t n O'C:: ::r a:-.... Il> ~" 0
til ~ c:: ~ 00 '<st ,.. rt .... Il>
0 ..... 1-3 HI
l:l ~ ::r rt Il> HI M'
...... ,.... t 0-. ,-., I-'
co W In ...... r:; .. In .. I» .. t In
N 0\ 0>01:' ~ 0\ 0\ ,
VlO"S ./:'~ ~0'4 01» I».p. I-'
0 0 w~ t.A0'4 '" '-' 0 0 ....,. '-'" '-' ....,.
...... ,.... S ..... ..... C; "....,
0 ~ In "'" ./:' In N
1'>3 ..... ..
""' .. 01:' .. 0\ .. 0\ 0
1'>3 \0 lnln 1'>3 ..... HI-' N~ \O~ ~~ S~ co~
I
0 .e w
'-' 0 ./:'
'-" ..... .....
...... ...... w ...... 0
,..., I:::l ~
W 0\ co .. ,j:- .. N .. ,j:- " VI .. ,j:-
VI
COV1 NN ~~ ./:'-.1 010
I
\O~ ~~ ,j:-
0 ~~ Wil"l \0
~ '-' '-' ° ..." '-'
C/l (I)
""' HI I
~ 0 rt III n M'
~ III
~'" (I) ID
'" t1 01 n tr.I c:: (1) .... 1"\::1 ~~rt rt t:'
d .... HOI III .§ Il> rt
""" 00 .... >-3 nHO' l'l r1'::S~ 0'
(')"' .... I-' I"'-roO Il> rt 1"\ ;:I W I"'- 01 III
W Il> 0
~ ~ .-,j
>I-'~ IJQ <: '"i ~h':r IIIrtlD
~~d rt ,... 01
<: ID til (1)
t-I III :l (') ::r..,. 1-3
Ii! 0 ::I CD
en .. b;I
g; '< t'l ~ .
III
i; III 0 ttl
1-3
used self-protective measures was greater in assaultive victimizations
than in personal theft without injury.
........ N ...... ...... ,... ...... I.J1 ..... 0\ .....
.!',j:-In
.. ,j:- .. N .. W In 0\0 I-'N co "oJ 0\ 0\ o./"
0 , ~~ ~~ o~ ln~ ~~ 0'1
0 0 ,j:-
'"'" '-" '-' '-" '-"'
::r III
<: I"'-n r1'
~ f
Additional analysis of data which are not shown here reveals sub-
stantial differences among age groups in the nature of the self-
,... 00'1
C; ...... ...... ,-, ..-. l;:ln
V1 W 1'>3 ""' Il> 0 .. U> .. N .. W .. ,j:-..... 0 O\N \.>.IN
\.>.I t1 t1 ..... t-< \0 0>
O~ I-'il"l coO'-!! ..... N ~iJ'2 0 0 0 0 ..." ...... ..... ..... '-"
protective measures used. For total personal victimizations, for
example, as age increases, there is a decreasing tendency for the

56
vic.tims who took self-protective meaSures to have hit the offender or I
left the scene, and an increasing tendency to have yelled for help ~nd
to have held on to one's property. In spec.ific categories of victimiza-
tion these relationships generally maintain and, in many cases, intelt-
sify.
In assaultive violence ,.;rith theft, 70 percent of the victims who
used self-protective measures in the youngest age group, 62 percent in
the 35-49 age group, and 47 percent in the oldest age group hit the
offender as a self-protective measure. A similar pattern is evident
for assaultive violence without theft, ,v-here 41 percent of the youngest
victims, but only 13 percent of the oldest victims who used self-
protect:ive measures hit the offender as a self-protective measure.
Also, for assaultive violence without theft, as age increases, there
is a generally increasing propensity for victims who used self-urotec
tive tr~easures to have tried to reason \vith the offender--rising from
one in t~ ... elve in the youngest group to one in four in the oldest group.
For robbery without injury, the youngest victims tv-ho used self-
protective measures were more likely than the oldest to have run away
from the scene (33 percent vs. 15 percent) and less likely to have
yelled for help (eight percent vs. 31 percent). For personal lar-
ceny, the oldest victims who used self-protective measures were more
~ I r
! ' I 57
likely than the youngest victims to have held on to their property
(47 percent VS. 29 percent) and to have yelled for help (44 percent
vs. 20 percent).
Finally, the use of self-protective measures was also examined
in relation to the race and the sex of the victim. The data on self-
protective measures by sex of the victim show that male victims of
total personal victimizations were about as likely as female victims
of total personal victimizations to use some self-protective measure
(52 percent vs. 50 percent). However, of those who used self-protec-
tive measures, male victims were more likely to have hit, kicked, pr
scratched the offender (39 percent vs. 29 percent), while female vic-
tims were more likely to have yelled for help (26 percent vs. four percent).
Turning to self-protective measures by race of the victim, the
data show that white victims were more likely than black/other victims
to have used self-protective measures (56 percent vSo 42 percent). An
examination of the subcategories of personal victimization, however,
shows that the difference is largely a consequence of the fact that
whites were disproportionately victims of assaultive violence without
theft--the victimization most likely to have evoked self-protective
measures among victims of both races.
Among those victims using self-protective measures, whites and
black/others show remarkably similar percent distribution of type of

58
self-protective measures employed fpr total personal 7ictimization
and for each of the subcategories of personal victimization as well.
Injury Resulting Iti Hospital Treatment
All of the respondents who reported having been attacked were
also asked whether they were injured to the extent that they needed
medical attention after the attack; if such attention was required,
respondents were ~sked whether they received any treatment at a
hospital, and, if so, the length of their hospital stay during treat-
ment. Since by definition, victims of personal theft without injury
could not have sustained injuries requiring medical attention, the
analyses herein will be restricted to those victims of assaultive vio-
lence with theft and assaultive violence without theft.
The extent of injuries suffered in assaultive victimizations is
reflected in Table 3.4. For those victimizations involving both as-
sault and theft, about two out of five victims were injured to the
extent that they required medical attention,3 while for assaultive
violence without theft, only about one in ten victims were so injured.
The~efore, when theft was involved, injury w~s about four times as
likely as when it ~as not involved in an assaultive victimization.
As noted above, all injured victims were asked whether they re-
ceived treatment at a hospital. From Table 3.4, it can be seen that
! ::l o ... CD
~
" o ... o ... III .... go '" ... o Ii o
& i
. ..:: .... rt P" o-,! P"
'" ..., ..
l= !"' I-' N 0
,... I-' J'> .... WI-' V1N 0 '"'
'"' I-' I'll-'
0 WO V1N 0
'""
,... J'> o>N .... 1-' ON "'"
,... ..... .... '" .... " ON ......
,..,. N co N ON ......
,..., N NN ON '-'
,... .... CD .... ON .....
,..., "'CD WN 8
"...
t; .... .ea-<!
,... N NN ON .....,
> CD CD III s: ....
~ ... ~
" (11 P"
<: ~ ....
0
'" .... ..., '" rt P 0 (11
N .0 V1 0 0
,... co .... NO ...... N 0 '-'
,..... COl-'
0 NO ...... N 0 '-'
,... ,l-' ........ N ..... ON '-'
,... IJI . Wo> ",l.n .s~
".... .... CD I» ON .....
,-.. I-' CDN 8 N
,..., w N .... ON '-'
"... ",CD V1N 0 ......
,... I-' ....... oN """
..... NO oN '-'
59
<: .... o-,! o 0 rt ..
tt~ til
0 HH>'<:l
3. o-,! ~ s: 0 0 1"1 rt '" '" III P g. .......
,
~b'o-,! 0 .... 0 M'Crt
H a ttl1lll "' .... til g.
c 1"1 '<
> P .,.
F;;;:: rtn> n> Po:>:: P .... 0 M'O ......
~ " n> P rt
01-' P 0 ....
= lfW o n> a~ On> P P .... 0 '<'<
:tj 00' p CD' '" ",,'
t:I~ ~~
l'1g .... "" 0'0 .... P"" !"till H .... 8 o-,!
"" 1"1 Col (11
~ o III "g nn> .... .... P '" "n-.... '-" '" I'd fA n> .... .. 0
(11
>tt OQ .'"
'fir '-"'" t:I;:' III M' '<Il> '" I-'
C'lQ. 1"1
'" H OQ P III rt'<l
'" n> 11 fA 0
~ ..,.:tj .1-' I 0
...... '" t:li:l. III rt '<til III I-'
<: .... 0
" ~ tI III
co t:loir .el 'i.gJ to :3: ...
... .... 0 P III
III 0 ... 11 III n>1-'
>t:I:xl III III 0 0'< '" n>"''O 1"1 .... n:>::rt III 0 III .... M'I-' P n> c. ... en H 0 >t 10 n> 11 :>:: III nOrt III n- E ,.... n> p. P tU, rt Po'

60
injured victims of assaultive violence v~ith theft and assaultive
violence without theft received si~ilar hospital treatment. About
one out of five victims who were injured received no hospital medi
cal attention, slightly more than three out of five received only
room treatment at a hospital, and one out of six had a emergency
f i ht r longer Regarding hospital stays, hospital stay 0 overn go.
half of those who stayed in the hospital overnight or longer--or
of all 4nJ'ured victims--stayed in the hospital about eight percent ~
eight days or more.
With respect to business robberies, the data show that injury
d ' less than one out of ten victimizations and to employees occurre ~n
that injury to employees serious enough to require hospitalization
w'as very rare. In only tw'O percent of business robberies was an
employee inJured seriously enough to require hospitalization.
~Iroperty Loss And Recovery
Most o:E the victims of theft-related victimizations were involved
in personal theft without injury rather than in assaultive violence _/.
with theft. Further, data not shot;>m here indicate that in each of
these major subcategories of personal victimization more than two-
thir.ds of the victims did, in fact, suffer property loss. For those
having property stolen, the value of the property stolen in assau1-
\
f
I I 11 I ' I
t~'
----~~----- ~- - - ~-----
61
tive violence with theft and personal theft without injury is similar.
In more than one-half of the theft victimizations in which there
was some loss, the estimated value of the stolen property was less
than $50, in another 15 percent of the victimizations the estimated
value was between $50 and $99, and in only about six'percent of the
victimizations was the estimated value of the property stolen worth
$250 or more; in about ten percent of the victimizations, the esti-
mated value of the property stolen was not ascertainable, and in
only one percent of the victimizations was the estimated value of
the stolen property categorized as "none.,,4
In theft victimizations whites had property actually stolen in
a smaller proportion of ~ictimizations than did black/others. In
assaultive violence with t~eft, 63 percent of the white victims
and 73 percent of the black/other victims had property stolen,
while in personal theft without injury 63 percent of the white vic
tims and 78 percent of the black/other victims had property stolen.
Not only were white victims less 1~ke1y than black/other victims
to have had property stolen, but the property stolen from whites
had a somewhat smaller estimated value than did the property stolen
from black/others. Iu assaultive violence with theft, the property
stolen from whites was valued at less than $50 in 58 percent of -,

62
the victimizations and that stolen from black/others was valued at
less than $50 in 45 percent of the ~ictimizations. For personal
theft without injury, the comparable figures for whites and black/
others were 63 percent and 54 percent, respectively. Among neither
racial group was loss of $250 or more very extensive--about one out
of sixteen victims in each racial group had property worth $250 or
more stolen.
Property stolen from victims in the course of personal victimi-
zations may be recovered through the efforts of the victim, the
police, or the victim's insurance company. Data not shown in tabu-
lar form indicate that when some property stolen in a personal
victimization (or its replacement value) was recovered, the method
h . 1n less than one out of ten re-of recovery was throug ~nsurance ~
coveries; in the remaining cases, the property was recovered through
some "other!! means such as the efforts of the victim or the police.
In four out of five personal theft victimizations, none of the
. d Th1s low rate of recovery was similar property stolen ~s recovere. ~
for victimizations categorized as assaultive violence with theft
and personal theft without injury.
Data which are not presented here in tabular form show that as
the value of the property stolen increases, so does the proportion
of losses in which there was either full or partial recovery.
63
- ; , )
i Especially striking is the difference between the proportion of losses
of $1,000 or more, and the proportion of losses of less than $1,000
which result in full or partial recovery. For theft victimizations
suffered by whites, 24 percent of all losses, but 64 percent of losses ,
of $1,000 or more, resulted in full or partial recovery. Similarly
for black/others, 17 percent of all losses, but 52 percent of all
losses of $1,000 or more, resulted in full or partial recovery. This
large difference in the recovery rate for losses of $1,000 or more
holds for each type of theft and for each racial group. Such large
differences in the rate of recovery might be expected for several rea-
sons. Very valuable property is likely to be insured, and if insured,
the victim would be almost certain to file a claim to collect for the
loss. Very valuab~e personal property--especially rings, watches,
bracelets, necklaces, etc.-- is likely to be unique, and hence, rela-
tively easily identifiable. Finally, when very valuable property is
stolen, especially the victim, but even the police, would be motivated
to invest the effort required to search for the goods and/or the thief.
By way of summary, the majority of theft-related personal victim-
izations result in property losses (including cash) of less than
$50. In comparison to whites, black/other victims are, in general,
more likely to have property stolen--and when property is stolen to

Burglary
Larceny
Vehicle Theft
'I:able 3.5
aValue Of Froperty Stolen In Household Victimizations, By Race Of Head
Eight Impact Cities: Aggregate
VALUE OF STOLEN PROPERTY
·ijone $1-9 $10-49 $50-99 $100-249 $250-999
1% ax 22% 15% 21% 217-
White (460) (~,S50) (18,680) (12,260) (17,640) (11,280) --- ------------ ---
Black-Other Or. 47- 13X 137- 22% 347-(230) (2,060) (7,550) (7,630); (12,760) (1~;710)
17. 24% 39% 16% 12% 4% (2,140) (74,730) (122,030) (50,090) (38,110) (13,040) .
"White l-- _.------- I-- -- - -- I-- -I
Black-Other 1% In: 40:r. 20% 12% 47. {I, 240) (17,530) (41,760) {20,390} (12,430) (4,120)
Or. 07. 1% 2% 11% 457-
White (40) (100) e19O) (430) (2,920) (12,320) --- ---~-- --- _-J,. _ ---Black:-Other 9% 0% lit U 7% 41X
(0) (30) (180) (180) (1,350) (7,730)
Total Household Incidents 1% 19% 337. 15i. 147- 10i. (2,670) (81,660) (140,880) (62.780) (58,670) (42,670)
White --- ~-~...........-- --- --- -'-- ---~% 11% 27% 16% 15% 187-
Black-Other (1,490) (19,610) (49.490) (28,370) (26,580) . (31,610) ~
a . Suo categories may not s~ to total due to rounding.
$1,000 or Not
More Ascertained Total
a% 4% 100% (7,000) (3,210» (83,360)
--- '--- ---9% 5% 100r. (5.340) (2.97.0~) (56,190)
17- 3% lo0r. (1,880) (10,930) (313,030)
--- --- ---1i. 5% 100% (650) (5) 330) (103,430)
397- 3% 100r. (10.710) (800) (27,500) --- -- - ---457. 5% 100r. (a ,460) • (950) (18,880)
-5?' 4% 100% (19,590) (14,950) (423,900; -----~ r-- -:--8i. 5% 1007. (14,460) (8.930) (180,560)
~".""t' ........ ,.,. .. "" .,,'. ..."eo" ..... n •• '~.'~: ••• --.:.~~~':J
·..,.

66
was accounted for by different losses in burglaries. White victims
of burglary had property worth less than $50 stolen in 31 percent
of the victimizat:i.ons while the comparable figure for black/others
was 17 percent; white victims of burglary had property worth more
than $250 stolen in 29 percent of the victimizations, while for
black/others the figure is 43 percent. No such differences are
evident for larceny or vehicle theft. In larcenies, about three
out of five victimizations in each racial group resulted in property
of less than $50 being stolen, while only about one out of 20 lar-
ceny victimi~ations in each racial group resulted in property of
$250 or more being stolen. Likewise, only about 14 percent of the
white and nine percent of the black/other vehicle thefts resulted
in property of less than $250 being stolen.
In household victimizations in which property was stolen, victims
may have recovered some or all of the property itself, or some or
all of the value of the property through insurance. The data (not
presented here in tabular form) show that partial or full recovery
of property stolen was realized in one-quarter of the household vic-
timizations. The percentage) however, varied dramatically across
the three major subcategories of household victimization. In only
20 percent of the larcenies an~ in only 24 percent of the burglaries,
but in 83 percent of the vehicle theft~ was some recovery realized.
: i
; !
\ .
, . , 1 ; \
67
It is clear from Table 3.6 that--for each major type of house-
hold victi~mization--there is a monotonic increase in the proportion
of victimizations resulting in recovery, as the value of the property
stolen increases. As for differences between racial groups, they
are small for vehicle theft and larceny but more apparent for bur-
glary. Twenty-nine percent of all white households, but only 17
percent of all black/other households which were Victimized by bur-
glary realized some recovery. In the larger loss categories this
racial difference was even more pronounced. While 40 percent of the
white households suffering burglarie's in which the losses were $250-
$999 recovered some of the value of the property stolen, only 15
percent of their black/other counterparts were as fortunate; for
burglaries of items worth $1,000 or more, 58 percent of the white
households, but only 33 percent of the blaCk/other households,
recovered some property.
One reason for the race differential in property recovery is
suggested by the examination of the data along the dimension of in
surance coverage. Although the data are not presented here, black/
other households which were victiluized by burglary and larceny
recovered property stolen in these crimes through insurance propor
tionately less often than white households. For burglary, 60 percent
of the white households but only 38 percent ~f th.e black/other house-

to \0
0'\ '-D
"0 'U I Q) Q) Q) .1-1 .1-1 Q) ,....., ,....., I-! 'H !:l 00 I \0 ::l ..c: 0 m en Q) Q) .c ,....., a en .1-1 Q) ,....., .,-i 0 t1I a Q) en ..c: Q) I-! t1I I-! I-! .1-1 .1-1 0
:>. I-! 'U Q) .1-1 ..c: 00 Q) >. 00 0 (J
I-! s:: -rl .1-1 en Q) .c I-! s:: CIl .;J t1I co Q) tI) t1I I-! 00 Q) ,....., .c m til 'M P. ..-I
~ u til 00 'H 00 0 0 ,....., ..c: I-! "0 ~ 0 s:: ,....., Q) 0 en ~ I-! bO u t1I Q) "0 tJ Q) 0'\ bO ,....., 00 Q) I-! ,....., U CIl Q) 'U -;r I-! +J +J s:: "0 ;::j U bO t1I CIl +J I-! ..-I N ;::j 'H s:: s:: ..-I 'H s:: ,0 en I-! l3 ..c: t1I
(J I ,0 0 Q) Q). 00 0 t1I 0 ;::j OM .jJ l3 t1I s:: a (J "0 ::l ,....., ,J:l +J 'M
'M IJ') ~ Q) 00 H .,-i .c en en en 00 ;i .jJ
.a <l)- I-! CIl Q) tJ Q) Q) til en \I') Q) 00 tJ Q) .w
~ 00 p. s:: ,....., orf ..-I 0 .w a Q)
;::j ..c: 4-1 til .,-i t1I I-! I-! ,....., s:: a m 00 til +J 0 'H 0 ..;t +J Q) t1I ;:3 a Q) s::
0 I-! ,....., (V) Q) 0 .c ,....., 4-1 0 00 m Q) 4-1 til 0 ..c: +J .c bO 0 @ ..;t s:: 00
"0 s:: 0 Q) +J s:: ;i +J 0 . I-! a .,-i Q) t1I 0 00 ;1 a .,-i 'H I-! Q) ;:3 +J ..-I s:: 00 l3 -rl s:: m 0 a 4-1 0 I-! ,0 § H "0 ·rf Q)
.jJ Q) 0 a "0 0'\ 0 Q) 0 t1I "0 Q) 00 00 .. m .1-1 ,....., Q) Q) -;r 00 ..c: l3 4-1 0 ,....., Q) u !:l 00 aJ N s:: ..-I .jJ N +J Q) +J 0 ~
,....., +J ,....., .c Q) ;:3 'M 'H ~ 0 <I)- ,....., I s:: ..-I I-! 0 t1I ;:3 s:: ,....., .;:i 0 ;:3 a aJ I-! 4-1 0 llJ "0 ~ 00 0 OM t1I :>. 'l-l 00 11) tJ Q) 0 § Q) aJ +J 00 ~ +J +J ..c: ,....., 0 aJ <l)- I-! .c a ..c: s:: +J I-! ;:3
tJ ;:3 .1-1 P l-l Q) .c "0 11) ,....., +J -rl (Jl 00 ,.c :>. 'M 0 4-1 0 00 p.. 0 I-! N 0 <II a I-! +J :> oM aJ 00 00 I-! 'M <I)- ~ ..c: :>. a m ,....., I-! I-! 'H 00 aJ +J ..-I ..c: .1-1 ,....., § 11) ,....., t1I aJ 00 ;::j I Q) (Jl en s:: N Q) +J 4-1 aJ ·rf +J ,I)- ,....., +J P. 00 0 llJ I-! 0 00 Q) ..c: I 0 ~ ~ 00 0 0 0 Q) 'l-l s:: ~
,....., aJ "0 P +J Q) 'M 0 'H 'U .1-1 I-! P 0 s:: .,-i 'M s:: 00 .1-1 P (J en 0 p. oM P 'M tJ 'H 0 Q) m 0 aJ s:: I-!
00 00 .. I-! .,-i (Jl P QJ 0 00 ,....., 'M aJ 00 00 0 0 QJ ;::j QJ a 0 ;:3 .,-i I-! en QJ .w I-! 00 00 'M 'H S I=Q I-! oM 11) "0 .c 0 ..c: aJ 0 I-! tJ 0 Q) 0 ,....., 0 Q) I-! <I)- a aJ Q) IS .1-1 I-! ,....., P S .~ rl rl 00 ~ m tr'\ .1-1 cd ..c: 'H 0 aJ ;:3 'M I-!
0 ,....., m N ,....., .1-1 I-! -rl. S P ..c: 'n til 00 m s m
"0 tJ bO <I)- ;:3 +J 0 4-1 ..-I +J P ::l aJ QJ QJ I-! ..c: 00 0 'H I I-! 0 'H .c QJ a >. I-! p:< ::l .1-1 4-1 aJ +J 0 a aJ 0 "0 s:: (J s 11)
aJ . ,0 0 I-! 11) P aJ aJ aJ ,....., aJ ~ Q) "0 00 'H +J N 0 a .w ~ P l3 t1I 'U s:: ,....., 0 (J
~ m tI) en 00 0 p <I)- 11) ,....., 'M 'M +J QJ t1I bO (J P til Q) QJ Q) aJ >. N ::l I-! 0 .1-1 ,r:: P aJ t1I aJ ,....., (Jl til til (J "0 ,....., <I)- 00 >. "0 (J +J t1I +J 'H I-! I-! 00 P 00 00 aJ k P P Q) ,....., Q) ,~ 00
::l til oM 'H 0 Q) 'M Q) m 0 4-1 I-! P I-! t1I I-! Q)
..c: (''l 0 til 0 ,....., s:: I-! p.. 0 'M QJ 0 .).J I-! m (J p H ;::j 'H Q) .. Q) 00 t1I "0 00 ~ til 0
'M 'M ,0 00 ;i 00 .c a til ,....., en Q) .jJ °rf t1I QJ S s:: 'S Q) ::l .c ..;:t .1-1 ..-I Q) til I-! til OM
.c: p tI) .c 0 s:: § 00 til Q) s:: til s:: 4-1 bO H til en p:< s:: Q) 00 Q) t) 0 aJ (Jl til 0 00
til ::l 0 .c: ,....., ..-I "0 0 s:: tJ bO QJ Q) "0 0 ,....., +J t1I OM ,....., 'M I-! OM ..c: 00 'M ,....., I-! 0 P +J a (J 00 aJ Q) I-! .1-1 00 +J 0 ..c: I-! p Q) 0 11) s:: s:: ::l k m Q) -rl 0 or!
..c: .1-1 P-< 'M .1-1 .1-1 <l)- 'M 'M ..0 t1I .0 ~ ,....., u
'!rf41'~1! ~"by' ","r 'M'" b""'rl '3'> -t. 1.\'" "..... .C'f'-' ')'"'-1 ~-:~":~N--'~'~~-::~.
Burglary
Larceny
Vehicle THeft
Table 3.6
Percentages of Household Victimizations in Hhich There W<\s Partial Or Full Recovery, By Value of Property Stolen and Race of Heada
Eight Impact Cities: Aggrpgate
VALUE OF STOLEN PROPERTY
$1,000 or $1-49 $50-99 $100-249 $250-999 More
12% 20r. 31% 40% 58% White (25,530) (12,260) (17 ,640) (17,280) (7,000)
t--- r--.-- ------1---10% 9% 11% 157- 33%
Black/Other (9,610) (7,830) (12.760) (19,710) (5,340)
137- 24% 34% 36% 42% White (196,770) (50,090) (38,110) (13 ,040) (1,880) ---~-- ---- --- ---
9% 121. 14% 177- 267-Black/Other '(59,290) (20,390) (12,430) (4,120) (650)
507- 17% 80r. 82% 90% White (290) (430) {2,920} (12,320) (10,710) - ~--. --- ~-- ~-- ---
20r. 72% 577- 78i. 87% Black/Other (210) (180) (1,350) (1,730) (8,460) - -
Total Household Incidents 13% 23% 35% 51? 74% White (222,540) (62,780) (58,670) (42,670) (19,590) --- ------ ------
9% 12% 15% 31% 64% Black/Other (69,100) (28,370) (26,580) (31,610) (14,460)
Not Ascertained Total
63% 29% I
(3,210) (82,900) I , --- ---
72% 17% (2,670) (57,960)
757- 20% (10,930) (310,890) --- -----
74% 14% (5,330) (102,190) ;
i
75% 84% (800) (27,460) , --- ---
79% 80% (950) (18,880)
72% 267-(14,950) (421,230) --- ---
747- 22% (8,930) (179,070) --&
Excludes those cases where the value of stolen property wss "none "; subcategories may not sum to total due to rounding.
\

70
robberies with an estimated mean loss of $390 resulted in an esti-
mated total loss of seven million dollars to businesses in the Impact
Cities in a single year. Thus total dollar losses in burglary
were roughly seven times greater than total dollar losses in robbery.
Even for "other" businesses which suffered substantially greater
mean losses for robbery than for burglary, the total losses in
burglary were far greater than the total losses in robbery ($4.0
million vs. $1.5 million).
For both burglary and robbery, as the value of the losses in-
creased, there was a monotonic increase in the proportion of busi-
nesses recovering some of their losses through insurance. For
example, in both burglaries and robberies in which the losses were
less than $10, none of the victimized businesses recovered any of
their losses, but for victimizations in which losses were $1,000
or more; more than one-quarter of the burglarized bUsinesses and
two-fifths of the robbed businesses recovered some of their losses
through insurance.
In sum, although the losses for household and business burglaries
were similar, losses in robberies of businesses wer.e greater than
losses in robberies of individuals. For all types of theft victimi-
zation (from individuals, households, and businesses) the likelihood
of recovery of property losses increased as the value of the items . ,
71
stolen increased.
Footnotes 1 But to whom the victim had never sal.·d 1" more tlan Hello. II
2 For the perceived races of bb
black/other (as was used earlier)r~ e~y offender~~ black rather than Bureau of the Census personnel code~Sthee~ u~ed Sl.nce this is how the should also be noted here th t e us ness robbery data. It percent of the population inathaccoirhdingr to the 1970 census, about 35
e e g t mpact Cities was black 3 . • For ease in communications he i fr "
requiring medical attention wil] b reina _er, l.nJured to the extent 4 . e s tuply referred to as :!.njured. Stolen property \'7ith an
valueless property, such as a
5
estimated value of "nonen includes letter, and also credit cards and cl1ecks.
Excludes burglarized businesses f h was not ascertained. or w ich the amount of loss
6 Excludes businesses Victimized b
of loss was not ascertained. y robbery for which the amount

Chapter IV
CI~RACTERISTICS OF THE INCIDENT
Time Of Oc~urrence
Personall
here in tabular form indicates that A review of data not s~own
incidents occurred during daylight nearly one-half of the personal
two out of five occurred between 6 p.m. hours (6 a.m. - 6 p.m.),
one out of ten personal incidents ocand midnight, while only
2 This distribution maintains cured between midnight and 6 a.m.
the offender were known to each other. whether or not the victim and
involving assault--with or without The majority of incidents
theft--occurred between 6 p.m. and,6 a.m. Further, only 47 percent
h ft without injury which involved of the incidents of personal t e
force or threat of force without injury--namely" robbery without
injury--but 64 percent of the incidents of personal theft wit~out
wh~ch did not involve force or threat injury ...
d between 6 a.m. and 6 p.m. larceny--occurre
of force--per~onal
Overall, therefore,
assaultive vi;lence were more often those incidents involving
• 1 '1 those incidents involving personal "nighttimell incl-dents, w U e
ften "daytime" incidents. larceny were more 0
Household
V~ct~'m~zations, about half were reported to Of all household ... ... ...
d 6 a m about four-tenths between have occurred between 6 p.m. an . 0,
6 a.m. and 6 p.m., and the remaining one-tenth were reported to have 1
occurred at an unknown time. An examination of the subcategories 1
of household victimization reveals that burglaries were more likely 1
1
to have occurred at an unknown time (15 percent), larcenies next
most likely (ten percent), and vehicle thefts least likely to have
occurred at an unknown time (four percent).
Of those household victimizations occurring at a kno~vn time,
more than half in each subcategory occurred at night (6 p.m. to
6 a.m.). Vehicle theft (77 percent), substantially more often than
either larceny (56 percent) or burglary (54 percent), is an offense
which occurs disproportionately during the nighttime. Finally,
larcenies of $50 or more were more likely than 'larcenies of. less
than $50 to have occurred at night (61 percent vs. 52 percent).
Business
Only one out of ten total business establishments which were
victimized by burglary were burglarized between the hours of 6 a.m.
and 6 p.m. An additional 15 percent were burglarized between 6 p.m.
and 12 midnight, 35 percent between midnight and 6 a.m., and 30 per-
cent at some unknown hour between 6 p.m. and 6 a.m. Thus, four out of
five burglaries of businesses occurred at night. The percentages
of burglaries occurring during the daytime varied from only five
1
1
1
1
1
1
1
1
1
1
1
1
1
1
1
1
1
1
1

74
percent for retail business to ~2 percent for real estate businesses.
As would be expected, robberies showed a distinctly different
time of occurrence pattern from that shown by burglaries. Nearly
three out of five business robberies occurred between 6 a.m. and
6 p.m.; an additional one-third took place between 6 p.m. and mid
night, and only one-tenth occurred between midnight and 6 a.m. There
was substantial variation by type of business. For example, while
retail robberies were evenly divided between daytime and nighttime,
"other," wholesale, and manufacturing businesses were disproportionately
robbed during the daytime. Overall, while business burglaries in the
Impact Cities were essentially a nighttime phenomenon, business rob-
beries were essentially a daytime phenomenon.
Place Of Occurrence
Personal
Personal incidents in each of the major subcategories occurred
much more often in outside public places (tlstreet, park, field," etc.)
than in any other location. In fact, for each subcategory of personal
incidents,the place of occurrence was more likely to be such a public
place than all other categories combined. For assaultive violence
with theft and robbery without injury, seven out of ten of the inci
dents, but for assaultive violence without theft and personal larceny,
just more than half of the incidents, occurred in these outside
public places. For total personal inCidents, the next most likely
place of occurrence was inside 'd a non-res~ ential building (such
as an office building) or on a bli ' pu c conveyance; about one-eighth
of all personal incidents, but more than one-fourth of the personal
larceny incidents, occurred in places fall;ng ;nto h .... .... t is category.
Finally, about one-tenth of all p. ersonal incidents Occl'.rred in the
home of the Victim and an additional one-tenth near the home (in
the yard, on the sidewalk' f f h h ~n ront 0 t e ome, et~.) of the victim.
As might be expected, the prior relationship of the offender
and the victim was found to b~ associated with the place in which
the incident occurred. The major differences between stranger and
non-stranger inCidents in places of occurrence are between the
categories of putside public places and inside the home of the
victim. When the offender was a stranger about two _ thirds of all
personal inCidents occurred in "street, park, field," etc., but
when the offender was not a stranger only about one-third of all
personal incidents occurred in outside public places.
Household
As would be expected on the basis of the nature of the various
75

76
types of' household victimizations" the place of occurrence is quite
variable across the subcategories of household victimizations.
By the definition used herein, burglary involves an entry into
the household premises by a person who did not live there and who
had no right to be there. Hence, it is not surprising that all of
the burglaries took place either inside the home or at a vacation
3 home.
Relatively few household larcenies, on the other hand, take
place within the home. Again, by definition, a theft from the home
would cnly be categorized as a larceny if committed by someone who
had a right to be there--such as a visitor or a workman. Larcenies
near the home would likely include thefts of lawn furniture, out-
side ornaments, and personal property (e.g. bicycles, lawn mowers,
tools, etc.) left outside. Larcenies elsewhere would include the
thefts (occurring away from home) of any objects not in the possession
of the victim at the time of the theft.
Vehicle theft, in part because of its nature, evidences a dis
tinctive place-of-occurrence distribution. About seven out of ten
vehicle thefts take place in an open public place and the bulk of
the remaining vehicle thefts occurred near the home. Thus it appears
that vehicles may well be better protected near the home (perhaps
in a garage) and/or where the owner and neighbors may be in a posi-
tion to keep a watch on tbe vehicle.
77
Briefly summarizi.ng, burglary th 1 . was e on y household victimization
which took place entirely at or near, home.' . Six out of ten household
larcenies and seven out of t . h cl en ve·i e thefts occurred away from
home; most of these "else h 11 ' " • w ere v~ct~m~zations occurred in an open public
place.
Use Of Weapons
Personal
In connection with all personal' 'd ~nc~ ents which were reported
by respondents, the interviewers asked whether the offender used a
gun, a knife, or any other object (such as a club. , a bottle, chain,
etc.) as a weapon in the commission of the offense. As Table 4.1
shows, 38 percent of all 1 persona incidents involved some· weapon.
Since, by definition, per'sonal 1 arceny cannot involve a weapon--
and because personal larcenies constituted more than one-eighth
of all personal incidents--it is important t i o exam ne the percentages
of the subcategories of personal incidents for the presence of wea-
The category showing the highest proportion of weapons is
robbery without injury, in which 52 percent of tb.,e' 'd . ~nc~ ents involved
pons.
weapons; the categories of personal incidents no.xt ,.nost likely to
have involved weapons were assaultive violence W~I..C~l h ~ ! t eft (44 percent)
and assaultive violence without theft (42 percent).

78
C' ID Ii CI'l CI'l
~ g. g. "Cl n n o ID ID ::l N N 00 Ib Ib Ib OQ OQ
o 0 ..0 Ii Ii ~ ........ Ib Ib Ib
,00 00 00
~~ :' g. ....
::l
Ii 0 ~ Q)
~ I-' I-'
01
§ N 0
DQ Ii Ib ID N Ib Ii
N ::r' ID ::l
N o N
~ go Ib
N o
g. 11!
>-II ID n N
g. ID N
N ::r' Ib
'" ID N ID
~ I'D
N
[ >-II Ii g ID
~ N .... ~ III
S
~ ::l 0 N
Q)
m N 0
N 0 N ID I-'
'" ~ Ib
N 0
Ii 0 ~ ::l
'" .... ::l
c;'l
H 0 r~
~ t:r:f ~ 00 .... ::l Ib Ol 00
::0 0 0-0-Ib Ii .... I'D Q)
i-' CXI
'" '-I 0
..... .... N w CXI '-I CD WeN! In '-'
H ::l n .... c.. Ib ::l N 01
.... CXI N
N
'" o
..... 0\ CXI
w W lnCXI lJ1~ o '-'
..... i-' • W '-IN 0\ o '-'
N CD
'" o o
..... 00 '-' N
.to N CXI o
"tl Ib Ii Q) o ::l
~ H ::r' III >-II N
..... i-' o
N \0 CD CDN o '-'
...... CXI ON ON '-'
I~ N P'
H P' Ib >-II N
.... CD
In 0\ o
HH ::l 0 n I'T .... ID c..t-' III
~ Q)
.....,
t>1 X N Ib ::l N
~ '" H
~ I'D
0 >-II
~ I'D ID
t>1"Cl .... 0
OQ::l
~c: 00
Hill i3 c..
"Cl III H n ::l I'T", ('llll
~~ .... 0 III ::l til III •• I-'
H >::l
DQ n ~ .... >1 c.. Ib Ib
DQ ::l III .... .... 00 III g:
t:r:f ~ til .... ::l Ib en en ::0 o 0-0-III Ii .... Ib en
ID
-7
79
H ID 0-t-' Ib
.:;-. .....
Table 4.1 is more. specific in that it shows--for those inci-
dents in which weapons were involved--the type of weapon used in
each sUbcategory of personal incidents. For those personal inci-
dents in which weapons were used, knives were used in about the same
proportion (three out of ten) in each of the subcategories of per-
sonal incidents shown. For those incidents in which weapons were
used, guns were mast frequently used in incidents of rObbery without
injury (51 percent) and least frequently in incidents of assaultive
violence with theft (30 percent); conVersely, "other" weapons Were
used least frequently in rObbery witqout injury (16 percent) and
most frequently in assaultive violence with theft (40 percent) •
The fl.nding that--in incidents in which a weapon was USed--guns are
used most often in robberies Without injury and least often in as-
saults with theft, has at least two Possible explanations. In some
incidents, the presence of a dangerous weapon, such as a gun, may
make the use of physical assault unnecessary. That is, the pres-
ence of a gun may conVince Victims not to resist. On the other hand,
when a gun is used by an offender as a means of intimidation, it is
Possible that there i~ great reluctance to discharge it, given its
highly lethal character.
BUsiness
By definition, business burglaries (as well<, as all household

80
crimes) cannot involve the use ot threat of force directed at
individual persons in order to secure valuables. Rence, the
use of weapons is only relevant for those business victimiza
tions categorized as robberies. Table 4.1 indicates that most
(77 percent) of the 19,000 business robberies involved a weapon
of some kind.
Table 4.1 also makes clear that when a weapon was used, it
was almost always a gun. In robberies of tot~l businesses in which
a weapon was used, a gun was the weapon in 88 percent of the rob
beries, knives were used in seven percent of the robberies, and
"other" weapons were used in five percent of the robberies. Regard
less of the type of business robbed, guns predominated as the type
of weapon.
Robberies in which weapons were used are more likely than rob-
beries in which weapons were not used to result in some loss--in
either cash, merchandise, equipment, supplies, or damage to the
th b 's El.'ghty-one percent of the robberies
property--to e US1.ne s.
of total businesses involving weapons, but only 60 percent of the
robberies of total businesses not involving weapons, resulted in some
loss to bus:tnes8. It is interesting to note that not only was the pres
ence of a weapon related to the proportion of businesses suffering loss,
but also the type of weapon was related to the proportion of businesses
-
exper.iencing loss. For total businesses, 85 percent of the robberies
... in which knives in which guns were used, 63 percent of the robber{es
... m which 'other" weapons were used, and 44 percent of the robber{es ' I
were used, resulted in some loss to the victimized busin~ss. However,
when knives were used as weapons, loss was no more likely to result
than when no weapon was used and wh II th " , en 0 er weapons were used,
loss was actually less likely to result than when no weapon was used.
Number of Victims
Personal
The vast majority of l' 'd persona ~ncl. ents were committed against
lone victims. About nine out of ten personal incidents involved a
single victim. For personal incidents in which theft was an element
(assaultive violence with theft bb ,ro ery without injury and personal
larceny), 19 out of 20 incidents involved a person who was unaccom-
panied. Victimization of a trio or more was quite rare--only about
one out of-50 incidents involved three or more victims.
Number Of Offenders
81
Although incidents with more than one victim did not occur
very often, incidents with more than one offender were rather common,I'lace. ,
1
1
l ! l , l
1
1
1
1
1
1
1
1
1
1
1
1
1
1
1
1
1
1
1
1
1
1
1
1
1

82
For only one category of personal incidents did single offenders J
predominate; 65 percent of the incidents of assaultive violence with-
out theft involved single offenders. However, for crimes involving
thef~ (assaultive violence with theft, robbery without injury and
personal larceny) from three-fifths to two-thirds of the incidents
involved multiple offenders.
Business
The majority of business robberies involved more than one offender.
In fact, only 39 percent of business robberies involved lone offenders.
Approximately four out of ten business robberies involved two offenders
and only two out of ten involved three or more offenders.
By way of summary, the use of weapons and the presence of multiple
offenders give offenders a substantial advantage over victims; weapons
and multiple offenders were found to be especially prevalent in business
robberies ..
Footnotes
1 The reader's attention is drawn to the fact that in this chapter
the unit of count under the Personal heading is the incident and not the victimization.
2While the proportion of total . . the 6 a.m. - 6 p.m. and th 6 perso~al.~nc~dents falling into similar, it must be noted ~h tP.~. - 12 m~dn~ght time periods are twO a s~nce the first t· . d
~ce as many hours as the se d t. ~me per~o contains incidents per hour duri g th con ~me.period, the mean number of that of the mean numbernof .e ~~cond t~me period is almost twice period. ~nc~ ents per hour during the first time
the 3I £ any ~uilding on the hous~hold's property ;s burglary ~s r d d ~ ecor e as having occurred at home. burglarized,
83

84
ell < P'tER V
FAILURE 'IO REPORT VIC'IIHIZATIONS TO THE POLICE
It has often been suggested that victim surveys are necessary
because, among other reasons, some victims of ~~imes fail to ~eport
their victimizations to the police. l In fact, critiques of official
crime statistics often begin by noting that failure to report crimes
to the police is one of the major limitations of official crime sta-
tistics; further, it has sometimes been argued that non-reporting
may be variable across crimes, across geographic areas, and across
t. 2 :Lme. Hence, one of the most critical questions asked of those
respondents in the NCP surveys who experienced victimization was
Whether the victimization had been reported to the police. In the
analyses that follow, results will be presented in terms of percen-
tages of non-reporting--the ratio of non-reported victimizations
to total victimizations.
Extent Of Non-Reporting
Personal Victimizations
Table 5.1 indicates that slightly more than one-half of
all personal victimizations in the eight Impact Cities
as an aggregate were not- reported to the police. This overall
rate of non-reporting of personal victimizations was similarly high
in most of the eight cities. While the rates of non-reporting for
total personal victimizations ranged from 48 percent in St. Louis
--- ~- - --~---
/
.... '.!'

-r
\
Ir) co
P E R S o N A L
H o u S E H o L D
B U s I N E S S
-...,..........-
Table 5.1
Percentages Of Non-Reported Personal, Household, and Business Victimizationsa
Eight Impact Cities
Atlanta Baltimore Cleveland Dallas Denver Newark Portland St. Louis
Assaultive Violence ~ 40% 35% 34% 27% 37% 38'7. 39% 39%
With Theft (1,490) (5,710) (3,100) (1,800) (2,460) (2,110) (1,570) (2,260)
58% 53% 59% 60% 60% 50% 617. 52%
Without Theft (10,830) (18,900) (15,120) (20,040) (19,810) (3,120) (12,350) (10,960) .
Personal Theft Without Injury 46% 45% [~9% 55% 63% 54% 60% 43%
Robbery (4,000) (11,850) (9,220) (4,460) (4,780) (4,700) (3,470) (4,500)
69% 52% 62% 66% 54% 62% 60% 51%
Larceny (3,710) (8,700) (4,370) (2,390) (2,360) (3,560) (1,450) (3,560)
56% 49% 54% 58% 58% 53% 597. 48% Total Personal Victimization (20,040) (45,150) (31,820) (28,690) (29,410) (13,500) (18,830) (21,290)
- - - - -- - -
44% 42% 467. 48% 42% 48% 48% 42% Burglary (25,320) (32,890) (28,670) (41,080) (30,750) (13,140) (21,860) (24,600)
74% 68% 75% 72% 68% 68% 68% 65% Larceny (46,340) (70,990) (48,680) (96,500) (83,490) (12,800) (56,150) (42,820)
21% 22% 24% 24% 22% 20% 20% 25% Vehicle Theft (4,480) (9,960) (17,590) . (6,840) (8,640) (3,930) (4,910) " (9,330)
61% 57% 57% 63% 58% 52% 60% 53% Total Household Victimization (76, 1~2) (113,850) (94,940) (144,420) (122,890) (29,870) (82,920) (76,750)
....
29% 19% 25% 26% 24% 20% 23% 29% Burglary (15,380) (19,998) (11,376) (16,545) (11,186) (12,089) (7,826) (12,898)
8% 5% 10% 8% 4% 25% 12% 12% Robbery (3,275) (4,666) (2,388) (2,259) (1,375) (1,880) (860) (2,282)
25'7. 16% 23"~ 24% 22% 21% 22% 26% Total Business Vict~ization (18,655) (24,664) (13,764) .(18,804) (12,561) (13,969) (8,686) (15,180)
aSubcategories may not sum to total due to rounding.
'10
.-l til I .jJ III <Il ttl
I
~ oM -~ .jJ til
<Il § ,s:::
:>-. 0 (J til bO til ,s:::
bO ~
~ P- 'r! ~ l:l 0 <Il til .jJ (J til
..... 0 rn
III <Il .4-\ (J ~ 'r! ~ til til ;.I l:l
,s::: 4-\ .,-1
til .~ 4-\ .jJ (J 0 ~ l:l <Il 0
;:j
til 0 .jJ .r! ~ III ,s::: H P- .r! .-l ~
bO 0
<Il 0 ~ ~ 0 .jJ l:l .jJ
.-l ::: ..:l
(J .jJ 4-\ 0 (J P- '0 0 4-\ III '4-t III ~ .,-1
<Il 0 P- <Il ~ 4-\ ',-l 0 t-:I 0 ~ III .jJ .
rz:l P r-l <Il .-l ~ 0 .jJ <Il ..-I
<Il .-I ~ .jJ
oM til ~ III b III (J til .~
4-1 :> • .-1 0 tr.I
t:> <Il ttl <Il ..-I .. '1:1 N .,-l a .-I 0 a P-
H ~ 4-1 g. 0 (J 0 til <Il .r! .-l ~ .jJ
ttl • .-1 <Il P
..:l III .jJ .r! l:l III ~ S 0 <Il (J
,s::: rn rn rn ~ .,-1
0 til .,-1 4-1 <Il til .,-l P- .jJ .r! I <Il .,-1 I
P4 til <Il .jJ <Il 4-1 .jJ ~ III .jJ :> <Il .,-1 fl rn p .jJ
t:>- .~ .,-1 ~ 0 III ttl tJ <Il P
P .jJ III 0 P
rz:l <Il ~ ;:j ,s::: til 'r! ,s::: .,-1 '1:1 0 .,-1 ~ ::: <Il
p:: :> 1-1 (J .-I 4-1 .jJ tJ P :> .jJ <Il t:>
()
E-4 ~ () .r! 0 .r! 0 '\:l .jJ g . rn 4-1 ~
0 ;:j III rc:J ,s::: 'r! '\:l 0 <Il ~
.jJ <Il l:l 0 <Il
til 4-\ .jJ 4-1 til <Il P- .jJ <Il .jJ .jJ 0 bO fl () tJ 0 p..
E-4 0 tJ P ;I ttl til tJ P p.. .~ III • .-1 .,-1 rn
.~ III .jJ 0 bO ~ <Il § '1:1 <Il <Il ~
.-l .jJ <Il co
tr.I rn 4-1 ttl .,-l ~ bO g. <Il til ~ .jJ
<Il 0 III .jJ ""
5 .jJ ~ ,s::: .jJ III 0
.,-l .jJ <Il I ~ ~
p.. N III
tJ P .jJ III <Il ~ ~ ~ p 0 0
.,-1 1-1 a
H .,-l .jJ H .jJ § bO .-I <Il 0 P- o ~ a .jJ <Il a 0
t> J:.~ :> (J bO .,-l III p.. P. P 1:0 :5 .,-1 ~ ~
<tl .,-l -~ -~ <Il til tJ ~ <Il <Il ~
:>-. .jJ 4-1
g1 N . .jJ ~:> .-I .0 til • .-1 ~ .0 4-1 b .-l .,-1 tl .jJ
g ttl . +J .-I 0 .jJ
0 .jJ <Il 0 • .-1 '1:1
H ,s::: <Il <Il g u> ~ .,-1
~ P .-I
0 ~ .jJ :> <Il <Il
~ +J a (J ~ ..u (J ~ <Il .-I Z
<Il .-l bO
H 0 'M t; .~ III tJ <Il .,-1
• .-1 :5 '1:1 r-l -.-I g
t:> rc:J rn .-I t:>- .,., .0 ~ 4-1
r-l <Il til §
t:> H Q) 0 .c til .jJ .lJ til 0
rn .lJ p ~
t> .jJ p. a <Il til rn ~ rc:J til
P ~ 0
~ til til l:l § <Il 0 III .jJ
.jJ .jJ -.-I 0 rn rn
<Il p <Il -r! <Il .~ S :> ,s::: .-l § ttl p.. ~ P
bO 0 ,s::: bO ,s::: rn ~ ;:j
il rn <Il <Il rn 0
0 bO til .jJ <Il .lJ ~ <Il ;:j P til ~ P l-I P. <Il -.-I
~ ;:j III .c rn (j ,s::: til 0 Q)
0 , .,-1 .jJ
til <Il 0 4-1 III .jJ oM ~ til til rn 'M g\ 4-1 +J III
~ .jJ E3 0 ,s::: rn P-I .jJ P l:l <Il .jJ 0 .,-1 N
P til 4-1 t:> III .. 0
0 .lJ til tl • .-1
0 <Il ~ til .jJ <Il +J 0 0 Z N ~ .,-l
.,-l III N bO -~
H <Il <Il P 4-1 P .r! ~ .,-l 0 .jJ
.jJ tl -r! <Il P .jJ
~ .0 ,s::: 0 0 0 tJ <Il <Il a r-l III til
• .-1 .~ ~ -M 1:0 .jJ
.jJ .,-l til P ,s::: .,-l .-I N t-:I rc:J Q) .jJ ()
p 0 .jJ til til ~ 0 +J +J 0 'M -r! P +J ~ ~ 'H • .-1
~ Q) III (J 'M <Il Q)
(J 4-1 .~ .~ • .-1 (J 0 <Il :>
.jJ bO N -,-l ,s::: .-I .. P -M
• .-1 <Il P.
0-> 4-l l:l .,-1 .jJ Q) .jJ .g <Il -r! :> +J .jJ .jJ r-l :> .jJ <Il <Il .-l
<!! 0 0 .~ til (J l-I (J
CIj (J (J
til 1-1 il til
~ m -r! -M ;j .,-l P til Q) ,s::: .,-l .,-l U) r-l 0£) I P
til .jJ +J r-l lW ~ Q) .jJ ,s::: .jJ :> l> CIj <Il P 0
CIj (J III 0 CIj p:: p .jJ
Q) p t'o 0 4-1 rn
,s::: .. 'r! +J p.. :> <Il til 4-1 .-I .-l 0 P 0 ~
til til rc:J 1-1 <Il 0 til ~ rn bO <Il
l:l <Il rn .jJ 1-1 CIj 4-1 .jJ p..
0 E-4 <Il 0 rn
p.. 0 r-l til
Aggregate Total
35% (20,490)
~
58% (111,130)
51% (47,020)
58% (30,080)
54% (208,720)
45% I (218,310) :
i
70% I I (457,780) I
23% i
I (65,680) I
,
58% I I
(741,790) I
24% (1(;7,298)
10% (18,985)
22% (126,283)
1\ Q) :>
.jJ til Q) (J <Il C'I
,s::: .r! .0 0 ,s::: ~ .. til +J .-I Q) .jJ ~ <Il a
r-l .jJ +J .
H g 1-1 Q)
~
'r! .~ .jJ .jJ <Il P.
(J <Il rn t:>- .~ til <Il CIj bO
co <Il ,s::: 1-1 0 .,-l CIj <Il ~ P CIj 0
.c +J (J +J +J a +J 1-1 CIj .jJ .jJ
r-l rn til l:l 0 til til 1-1 '.-1 .jJ
.. i·.,

86
to 59 percent in Portland, six of the eight cities had rates of
non-reporting which were over 50 percent.
When non-reporting is examined by type of personal victimization,
it is seen that the eight cities in aggregate showed the lowest
rate of non-reporting for assaultive violence with theft, followed
by personal theft without injury and finally by assaultive violence
without theft. The individual cities were again found to be rather
homogeneous with regard to non-reporting. For assaultive violence
with theft, the rates ranged from 27 percent in Dallas to 40 per-
cent in Atlanta; all cities except Dallas had rates of non-re-
porting which fell between 34 percent and 40 percent. For per-
sonal theft without injury, the rates of non-reporting ranged from
46 percent in St. Louis to 60 percent in Denver and Portland;
assaultive violence without theft had non-reporting rates of 50
percent or greater in each of the cities, ranging from a low of 50
percent in Newark to a high of 61 percent in Portland.
Household Victimization
Turning to non-reporti.ng of household victimizations, Table 5.1
suggests that the variation in the rates of non-reporting across
subcategories of household victimization was greater than variation
across the subcategories of personal victimization. For the eight
87
cities as an aggregate the lowest rate of non-reporting was for
vehicle theft, followed by b urglary, and larceny. Th e subcategories
of.household victimizations are even more homogeneous across cities
than the subcategories of personal victimizations. Vehicle theft
ranged from a 10 f 20 w 0 percent in Portland and
Newark to a high of 25 percent in St. Louis.
Burglary showed a similarly narrow
range, from 42 percent in St. Louis, Denver , and Baltimore, to 48 percent in Dallas , Newark, and Portland.
Non-reporting per-centages for larceny were also 1 .
re at~ve1y homog eneous, ranging from 65 percent in St. Louis to
75 percent in Cleveland.
Business Victimization
Business robberies ( Table 5.1) had an a ggregate non-reporting
rate of ten percent while bu . , s~ness
rate. burglaries had a 24 p ercent
An examination of these rates b 't y c~ y shows non-reporting
rates for burglary to b , e more homogeneous than tho f
se or robbery. Rates for th f e ormer varied from 19
percent in Baltimore to 29 per-cent in Atlanta and St. Louis.
For the latter, rates varied from four percent in Denver to 12
percent in Portland and St L . • ou~s,
Of the types of victimization thus far examined, bUsiness robbery .
~s the only one for which the
to 25 percent in Newark.
rate for

88
out of line with the rates for the any city was dramatically
remaining cities.
Comparisons of aggregate rates of non-reporting for personal,
h 1 < and business victimizations show house a (1,
that rates of non-reporting
. 'ctimizations were among the lowest rates observed.
for bus~ness v~ only vehicle theft had
Of the household and personal victimizations
t~ng rates for business victimi-f the non-repor .... a rate in the range 0
zations. . f r household burglaries
In each city, the non-report~ng rate 0
t han the non-reporting was greater r ate for business burglaries.
In the aggregate one and one-half times
the former was more than
than the latter (45 percent vs. 24 percent).
larger f Personal robbery without injury and
A similar comparison P
C;ty the non-reporting rate
h that in each ~ business robbery sows f that for business
. was wflll in excess 0
for Personal r6bber~es . rate . combined, the non-report~ng
For the eight cit~es robberies. 1 than the
for personal robbery re than five times arger was mo f' d ven personal In the aggregate, we ~n e
rate for business robbery.
assaultive violence with theft
to have a substantially higher
. ff t robbery with assault) (~n e ec,
rate of non-reporting than
business robbery.
89
Table 5.1 also shows that personal larceny had a substantially
lower non-reporting rate than did household larceny. While the non-
reporting rates for personal larceny varied somewhat among Impact
Cities, in each city the non-reporting rate for personal larceny
was lower than the 'non-reporting rate for household larceny.
Amount Of Loss
Data not shown here in tabular form indicate that household lar-
cenies of items worth less than $50 were not reported to the police
proportionately as often in any city as were larcenies of $50 or more;
in the aggregate while four out of five household larcenies of under
$50 were not reported to the police, less than half of the larcenies
of $50 or more were not reported to the police. Further breakdown of
larcenies of $50 or more reveals that only about two out of five lar-
cenies of items worth $250 or more were not reported to the police.
This trend holds for robberies and burglaries of businesses as well.
For example, in robberies in which the loss was under $50, the rate of
non-reporting was 18 percent. However, for robberies in which the
amount of loss was $50-249, the non-reporting rate was two percent,
and for robberies in which the amount of loss was $250 or more, the
non-reporting rate was one percent. For business burglaries a similar
trend is in evidence; burglaries with losses of less than $50 had a
'I

90
Table 5.2 d t d Personal Household An a Percentages Of Non-Repor ed Versus A~tempted Victimizations Business Victimizations, By Complete t
Eight Impact Cities: Aggrega e
b Personal Victimization Completed J Attempted Total
AssaUltive Violence Without Theft 34% 57% 52%
Rape (1,090) (4,410) (5,500)
46% 62% 58% Assault (30,770) (74,840) (105,610)
Personal Theft Without Injury 40% 67% 51%
Robbery (28,180) (18,790) (4~, 970)
55% 80% 58% . Larceny (25,760) (4,350) (30,100)
Household Victimizat on i
37% 68% 45% Burglary (164,110) (54,180) (218,290)
69% 79% 70% Larceny (416,470) (41,320) (457,790)
6% 64% 23% Vehicle Theft (46,450) {19,240) (65,690)
Business Victimization
3% 29% 10% Robbery (14,400) (4,585) (18,985)
17% 43% 24% Burglary (76,698) (30,440) (107,138)
aSubcategories may not sum to total due to rounding.
b 1 d d i virtually all Assaultive violence with theft is exc u e s nce
victimizations in that category are completed.
"
? ! E
non-reporting rate of 39 percent, while for losses of $50-249 and $250
or more the non-reporting rates were 19 percent and five percent,
respectively.
Attempted And Completed Victimizations
The relation of amount of loss to rates of non-reporting raises
the question of what other elements of the victimization are associated
with tendencies to report the victimization to the police. The finer
breakdown of the NCP classification scheme for personal, household, and
business victimizations allows the major crime headings to be broken
down into attempted and completed victimizations. Using these break-
downs for attempted and completed victimizations, it is Possible to
examine whether this aspect of the victimization was related to non-
reporting to the police. The results in Table 5.2 demonstrate that
whether the victimization was completed or only attempted is rather 3
strongly related to non-reporting. For each subcategory of victimiza-
tion, non-reporting was substantially more likely in attempted than in
although two out of five completed robberies without injury were not
completed victimizations. Among personal victimizations for example,
reported to the police, two out of three attempted robberies without
injury were not reported to the police. Similarly, in assaUltive vio-
lence without theft where assault was the method of attack, 62 percent
91

92
of the attempted and 46 percent Victimizations were not
of the completed
reported to the police.
In connection with the
f personal victimiza-non-reporting rates 0
. . the non-reporting t that the homogene~ty Ln
it is important to no e d tions nal victimization for attempted an
of the subcategories of perso r~tes d;' partially an artifact of the pro-
. combine, LS co·m· pleted victimizat~ons b t ry
. .' t'ons in each su ca ego • completed vlctLm~za L
portion of attempted and . violence without theft larceny and assault~ve
For example, personal method of attack had
where assault was the
reporting (58 percent).
f nonidentical total rates a
However, since five f S ~x of the former out 0 .....
three out of ten of the latter. were but less than -
completed, the total
d a~d particularly For complete
results are misleading. non-reporting f reporting.
had higher rates 0 non-victimizations, larceny .
for attempted .' . s the heterogeneLty h Ld vict~mLzatLon ,
On the other hand, in house 0 . . almost wholly subcategorLeS 1.S
rting rates acrosS the in the non-:repo of non-reporting for completed
the heterogeneity in rates determined by 1 t' ely
victimizations had re a :LV
victimizations; the attempted household .
h f the subcategor~es. in eac 0 homogeneouS non-repo rting rates
completed household victimiza-. f the attempted and ComparLsons 0
than one-third of
subcategory shoW that although more
tions in each h 1 h Police, slig t Y
t reported to t e d burglaries were no
the complete
l 93 l
l l l 1
1 more than two-thirds of the attempted burglaries were not reported
to the police. While the comparable percentages for larceny show the
smallest difference (69 percent vs. 79 percent), rates'of non-reporting· t
for vehicle theft were extremely divergent for completed and attempted
victimizations. Whereas only six percent of the completed vehicle thefts
were not reported to the police, more than ten times this percentage--
64 percent -- of attempted vehicle thefts were not reported to the police.
Finally, this pattern of differences between the rates of non-reporting
for completed and attempted victimizations was in evidence for business
robberies in which three percent of the completed, but 29 percent of
the attempted, robberies were not reported to the police.
Use Of Weapons
The analysis of data which do appear here in tabular form provides
evidence that another element of the victimization--the use of a weapon
by the offender--is tied to reporting the victimization to the police.
In victimizations of assaultive violence with theft, 30 percent of those
in which the offender used a weapon and 41 percent of those in which the
offender did not use a weapon, were not reported to the police. For
assaultive violence without theft, the percent difference between the non-
reporting rates for weapon-present and weapon-absent victimizations was
even greater--49 percent and 66 percent, respectively. Robberies without
1
1
1
.1
1
1
1
1
1
1
1
1
1
1
1
1
1
1
1
1
1
1
1
1
1
1

94
injury showed a similar difference; when the offender had a weapon 43
percent of the victimizations were not reported to the police, but when
the offender did not have a weapon 60 percent of the victimizations were
not reported to the police.
Although the rates of non-reporting for business robberies were
lower than rates of non-reporting for personal robberies without injury
(both when a weapon was present and when a weapon was not present), once
again, the rate of non-reporting in weapon-present business robberies
was substantially lower than the rate of non-reporting in weapon-absent
business robberies (five percent vs. 22 percent). Thus, across each of
the categories of victimization', the presence of a weapon was uniformly
associated with a lower rate of non-reporting.
Victim Characteristics
In order to examine further the phenomenon of failure to report
victimizat:i,ons to the police, characteristics of individuals, house-
holds, and businesses were examined. It was found that once the nature
of the victimization was controlled, characteristics of the victims were
largely unrelated to non-reporting. In fact, only for age did a sub-
stantial relationship maintain when the nature of the personal victim-
ization was controlled. For example, in the eight city aggregate while
nearly tw'o out of three of the total personal victimizations suffered
'i
I J
I I
by those 12-19 years of age were not reported
half of the total
were not reported
to the pol' l.ce, fewer th personal victimizat' an
. l.ons suffered b Y those 65 or older
to the police. With the exception of
age, however , victim characteristics were not found t b '
95
o e associated ' Wl.th non-report' l.ng.
Reasons Given F N or on-Reporting
All household and bUSiness survey
, respondents who t 1 Vl.ewers that th' , , 0 d the inter-
el.r Vl.ctl.mizations
asked "What was the reason were not reported to
the police were this inCident was
Responses to th' l.S question were
not reported to the
grouped into nine 1) Nothing could b
e done--lack of categories:
2)
3)
4)
5)
6)
7)
8)
9)
proof. Did not think '
l.t important enough.
Police wouldn't want to be bothered. 4
Did not want to take time--too '
p , rl.vate or personal
Did not want t o get
Afraid of repr' 1 l.sa •
Reported to someone
Other--Specify.
matter, did
involved.
else.
l.nconvenien t.
not want to report' 5 l.t.
Respondents were free to
police?"
give as many reasons failure to report th as they liked for their
e victimizat' l.ons to the police' h
on reasons give f ' e~ce, in Table 5.3 n or non-report' .
l.ng, row percentages may sum to more than

96
L..---r->o.---l----r-----, ,... V1 N
w ... ON ~N o ""
... WO'I ON o ""
... ... N
w 0\ \D o
::tI!ZH i'D 0 0 ~s:lM' o I Il> 11 ~
" Ol
lO:I m ID o s:I ID
~ o 01
l2: o M'
; I
; I !
J
I ,: I i I !
i I , f
11 1 j I,·
97
100 percent.
In Table 5.3 the distribution of reasons which were given by vic-
tims of total personal, household, and business victimizations are
presented. For each category of Victimization, the belief on the part
of the victim that nothing could be done about the victimization was
the reason most frequently given, fOllowed by the belief that the vic-
timization was not sufficiently important to report. In fact, about
four-tenths of the victims cited the former reason and one-third the latter reason.
This table also shows that reasons which were given by victims
in all three categories are strikingly similar. The only notable
differences are in the "private matter" and "fear of reprisal" cate-
gories. One out of eight victims of personal crimes and one out of
20 victims of household crimes cited "private matter" as their reason
for failure to report the victimization to the police. Fear of re-
prisal was cited by one out of 25 personal victims, one out of 100
household victims, and virtually none of the business Victims as a
reason for failure to report the crime to the police.
Victim Survey Estimates And The Uniform Crime Reports
The question of how victim survey data relate to "official" crime
data is a critical one. Since most decisions about the extent and

98
------------~.~-----... -----
1 crime statistics, based on officia
h rime problem are nature of t e c b' s in these
~ndication of ~ase . 1 to have some ~
it is obviously cruc~a
official statistics. first section of this
chapter strongly suggest
The results in the t 11 as its constituen
. .' t' n itself--as we v~ctlomloza ~o that the nature of the
related to failure to report the victimization to
elements-- is closely
t I1serious" offenses--those in which weapons are
1 Thus mos . the po ice. etc --are dis-
. h' h loss is greater, • completed, lon w ~c
used, which are d further, auto thE!fts an
reported to the police; disproportionately reported as proportionately
burglaries and robberies are commercial
rely on official statistics to provide a
well. Hence, if one were to
. f crimes occurring, the t d in over-re -
picture would be distor e p1.cture 0
those crimes which are presenting
1 orted to the disproportionate y rep
police. bl Namely, some of another complicating pro em.
There is, however, may not be officially
, to the police the crimes reported by vi'ctims 6
. b the p'olice recorded as crl.mes Y . reported to the FBl1s
or may not be
. R rt~ng program. Although the comparison of victim
Uniform Cr1.me epo ~ statistics is important, the
data and Uniform Crime Report survey
make such a comparison is not one ability to
of the major justifications
. 1 'ctimization surveys. . al Crl.me Pane Vl.
for undertaking the Natl.on
In fact,
.1},
f "
99
such cotltparisons between the Uniform Crime Reports and the victim survey
results in the Impact Cities are problematic; at best, such comparisons
are gross for several reasons:
1) The victim survey results reflect victimizations suffered by
residents of the city in question, whether or not these victim-
izations occurred within the city in which the victim resides;
the UCR statistics in a given city reflect victimizations of
all persons (whether or not they are residents of the city)
which occur within the city boundaries.
2) The victim survey results only counted victimizations occurring
to those residents who were twelve years of age and older; the
UCR statistics count crimes against persons of all ages.
3) The victim survey did not attempt to count some of the offenses
which are counted in the UCR statistics; although the victim
survey did count some larcenies, it did not count commercial
larcenies (e.g. shoplifting, employee theft) and vehicle theft,
which are tabulated in the UCR statistics.
4) The victim survey did not attempt to include some types of
institutional victims--for example, banks and governmental
agencies.
5) While the victim survey results reported herein cover a refer-
ence period of twelve months, this twelve month period does
I
I
I

100
6)
not coincide with either the 1971 or
ear' the 1972 calendar y ,
1 for the 1971 on y , h d UCR statistiCS
the pub 1:Ls e
or the 1972 calendar year.
are available
Panel system 0
'f' t';on for f class~ ~ca ....
survey results into the tl~e National crime Although
to re-Cast the incidents enables one the two systems in
differences between UCR categories, some
, les do exist. count~ng ru
are only estimates results
which are subject
7) The vic tim survey
8)
to sampling error.
There is evidence to
lapses and telescopst that memory
sugge reported
effect on the number ing have some
of victimizations
, surveys. to interviewers ~n
, ur victim Comparisons will
survey/UCR
In view of these d if Hcul tl.es, 0
be brief. ld be noted. things shou
1 es some data themse v , Before turning to the , rules use victimi-
It the UCR countl.ng t d as sau
a'~d aggrava-e , ' survey For rape .. for these v~ct~m of victimizations
d hence counts zations , an , '
d' for the remal.nl.ng h UCR countoffenses t e
have also beerL use , offenses have also been used
incidents, and incidents
for the vic tim
ing rules use
survey counts.
female victims, app lies only to
The UCR definition of rape
excluded from the stimates. victim survey e
v.; ctims of rape so male .... have been
\
1\
\\
\ \ 1
l \ ': 1
\\
\
101
Finally since the UCR data for 1972 coincided most closely with the
victim survey reference period, the 1972 UCR data were used.
For the eight Impact Cities in the aggregate, the victim survey
estimates and the UeR counts (Table 5.4) are in the most agreement for
vehicle theft (the ratio of the former to the latter is 1.00) and in \
the least agreement for larceny (3.02) and burglary (2.71). For rape,
aggravated assault, and robbery the agreement between the two is closer,
with ratios between 2.05 and 2.23.
The close correspondence between the victim survey and the UCR data
for vehicle theft is expected on the basis of the very low rate of non-
reporting for vehicle theft. At the other extreme, the discrepancy
between the victim survey and UCR figures for larceny also can be accounted
for largely by the high rate of non-reporting for larceny (69 percent).
The relatively high ratio for burglary (2.71) is problematic, since
the non-reporting rate for burglary is relatively low (38 percent).
There is evidence (from data not presented here) of considerable
inter-city variation in the ratios of victim survey to UCR counts for
the individual offense categories. Rape and aggravated assault show
ratios that are most variable across cities, while the ratios for robbery,
burglary, larceny, and vehicle theft are less variable.
For rape, Newark's ratio of .98 is substantially smaller than the
ratios for Portland (4.08), Denver (3.17), and Atlanta (3.15).

'1
td :<' > 5' < t"' 0 QQ
'" ~ ~ ~ 0' ~ II> 0' 0 QQ II> ~
..... II> .....
11 0
~ IX> ..... ~ '< II>
IT '< II> ~ P.
> II> .... IT til
til IX> s: ..... IT
.... .... 0'\ 0- .... W N V1 .... \Q """ """ W
w w w \Q ..... \Q N 0 0 0- '" 0> ..... '" '" 0'1 \Q """ """ .." 0
I
I """ w ..... """ 0> N 0'1 V1 ..... V1 0- '" 0-
V, \.J1 W w
\.J1 0> """
.... 0'1 0>
0> 0 0 '? '" \Q .....
N .....
0 0 .... N . II> P. 0 0'
!" N !" W N ::, 0
.... :.., .
N 0 0 0 N ... w P' V1
-
0 .... t<I < ..... ..... ~ 0
IT IT ~ ~ tI.I
:<,0= II> 11 ::l '" C
IX> ~ 0
"g ~~ 1"\ II> 0
g a IT (t>
'< 0 ..... 0 IT 0 ..... § II> til IT
-- til
> ~ QQ P.
I tI.I< c ..... ~ ::; ~~
OQ = 11 II> ::l
OQ ..... IX> .... IT 0 (D a
0 11
~ (t>
:<' (t>
'" :<'=tI.I:<' II> ::l C IX>
'" ~ ~ l! ~ 0 (t> 0
0 11 rT til
IX>
rTg'<o til I-i ....
00< 1"\ .....
~ 0 (t> IT
~
I-i IX> 0' ..... (t>
~ """
LikeWise for aggravated assault Newark's ratio (.55) is very much
smaller than the ratios in Denver (4.14), Cleveland (3.9B), and Portland (3.41).
From Table 5.5 it is apparent that the UCR figures and the vic_ t
tim survey figures similarly rank the eight Impact Cities. A measure
of the similarity in the paired rankings for each offense is given by
the row labeled "~d'''--the sum, across cities, of the squared differences
between Victim survey rank and the UCR rank. If the two sets of rankings
for any given offense were only associated by chance, the ~d' would be
expected to be B4.7
Although the correspondence in the rankings for
rape and aggravated assault is not very close, the correspondence for
the remaining offenses is qUite close.
crimes were not reported to the police. Failure to report victimiza_
In summary, this chapter has shown that a large proportion of
tions to the police Was most closely associated With circumstances
surrounding the victimization. In general, more "serious" Victimiza_
tions were disproportionately reported to the police. On the whOle,
With the exception of the Victim's age, the victim's characteristics
were not strongly related to non-reporting. Among those not reporting
Victimizations to the POlice, the belief that "nothing could be done"
or thet the victimization was not important were the two reasons most COnnnonly cited.
103

104
--
....
1--
L,' 00
00
.. ' Ln 00
1"--
00
.... ...
r- -I
wi ...
1
00
...
00
00
cn< c:: ~ 11 n < rt
~It
cn< c:: ~ 11 n < ... ~It
cn< c:: ~ 11 n < IT
~It
> 00 00 t1
~ ... It > (J)
In III c:: .... IT
< g. ~ (') .... !O
H 0-!O ... IT
1 I
f 1
II 11 I , l 1
j f j
I ! I II II 11
1/
II 1 ! ,! ! ) )
j I
1/ , j
·1 1 I
I I )
11
II I; II H i I !I , I
i I 11 II 1 j !J I j
t!
When the victim survey and UCR figures ~ere compared, the former
sho~ed higher lftvels than the latter, especially for larceny. Except
for rape and aggravated assault, the rankings of the eight cities for
given offenses ~ere similar for the victim survey and the UCR Counts
, of crimes. Overall, these comparative data suggest that the t~o Sources
of crime statistics differ more in the level than in the nature of the offenses counted.
~
Footnotes
lSee President's Commission on La~ Enforcement and the Administration of 'Justice, Task Force Re art: Crime and Its Im act--An Assessment (Washington, U. S. Government Printing Office, 1967).
2See for example T. Sellin and M. Wolfgang, ]he Measurement of Qelinguencl (New York: John Wiley, 1964). 3
ObViously, completed victimizations involving property also involve more extensive losses than attempted Victimizations; however, even attempts can result in ~ome loss, primarily in terms of property damage.
4unfortunatelY, the slightly different Wording of this alternative which was used in the business survey gave this reason a much different flavor. In the business survey the ~ording "Did not ~ant to bother the Police ff was used.
5Used
only in the household survey.
6This
discrepancy may result from error, a conScious effort On the part of the police to manipulate the statistics, or the genuine belief on the part of the police that no crime has been committed.
7This
value is based on the formula for Spearman's rank correlation coefficient:
105

106
hen the two ranks t d value of zero w h' quation
efficient takes on an expecBey setting the value of t ~s e ThiS co . d urely by chance.. . 8 'id'! = 84. are assoc~ate P b r of c~t~es) = , to zero, when N (the num e
1 \i 1\
1\ ,)
!I : \
\ ;1 i \ , I
1 i
\ J 1
I
\ ; i ; \ l
, I
\ \
t I
1 \
't 1\ II i 1
1 i
\ I
\ t I I 1
---_.-~~ .......... ~." .. _~~ .. "-.,-",-"",-,,, -
APPENDIX A 107
National Crime Panel ClaRRificatinn of P~rsonal Crimes
Type of Crime
Assaultive Violence With Theft
Rape At:tempted rape
Serious assault with weapon
Serious assault with no Neapon Minor assault
Without Theft
Rape Attempted rape
Serious assault with weapon
Serious assault with no ~leapon Attempted assault with a weapon
Minor assault
Attempted a~sault
Personal Theft Without Injury'
Robbery
With weapon No weapon
Attempted robbery With weapon No weapon
Purse snatch, no force
Attempted purse snatch, no force
Pocket picking
Personal Crime Categoriesa,b
Conditions
Something was stolen or taken without permission or there was an attempt to steal or take something without permission.
Rape was the method of attack or the type of injury suffered. Verbal threat of rape or attempted rape as the method of attack or
attempted rape injuries. The offender had a weap()n or something he was\,using as a weapon and
the victim suffered aoy injury. ---:he offender had no weapon ~ the victim suffered a serious injury. The offender had no weapon or the victim did not know if the offender
had a weapon and the victim was attacked in some fashion and r~ceived minoi::[njuries. --
Nothing was stolen or taken without permissiQn nor was there any attempt to steal or take something without permission.
Rape was the mathod of attack or the type of injury suffered. Verbal threat of rape or attempted rape as the method of attack or
attempted rape injuries. The offender had a weapon or something he was using as a weapon and
the,victim suffered a serious injury. ---The offender had no weapon ~ the victim suffered a serious injury. The offender had a weapon and the victim was threatened with harm
or was actually attacked~t received no injury. The offender had no weapon or the victim did not know if the offender
had a weapon and the victim was attacked in some fashion and re-ceived minor injuries. --
The offender did not have a weapcn a::.:!. the vict;!..'\', ~las threatened Inth harm or was actually attacked but-received no injury.
Something ~as stolen or taken without permiseion or there ~as an attempt to steal or take something without permission, and the victim was not injured in any way.
Something that belonged to the victim was stolen or taken without permission.
The offender had a weapon or something he was using as a weapon. The offender did not have a weapon and the victim was threatened
with harm or was attacked but rec~ed no injury. The offender attempted to steal something. The offender had a weapon or something he was using as a weapon. The offender did not have a weapon and the Victim was threatened
with harm or was attacked but receIVed no injury. A purse was taken from the person ,and the offender did not have a
weapon and the victim was not threatened with harm or actually attac~: An attempt was made to take a purse from the person ~ the offen
der did not have a weapon and the victim was not threatened Idth harm or actually attacked.---
Cash or a wallet was taken from the uerson and the offender did not have a I~eapon and the victim was n~t threatened with harm or actually attacked.
arhe conditions which must be present for a main category must also be present for each of its subcategories even though the conditions are not repeated each time in the outlin~
bFor each personal incident the victim must have been present when the incident occur~ed.

108
APPENDIX B
National Crime Panel Classification of Household Crimes a
Household Crime Categories
Each household incident involves some form of crime directed against property without personal confrontation taking place between the victim and the offender during the (actual) commission of the cr~e.
Burglary
Forcible entry
Nothing taken Property damage No property damage
Something takiih Unlawful entry without force
Attempted forcible. entry
Larceny
Under $50b
Under $10 $10-24 $25-49
$50 or more $50-99 $100-249
$250 'or more NA ruuount
Attempted larceny
Auto Theft Theft of a car
Theft of other vehicle
Attempted theft of ~ car A~tempted cheft of other vehicle
J The offender did not live where the crime was committed and did not
have a right to be there. The offender actually got into the building and there was some evi-
dence that the offender forced his way in.-Nothing was stolen or taken without permission. There was property damage. There was no property damage. Something was stolen or taken without pe~ission. The offender actually get into the building and there was r.o evidence
that the offender tried to force his way in. The offender tried to get into the building without success and there
was some evidence that the offender tried to force his way~.
Thef~ except of motor vehicles or attempted theft except of motor vehicles.
The sum of the stolen cash and stolen property a $0-49. The sum of the stolen cash and stolen p?eperty - $0-9. The sum of the stolen cash and stolen property = $10-24. The sum of the stolen cash ancl stolen property = $25-49. The sum of the stolen ca."h and stolen property = :;;50 or ::lore. The sum of the stolen cash and stolen property = $50-99. The sum. of the stolen cr sh and stolen property = ,5100-249. The sum of the stolen cash and stolen property = ~250 or more. The ruuount of stolen cash is not ascertainable or the value of the
stolen propexty is not ascertainable. --Attempted theft except attempted motor vehicle theft.
Theft of a car and no permission was given to take the car or permiSSion was given but the car was not returned.
Theft of other motor vehicle and no permiSSion was given to take it or permission was given but it was not returned.
Attempted theft of a car. Att,empted theft of other motor vehicle.
aThe conditions which must be present for a main category must also be present for each of its subcategories even though the conditions a'l! not 'repeated each time in the outline.
bStolen checks and credit cards were uniformly considered as $0.
1lPe of Cr~
Burglary Attempted
Completed
National C
APPENDIX C
rime Panel ClaSSification
lUsiness Crime of BUsiness
Crimes Cat~
The Offender tried Was eVidence to get into th
--------------~---________________ The offender ac~~:t he tried to f:rbUilding illegall Robbery ----______ Without USing f lly got into the ~e his l~ay in. y 1lnd there
--•• -_____ orce. Uilding ill Attempted ---------____ egally , with
The offender att ------------------------------------::--
Completed
supplies belo empted to take mo bUSiness ( nging to the b ney, merchandi CUstomers ~;t inCLUding) mo~!iness from any e:ei equipment or a weapon. store perSOnnel)Y o~ personal pro:e;~ee of the
The offender to ' Wether or ~ot the y taken from belonging to ~~ money, merchandi offender had (not includin e bUSiness from se, equipment or or store per g money or person :ny emplOyee of th SUbP1ies
Sonnel), Whether a property taken fe usiness or not the offender ~om CUsto.Illers
ad a weapon.
109

f
I
.-j
.-j
.-j
f-~'-
I o M .--l
n Table D.l Estimated Standard Errors And 9S Percent Confidence Intervals For Rates (Per 1,000 Persons 12 Years Of Age Or Older) Of Personal Victlmiation
Eight Impact Cities
Atlanta
Population Base ~341,O44
Assaultive Violence Rate 4.38 With Theft - ---.
Standard Error .53
---Intervlll 3.32-5.44
Without Theft Rate 31.77
----. Standar!l Error 1.40
---Interv~l 28.97-34.57
Personal Theft. Rate 22.62 Without Injury ---
Standard Error 1.19
---Interval 20.24-25.00
Total Personal Rat.e 58.77 Victimization ---
Standard Error 1.88
---Interval 55.01-62.53
aIntervals based on ± t~v standard errors.
A
x H A
~ p.,
~
(/)
ClJ M ,.c td 't-I
l-t 0 l-t 1-1 til
"d
,', "
1-1 til "d c: til +J (I)
+J c: ClJ 0 1-1 ClJ Po
lI"l 0\
'0 c: til
(/)
1-1 0 }..t !-l ClJ
T(j }..t til '0 c:
~ m +J (/)
+J
m (/)
Cl! l-t P. (/) Q1 M ,.c til .j.J
bO .;i 3 0
M M 0
4-l
ClJ .c £-I
I ClJ. +J til ClJ 0 .c
+J ClJ a 4-l .r! 0 l-l 0 .c ClJ
0 +J 1-1 til til 0 ClJ bO .,..., ClJ til }..t }..t
a 0 bO 4-l bO
ClJ til .c c: +J 0 :>..
'r! +J 4-1 +J .r! 0 til c.J
!:! I .c +J 0 0 .c til 4-l en ClJ c: .r!
.r! ClJ
.s (/) Q1 -rl .c
(/) ...c +J Q1 +J +J l-t m c: 0 l-t .r! 4-l
til l-t +J (/)
0 c: m 4-l 0
() M (/) M
M (/) Ql til Ql ~ > M l-t .g (/)
Q1 rd .j.J +J c: (/)
-rl Ql Ql .c .r!
Ql 't-I .j.J
0 "rI c: U III '0 (/) .:..J .,-\ III 0 4-l "rI til c: l-t p.. 0 0 ~ 0 en
llaltimore Cleveland Dallas Denver Newark Portland 51:. Louis ASCregate
Total
656,299 510,824 613,781 404,469 235,516 295,826 422,686 3,480,445
8.70 6.06 2.93 6.09 8.94 5.31 5.34 5.89
--- --- ------ -- - I-- - - --- ---.65 .62 .39 .59 .65 .54 .56 .22
--- --- --- --- --- --- I--- - ---7.40-10.00 4.82-7.30 2.15-3.71 4.91-7.27 7.64-10.24 4.23-6.39 4.22-6.46 5.45-6.33
I 28.80 29.61 32.65 48.97 13.25 41.75 25.92 31.93 I , --- I--- - 1--- --- ------ ---- - .-;-1 1.16 1.34 1.29 1.65 .79 1.48 1.21
I --- --- --- >- ---_.- --- --- ---I ~6.48-31.12 tz6. 93-32.29 0.07-35.23 ~5.67-52.27 11.67-14.83 38.79-44.71 23.50-28.34 ?O.51-33.35
31.30 26.62 11.16 17 .65 35.12 16.60 19.09 22.15 I
r-- - - --- --- --- --- --- --- ---1.21 1.28 .76 1.01 1.27 .95 1.04 .1.7
--- --- --- 1---- '-- --1-- -- --- ---28.88-33.72 24.06-29.18 9.64-12.68 l5.63-19.67 32.58-37.66 14.70-18.50 17.01-21.17 21.21-23.09
68.80 62.29 46.74 72.71 57.31 63.66 50.35 59.97
--- --- ------~-- --- ,..--- - ---1. 76 1.92 1.54 1. 98 1.60 1.B1 1.67 .80
--------- --- -- ~--1--- 1--- -65.28-72.32 58.45-66.13 43.66-49.82 08.75-76.67 54.11-60.51 60.04-67.28 47.01-53.69 58.37-61. 57
!
,~ ;;..

C,
C'1 .-I .-I
L
Table D.3 Estimated Standard Errors And 95 Percent Confidence Intervalsa For Rates (Per 1,000 Businesses) Of B
Eight Impact Cities
Atlanta Baltimore Cleveland Dallas Denver Newark Portland St. Louis Af',ft'gate otal
Number of Businesseo 20,744 34,630 31,000 46,579 25,239 19,188 21,982 24,316 223,678 ~
-
Burglary Rate 740.98 577.62 365.93 355.07 442.68 630.55 355.56 531.25 479.68
--- --- --- --- --- -- - --- -- - ---Standard Error 99.29 41.59 32.66 34.44 44.27 93.32 51.91 73.84 30.64
- -- --- --- -- - i-- - - --- - -- --- ----Interval 542.40- 494.44- 301.61- 286.19- 354.14- 443.91- 251. 74- 383.57- 418.40-
939.56 660.80 432.25 423.95 531.22 817.19 459.38 678.93 540.96
Robbery Rate 157.34 134.65 76.93 48.45 54.28 97.76 38.89 94.30 84.77
i--- -- ------ _c __ ------ --- --- ---
Standard Error 21.87 14.00 13.16 10.22 11.29 22.88 4.01 22.07 6.57
--- --- --- ------ --- --- -- -- ---Interval 113.60- 106.65- 50.61- 28.01- 31.70- 52.00- 30.87- 50.16- 71. 63-
201. OB 162.65 103.25 68.89 76.B6 143.52 46.91 138.44 97.91
Total Business Rate 898.33 712.27 443.87 403.52 496.96 728.31 394.45 625.55 564.45 Victimizations --------- --- I-- - --: --- --- - -- -- --
Standard Error 106.00 49.15 40.84 39.95 47.71 nO.70 52.07 93.21 35.47
----- --- ------1--- --- --- --- ---Interval 686.33- 613.97- 362.19- 323.62- 401.54- 506.91- 290.31- 439.13- 493.51-
1.110.33 815.07 525.55 483.42 592.38 949.71 498.59 811.97 635.39
Table p.2 E" ... ,.d ,,,,,,,d Ere", And'S ,.".,' Co,f""" ,.,.<v.'" ,,' .. ,., (re' 1, •• • R,.,.ho
ld.) .f n,.,.h,ld V""",.,,,"
Eight Impact Cities St. LouiS Fortland Denver Newa1:\<.
Agg1:egate Total
Number Of Rouseholds
'Burglary
La1:ceny
Vehicle Theft
Dallas Baltimore ,Cleveland 1,595,399 197,107 Atlanta 144,703 106,740
\ 136.84
\-- - ~ 1 1. !if \
C, , .
-- ----
194,615 280,348 230,403 284,416 151.10 124.78 157,067 123.06 158.02 146.54 ---_--l------124.41 115.65 3.74 161.21 ____ l- -- -
3.82 4.28 Rate ---- 4.00 4.29 ----_ ...... 3.91 3.48 ----_.- -- ~--117.30- \\\
132.26
133.60-140,.08
Standard Error
Interval
Rate
Standa1:d Error
Interval
Rate
Standard Error
Interval
Rate
4.15 --- --_.---- 142.54-159.66 ---
152.91-169.51
---108.69-
122.61
116.59-132.23
138.54-154.54
344.21
149.44-166.60
429.01
115.42-130.70
119.93 388.06
_---l---~7~6_\\~6.:
2.87 4.67 211.30 249.61 --- 5.82 3.77 295.05 1---_1----
. 281.20-292.68 - - _,- - _,- - _,- - _,--- ,_- -I- - -'- - -" ----
5.83 --- 5.38 207.92-
226.60 --- 4.84
333.45- 417 .!35- 1\2.39- 376.42-354.97 440.67 127. 47 . 399.70
4.70 5.15
284.75- 240.21- 201.62- 41.17
2.40
47.34 -~ 305.35 259.01 2~0.98 ---24.39 44.41 36.85 33.90
--_._-_.- - -'--- .B6 18.54 35.02' I 76.34
2.19 2.16
_- -,---,---,--_1--_1-- -1-- -'---" - - -- ~ - -'- - - 2.43 1.75
24.78--"." 31 •• ,-39 •• , 70.04
-".64 , •• B9-".89 39 .55 ... '.27 ".41-41
•23 ".SS-3B." ".54-
52
•
14
\". ,,..42.89,
. '::\ ~ 1(-",." , ••. " ",.05 51S .14 "l.M ",.8l "'.... 389.
37
\\ 464.96 •
2.00 3.15 1.88
5.91 5.5~ 4.14 _----~ 1--- >- ----- ,---'---- >-- ---
5.68 5.22 ~ --- -- -- -- ,- --
L \
561.24- 378.33- I 456.68-Total Rousehold
VictimizatiOn 5.66 5.83
_'"-"_------------..!..-----I-----..J\----~----l..--- 584.88 400.41 473.24
I----r-·-620.08- 269.39-642.80 290.27.
5.32 5.64
Interval
I---\---r--r---473.51- . 389.65- 400.39- 503.82-496.07 410.93 423.71 526.46
Standard Er1:or
aIutervals based on ± t~~ standard erro~S.
~ ; '" '" '" . :'l '" . o ~ :l
~ r. 15 CJ ~
~ n: t>.
£ f.>1 :a z gj > o " uI :;;
"
!,
N .-I .-I
.. ",."~._""":~>~,,...-..,~-'"""--,~C-~v',..'f'------~C~ ·:1It , _m:'Ccc1c
:' c.: ct. .' : ":":,::;'c:' ':;: '.,

r