load testing summary report lookout point...
TRANSCRIPT

LOAD TESTING SUMMARY REPORT:
LOOKOUT POINT SPILLWAY BRIDGE
LOWELL, OR
SUBMITTED TO:
Tetra Tech INCA, Inc. 400 112
th Ave NE, Suite 400
Bellevue, WA 98003
www.incainc.com
SUBMITTED BY:
BRIDGE DIAGNOSTICS, INC.
1995 57th
Court North, Suite 100
Boulder, CO 80301-2810
303.494.3230
www.bridgetest.com
July, 2013

LOAD TEST AND SUMMARY REPORT– TO-20 LOOKOUT POINT SPILLWAY BRIDGE, LOWELL, OR ii
EXECUTIVE SUMMARY
In March of 2013, Bridge Diagnostics, Inc. (BDI) was contracted by Tetra Tech INCA, Inc. in
coordination with the US Army Corps of Engineers (USACE) to perform load testing on the
Lookout Point Spillway Bridge near Lowell, Oregon. The goal of this project was to quantify the
load response of the superstructure in its current condition so that a more accurate load rating
value could be developed. BDI’s scope of work included instrumentation development and
installation, load testing, and preliminary data processing and review.
The instrumentation and testing phases of this project were completed on June 24th
and June
25th
, 2013. A specialized wireless structural testing system (STS-WiFi) was used to record
strains and rotations on the superstructure while the bridge was subjected to semi-static loading
along three different truck paths.
The load test data was reviewed by BDI, and the responses were found to be linear and
reproducible, with minimal thermal effects, indicating that the structure was behaving in a linear-
elastic manner. In addition, the structure exhibited good lateral load distribution, which will be
critical to consider during the analysis of this bridge. Overall, the data was judged to be of high
quality and should provide a very good basis for verifying analytical predictions. By using both
the strain and rotation responses, the engineer should be able to develop a relatively accurate
finite element model of the superstructure.
This report provides details regarding the instrumentation and load test procedures, sample
response plots, a discussion on the quality of the data collected, and brief conclusions resulting
from the data review. In addition, processed data from each lateral path has been formatted as a
function of longitudinal truck position and provided in MS Excel format for ease of use. A
response envelope of the data containing minimum and maximum responses induced at each
gage location for each lateral truck position has also been supplied in the MS Excel file. Lastly,
principal stress responses and orientations calculated from strain rosette responses on Girder 4
and 5 near the connection to the diaphragms have been provided in the MS Excel file.
Questions regarding this report and/or data should be directed to Kyle Ramer
([email protected]) or Brett Commander ([email protected]) at BDI. For further
background information on BDI equipment, testing services, and analysis/rating methods, please
visit our website at www.bridgetest.com.
The load test results presented in this report correspond to the superstructure at the time of
testing. Any further structural degradation, damage, and/or retrofits must be taken into account
in future ratings.

LOAD TEST AND SUMMARY REPORT– TO-20 LOOKOUT POINT SPILLWAY BRIDGE, LOWELL, OR iii
Submittal Notes:
This submittal includes the following files:
1. Raw ".dat" files
This data is raw and therefore does not have certain gage factors applied that
must be used for analysis. This data is provided so that AECOM has everything
BDI collected, but should not be used for analysis!!
2. BDI_TO20_LookoutPoint_Processed_Data.xlsx
This spreadsheet contains selected data that has been extracted and formatted as a
function of vehicle position for each truck path. Additionally, envelope data
(minimum and maximum responses) for every gage location at each of the three
lateral truck positions is provided in this file. It also gives the vehicle location for
each min/max response as related to the test truck’s front axle. Lastly, principal stress
calculations for Girder 4 and 5 near the girders’ intersection with the diaphragm from
strain gage rosettes have been included in the file.
3. BDI_TO20_LookoutPoint_Report_Submittal_V1.pdf
This is the BDI report submittal, which contains all relevant information pertaining to
the testing project.
4. BDI_TO20_LookoutPoint_LL_Test_V3.pdf
This is a complete set of instrumentation plans including gage locations, gage ID’s,
and channel numbers.
5. BDI_TO20_LookoutPoint_Pics
This folder contains pictures of all instrumentation locations and other miscellaneous
photographs that may be helpful during analysis.

LOAD TEST AND SUMMARY REPORT– TO-20 LOOKOUT POINT SPILLWAY BRIDGE, LOWELL, OR iv
TABLE OF CONTENTS
EXECUTIVE SUMMARY .....................................................................................................................................II
TABLE OF CONTENTS ...................................................................................................................................... IV
1. STRUCTURAL TESTING PROCEDURES .................................................................................................... 5
2. QUALITATIVE REVIEW OF TEST DATA ................................................................................................. 17
3. CONCLUSIONS ............................................................................................................................................... 28
A. APPENDIX A – REFERENCE RESPONSE HISTORY PLOTS ................................................................ 29
B. APPENDIX B – EQUIPMENT SPECIFICATIONS ..................................................................................... 60
LOAD TEST AND SUMMARY REPORT – TO-20 LOOKOUT POINT SPILLWAY BRIDGE, LOWELL, OR 5
1. STRUCTURAL TESTING PROCEDURES
The Lookout Point Spillway Bridge is a 248.5’ long, five-span, steel girder bridge on the
Lookout Point Dam. The bridge was built in 1957 and was found to be in fair condition.
However, please note that BDI did not perform an in-depth visual inspection on the structure
during the field visit.
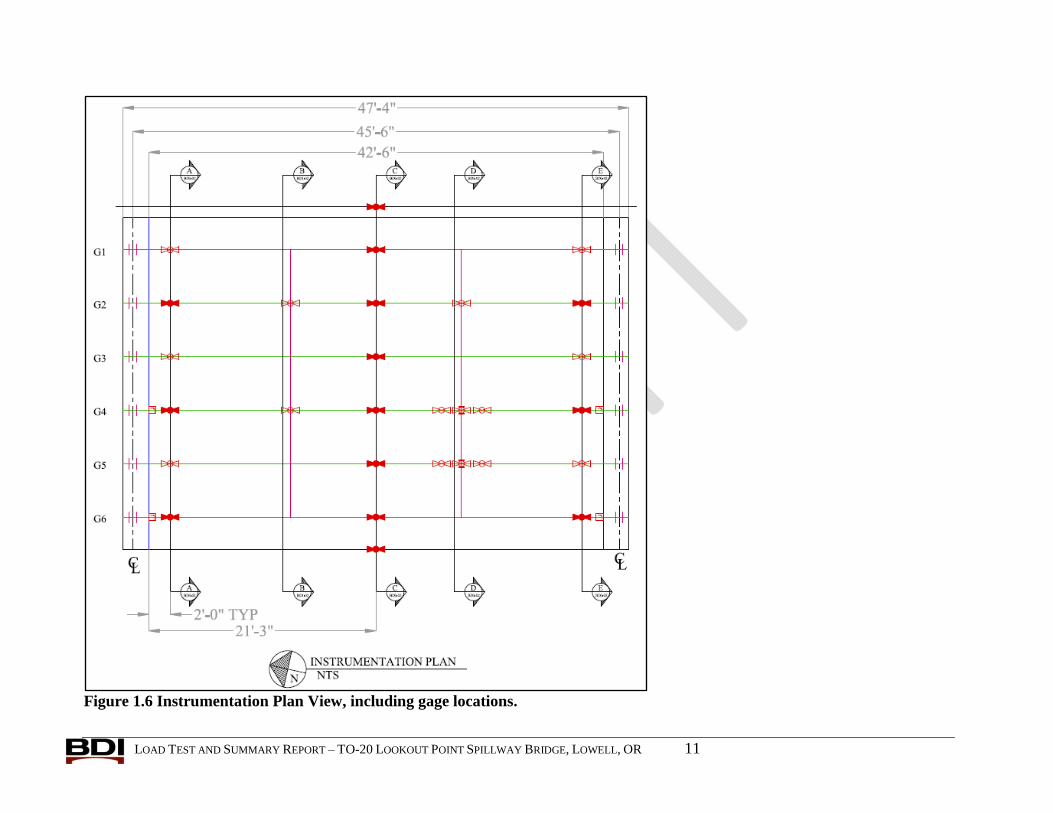
To evaluate the structure’s response to live load, the center span of the superstructure was
instrumented with 41 surface-mounted strain sensors (Figure 1.1 through Figure 1.3), 12
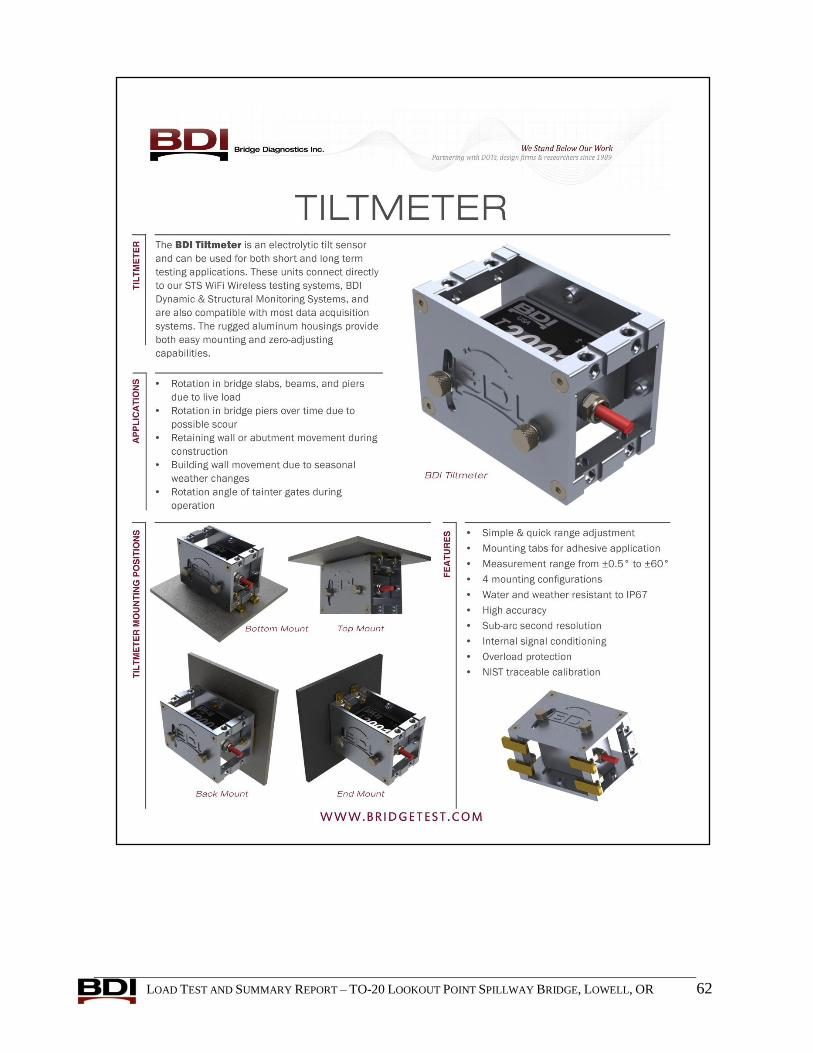
weldable foil gages (Figure 1.4), and 4 BDI Tiltmeter rotation sensors (Figure 1.5). The
instrumentation plans shown in Figure 1.6 through Figure 1.12 illustrate the sensor locations as
well as the gage and channel IDs for each sensor. The instrumentation plans have also been
provided in PDF format along with this report.
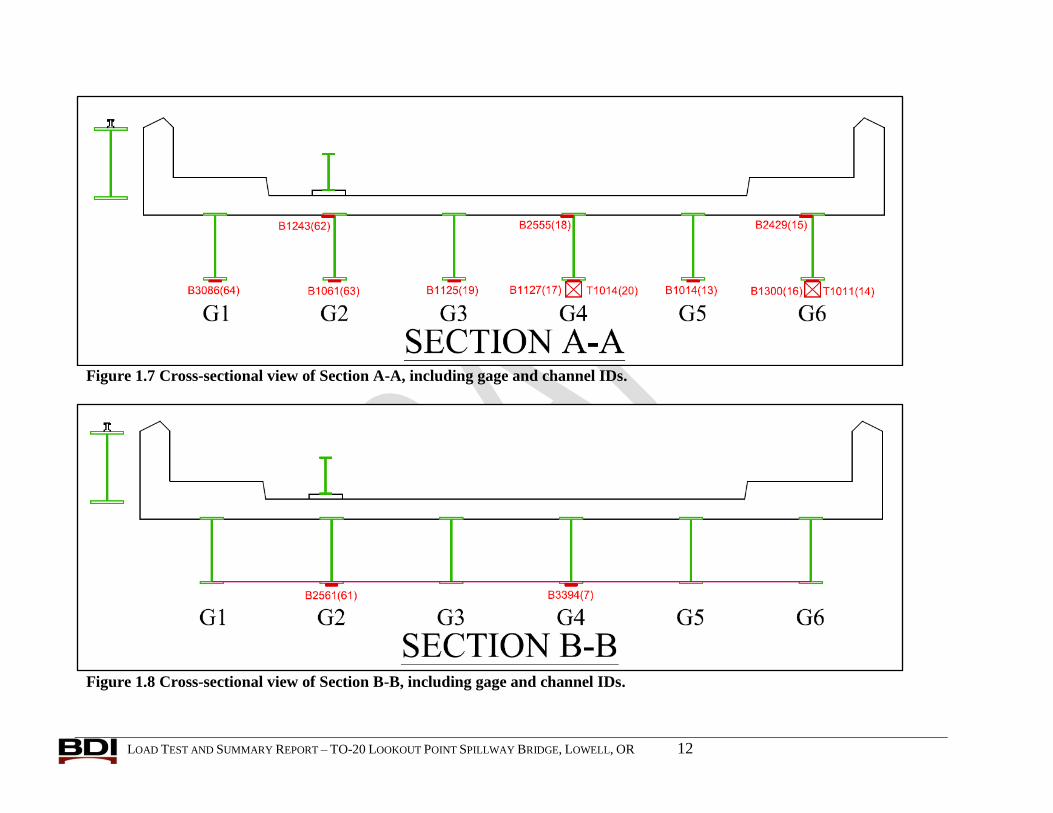
The majority of the strain transducers were placed on the bottom of the girders with additional
strain transducers placed on the girders’ top flanges, the interior and exterior crane rail girders
and on the bottom of the west parapet. The transducers were installed using mounting tabs and a
quick-setting adhesive, requiring approximately five minutes each to install.
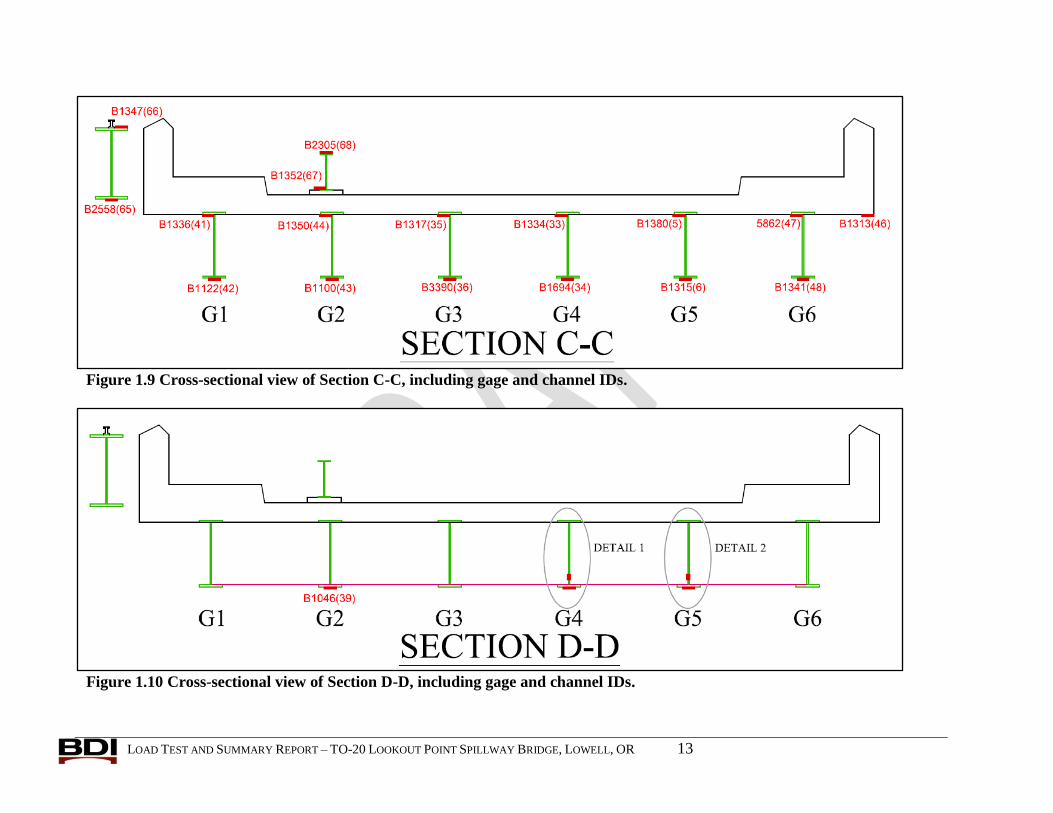
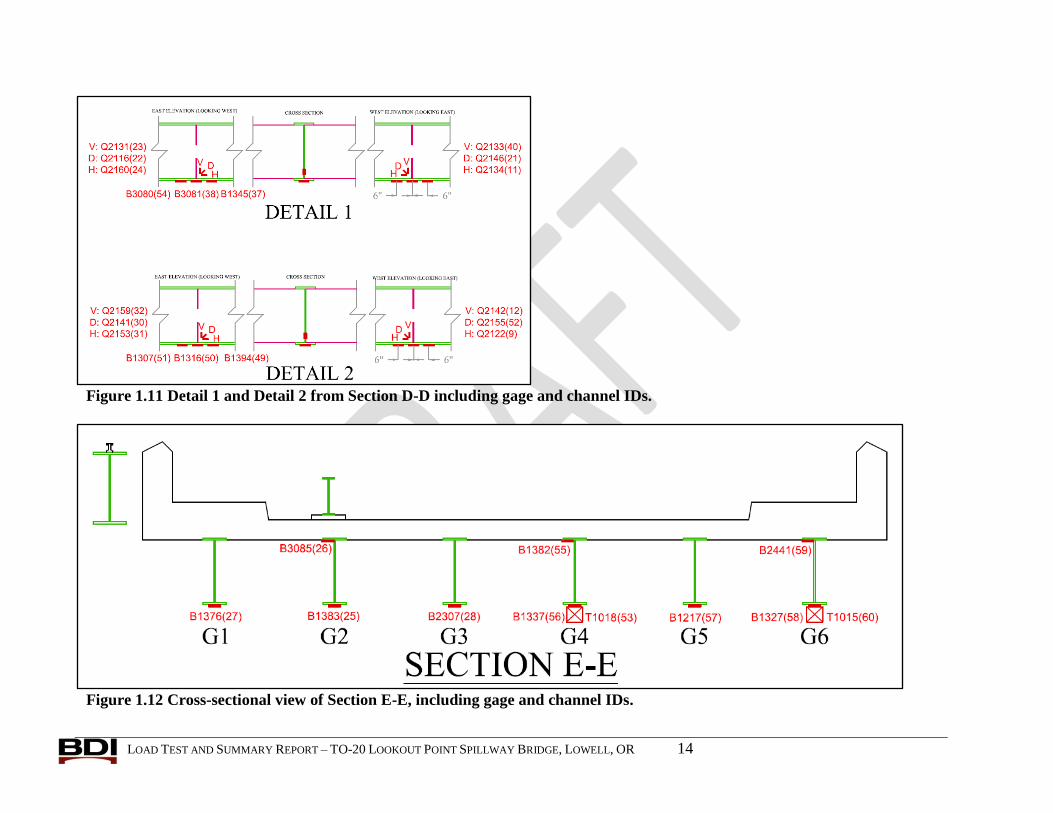
Twelve weldable foil gages were installed on Girder 4 and Girder 5 near their intersections
with the span’s southern diaphragm at the base of the web to determine if any stress
concentrations were developing in the girders due to the diaphragm’s connection to the girder
webs. The sensors were installed in groups of three, forming rosettes with one sensor installed
horizontally (H), one sensor installed vertically (V) and one sensor installed diagonally at 45
degrees from horizontal (D). The rosette made it possible to determine the principal stresses and
orientation, as well as the maximum shear stress at the origin of rosette.
The installed tiltmeters were centered 2 inches from the face of the nearest support and were
used to measure any rotation occurring at the ends of the beams. They were installed using the
same procedure as the strain transducers.
Once all of the sensors were installed, diagnostic load testing was completed in which data
was recorded at 40 Hz on all channels as the test truck rolled across the instrumented span at
approximately 1-3 mph. This process was repeated a minimum of two times for each testing
location to ensure reproducibility. One test was also completed along each load path during
which the test truck paused for 10 seconds while positioned with its front tires near the span’s
expansion joint and the rear tires close to midspan before continuing across the bridge. An
additional test was conducted where the test truck crossed the bridge at 10 mph. Throughout the
test procedures, no other vehicles were allowed on the bridge to ensure that the only responses
being measured would be those induced by the test truck. Additionally, the longitudinal position
of the truck was wirelessly tracked as it crossed the bridge, allowing the data to be presented as a
function of vehicle position in addition to time.
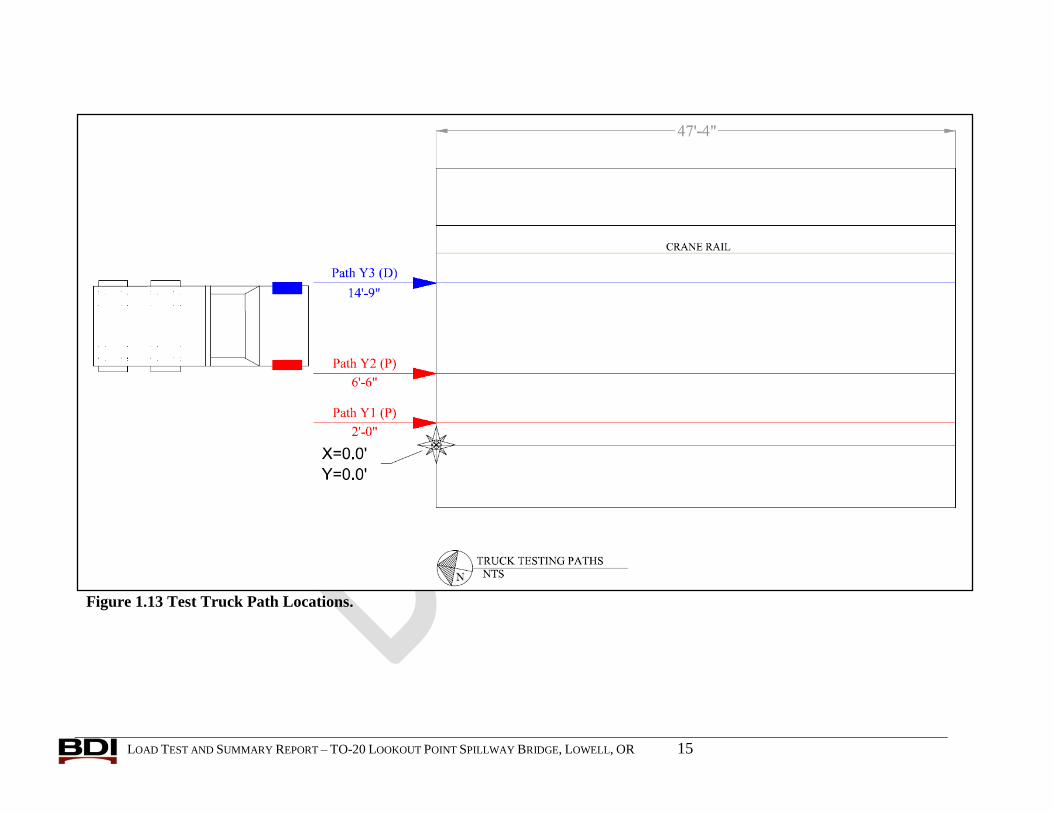
Three lateral truck positions were used with the vehicle driving in the southbound direction as
shown in Figure 1.13. It should be noted that the locations of the truck paths in this figure are
given as the transverse distance from either the front driver’s side wheel (D) or front passenger’s
side wheel (P) to the inside edge of the west curb along the north expansion joint.
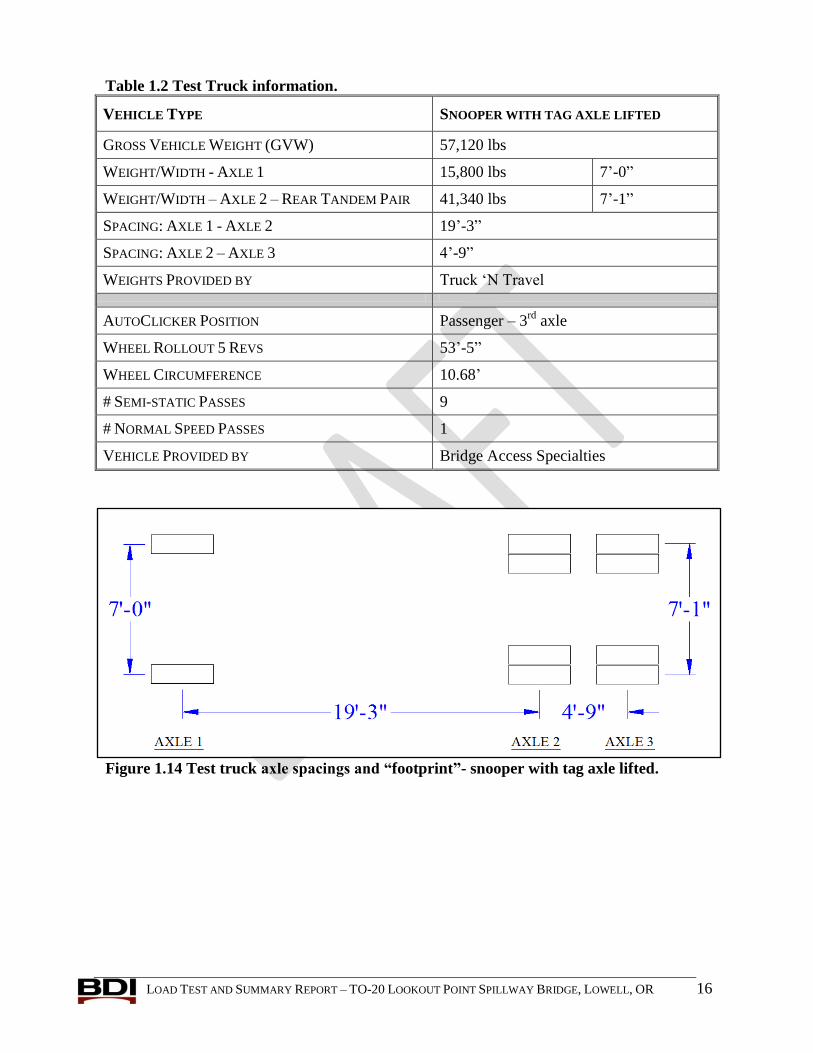
Test notes that include the data file names for each truck crossing are provided in Table 1.1.
The test vehicle’s gross weight and wheel rollout distance (required for tracking the truck’s
position as it crossed the structure) are provided in Table 1.2. The vehicle weight was obtained

LOAD TEST AND SUMMARY REPORT – TO-20 LOOKOUT POINT SPILLWAY BRIDGE, LOWELL, OR 6
from certified scales at a local gravel pit. Lastly, a “footprint” for the test truck is shown in
Figure 1.14.
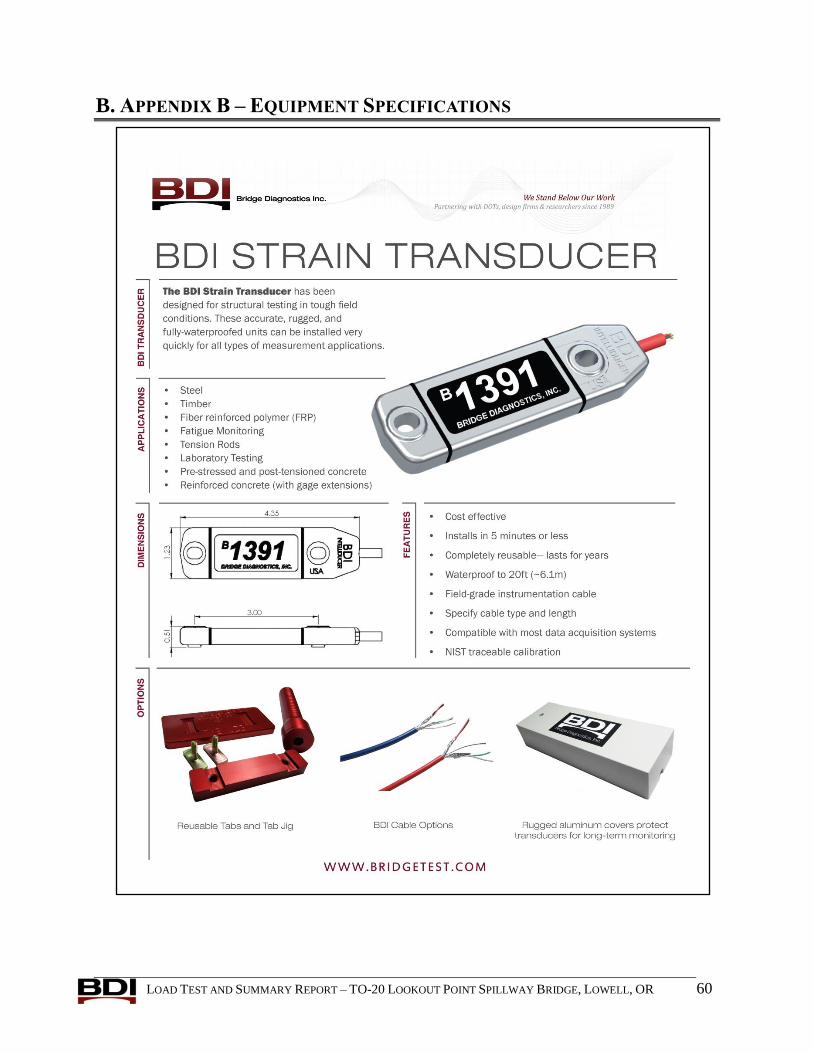
Please see Appendix B for the specifications on the strain transducers, rotation sensors, and
the wireless structural testing system. BDI would like to thank Tetra Tech INCA, Inc., USACE,
and Bridge Access Specialties for their help in scheduling, planning and completing this project!
Table 1.1 Structure description & testing notes
ITEM DESCRIPTION
STRUCTURE NAME Lookout Point Spillway Bridge
BDI Reference Number 130301-OR
TESTING DATE June 24th
and June 25th
CLIENT’S PROJECT ID # TO-20
LOCATION/ROUTE Lookout Point Dam, Lowell, WA
STRUCTURE TYPE Steel Girder Bridge
TOTAL NUMBER OF SPANS 5
CLEAR SPAN LENGTH(S) 42’-6”
SKEW N/A
STRUCTURE/ROADWAY WIDTHS Structure: 31’-0” / Roadway: 20’-0”
WEARING SURFACE Integral Concrete
OTHER STRUCTURE INFO N/A
SPANS TESTED 1 (Center Span)
TEST REFERENCE LOCATION
(X=0,Y=0) - BOW
The inside edge of the west curb in line with the north
expansion joint
TEST VEHICLE DIRECTION South
TEST BEGINNING POINT Front axle at X = 20’-0”
LATERAL LOAD POSITIONS
(PERPENDICULAR TO ROADWAY)
Y1 (P) = 2’-0” Y2 (P) = 6’-6”
Y3 (D) = 14’-9"
NUMBER/TYPE OF SENSORS
3” Strain Transducers – 44
Weldable Foil Gage - 12
Rotation Sensors – 4
SAMPLE RATE 40 Hz – Semi-static
NUMBER OF TEST VEHICLES 1
STRUCTURE ACCESS TYPE Snooper
STRUCTURE ACCESS PROVIDED BY BDI
TOTAL FIELD TESTING TIME 2 Days
ADDITIONAL NDT INFO N/A

LOAD TEST AND SUMMARY REPORT – TO-20 LOOKOUT POINT SPILLWAY BRIDGE, LOWELL, OR 7
TEST FILE INFORMATION
FILE NAME LATERAL
POSITION FIELD COMMENTS
Lookout_1.dat Y1 Truck crossed adjacent
span.
Lookout_2.dat Y1 Truck crossed adjacent
span.
Lookout_3.dat Y1
Truck paused with front
wheels at exp. joint for
10 sec. & continued off
adjacent span.
Lookout_4.dat Y3 Truck crossed adjacent
span.
Lookout_5.dat Y3 Truck crossed adjacent
span.
Lookout_6.dat Y3
Truck paused with front
wheels just short of exp.
joint for 10 sec. &
continued off adjacent
span. Double click after
pause.
Lookout_7.dat Y2 Truck crossed adjacent
span.
Lookout_8.dat Y2 Truck crossed adjacent
span.
Lookout_9.dat Y2
Truck paused with front
wheels just short of exp.
joint for 10 sec. &
continued off adjacent
span.
Lookout_10.dat Y2 ~10 mph
ADDITIONAL COMMENTS Weather: 70°F
LOAD TEST AND SUMMARY REPORT – TO-20 LOOKOUT POINT SPILLWAY BRIDGE, LOWELL, OR 8
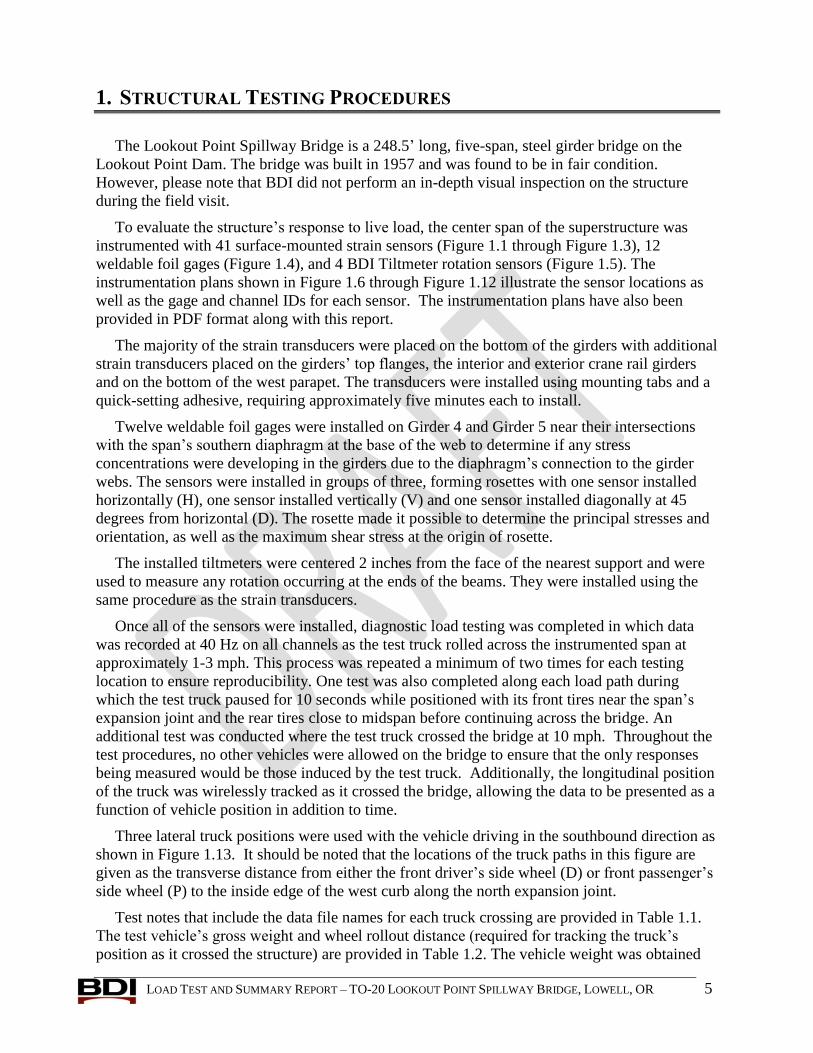
Figure 1.1 Strain transducer mounted on bottom of girder (Typical).
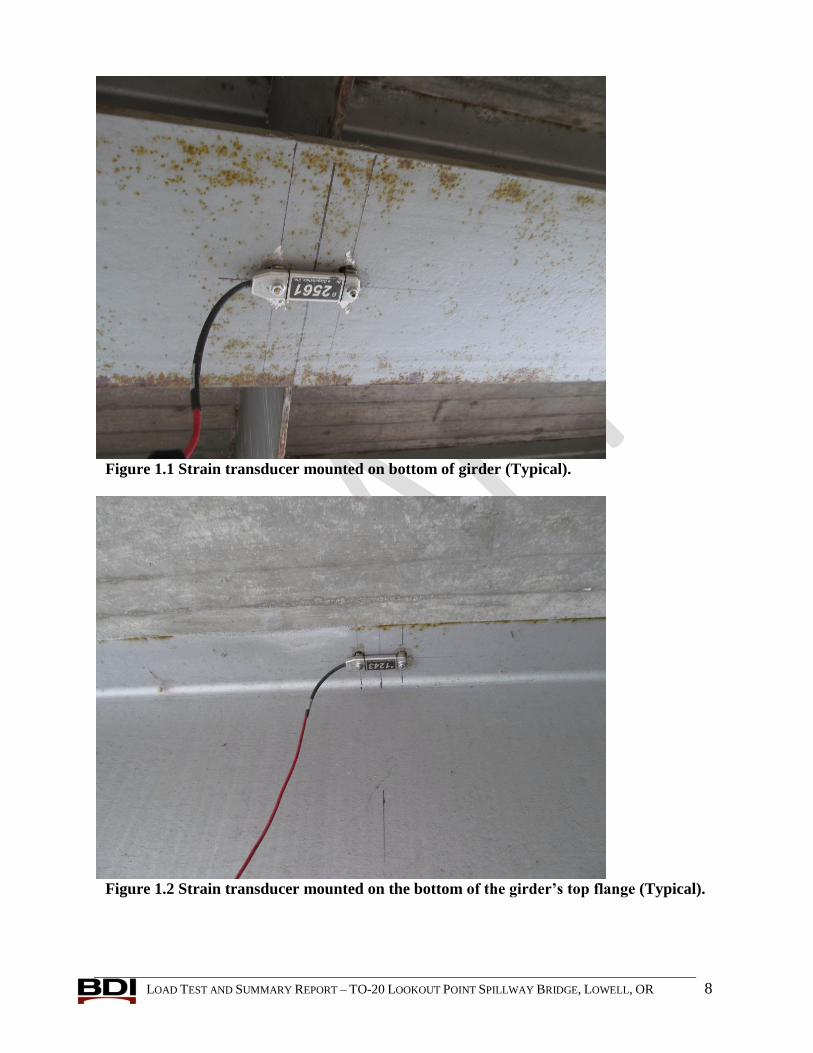
Figure 1.2 Strain transducer mounted on the bottom of the girder’s top flange (Typical).
LOAD TEST AND SUMMARY REPORT – TO-20 LOOKOUT POINT SPILLWAY BRIDGE, LOWELL, OR 9
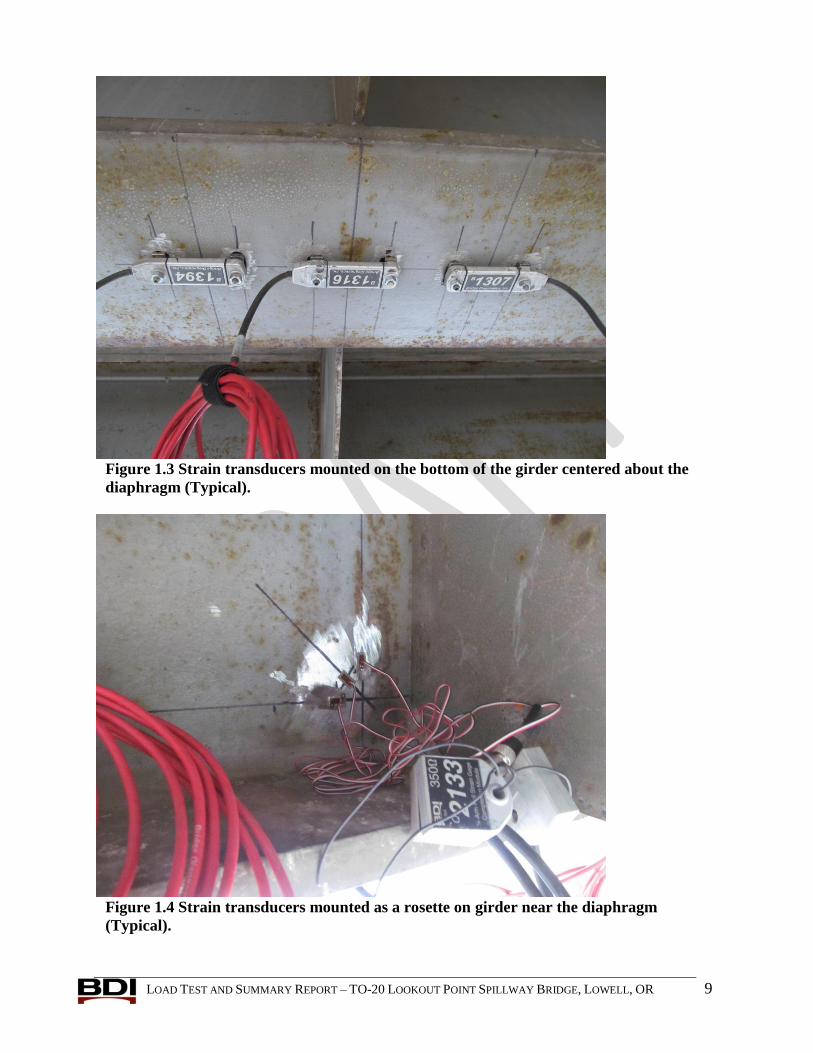
Figure 1.3 Strain transducers mounted on the bottom of the girder centered about the
diaphragm (Typical).
Figure 1.4 Strain transducers mounted as a rosette on girder near the diaphragm
(Typical).
LOAD TEST AND SUMMARY REPORT – TO-20 LOOKOUT POINT SPILLWAY BRIDGE, LOWELL, OR 10
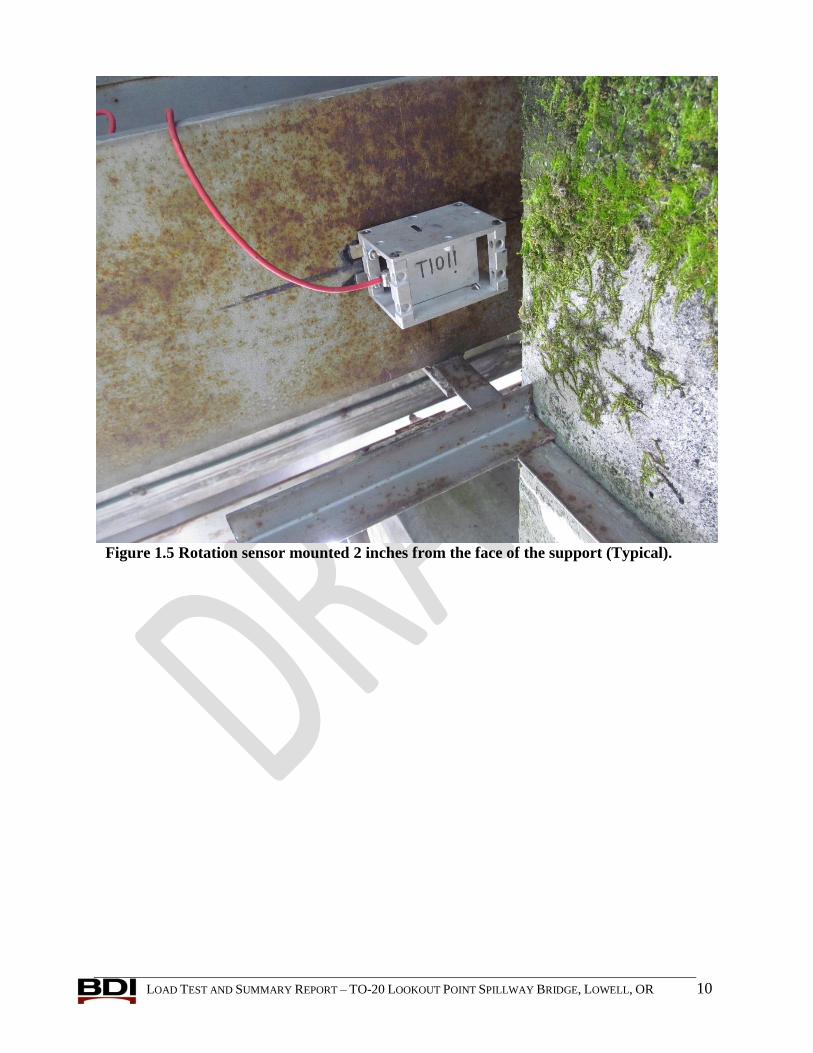
Figure 1.5 Rotation sensor mounted 2 inches from the face of the support (Typical).
LOAD TEST AND SUMMARY REPORT – TO-20 LOOKOUT POINT SPILLWAY BRIDGE, LOWELL, OR 11
Figure 1.6 Instrumentation Plan View, including gage locations.
LOAD TEST AND SUMMARY REPORT – TO-20 LOOKOUT POINT SPILLWAY BRIDGE, LOWELL, OR 12
Figure 1.7 Cross-sectional view of Section A-A, including gage and channel IDs.
Figure 1.8 Cross-sectional view of Section B-B, including gage and channel IDs.
LOAD TEST AND SUMMARY REPORT – TO-20 LOOKOUT POINT SPILLWAY BRIDGE, LOWELL, OR 13
Figure 1.9 Cross-sectional view of Section C-C, including gage and channel IDs.
Figure 1.10 Cross-sectional view of Section D-D, including gage and channel IDs.
LOAD TEST AND SUMMARY REPORT – TO-20 LOOKOUT POINT SPILLWAY BRIDGE, LOWELL, OR 14
Figure 1.11 Detail 1 and Detail 2 from Section D-D including gage and channel IDs.
Figure 1.12 Cross-sectional view of Section E-E, including gage and channel IDs.
LOAD TEST AND SUMMARY REPORT – TO-20 LOOKOUT POINT SPILLWAY BRIDGE, LOWELL, OR 15
Figure 1.13 Test Truck Path Locations.
LOAD TEST AND SUMMARY REPORT – TO-20 LOOKOUT POINT SPILLWAY BRIDGE, LOWELL, OR 16
Table 1.2 Test Truck information.
VEHICLE TYPE SNOOPER WITH TAG AXLE LIFTED
GROSS VEHICLE WEIGHT (GVW) 57,120 lbs
WEIGHT/WIDTH - AXLE 1 15,800 lbs 7’-0”
WEIGHT/WIDTH – AXLE 2 – REAR TANDEM PAIR 41,340 lbs 7’-1”
SPACING: AXLE 1 - AXLE 2 19’-3”
SPACING: AXLE 2 – AXLE 3 4’-9”
WEIGHTS PROVIDED BY Truck ‘N Travel
AUTOCLICKER POSITION Passenger – 3rd
axle
WHEEL ROLLOUT 5 REVS 53’-5”
WHEEL CIRCUMFERENCE 10.68’
# SEMI-STATIC PASSES 9
# NORMAL SPEED PASSES 1
VEHICLE PROVIDED BY Bridge Access Specialties
Figure 1.14 Test truck axle spacings and “footprint”- snooper with tag axle lifted.
LOAD TEST AND SUMMARY REPORT – TO-20 LOOKOUT POINT SPILLWAY BRIDGE, LOWELL, OR 17
2. QUALITATIVE REVIEW OF TEST DATA
All of the field data was examined graphically to determine its quality and usefulness for
future analytical comparisons. Some of the typical indicators of data quality include
reproducibility between identical truck crossings, elastic behavior (strains returning to zero after
truck crossing), and any unusual-shaped responses that might indicate nonlinear behavior or
possible gage malfunctions.
RESPONSES AS A FUNCTION OF LOAD POSITION: Data recorded from the wireless truck position
indicator (BDI Autoclicker) was processed so that all of the corresponding response data
could be presented as a function of vehicle position. All of the response data included in the
MS Excel spreadsheets has been presented this way. The first column in each worksheet
indicates the longitudinal position of the test truck’s front axle relative to the test reference
point, which was located at the inside edge of the west curb on the north expansion joint.
This was done so that during analytical modeling, important measurement responses could be
directly related to a specific load location rather than an arbitrary point in time.
Once all data was processed as a function of load position, one file from each truck path was
selected as having the best apparent quality. This selected data was further processed as
discussed below. Table 2.1 provides a list of the selected data for the three truck paths. It is
recommended that this selected data be used for analysis of this structure.
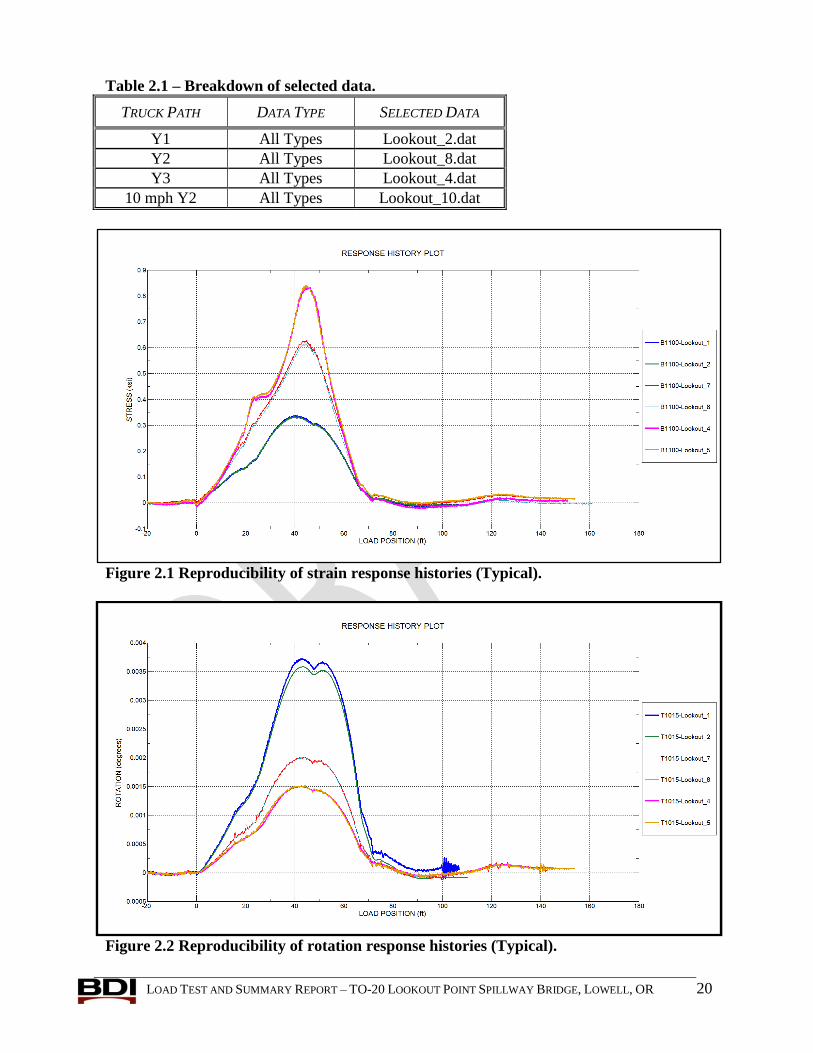
REPRODUCIBILITY AND LINEARITY: Responses from identical truck passes were very
reproducible as shown in Figure 2.1 and Figure 2.2. In addition, all response data appeared
to be linear with respect to load magnitude and truck position. Note that the majority of
responses returned to zero (except for some slight thermal drift), indicating elastic behavior.
All of the response histories had a similar degree of reproducibility and linearity, indicating
that the data collected was of good quality. Note that since the thermal drift was very minor,
it was not removed from the data.
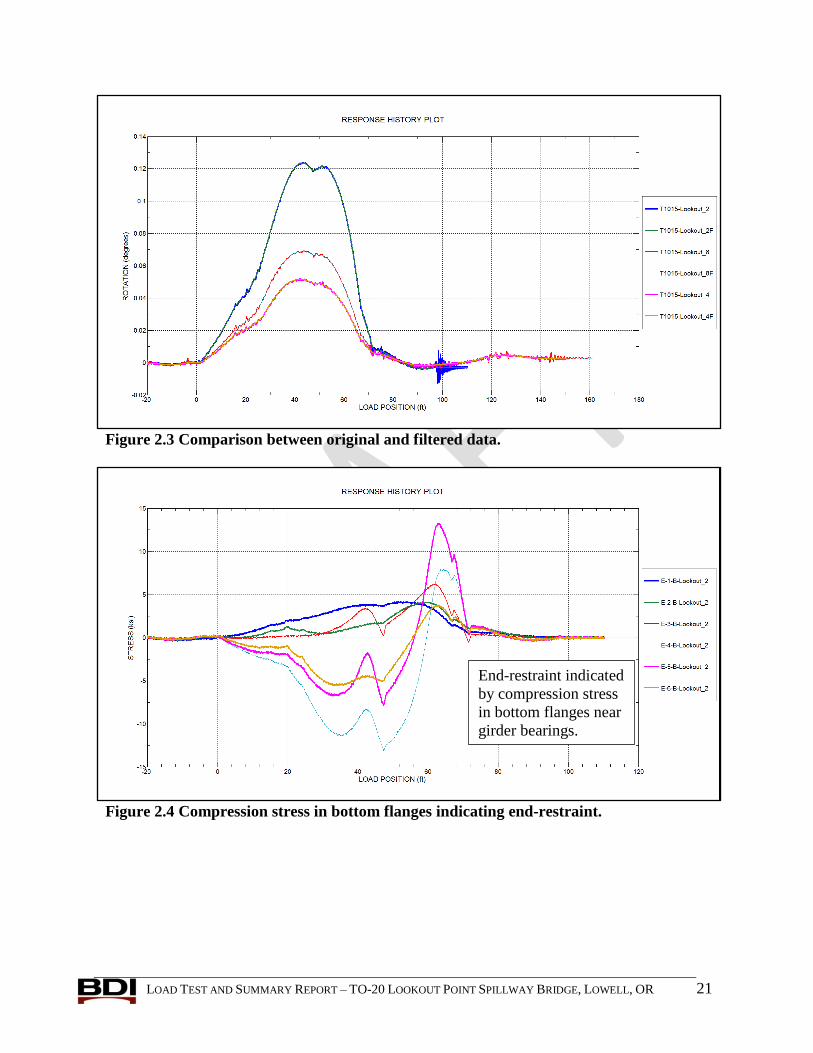
NOISE REMOVAL FROM DATA: Significant noise was observed in the portions of the original
rotation and weldable foil gage responses. So that the noise would not impact the enveloped
responses or principal stress calculations, these sensor responses for the selected data files
were cleaned up using a low-pass Butterworth filter. As shown in Figure 2.3, filtering
clarified the data significantly. Please note that while some of the 3-inch strain sensor data
appears to be noisy, the noise was trivial and remained unfiltered due to the low magnitude
of the responses relative to the peak stress responses seen in the rest of the data.
OBSERVED END-RESTRAINT: Structural plans indicated the Lookout Point Spillway Bridge was
designed as five identical simply supported spans. During the data review, a significant
amount of end-restraint was observed as compression in the bottom flanges near the girder
bearings, as shown in Figure 2.4. While the bearing details could not physically develop
moment resistance, they could resist axial displacement of the girders bottom flange. The
horizontal bearing reactions developed an arching action and induced negative moment at the
beam-ends since the reaction forces were applied eccentrically from the girders’ neutral axis.
This effect likely reduced midspan moment by as much as 10 to 20 percent on some beams
based on test results and analyses of similar bridges. It was apparent, however, the degree of
end-restraint varied with truck location and also between girder bearing locations. Therefore
the observed end-restraint should not be utilized for load rating purposes. It will be important
LOAD TEST AND SUMMARY REPORT – TO-20 LOOKOUT POINT SPILLWAY BRIDGE, LOWELL, OR 18
to consider end-restraint with respect to the load test results as it had a significant influence
on all of the flexural responses.
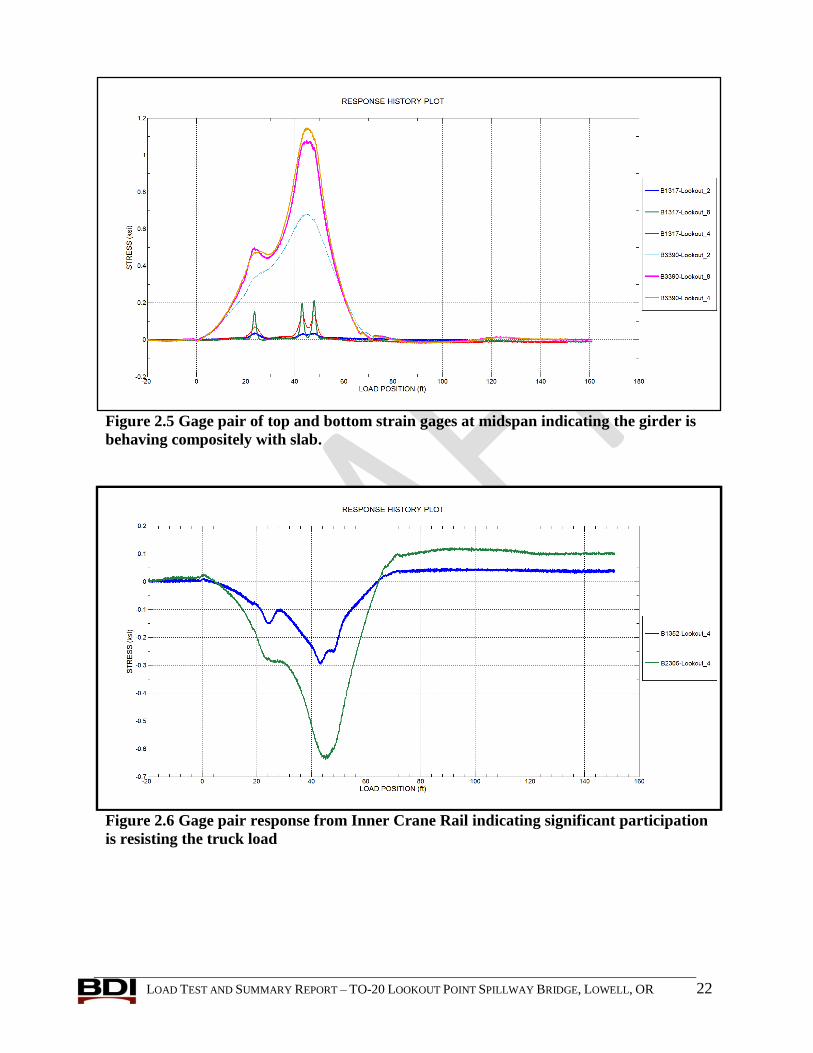
OBSERVED LOAD RESISTANCE IN GIRDER, DECK, CURB, AND CRANE RAILS: Strain sensors were
installed on both the girders’ bottom and top flanges to help determine the level of composite
action between the girders and deck. As shown in Figure 2.6, the bottom midspan gage
experienced high tension while its top flange paired gage experienced a small level of tension
only when directly loaded. The tension seen in both sensors indicates the neutral axis of the
girder is slightly above the top flange sensor in the slab, meaning the girder is acting
composite with the slab. It should also be noted that the neutral axis of the exterior girders
was found to be slightly higher than in the interior girders, indicating the curbs were
contributing to the stiffness of the exterior girders. Additionally, the interior crane-rail girder
was found to participate in resisting the truck load, as shown in Figure 2.6, while the outside
crane-rail girder experienced minimal response as a result of the applied live-loads (Figure
2.7).
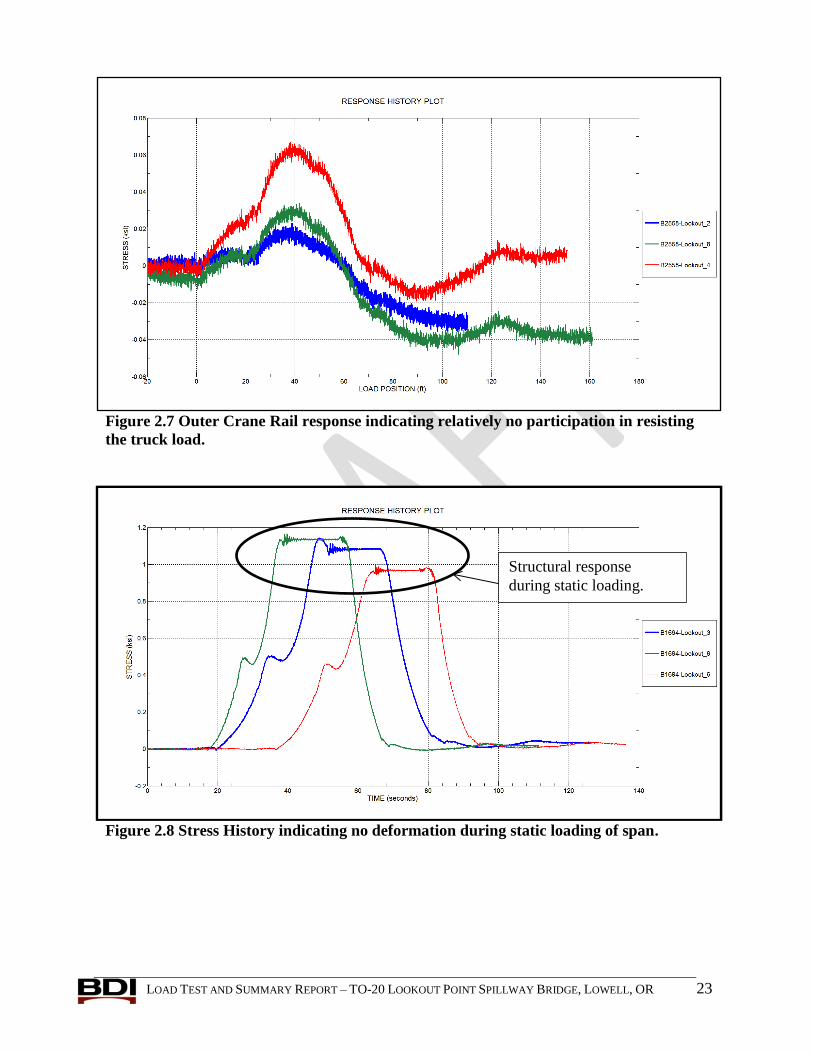
STRUCTURAL RESPONSE TO STATIC LOADING: One test was performed on each load path during
which the test truck paused for approximately 10 seconds with its front axle near the
expansion joint as it moved across the instrumented span. The position of the test truck
during this pause placed the truck’s rear axles close to midspan so that the pause would occur
during maximum structural response. The goal of this testing was to determine if the
structure deformed under completely static loading conditions. As seen in Figure 2.8, the
structure experienced some dynamic effects due to the truck stopping and starting while on
the span, but there was no additional variation in stress between the moving and static load
response.
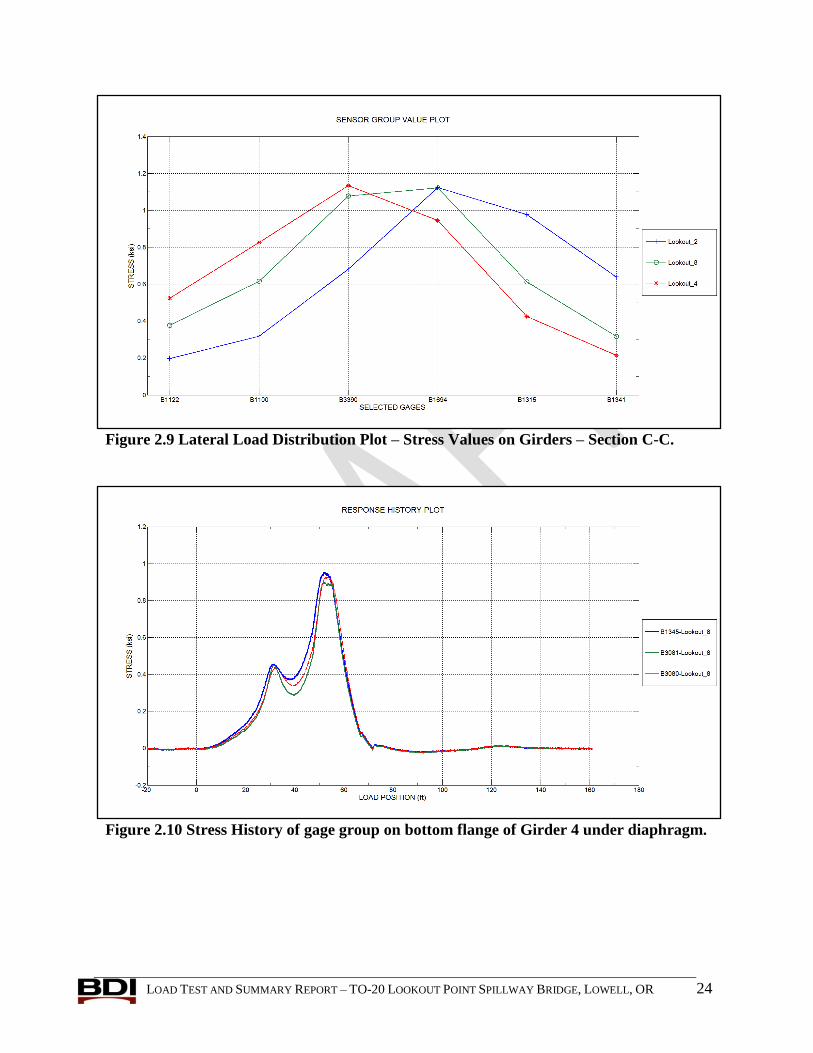
LATERAL LOAD DISTRIBUTION: When evaluating a bridge for the purpose of developing a load
rating, the bridge’s ability to laterally distribute load is an essential characteristic to quantify.
Lateral distribution is most easily observed by plotting the response values from an entire
gage line cross-section as done in Figure 2.9. The response values shown in this figure
correspond to the longitudinal load positions producing the maximum strain responses for
each truck path at the midspan gage line (Section C-C) on the girders. From this figure, it can
be observed that the structure exhibited a significant amount of lateral load distribution
across its cross-section. This behavior is important because a composite steel girder structure
typically distributes load through its cross-section much better than what is assumed using
AASHTO equivalent slab width method.
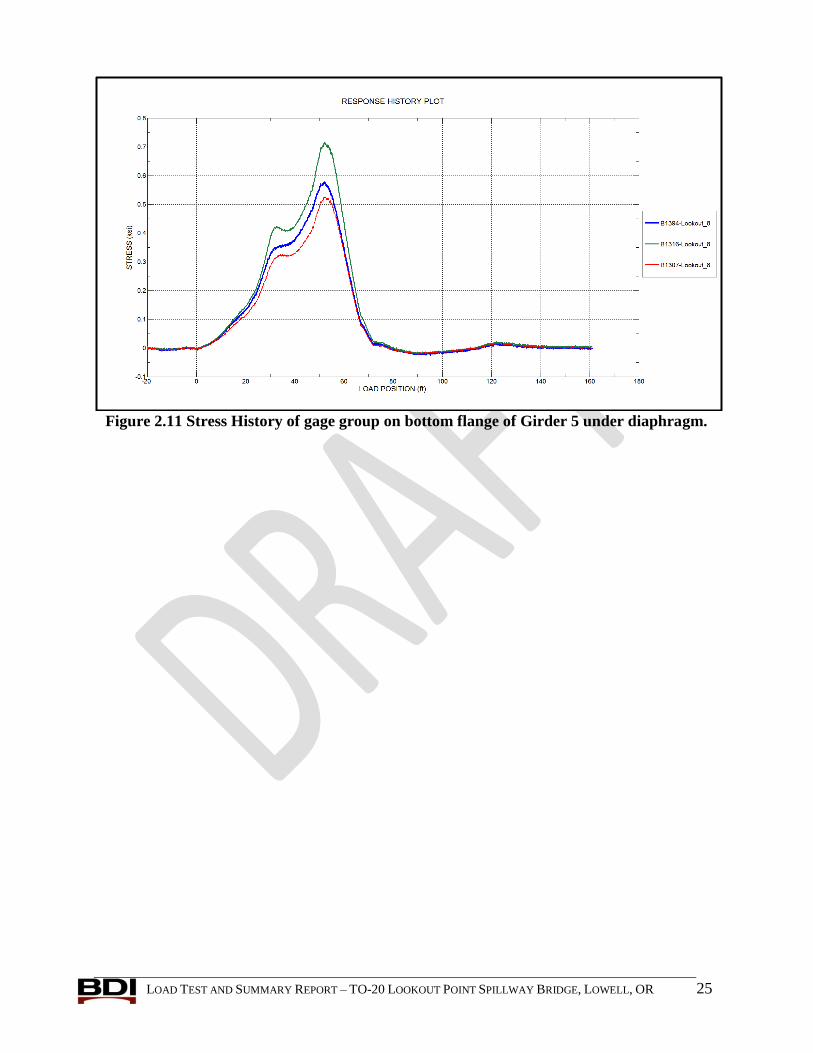
STRESS VARIATION IN THE GIRDERS AT DIAPHRAGM CONNECTIONS: Two girders were heavily
instrumented on their bottom flange at Cross Section D-D. Girder 4 and Girder 5 each had
three 3-inch strain gages mounted on the bottom of the bottom flange spaced at 6 inches
longitudinally and centered about the diaphragm. Stress histories from Girder 4 are shown in
Figure 2.10 when the girder is directly loaded by the test truck. These responses illustrated a
relatively uniform variation with the largest stress occurring in the transducer closest to
midspan. The same comparison in Girder 5 had slightly different results, as shown in Figure
2.11, since the largest stress was measured by the transducer centered under the diaphragm.
This was likely due to a variation in the load application between the two girders. Girder 4
was directly loaded by the truck, which was essentially straddling the girder. Girder 5 was
under the edge of the roadway and could only be directly loaded by one wheel line. It is
likely that Girder 5 experienced more indirect load transfer from the deck and diaphragm
than does Girder 4.
LOAD TEST AND SUMMARY REPORT – TO-20 LOOKOUT POINT SPILLWAY BRIDGE, LOWELL, OR 19
STRESS CONCENTRATIONS IN THE GIRDERS AT THE DIAPHRAGMS: Weldable foil strain gage
rosettes were installed on both sides of Girder 4 and Girder 5 webs. The strain gages were
installed as close as possible to the diaphragm connections to help determine if the stress
concentrations were induced by the welded connection. The rosette configuration enabled
calculations of principal stress, principal stress orientation, and maximum shear stress at the
rosette origins.
Principal stress, principal stress orientation, and maximum shear stress calculations were
made for the rosette locations on Girder 4 and Girder 5 using Error! Reference source not
found. through Error! Reference source not found.. Computed stresses profiles were
generated for each truck path and were provided in the MS Excel file included in the
submittal package. To determine the strain components in each equation, strain
measurements from identical sensor locations on either side of a girder’s web were averaged
to eliminate any out-of-plane effects. Since sensor Q2155 was determined to be a dead gage,
only its mirrored diagonal gage, Q4141, was used in the stress calculations as the diagonal
strain at Detail 2. The conversion from strain to stress was performed based on a plane stress
condition in the girder web. The controlling principal stresses in each girder for each load
path are provided in Table 2.2. The orientation of maximum principal stress was
approximately -10º with a maximum principal stress of 1.85 ksi and a maximum shear stress
of 0.94 ksi. Please note that the stress and orientation values provided are specific to the
exact locations are which the measurements were taken and specific to the applied load.
When the principal stress values are compared to the stress values in the bottom flange under
the diaphragm at Section D-D, it is apparent that there are significant stress concentrations in
the girder webs. For example, the Girder 4 bottom flange sensors saw a maximum response
of approximately 0.95 ksi while the principal stress in that girder’s web was calculated to be
1.85. A nearly 100% greater stress in the bottom of the web than in the bottom flange
indicates that the welded connected of the diaphragm to the girder web did induce a
significant stress concentration. This is not a concern for this structure because the measured
and computed stress levels were still relatively low and the bridge has very low traffic
volume.
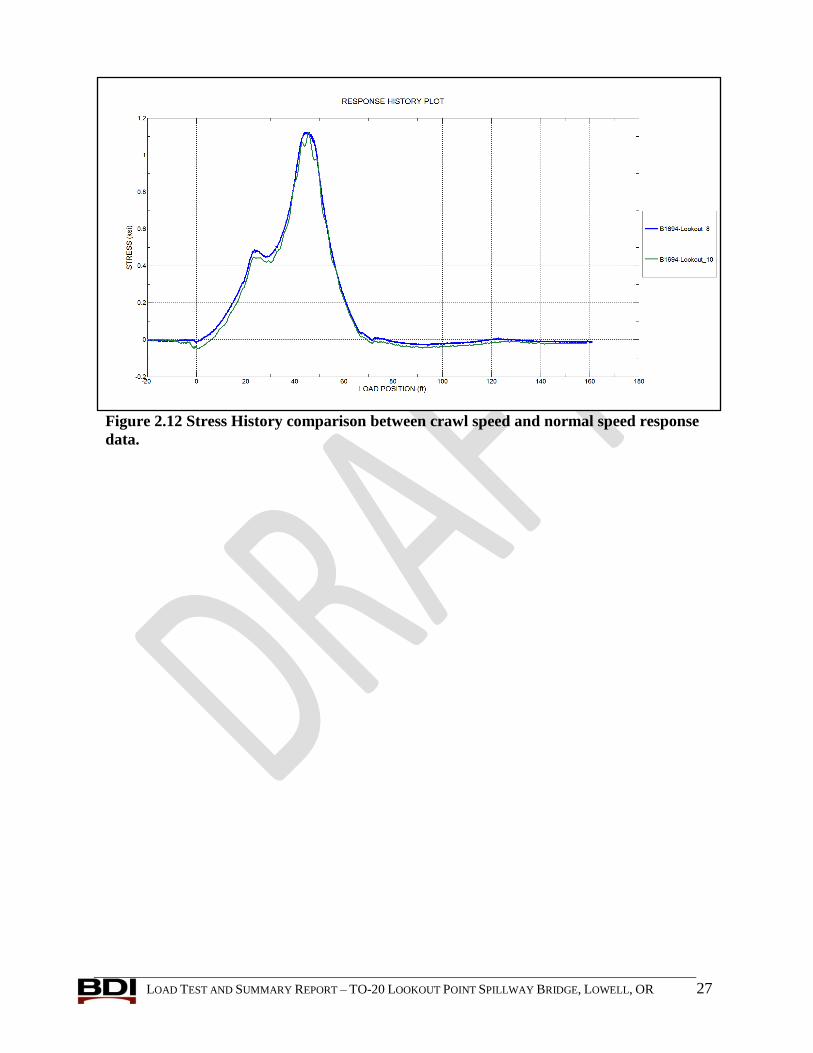
COMPARISON BETWEEN NORMAL SPEED AND CRAWL SPEED TESTS: Responses between the crawl
speed (~1-3mph) and normal speed (10 mph) tests run along path Y2 were compared to
provide information on the impact effects during normal operation. As shown in Figure 2.12,
essentially no change in peak response magnitude was observed between the crawl speed
(blue) and the normal speed tests (green). However, there were small dynamic effects
observed in the overall response indicating approximately a 6% impact effect. It should be
noted that much more testing, including multiple vehicle types and speeds, would be
necessary to obtain a field-based impact factor for the structure. However, this comparison
provides evidence that the typical AASHTO impact used for rating is most likely
conservative.
LOAD TEST AND SUMMARY REPORT – TO-20 LOOKOUT POINT SPILLWAY BRIDGE, LOWELL, OR 20
Table 2.1 – Breakdown of selected data.
TRUCK PATH DATA TYPE SELECTED DATA
Y1 All Types Lookout_2.dat
Y2 All Types Lookout_8.dat
Y3 All Types Lookout_4.dat
10 mph Y2 All Types Lookout_10.dat
Figure 2.1 Reproducibility of strain response histories (Typical).
Figure 2.2 Reproducibility of rotation response histories (Typical).
LOAD TEST AND SUMMARY REPORT – TO-20 LOOKOUT POINT SPILLWAY BRIDGE, LOWELL, OR 21
Figure 2.3 Comparison between original and filtered data.
Figure 2.4 Compression stress in bottom flanges indicating end-restraint.
End-restraint indicated
by compression stress
in bottom flanges near
girder bearings.
LOAD TEST AND SUMMARY REPORT – TO-20 LOOKOUT POINT SPILLWAY BRIDGE, LOWELL, OR 22
Figure 2.5 Gage pair of top and bottom strain gages at midspan indicating the girder is
behaving compositely with slab.
Figure 2.6 Gage pair response from Inner Crane Rail indicating significant participation
is resisting the truck load
LOAD TEST AND SUMMARY REPORT – TO-20 LOOKOUT POINT SPILLWAY BRIDGE, LOWELL, OR 23
Figure 2.7 Outer Crane Rail response indicating relatively no participation in resisting
the truck load.
Figure 2.8 Stress History indicating no deformation during static loading of span.
Structural response
during static loading.
LOAD TEST AND SUMMARY REPORT – TO-20 LOOKOUT POINT SPILLWAY BRIDGE, LOWELL, OR 24
Figure 2.9 Lateral Load Distribution Plot – Stress Values on Girders – Section C-C.
Figure 2.10 Stress History of gage group on bottom flange of Girder 4 under diaphragm.
LOAD TEST AND SUMMARY REPORT – TO-20 LOOKOUT POINT SPILLWAY BRIDGE, LOWELL, OR 25
Figure 2.11 Stress History of gage group on bottom flange of Girder 5 under diaphragm.

LOAD TEST AND SUMMARY REPORT – TO-20 LOOKOUT POINT SPILLWAY BRIDGE, LOWELL, OR 26
Principal strain and stress calculations
Equation 1
Equation 2
Equation 3
Equation 4
Equation 5
√(
)
Equation 6
Equation 7
Equation 8
Equation 9
(
(
)
)
Equation 10
Table 2.2 Controlling principal strain responses at Section A-A and Section C-C.
Girder 4 Girder 5
σP1 (ksi) σP2 (ksi) θP (deg) τmax (ksi) σP1 (ksi) σP2 (ksi) θP (deg) τmax (ksi)
Path Y1 1.84 -0.05 -9.39 0.94 1.75 -0.04 -13.07 0.90
Path Y2 1.85 -0.03 -8.98 0.94 1.12 0.08 -5.89 0.52
Path Y3 1.62 -0.01 -9.55 0.82 0.81 0.06 -5.39 0.38
LOAD TEST AND SUMMARY REPORT – TO-20 LOOKOUT POINT SPILLWAY BRIDGE, LOWELL, OR 27
Figure 2.12 Stress History comparison between crawl speed and normal speed response
data.

LOAD TEST AND SUMMARY REPORT – TO-20 LOOKOUT POINT SPILLWAY BRIDGE, LOWELL, OR 28
3. CONCLUSIONS
Load tests indicated that the bridge was performing in a linear-elastic manner, and there were
no major signs of distress. The following conclusions were made during the preliminary data
review:
All of the response histories were reproducible and linear (with minimal thermal drift in
the strain responses) indicating that the data collected was of good quality.
Rotation sensor data and weldable foil gage data presented in the processed data Excel
file was filtered to reduce noise levels.
Responses indicated that there is a small level of axial end-restraint on the girders
provided by the bearing conditions. This end-restraint likely causes reductions in midspan
flexure by 10 to 20 percent based on analyses of similar structures.
Top and bottom gage pairs on the girders indicated the girders were acting compositely
with the deck.
Responses in the interior crane rail girder indicated it was participating in the live load
resistance. The exterior crane rail, which was bolted to the parapet experienced minimal
live-load response.
Significant lateral load distribution was observed during the load test. All 6 girders
provided significant contribution to the load response.
Principal stress calculations in girder webs near the diaphragm compared with girder
bottom flange responses indicated significant stress concentrations in the girder webs due
to the welded diaphragm connection to the web. Principal stresses in the web were as
much as 100% higher than those in the bottom flange.
The strain response histories showed minimal thermal drift in the sensors. Therefore, no
thermal correction was applied to the selected processed data.
As a whole, the load tests were very successful, and quality data was obtained. BDI would
like to thank Tetra Tech INCA, Inc. and USACE for organizing the project, and the Bridge
Access Specialties for providing the access/testing vehicles and field support.
The load test results presented in this report correspond to the superstructure at the time of
testing. Any further structural degradation, damage, and/or retrofits must be taken into account
in future ratings.
LOAD TEST AND SUMMARY REPORT – TO-20 LOOKOUT POINT SPILLWAY BRIDGE, LOWELL, OR 29
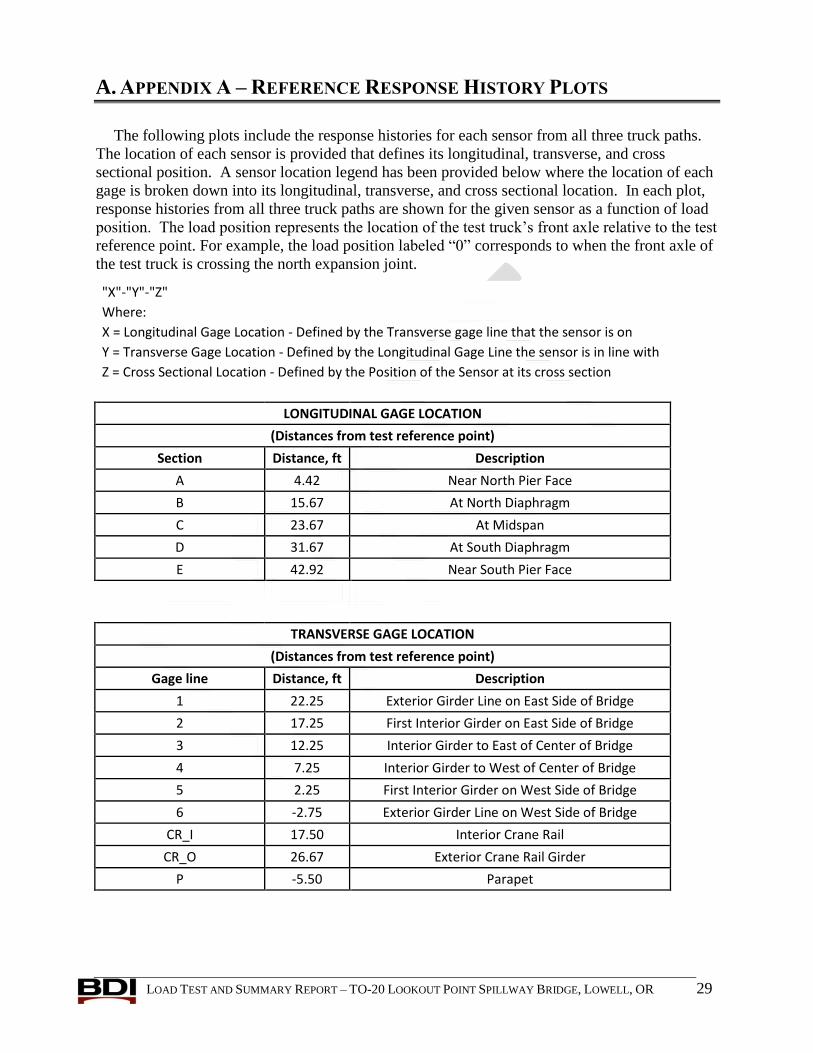
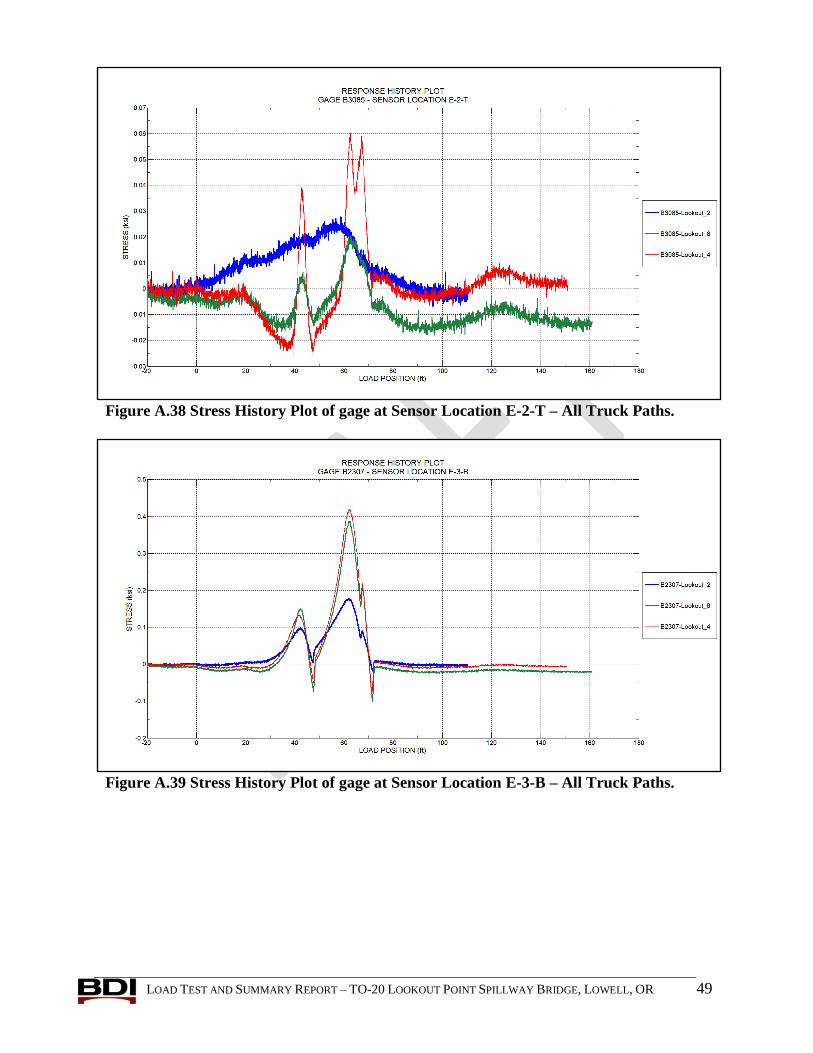
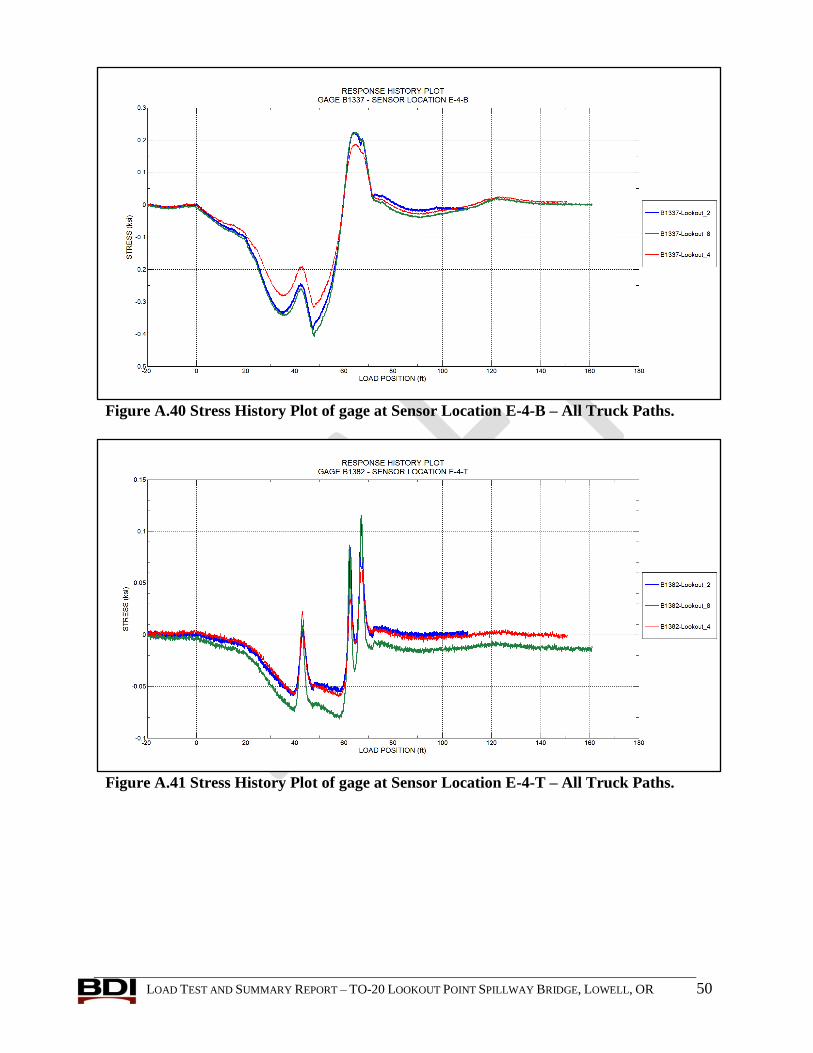
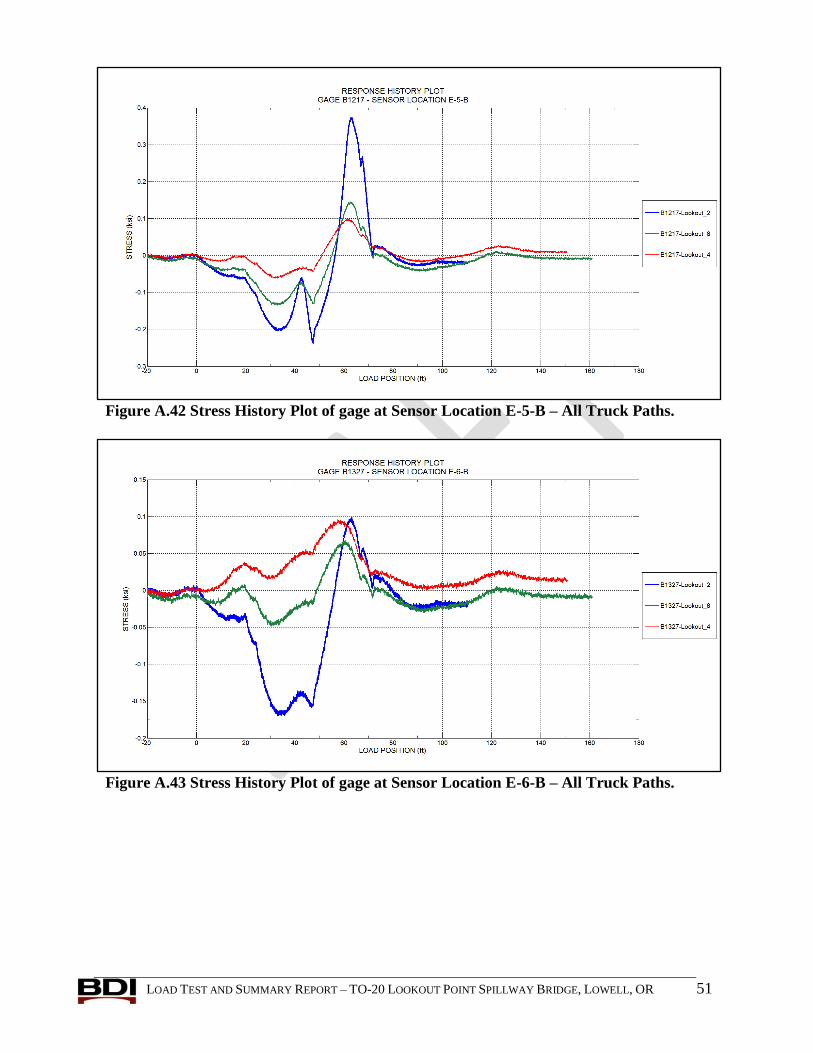
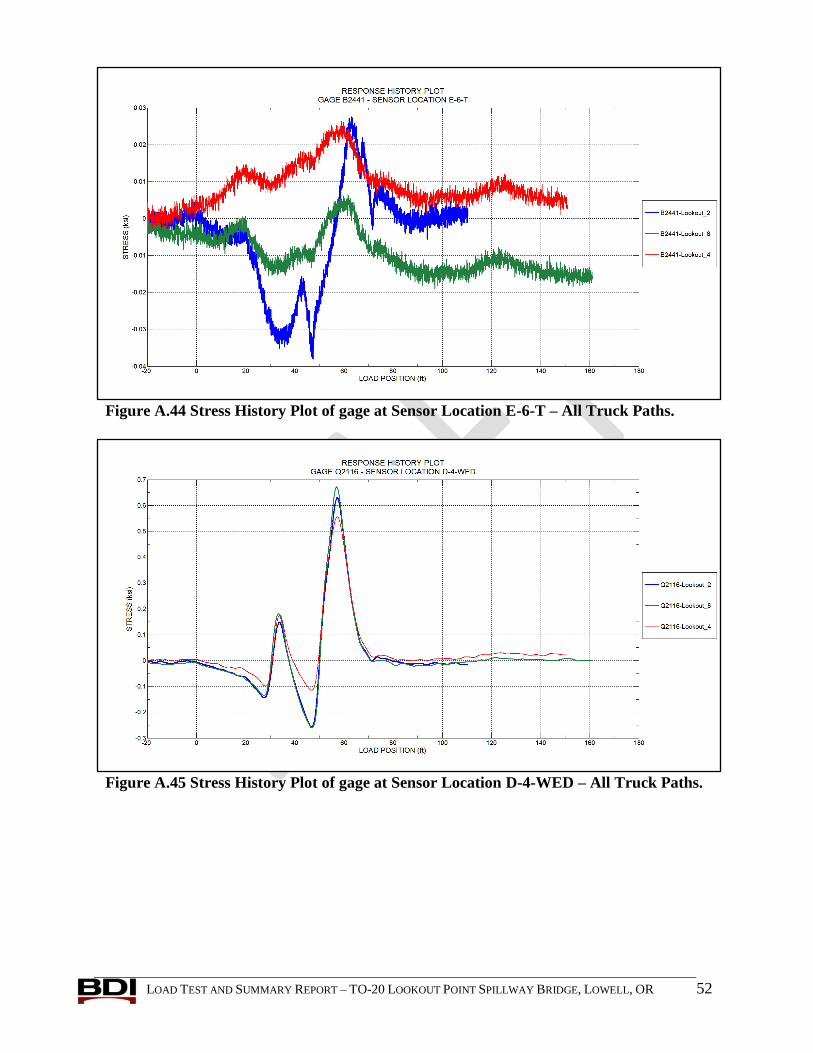
A. APPENDIX A – REFERENCE RESPONSE HISTORY PLOTS
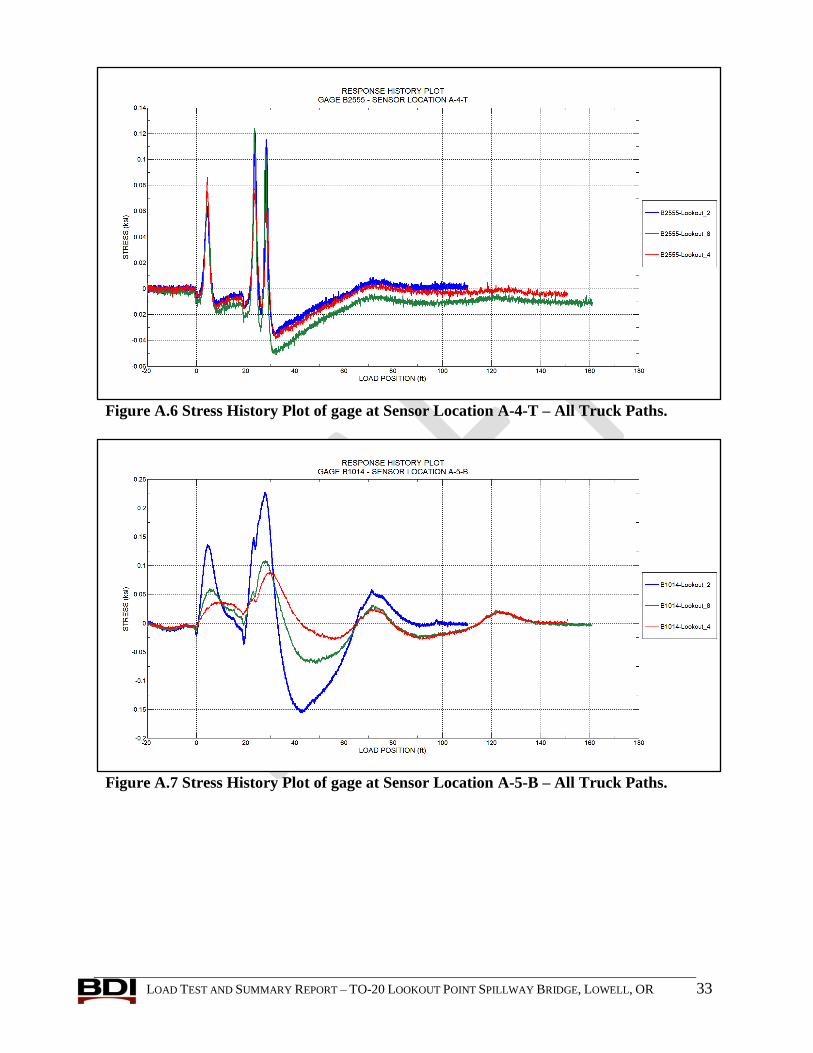
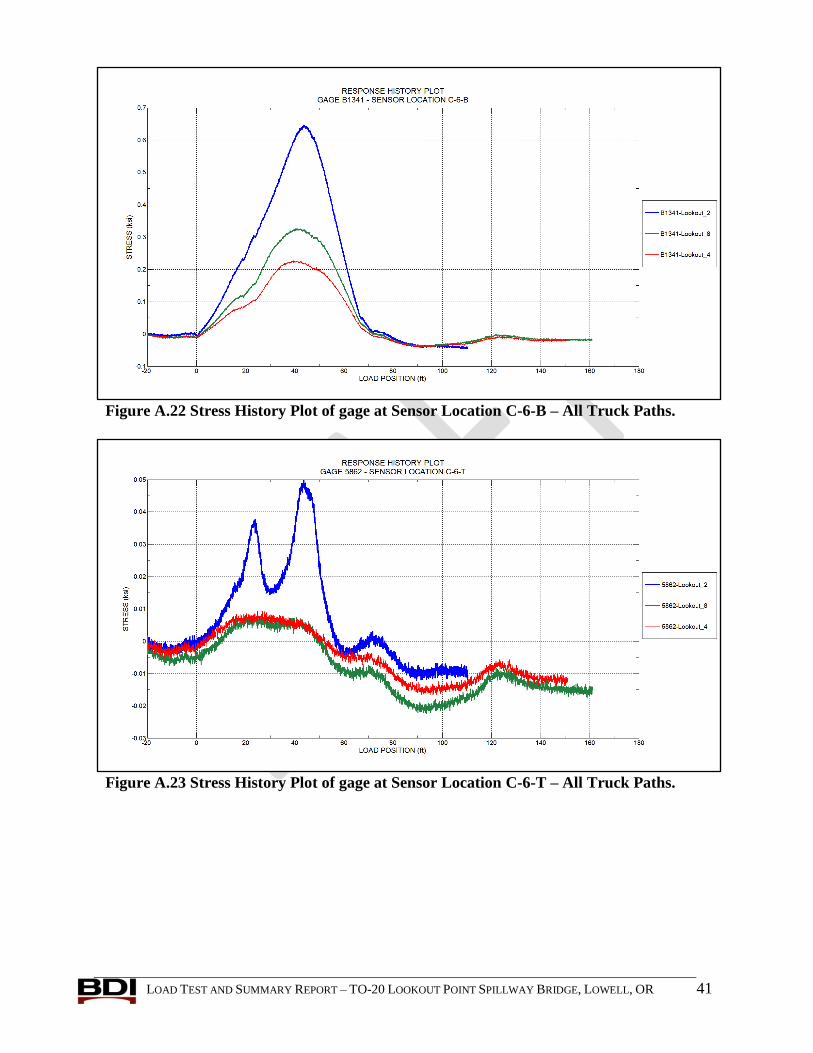
The following plots include the response histories for each sensor from all three truck paths.
The location of each sensor is provided that defines its longitudinal, transverse, and cross
sectional position. A sensor location legend has been provided below where the location of each
gage is broken down into its longitudinal, transverse, and cross sectional location. In each plot,
response histories from all three truck paths are shown for the given sensor as a function of load
position. The load position represents the location of the test truck’s front axle relative to the test
reference point. For example, the load position labeled “0” corresponds to when the front axle of
the test truck is crossing the north expansion joint.
"X"-"Y"-"Z"
Where:
X = Longitudinal Gage Location - Defined by the Transverse gage line that the sensor is on
Y = Transverse Gage Location - Defined by the Longitudinal Gage Line the sensor is in line with
Z = Cross Sectional Location - Defined by the Position of the Sensor at its cross section
LONGITUDINAL GAGE LOCATION
(Distances from test reference point)
Section Distance, ft Description
A 4.42 Near North Pier Face
B 15.67 At North Diaphragm
C 23.67 At Midspan
D 31.67 At South Diaphragm
E 42.92 Near South Pier Face
TRANSVERSE GAGE LOCATION
(Distances from test reference point)
Gage line Distance, ft Description
1 22.25 Exterior Girder Line on East Side of Bridge
2 17.25 First Interior Girder on East Side of Bridge
3 12.25 Interior Girder to East of Center of Bridge
4 7.25 Interior Girder to West of Center of Bridge
5 2.25 First Interior Girder on West Side of Bridge
6 -2.75 Exterior Girder Line on West Side of Bridge
CR_I 17.50 Interior Crane Rail
CR_O 26.67 Exterior Crane Rail Girder
P -5.50 Parapet
LOAD TEST AND SUMMARY REPORT – TO-20 LOOKOUT POINT SPILLWAY BRIDGE, LOWELL, OR 30
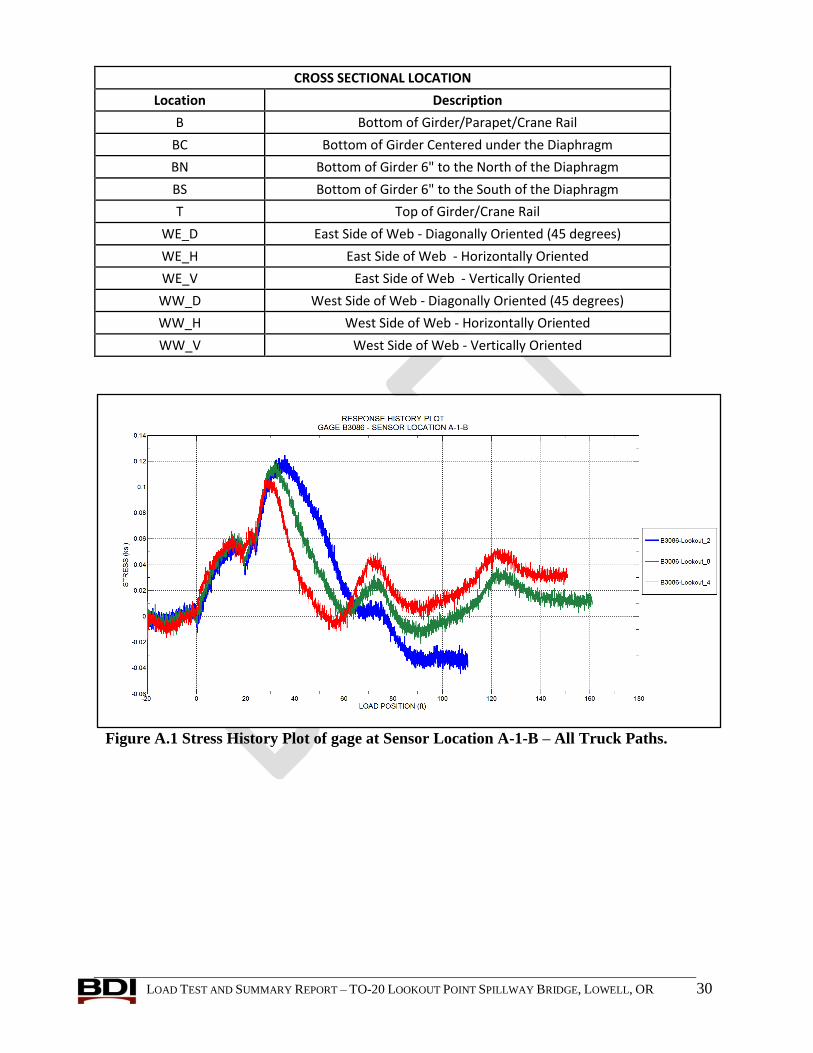
CROSS SECTIONAL LOCATION
Location Description
B Bottom of Girder/Parapet/Crane Rail
BC Bottom of Girder Centered under the Diaphragm
BN Bottom of Girder 6" to the North of the Diaphragm
BS Bottom of Girder 6" to the South of the Diaphragm
T Top of Girder/Crane Rail
WE_D East Side of Web - Diagonally Oriented (45 degrees)
WE_H East Side of Web - Horizontally Oriented
WE_V East Side of Web - Vertically Oriented
WW_D West Side of Web - Diagonally Oriented (45 degrees)
WW_H West Side of Web - Horizontally Oriented
WW_V West Side of Web - Vertically Oriented
Figure A.1 Stress History Plot of gage at Sensor Location A-1-B – All Truck Paths.
LOAD TEST AND SUMMARY REPORT – TO-20 LOOKOUT POINT SPILLWAY BRIDGE, LOWELL, OR 31
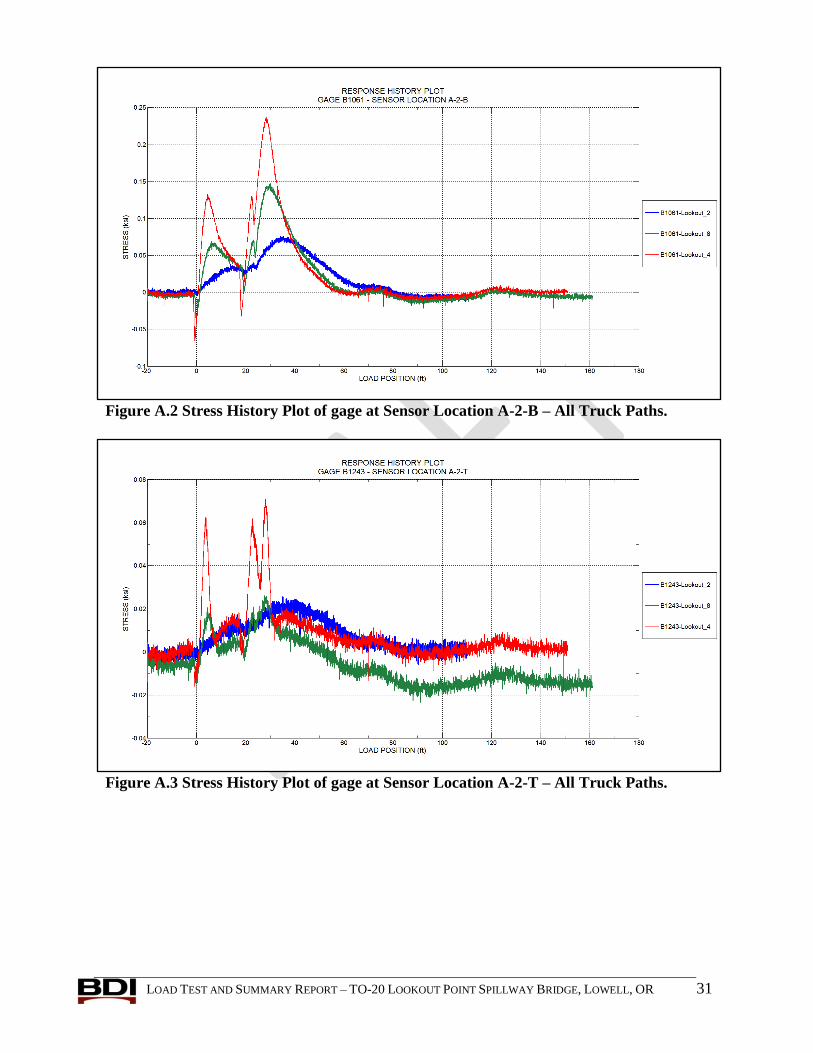
Figure A.2 Stress History Plot of gage at Sensor Location A-2-B – All Truck Paths.
Figure A.3 Stress History Plot of gage at Sensor Location A-2-T – All Truck Paths.
LOAD TEST AND SUMMARY REPORT – TO-20 LOOKOUT POINT SPILLWAY BRIDGE, LOWELL, OR 32
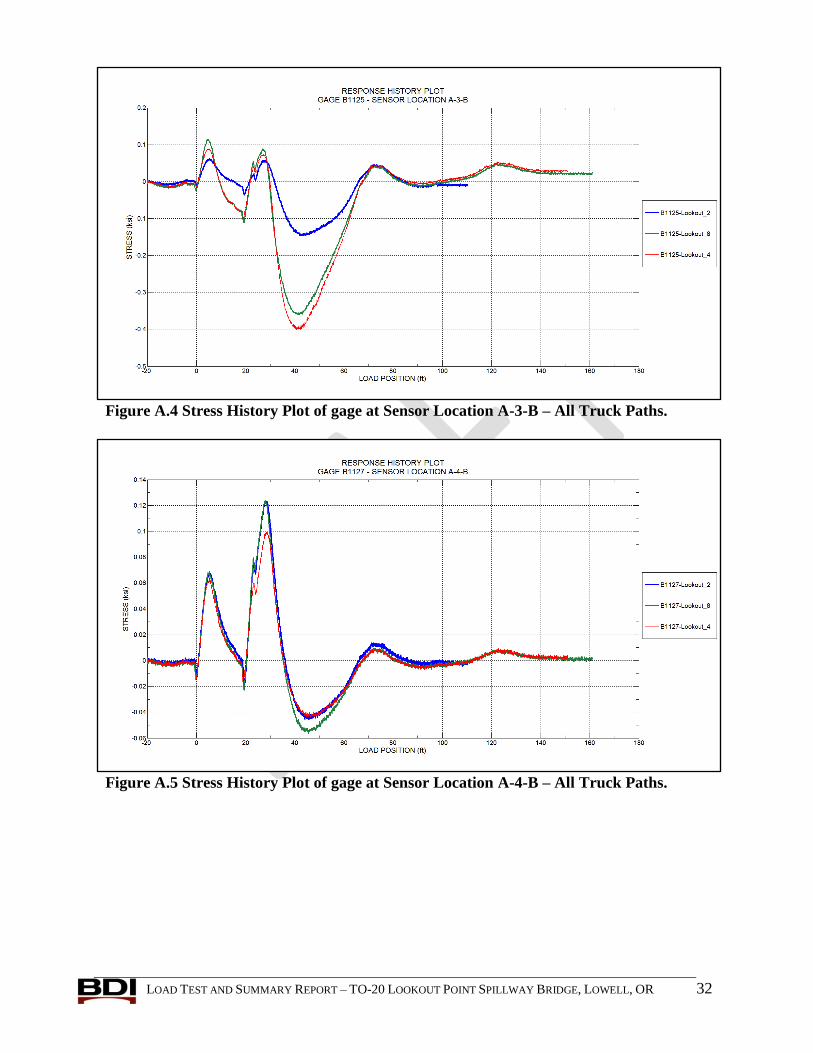
Figure A.4 Stress History Plot of gage at Sensor Location A-3-B – All Truck Paths.
Figure A.5 Stress History Plot of gage at Sensor Location A-4-B – All Truck Paths.
LOAD TEST AND SUMMARY REPORT – TO-20 LOOKOUT POINT SPILLWAY BRIDGE, LOWELL, OR 33
Figure A.6 Stress History Plot of gage at Sensor Location A-4-T – All Truck Paths.
Figure A.7 Stress History Plot of gage at Sensor Location A-5-B – All Truck Paths.
LOAD TEST AND SUMMARY REPORT – TO-20 LOOKOUT POINT SPILLWAY BRIDGE, LOWELL, OR 34
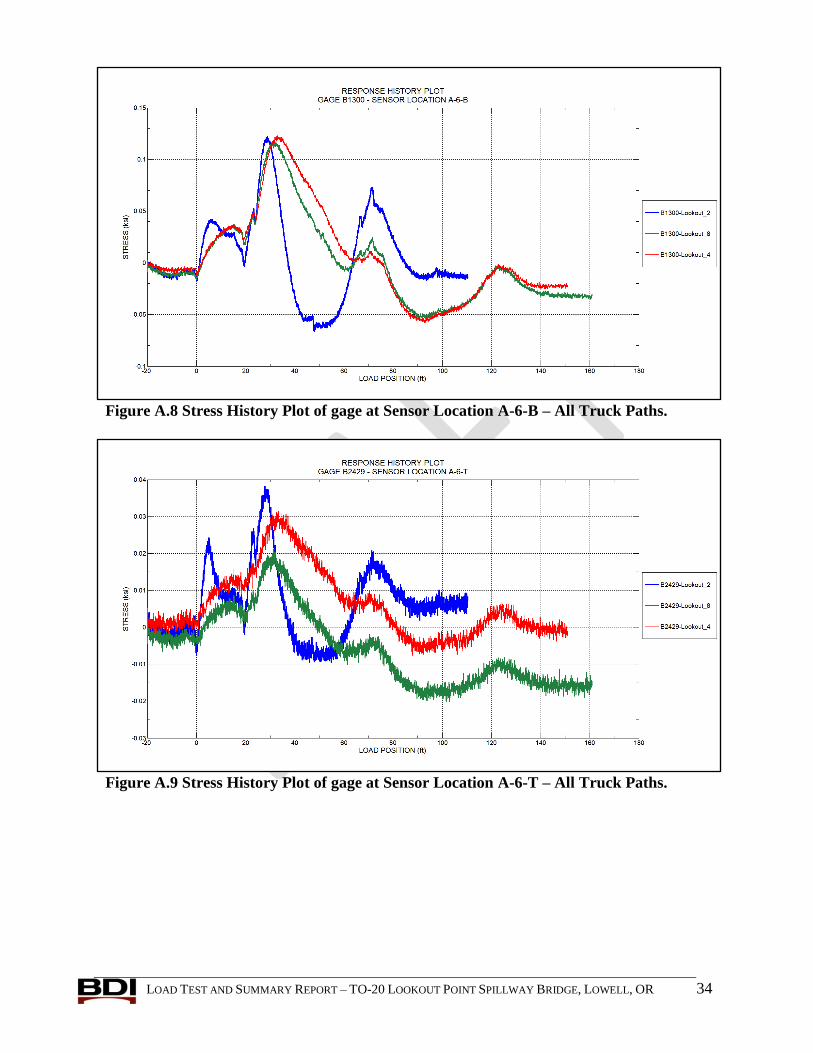
Figure A.8 Stress History Plot of gage at Sensor Location A-6-B – All Truck Paths.
Figure A.9 Stress History Plot of gage at Sensor Location A-6-T – All Truck Paths.
LOAD TEST AND SUMMARY REPORT – TO-20 LOOKOUT POINT SPILLWAY BRIDGE, LOWELL, OR 35
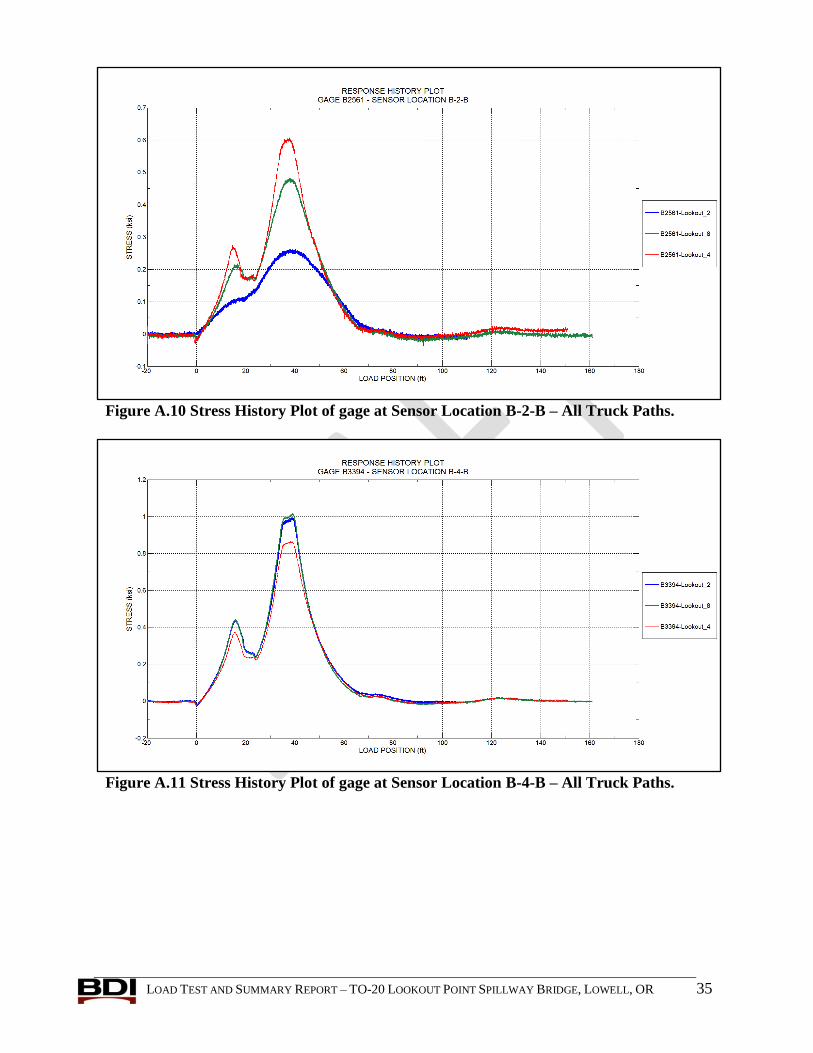
Figure A.10 Stress History Plot of gage at Sensor Location B-2-B – All Truck Paths.
Figure A.11 Stress History Plot of gage at Sensor Location B-4-B – All Truck Paths.
LOAD TEST AND SUMMARY REPORT – TO-20 LOOKOUT POINT SPILLWAY BRIDGE, LOWELL, OR 36
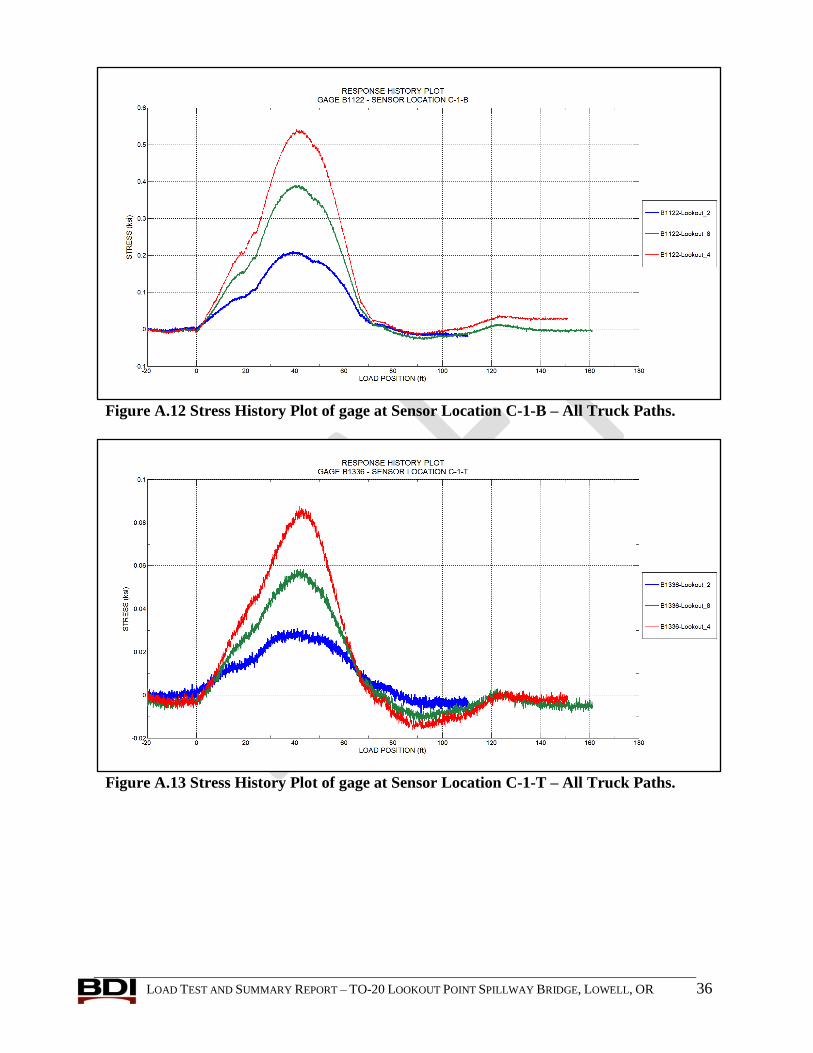
Figure A.12 Stress History Plot of gage at Sensor Location C-1-B – All Truck Paths.
Figure A.13 Stress History Plot of gage at Sensor Location C-1-T – All Truck Paths.
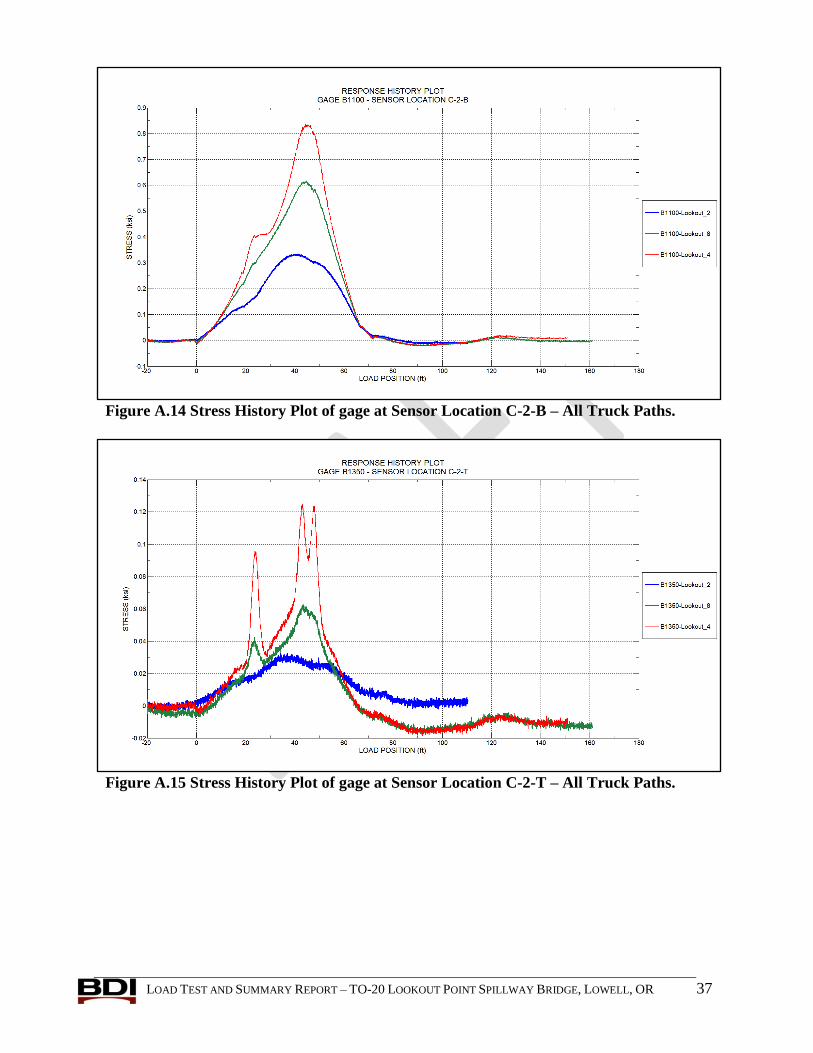
LOAD TEST AND SUMMARY REPORT – TO-20 LOOKOUT POINT SPILLWAY BRIDGE, LOWELL, OR 37
Figure A.14 Stress History Plot of gage at Sensor Location C-2-B – All Truck Paths.
Figure A.15 Stress History Plot of gage at Sensor Location C-2-T – All Truck Paths.
LOAD TEST AND SUMMARY REPORT – TO-20 LOOKOUT POINT SPILLWAY BRIDGE, LOWELL, OR 38
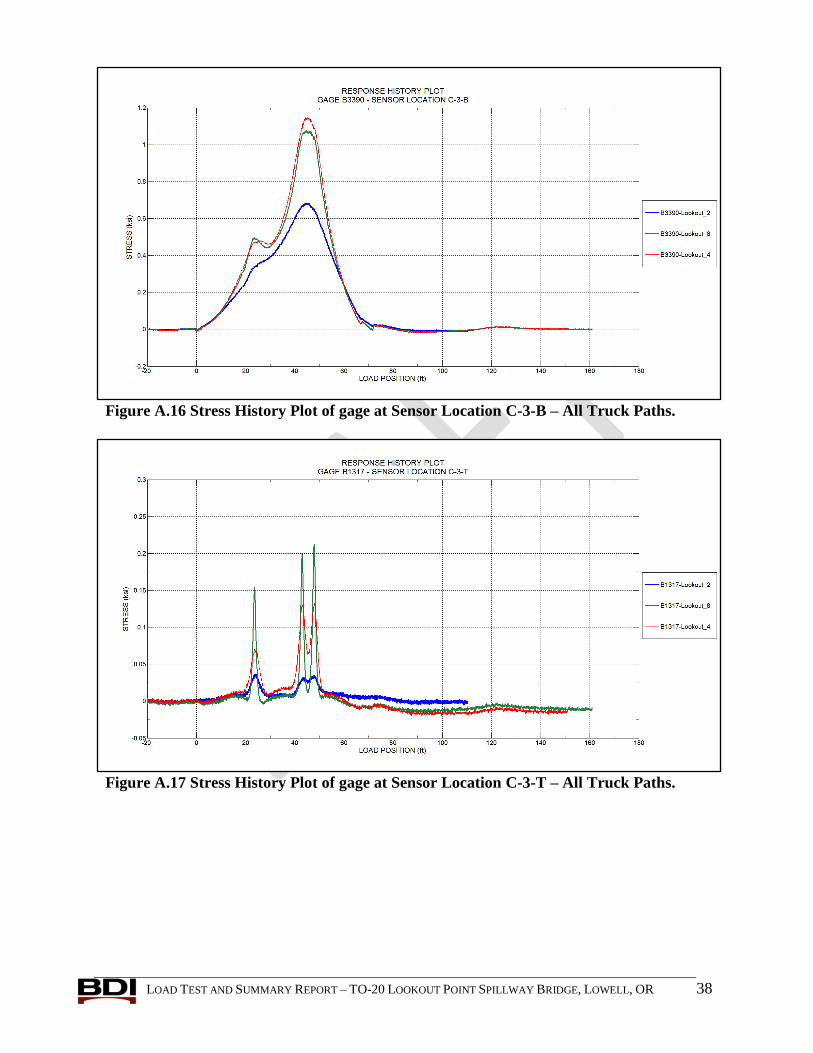
Figure A.16 Stress History Plot of gage at Sensor Location C-3-B – All Truck Paths.
Figure A.17 Stress History Plot of gage at Sensor Location C-3-T – All Truck Paths.
LOAD TEST AND SUMMARY REPORT – TO-20 LOOKOUT POINT SPILLWAY BRIDGE, LOWELL, OR 39
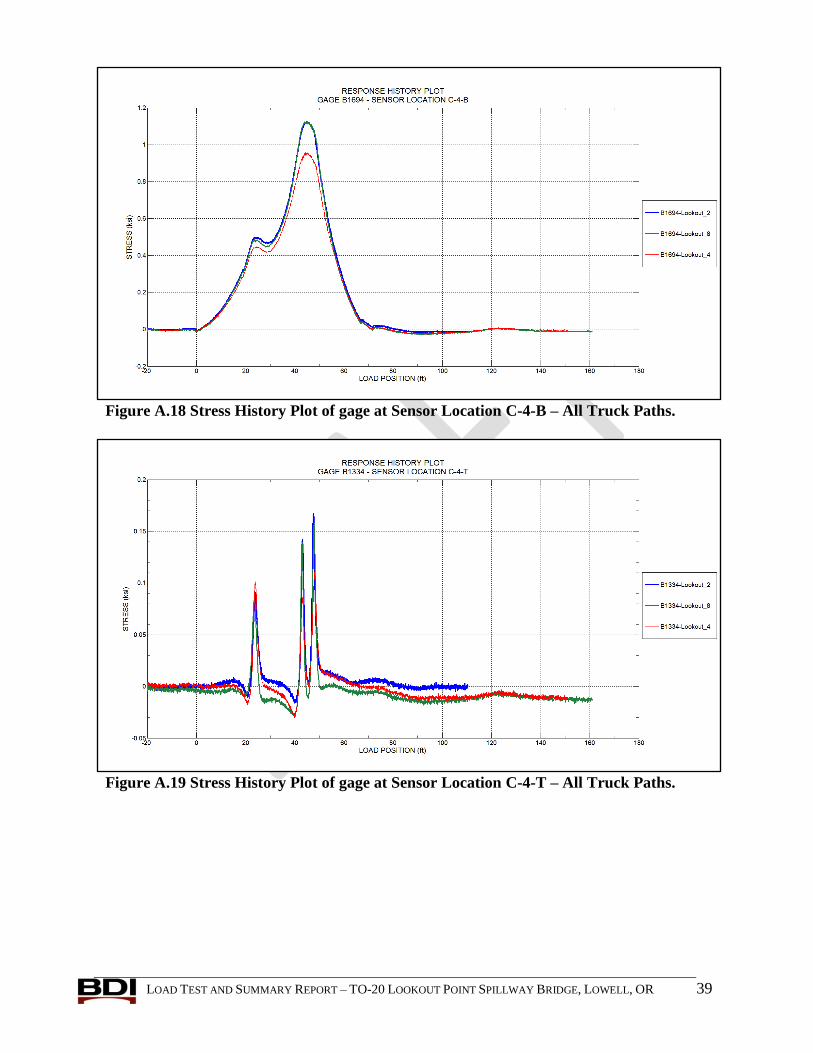
Figure A.18 Stress History Plot of gage at Sensor Location C-4-B – All Truck Paths.
Figure A.19 Stress History Plot of gage at Sensor Location C-4-T – All Truck Paths.
LOAD TEST AND SUMMARY REPORT – TO-20 LOOKOUT POINT SPILLWAY BRIDGE, LOWELL, OR 40
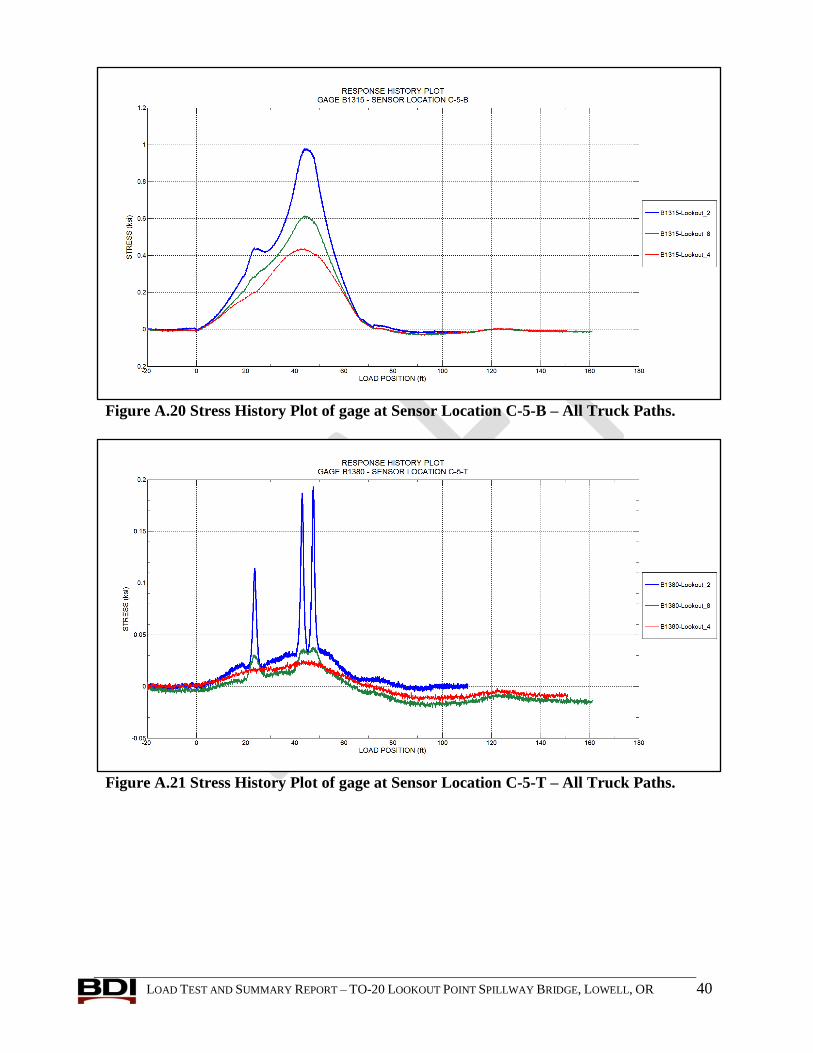
Figure A.20 Stress History Plot of gage at Sensor Location C-5-B – All Truck Paths.
Figure A.21 Stress History Plot of gage at Sensor Location C-5-T – All Truck Paths.
LOAD TEST AND SUMMARY REPORT – TO-20 LOOKOUT POINT SPILLWAY BRIDGE, LOWELL, OR 41
Figure A.22 Stress History Plot of gage at Sensor Location C-6-B – All Truck Paths.
Figure A.23 Stress History Plot of gage at Sensor Location C-6-T – All Truck Paths.
LOAD TEST AND SUMMARY REPORT – TO-20 LOOKOUT POINT SPILLWAY BRIDGE, LOWELL, OR 42
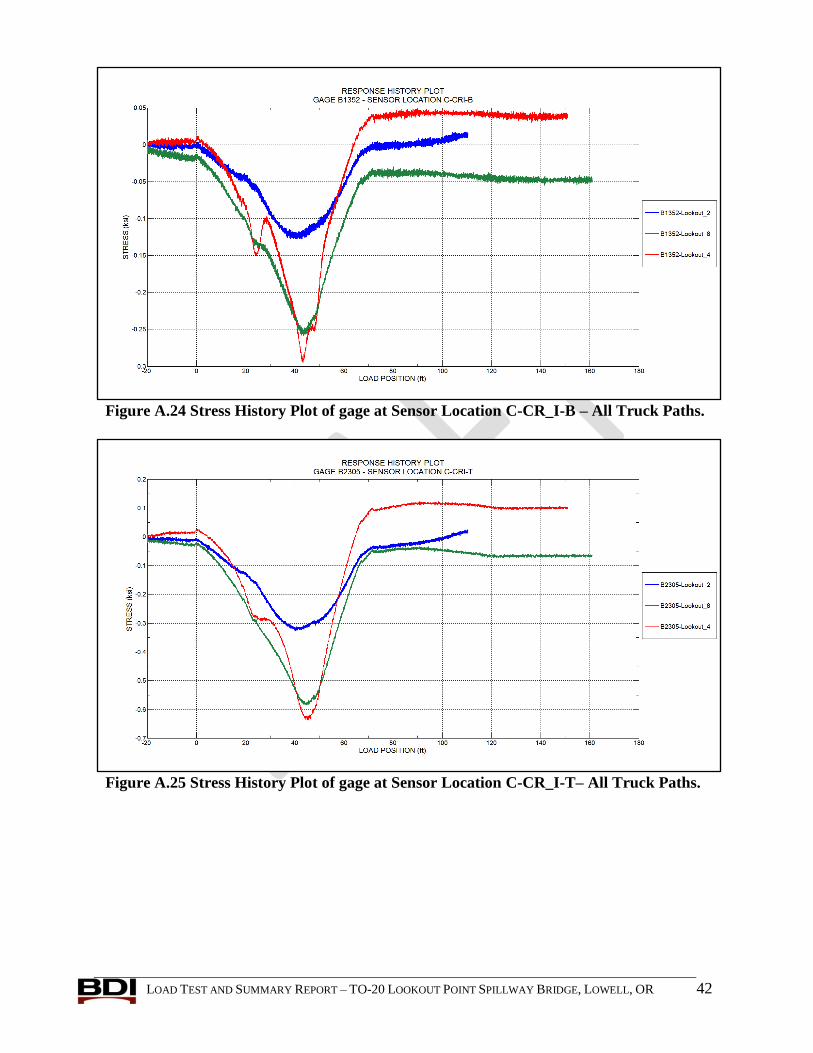
Figure A.24 Stress History Plot of gage at Sensor Location C-CR_I-B – All Truck Paths.
Figure A.25 Stress History Plot of gage at Sensor Location C-CR_I-T– All Truck Paths.
LOAD TEST AND SUMMARY REPORT – TO-20 LOOKOUT POINT SPILLWAY BRIDGE, LOWELL, OR 43
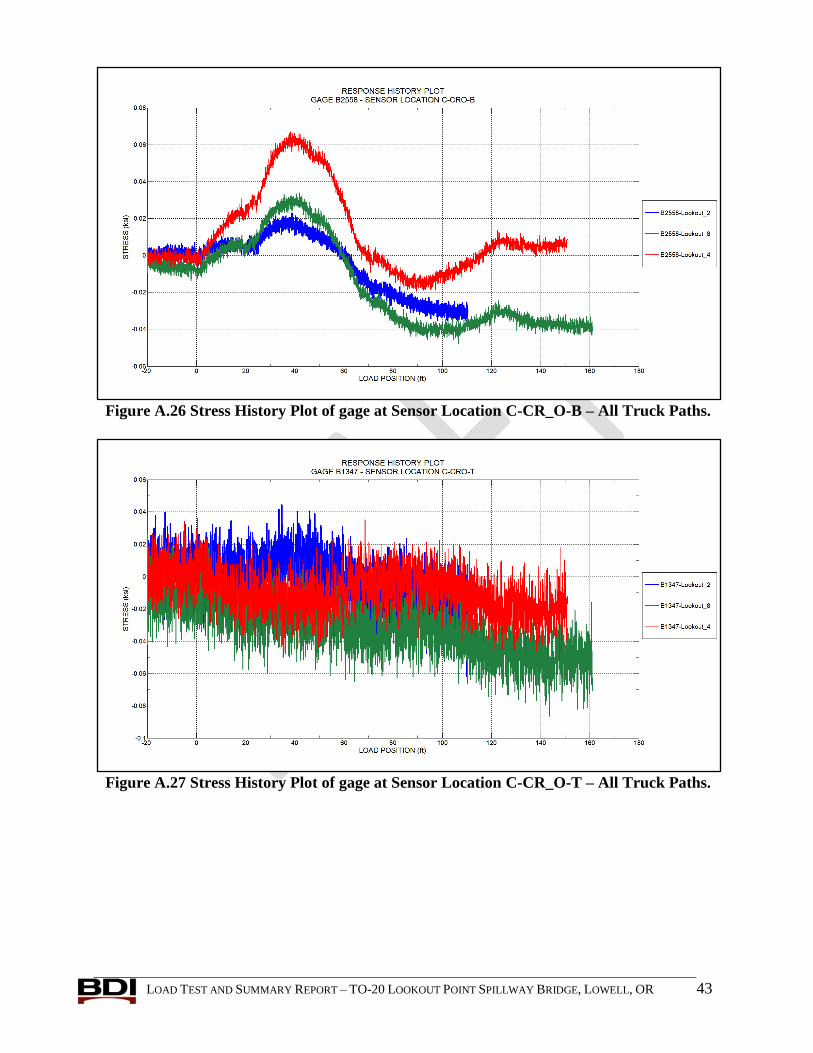
Figure A.26 Stress History Plot of gage at Sensor Location C-CR_O-B – All Truck Paths.
Figure A.27 Stress History Plot of gage at Sensor Location C-CR_O-T – All Truck Paths.
LOAD TEST AND SUMMARY REPORT – TO-20 LOOKOUT POINT SPILLWAY BRIDGE, LOWELL, OR 44
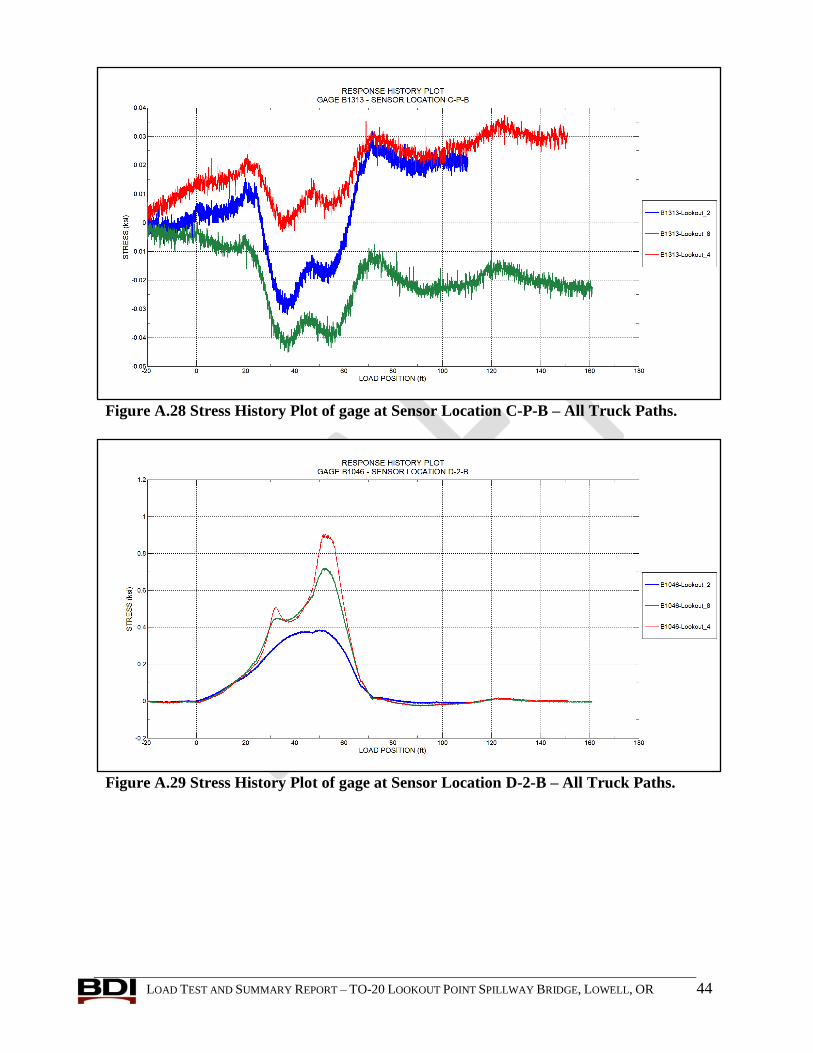
Figure A.28 Stress History Plot of gage at Sensor Location C-P-B – All Truck Paths.
Figure A.29 Stress History Plot of gage at Sensor Location D-2-B – All Truck Paths.
LOAD TEST AND SUMMARY REPORT – TO-20 LOOKOUT POINT SPILLWAY BRIDGE, LOWELL, OR 45
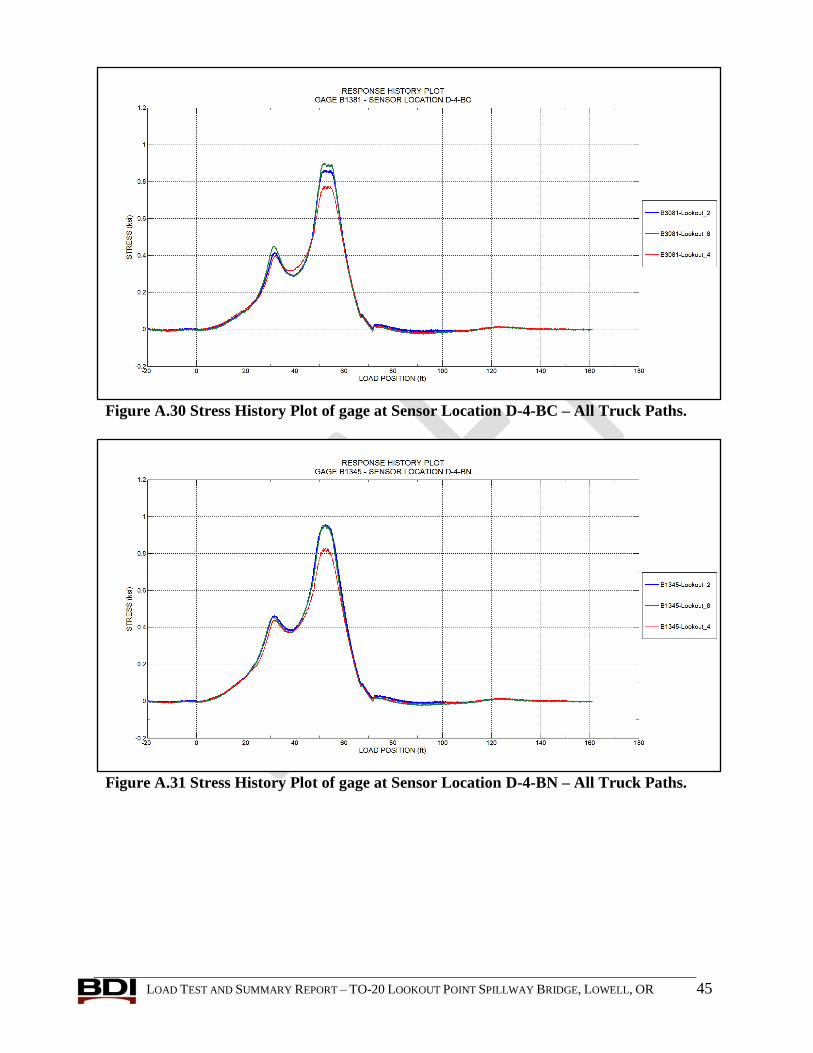
Figure A.30 Stress History Plot of gage at Sensor Location D-4-BC – All Truck Paths.
Figure A.31 Stress History Plot of gage at Sensor Location D-4-BN – All Truck Paths.
LOAD TEST AND SUMMARY REPORT – TO-20 LOOKOUT POINT SPILLWAY BRIDGE, LOWELL, OR 46
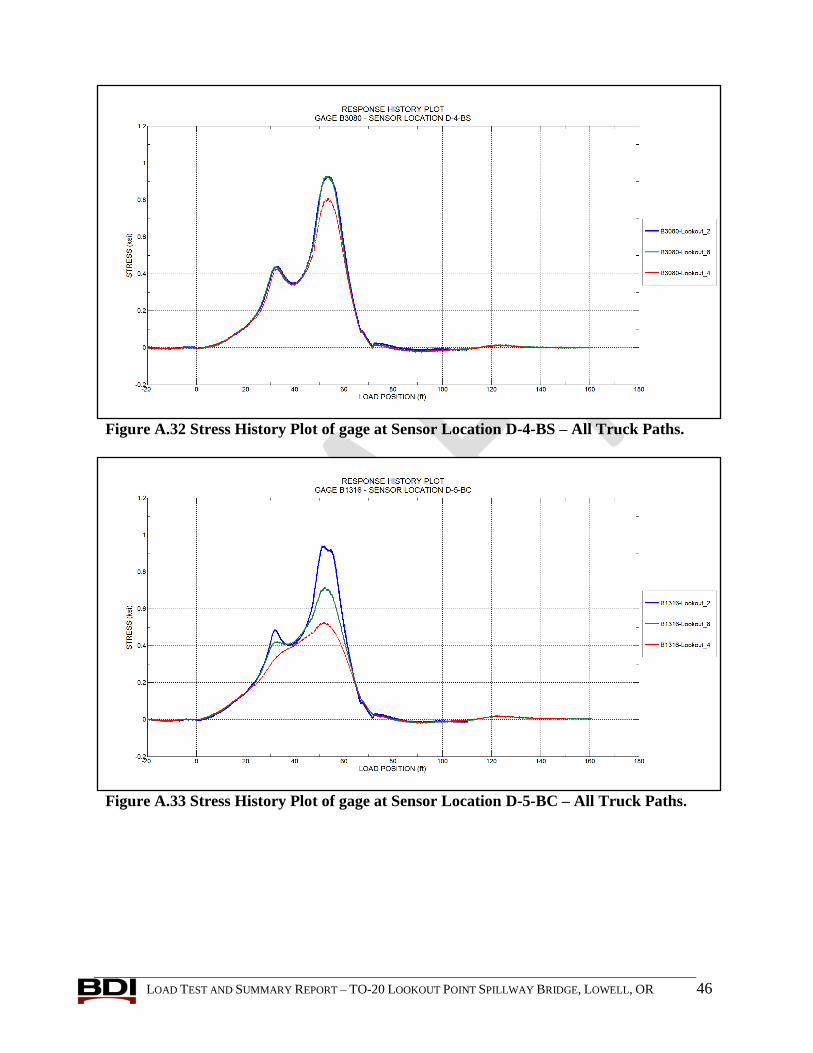
Figure A.32 Stress History Plot of gage at Sensor Location D-4-BS – All Truck Paths.
Figure A.33 Stress History Plot of gage at Sensor Location D-5-BC – All Truck Paths.
LOAD TEST AND SUMMARY REPORT – TO-20 LOOKOUT POINT SPILLWAY BRIDGE, LOWELL, OR 47
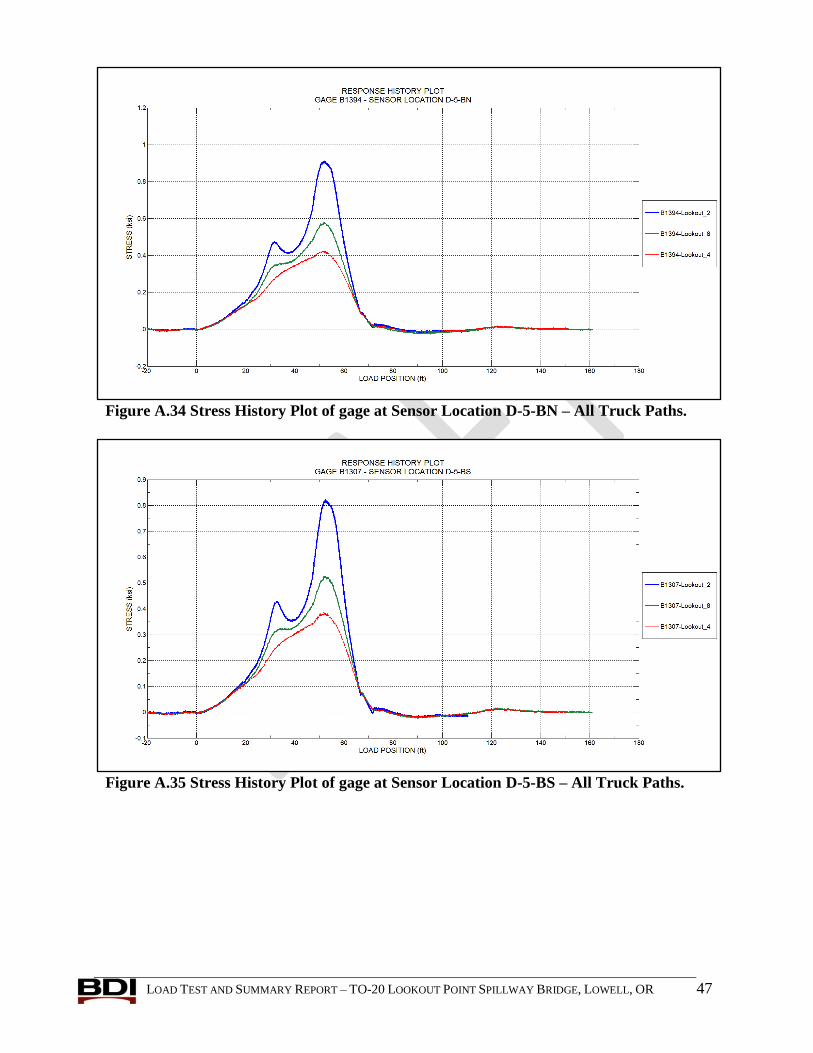
Figure A.34 Stress History Plot of gage at Sensor Location D-5-BN – All Truck Paths.
Figure A.35 Stress History Plot of gage at Sensor Location D-5-BS – All Truck Paths.
LOAD TEST AND SUMMARY REPORT – TO-20 LOOKOUT POINT SPILLWAY BRIDGE, LOWELL, OR 48
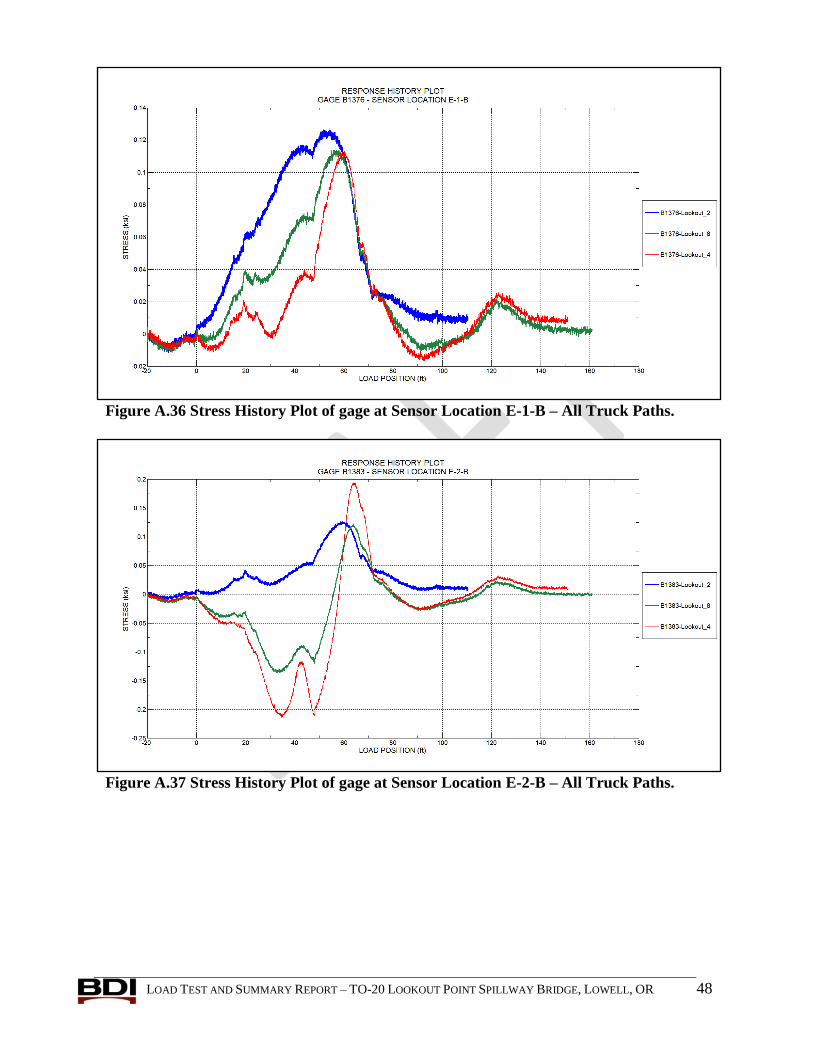
Figure A.36 Stress History Plot of gage at Sensor Location E-1-B – All Truck Paths.
Figure A.37 Stress History Plot of gage at Sensor Location E-2-B – All Truck Paths.
LOAD TEST AND SUMMARY REPORT – TO-20 LOOKOUT POINT SPILLWAY BRIDGE, LOWELL, OR 49
Figure A.38 Stress History Plot of gage at Sensor Location E-2-T – All Truck Paths.
Figure A.39 Stress History Plot of gage at Sensor Location E-3-B – All Truck Paths.
LOAD TEST AND SUMMARY REPORT – TO-20 LOOKOUT POINT SPILLWAY BRIDGE, LOWELL, OR 50
Figure A.40 Stress History Plot of gage at Sensor Location E-4-B – All Truck Paths.
Figure A.41 Stress History Plot of gage at Sensor Location E-4-T – All Truck Paths.
LOAD TEST AND SUMMARY REPORT – TO-20 LOOKOUT POINT SPILLWAY BRIDGE, LOWELL, OR 51
Figure A.42 Stress History Plot of gage at Sensor Location E-5-B – All Truck Paths.
Figure A.43 Stress History Plot of gage at Sensor Location E-6-B – All Truck Paths.
LOAD TEST AND SUMMARY REPORT – TO-20 LOOKOUT POINT SPILLWAY BRIDGE, LOWELL, OR 52
Figure A.44 Stress History Plot of gage at Sensor Location E-6-T – All Truck Paths.
Figure A.45 Stress History Plot of gage at Sensor Location D-4-WED – All Truck Paths.
LOAD TEST AND SUMMARY REPORT – TO-20 LOOKOUT POINT SPILLWAY BRIDGE, LOWELL, OR 53
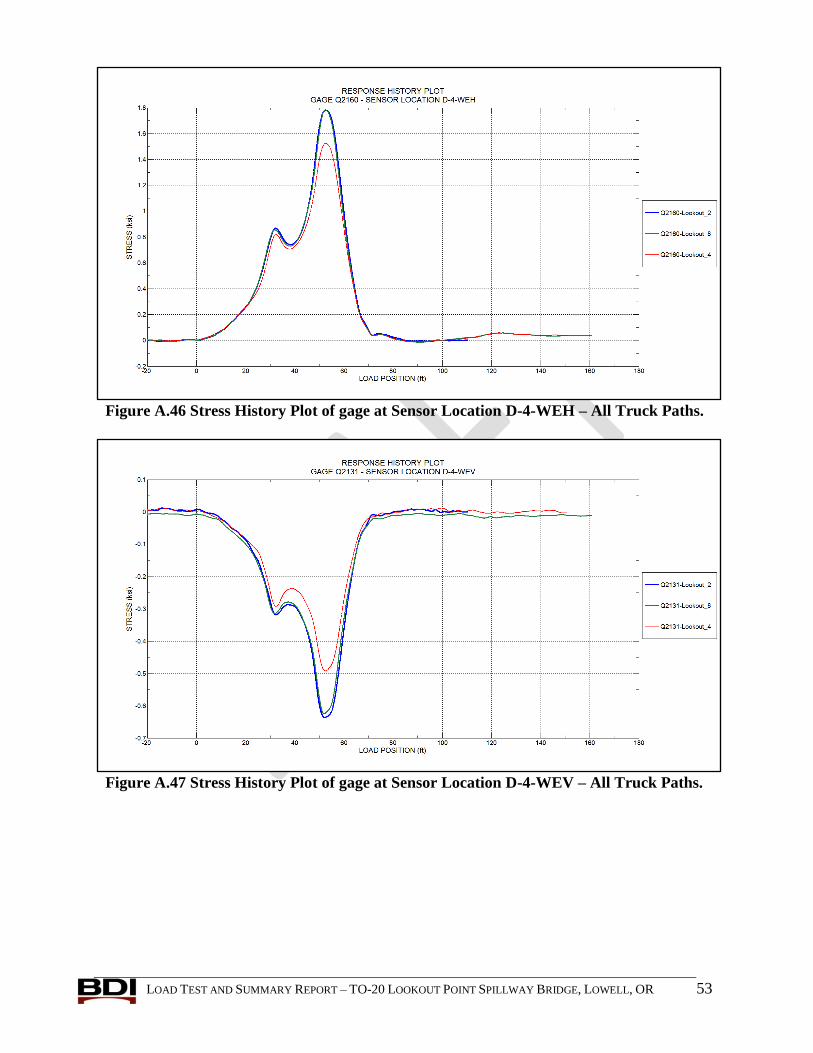
Figure A.46 Stress History Plot of gage at Sensor Location D-4-WEH – All Truck Paths.
Figure A.47 Stress History Plot of gage at Sensor Location D-4-WEV – All Truck Paths.
LOAD TEST AND SUMMARY REPORT – TO-20 LOOKOUT POINT SPILLWAY BRIDGE, LOWELL, OR 54
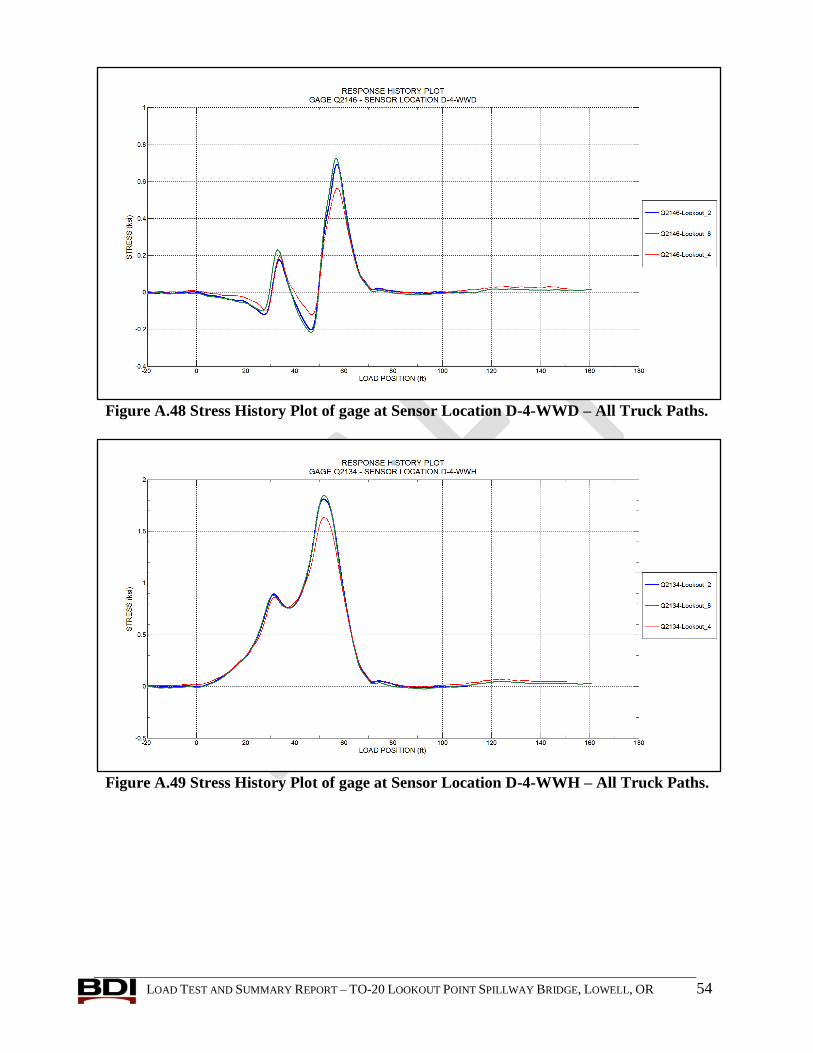
Figure A.48 Stress History Plot of gage at Sensor Location D-4-WWD – All Truck Paths.
Figure A.49 Stress History Plot of gage at Sensor Location D-4-WWH – All Truck Paths.
LOAD TEST AND SUMMARY REPORT – TO-20 LOOKOUT POINT SPILLWAY BRIDGE, LOWELL, OR 55
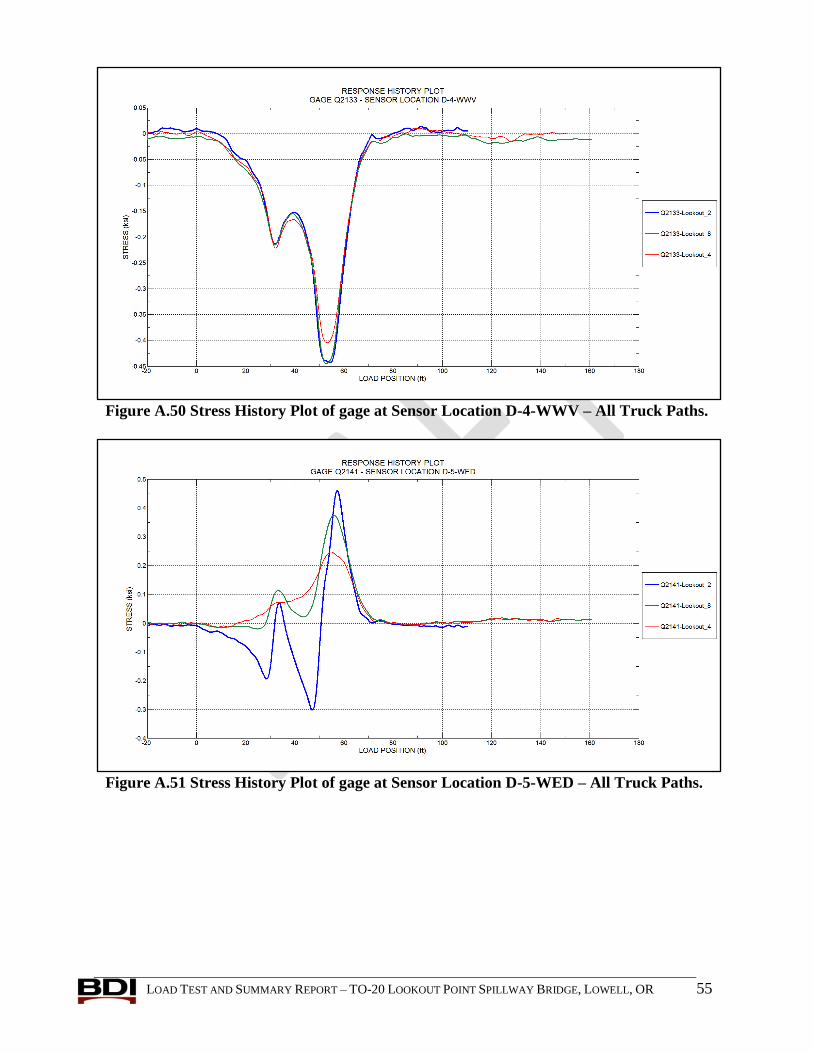
Figure A.50 Stress History Plot of gage at Sensor Location D-4-WWV – All Truck Paths.
Figure A.51 Stress History Plot of gage at Sensor Location D-5-WED – All Truck Paths.
LOAD TEST AND SUMMARY REPORT – TO-20 LOOKOUT POINT SPILLWAY BRIDGE, LOWELL, OR 56
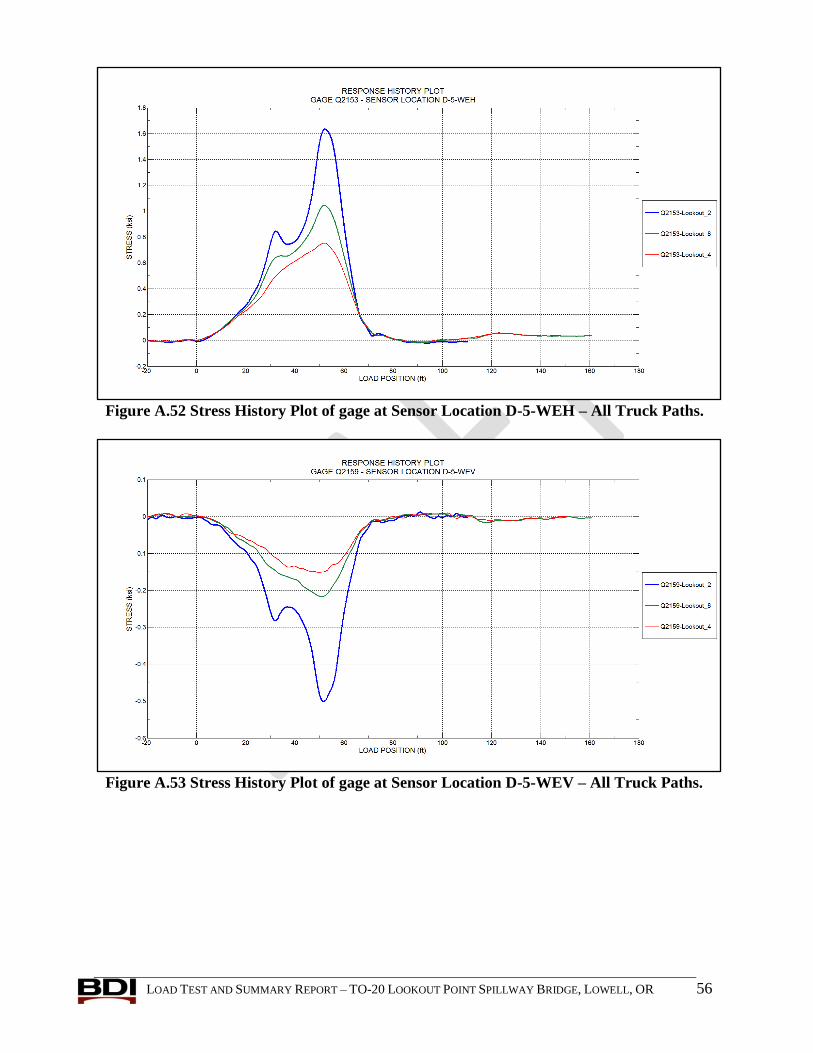
Figure A.52 Stress History Plot of gage at Sensor Location D-5-WEH – All Truck Paths.
Figure A.53 Stress History Plot of gage at Sensor Location D-5-WEV – All Truck Paths.
LOAD TEST AND SUMMARY REPORT – TO-20 LOOKOUT POINT SPILLWAY BRIDGE, LOWELL, OR 57
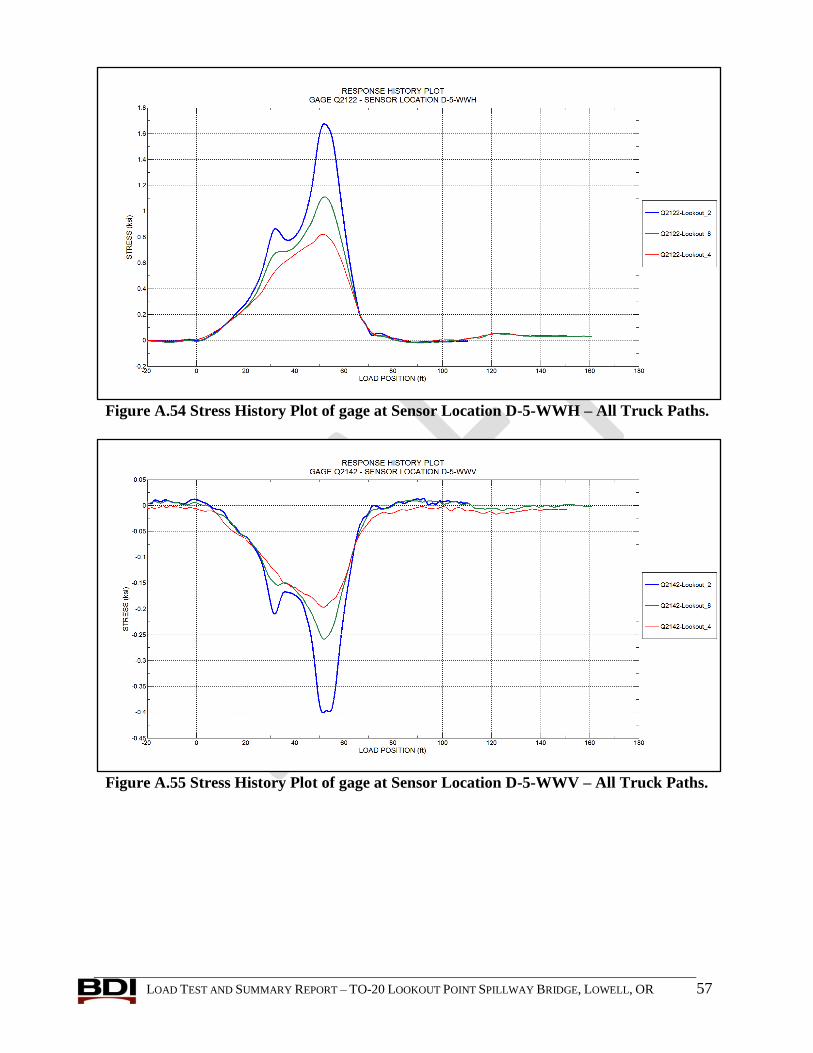
Figure A.54 Stress History Plot of gage at Sensor Location D-5-WWH – All Truck Paths.
Figure A.55 Stress History Plot of gage at Sensor Location D-5-WWV – All Truck Paths.
LOAD TEST AND SUMMARY REPORT – TO-20 LOOKOUT POINT SPILLWAY BRIDGE, LOWELL, OR 58
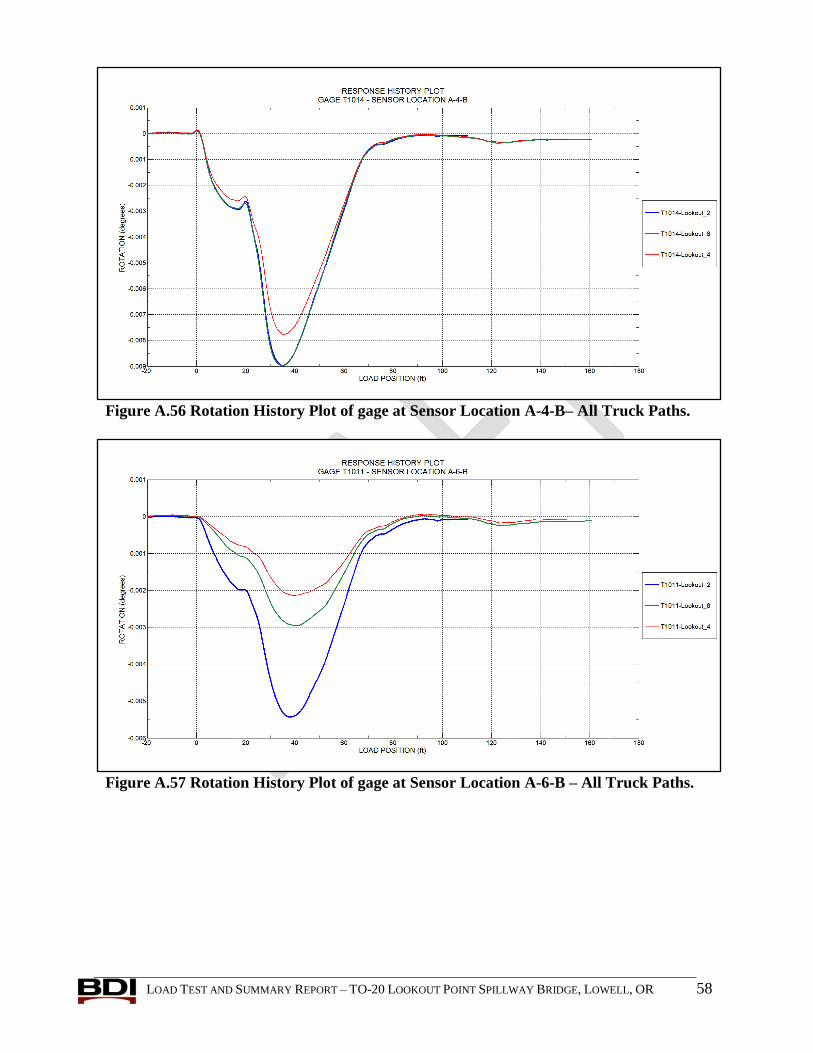
Figure A.56 Rotation History Plot of gage at Sensor Location A-4-B– All Truck Paths.
Figure A.57 Rotation History Plot of gage at Sensor Location A-6-B – All Truck Paths.
LOAD TEST AND SUMMARY REPORT – TO-20 LOOKOUT POINT SPILLWAY BRIDGE, LOWELL, OR 59
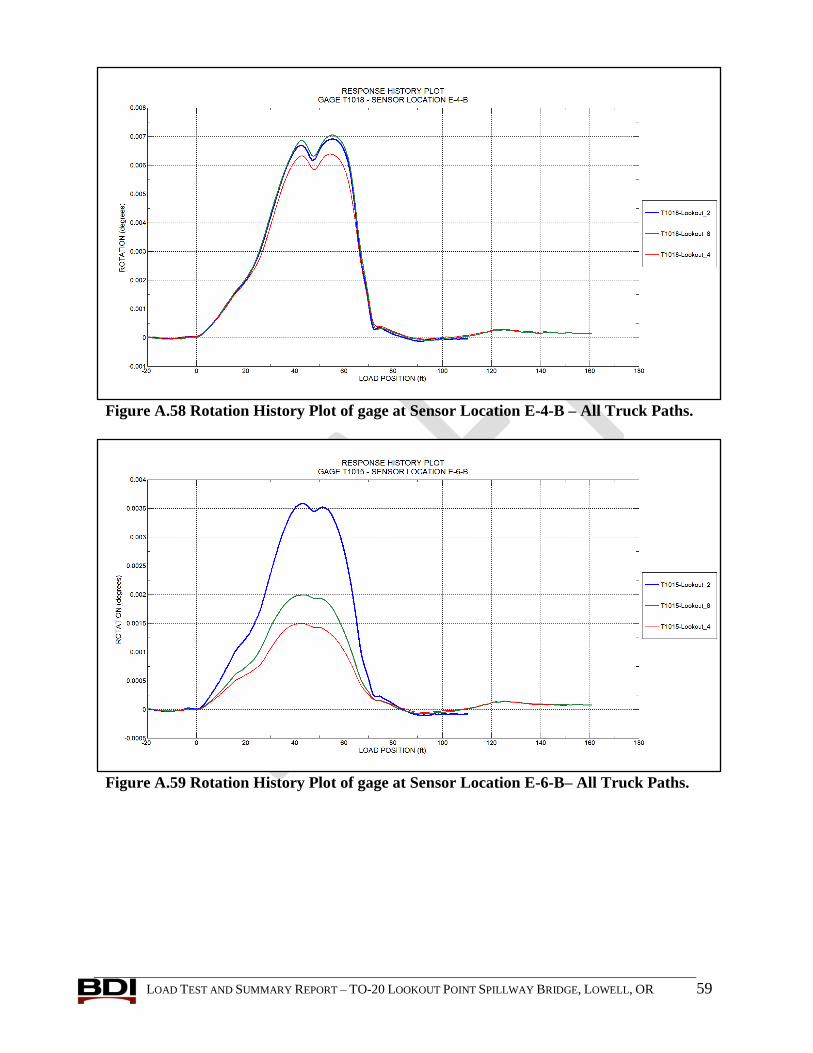
Figure A.58 Rotation History Plot of gage at Sensor Location E-4-B – All Truck Paths.
Figure A.59 Rotation History Plot of gage at Sensor Location E-6-B– All Truck Paths.
LOAD TEST AND SUMMARY REPORT – TO-20 LOOKOUT POINT SPILLWAY BRIDGE, LOWELL, OR 60
B. APPENDIX B – EQUIPMENT SPECIFICATIONS

LOAD TEST AND SUMMARY REPORT – TO-20 LOOKOUT POINT SPILLWAY BRIDGE, LOWELL, OR 61
LOAD TEST AND SUMMARY REPORT – TO-20 LOOKOUT POINT SPILLWAY BRIDGE, LOWELL, OR 62
LOAD TEST AND SUMMARY REPORT – TO-20 LOOKOUT POINT SPILLWAY BRIDGE, LOWELL, OR 63

LOAD TEST AND SUMMARY REPORT – TO-20 LOOKOUT POINT SPILLWAY BRIDGE, LOWELL, OR 64
LOAD TEST AND SUMMARY REPORT – TO-20 LOOKOUT POINT SPILLWAY BRIDGE, LOWELL, OR 65
LOAD TEST AND SUMMARY REPORT – TO-20 LOOKOUT POINT SPILLWAY BRIDGE, LOWELL, OR 66
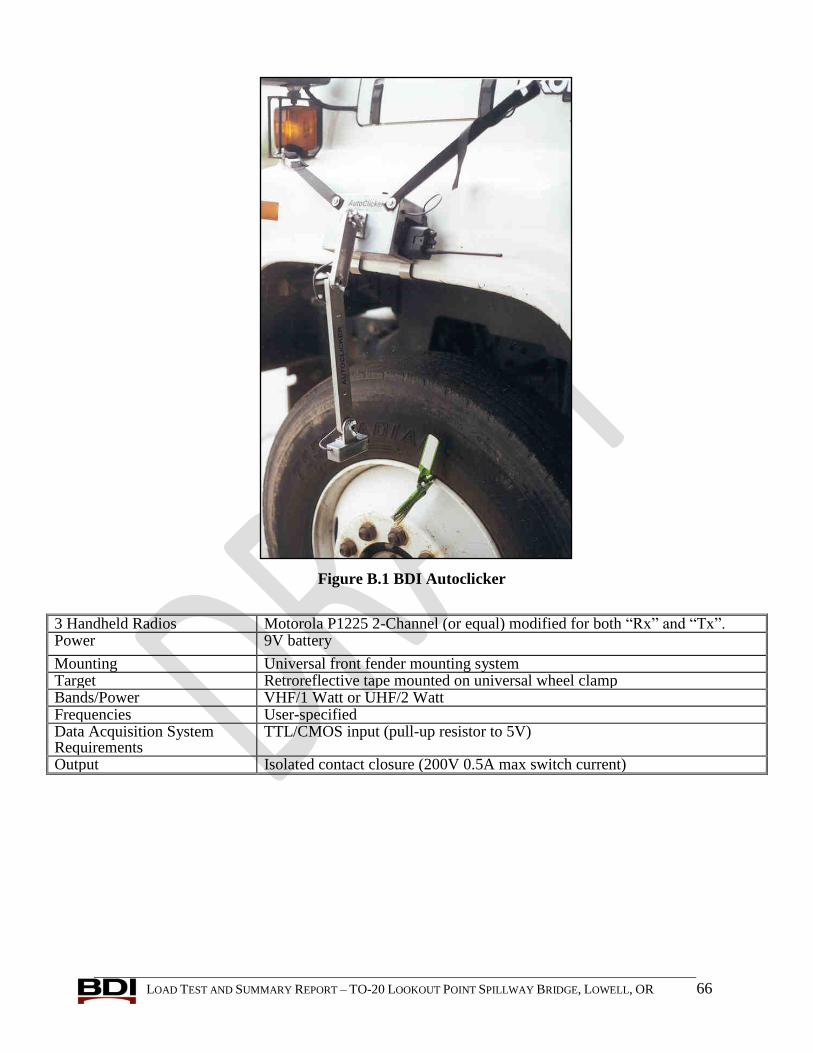
Figure B.1 BDI Autoclicker
3 Handheld Radios Motorola P1225 2-Channel (or equal) modified for both “Rx” and “Tx”. Power 9V battery
Mounting Universal front fender mounting system Target Retroreflective tape mounted on universal wheel clamp Bands/Power VHF/1 Watt or UHF/2 Watt Frequencies User-specified Data Acquisition System Requirements
TTL/CMOS input (pull-up resistor to 5V)
Output Isolated contact closure (200V 0.5A max switch current)