load eccentricity effects on behavior of circular footings ... length article load eccentricity...
TRANSCRIPT

lable at ScienceDirect
Journal of Rock Mechanics and Geotechnical Engineering 7 (2015) 691e699
Contents lists avai
Journal of Rock Mechanics andGeotechnical Engineering
journal homepage: www.rockgeotech.org
Full length article
Load eccentricity effects on behavior of circular footings reinforcedwith geogrid sheets
Ehsan Badakhshan*, Ali NoorzadFaculty of Civil, Water & Environmental Engineering, Shahid Beheshti University, Tehran, Iran
a r t i c l e i n f o
Article history:Received 11 May 2015Received in revised form9 August 2015Accepted 12 August 2015Available online 17 October 2015
Keywords:Model testCircular footingEccentric loadReinforced sandBearing capacity
* Corresponding author. Tel.: þ98 126595684.E-mail address: [email protected] (E. BadakPeer review under responsibility of Institute o
Chinese Academy of Sciences.1674-7755 � 2015 Institute of Rock and Soil Mof Sciences. Production and hosting by Elsevier B.V. Ahttp://dx.doi.org/10.1016/j.jrmge.2015.08.006
a b s t r a c t
In this paper, an experimental study for an eccentrically loaded circular footing, resting on a geogridreinforced sand bed, is performed. To achieve this aim, the steel model footing of 120 mm in diameterand sand in relative density of 60% are used. Also, the effects of depth of first and second geogrid layersand number of reinforcement layers (1e4) on the settlement-load response and tilt of footing undervarious load eccentricities (0 cm, 0.75 cm, 1.5 cm, 2.25 cm and 3 cm) are investigated. Test results indicatethat ultimate bearing capacity increases in comparison with unreinforced condition. It is observed thatwhen the reinforcements are placed in the optimum embedment depth (u/D ¼ 0.42 and h/D ¼ 0.42), thebearing capacity ratio (BCR) increases with increasing load eccentricity to the core boundary of footing,and that with further increase of load eccentricity, the BCR decreases. Besides, the tilt of footing increaseslinearly with increasing settlement. Finally, by reinforcing the sand bed, the tilt of footing decreases at 2layers of reinforcement and then increases by increasing the number of reinforcement layers.� 2015 Institute of Rock and Soil Mechanics, Chinese Academy of Sciences. Production and hosting by
Elsevier B.V. All rights reserved.
1. Introduction
In civil engineering, most of foundations, especially foundationswith industrial application, are subjected to horizontally seismicand wind forces, in addition to vertical forces that cause eccentricloading. It is reported by several researchers that the eccentricloading reduces the soil bearing capacity (e.g. Eastwood, 1955;Dhillon, 1961; Graudet and Kerisel, 1965; Lee, 1965; Michalowskiand You, 1998; Mahiyar and Patel, 2000; Taiebat and Carter,2002). Meyerhof (1953) reported that when a strip or rectangularfoundation is subjected to an eccentric load, the contact pressuredecreases linearly from toe to heel, and subsequently proposed theconcept of effective width. Prakash and Saran (1971) provided acomprehensive mathematical formulation to estimate ultimatebearing capacity and settlement for strip foundations in a cohesivesoil subjected to eccentric loading. Purkayastha and Char (1977)proposed a reduction factor method for continuous foundationssupported by sand. For high silos, refinery towers, wind turbinesand chimneys, circular foundation is more economical than anyother form of footing, and this is because direction of overturning
hshan).f Rock and Soil Mechanics,
echanics, Chinese Academyll rights reserved.
fromwind and earthquake is not fixed and load eccentricity alwaysoccurs in one way.
In the case of circular foundations under eccentric loading,Highter and Anders (1985) provided a graphical solution to deter-mine the effective area. The effective area is defined as an equiva-lent area of footing which can be loaded centrally when a verticalload is applied at a location other than the centroid of footing orwhen a foundation is subjected to a centric load and momentum.Moreover, Meyerhof (1953) and Vesic (1973) suggested an equationto calculate the effective area in circular footing. In the last fourdecades, geosynthetics application has been known as a commontechnique to increase the ultimate bearing capacity of soils anddecrease the settlement of footing. Yetimuglu et al. (1994), Adamsand Collin (1997), Alawaji (2001), Ghosh et al. (2005), Kumaret al. (2007), Mosallanezhad et al. (2008), Latha and Somwanshi(2009), Vinod et al. (2009), and Moghaddas Tafreshi and Dawson(2010) reported when the reinforcements are placed in the opti-mum depth from the surface of footing (strip, square, rectangularfoundations), the maximum beneficial effect of reinforcement canbe achieved. However, few researches have been carried out in thefield of sand or clay reinforced with geosynthetic layers. These re-searches have considered centrically loaded circular foundations incomparison with other foundations.
Boushehrian and Hataf (2003) found that, for the circular foot-ings on reinforced sand, the maximum bearing capacity occurs atdifferent values of embedment depth ratio depending on thenumber of reinforcement layers N and that, for the ratio of u/D (u isthe embedment depth of first layer of reinforcement, and D is thediameter of circular footing) greater than one, reinforcement layers

Fig. 1. Particle size distribution curve for the sand.
E. Badakhshan, A. Noorzad / Journal of Rock Mechanics and Geotechnical Engineering 7 (2015) 691e699692
have no significant effect on bearing capacity. They also explainedthat choosing a rigid reinforcement does not always lead to a bettereffect on bearing capacity. Basudhar et al. (2007) carried out anumerical analysis to study the behavior of circular footings withdifferent sizes resting on reinforced sandwith geotextile, and foundthat with an increase in number of reinforcement layers, the set-tlement gradually decreases at a decreasing rate. Lovisa et al. (2010)studied the behavior of prestressed geotextile reinforced sand bedsupporting a loaded circular footing. They found that the effect ofthe prestressed geotextile configuration is evident in greaterfooting depths in comparison with unreinforced and reinforcedsand beds without prestressed counterparts.
Regarding loading with eccentricity, only few studies wereperformed experimentally to identify the critical values of rein-forcement layers for reinforcing the soil under strip and rectangularfoundations. Sawwaf (2009) conducted a series of model tests oneccentrically loaded strip footing resting on geogrid reinforcedsand, and found that the effect of reinforcement on bearing ca-pacity ratio is greater at lower values of eccentricity and greaterrelative densities. They figured out that the maximum improve-ment occurs at a depth ratio of u/B ¼ 0.33 and h/B ¼ 0.5 (B is thewidth of footing, and h is the vertical distance between reinforce-ment layers).
Furthermore, Patra et al. (2006) proposed an empirical rela-tionship from model loading tests on an eccentrically loaded stripfoundation in geogrid reinforced sand bed. Sadoglu et al. (2009)reported that the reinforcement increases ultimate loads in com-parison with unreinforced cases, and this contribution becomesmuch lower with increasing load eccentricity. Al-Tirkity and Al-Taay (2012) showed that, for the strip footings, the optimumvalues of u/B for the first geogrid layer vary from 0.35 to 0.45depending on the value of load eccentricity.
The experimental studies mentioned above focused on eccen-trically loaded strip footing resting on reinforced soil, and noattention was paid to the behavior of eccentrically loaded circularfoundation resting on reinforced sand. The present study focuseson the effects of different parameters of geogrid layers, such as thedepth of first and second layers of reinforcement, number of rein-forcement layers, on the bearing capacity, settlement and tilt of thecircular footing resting on sand bed under different loadeccentricities.
2. Materials properties
To investigate the effect of eccentric loading on a circular footingresting on reinforced sand with geogrid layers, the properties ofmaterials used in the tests are described in this section.
2.1. Sand
In this study, the poorly graded medium sand dried by the ovenis used. The particle size distribution curve, as shown in Fig. 1, isdetermined using the dry sievingmethod according to the standardof ASTM D422-90 (1990) on two sand samples. The sand is classi-fied as SP (poorly graded sand) in the unified soil classificationsystem (USCS) with a coefficient of uniformity (Cu) of 2.89, a coef-ficient of curvature (Cc) of 1.05, and an effective size (D10) of
Table 1Physico-mechanical properties of geogrid.
Geogridname
Apertureshape
Opening size(mm � mm)
Mesh thickness(mm)
Tensilestrength (kN m�1)
Extens1/2 pe
CE121 Oval 6 � 8 3.3 7.68 3.2
0.27 mm. In order to determine the specific gravity of soil particles,the maximum and minimum dry densities, the maximum andminimum void ratios, three types of tests are carried out andaverage values for the sand are computed to be 2.65, 1.64 g/cm3,1.44 g/cm3, 0.89 and 0.65, respectively. The angle of internal frictionof dry sand with relative density of 60% is 39�, which is determinedby the direct shear test.
2.2. Geogrid
In order to provide reinforcement material for the model test,geogrid CE121 with tensile strength of 7.68 kN/m is used. Thisgeogrid has an oval shaped aperture (with 6 mm small diameterand 8 mm large diameter) and is made of high-density poly-ethylene (HDPE). The reason for selection of this type of geogrid isthat the peak tensile strengths in every direction are identical. Thephysico-mechanical properties of this geogrid categorized in bothmedium and stiff types are listed in Table 1.
2.3. Footing
The model circular footing is made of steel plates in 15 mmthickness to provide the rigid footing condition. The diameter offooting is selected as 120 mm. The base of footing is roughened bygluing a layer of geogrid on the bottom of circular footing withepoxy glue to ensure uniform roughness in all the tests. To preparedifferent eccentricities on the footing, several holes are consideredfor loading and the footing is allowed to rotate freely. The loadeccentricity for the footing is chosen according to the core of cir-cular footing, which is a part of footing where the whole footingundergoes compressive pressure when load is applied on otherplaces, except for the center, and when load is applied on the coreboundary, the edge of footing has zero pressure. The core of circularfooting is computed to be R/4 which is equal to 1.5 cm, as givenbelow:
q ¼ 00q ¼ PA0 �
MyI
¼ 00P
pR2¼ PeR
pR4
4
0e ¼ R4
(1)
where q is the pressure at the edge of the footing, P is the centricload, A0 is the area of footing, M is the moment, y is the maximum
ion atak load (%)
Extension at maximumload (%)
Tensile strength at10% extension (kN m�1)
Mass per unitarea (g m�2)
20.2 6.8 730

Fig. 3. Geometric parameters of geogrid reinforced sand.
E. Badakhshan, A. Noorzad / Journal of Rock Mechanics and Geotechnical Engineering 7 (2015) 691e699 693
distance from the center, I is the moment of inertia, e is the loadeccentricity, and R is the radius of circular footing. In the presentstudy, five load eccentricities are assumed, i.e. centric (e¼ 0), insideof the core (e¼ 0.75 cm), on the core boundary (e¼ 1.5 cm), outsidethe core (e ¼ 2.25 cm) and further away from the core (e ¼ 3 cm).The core of footing and loaded locations are demonstrated in Fig. 2.
3. Test apparatus, program and setup
The tests are conducted using the apparatus with a square tankwith inside dimensions of 0.6 m � 0.6 m � 0.6 m in length, widthand height, respectively. Tank dimensions are 5 times longer thanthe diameter of footing to ensure that the footing rupture occursinside the tank. Finally, displacements are measured by the linearvariable differential transducer (LVDT).
In all tests, the unit weight and relative density of sand are15.14 kN/m3 and 60%, respectively. Pouring technique is used toachieve the desired relative density. The height of free pouring isobtained through several trials in an especial aluminum cup withcertain volume of 130 mL. Afterwards, it is found that the tankshould be filled in 50 mm thickness interval in order to obtain thedesired density. The tank is filled up until the depth of the sandreaches to 50 cm (about 4.2 times the diameter of footing).Meanwhile, a cup pouring the sand with a certain volume is placedin the tank and, after each test, the relative density of sand in thecup is calculated as a sample of the tank soil. The variation of sandrelative density is found to be (60� 4)% in all tests. In the reinforcedcases, a square shaped geogrid layer with the width of 4.5 times thediameter of footing (L/D¼ 4.5, L is thewidth of reinforcement layer)is placed after leveling the sand surface and this selection is madebased on previous researches (Sitharam and Sireesh, 2004;Basudhar et al., 2007; Latha and Somwanshi, 2009), and sandpouring is continued to the selected surface of footing. Afterpreparation of sand in the soil tank, the final level of the sand isflattened from center of the tank into the sides by a steel ruler andextra soil mass is removed without disturbance. Then the circularfooting is placed and the head of loading rod is put on the footing.Two LVDTs, with an accuracy of 0.01 mm, are used in all tests: oneon the footing surface and the other in the loading place. Bydetermining the difference between the two LVDTs and measuringthe distance between them, we are able to calculate the tilt of
Fig. 2. The core of footing for circular foundation and loaded locations.
footing. The tests are conducted in the displacement control con-dition with displacement rate of 1 mm/min. The applied displace-ment is continued up to the failure of soil at a settlement s about0.25 times the footing diameter. The geometry of the reinforcedsand and footing is shown in Fig. 3.
Forty five tests are carried out to study the effect of eccentricloading on a circular footing, resting on both reinforced and unre-inforced sands with geogrid layers. These 45 tests consist of 5groups of tests on a circular footing to study the effect of differentload eccentricities (e/D ¼ 0, 0.0625, 0.125, 0.1875 and 0.25) onloadedisplacement response of sand. Initially for obtaining theoptimum depth ratio (u/D) for the first reinforcement layer, threetests with u/D values of 0.25, 0.42 and 0.58 are carried out. Fordetermining the optimum depth ratio (h/D) for the second rein-forcement layer, 3 tests are considered with h/D values of 0.25, 0.42and 0.58. Three tests in unreinforced and reinforced conditionswith three and four reinforcement layers are performed while theoptimumvalues for u/D and h/D are selected for the first and secondlayers of geogrid to investigate the effect of number of reinforce-ment layers on bearing capacity. Finally, all of these 9 tests areconducted for each load eccentricity. Also, new geogrid layers are
Fig. 4. Bearing capacity versus settlement of footings on reinforced and unreinforcedsands with two layers at u/D ¼ h/D ¼ 0.42.
E. Badakhshan, A. Noorzad / Journal of Rock Mechanics and Geotechnical Engineering 7 (2015) 691e699694
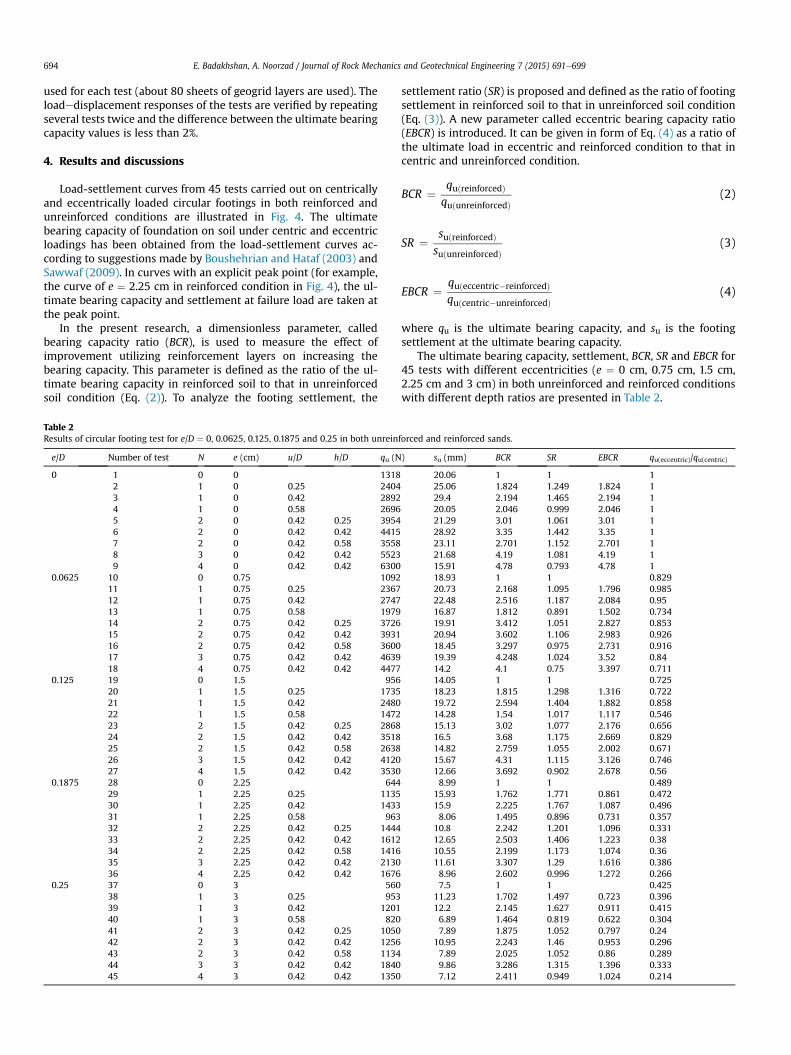
used for each test (about 80 sheets of geogrid layers are used). Theloadedisplacement responses of the tests are verified by repeatingseveral tests twice and the difference between the ultimate bearingcapacity values is less than 2%.
4. Results and discussions
Load-settlement curves from 45 tests carried out on centricallyand eccentrically loaded circular footings in both reinforced andunreinforced conditions are illustrated in Fig. 4. The ultimatebearing capacity of foundation on soil under centric and eccentricloadings has been obtained from the load-settlement curves ac-cording to suggestions made by Boushehrian and Hataf (2003) andSawwaf (2009). In curves with an explicit peak point (for example,the curve of e ¼ 2.25 cm in reinforced condition in Fig. 4), the ul-timate bearing capacity and settlement at failure load are taken atthe peak point.
In the present research, a dimensionless parameter, calledbearing capacity ratio (BCR), is used to measure the effect ofimprovement utilizing reinforcement layers on increasing thebearing capacity. This parameter is defined as the ratio of the ul-timate bearing capacity in reinforced soil to that in unreinforcedsoil condition (Eq. (2)). To analyze the footing settlement, the
Table 2Results of circular footing test for e/D ¼ 0, 0.0625, 0.125, 0.1875 and 0.25 in both unrein
e/D Number of test N e (cm) u/D h/D qu (N
0 1 0 0 13182 1 0 0.25 24043 1 0 0.42 28924 1 0 0.58 26965 2 0 0.42 0.25 39546 2 0 0.42 0.42 44157 2 0 0.42 0.58 35588 3 0 0.42 0.42 55239 4 0 0.42 0.42 6300
0.0625 10 0 0.75 109211 1 0.75 0.25 236712 1 0.75 0.42 274713 1 0.75 0.58 197914 2 0.75 0.42 0.25 372615 2 0.75 0.42 0.42 393116 2 0.75 0.42 0.58 360017 3 0.75 0.42 0.42 463918 4 0.75 0.42 0.42 4477
0.125 19 0 1.5 95620 1 1.5 0.25 173521 1 1.5 0.42 248022 1 1.5 0.58 147223 2 1.5 0.42 0.25 286824 2 1.5 0.42 0.42 351825 2 1.5 0.42 0.58 263826 3 1.5 0.42 0.42 412027 4 1.5 0.42 0.42 3530
0.1875 28 0 2.25 64429 1 2.25 0.25 113530 1 2.25 0.42 143331 1 2.25 0.58 96332 2 2.25 0.42 0.25 144433 2 2.25 0.42 0.42 161234 2 2.25 0.42 0.58 141635 3 2.25 0.42 0.42 213036 4 2.25 0.42 0.42 1676
0.25 37 0 3 56038 1 3 0.25 95339 1 3 0.42 120140 1 3 0.58 82041 2 3 0.42 0.25 105042 2 3 0.42 0.42 125643 2 3 0.42 0.58 113444 3 3 0.42 0.42 184045 4 3 0.42 0.42 1350
settlement ratio (SR) is proposed and defined as the ratio of footingsettlement in reinforced soil to that in unreinforced soil condition(Eq. (3)). A new parameter called eccentric bearing capacity ratio(EBCR) is introduced. It can be given in form of Eq. (4) as a ratio ofthe ultimate load in eccentric and reinforced condition to that incentric and unreinforced condition.
BCR ¼ quðreinforcedÞquðunreinforcedÞ
(2)
SR ¼ suðreinforcedÞsuðunreinforcedÞ
(3)
EBCR ¼ quðeccentric�reinforcedÞquðcentric�unreinforcedÞ
(4)
where qu is the ultimate bearing capacity, and su is the footingsettlement at the ultimate bearing capacity.
The ultimate bearing capacity, settlement, BCR, SR and EBCR for45 tests with different eccentricities (e ¼ 0 cm, 0.75 cm, 1.5 cm,2.25 cm and 3 cm) in both unreinforced and reinforced conditionswith different depth ratios are presented in Table 2.
forced and reinforced sands.
) su (mm) BCR SR EBCR qu(eccentric)/qu(centric)
20.06 1 1 125.06 1.824 1.249 1.824 129.4 2.194 1.465 2.194 120.05 2.046 0.999 2.046 121.29 3.01 1.061 3.01 128.92 3.35 1.442 3.35 123.11 2.701 1.152 2.701 121.68 4.19 1.081 4.19 115.91 4.78 0.793 4.78 118.93 1 1 0.82920.73 2.168 1.095 1.796 0.98522.48 2.516 1.187 2.084 0.9516.87 1.812 0.891 1.502 0.73419.91 3.412 1.051 2.827 0.85320.94 3.602 1.106 2.983 0.92618.45 3.297 0.975 2.731 0.91619.39 4.248 1.024 3.52 0.8414.2 4.1 0.75 3.397 0.71114.05 1 1 0.72518.23 1.815 1.298 1.316 0.72219.72 2.594 1.404 1.882 0.85814.28 1.54 1.017 1.117 0.54615.13 3.02 1.077 2.176 0.65616.5 3.68 1.175 2.669 0.82914.82 2.759 1.055 2.002 0.67115.67 4.31 1.115 3.126 0.74612.66 3.692 0.902 2.678 0.568.99 1 1 0.489
15.93 1.762 1.771 0.861 0.47215.9 2.225 1.767 1.087 0.4968.06 1.495 0.896 0.731 0.357
10.8 2.242 1.201 1.096 0.33112.65 2.503 1.406 1.223 0.3810.55 2.199 1.173 1.074 0.3611.61 3.307 1.29 1.616 0.3868.96 2.602 0.996 1.272 0.2667.5 1 1 0.425
11.23 1.702 1.497 0.723 0.39612.2 2.145 1.627 0.911 0.4156.89 1.464 0.819 0.622 0.3047.89 1.875 1.052 0.797 0.24
10.95 2.243 1.46 0.953 0.2967.89 2.025 1.052 0.86 0.2899.86 3.286 1.315 1.396 0.3337.12 2.411 0.949 1.024 0.214

1
1.5
2
2.5
3
0 0.2 0.4 0.6 0.8
e=0 cm
e=0.75 cm
e=1.5 cm
e=2.25 cm
e=3 cm
BC
R
u/D
e=0 cm e=0.75 cm
e=1.5 cm
e=2.25 cm
e=3 cm
Fig. 5. Variations of BCR with u/D ratio for the first layer of reinforcement.
1
2
3
4
5
0 0.2 0.4 0.6 0.8
e=0 cm
e=0.75 cm
e=1.5 cm
e=2.25 cm
e=3 cm
BC
R
h/D
e=0 cm e=0.75 cm
e=1.5 cm
e=2.25 cm
e=3 cm
Fig. 6. Variations of BCR with h/D ratio for the second layer of reinforcement.
Fig. 7. Variations of BCR with N for centric and eccentric loadings.
E. Badakhshan, A. Noorzad / Journal of Rock Mechanics and Geotechnical Engineering 7 (2015) 691e699 695
4.1. Failure mechanism
In all 45 tests, two different modes of failure, i.e. general shearfailure and local shear failure, are demonstrated. In the case ofgeneral shear failure, continuous failure surfaces develop betweenthe edges of footing and the ground surface. As the pressure in-creases towards the ultimate value, the soil around the edges offooting then gradually spreads downwards and outwards. Heavingof the ground surface occurs on both sides of footing. In this modeof failure, the load-settlement curve has a peak point where theultimate bearing capacity is well defined. In the case of local shearfailure, there is a significant compression of the soil under thefooting. The local shear failure is characterized by the occurrence ofrelatively large settlements, slight heaving in surfaces and the factthat the ultimate bearing capacity is not clearly defined.
Regarding the load-settlement curves for the unreinforced andreinforced tests, it is found that the local shear failure is themode offailure for centrically loaded footing. For the sand with 60% relativedensity, this is an expectation failure mode (Vesic, 1973). Ineccentrically loaded footing, the failure mechanism is different inreinforced and unreinforced tests. In the tests without reinforce-ment layers, by increasing the load eccentricity, the mode of failureremains constant (local shear failure), whereas for the tests withreinforcement layers, the mode of failure changes by increasing theload eccentricity to general shear failure. For the tests with loadeccentricity outside the footing core, the failuremodes are quite thegeneral shear failure, while for the load eccentricities inside thefooting core and on the footing core boundary, it is dependent onthe reinforcing conditions.
For eccentrically loaded tests in reinforced condition, the set-tlement continues causing strain softening to occur. Subsequently,the sand behavior changes to strain hardening and thus byincreasing the settlement the corresponding load increases with analmost constant slope and geogrid layers seem to rupture. In otherwords, the strain hardening behavior could be attributed to thefailure of geogrid sheets, because those have increased with thesame slope. Strain softening is referred to as a behavior where thebearing capacity reduces with continuous development of settle-ment of footing (or strain of sand). Strain hardening is a process inwhich foundation bed is permanently deformed in order to in-crease resistance to further deformation.
4.2. Optimum depth of reinforcement layers
One of the important parameters in reinforced soil is theembedment depth of reinforcement layers from the soil surface.The optimum spacing of reinforcement layers is studied experi-mentally in this section. According to previous studies, severalfindings were reported for u and h in centric loading condition.Researchers emphasized that there is critical values for u and hbeyond which further increase has not any effect on bearing ca-pacity. Boushehrian and Hataf (2003), Mosallanezhad et al. (2008),and Latha and Somwanshi (2009) have shown through the tests oncircular and square footings that the optimum depth of the firstreinforcement layer and the vertical spacing between reinforce-ment layers that provide the maximum BCR vary from 0.2 to 0.5 foru/D or u/B and from 0.3 to 0.6 for h/D or h/B, respectively. Forcentrically and eccentrically loaded footings, three different depthsincluding 3 cm, 5 cm and 7 cm from footing bottom are consideredfor the first and second layers of geogrid (in dimensionless condi-tion u/D ¼ 0.25, 0.42 and 0.58 and h/D ¼ 0.25, 0.42 and 0.58 areconsidered). The results for embedment depth ratios of the firstlayer of reinforcement versus the BCR are shown in Fig. 5. As isobvious in this figure, the depth ratio of u/D¼ 0.42 gives the highestBCR at all load eccentricities. For the second layer of reinforcement,
different depth ratios including h/D ¼ 0.25, 0.42 and 0.58 areconsidered to determine the optimum value of h/D by maintainingu/D ¼ 0.42 as a constant. Results of h/D changing with the BCR areshown in Fig. 6 for both centric and eccentric loadings. It can beseen from this figure that, for depth ratio of h/D ¼ 0.42, themaximum BCR has occurred. Thus, the optimumvalue for u and h inall tests can be considered to be about 5 cm (equal to u/D ¼ h/D ¼ 0.42). Consequently, for the tests with more than 2 layers ofreinforcement, the embedment depth ratio is chosen as 0.42.
4.3. Effect of number of geogrid layers
Several tests are carried out with the same depth ratio (u/D ¼ h/D ¼ 0.42) to find out the effect of number of geogrid layers on BCRfor centrically loaded circular footing and different load eccentric-ities (e¼ 0.75 cm,1.5 cm, 2.25 cm and 3 cm). The number of geogridlayers (N) is assumed from 1 to 4. The BCR versus N is plotted inFig. 7. It is revealed that the BCR in centrically loaded footing

E. Badakhshan, A. Noorzad / Journal of Rock Mechanics and Geotechnical Engineering 7 (2015) 691e699696
increases by increasing N to 4 layers of geogrid. This finding wasreported previously by Boushehrian and Hataf (2003) proposingthat, for N greater than 4, the effect of geogrid layers is negligible.However, optimum number of reinforcement layers is dependenton embedment depth ratio of reinforcement, and in centric loadingcondition, the BCR increases to 4.19 at 3 layers of geogrid with u/D ¼ h/D ¼ 0.42. Nevertheless, in centric loading condition, the 4thlayer of reinforcement increases the BCR to 4.78, but in eccentricloading condition, the BCR increases at 3 layers of reinforcementand the 4th layer of geogrid has a reducing effect. Sawwaf (2009)obtained the same conclusion for strip footing and Sawwaf andNazir (2012) reported that N ¼ 3 is the optimum number of geo-grid layers in eccentric loading condition for ring footing overgeogrid reinforced sand and beyond N ¼ 3 the effect of reinforce-ment layers on the bearing capacity ratio can be neglected. Inaddition, the effective depth under the circular footing in eccentricloading condition is influenced by two elements. The effectivedepth has been reduced with increasing load eccentricity. On the
Fig. 8. The photographs of geogrid
other hand, the reduction of footing settlement at the ultimate loadoccurs with increasing number of geogrid layers. The photographsof geogrid sheets before and after the testing are shown in Fig. 8.After the loading of each test (at the end of each test), the diameterof punching rupture on each geogrid sheet is measured. As shownin Fig. 8, the small punching and large punching are related to lowerand upper layers of geogrids, respectively. Consequently, the failuremechanisms are predicted.
According to Fig. 9, when 4 layers of reinforcement are used, thefailure wedge cannot develop into a larger depth in comparisonwith those cases with three layers of reinforcement. As a result, theultimate bearing capacity has been decreased in comparisonwith acase with 3 layers of reinforcement. In the condition of centricloading, similar results were stated by Yetimuglu et al. (1994),Adams and Collin (1997), and Boushehrian and Hataf (2003). Toconclude this section, by increasing the number of reinforcementlayers from an optimum number, the BCR tends to decrease due tolateral slipping of sand particles on reinforcement layers.
sheets before and after testing.

Fig. 9. Failure mechanisms for three and four layers of geogrid under centric and eccentric loadings. (a) N ¼ 3 and centrically loaded. (b) N ¼ 3 and eccentrically loaded. (c) N ¼ 4and centrically loaded. (d) N ¼ 4 and eccentrically loaded.
1
2
3
0 0.75 1.5 2.25 3
BCR
Load eccentricity (cm)
(a)
1
2
3
4
0 0.75 1.5 2.25 3
BCR
Load eccentricity (cm)
(b)
u/D=0.25 u/D=0.42 u/D=0.58
u/D=0.42, h/D=0.25 u/D=h/D=0.42 u/D=0.42, h/D=0.58
N=3, u/D=h/D=0.42
N=4, u/D=h/D=0.42
Load eccentricity (cm)
BCR
(c)
0 0.75 1.5 2.25 3
6
5
4
3
2
1
Fig. 10. Variations of BCR with e for (a) one layer, (b) two layers, (c) three and fourlayers of reinforcement.
E. Badakhshan, A. Noorzad / Journal of Rock Mechanics and Geotechnical Engineering 7 (2015) 691e699 697
4.4. Effect of load eccentricity on bearing capacity
In order to investigate the effect of load eccentricity on bothunreinforced and reinforced sands for circular footing, differentload eccentricities are considered. Results indicate that the ultimatebearing capacity decreases with increasing load eccentricity in bothunreinforced and reinforced sands with geogrid layers. Byincreasing the load eccentricity, the decrease rate of ultimatebearing capacity in unreinforced condition is much lower than thatin reinforced condition. When reinforcements are placed in anoptimum distance from the footing bottom (u/D ¼ h/D ¼ 0.42), thedecrease rates of ultimate bearing capacity at a load eccentricity tothe core boundary of footing (e ¼ 0.75 cm and 1.5 cm) are less thanthose in unreinforced condition. Further, by increasing load ec-centricity away from the core boundary of footing (e ¼ 2.25 cm and3 cm), the decrease in ultimate bearing capacity is greater than thatin unreinforced condition. The bearing capacity ratio (BCR) versusthe load eccentricity for one to four layers of geogrid is shown inFig. 10. When reinforcement layer is placed in an optimum depth,the effect of geogrid layers on bearing capacity increases byincreasing the load eccentricity to the core boundary of footing(e ¼ 1.5 cm). The BCR decreases significantly at greater load ec-centricity from the core boundary of footing and by increasing theload eccentricity further outside the core, the contribution ofreinforcement becomes much lower or negligible. This increase inBCR for eccentrically loaded circular footing, in comparison withcentrically loaded circular footing, is previously shown in a test bySadoglu et al. (2009) for strip footing on geotextile reinforced sand.Similar conclusion was also reported by Sawwaf and Nazir (2012)for eccentrically loaded ring footing on reinforced layered soilthat BCR increases considerably to a value of e/D0 ¼ 0.15 (D0 is thediameter of ring footing), after which the increase rate of the BCRbecomes much lower. It is also clearly observed that, by increasingthe number of reinforcement layers from one layer (Fig. 10a) tothree layers (Fig. 10c), the BCR increases, and for four layers ofreinforcement it is lower than that in the case of three layers.
From Table 2, it is realized that, by increasing the load eccen-tricity, the ultimate bearing capacity occurs at lower settlement.However, when the sand bed is reinforced with geogrid layers, alarger settlement is necessary in comparison with unreinforced

Fig. 11. Variations of su with number of geogrid layers for centric and eccentricloadings.
Fig. 12. Tilt of footing versus settlement for each load eccentricity for one layer geogridat u/D ¼ 0.58.
Table 3Rates of circular footing tilt for different load eccentricities.
Test condition N A
e ¼ 0.75 cm e ¼ 1.5 cm e ¼ 2.25 cm e ¼ 3 cm
Unreinforced 0 0.681 0.865 0.983 1.155u/D ¼ 0.25 1 0.421 0.644 1.153 1.23u/D ¼ 0.42 1 0.411 0.61 0.802 0.985u/D ¼ 0.58 1 0.489 0.771 0.977 1.135u/D ¼ 0.42, h/D ¼ 0.25 2 0.447 0.715 0.849 1.052u/D ¼ h/D ¼ 0.42 2 0.356 0.589 0.723 0.903u/D ¼ 0.42, h/D ¼ 0.58 2 0.494 0.706 0.831 0.99u/D ¼ h/D ¼ 0.42 3 0.454 0.682 0.845 0.994u/D ¼ h/D ¼ 0.42 4 0.789 0.941 1.164 1.321
0
0.2
0.4
0.6
0.8
1
1.2
1.4
0.75 1.5 2.25 3
N=0N=1N=2N=3N=4average
Average (A) = 0.2353e + 0.3714
A N=0 N=1 N=2 N=3 N=4 Average
Load eccentricity (cm)
Fig. 13. Variations of Awith load eccentricity in both unreinforced and reinforced tests.
E. Badakhshan, A. Noorzad / Journal of Rock Mechanics and Geotechnical Engineering 7 (2015) 691e699698
condition. Use of geogrid layers causes the footing settlementcorresponding to the constant load intensity to reduce. From thefactor SR, it can be concluded that the settlement at the ultimatebearing capacity for centrically loaded circular footing withoutreinforcement layers is larger than that of eccentrically loadedcircular footing in reinforced condition. The settlements at the ul-timate bearing capacity, su, versus the number of geogrid layers, N,for different load eccentricities are shown in Fig. 11. This figureclearly indicates that, in the same condition of load eccentricity, thesettlement at the ultimate load decreases by increasing the numberof geogrid layers and it occurs mostly in one layer of geogrid. Theresults indicate that reduction rate of settlement at the ultimatebearing capacity decreases with increasing load eccentricity.
When the reinforcement layers are located in optimum values(u/D ¼ h/D ¼ 0.42), the ultimate bearing capacity for each loadeccentricity (inside and outside the footing core) has a largerquantity than centric and unreinforced bearing capacity. It is worthnoting that using reinforcement layers ensures the ultimatebearing capacity of circular foundation designed regardless ofeccentric loading. For sudden natural eccentric loads exerted on thefoundation, no bearing capacity reduction is applied whencompared to the initial state (unreinforced and regardless of loadeccentricity).
The factor qu(eccentric)/qu(centric) is also computed for both unre-inforced and reinforced conditions which is given in Table 2. It canbe concluded that, by increasing the load eccentricity, this factordecreases. Thus, when the geogrid layers are placed in optimumdepth (u/D ¼ h/D ¼ 0.42) for the load eccentricities inside thefooting core, this factor is larger than that in unreinforced conditionand for the load eccentricities outside the footing core for unrein-forced condition it is larger than that in reinforced condition.
4.5. Tilt of footing
When a footing is subjected to eccentric loading, footing tilt isinevitable. The effect of geogrid layers on the behavior of circularfooting tilt, as an unknown issue, is investigated prior to recogni-tion of the effect of geogrid layers on the BCR for eccentricallyloaded circular footing. In this study, in order to calculate the tilt ofcircular footing, two LVDTs are used for measuring the settlementof footing in two different places: one LVDT on loading rod and oneLVDT on surface of footing in a certain location along the load ec-centricity. The tilt of footing is calculated with respect to the dif-ference of settlement of footing recorded by two LVDTs. For eachtest, with eccentric loading the tilt of footing is measured. The tilt offooting versus the settlement of footing is shown in Fig. 12 for onelayer of geogrid with depth ratio of u/D ¼ 0.58 for all load eccen-tricities. From the tilt-settlement curves in both reinforced and
unreinforced cases, it is found that the tilt of footing increases withincreasing footing settlement linearly. It is clear that the tilt offooting is not corresponding to the failure of soil under footing and,thus, the tilt of footing before and after failure has a constant in-crease rate. As shown in Fig. 12, a trend line is plotted for each tilt-settlement response equal to y ¼ Ax þ B, where A is the rate offooting tilt, and B is the constant of tilt rate. The quantities of A forevery test are measured and summarized in Table 3. The maximumvariation of B is computed to be �0.5 which is negligible and doesnot have any main effect on the tilt computations. As is expected, itis seen in Table 3 that, by increasing the load eccentricity, the tilt offooting for the constant reinforced condition increases withincreasing load eccentricity.
Fig. 13 shows that, by increasing the load eccentricity, the tilt ofcircular footing increases with a constant ratio of about 0.2353.Consequently, when the tilt of footing for a test is specified (witheach reinforced condition), the tilt of footing for any load eccen-tricity (all variables are constant except for the load eccentricity)can bemeasured by this quantity (A). The other conclusion revealed

E. Badakhshan, A. Noorzad / Journal of Rock Mechanics and Geotechnical Engineering 7 (2015) 691e699 699
from Table 3 is that the rate of the footing tilt under the geogriddepth ratios of u/D¼ 0.42 and h/D¼ 0.42 at 2 layers is theminimumin comparison with two other depth ratios of u/D and h/D, i.e. 0.25and 0.58, respectively. In addition to the maximum BCR, the mini-mum tilt rate has occurred in reinforcement depth ratio of u/D ¼ h/D ¼ 0.42 for all load eccentricities. It is also observed that the tilt offooting decreases by increasing the number of reinforcement layersto 2 layers, afterwards the tilt rate increases. This trend is perceivedfor all load eccentricities (inside and outside the footing core).
5. Conclusions
The behaviors of eccentrically loaded circular footing supportedon both unreinforced and reinforced sands with geogrid layers arestudied based on a series of tests. Load eccentricities are consideredwith different values (e ¼ 0.75 cm, 1.5 cm, 2.25 cm and 3 cm) inorder to understand the effect of geogrid reinforcement layers onthe bearing capacity, settlement and tilt for load eccentricity insideand outside the footing core boundary. The following conclusionscan be drawn from this study:
(1) The maximum bearing capacity for centric and eccentric load-ings on reinforced sand bed occurs at the distance of u/D¼ 0.42between the first layer of geogrid and base of footing. The opti-mumvertical distancebetweenother geogrid layers ish¼0.42D.For eccentrically loaded circular footing, the bearing capacityincreases at 3 layers of reinforcement, beyond which the rein-forcement layers do not contribute to any improvement effects.
(2) The failure mechanism for reinforced and unreinforced sandsin centrically loaded circular footing is local shear failure, whileby increasing the load eccentricity it tends to approach generalshear failure in reinforced condition.
(3) The BCR increases with increasing number of geogrid layers,and when reinforcement layers are placed in optimum depth,the BCR increases with increasing load eccentricity to thefooting core boundary, beyondwhich the BCR can be decreased.
(4) Based on the results of this study, the ultimate bearing capacityunder eccentric loading occurs in a lower settlement in com-parison with centric loading in both unreinforced and rein-forced conditions. With increasing number of geogrid layers,the settlement increases considerably initially (about 1 layer)and afterwards decreases.
(5) The rate of tilt (A) increases by increasing the load eccentricitylinearly, and with the increase in number of geogrid layers, therate of tilt decreases at 2 layers of reinforcement.
It should be noted that the results demonstrated in this paperare related to the circular footing with diameter of 12 cm on sandbed and limited to this sand type, density and loading rate selectionconditions and that effects of some other parameters such as scaleeffect, density of soil, diameter of footing, embedment depth offooting, etc. have not been investigated herein.
Conflict of interest
The authors confirm that there are no known conflicts of interestassociated with this publication and there has been no significantfinancial support for thiswork thatcouldhave influenced itsoutcome.
References
Adams M, Collin J. Large model spread footing load tests on geosynthetic reinforcedsoil foundations. Journal of Geotechnical and Geoenvironmental Engineering1997;123(1):66e72.
Alawaji HA. Settlement and bearing capacity of geogrid-reinforced sand overcollapsible soil. Geotextiles and Geomembranes 2001;19(2):75e88.
Al-Tirkity J, Al-Taay A. Bearing capacity of eccentrically loaded strip footing ongeogrid reinforced sand. Journal of Engineering Sciences 2012;19(1):14e22.
ASTM D422-90. Standard test method for particle-size analysis. West Con-shohocken, PA, USA: ASTM International; 1990.
Basudhar PK, Saha S, Deb K. Circular footings resting on geotextile-reinforced sandbed. Geotextiles and Geomembranes 2007;25(6):377e84.
Boushehrian J, Hataf N. Experimental and numerical investigation of the bearingcapacity of model circular and ring footing on reinforced sand. Geotextiles andGeomembranes 2003;21(4):241e56.
Dhillon GS. Settlement, tilt and bearing capacity of footings under central andeccentric loads. Journal of the National Building Organisation 1961;6(2):66e78.
EastwoodW. The bearing capacity of eccentrically loaded foundations on sandy soil.Structural Engineer 1955;33(6):181e7.
Ghosh A, Ghosh A, Bera AK. Bearing capacity of square footing onpond ash reinforcedwith jute-geotextile. Geotextiles and Geomembranes 2005;23(2):144e73.
Graudet P, Kerisel J. Recherges experimentation sur les foundations soumises des effortinclines au exentres. Annales des Ponts et Chauses 1965;13(3):167e93 (in French).
Highter WH, Anders JC. Dimensioning footings subjected to eccentric loads. Journalof Geotechnical Engineering 1985;111(5):659e63.
Kumar A, Ohri ML, Bansal RK. Bearing capacity tests of strip footings on reinforcedlayered soil. Geotechnical and Geological Engineering 2007;25(2):139e50.
Latha M, Somwanshi A. Effect of reinforcement form on the bearing capacity ofsquare footings on sand. Geotextiles and Geomembranes 2009;27(6):409e22.
Lee IK. Foundations subjected to moments. In: Proceedings of the 6th InternationalConference on Soil Mechanics and Foundation Engineering; 1965. p. 108e12.
Lovisa J, Shukla SK, Sivakugan N. Behavior of prestressed geotextile-reinforced sandbed supporting a loaded circular footing. Geotextiles and Geomembranes2010;28(1):23e32.
Mahiyar H, Patel AN. Analysis of angle shaped footing under eccentric loading. Journalof Geotechnical and Geoenvironmental Engineering 2000;126(12):1151e6.
Meyerhof GG. The bearing capacity of foundations under eccentric and inclinedloads. In: Proceedings of the 1st Conference on Soil Mechanics and FoundationEngineering; 1953. p. 440e9.
Michalowski R, You L. Effective width rule in calculations of bearing capacity ofshallow footings. Computers and Geotechnics 1998;23(4):237e53.
Moghaddas Tafreshi SN, Dawson AR. Comparison of bearing capacity of a stripfooting on sand with geocell and with planar forms of geotextile reinforcement.Geotextiles and Geomembranes 2010;28(1):72e84.
Mosallanezhad M, Hataf N, Ghahramani A. Experimental study of bearing capacityof granular soils reinforced with innovative grid-anchor system. Geotechnicaland Geological Engineering 2008;26(3):299e312.
Prakash S, Saran S. Bearing capacity of eccentrically loaded footings. Journal of theSoil Mechanics and Foundations Division, ASCE 1971;97(1):95e103.
Patra CR, Das BM, Bhoi M, Shin EC. Eccentrically loaded strip foundation on geogrid-reinforced sand. Geotextiles and Geomembranes 2006;24(4):254e9.
Purkayastha RD, Char RAN. Stability analysis for eccentrically loaded footings.Journal of Geotechnical Engineering Division, ASCE 1977;103(6):647e53.
Sadoglu E, Cure E, Moroglu B, Uzuner BA. Ultimate loads for eccentrically loadedmodel shallow strip footings on geotextile-reinforced sand. Geotextiles andGeomembranes 2009;27(3):176e82.
Sawwaf M. Experimental and numerical study of eccentrically loaded strip footingsresting on reinforced sand. Journal of Geotechnical and GeoenvironmentalEngineering 2009;135(10):1509e18.
Sawwaf ME, Nazir A. Behavior of eccentrically loaded small-scale ring footingsresting on reinforced layered soil. Journal of Geotechnical and Geo-environmental Engineering 2012;138(3):376e84.
Sitharam TG, Sireesh S. Model studies of embedded circular footing on geogrid-reinforced sand beds. Ground Improvement 2004;8(2):69e75.
Taiebat HA, Carter JP. Bearing capacity of strip and circular foundations on un-drained clay subjected to eccentric loads. Géotechnique 2002;52(1):61e4.
Vesic AS. Analysis of ultimate loads of shallow foundations. Journal of Soil Me-chanics and Foundation Engineering Division, ASCE 1973;99(1):45e55.
Vinod P, Bhaskar AB, Sreehari S. Behavior of a square model footing on loose sandreinforced with braided coir rope. Geotextiles and Geomembranes 2009;27(6):464e74.
Yetimuglu T, Wu JTH, Saglamar A. Bearing capacity of rectangular footings ongeogrid-reinforced sand. Journal of Geotechnical Engineering, ASCE1994;120(12):2083e99.
Ali Noorzad obtained a Ph.D. degree from Concordia Col-lege, Canada in 1998 working on cyclic behavior ofcohessionless granular media using the compact stateconcept. He is a professor in Faculty of Civil, Water &Environmental Engineering, Shahid Beheshti University inTehran. His research interests include plasticity conceptsand constitutive modeling, finite element simulations, soildynamics and ground improvement.