:lo ij.. cfa rj6 1 studies of the strain distribution in
TRANSCRIPT

:Lo Ij.. CfA
. CIVIL ENGINEERING STUDIES rJ6 .. Is 1 STRUCTURAL RESEARCH SERIES NO. 151
STUDIES OF THE STRAIN DISTRIBUTION IN WIDE
PLATES DURING BRITTLE FRACTURE PROPAGATION
By S. T. ROLFE
T. M. LYNAM
and - W. J. HALt
A Technical Report for the
Ship Structure Committee under the
Bureau of Ships, U. S. Navy Contract NObs 65790
Index No. NS-731-034 Subproject SR -137
UNIVERSITY OF ILLINOIS
URBANA, ILLINOIS

STU~IES OF THE STRAIN DISTRIBUTION IN WIDE PLATES
DURING BRITT'"LE FRACTURE PROPAGATION
by
S. T. Rolfe
T. Mo Lynam
and
W. Jo Hall
A Technical Report
for the
SHIP STRUCTURE COMMITTEE
illlder the
BUREAU OF SHIPS, U. S . NAVY
Contract NObs 65790, Index No. NS-731-034
Subproject SR-137
Department of Cj.vil .Engineering
University of Illinois
Urbana, Illinois
April 1958


ii
ABSTRACT
This report summarizes the results of a series of tests made as a part
of the study of the propagation of brittle fractures in six-ft wide steel plateso
All plates were tested under similar conditions of stress, temperature, and
impact, which made it possible to superimpose the test data and obtain contours
of strain on the surface of the plate for a propagating fracture. Contours of
both the maximum principal strain and strain for vertically oriented gages for
various lengths of crack are presented in this report. A study of all the appli
cable data from earlier tests made as a part of this program indicates that the
strain contour data presented herein are representative of all the tests which
have been conducted.
The strain contours reveal much about the nature of the strain field
associated with a propagating brittle fracture. The studies indicate that for
this particular specimen geometry and associated test conditions, the strain
field associated with the tip of the advancing fracture remains essentially
unchanged after traversing about one-third of the plate width.


I.
TABLE OF CONTENTS
INTRODUCTION 0 •
1. General ..
2. Object and Scope
3. Acknowledgment.
4. Nomenclature.
DESCRIPTION OF SPECIMENS AND INSTRUMENTATION
Specimens and Material Properties.
Instrumentation 0 0 •
Data Reduction 0
8. Apparatus and Test Procedure 0 •
1110 ANALYSIS OF TEST RESULTS .
9. General .. 0 •••
10.
110
120
Recorded Test Data 0 0
Computed Principal Strains
Maximum Principal and Vertical Strain Contours . .
13. Crack Path and Surface Texture 0
rv 0 SUMMARY. 0 •
BIBLIOGRAPHY .
TABLES.
FIGURES
iii
Page
1
1
1
3
4
6
6
7
9
10
12
12
12
15
20
27
29
31
32

iv
1.
2.
3.
4.
5·
6.
LIST OF TABlES
Outline of Tests . . . 0 • • • • c • •
Check Analyses of Steel Plate Material . .
Tensile Test Data for Steel Plate Material .
Fracture Speeds ....
Times Corresponding to Various Crack Lengths .
Data Obtained from SRS-136 (Tests 13-32) .•
Page
32
34
35
36
33
39

v
LIST OF FIG1JRES
1. Typical Test Setup
2. Charpy V-Notch Curves Tests 33, 34, and 35
30 Charpy V -Notch Curves Tests 36 and 37
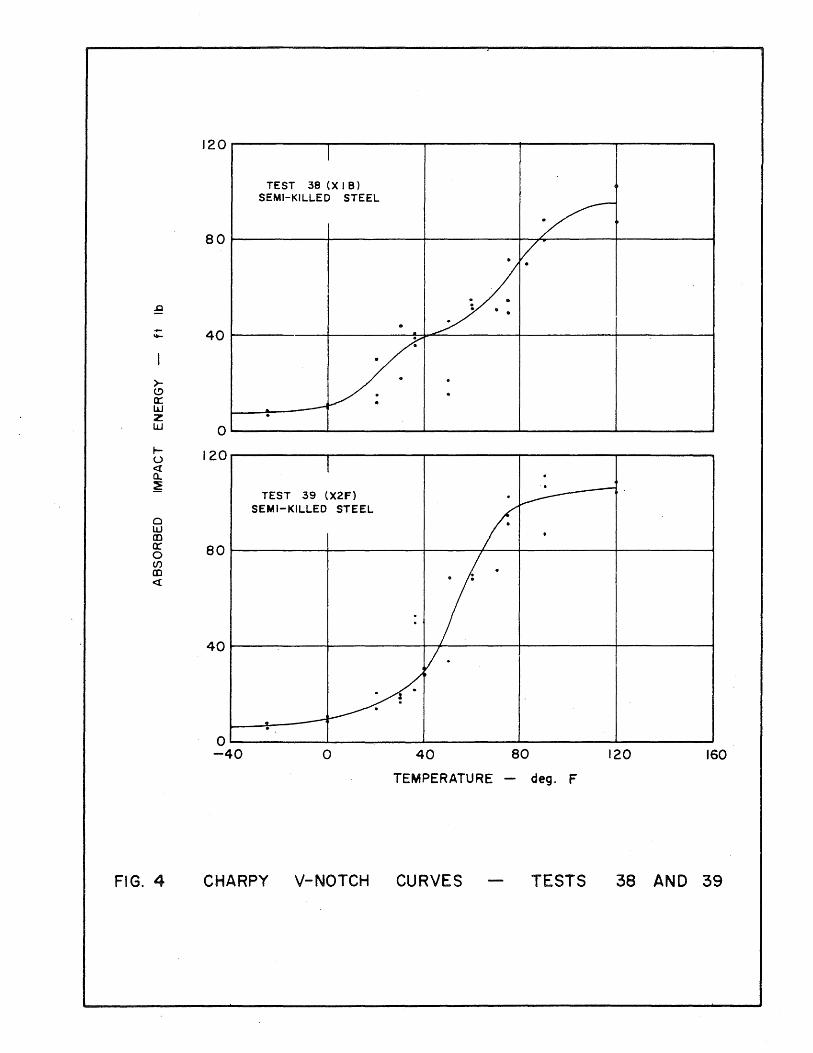
4. Charpy V-Notch Curves Tests 38 and 39
5. Instrumentation Circuits
6. Trigger Circuit
70 Recording Equipment
8. Typical Strain Records
9· Closeup of Notch and Tip of Wedge
10. Piston Device Used for Fracture Initiation
11. Therm?couple Locations and Cooling Apparatus
12. Average Cooling Curves Tests 33, 34, and 35
13. Average Cooling Curves Tests 36, 37, 38, and 39
14. Instrumentation Layout and Crack Path Test 33
15. Instrumentation Layout and Crack Path Test 34
16. Instrumentation Layout and. Crack Path Test 35
17· Instrumentation Layout and Crack Path Test 36
18. Instrumentation Layout and Crack Path Test 37
19· Instrumentation Layout and Crack Path Test 38
20. Instrumentation Layout and Crack Path Test 39
210 Typical Strain Traces and Computed Principal Strains for Rosettes Located at Various Distances from the Fracture
22. Component Gage Layouts A and B
23. Typical Strain Traces from Component Gage Layouts A and B
24. Effect of Shifting Component Gage Traces on Principal Strains
25 through 89. Strain Traces from Component Gages and Principal Strains from Rosettes -- Tests 33 tr~ough 39

vi
LIST OF FIGURES (Continued)
90. Comparison of Maximum Principal and Vertical Strain Magnitudes
910 Maximum Principal Strain versus Distance Between Rosette and Fracture
92. Maximum Principal Strain versus Distance Between Rosette and Fracture
93. Maximum Principal Strain versus Distance Between Rosette and Fracture
94. Maximum Strain Rate versus Distance Between Rosette and Fracture
95. Maximum Principal Strain Contours for 8-in. Crack
960 Maximum Principal Strain Contours for 15-in. Crack
97. Maximum Principal Strain Contours for IB.5-in. Crack
9B. Maximum Principal Strain Contours for 22-in~ Crack
99. Maximum Principal Strain Contours for 25.5-in. Crack
100. Maximum Principal Strain Contours for 29-in. Crack
101. Maximum Principal Stra.in Contours for 32.5-in. Crack
102. Maximum Principal Strain Contours for 36-in. Crack
103, Maximum Principal Stra.in Contours for 39. 5-in. Crack
104. Maximum Principal Strain Contours for 43-in. Crack
105. Typical Set of Principal Strain Contours for 22 to 50-in. Crack
106. Vertical Strain Contours for B-in. Crack
107. Vertical Strain Contours for 15-in. Crack
loB. Vertical Strain Contours for 18.5-in. Crack
109. Vertical Strain Contours for 22-ino Crack
110. Vertical Strain Contours for 25.5-in. Crack
111. Vertical Strain Contours for 29-in. Crack
112. Vertical Strain Contours for 3205-in. Crack
113. Vertical Strain Contours for 36-in. Crack
114. Vertical Strain Contours for 39.5-in. Crack
LIST OF FIGURES (Continued)
115. Vertical Strain Contours for 43-ino Crack
116. Typical Set of Vertical Strain Contours for 22 to 50-ino Crack
117. Vertical Strain Contours for 29-in. Crack -- Tests 13-32
1180 Fracture Paths -- Tests 33, 34, and 35
119. Fracture Path -- Test 36
1200 Fracture Paths -- Tests 37, 38, and 39
121. Typical Fracture Surface
122. Views of Portions of Typical Fracture Surfaces
vii


10 INTRODUCTION
10 General
Brittle fractures in riveted and welded steel structures have been
reported in the engineering literature for many years. These fractures generally
are characterized by a lack of the ductility usually associated with failures of
structural steel) and by a sudden occurrence with little or no previous warning.
The significance of the brittle fracture problem was not fully appre
ciated until World War II) when a large number of welded merchant vessels failed
in this manner. Fortunately) through the use of improved geometrical layout)
crack arrestors) and improved materials and fabrication procedures) it was
possible to reduce greatly the number of major ship failures. In many cases
provisions have been made to incorporate similar improvements or changes in the
design of structures other than ships in order to minimize the possibility of
the occurrence of brittle fractures. Nevertheless) in spite of these improve
ments in design which have resulted from the large amount of research completed
during and since World War II) brittle fractures still occur) and further studies
are requirei ~~ a better understanding of the brittle fracture problem is to be
obtained
::--~-.:;~le fracture phenomenon is extremely complicated in that it
invol"v"e.:: ::::. -'::-._~ieration of materials and their behavior in various environments.
This par:. ~::- ~_'::.:-. program is concerned with a study of the propagation of brittle
fractures i~ ~ide steel plates. The experimental approach followed in this
investigation has consisted of measuring surface strains and crack speed as the
fracture traverses a wide steel plate to obtain fundamental data that will be of
assistance in arriving at a better understanding of the brittle fracture problem.

2
Until approximately one year ago it had been possible to obtain only a
limited amount of data from anyone test because a maximum of only nine channels
of cathode ray oscilloscope recording equipment had been available. Nevertheless"
the earlier work with both two-ft wide and six-ft wide plates produced much valu-
able information concerning expected fracture speed and the strain distribution
at various points on the plate surface as recorded by single strain gages. The
* results of the work through the end of 1956 have been reported in a paper (1) '"
and in more detail in two technical reports (2, 3).
In 1957 an additional twenty-five char~els of cathode ray oscilloscope
recording equipment were made available to the program "by the Naval Research
Laboratory 0 Thus far" six flajor fracture tests of six-ft wide semi-killed steel
plates have been completed in which 34 channels of cathode ray oscilloscope re-
cording instrumentation have been utilized; in each test, 33 channels were used
for eleven rectangular strain rosettes and one channel was used for speed detec-
tors. The plates were tested at an average net applied stress of 19,000 psi,
and at a temperature of about -10 dego F. The fractures were initiated from one
edge of the plate with the notch-wedge-impact method of fracture initiation. In
conjunction with the crack arrestor program (Project SR-134), one additional set
of records has been obtained for a plate tested at a higher stress level (28,000
psi) and at a lower temperature (-15 dego F.).
Tlle primary purpose of the latest tests and studies was to obtain
sufficient data to establish representative strain contours on the plate surface
during the time a brittle fracture is propagating. The results presented in
this report are based on the tests reported herein for the first time" as well
as all of the previous applicable data obtained as part of this program ~,~4,,5)o
* Numbers in parentheses refer to references listed in the Bibliography.

3
This is a research report consisting of a summary and preliminary analysis of
the test data. More complete studies of these data, as well as subsequently
obtained data, will be made as a part of this programo
lowing~
Among the more important items presented in this report are the fol-
(1) Strain gage traces from the component gages of the strain rosettes.
(2) The principal strain curves computed from the compone:c.t gage strain
traces.
(3) A discussion of the factors affecting the computed principal ~rain
magnitudes and strain rateso
(4) Representative vertical and maximum principal strain contours for
various crack lengths during the time the fracture is propagating.
(5) Typical sets of maximum principal strain contours, and vertical
strain contours, associated with a crack in the central portion
of the plate.
The strain contours should be of considerable value in correlating the
test results and associated significant parameters with other experimental and
analytical results, and with the analytical studies being conducted as a part of
this program.
3. Acknowledgment
This investigation is a part of the Structural Research Program of the
Department of Civil Engineering under the general direction of No M. Newmark,
Head, Department of Civil Engineering, and under the general supervision of
W. H. Munse, Professor of Civil Engineering. The work was conducted by S. To
Rolfe and T. M. Lyrram,Research Assistants in Civil Engineering, working under
the immediate supervision of W. Jo Hall, Associate Professor of Civil Engineering.
The program is sponsored by the Ship structure Committee through the Bureau of

4
Ships, U. S. Navy) Contract NObs 65790, Index Noo NS~731-034 (Subproject SR-137).
The members of the Brittle Fracture Mechanics Advisory Committee to the Committee
on Ship Structural Design have acted in an advisory capacity in the plaD21ing of
this program.
V. J. McDonald) Associate Professor of Civil Engineering) supervised
the instrumentation and reduction of the test data from the photographic records.
M. Po Gaus, Research Associate in Civil Engineering) prepared the computer code
for the strain rosette computations) and F. W. Barton) Research Assistant in
Civil Engineering, helped. with the tests and preparation of the figures for the
report.
4. Nomenclature
The following terms are used repeatedly throughout the text~
Dynamic strain gage -- SR-4 Type A7 (1/4 in. gage length) strain gage whose
signal is monitored with respect to time on an oscilloscope during
the fracture test.
Static strain gage -- SR-4 Type A7 (1/4 in. gage length) strain gage used to
monitor the static strain level.
Component stra:~ gage -- One of the three individual strain gages of the rectan-
gula~ s:~ai~ rosette.
Crack detect-o:- -- .:'. single wire SR-4 Type A9 (6 in. gage length) strain gage
Ioea :,::.:.: ::=::-. t~e plate surface perpendicular to the expected fracture
pa t::-~. .:".:--c ..;.gh measure of the fracture speed may be obtained from a
know~e~-c 0: the distance between the detectors and the time interval
corresponding to the breaking of adjacent detectors.
Initiation edge -- The edge of the specimen at which the brittle fracture is
initiated.

Notch line -- An imaginary horizontal line connecting the fracture initiation
notches on opposite edges of the plate specimeno
Test load strain -- At any gage point) the strain corresponding to the applied
test loado
5

6
II ~ DESCRIPTION OF SPEC IM:ENS AND INSTRUMENTATION
5. Specimens and Material Properties
The plate material for the six major fracture tests reported herein
(Tests 33, 34 and 36 through 39) was a semi-killed steel, USS Heat Number 64M487,
and was tested in the as-rolled condition. The specimens were 3/4 in. thick,
72 in. wide, and 20 in. long; the net width at the notch line was approximately
2-1/4 in. less than the gross width because of the notches on each edge~ The
specimen was welded with double-V butt welds made with E7016 electrodes on both
ends to l-in. thick pull-plates mounted in the testing machine; in welding the
specimen to the pull-plates, care was taken to keep the warping and residual
stresses to a minimum. A line diagram of the specimen and pull-plates, and two
views of a typical test setup in the 3,OOO,000-lb hydraulic testing machine are
shown in Fig. 1.
The composite plate specimen for the arrestor test (Test 35) was fab
ricated from, in order, a 36-ino fracture starter strake of rimmed steel (the
plate on which the strain rosette gages were mounted), a 4-in. strake of T-l
steel, a 20-ino strake of rimmed steel, and a 12-in. strake of T-l steel.
Over all, the specimen was 3/4 in. thick, 72 in. wide, and 27 in. long.
Mechanical property tests were made on material taken from the central
portion of the plate after the plate had been fractured. The check analyses and
the tensile test data for each of the rimmed and semi-killed steel plates are
presented in Tables 2 and 3. Charpy V-notch data are presented in Figs. 2, 3,
and 40 The plate material used in these tests was from the same stock that was
used in the earlier tests made as a part of this program and its properties,
typical of A-7 structural steels, are in agreement with those reported earlier

7
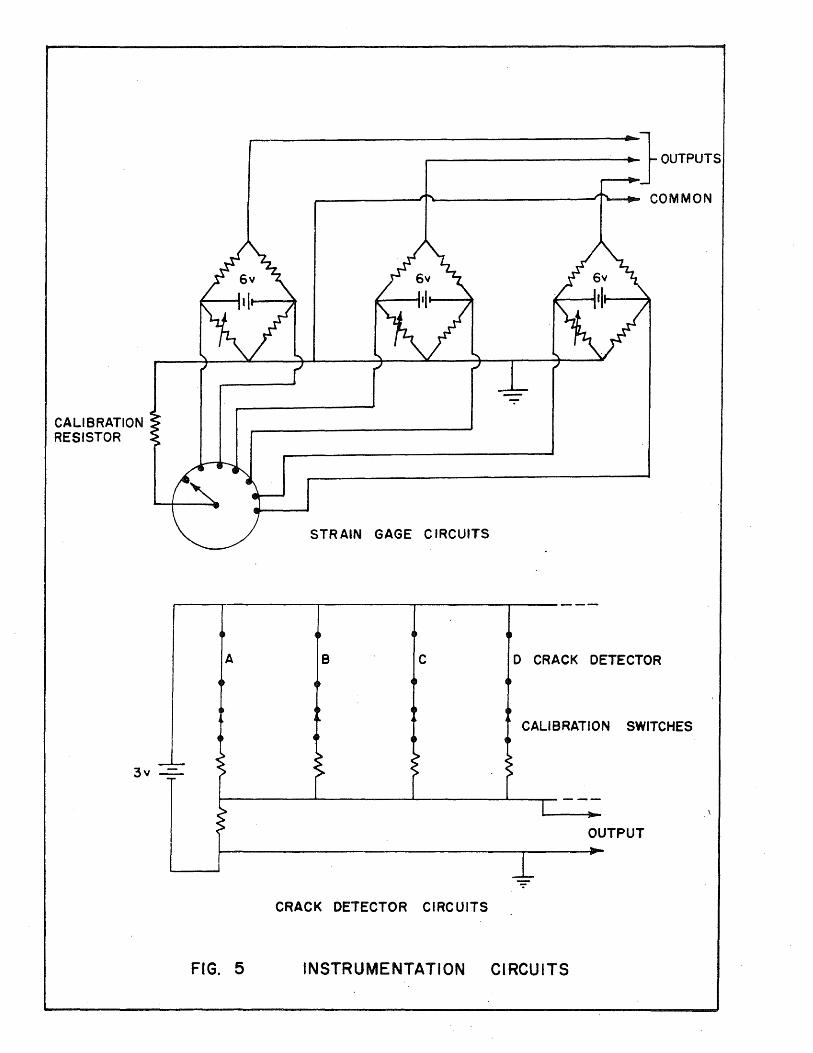
6. Instrumentation
BaldwinSR-4 Type A-7 strain gages (lj4-in. gage length) were used to
measure dynamic and static strains. The gages for dynamic measurements were
connected in the customary manner in a Wheatstone bridge circuit 0 Three similar
electrical strain gages, which were isolated from the specimen) were used as
resistances to complete the bridge circuito These bridges were excited by
direct current and their outputs fed to the recording oscilloscope channels 0 A
diagram of typical circuits is shown in Fig. 5.
The crack speed was measured with a system of six surface crack detec
tors which broke as the fracture traversed the plate; at each detector location
in Tests 36 through 39 two 6-in. detectors (Baldwin SR-4 Type A-9 strain gages)
were wired in series to give a 12-in. detector. The failure of a crack detector
opened an electrical circuit and caused a stepped change in voltageo A diagram
of a typical crack detector circuit is shown in Fig. 5. From a knowledge of the
spacing between detectors and the elapsed time between successive interruptions
of the circuit) the speed of the fracture could be computedo This system gives
an average surface speed of the fracture since the crack front location is not
known precisely at the time the detector breaks. Thus) all calculated speeds
were rounded off to the nearest 50 fpso Crack detector calibration was obtained
by successively opening switches arranged in series with the various detectors
and recording the trace steps. The switch locations are indicated in the circuit
shown in Fig. 5.
A triggering device) referred to as an external trigger because of its
location} was utilized in these tests to activate the sweep and spot intensifying
circuits in the recording equipment. This trigger consisted of a strip of alumi
num foil which was broken as the piston device drove the wedge into the notch;
thus, the circuits in the recording devices were energized just -before the
8
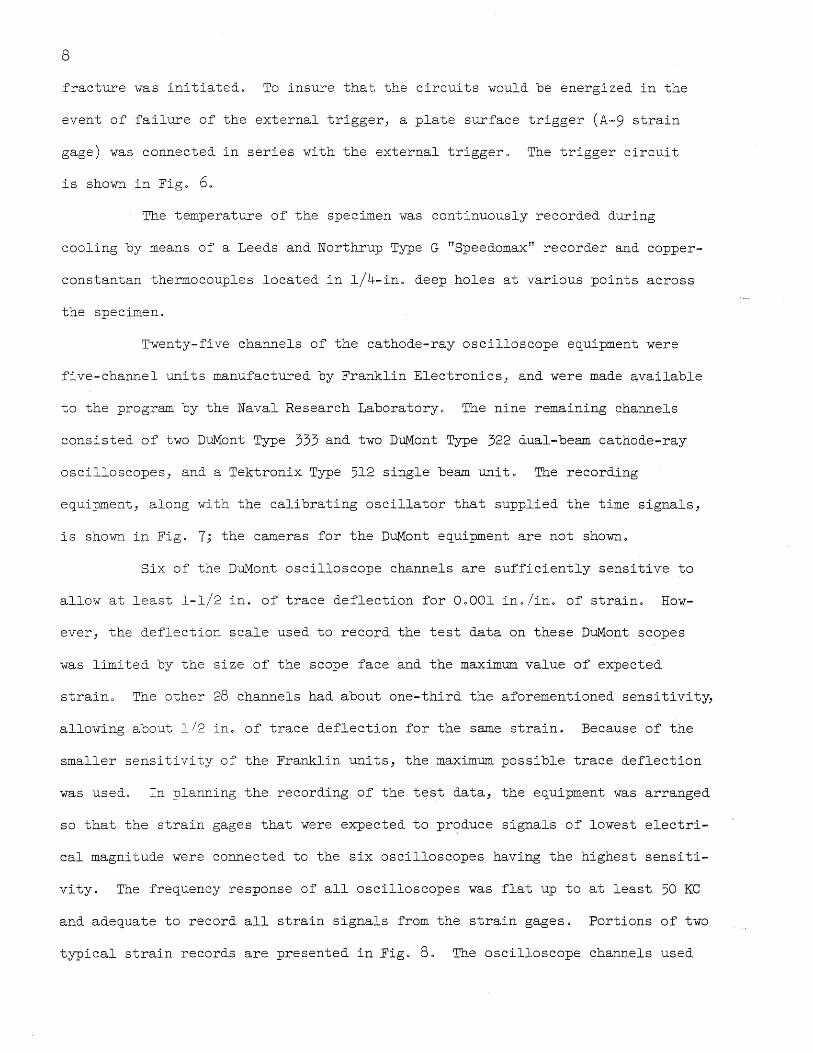
fracture was initiated. To insure that the circuits would be energized in the
event of failure of the external trigger, a plate surface trigger (A-9 strain
gage) was connected in series with the external trigger. The trigger circuit
is shown in Fig. 60
The temperature of the specimen was continuously recorded during
cooling by means of a Leeds and Northrup Type G TlSpeedomax Tl recorder and copper
constantan thermocouples located in 1/4-in. deep holes at various points across
the specimen.
Twenty-five channels of the cathode-ray oscilloscope equipment were
five-channel units manufactured by Franklin Electronics) and were made available
to the program by the Naval Research Laboratory. The nine remaining channels
consisted of two DuMont Type 333 and two DuMont Type 322 dual-beam cathode-ray
oscilloscopes, and a Tektronix Type 512 single beam unit. The recording
equipment, along with the calibrating oscillator that supplied the time signals)
is shown in Fig. 7; the cameras for the DuMont equipment are not shown.
Six of the DuMont oscilloscope channels are sufficiently sensitive to
allow at least 1-1/2 in. o~ trace deflection for 0.001 in./in. of strain. How
ever, the deflection scale used to record the test data on these DuMont scopes
was limited by the size of the scope face and the maximum value of expected
strain. The other 28 channels had about one-third the aforementioned sensitivit~
allowing about 1/2 inc of trace deflection for the same strain. Because of the
smaller sensitivity of the Franklin units, the maximum possible trace deflection
was used. In planning the recording of the test data, the equipment was arranged
so that the strain gages that were expected to produce signals of lowest electri
cal magnitude were connected to the six oscilloscopes having the highest sensiti
vity. The frequency response of all oscilloscopes was flat up to at least 50 KC
and adequate to record all strain signals from the strain gages. Portions of two
typical strain records are presented in Fig. 8. The oscilloscope channels used

9
to measure and record strain were calibrated by shunting gages with a resistance
whose equivalent strain value was known.
The time base for the records obtained from the DuMont and Franklin
oscilloscopes was supplied by continuously moving 35 rum filmo Timing marks on
the traces from the Franklin units were energized by the oscillator and recorded
as part of the strain traces; the DuMont units employed intensity modulation of
the electron spot to define the time base. On all of the strain traces a simul
taneous lTbliplT was produced by a synchronizing signal supplied from the
Tektronix oscilloscope circuit, immediately before and after the testo This
signal made it possible to synchronize accurately with each other all the strain
traces from a particular test. The synchronizing lTbliplY is visible on the
records shown in Fig. 8.
The crack detector trace on the Tektronix oscilloscope was recorded on
a single frame of 35 mm film. The time axis was calibrated by putting a time
signal of known frequency on the channel and photographing one sweep 0 This was
done i~ediately after the test was completed 0
A more complete description of the instrumentation may be found in
reports and papers previously issued as a part of this program (1, 2, 3).
7. Data Reduction
Reduction of the strain data recorded on 35 mm strip film was facili
tated with a decimal converter and the University of Illinois high speed digital
computer, the ILLIAC.
A brief summary of the data reduction procedure is presented belowo
The 35 mm film strips were enlarged and the calibration and timing marks scaled
on the enlargements. With the aid of the decimal converter, values of component
gage strain versus time were simultaneously punched on IBM cards, plotted on an
X-Y plotter, and typed in tabular form. The strain-time values were then

10
transferred from IBM cards to punched paper tape, and processed tp~ough the
ILLIAC, to compute values of the principal strains. The ILLIAC results consisted
of tabulated principal strain data, as well as scaled oscilloscope displays of
component gage and principal strain traces which were photographed for later
enlargement and processingo Drawings of the traces are presented as Figs. 25
through 89.
8. Apparatus and Test Procedure
In most respects the appartus and test procedure used for these tests
was similar to that used in earlier tests made as a part of this program.
The notch-wedge-impact method of fracture initiation was used in these
tests. A closeup view of the 1-1/8 in. deep notch and the wedge is shown in
Fig. 9. A view of the gas operated piston device that provides the external
impact is shown in Fig. 10. The theoretical output energy of the piston device
was 1200 ft Ib, but calibration tests indicate that the device actually delivered
about 1000 ft lb.
Crushed dry ice was used to cool the plate specimen. Photographs of
the dry ice containers, as well as a diagram showing the thermocouple locations
for the specimens, are presented in Fig. 11. Typical cooling curves for Tests 33
through 39 are presented in Figs. 12 and 13.
After the instrumentation was mounted on the plate: and the plate spec
imen had been welded to the pull-heads, the specimen was stressed at room temper
ature to the test load to check the behavior of the strain gages; at the same
time it was possible to ascertain the static strain distribution in the specimen
and to obtain the test load strain values for each dynamic gage. Any gages that
displayed faulty or questionable response were immediately replaced and the
newly installed gages were checked by another test load cycle.
11
In Tests 36 through 39 wiring between gages and oscilloscopes was
double checked by shunting each gage with a resistor and noting the direction
of trace movement on the face of its respective oscilloscope. This gave a posi
tive identification of the scope trace corresponding to each gage and the
direction of the compression calibration for each gage 0
At the time of test the cooling tanks were filled with crushed dry
ice, and when the test temperature was approached, the plate was stressed to
the test load. After loading, the recording equipment was calibrated, and the
gas operated piston device pressurized. When the desired specimen temperature
was obtained, the recording cameras were started, and the gas operated piston
device was fired manually, driving the wedge into the edge notch to initiate
the brittle fracture.

12
1110 ANALYSIS OF TEST RESULTS
9. General
The results presented herein are based on all of the applicable data
obtained as a part of this program. The extensive strain data obtained in Tests
33 through 39 are presented in this report for the first time 0 The use of
strain rosettes in the latter tests permits the plotting of contours of maximum
principal strain, as well as contours of vertical strain, on the surface of the
plate as the fracture propagates across the plate. The data obtained in earlier
tests (2, 3) support the results presented herein for the more recent tests;
some of these earlier data are included in this report alsoo
The order of presentation of the results is as follows 0 The original
strain-time traces from the component gages for Tests 33 through 39 are pre
sented in Section 100 The principal strains computed from the component gage
strain traces are presented and discussed in Section 11. Contours of maximum
principal strain and contours of vertical strain, for various crack lengths, are
presented and analyzed in Section 12. The principal strain contours were ob
tained by superimposing the data from Tests 33 through 39. The vertical strain
contours were obtained in the same manner and are shown to be essentially the
same as vertical strain contours based on data from earlier tests. Observations
relating to the crack path and texture of the fractures are presented in Section
10. Recorded Test Data
The primary objective of this particular series of tests was to obtain
sufficient data to establish representative strain contours on the plate surface
for various crack lengths during the time a brittle fracture is propagating
across the plateo Since only thirty-four channels of strain recording equipment

13
were available (33 channels for eleven rectangular strain rosettes and one
channel for crack speed detectors) and the exact location of the fracture path
was unknown prior to each test, it was decided to concentrate the strain rosettes
in three general areas with respect to width on tpJee of the plate specimens, and
thereafter superimpose the data to obtain the picture of the strain distribution
associated with a propagating crack.
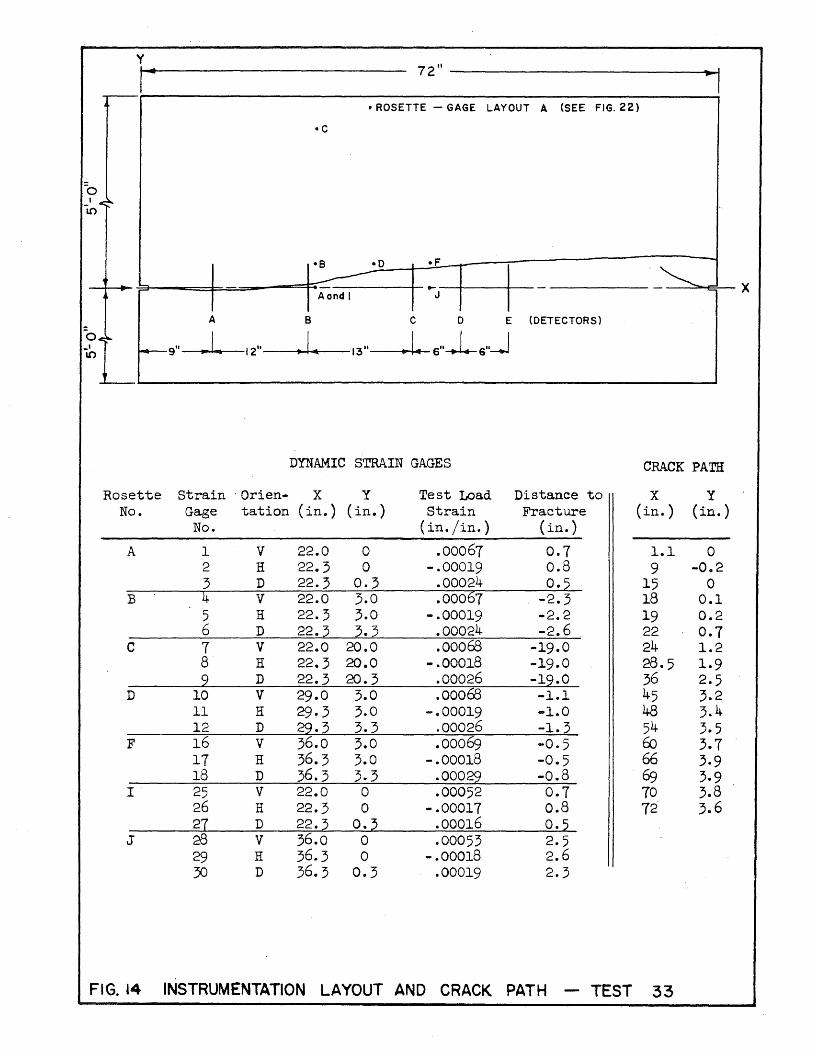
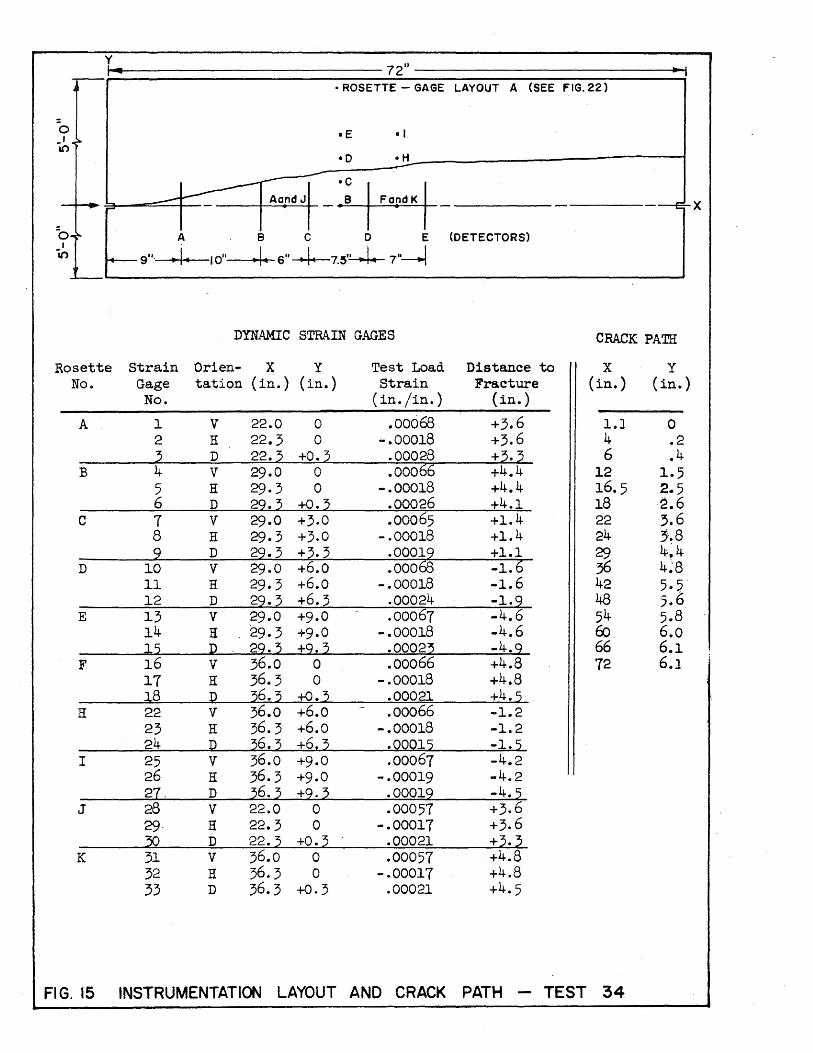
The instrumentation layouts andcrackpattls for Tests 33 tPJough 39 are
shown as Figs. 14 through 20. It should be noted that in general the rosettes
were located on the opposite side of the plate shown in these drawings. The
strain rosettes are located on only the first two-thirds of the plate since it
was felt rosettes located in this region would yield the desired strain informa
tion. The strain rosettes were located at 7-in. intervals across the plate in
order to obtain strain values at intervals of bne~tenth the net plate width.
Since a double fracture occurred in Test 36, a duplicate test (Test 39) was
conducted.
The strain-time curves of the component gages from Tests 33 through 39
are presented in Figs. 25 through 89. All strain ~races are plotted such that
the strain at zero time is the initial test load strain.
The vertical and diagonal gage traces exhibit a general shape char
acterized by a fairly steady and rapid increase in strain to a maximum (peak)
strain value as the fracture propagates past the gage; the peak strain is
followed by a decrease to a strain level associated with the removal of external
load. For gages located close to the fracture, the peak is very sharp; for gages
located away from the fracture, the peak is of a lower magnitude and the pulse
extends over a longer time.
The horizontal gage traces are characterized by three major changes in
strain. The strain trace first exhibits an initial relaxation of compressive

14
strain, and this is followed by a compression pulse corresponding to the tension
peak of the vertical gage. Finally) the trace exhibits another relaxation of
compressive strain before leveling off at the final strain value.
Typical strain traces for component gages located at various distances
from the fracture may be seen in Fig. 21; the three rosettes are from one plate
and are mounted directly above one another at distances of 101 ino) 401 ina) and
7.1 in. from the fracture. The strain traces shown are representative of the
strain-time curves obtained from all tests conducted as a part of this program.
The decrease in maximum strain magnitude and the change in pulse shape as the
distance between the gage and fracture changes may be clearly noted.
The second peak occurring in the component gage traces (and principal
strain traces) in Figs. 47, 49, 51, and 54 was attributed to electrical effects
associated with the recording eqUipment, (although there is still some question
regarding this matter) and not the double fracture of the plate specimen in
Test 36.
Static strain gages were located every seven inches along the notch
line on both faces of the plate and three sets of back to back gages were placed
18 in. above the notch lineo Strain readings showed that in each test there was
a fairly uniform static strain distribution across the plate during application
of the test load; in addition, bending strains were noted to be less than
0.0002 in.jin. in all tests. To simplify the instrumentation drawings presented
as Figse 14 through 20, the positions of the static stralllgagesarenot presented.
The crack speed detectors were used to measure the approximate surface
fracture speed and to aid in determining the location of the surface fracture at
any time during the brittle fracture test. The average surface speeds of propa
gation of the brittle fracture for Tests 33 through 39 are presented in Table 4.

15
It will be noted that these speeds ranged from 1850 to 4750 fpso These speeds
are in the same range as those reported for earlier tests (2, 3)0
11. Computed Principal Strains
Rectangular strain rosettes consisting of three SR-4 Type A-7 strain
gages were used to determine the principal strains at various locations on the
surface of each specimen. Since the component gages were of a finite size, it
was obviously not possible to measure the strain in three directions precisely
at a point; however, since the three component strain gages of the rosettes had
a 1/4-in. gage length, it was possible to mount the three gage elements within
a 0.7-in. diameter circle and this was considered to be satisfactory under the
circumstances.
In the tests reported herein, two rosette layouts of the component
gages were used. Photographs and drawings of both gage layouts are presented in
Fig. 22. In layout A (used in Tests 33, 34, and 35) the diagonal gage was cen-i
tered directly above the horizontal gage, and the vertical gage was mounted on
the side near the initiation edgeo In layout B (used in Tests 36 through 39)
the vertical gage was centered directly above the horizontal gage, and the
diagonal gage was mounted on the side away from the initiation edgeo
In the case of strain records obtained with gage layout A, ~he verti-
cal gage peaked ahead of, or at the same time as, the horizontal and diagonal
gages for about 80 per cent of the rosettes. A detailed study of the component
gage traces and the principal strain computations indicated that changes in the
vertical and horizontal strain values had the greatest effect on the principal
strain magnitudes; thus in Tests 36 through 39 it was decided to center the
vertical and horizontal gages above one another, in the manner shown in layout B
(Fig. 22)0 For records obtained ~th gage layout B, the vertical and horizontal
gages peaked ahead of, or at the same time as, the diagonal gages for about 85

per cent of the rosettes 0 Typical component gage traces from both layouts are
shown in Fig. 23; the offset in peaking times may be noted clearly.
Initially, it was believed that a refinement in the results would be
obtained by shifting the recorded component gage traces to make the maximum
strain values occur at the same time 0 However, later studies showed that there
was only a small change in the principal strains as a result of shifting the
component gage traces. This is illustrated in Figo 24, in which the principal
strains are computed for a typical rosette, in one case with the strain traces
as recorded and in the ether case with the traces shifted to make the peaks
occur at the same time. It will be noted that shifting the trace does not
change the shape or magnitude of the maximum principal strain trace markedly.
For most rosettes it would be necessary to shift the trace less than Ool milli
seconds to make the maximum strain values occur at the same time. This time
difference is of the same order of magnitude as the inherent time error asso
ciated with matching of the trace times during a reduction of the original 35 mm
strip film record. It should be noted that many other factors also tend to
affect the strai~ traces, such as the discontinuous nature of the fracture, the
deviation of the 2rack path from the notch line, inherent variations in
instrumentatio~. e~c. All of the foregoing factors and studies tend to justify
the decisior: :-::::; +~ :c shi ft the traces; therefore, all of the principal strains
have been co:::.r...:' .::.: :':-:nn the lias recorded ll component gage traces.
To :::;r ',a _:-~ :,j-:: computed principal strains from the rectangular strain
rosette equa~i~:.z :~ was necessary to first determine strain values from the
three component gage traces at selected times; the times were selected arbitrarily
at points corresponding to changes in strain in the component gage traceso The
data reduction procedure followed thereafter has been described in Section 70

17
The rectangular strain rosette equations used in computing the principal strains
and the direction of the maximum principal strain were as follows a
where:
e max
E )~ Vi]
e . mln e -~/2 (~ - E )2 + 2(£ - e )21 hV n d d vJ
= .1. tan-l 2
2Ed - ~ - ev eh - Ev
e = maximum principal strain max
E. = minimum principal strain mln
e angle between e and the positive X-axis max
E = vertical (Y) component gage strain v
Ed = diagonal component gage strain
Eh = horizontal (X) component gage strain
The resulting curves of the principal strains (e and E . ) and the direction max mln
of E wi th respect to the positive X-ax.is: (e) for Tests 33 through 39 are premax
sented in Figs. 25 through 890
In general the maximum principal strain trace for each rosette is of
essentially the same shape as the vertical component gage trace. Also for any
rosette, the magnitudes of the peak strain for the vertical gage trace and for
the principal strain trace are nearly equalo This is shown in Fig. 90 in which
a comparison is made of the maximum principal and vertical peak strain magnitudes;
it will be noted that there is nearly a one to one correspondence in strain
values, irrespective of the distance from the fracture path. Almost all peak
strain values fall in a range between 0.0008 in./in. and 0.00)0 in./in.
The minimum principal strain traces are characterized by a shape which
exhibits a slight peak in tension, followed by -a fairly sharp compressive pulse
occurring as the fracture propagates past the rosette; this compressive pulse
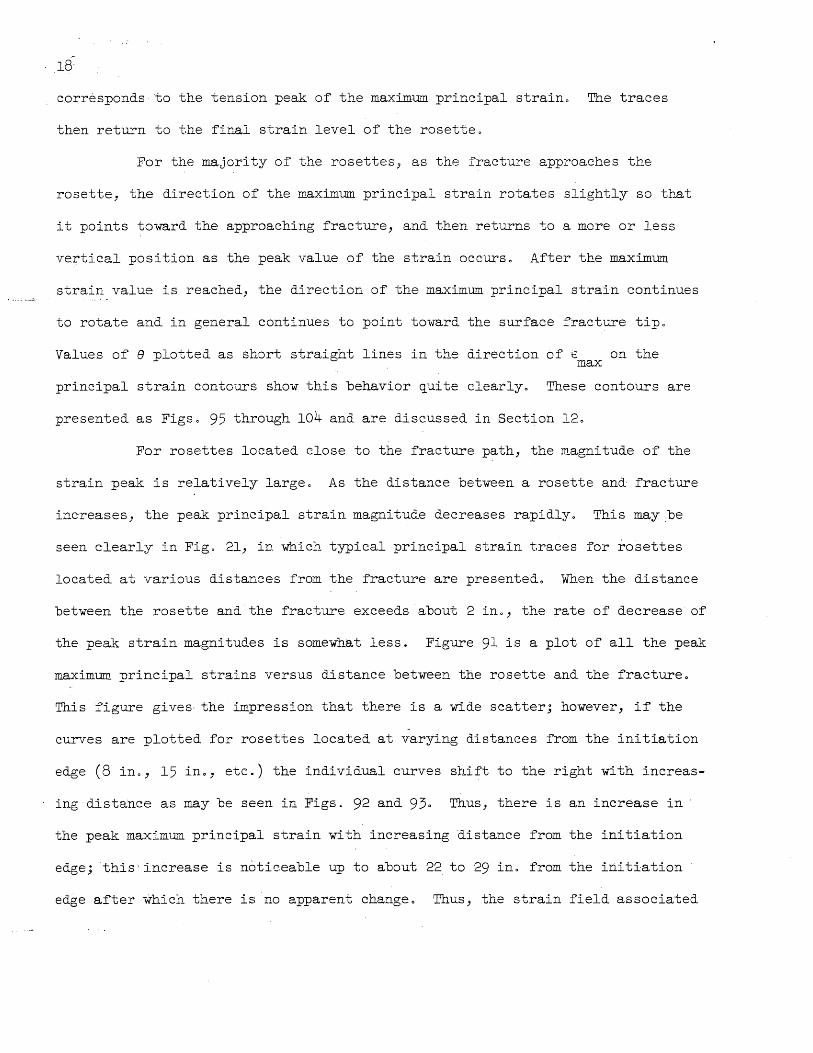
corresponds to the tension peak of the maximum principal straino The traces
then return to the final strain level of the rosette.
For the majority of the rosettes, as the fracture approaches the
rosette, the direction of the maximum principal strain rotates slightly so tr~t
it points toward the approaching fracture, and then returns to a more or less
verti.cal position as the peak value of the strain occurs 0 After the maximum
strain value is reached, the direction of the maximum principal strain continues
to rotate and in general continues to point toward the surface fracture tipo
Values of e plotted as short straight lines in the direction of€ on the max
principal strain contours show this behavior quite clearlyo These contours are
presented as Figso 95 through 104 and are discussed in Section 120
For rosettes located close to the fracture path, the magnitude of the
strain peak is relatively large 0 As the distance between a rosette and' fracture
increases, the peak principal strain magnitude decreases rapidly. This maybe
seen clearly in Figo 21, in which typical principal strain traces for rosettes
located at various distances from the fracture are presentedo When the distance
between the rosette and the fracture exceeds about 2 in., the rate of decrease of
the peak strain magnitudes is somewhat less. Figure 91 is a plot of all the peak
maximum principal strains versus distance between the rosette and the fracture 0
This figure gives the impression that there is a wide scatter; however, if the
curves are plotted for rosettes located at varying distances from the initiation
edge (8 in., 15 in., etc.) the individual curves shift to the right with increas-
ing distance as may be seen in Figs. 92 and 930 Thus) there is an increase in
the peak maximum principal strain with increasing 'distance from the initiation
edgejthis'increase is notic.eable up to about 22 to 29 in. from the initiation
edge after which there is no apparent change. Thus, the strain field associated

with the propagating fracture appears to reach a TTsteady staten condition at
about 22 to 29 ina from the initiation edge.
19
Another characteristic of the strain-time curves that was studied was
the variation of the maximum strain rate with vertical distance of the rosette
from the fracture surface. The strain rate (ino/ino/sec) is difficult to
determine accurately because of the very nature of the strain traces (Figo 8),
the computed strain rates presented in Figo 94 should be considered to give only
a qualitative pictureo However, it is apparent that a general trend of strain
rate versus distance between rosette and fracture does exist as might be ex
pected. The sketch in the upper right corner of Figo 93 illustrates the proce
dure by which the strain rates were determined 0 A IIbest fit" curve of all points
is also shown on the plot 0 Strain rates ranging from 1 to 109 ino/ino/sec were
computed; however the majority of the values fall in the range of 1 to 30
in./in./sec for gages located at 1/2 ino to 3 ino from the fracture 0
Strain-time curves of the component gages and computed principal
strains of the four rosettes for which records were obtained in Test 35 are
presented as Figs. 42 to 45. This test was conducted at a higher stress (28,000
psi) and a lower temperature (-150 F) to determine the effect of a higher stress
level on the strain patterno The traces are essentially the same shape as those
found in the plates tested at lower stresses although the peak maximum strains
are slightly higher. However, the rosettes were located quite close to the
fracture path and in view of the earlier discussion, it is to be expected that
the strain magnitudes might be fairly high. The maximum principal peak strain
magnitudes of rosettes from Test 35 are plotted on Figo 91 and exhibit the same
trend as peak strain magnitudes from the other tests. Thus, on the basis of one
test only, it appears that there was no marked change in the strain behavior for
a propagating crack at this somewhat higher stress level.

20
120 Maximum Principal and Vertical Strain Contours
In order to portray the strain distribution in a plate during the time
a fracture is propagating, it was decided to plot contours of certain strain
components for various crack lengthso The available data consists of strain-time
traces for horizontal, diagonal, and vertical gages from this series of tests as
well as from earlier tests; in addition, principal strain values have been com
puted for the rectangular rosettes formed with the component gages in the test
series reported hereino
In view of the fact that this is a brittle fracture study and the
maximum tensile strains are of interest, it was felt that plots of contours of
maximum principal strains for various crack lengths would be particularly
valuable~ The maximum principal strains are of interest from another standpoint
since they provide both the magnitude and direction of the maximum tensile straino
The maximum principal strain contours are presented as Figso 95 tb~ough 105. As
has been noted earlier, the magnitude of the maximum principal strain is essen
tially equal to that of the maximum vertical strain; one reason for this is that
the principal strain direction does not rotate much from the vertical. Thus, as
a matter of comparison, and because a plot of the vertical strain allows an
incorporation of data from the earlier tests, it was decided to present contours
for the vertical strains as well; the contours of vertical strain are presented
in Figs. 106 through 117. Although contours of only the maximum principal
strain and vertical strains are presented in this report, contours of the other
strain components, namely the diagonal strain, horizontal strain, minimum princi
pal strain, and shear strain, could be prepared from the strain data presented in
Figs. 25 through 89.
In order to obtain strain contours, it was necessary to superimpose the
results from a number of tests. The data ~rere superimposed only from plates tested

21
under similar conditions of stress, temperature, and impact; the only major
variable with respect to the individual tests was the location of the fracture
path with respect to the notch line. In general, the fractures sloped upward
from the point of initiation and then leveled off as they traveled across the
plate. The excursions from the notch line were on the order of 2 to 8 in.,
precise locations of the fracture paths are tabulated in Figs. 14 through 20.
However, since these distan2es are small in relation to the plate width, the
actual crack length was never more than a few per cent greater than the net
plate width. The horizontal projection of the fracture was used as the common
fracture path on the strain contour plots.
The procedure used in plotting the strain contours may. be summarized
as follows. It was first necessary to establish from the original strain-time
curves the time corresponding to various selected crack lengths. At the same
time, it was necessary to establish the position of the gage with respect to
the fracture path 0 Then, at any particular time corresponding to a given crack
length, the strain values were obtained from the test data and this strain data
was used in plotting the contours 0 The contour lines were drawn in regions
where data were available by joining points of equal straino No contours were
drawn in regions where there were no data, although, it is obvious that strain
contours do exist in these regionso
Before strain values could be determined for any particular crack
location, it was necessary to establish the respective times that corresponded
to the desired crack positions in every testo These times were determined by a
knowledge of the breaking times of the crack detectors and the peaking times of
the vertical strain gages located closest to the fracture surface, and are tabu
lated in Table 5 for various crack lengthso It was assumed that the peak strain
of a rosette occurs when the surface fracture is directly above or below the

22
rosette) although the exact position of the tip of the fracture cannot be
determined at any precise time. At points where there was disagreement between
detector breaking times and gage peaking times) the peaking times of the strain
gages were selected as the more reliable indication of the surface fracture
location because of the more sensitive response of the strain gage. As a
geneTal rule, the detector breaking times were used or~y as a guide to selecting
times corresponding to selected crack lengths. At fracture positions where there
were no strain. gages or detectors) the corresponding time was approximated bya
linear interpolation between any two known points.
Since the horizontal projection on the notch line of the actual frac
ture path was used as the common fracture path for all tests for purposes of
superposition) it was important to locate accurately each gage or rosette with
respect to this common fracture. Three different methods of determining the
gage and rosette locations on the plate layout with the common fracture path
were investigated. The first method consisted of measuring the vertical dis~
tance between the rosette and the actual fracture for particular tests and
locating the rosettes on the plate layout accordingly. The second method
consisted of measuring the perpendicular distance of each rosette or gage from
a horizontal line projected across the plate from the tip of the surface fracture
for the particular crack length under investigation. The third method consisted
of measuring the perpendicular distance between a rosette and the fracture) or
the extension of the fracture in the direction the fracture was traveling at that
particular instant; the rosette was then located above or below the common frac
ture path by this amount. A study of the three methods of locating the gages and
rosettes on the strain contour plots indicated that regardless of the method used)
the final strain contours were essentially unchanged. Since, in general the
fracture followed a horizontal path as it passed tr~ough the region where rosettes

23
were placed., it was o"bvious that in the majority of cases there would be no
significant difference in the final rosette loc:at.ions as determined by any of the
three methods investigatedo In tests where the fracture was not horizontal~
there would be a change in.. rosette locations; however, in general, at some dis
tance ahead of the tip of the fracture, the changes in strain were so small that
the net result was that the st.rain cont.ours were still not altered markedlyo
Therefore, it was decided to use the actual fracture path as the common reference
line for location of the strain gages and rosetteso
With regard to the strain data which is plotted at any particular time
for purposes of establishing the strain contours, there are several additional
factors of importance which should be noted at this timec Because of the nature
of the recording equipment, the component gage strain and the computed prinCipal
strains are accurate only to about the nearest 000001 ino/inc, and the recorded
times are accurate only to about 0005 millisecondsc For an average fracture
speed of 2500 fps, this time error of 0005 milliseconds would correspond to a
fracture length of about 1-1/2 ino
Because of the slight bending of the plates caused by the welding of
the specimens to the pull-plates, and the possible residual strains in the
plates, the value of the test load strains varied somewhat for the testsc
Because of this fact, and to minimize the effect of any other variables, the
contour interval selected for the plots was Oc0002 to 000004 ino/inc In the
case of the maximum principal strain contours, all of the tests were made at
about the same stress level; thus" it appeared desirable to plot the contours in
terms of absolute strain, that is, with respect to the as-rolled condition.
The vertical strain contours could also have been plotted in terms of
absolute strain. However, in order to incorporate the data from earlier tests
in which the test load stress varied from 15,000 psi to 20,000 psi, it was

24
decided to subtract the test load strain from the absolute vertical strain and
plot the relative strain values; in all cases the reference strain in the verti-
cal strain contour plots is the test load strain.
In spite of the limitations discussed in this section, it is felt that
the strain contours presented give a very representative picture of the effect
of a propagating brittle crack on the strain distribution in a wide steel plate.
The maximum principal strain contours presented as Figs. 95 through
104, and the vertical strain contours presented as Figs. 106 through 115, are
based on the data from Tests 33, 34, 37, 38, and 39. The data from Tests 35 and
36 were not used in the contour plots because Test 35 was conducted on an arres-
tor specimen at a higher applied stress level, and Test 36 resulted in a double
fracture. A careful examination of the strain results from gages and rosettes
of Tests 35 and 36 will show that the data from these two tests are similar to
that of the other tests reported. In the contour plots, the magnitudes and
directions of the maximum principal strain are shown at the respective locations
on the plate layout. The directions of the maximum principal strain, are shown
as short straight lines. For ease in interpretation of the contours, all strain
units are ina/in. times 106.
For an 8-in. crack (Fig. 95), the shortest crack length for which
contours have been plotted, it will be noted that the increase in strain directly
above and below the surface fracture tip is small in comparison with strain
changes for longer crack lengths. At points ahead of the 8-in. crack, the strain
changes are negligible and the plotted strains correspond to the test load prin-
cipal strains. The variation in test load principal strains for the rosettes and
for the various tests accounts for the differences noted in the plotted strain
values. The numbers in parentheses following the strain values refer to the test
number and corresponding rosette from which the plotted strain values were

25
obtained. These two numbers are shown only on Fig. 95 but refer also to Figs.
95 t~~ough 104 as well. For an 8-in. crack length, the small changes in strain
exhibited by the rosettes located only 8 in. from the initiation edge (Figs. 60
and 66) further attest to the fact that the notch-wedge-impact method of fracture
initiation has little effect on the strain distribution in a wide plate.
The change in strain distribution as the crack length increases may be
seen clearly by comparing Figs. 95, 96, and 97, in which the maximum principal
strain contours are presented for crack lengths of 8 i:::1. ,15 in., and 18.5 in.
As the crack length increases it will be noted that the magnitude and extent of
the strain field associated with the crack tip have increased. At a crack
length of 22 in., as is shown in Fig. 98, the strain pattern surrounding the
moving crack tip ceases to change, and for crack lengths in excess of 22 in.,
the strain field surrounding the advancing crack tip remains essentially un
changed. This general effect was noted earlier in Section 11 in connection with
Figs. 92 and 93 which show the results of a study of the peak strain magnitude
versus distance of the rosette from the fracture, for rosettes located at various
distances from the initiation edge. Figures 99 through 104, for crack lengths of
25-1/2 in. to 43 in., illustrate the fact that in the central one-third of the
plate the strain field associated with the tip of the crack remains essentially
unchanged. The extent of the strain contours directly ahead of the fracture
increases only slightly with increasing crack length. Thus, for this particular
specimen geometry, apparently the propagating brittle fracture does not reach a
Tisteady state" condition until it has traversed a distance of about 22 in. This
length is somewhat longer than that which earlier stUdies had suggested.
As may be seen in Fig. 98, the major portion of the strain field
associated with the propagating brittle fracture extends or~y about 8 in. to
10 in. ahead of the fracture. In the region directly ahead of the cracks, the
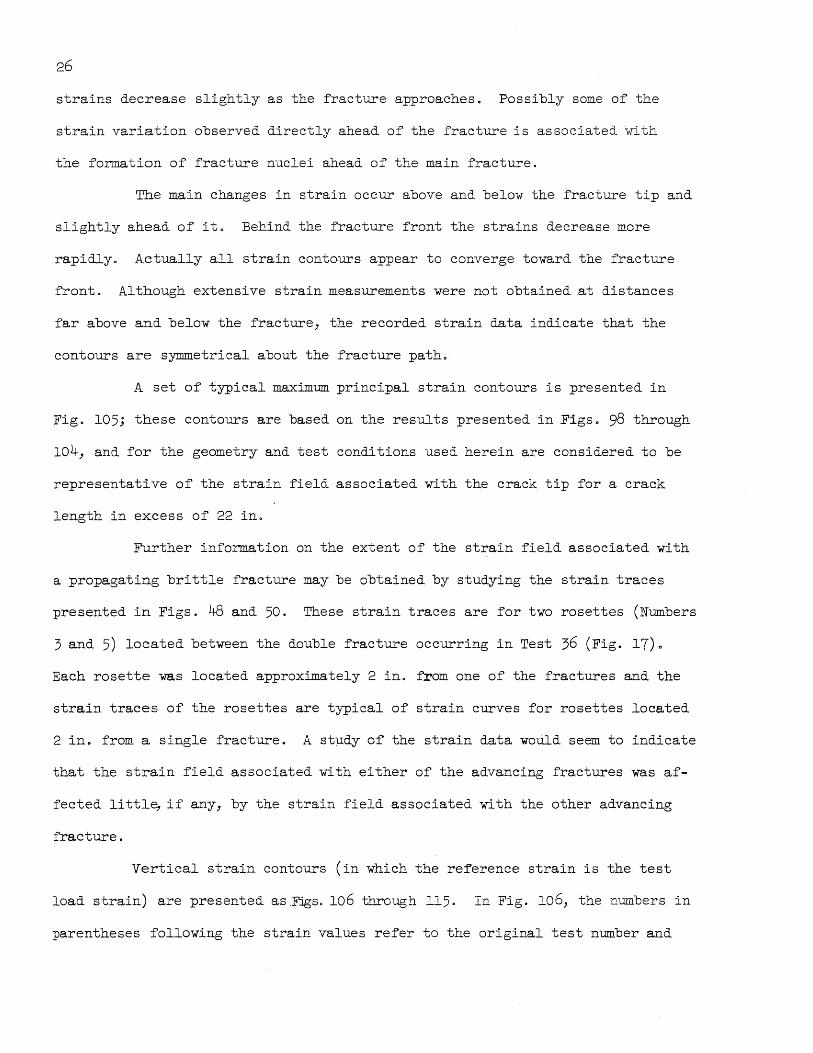
strains decrease slightly as the fracture approaches. Possibly some of the
strain variation observed directly ahead of the fracture i.s associated With
the formation of fracture nuclei ahead of the main fracture.
~he main changes in strain occur above and below the fracture tip and
slightly ahead of ito Behind the fracture front the strains decrease more
rapidly0 Actually all strain contours appear to converge toward the fracture
front. Although extensive strain measurements were not obtained at distances
far above and below the fracture, the recorded strain data indicate that the
contours are symmetrical about the fracture path 0
A set of typical maximum principal strain contours is presented in
Fig. 105; these contours are based on the results presented in Figs. 98 through
104, and for the geometry and test conditions used herein are considered to be
representative of the strain field associated with the crack tip for a crack
length in excess of 22 in.
Further information on the extent of the strain field associated with
a propagating brittle fracture may be obtained by studying the strain traces
presented in Figs. 48 and 50. These strain traces are for two rosettes (Numbers
3 and 5) located between the double fracture occurring in Test 36 (Fig. 17).
Each rosette was located approximately 2 ino from one of the fractures and the
strain traces of the rosettes are tJ~ical of strain curves for rosettes located
2 in. from a single fracture. A stpdy of the strain data would seem to indicate
that the strain field associated with either of the advancing fractures was af
fected littl~ if any, by the strain field associated with the other advancing
fracture.
Vertical strain contours (in which the reference strain is the test
load strain) are presented as.ngso 106 ~hrough 115. In Fig. 106, the p-umbers in
parentheses following the strain values refer to the original test number and

27
corresponding vertical gage number respectively from which the plotted strain
values were obtained. In general) these contours are similar in shape and mag-
nitude (if the test load strain were added) to the maximum principal strain
contours discussed previouslyo A typical set of vertical strain contours based
on the results of Figs. 109 through 115 and for a crack length in excess of
22 in.) is presented as Figo 116.
Vertical strain contours for a crack length of 29 ina) based. on
results from all earlier six-ft wide plate tests are presented in Figo A
tabulation of the data used to plot the contours in Figo 117 is presented in
Table 6. These values are typical for the crack lengths in excess of 22 ino
investigated for Tests 13 through 32. The strain values were superimposed in a
manner described earlier; although a few exceptions may be ~oted) the strain
values exhibit the same general pattern as shown in Figo 116.
The contours of maximum principal strain and vertical strain are based
on data obtained from all the six-ft wide plates tested as a part of this inves-
tigation, and are considered to be representative of the strain distribution
recorded on the surface of the plates during brittle fracture propagation.
13. Crack Pat~ and Surface Texture
P::~to;raphs of the fractured plate specimens are presented as Figs. 118
through ~~~. _ .. general, the fractures slope upward from the point of initiation
and the:-. A black string is stretched along the notch line in these
figures. l~. ==-,?: tests a secondary crack started from the notch cut at the far
edge) p::-::::-;:s.;-::.:~' i :oward the approaching fracture, and ended in a submerged crack
before reac~i~; the main fracture. These secondary cracks may be seen in the
figures.
The fracture in Test 36 branched near the center of the plate into two
complete fractures. A close-up of the branch of the double fracture may be seen
in Fig. 119.

28
Views of a typical fracture surface are presented in Figo 1210 The
shear lip associated with the fractures was very small and almost imperceptible 0
Portions of the surface exhibit a coarse texture with the usual herringbone pat
tern while in other regions, usually near the initiation edge, the texture is
quite smooth 0 Close-up views of both smooth and coarse fracture texture are
presented in Fig. 122.
The reduction in plate thickness in the region of the fracture surface
was one to two per cent; this reduction in thickness is of the same order of
magnitude as that found in earlier fracture tests conducted as a part of this
program.
IV. SUMMARY
This research report contains a summary and preliminary analysis of
data primarily from Tests 33 through 39 conducted as a part of the current
brittle fracture propagation study 0 More complete studies of these data, as
well as data obtained subsequently, will be made as a part of the program 0
The specimens were tested with a net stress of about 19,000 psi, at
a temperature of about -10 deg F, and with a nominal impact of 1200 ft lb for
fracture initiationo Thirty-three channels of instrumentation were useQ i'or
each test; this is more than t~~ee times as many channels as had previously
been available for anyone test. The strain-time traces from the component
gages, as well as the computed principal strains J are presentedo Since the
29
tests were conducted under similar conditions of stress, temperature, and impact,
it was possible to superimpose the strain data to obtain a more complete picture
of the strain distribution on the surface of the plate associated with the moving
fracture.
The behavior exhibited by the component gages was similar to that ob
served in earlier tests. For example, in the case of a vertically oriented
strain gage, as the distance between the gage and the fracture path decreased,
the strain pulse became sharper and had a greater magnitude; as the distance
between the gage and fracture increased, the strain pulse extended over a longer
period of time, but the: precise shape of the pulse depended on the distance from
the fracture path. For gages oriented in the diagonal and horizontal directions,
this same general trend was noted, but the shape of the strain trace, particu
larly in the case of the horizontal gage, was markedly differento
In the case of the principal strains computed from the component
strain traces, the maximum prinCipal strain was found to exhibit the same type

of behavior as observed for a vertically oriented gage, with the exception that
the direction of the maximum principal strain was found to rotate slightly to
either side of the vertical axis depending upon the location of the fracture 0
Although the nature of the strain traces are such that only a rough
picture of the strain rates may be obtained, the trend is of some interesta As
would be expected, the maximum strain rate occurs for gages located quite close
to the fracture 0 Strain rates ranging from 1 to 109 ina/ina/sec have been com
puted; however, the majority of the values fall in the range of 1 to 30 ina/ina/sec
for gages located at 1/2 ino to 3 ino from the fracture 0
Contours o~ maximum principal strain and vertical strain, for various
crack lengths, are presented. The major- portion of the strain field associated
with the front of the propagating brittle fracture extends only about 8 to 10 in.
ahead of the fracture; the regions most affected are above and below the fracture
tip and slightly ahead of ito Although extensive strain measurements were not
obtained at distances far above and below the fracture, the recorded strain data
indicate that the contours are symmetrical about the fracture patho
A study of the data reveals that for crack lengths in excess of about
22 in., the exten~, magnitude, and nature of the strain field associated with the
advancing ti~ of ~he fracture remains essentially unchanged. Typical maximum
principal s+ .,..~, l'" :::-ltOurS and vertical strain contours based on all of the avail
able data a"""" ::':--··~~:1ted for fractures propagating in the central one-third of the
plate width <

BIBLIOGRAPHY
10 Hall, W. J. J Mosborg, Ro J 0, and McDonald, V. J 0' IjBri ttle Fracture Propagation in Wide Steel Plates,T1 The Welding Journal, 36 (1), Research Supplement, ppo l-s to 8-s (1957).
20 Hall, Wo J 0, Godden, W. Go, and Fettahlioglu, 00 Ao, !1Preliminary Studies of Brittle Fracture Propagation in Structural Steel,TV Civil Engineering Studies, Structural Research Series Noo 123, University of Illinois, J"une 19570
3. Lazar, Ro and Hall, Wo Jo, "Studies of Brittle Fracture Propagation in Six-Foot Wide Structural Steel Plates," Civil Engineering Studies, Structural Research Series Noo 136, University of Illinois, June 19570
31
4. Lynam, T. Me, ftStrain Patterns During the Propagation of a Brittle Fracture in Steel Plates,!1 Mo So Thesis submitted to the Graduate College, University of Illinois, (1957)0
50 Rolfe, S. T., tTStudies of the Strain Distribution in Wide Plates During Brittle Fracture Propagation,!! Mo So Thesis submitted to the Graduate College, University of Illinois, (1958).

Test No. (Plate NO.)
and Date of Test
Initial Load
(kips)
TABLE l
OUTLINE OF TESTS
Stress on Net Section
(ksi)
Ave. Temp.
(deg. F)
Remarks
With the exception of Test 35, all tests were conducted on 3/4 in. by 72 ina by 120 in. semi-killed steel plate specimens welded with E7016 electrodes to I-ina thick pull-plates in the 3)000)000-lb Baldwin hydraulic testing machine. The brittle fractures were initiated by the notch-wedge-impact method with a nominal lateral impact of 1200 ft lb.
The notch was 1-1/8 in. long and consisted of a slot four hacksaw blades wide (",0.141 in.) for the first 1 in.) one blade wide ("'0.034 in.) for the next 1/16 in.) and ended with a jewelers saw-cut (",0.012 in.) 1/16 in. long.
33 (XC-I) 28 Feb. 57
34 (XF-l) 12 Mar. 57
35 (RTRT-4 ) 16 April 57
(Tested in conjunction with Project SR-134 )
1000
1000
1475
19·0 °
19·0 °
28.0 -15
Complete fracture -- good strain records obtained from 7 rosettes.
Complete fracture -- good strain records obtained from 10 rosettes.
Plate specimen composed of 36-ina starter strake of rimmed steel) 4-in. strake of T-l, 20=in. strake of rimmed steel) and a 12-in. strake of T-l steel. Specimen was 27 in. long. Fracture arrested at leading edge of final T-l strake. Final load -- 85 kips. Good strain records obtained from 4 rosettes.
'VI f\)

Test No. Initial (Plate NO.) Load
and Date of Test (kips)
36 997 (X2B) 10 Oct. 57
37 997 (X2F) 25 Octo 57
38 997 (X1B) 1 Novo 57
39 997 (X2E) 15 Novo 57
TABLE 1 (Continued)
---"'.....,--""~~~
stress on Ave. Remarks Net Section Temp.
(ksi) (deg. F) "'=-:'-"'_-~·o~~·~~. __ ~~_.~_.
--..~-.~~--
19·0 =10 Complete fracture fair strain records obtained from 11 rosettes. Double frac= ture last two~thirds of plate width.
1900 -8 Complete fracture == good strain records obtained from 11 rosetteso
1900 -9 Complete fracture -~ good strain records obtained from 11 rosettes.
19·0 ~6 Complete fracture ~- good strain records obtained .from 11 rosetteso
Vl Vl

Test Noo Material (Plate Noo) Heat Noo
33 Semi-killed Steel
(XC-l) 64M487
34 Semi-killed and Steel
37 (XF) 64M487
35 Rimmed Steel (ZlA) 16445
36 Semi=killed and Steel
38 (XB) 64M487
39 Semi-killed Steel (XE)
64M4B7
TABLE 2
CHECK .ANALYSES OF STEEL PlATE MATERIAL
Chemical Composition j.n Per Cent
C Mn P S Si Cu
0017 0071 00019 00028 00058 0002
0020 0.76 0.019 00028 0.052 0002
0018 0042 00013 00031 0.02 0023
0021 0082 0.018 00030 00058 0002
0020 0.76 0.019 00040 0003 0004
Ni
000
Trace
0.14
000
0016
Al
0003
0003
0.003
0003
00002
\>J +

TABLE 3
TENSILE TEST DATA FOR STEEL PLATE MATERIAL
(Standard ASTM O.505-in. diao specimens)
35
Test Material Lower Yield Maximum per Cent Per Cent No. (Plate NO.) Strength Strength Elongation Reduction
Heat Noo (ksi) (ksi) in 2-in. of Area
* 66.5 33 Semi-Killed. (L) 32.9 59·3 4005 Steel (T) 3206 58.8 41.0 59·5
(XC-l) 64M487
34 Semi-Killed (L) 32.9 61.8 4007 6603 Steel (T) 34.5 6204 40.0 6107
(XF-l) 64M487
35 Rimmed Steel (L) 34.7 6801 36.5 5706 (ZlA) (T) 35.2 6807 31.2 51.6 16445
36 Semi-Killed (L) 3605 6702 3600 63.5 (X2B) (T) 35·2 67.8 3405 5808
64M487
37 Semi-Killed (L) 35.5 6404 4100 67.8 Steel (T) 35.0 64.2 36.3 61.8 (X2F)
64M487
Semi-Killed (L) 35.5 66.8 36.5 64.3 Steel (T) 35.6 6604 36.8 59·8
. (XIB) 64M487
39 Semi-Killed (L) 34.3 61.6 39· 5 65.3 Steel (T) 35·2 6201 36.8 57.5 (X2E)
64M487
* (L) Average of two specimens taken parallel to the direction of rolling. (T) Average of two specimens taken transverse to the direction of rolling.

TABLE 4
FRACTURE SPEEDS All distances are measured along the crack patho
Speeds are rounded off to nearest 50 fpso
Detector Distance Breaking Time Between Time Interval Detectors
(in. ) (milliseconds)
TEST 33
A 076 12.02 0.36
B 1.12 13.16 0037
c 1·59 6.02 0.22
D 1.71 6.05 0025
E 1096
TEST 34
Fracture Passed Above Crack Detectors
TEST 35
A .77 8.00 0.23
B 1.00 8.00 0.14
C 1.14 8.00 0.24
D 1055 8.00 0020
E 1.58
TEST 36
A 0·31 7.10 0.13
B 0044 6064 0015
c 0.59 .7·32 0.23
D 0082 7n15 0.20
E 1.02 14.47 0·52
F 1.54
Speed
(fps)
2800
2950
2300
2000
2900
4750
2800
3350
3500
4150
3050
3000
2800

37
TABLE 4 (Continued)
Detector Distance Breaking Time Speed Between Time Interval Detectors
(in. ) (milliseconds) ( fps)
TEST 37
A 0·96 7.02 0.14 4200
B 1.10 7.10 0.18 3300
C 1028 6050 0.22 2450
D 1050 6097 0.28 2100
E 1.78 13.60 0.62 1850
F 2.40
TEST 38
A 0.34 7014 0.15 3950
B 0.49 7016 0.16 3750
C 0065 6.71 0020 2800
D 0.85 6.94 0.22 2650
E 1007 13.84
F
TEST 39
A 0006 6.73 0019 2950
B 0025 7.18 0.44 2700
C 7018
D 0069 7.24 0.26 2300
E 0·95 1400 0.46 2550
F 1041

Crack Length (in. )
8
15
18.5
22
25·5
29
32·5
36
39· 5
43
TABLE 5
TIMES CORRESPONDING TO V.A.RIOUS CRACK LENGTHS
All times are in milliseconds and refer to the time base of the strain-time curves presented in Figso 25-89
Test No.
33 34 37 33
0.22 0.03 0·92 0.35
0.94 0.50 1.11 0·52
1.05 0.72 1.18 0.61
1.16 0·95 1.24 0.70
1.24 1.10 1.35 0081
1.32 1.25 1.45 0·92
1.57 1.37 1.56 1.03
1.62 1·50 1.66 1.14
1.74 1.63 1.82 1.26
1.86 1.77 1·97 1.37
39
0.10
0.31
0.45
0·59
0.67
0.75
0·91
1.07
1.18
1.30
Note: These times, corresponding to various crack lengths, were used in determining both the maximum principal strain contours (Figs. 95 through 104) and the vertical strain contours (Figs. 106 tb~ough 115).

TABLE 6
DATA OBTAINED FROM SRS-136 (TESTS 13-32) (See Fig. 117)
Test VI')'! i'''11 Di !,t ~U1C'{' Di. stance Time Total Test Load Strain No. t;.!. "I ';'1, '.' rI'llm or Gau;e from Corres. to. Strain Strain Referenced to
L • ~ r ! . \ !.. 1::' I~ ~. ' Fracture 29-in. Test Load Crack Strain
(lrl.l (ino 2 (mil1isecoYl dsL ~(inolip:.) _____ Cino/ip. __ l (ino/ino)
13 1 12.0 -0.3 0.66 .00063 .00063 0 2 35.5 -1.7 0066 .00072 .00072 0
3 60.0 -200 0066 000066 000066 0
15 1 3500 1 06 0.81 .00079 000064 000015 2 3600 106 0.81 000071 000049 .00022
3 36.0 -3.4 0.81 .00090 .00078 .00012 19 2 36.5 -0.6 0.56 000052 .00047 000005
4 61.0 0 0.56 .00055 .00055 0
22 1 37.0 -3·5 0.32 .00082 000064 000018
4 61.0 - 3.5 0.32 000062 000062 0
23 5 36.0 -300 0.82 000067 000067 0
6 43.0 -3.4 0.82 000067 000067 0
7 50.0 - 3.5 0.82 .00064 000064 0 8 57.0 ... 305 0082 000063 000063 0
9 64.0 - 3.5 0082 000052 000062 -000010 25 1 8.0 -0.5 0·92 "'000003 000059 -000062
2 1500 -0.8 0·92 ~000001 000061 -.00062 3 2200 -0·7 0·92 -000007 000061 - 000068 4 29·0 -007 0092 000831 000056 000175 9 64.0 -008 0.92 .00061 000061 0
32 1 15.0 -200 0.60 -.00011 .00057 - 000068 2 3600 -606 0060 .00095 000055 .00040 3 5000 -702 0.60 000050 000055 -000005
4 57.0 -701 0060 000054 000054 0 'Vl '0


~ t PULL
7'6"
HEAD
-4 I" PULL
PLATE 3'8"
1 SPECIMEN 10'0"
32' 8"
--t I" PULL
PLATE 4'0"
-i PULL HEAD 7' 6"
~ ~ l6'O"~
SPECIMEN IN 3,OOO,OOO-LB
TESTING MACHINE LI NE DIAGRAM OF SPECIMEN
SPECIMEN READY FOR TESTING
FIG. TYPICAL TEST SETUP


>-(!) cr: w z w
~ (,) <t a.. :E
0 UJ (l) a: 0 en m <t
FIG. 2
120
80
40
o 120
80
40
0
80
I TEST 33 (XC-I)
SEMI':'I<ILLED STEEL
. -~ r
I TEST 34 (XF-/)
SEMI-KILLED STEEL
. ~ ~.
TEST 35 (RTRT -4) RIMMED STEEL
·
/ V
V
/ V
· · V
. / V .
V
40r----------+-------------~----------~-------------+~~------~
94~O--------~--------~--------~--------~--------~ o 40 80 120 160 TEMPERATURE - deg. F
CHARPY V-NOTCH CURVES - TESTS 33, 34, AND 35

..c
-->-(!)
a:: w z w
.-u ~ ~
0 w CD a:: 0 (f) CD ~
FIG. 3
120
80
40
0
120
80
40
o -40
I TEST 36 (X2B)
SEMI-KILLED STEEL
.----
/ Y-
o • · . ..
/ .. --~ ..
I TEST 37 (X2F)
V SEMI-KILLED STEEL
• •
• • .
· . · · V
/ · . .
~ . o 40 80 120 160
TEMPERATURE - deg. F
CHARPY V-NOTCH CURVES TESTS 36 AND 37
~
;:
>-(!) a:: w z w
~ u <l: Cl.. ~
a w CD cr 0 (/) CD «
FIG. 4
120
80
40
0
120
80
40
o -40
, TEST 38 (x I B)
SEMI-KILLED STEEL
/
/: l(
· .. .
v . . -----·
I . TEST 39 (X2F) . ~
SEMI-KILLED STEEL
/ . . · . ·
. .
V-
· ~ /" ·
o 40 80 120 160
TEMPERATURE - deg. F
CHARPY V-NOTCH CURVES TESTS 38 AND 39
CALI BRATION RESISTOR
3v -=-
FIG. 5
~----------------~~OUTPUTS COMMON
STR AIN GAGE CIRCUITS
D CRACK DETECTOR
CALIBRATION SWITCHES
OUTPUT
CRACK DETECTOR CIRCUITS
INSTRUMENTATION CIRCUITS

TRIGGERING DEVICES
BATTERY +
1 RESET
TRIGGER SIGNAL TO SWEEP GENERATOR
THYRATRON
~~~----------~ MANUAL TRIGGER
FOIL
SR-4
A-9 GAGE
FIG. 6
'- TRIGGER SHORTED FOR CALIBRATION
3v
TRIGGER CIRCUIT


SPEEDOMAX
FIG. 7
CALIBRATING OSCILLATORS
FRANKLIN OSCILLOSCOPES
~UMONT OSCILLOSCOPES
TEKTRONIX OSCILLOSCOPE
I
. ~~.----*' rr
.~( ~ .
-..... ~~~
RECORDING EQUIPMENT


FRANKLIN OSCILLOSCOPE RECORD
DUMONT OSCILLOSCOPE RECORD
FIG. 8 TYPICAL STRAIN RECORDS


FIG. 9 CLOSEUP OF NOTCH AND TIP OF WEDGE
FIG. 10 PlSTON DEVICE USED FOR FRACTURE INITIATION


AL_ 'I
r 15"
"r: 15" 'r: 15" l' 15" "C 6"-
- - • I I I I I 4"
..... -
t t t L-... +
~ ... ~" T
2
~. r
THERNOCOUPLE LOCATIONS
INDIVIDUAL COOLING TANK
COOLING TANKS MOUNTED PRIOR TO TESTING
FIG. II THERMOCOUPLE LOCATIONS AND COOLING APPARATUS


60
40
20 ...........
o
-20 o
60
~ r-------------20 40
TEST 33
I-(f) W t-
f -
60 80 100 120
0. ~ 40 ~
TEST 34
w 20 a: ::l ..... ~ 0 w a.. ~ w t- -20 o
80
60
40
20
o
-20 o
FIG. 12
............
~ I-(J)
W.
~ t-
--- t -~ 20 40 60 80 100 120
'" TEST 35 ~ ... -
~ ~ ~ ~
~'-I-(J) W t-
-------r---± 40 80 120
TIME -min.
160 200
AVERAGE COOLING CURVES-· TESTS 331 34, AND 35
24

LL
0, ell
'"0
I.LJ Q: ::l .... <t a:: LU a.. :E w ....
60
40
20
0
~ TEST 36 ...............
~ ~
...........
~ ..... (f)
w
""'- ~
~ ~ -~8
40
20
0
~ TEST 37
.............
~ --~
.... (f) w .....
I-- I ----- 1 10---
-20 60
40
20
~ TEST 38 , ~ ~
EXTRA ICE ADDED}'
~ I-(f)
W .....
I 0 ............. i----J--20 60
40 ~ 20
0
-20 o
~
~ ~ ~
20 40
TEST "39
1-" CJ)
UJ .....
1 ............... ~-,
60 80 100
TIME - min.
FIG. 13 AVERAGE COOLING CURVES - TESTS 36, 37, 38, AND 39
120
y
72" ------------------------~~~I I" • ROSETTE - GAGE LAYOUT A (SEE FIG.22)
-C
I c::"'"
-8 -0 -F --~ '-- ~ -
Aond I J x
A 8 C 0 E (DETECTORS)
Ic~ . I. ~ I ~ • 14 6 11-LSII-.J I i-t---9" 12" 13"
-'---
DYNAMIC STRAIN GAGES CRACK PATH
Rosette Strain -Orien- X Y Test Load Distance to X Y No. Gage tation (in.) (in. ) Strain Fracture (in. ) (in. )
No. (in. jin. ) (in. )
A 1 V 22.0 0 .00067 0.7 1.1 0 2 H 22.3 0 -.00019 0.8 9 -0.2 3 D 22.3 0.3 .00024 O.~ 15 0
B 4 V 22.0 3.0 .00067 -2.3 18 0.1 5 H 22.3 3.0 -.00019 -2.2 19 0.2 6 D 22.:d 3.3 .00024 -2.6 22 0.7
C 7 V 22.0 20.0 .00068 -19·0 24 1.2 8 H 22.3 20.0 -.00018 -19·0 28.5 1.9 2 D 22.3 20.3 .00026 -12. 0 36 2.5
D 10 V 29.0 3.0 .00068 -1.1 45 3.2 11 H 29· 3 3.0 -.00019 -1.0 48 3.4 12 D 29.3 2·3 .00026 -1.3 54 3.5
F 16 V 36.0 3.0 .00069 -0.5 60 3.7 17 H 36.3 3.0 -.00018 -0.5 66 3·9 18 D 36.3 3.3 .00029 -0.8 69 3·9
I 25 V 22.0 0 .00052 0.7 70 3.8 26 H 22.; 0 -.00017 0.8 72 3.6 21 D 22.:2 Ood .00016 0·2
J 28 V 36.0 0 .00053 2.5 29 H 36.3 0 -.00018 2.6 30 D 36.3 0.3 .00019 2.3
FIG. 14 INSTRUMENTATION LAYOUT AND CRACK PATH - TEST 33
y 72" I ...... ...,
• ROSETTE - GAGE LAYOUT A (SEE FIG.22)
0 ·E • I. .' .. ::.. 10
-0 ·H
---~ ·C
I FOl'd K I - r--.- Aand J - . B - .--E -X .-
·O .. ~ A B C 0 E (DETECTORS) J
.. I ~ .1, 6"-+-7.~1~ 7"-"\ -If) f+--S"· 10"
DYNAMIC STRAIN GAGES CRACK PATH
Rosette Strain Orien- X Y Test Load Distance to X Y No. Gage tation (in.) (in. ) Strain Fracture (in. ) (in. )
No. (in. lin. ) (in. )
A 1 V 22.0 0 .00063 +3.6 1.] 0 2 H 22.3 a -.00018 +3.6 4 .2 2 D 22.:2 +0·2 .00028 +2 .. ;2 6 .4
B 4 v 29.0 0 .00066 +4.4 12 1.5 5 H 29·3 0 -.00018 +4.4 16.5 2.5 6 D 22·:2 +0.:2 .00026 +4.1 18 ~.6
C 7 v 29.0 +3.0 .00065 +1.4 22 ,.6 8 H 29.3 +3.0 -.00018 +1.4 24 ;'..S 2 D 29.3 +2- 3 .OOO~ +1.1 29 4~4
D 10 V 29·0 +6.0 .000 -1.6 36 4~8 11 H 29· 3 +6.0 -.OOOlS -1.6 42 5.5' 12 D 22·d +6.3 .00024 -1.~ 48 5.b
E 13 v 29·0 +9·0 .00067 -4. 54 5.S l4 H 29.3 +9·0 -.00018 -4.6 6:) 6.0 l5 12 29·:2 +2·:2 .00Q2~ -4.9 66 6.1 16 36.0 .00066 +4.S 72 6.]
:
F V 0 17 H 36.3 0 -.OOOlS +4.S l,S 12 :26.:2 +0. :2 .00021 +4·5
H 22 V 36.0 +6.0 - .00066 -1.2 23 H 36.3 +6.0 -.OOOlS -1.2 24 ;Q :26.:2 +6!:2 .QQQ15 -1.5
I 25 v 36.0 +9·0 .00067 -4.2 26 H 36.3 +9·0 -.00019 -4.2 21· D :26.:2 +2·:2 .00012 -4·2
J 28 V 22.0 0 .00057 +3.6 29· H 22.3 0 -.00017 +3.6 30 D 22.:2 +0.:2 .00021 +:2. :2
K 31 V 36.0 0 .00057 +4.S 32 H 36.3 0 -.00017 +4.S 33 D 36.3 +0.3 .00021 +4.5
FIG. 15 INSTRUMENTATION LAYOUT AND CRACK PATH - TEST 34

y
1~4f ---7211--~·t
• ROSETTE - GAGE LAYOUT A (SEE FIG. 22)
o
-~ .... A and D B C ,_--+---1-+ - X
ABC D E (DETECTORS)
+3,La,,-L 8,,-L a,,---1-- 8"~
RIMMED T-I RIMMED T-I
... 1 ~.------- 36'-' -------1 ......... 1-4 4'~'AI ...... ·I----20"-----IIo .. +oJ.I---J2"~
DYNAMIC STRAIN GAGES CRACK PATH
Rosette Strain Orien- X Y T'est Loa.d Distance to X Y No. Gage tation (in. ) (in. ) Strain Fracture (in. ) (in. )
No. (in. lin.) (in. )
A 1 V 17.0 0 .00092 -0.5 1.1 0 2 H 17.3 0 -.00024 -0·5 11 -.2 3 D 11·' +0.3 .00032 -0.8 14.5 -.3
B 4 V 20.0 0 .00093 -0.6 17 -.5 5 H 20., 0 -.00022 -0.6 20 -.6 6 D 20·2 +0.:2 .00026 -0·2 23 -.8
C 7 V 23.0 0 .00092 -0.8 ;0 -1.1 8 H 23.3 0 -.00022 -0.8 35 -1.1 2 D 2~.3 +0.:2 .00033 -1.1 40.4 -·9
D 10 V '17.0 0 .00094 -0.5 44, -.3 11 H 17.3 0 -.00026 -0.5 48.5 0 12 D 17.3 +0.3 .00029 -0.8 53 +.3
57 0 60 -1.4 62 Fracture
arrested in T ... l
AG.16 INSTRUMENTATION LAYOUT AND CRACK PATH - TEST 35

y,........-------------72 11------------___. .. -l1
, ROSETTE - GAGE LAYOUT B" (SEE FIG.22)
ABC D E F (DETECTORS)
1,5"-+-111-+-711+-111+-711-·~I·-1411__1
DYNAMIC STRAIN GAGES CRACK PATH
Rosette Strain Orien- X Y Test Load Distance to X Y No. Gage tation (in.~ (in. ) Strain Fracture (in .. ) (in.).
No. (in. lin. ) (in. )
1 1 H 22.0 3.0 -.00016 0.0 (Lover) 1.1 0 2 D 22.3 3.3 .00022 0.0 tI 5 .2
g if 22'.0 , 3.3 .00070 0.15 " 10 .9 2 H 29·0 3.0 -.00017 0.15 " 15 1.9
7 D 29.3 3.3 .00026 0.50 " 20 2.6 8 V 29.0 2·2 .00074 0·22 " 22 ;.2
3 11 H 36.0 3.0 -.00011- 1.35 " 25 .. 0* 3.8 12 D 36.3 ;.; .00027' 1.80 It
1 V .000 0 1. 0 (u) (L)
4 1 H 29.0 .0 -.0001 0.0 Upper 26 4.2 3.4 17 D 29.3 6.3 .00020 0.10 t1 27 4.6 3.1 18 V 3*.0 6.2 .00011 0.10 II 29 5·9 2.8
5 2l H 6.0 -.00017 2.60 " 30 6.5 2.7 .0 22 D 36.3 6.3 .00026 2.15 tI 35 8.1 1.9 2 V 6.0 6.3 .000 2.20 n ;8 8.7 1.2
6 4 D 22.3 .3 .00017 -;.00 Lower 45 10.; 0.7 22.0 6.3
-.00070 -3.10 " 48 11.3 0.3 5 V
24 H 22.0 6.0 -.00016 -2.80 II 52 11.8 0.3 7 26 H 29.0 9·0 -.00015 -3.00 (Upper) 55 12.1· 0.3
27 D 29.3 . 9.3 .00026 -3.10 It 57 12.; 0 28 V ~.o 2·3 .00072 -3. :0 n 59 12·9 -0.4
8 29 H 9·0 -.00017 -0.45 " 65 13.5 -0.9 3 .0 32 D 36.3 9·3 .00027 -0.80 n 66.5 13.5 -1.0 31 V 36.0 2·3 .00071 -0.75 It 69.5 13.5 ;~0.8
9 9 D 22.3 0.3 .0002l 3.05 (Lower) 70 13·5 -1.0 10 V 22.0 0.3 .00069 2.90 tI 72 13.6 -0.7
i, H 22.0 0.0 -.00017 3.25 II
10 D 29·3 0.3 .OOO~ 2.55 " *Crack Branched 15 V 29·0 0.3 .00069 2.55 n (U)= Upper Crack 30 H . %00 . 0.0 -.00017 2.85 tt (L)= Lower Crack:
11 19 D 0.3 .00027 1.15 " .3 20 V 36.0 0.3 .00070 1.15 " 33 H 36.0 0.0 -.00017 1.65 It
FIG. 17 INSTRUMENTATION LAYOUT AND CRACK PATH - TEST 36

o I
-LC') ""~
""~
f
Rosette No.
1
2
:;
4
5
6
7
8
9
10
11
y .. ~OSETTE - GAGE LAYOUT B (SEE FIG.22)
·7
·S -6 '5
·4 .2. • J - -~~ ------"- 9 II "- '- -
-3 ·10
A B C D E F (DETECTORS)
--- 7.5"-t- 7"-+- 7" -+- 7" -+-711 ·1 ~ 14"---1
DYNAMIC STRAIN GAGES CRACK PATH
strain Or1en- X Y Test Load Distance to X Y Gage tation (in.) (in. ) Strain Fracture (in. ) (in. )
No. (in. jin. ) (in. )
1 H 22 3 -.00018 -1.70 1.1 0 2 D 22.3 3.3 .00022 -2.10 :3 0 2 V 22 2.:2 .00062 -2.10 8 .2 6 H 15 3 -.00018 -2.40 15 .6 7 D 15·3 3.3 .00022 -2.70 20 1.1 8 V 12 2! :2 !Qoo66 -2. 70 22 1.6
11 H 15 -3 -.00018 +1.65 25 1.8 12 D 15.3 -2.7 .00023 +1.35 29 2.2 1:2 V l~ -2·1 .0006~ +1·2~ 32.5 2.6 16 H 8 3 -.00019 -2.80 35.5 2.6 17 D 8.3 3.3 .00023 -3.10 36 2.4 18 V 8 2·2 .00061 -2·10 39 2.4 2l H 36 6 -.00017 -3.65 49 3.5 22 D 36.3 6.3 .00024 -4.00 55 3.6 2:2 V 26 6·2 .00067 -4.00 64 3.6 24 H 22 6 -.00017 -4.70 69 3.7
4 D 22.3 . 6.3 ~00021 -5·10 70 3.6 ~ V 22 6·2 .00067 -2.10 72 3.2
20 H 22 9 -.00017 -7.70 27 D 22.3 9.3 .00027 -8 •. 10 23 V 22 2·:2 .00066 -8.10 29 H 15 6 -.00018 -5.40 32 D 15.3 6.3 .00026 -5.70 2, V 12 6,2 .00063 -2·10 d.~
25 H 22 0 -.00016 +1.35 9 D 22.3 .3 .00027 +1.00
10 V 22 !2 .00c6J +1!00 ~ H 8 -3 -.00017 +2.20 14 D 8.3 -2.7 .OOO1~ +1·90 15 V 8 -2.7 .00061. +1.90 33 H 36 0 -.00011 +2.35 19 D 36.3 .3 .00023 +2.00 20 V 36 .3 .00066 +2.00
FIG.18 INSTRUMENTATION LAYOUT AND CRACK PATH - TEST 37
x
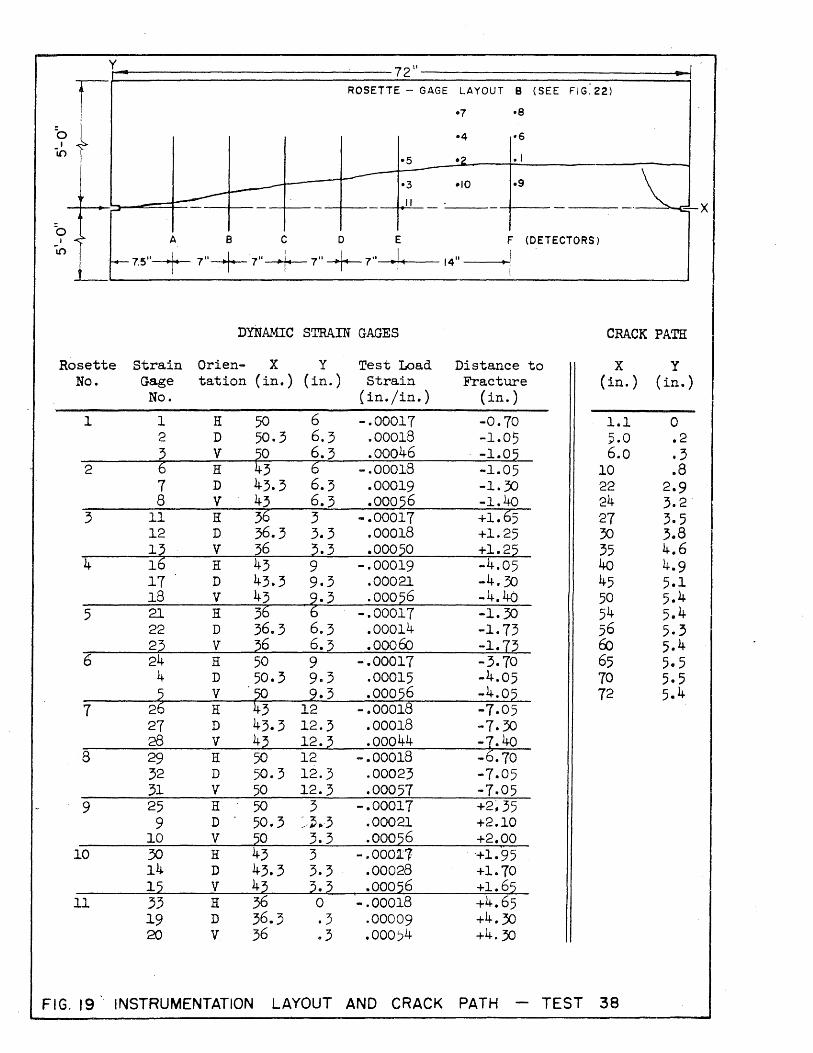
y III
ROSETTE - GAGE LAYOUT B (SEE FIG.22)
-7 ·S
... ~ -4 -6
-5 ·2 • I
.9 _\ ~ - '3 -10 ----- /I - - - - - -- x
<::.. A 8 C D E F (DETECTORS)
--7.S"-+- 7"-+-711 -+-7"-+-7" ·1 ~ 1411--1
DYNAMIC STRAIN GAGES CRACK PATH
Rosette Strain Orien- X Y Test Load Distance to X Y No. Gage tation (in.) (in. ) Strain Fracture (in. ) (in. )
No. (in. lin.) (in. )
1 1 H 50 6 -.00017 -0.70 1.1 0 2 D 50. :; 6.3 .00018 -1.05 ;;.0 .2 3 V
~ 6.3 .00046 . -1.02 6.0 .3
2 6 H 6 -.00018 -1.05 10 .8 7 D 43.3 6.3 .00019 -1.30 22 2·9 8 V 43 6.3 .00026 -1.40 24 3.2
3 11 H 36 3 -.00017 +1.65 27 3.5 12 D :;6.3 3.3 .00018 +1.25 ;0 3.8
~g V :26 :2.3 .00020 +1.22 35 4.6 4 H 43 9 -.00019 -4.05 40 4.9
17 D 43.3 9.3 .00021 -4.5J 45 5.1 18 V 43 *.3 .00026 -4.40 50 5.4
5 21 H 36 -.00017 -1. ;0 54 5.4 22 D 36.3 6.3 .00014 -1.73 56 5.3 2;d V 26 6'2 .00060 -1·1~ 6J 5.4
6 24 H 50 9 -.00017 -3.70 65 5.5 4 D 50.; 9·3 .00015 -4.05 70 5.5
2g V '3 2~3 .00026 -4.02 72 5.4
7 H 12 -.00018 -7.05 27 D 43.3 12.3 .00018 -7. ;0 28 V 42 12.~ .00044 -~.40
8 29 H 50 12 -.00018 - .70 32 D 50.3 12.3 .00023 -7.05 31 V 50 12.3 .00057 -7.05
9 25 H 50 3 -.00017 +2~35
9 D 50.3 ~~.j .00021 +2.10 lO V 20 3.3 .00026 +2.00
10 30 H 43 3 -.00011 +1.95 14 D 43.3 3.3 .00028 +1.70 l2 V 4:2 :2.3 .00026 +1.62
11 33 H 36 0 -.00018 +4.65 19 D 36.3 · 3 .00009 +4.30 20 V 36 .3 .000)4 +4.30
FIG. 19 . INSTRUMENTATION LAYOUT AND CRACK PATH - TEST 38

y 72" ..
, ROSETTE - GAGE LAYOUT e (SEE FIG.22 )
~ ·7 -8 ---~
. '4 '5
~ ~ ~ • I -2 -3
~ 9 10 II - -- -- x
...:;::" A B C 0 E F (DETECTORS)
-+-7.511+ 7"-+-7"-+-7"+-7" ·I~ 1411--1
DYNAMIC STRAIN GAGES CRACK PATH
Rosette Strain Orien- X Y Test Load Distance to X y No. Gage tation (in.) (in. ) Strain Fracture (in. ) (in. )
No. (in./in. ) (1n. )
1 1 H 22 3 -.00017 +2.29 1.1 0 2 D 22.3 3.3 .00021 +2.10 6 0.7 :2 Y. 22 ~·2 :!QOQ62 +1196 10 1.8
2 6 H 29 3 -.00017 +4.14 15 3.; 7 D 29.; 3.3 .00019 +3.90 20 4.6 8 v 29 2·2 .00061 +2. 82 21- 4.8
11 H ;6 3 -.00017 +4.50 25 6.; 12 D ;6.3 3.3 .00019 +4.22 28 1.1 1;2 Y. ~6 ~.;2 .00058 +4!12 ;2 7.0 16 H 29 6 -.00016 +1.09 ;5 7.4 17 D 29.; 6.3 .00022 +0.88 40 7.9 18 v 29 6,2 .00000 +0.82 45 8.2
5 21 H 36 6 -.00017 +1.55 50 8.4 22 D :;6.; 6.3 .00023 +1.14 55 8.5 ~2 v ~6 6.2 .00062 +1!12 60 8.5
6 24 H 22 6 -.00017 -0.73 65 8.6 4 D 22.3 6.3 .00025 -0.90 69 8.4 2 v 22 6.~ .00026 -11 08 12 7.9
7 26 H 29 9 -.00018 -1.76 27 D 29.3 9·3 .00020 -2.07 28 Y. 29 2·2 .00061 -2.12
8 29 H ;6 9 -.00018 -1.47 ;2 D 36.; 9·3 .00023 -1.80 21 v 36 2·2 .00062 -1.8~
9 25 H 22 0 -.00017 +5.27 9 D 22.; 0.3 .00022 +5'.10
10 V 22 0.3 .00022 +4.98 10 30 H 29 0 -.00019 +7.17
14 D 29.; 0.3 .00019 +6.85 12 V % 0.3 .. 00022 +6.82
11 33 H 0 -.00017 +7.50 19 D ;6.3 0.3 .00026 +7.20 20 V ;6 0.3 .00060 +7.14
FIG.20 INSTRUMENTATION LAYOUT AND CRACK PATH - TEST 39
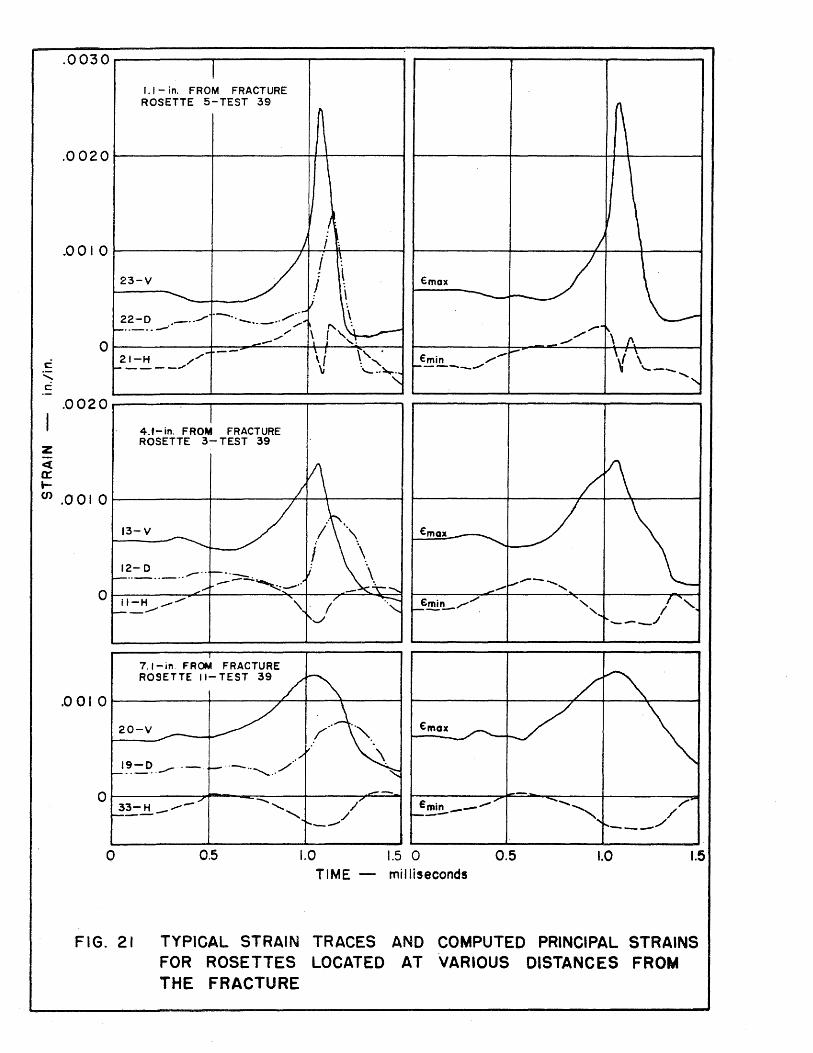
Z <t a:: t-
.0030· I
1./- in. FROM FRACTURE ROSETTE 5-TEST 39
n .0020 \
) i :
/ i f\ 23-Y lL ~ \ 22-0 .,_ .. '/ '-. / ..... \ '-"-" .;''' I' " : ~ .. -.,- ", '. ! ', . .;' --,- - ." \1 \', . 21-H /.;' ., ~---- ..... \i \_ .. ~ ..
.0010
€max
o Emin ".,..---...... -....,../
" .0020----------~---------~---------~ ~--------~--------~--------~
4.'-in. FROM FRACTURE ROSETTE 3- TEST 39
OO .001 O~---------~--------~~~------~ ~---------+-----~~~~--------~
13-Y
12-0
o II-H .._ ....... _ ........
7.I-in FROM FRACTURE ROSETTE 11- TEST 39
€max
.001 O~---------~------~-+---+-----~ ~--------+-----~--4_--~----~
20-V €max
o~---------~--~=----+----~~~ ~£m-i-n--__ --..-~~~~~---~--4--------/~ --- ~ /
o
FIG. 21
------ ......... /
0.5 1.0 1.5 0 0.5 1.0 1.5 TIME - milliseconds
TYPICAL STRAIN TRACES AND COMPUTED PRINCIPAL STRAINS FOR ROSETTES LOCATED AT VARIOUS DISTANCES FROM THE FRACTURE

SCALE I": I"
-DIRECTION OF FRACTURE
GAGE LAYOUT A
SCALE I" = IN
:'":':':.:. ::::: r",:"':;S ~OS=:7J:'E USED < O.7in.
-- ~c:3'~S 36, 37, 38~ and 39 Et-
- DIRECTION OF FRACTURE
GAGE LAYOUT 8
FIG. 22 COMPONENT GAGE LAYOUTS A AND 8


C "-C
z « a:: t-C/)
c --"-c .-
z « a:: t-en
0.0020
LAYO~T A
I TEST 34
0.0010 ~ I ROSETTE A
~I
I-;:-V _/ ! /~ 2-D _ .. _ .. ----..J -------,- I -.
O -- I -- '-3-H ./' '" 1/----~----,---- \i' ------------
I
-0.0010 o 0.5 1.0 1.5 2.0 2.5
TI ME - millis~conds
0.0020r--------~~-------~---------~----~~~----------
0·0010
, 0
LAYOUT B
TEST 39 ROSETTE I
.. _ .. , .. _. _ .. _ .. -.---- .....--.. ---,._ .. ---
-0.0010 ~------~~-------~---------~--------~--------~ o 0.5 1.0 1.5 2.0 2.5
TI M E -- milliseconds
FIG. 23 TYPICAL STRAIN TRACES FROM COM~ONENT GAGE LAYOUTS A AND B
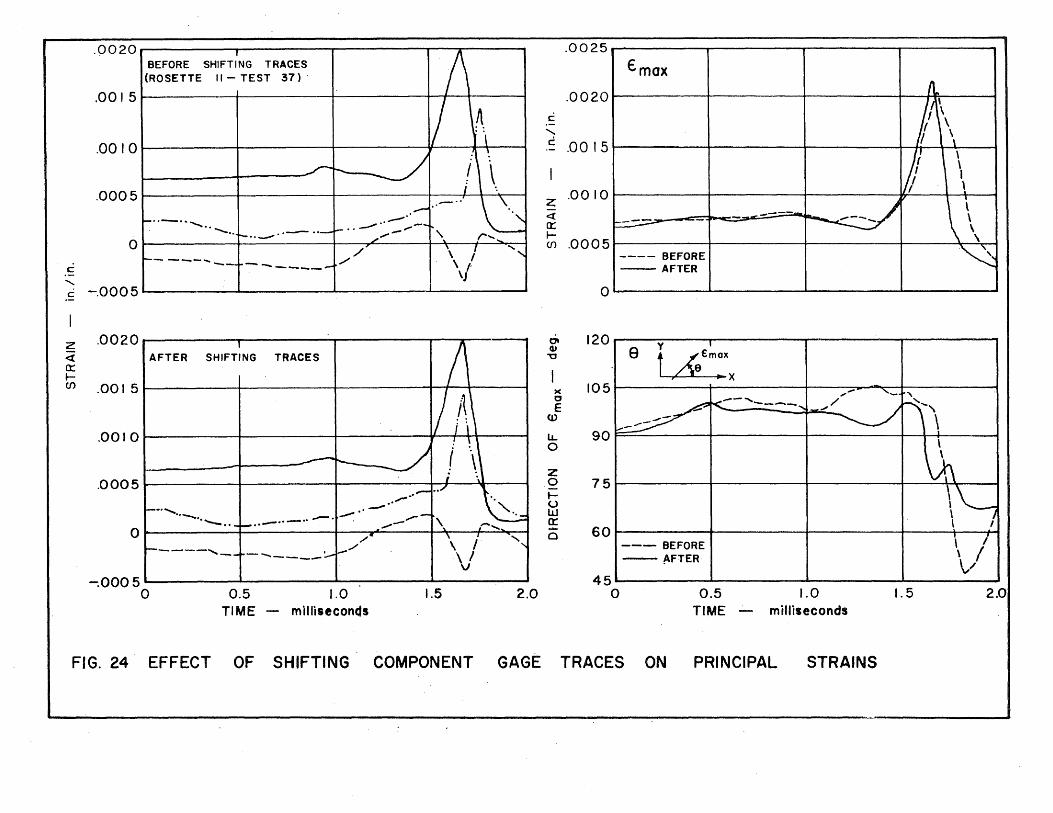
C
"' c
z <t a:: I-en
.0020. a
BEFORE SHIFTING TRACES (ROSETTE II - TEST 37)
.00 151 I J
.0010
.0005 I .. _ ............
"---"+-"-"-" O~ ____ ~
...... -1--- ....... --.. .... _
-.0005
.0020 IAFTER SHIFTING TRACES
.0015
.00 10 I V \ \
.00051 I J \\
............ -... .. """'- .. ..,.,,-.. --.. ,.,..... « \ { ->, o t /,/'
-----,_.-1--.-...._-----~0005·~--------~--------~--------~--------~
o 0.5 TIME
1.0 milliseconds
1.5 2.0
.0025
€mox
.0020 c
........ C .0015
z .0010 <t a::
..... ------I-en .0005
---- BEFORE -- AFTER
0 .-~-------~--.- ---- ------------_ ... _-----
a-ell
"U
)(
0 E
Cl)
lL. 0
z 0 I-u w a:: 0
120
105
90
75
60
45 o
y
e t ,£t:'X .....--' .... _ ...... --
\ I --- BEFORE \ I -- ~FTER \./
0.5 TIME
1.0 milliseconds
1.5 2.0
FIG. 24· EFFECT OF SHIFTING COMPONENT GAGE TRACES ON PRINCIPAL STRAINS

.0040 STRAIN TRACES FROM
COMPONENT GAGES
. I PRINCIPAL STRAINS
AND DIRECTION Y ... 6
OF € max. ( Ll..x)
180
~
.0030'~---------+-----------~-----------+----------~ r-----------r-----------+-~~------+---------~'150 :
.0020LI ---f---+--ttt--t---1
I .0010
c .:.::: c
z <i a: ..... Cf)
I-V
-o " I .. '-"_
\. •. f-- .. --
-.OOIO~'------------1-----------r----------+----------~
I I I ,
~ I I '120
8 90 I.
Emax i ; : \
r"\ \ I '"
/1 1\ ! t\ l' Ii! d" j .~ ,HI "-, 60
Emin ,.,,/ :. - ..... ~-----~-- ,~~ ---' = , , I I \, " ~------~--~----------+-~--------+---------~130
, I I I -.00200 0.5 1.0 1.5 2.0 0 0.5 1.0 1.5 '0
2.0 TIME milliseconds TIME milliseconds
FIG. 25 STRAIN TRACES FROM COMPONENT GAGES NOS. I , 2, AND 3, AND PRINCIPAL STRAINS FROM ROSETTE A TEST 33
~
~ ~
~
Cf)
x q:
...J <{ .... z o N
cr o ::r: ~ o e:
)(
o E
w
l1.. o
Z o i= u W 0: o

.0040 STRAIN TRACES FROM
COMPONENT GAGES
.0030~1--------~--------r-------~--------~
.0020
c
" c
.0010 f\ 4-V z
<i 0:: t-en t-.~-D ". _ .. .!-.. ~ . ..--- .. j .. - .. ""-
0 ./
I --t-_5-t1-______ ,.;
-.0010 t-I -----+-------4-----I-----~
8
1 PRINCIPAL STRAINS
AND DIRECTION Y. ~9 OF €max. ( u...x )
180
A ! i lis 0
, 1
l i i i j i I i 1120
I : I I I ' : !
\
Emax 90
.1-1-, ~ __ .!mln I ..". ___ 7 " /' 1 'I -----'1 60
---+--- V I I I ! ("'. i : .1 ii
r~----_r------~----1V--~----~ 130
-.00200
, , I
2~00 0.5 1.0 1.5 2.0 0 0.5 1.0 1.5 TIME milliseconds TIME milliseconds
FIG. 26 STRAIN TRACES FROM COMPONENT GAGES NOS. 4, 5, AND 6, AND PRINCIPAL STRAINS FROM ROSETTE B - TEST 33
If)
cu Q)
0\ cu 'U
en x <t
....J <t tZ o N
cr o :r: ~ o a:: LL
)( o E
w
LL o Z o to W 0:: o

.0040 I I 180 STRAIN TRACES FROM PRINCIPAL STRAINS
COMPONENT GAGES AND DIRECTION
OF y~ €max. ( x )
en .0030 150
(l.I (l.I ... 0' (l.I
"U
I (f)
.0020 120 x c::{
c -.J
"' <.t t-.S z
e 0
I .,-"----"-, N .0010 90 -" a:: - ~ Emox
.........
~ 0 7-V ~ - ~ .. :::-----: (\ I Z
'. / \ ! \ <i """-"-'" Dl\:: \ / . I . ~ a: ~ .. 1'-." . '-.., \: \ 0 t- 9-0 _ .. ..---.. .--. cr:: en t-.. _ .. _.
" ! \ LL ".- \J '. ., ... f' ",/ \.._- )( 0 60 0 -- I'. I \/' ..,.--- E 8-H ./ Emln -"- --"- "- _/'\...,/ !-----'" ./ '-/
W f-------- .-/ ---------------10-/ --l1... 0
Z 0
-.0010 30 ~. u W 0: 0
·-.0020 2.0
0 . 0 0.5 1.0 1.5 2.0 a 0.5 1.0 1.5 TIME - miUisecond6 TIME - milliseconds
FIG. 27 STRAIN TRACES FROM COMPONENT GAGES NOS. 7, 8) AND 9, AND PRINCIPAL STRAINS FROM ROSETTE C - TEST 33

·0040~1 --------~----------~--------~--------~
STRAIN TRACES FROM
COMPONENT GAGES
.0030rl --------~--------~--------_r--------~
.0020
c: .:.::: c:
.0010 8 ~-;-~ .. - .. - .. .. _ .. - ..
z Emox <i a: .-en
----
1 PRINCIPAL STRAINS
AND DIRECTION Y .... 9
OF €max. ( L..J..x)
180
If)
r. r-- 150 ~ ,I ~ ~ I : . Ol t \ (l}
I \ ~ I \ . I
\. (f)
120 x <t
....J <t. t-z 0 N
'-. .. ,. 90 cr 0
"-J:
....... ~- ~ 0 ex:: LL
)(
"_ .ll-H ___ -L- ___ --./ 0 \ r-~' ., . J I ~---=.-.. -Y ---.
I- .-!mln ___ ~ ___ //·I 60 0 E
'--....- ....... - w -.......
LL 0
Z 0
-.00101t-------t-----+------+------J 30 t= u W 0:: 0
-.00200
I I I
2~00 0.5 1.0 1.5 2.0 0 0.5 1.0 1.5 TIME millis econds TIME milliseconds
FIG. 28 STRAIN TRACES FROM COMPONENT GAGES NOS. 10, II, AND 12, AND PRINCIPAL STRAINS FROM ROSETTE 0 TEST 33

c
" c
z <i cr:: .-en
000401 1 I I J STRAIN TRACES FROM
COMPONENT I AGES (,0053)
I I ~ .00301 I
.0020
.00 10
/ i iJ lL 1
\ j
\ \ I ,
16-V ~ 00/ l-' .,/ I .. / . 18-0 .. - .. ..- .
1--.. _ .• _ .. _ .. 1-.,-.. _ .. _··-1 : 1 {-':;"- --.. ....... , O~ I.?._..!:!. __ ~ _____ ~ "\
-- \
/1'_-f ~ , \ \
" , "-\ J
\ f -.00101 .----t- I \ I
\ I \ I \ , \ I V
PRINCIPALl t~RAINS
AND DIREC ION Y ... 6
OF € max- L.l... x )
180
(.0055)
I , 1150
II \ ,0-W+~120
11 \' e ~/ I I
I'-~-"~' " """-"'-~_ .. J''- ""', J ! Vl 90
~ax '". I --- . '. /1 } \,., I i
I : : I \ . Emfn J - ,,----.,. '\',' 1,60
~------ -----/ "", \J t, \ 1 \
1 '-_
\ : --~II---,----i 30
\ I \ I "\ I
\ I \ 1(- .0027)
-.00200 0.5 1.0 1.5 2.0 0 0.5 1.0
\ I 10 1.5 2.0
TIME - milliseconds milliseconds
FIG. 29 STRAIN TRACES FROM COMPONENT
TIME
GAGES ROSETTE
NOS. 16, 17, AND 18, AND PRINCIPAL STRAINS FROM F TEST 33
(J)
cv cv 0'1 cv ~
(f)
X <l:
-1 <1 tZ o N
cr o I
~ o cr: lL
)(
c E
w
LL o z o .<-> W 0::: o

c
" c:
z <i cr: .... CI?
.0040 STRAIN TRACES FROM
COMPONENT GAGES
,0030~1---------+---------;----------r-------~
,0020~1----------4-----------r---+------+----------~
.001°1 25-V U jJr··l
t 27-0 /!, t'l~~
oo--_·--,·- .. ±··-.. -.. ~t/ \; ,"'.. "-__ 3!.-H .,- ~ '- "-"-
-- -- ....
-.OOIOr�----------+----------+----------+---------~
I 180 PRINCIPAL STRAINS
AND DIRECTION Y ... 6
OF €max. ( ~x)
r---------~---------;----------+---------~"50
r----------+-----------r---r------+----------41120
"\ I r' 1 t"B~~~ .. t··~· ~ ~t 1;90
./1 vL ./ '-- Emin I ././ \' " I ,.:......-~ -...::~-......:.:J 60 ~-----~-~ ~~~~~
i / \ ,/' : / \ ; ',.J
r----------+----------+----------+--------~130
-.00200 0.5 1.0 1.5 2,0 0 0.5 1.0 1.5 2.0
0
TIME - milliseconds
FIG. 30 STRAIN TRACES FROM COMPONENT AND PRINCIPAL STRAINS FROM
TIME - milliseconds
GAGES ROSETTE
NOS. 25, 26, AND 27., I TEST '33
C/) Q)
Q)
Ol Q)
.'"0
en X <t
..J c::( .... Z o N
tr o I
~ o a::: LL
)( o E
w
LL o
z o i= u w a:: o

c:
" c:
z <;( a:: . .--Cf)
·0040 I I I 80 STRAIN TRACES FROM PRINCIPAL STRAINS
COMPONENT GAGES AND DIRECTION
OF YU: tmax. ( x )
.0030 ~w_ ._"". ___ ~_. __ • ..... _ .. _.-. 50
r'" I I
.0020 ! I
i 20
.0010
0
(\
:71 : \ / :
28-V / \ \
30-0 . .-' .. --./ ~, --.- .. _ .. - ._ .. - .. - .. - -*....... --- ........ /--/ "", - \
/\ ,
.I .. .-,.\ .. / \ n I
e j 'VI \ i .... / . J
- .. .. .. .. - - - .. -J \i-fimox .-
\ I , :
...---~--.........., \ f , /~
90
60 29-H /' I ~ 1------- ----" \.J .......... - Emln \ ~ (,.~,
r------ r----~ \ \/ I ---~
-.0010 '-- -- ~
-.00200
FIG. 31
- - -_.-
0.5 1.0 TIME - milliseconds
,STRAIN TRACES AND PRINCIPAL
1.5 2.0 0
FR,OM COMPONENT STRAINS FROM
0.5
TIME
GAGES ROSETTE
1.0 milliseconds
\. . '-~ I .
\ I
\ I \ , \ i U :,
\I ~
1.5
NOS. 28, 29, AND 30, J -. TEST 33
30
o 2.0
II)
<U <U ... 0\ Q)
'U
Cf)
x <t
...J <t .--Z 0 N
er-0 ::r
~ 0 a:: LL
)( 0 E
w
lJ.. 0
Z 0 ~ u w a:: 0

c
"' c
'oo40r,---------~---------~----------r----------
STRAIN TRACES FROM
COMPONENT GAGES
,00301~---------~---------r----------r----------~
,0020Ir--------~~--------1----------4--------~
r 180 PRINCIPAL STRAINS
AND DIRECTION . Y ... 9
OF € max. ( LJ..x)
r----------r-------~~--------~------~1150
r---------r----------+----------+--------~1120
I ,0010 e //"!\r...
I--"-~~~'-. ··r,·_ .. r / \j ·~T~--=.,.,,-:; 90
z <i a:: Im
I-V /
,I 3-0 I _"./' r- .. _ .. _ .. _"I-- .. _.,
J . \ .~'---" .. /,./"
........ --_ .. _-. o " __ '-. 2 -H \"" __ ----- / ------
~-7----+-------~60
1--......,. Emln --l--""""/ ""\~ '---1-~..// I ------
-.00 10 t-I ---~-_t_-----t-------t------_f r-----~-------~-------+------~130
-.00290 0:5 I ~O ':5 2~0 0 TIME - milliseconds
FIG. 32 STRAIN TRACES FROM COMPONENT AND PRINCI PAL STRAINS FROM
0.5 TIME
GAGES ROSETTE
1.0
milliseconds
1.5
NOS. I , 2) AND 3, A TEST 34
2.00
en CJ.) CJ.) ... CJ) CJ.)
'U
(f)
X <t
-.J « Iz o N
Ir o :x: ~ o cr:: lL
)( o E
w
lJ.. o
z o ~ u w a:: a
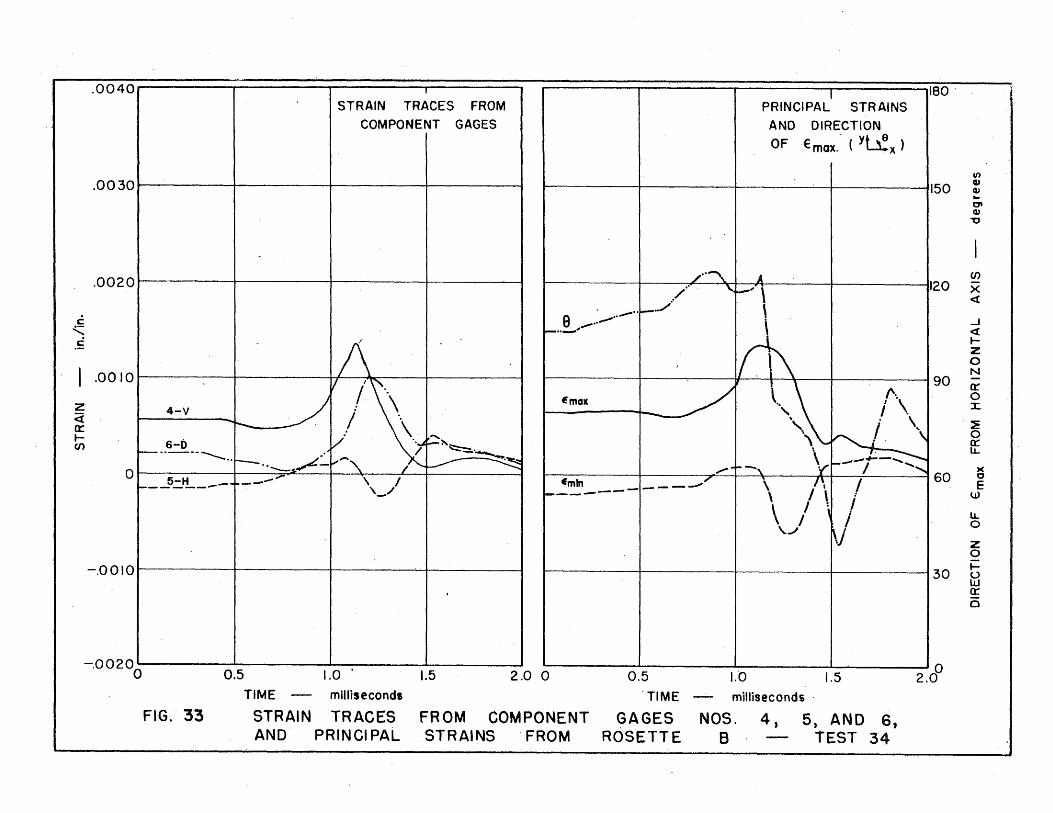
.0040 I f 180 ' STRAIN TRACES FROM PRINCIPAL STRAINS
COMPONENT GAGES AND DIRECTION
OF , e
Emax. (Yb!x)
(/)
.0030 150 Q) Q) ... C7' OJ
"1:J
I / .. ~ A en .0020
/ .' " ~\ 120 x <t
8 ' .. ~" f--"."/ \ c .,,,.. .. .,....,.- \ ...J
"' _ .. - «
/1\ t-.~ !\ z 0
I .0010 N
V /~" / \".~ ('" 90 cr
EmolC 0
>-/ : \ : \ ::I:. Z 4-V I . <i / '. . ,
'::IE .I \ a: ~/ \., 0 t- ......
~ [ C/) 6-0 ''-t ~,,~
\ I--"---~ .• / ~ t--.. ~--~-'\.
~. r- -" y )( 0 --. 60 0 r-- __ 5.::!!.._--. ----'" \ I Emln ---....".,/ \ /'s I E ,_/ ------- \ I \ i w
\ I , I u. \.../1 0
~J z 0
-.0010 30 i= u w . 0: 0
-.00200 0.5 1.0 . 1.5 2.0 0 0.5 1."0 1.5
0 2.0
TIME - milliseconds 'TIME - milliseconds '
FIG. 33 STRAIN TRACES FROM COMPONENT GAGES NOS. 4, 5, AND 6, AND PRINCIPAL STRAINS 'FROM ROSETTE B - TEST 34
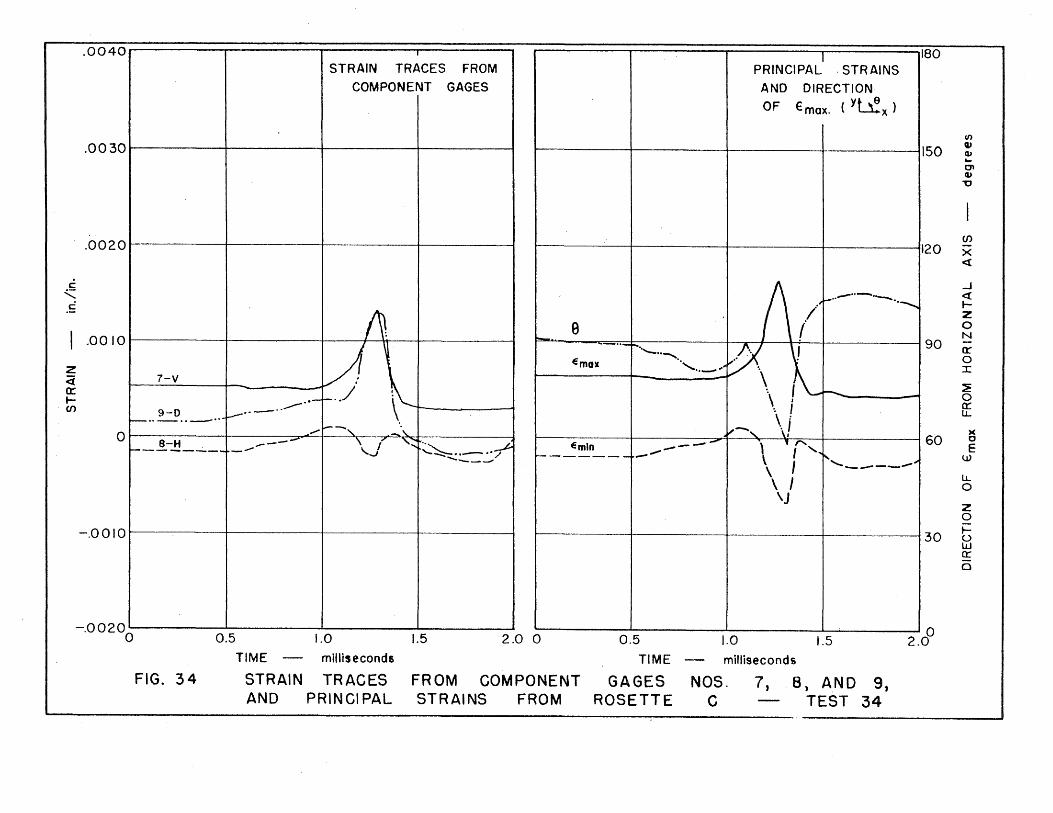
·0040 , I 180
STRAIN TRACES FROM PRINCIPAL . STRAINS COMPONENT GAGES AND DIRECTION·
OF y~ €max. ( x )
I/)
.0030 150 " Cb ... 01 Cb
""0
I en .0020 120 x <t
c:
(\/' -.J
"' ~""'-"----"-""" <t c: t-
~. Z
e 0
I N .0010 ~. 90 -
lA~ .. -
r-'-. .. -..
f0\l rr 0 Emox ", .. _ .. , I Z
<i 7-V
~../ ~ ~ a:: I--. 0 t-1---"-"""'-"-
\ I a:: C/) 9-0 '. I lL. \ : f-- •. _ •. _" r-, _\ ~-, \/ ",.. )( 0 60 0 8-H ---- \ I' '-::: ~~ .. - .. / Emln -'- \ 1 '"', E --1--------- -- ...... ...J 1-------- --- I .~
~. ." W .................. _--'"
\ I ,-----lL.
\ J 0 \J
Z 0
-.0010 30 t= u w cr 0
-.00200 0.5 1.0 1.5 2.0 0 0.5 1.0 1.5
0 2.0
TIME - milliseconds TIME - milliseconds
FIG. 34 STRAIN TRACES FROM COMPONENT GAGES NOS. 7, 8, AND 9, AND PRINCIPAL STRAINS FROM ROSETTE C - TEST 34

·0040 I t' . 180 STRAIN TRACES FROM PRINCIP . STRAINS
COMPONENT GAGES AND 9 RECTION : y~
OF €t~X. ( x )
i\ I/)
.0030 150 QJ
! l. QJ -. r'--,
at GI'
I ',\ "0
i \ \
i \ \ en
.0020
~ ! \ 120 x
<{
. i \\ -.J c j <t .:.:::: t\ .S I t-
i z e 0
;"--.--"--" f-~-~ ... : N .0010 90 -I /"'\ ~. .. -.....
~f ! \' Q:'
, Emax .... , .... / \ I 0 IO-V ,../ r" \ - _/ " I :r: Z " .
\ ,~ <i . ,/ \
~ ~ a:: .,/ IV"" 0
t- 12-0 ",..-,,/ a:: CJ)
~"--"-"-'" _ .. _ ..
~-, '-\ " ".-' \ i LL
," .. / \ / ~ ./ \ 'ill )(
0 60 0 II-H ..,,/ " (. --::::- .... -: Emln ,.,""'" ,~~ -'-- E !--------- --"..., r-:--"-" ------- -_/ ---- W
V LL 0
Z 0
-.0010 30 ~ u W 0:: a
-.00200 J.O
0 0.5 1.0 1.5 2.0 0 0.5 1.5 2.0
TIME mlflis.econdl TIME -'- milliseconds
FIG. 35 STRAIN TRACES, FROM ,COMPONENT GAGES NOS. 10, .11, AND 12, AND PRINCIPAL STRAINS FROM ROSETTE 0 TEST 34
- - -----.--~---.--- ... -----~.- ------
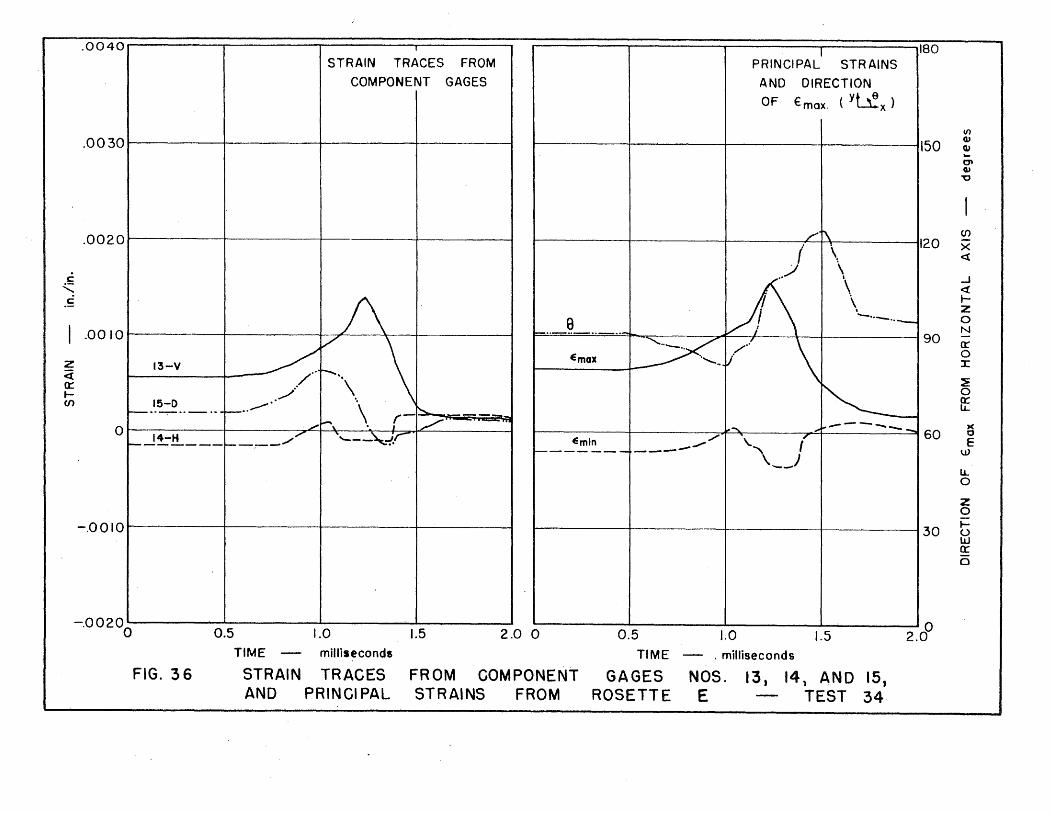
.0040 I T 180 STRAIN TRACES FROM PRINCIPAL STRAINS
COMPONENT GAGES AND DIRECTION OF y~ € max. ( x )
I/)
150 ClJ .0030 Cl1 .. 0' Q)
~
I /'1\ en .0020
I \. 120 x <!
u\ \ ,
..J c \ "' <t
A \. t-.~ Z
e -"-"- 0
I 1--., .. - l N . 0010 .. . . 90 -,/'
\ / .. '
\ D::'
~ ~-.,
0 Emax ""'-.~ V· :x:: z 13-V <i ...........
~ 0::: .-,,/ \ 0 t- o:: en 15-0 1--•. ,---. \. ~ l.J...
1--"-. "-". r .~- -./ ~\. /' ...
....... 1.------- )( a ... 60 0 14-H .,// ',---v..r- .,/ ,
(' E Emln ---_ ....... \." ~------I---~- 1------- w ' __ J u.. 0
Z 0
-.0010 30 i= u w cr 0
-.00200 0.5 1.0 1.5 2.0 0 0.5 1.0 1.5 2.0
0
TIME - milliseconds TIME - . milliseconds
FIG. 36 STRAIN TRACES FROM COMPONENT GAGES NOS. 13, 14, AND 15, AND PRINCIPAL STRAINS FROM ROSETTE E - TEST 34

c
" .S
·0040 STRAIN TRACES FROM
COMPONENT GAGES
.0030rl--------~----------+---------~--------~
.0020Ir----------~----------r----------+----------~
1 PRINCIPAL STRAINS
AND DIRECTION Y •• 9 OF €max, ( w.x)
180
~---------+----------~----------+---------~1150
en OJ OJ a-D' OJ ~
" (f)
1120 x I ' <t
I .0010 "-
16-V .' \',\ Emax
...J <t toZ o N
IX' o :x: z
<i a:: toC/) '- .,/
/ " . \ / '. 18-0 _"_"-' _..................... "'-.. .. _ .. __ .-._ ..
,,/., 60 ,-.. .,--/,-
/'
--o " " r- ....... 11-H --' "I', ----- ' ......
" /
-.OOIOrl----------r---------1----------4--------~ r-----------~----------+-----------+---------~130
-.00200 0.5 1.0 1.5 2.0 0
TIME millis-econda
FIG. 37 STRAIN TRACES FROM COMPONENT AND PRINCIPAL STRAINS FROM
0.5
TIME
GAGES ROSETTE
1.'0
milliseconds
1.5
NOS. 16, 17, AND 18, F TEST 34
2.00
~ o e:
)( o E
w
lL. o z ,0 ~ U UJ a:: o

.0040 STRAIN TRACES FROM
COMPONENT GAGES
.0030rl---------+---------4----------~------~
( .0020 1 J ~
c , c::
I PRINCIPAL STRAINS
AND DIRECTION y~ .. 9
OF €max. ( L.l..x)
180
t----------~----------+----------+--------~1150
/1--/-
/ .. '-" 120
8 J ./ ~ .. - .. - .. - .... - .. .....,./
z <i 0::: ten
I _00101 =t/ i11 \ I
:\~ 22-V
90 Emax
. I : I ~ _-1\ 1
.~4-~._.. .._.0 __ .. :-:"'-'~_.! \ f \C--,,-. " o / .~, ,
23-H ___ --- """' ...... ........
~_~~ __ ~ ___ --~+ -- _,J\~7--\,-_J 60
-.00 10 t-I ------+-----+-------1-------1 t-----------+----------~-----------+---------~130
-.00200 0.5
FIG. 38
1.0
TIME - milliseconds
STRAIN TRACES AND PRINCIPAL
1.5 2.0 0
FROM COMPONENT STRAINS FROM
0.5
TIME
GAGES ROSETTE
1.0
milliseconds
1.5
NOS. 22, 23, AND 24, H TEST 34
2.00
If)
Q) Q) ... 01 Q)
"'0
CJ)
X <t
-I <{ tZ o N
Q:" o :x:: ~ o 0:: lL
)( o E
w
LL o
Z o t= fd !f o

.0040 I 180 "
STRAIN TRACES FROM PRINCIPAL STRAINS
.. COMPONENT GAGES AND DIRECTItJ:, '-:.J Y ,
OF €max. ( x ),
/ \ (/)
.0030, 150 CI) CI)
( ... C7' CI)
I ~
en .0020 x
<t
c ..J
" " 4:
C t-Z /./ 8 0 .--.. - .. - .. N
.0010 .....
90 -/\ c:r
,/ \,
\ Emu
0 Z 25-V .. ".... .... /1 \\ :t:
a ~ a: .. /' /- --, \ I \ 0
l-
I >~ .. If en 27-0 , \ f--oo_ .. - .. _ .. 1--"/ / /' '\ "u )J(
0 60 c 26-H . / \ Il ~ .. /"~ Emln E 1--------1---" \.,1 ------ w
.. ../ u.. 0
z· 0
-.0010 30 t= u W 0:: a
-.00200 0.5 1.0 1.5 2.0 0 0.5 1.0 1.5 2.0
0
TIME millisecond', TIME milliseconds
FIG. 39 STRAIN TRACES FROM COMPONENT GAGES ~OS, 25, 26, AND 27, AND PRINCIPAL STRAINS FROM ROSETTE I TEST 34

c
"' c
z <i a:: ten
.0040 STRAIN TRACES FROM
COMPONENT GAGES
.0030rl --------r--------+--------+-------~
.0020rl---------r---------r--------~--------~
.0010
22-V_ ...
r- ....... /" ' ... _-
o--~ 'V~r-L-- 23':'~_--l"'" 'r _ -<::-~
-.00 I 0 rl -----+-------+-------'---11-----------1
I PRINCI PAL STR AINS
AND DIRECTION Y .... 9
OF €max. ( Ll..x)
180
r---r-----1----+---~1150
r--------+----------r---------4--------~1120
90
60 Emln _j,.....,7 ~--
~~. \ Em.. I ~I \
;"-"-, \
30
-;00200 0.5 1.0 1.5 2.0 0 0.5
TIME
LO milliseconds
1.5 2.00
FIG. 40 TIME - milliseconds
STRAIN TRACES AND' PRINCIPAL
FROM COMPONENT STRAINS FROM
GAGES ROSETTE
NOS. 22, 23, AND 24, J TEST 34
(f)
ClJ G1
0' cu
"U
C/)
X <l:
...J <! tZ o N
tr o :r:: ~ o ff
)( o E
w
LL o
Z o ~ u w a:: a

.!: ........ .S
z <i a:: Im
.0040 STRAIN TRACES FROM
COMPONENT GAGES
.00301 ·1
.00201 .1
.0010.-------~--------4-~-----+~~~~~
31-V
1--~_3-D_._ .. .l-_._ .. _.I _____ ·--··-··
o ~22-.!!---+-------~_-__ .... _Jt \(,\.-~--1
-.0010 t-I ------f-----+-----4--------I
f PRINCIPAl STRAINS
ANO DIRECTION Y ... 9
OF €max. ( u...x)
180
r---------~~------r---------~--~--~1150 en Cb QJ ... C7' QJ
"0
I·
en L----+-----i-~-----:-T-:----l,,20 ~
/~ ,
9 /II~~
..J <t: IZ o '''-I cr o J:
~ o fE
)( o E
w
u. o
z o
I ~ l--------+------+-------t---------130 . ~. a: o
-.00200 0.5. 1.0 1.5
, , '. I , '0 2.0 0 0.5 1.0 1.5 2.0
TIME - milliseconds TIME milliseconds
FIG. 41 STRAIN TRACES FROM COMPONENT GAGES NOS. 31, 32, AND 33, AND PRINCIPAL - STRAINS FROM ROSETTE K TEST 34

.0040 I I I 180
STRAIN < TRACES FROM PRINCIPAL STRAINS
COMPONENT GAGES AND DIRECTION
OF y~ €max. ( x )
If)
.0030 150 Q)
ClJ .... 0'1 Q)
'U
(f)
.0020 120 x
r <{
e ~ ..J
" <t - -~ t-e Z
I,....~-·-··-_ .. -,,-..
0 I-V a I. N
.0010 90 -
J'\ - .... "-" - . -- ! cr
Emax \ '.1\ / /--, 0
z ---_.- :r: ......... <i / \ v I '"'--
~ 0:: 3-D .' f 0 t- fo--- .. - .. - .. - - ... - .. ~..-- .. ---
J1 \ a:::
(J) I I.J...
J \ \ I )(
0 60 0
It' \ \ ..,.. .. "-'- ro •• """ ~I E 2-H ........... Eml" ..--'''' w 1-------- ----_./ \\ .. _ .. - ....... 1----------_ ......
L-~- --------------- LL 0
Z 0
-.0010 30 ~ u W 0:: 0
-.00200 0.5 1.0 1.5 2.0 0 0.5 /.0 1:5 2.0
0
TIME milliseconds TIME milliseconds
FIG. 42 STRAIN TRACES FROM COMPONENT GAGES NOS. I , 2, AND 3, AND PRINCIPAL STRAINS FROM ROSETTE A TEST 35
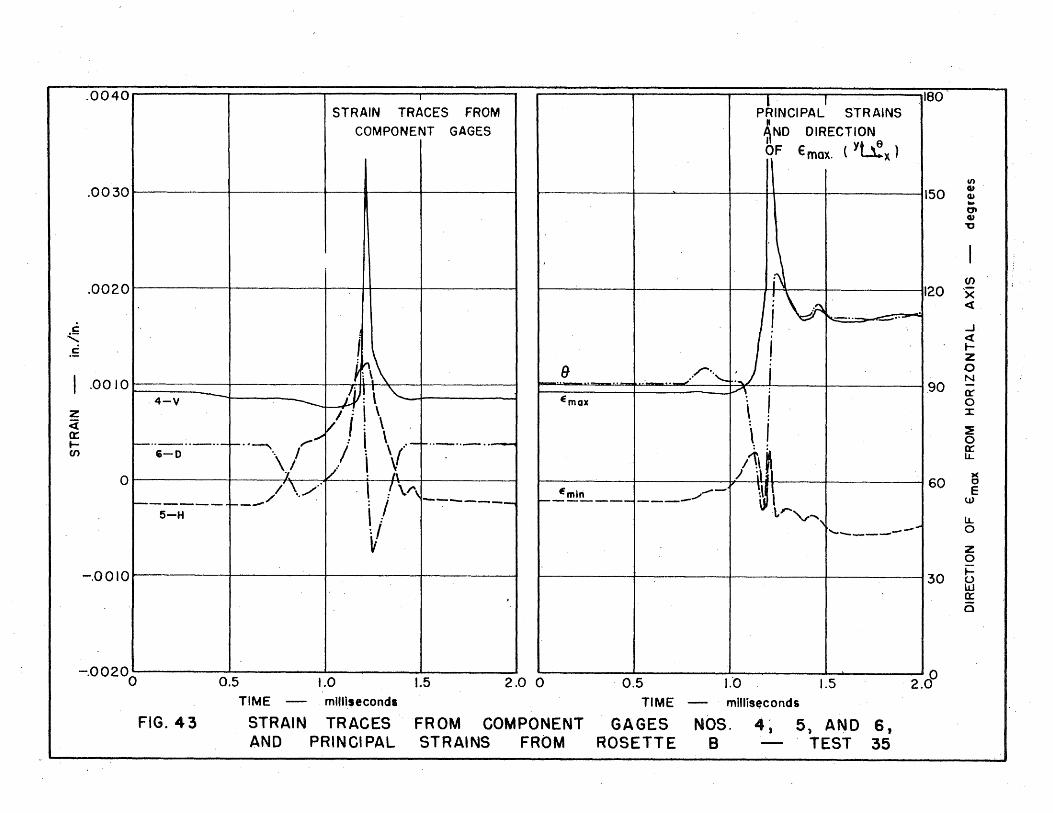
c
"' .5
.0040 STRAIN TRACES FROM
COMPONENT GAGES
.0030 t-I ------If----
.00201 II
I ,00I0r-----~-------+~~~~------~ : \
z <i a:: .... (f)
--'--~/-;' I \ f : \
1--".,_0 "-"1"---'\/"- / \ \ .. -+-,_ .. _ .. -
"l = 1\
o I I '\. "1· " / .. ./. . . \~ t--
5_ H--t--/ . \ / ~-~-----
~ I V
.4-V
e
I ~----I 180 PRINCIPAL STRAINS
II AND DIRECTION ·,1 Y ... 6 RF € max. ( L-l..x)
I' 1150 II)
cu QJ
-""
.. C7I QJ "'0
en 'x <l
..J <l tZ o N
90 0: . 0
::t:
:!E o ex: LL
)( o E
w
LL o z o
-.0010 t-I ------r------f--------if--------f ~ fd r---------~----------~---------+-------~130
a:: o
-.00200
I I I I • I I I I
2~00 0.5 1.0 1.5 2.0 0 . 0.5 1:0 1.5 TIME milliseconds TIME millis~conds
FIG. 43 STRAIN TRACES FROM COMPONENT GAGES NOS. 4' , 5, AND 6, AND PRINCIPAL STRAINS FROM ROSETTE B TEST 35

.0040
PRINCIPAL' 180
STRAIN TRACES FROM STRAINS COMPONENT GAGES AND DIRECTION
OF y~ €max. ( x )
(f)
.0030 150 Q)
0.1 ... OJ
\ <U "'0
! \
I \ I (f) .0020 I 120 x
\ ~
)1 ..J c , 1.--"-"-"-"-"-.:.::: <{ c ' i i .' t-
:/ z e 'j V 0
7-V N .001·0 90 ----.. .. .. ./ : cr Emax
"' ..• -\ I 0 ::r: z
\ i <i ~ 0: 9-0 \. t", 0 t- "-"-"-"
V l 0::: en LL
I/-J \ it "- )( 0 60 0 8-H ./ "-"-"- Emln ) VI ,,-1----- E ---'" --- tV -- ---- 1----- --- -----.------
I \ I ~ LL
0
Z 0
-.0010 30 .-u W 0: 0
-.00200 0.5 1.0 /.5
, 2.0 0 0.5 1.0 1.5 '2.0
0
TIME milliseconds TIME - milliseconds
FIG. 44 STRAIN TRACES FROM COMPON~NT GAGES NOS. 7, 8, AND 9, AND PRINCIPAL STRAINS FROM ROSETTE C - TEST 35
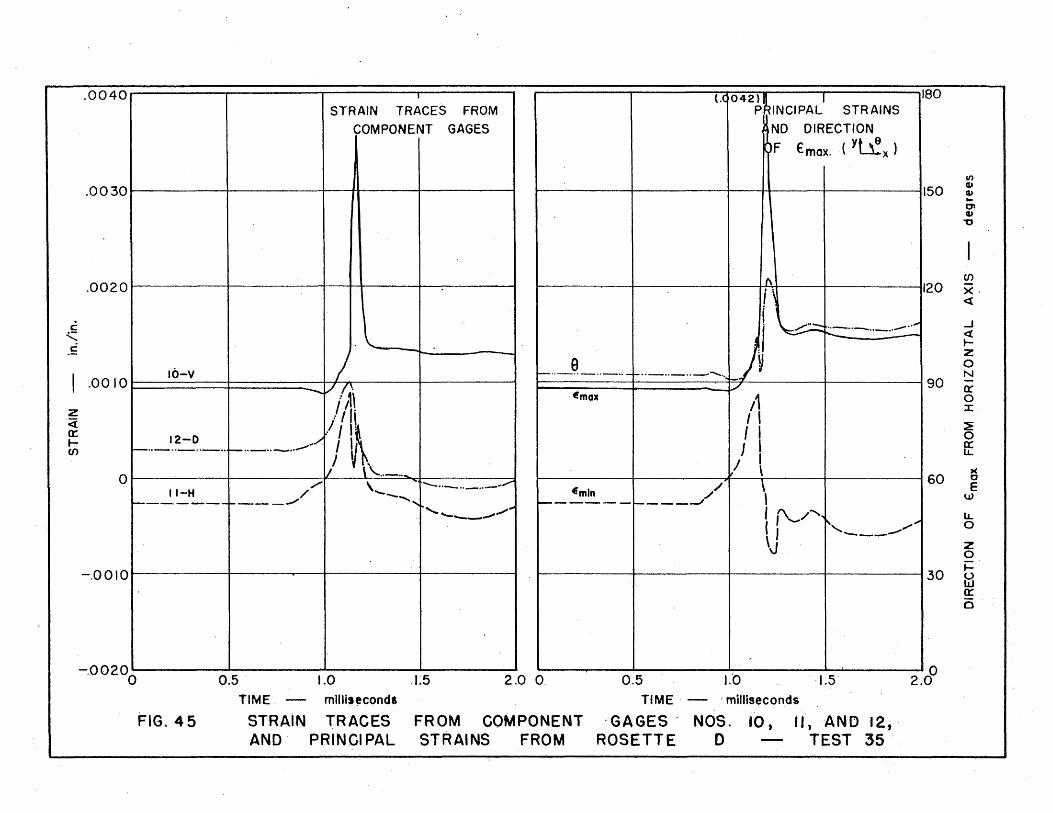
·0040 I (.C 042) ~INCJPALI 180
STRAIN TRACES FROM P STRAINS
COMPONENT GAGES NO DIRECTION
)F y~ €mox. ( x )
U)
.0030 150 cu cu ... C' cu
"U
1\ (f)
.0020 ; \ 120 x. ~
c I~ r:.:::::-"-"-"-~ ...J
"' ." <{
c l)~ t-
.-j - z
e 0 IO-V r-- .. - .. - .. - .. - f- •• _ •. _ .. --""~, N
.0010 90 -/ ~i\ ./ a::' -..... Emax /1 0 z /11' :r: <i /!I~ I I
~ cr: 12-0 .. / I I 0 t-
I 'I J I ff (f) ---.. _ .. _ .. _ .. _ .. _ .. _ .. .,-"
I ~ , I / \\... .. _" ... ~/ \ )(
0 60 0 /'" \ ....
--"-"-"-"/ ,// \ E II-H / ""- Eml" w 1--------f----../ ' .... ------____ ..J
........ -------,...,.",-- , {\-/ ...... ~, /'"
lL.
( I 0 ""------,..,."
\J Z 0
-.0010 30 ~ <.> w a: 0
-.00200 0.5 1.0 1.5 2.0 O. 0.5 1.'0 I.S
0 2.0
TIME. millis~cond$ TIME . millisecondl
FIG.45 STRAiN TRACES FROM COMPONENT 'GAGES - NOS. to, IJ, ·AND 12, AND PRINCIPAL STRAINS FROM ROSETTE 0 TEST 35'

c
" .~
z '<f a:: .... (/)
.0040 (·0052)
STRAIN TRACES FROM
COMPONENT GAGES
.00301- - ---
.00201 I I ,
.0010
,)
r·H / 1---'" I'
I \ '."... ........ I ........ - .....;. - ~ - - - -"""-
-.00 10 t-I -----t------+--....o...-----I---------I
~.0054) I PRINCIPAL STRAINS
AND DIR·ECTION Y" .. 9 OF € max. ( Ll...x)
180
L-~~~+_+-----:-t_----l'20 j
i
!\/ _ .. - .. - .... 8 . .1 .. - .. - .. - 90 ~ .. -.. -
€max
L---~~~--~-----t----~60
11- --- r- - - -1- - - -130 I J
I I
" -0020"'· . 0 0.5 1.0 1 .. 5 2.0 0 0.5 11(-·0027~ I I I
1:0 L5 .2.00
. FIG. 46 TIME -.. millisecond,
STRAIN TRACES AND PRINCIPAL
FROM COMPONENT STRAINS FROM·
TIME
GAGES ROSETTE
- milliseconds
NOS. I ,. 2 , AND. 3 t
TEST 36
I/)
QI OJ ~
CIt G)
~
. I C/)
X <l
..J « t-·z o N
€r o :x:
:e o cr: u...
a E·
w
lJ.. o Z o ~.
~ 'tr o

c
" .5'
z <i a:: I-(f)
.0040 STRAIN TRACES FROM
COMPONENT GAGES
I .0030 t-I ------+--~--+--- ----4-------1
.0020
.0010
0
I" J }I I: I II.
{ I 8- V •.
.' Iii ' .. I"'/'I!M \ O _.. ,. ... I 7 - '- "
1-.'- .. _- /'/ IV I
f-- _ 1'1 ..... 6 -H ' ..... I
I \
\ A " - \,..." ",J
. I -~-'-----.180
PRINCIPAL STRAINS
AND DIRECTION , y~ ' .. e, '
OF emox. (. u'x )
r--------~--~--~~--------~--------~1150-
8 _ ........... _' (I, E
~ :
! i .~
:1 I: :1
!
E ",ax ~ l
JI '" -. .'- .1 /- 1 . ........... ..-.. .. - .. "'. r' f" I
120
90
I 60
I
g:, Q) ... 0» Q)
"0
I,
C/)
X <t
.J <t .-. Z 0 't::! tr 0 :t:
~ 0
fE S E
w lL o {'r /\ -l .~
'./"'" - ~/30.~ o
I , I
l ' \ J \
-:-.0020~ I I '1 I I I I I I
2:00 0.5 1.0 1.5 2.0 0 0.5 1:0 '1.5
TIME milliseconds TIME mill1seconds
FIG. 4.7 STRAIN TRACES FROM COMPONENT GAGES NOS. 6 , 7 , AND 8 , AND PRINCIPAL STRAINS FROM ROSETTE 2 TEST 36

·0040 I 180 STRAIN TRACES FROM PRINCIPAL STRAINS,
COMPONENT GAGES AND DIRECTION y ... 9
OF €max. ( w..x)
.0030~1 --------+-------~--------~------~ r------;------t-----+-----~1150
U)
" Cb ... C7I Q)
."
I,
en .00201 III In 1120 ~
.!i
" .E
I .0010 ../
z <l
~ "-/", I t ", .. J'. en ~
o l-\. /_ ~r- - \f'~-:"7.,'·7 II_~"-' 1 ~I \ ... ~ A
•• ---- •• ---.... ----------------::-;;ij
-~
~I L~i 190
~/-·p\r\ \
r/\ 60 Emln /" \ "'. /"' /*("' ......
1--\./,./"'_ '\~r-''l, .7.::" .Jv· .. \ . /' \ .
: / \ . -.QOIOrl -----+------+-----4-------1 :. i 130 \ .:
-.00200 0.5
FIG. 48
1.0 TIME - mUUtfcorid,
STRAIN TR.ACES AND PRINCiPAL
1.5 2.0' 0
FROM COMPONENT STRAINS FROM
0.5 TIME
GA,GES ROSETTE
\/ l
1.'0 milliseconds
1.5
NOS. II. 12) AND 13, , 3 TEST 36
'2.0°
..J oCt tZ -0 N
cr o ::J:
:e, o e:
)( o E
W·
u.. o z o ~ frl cr o
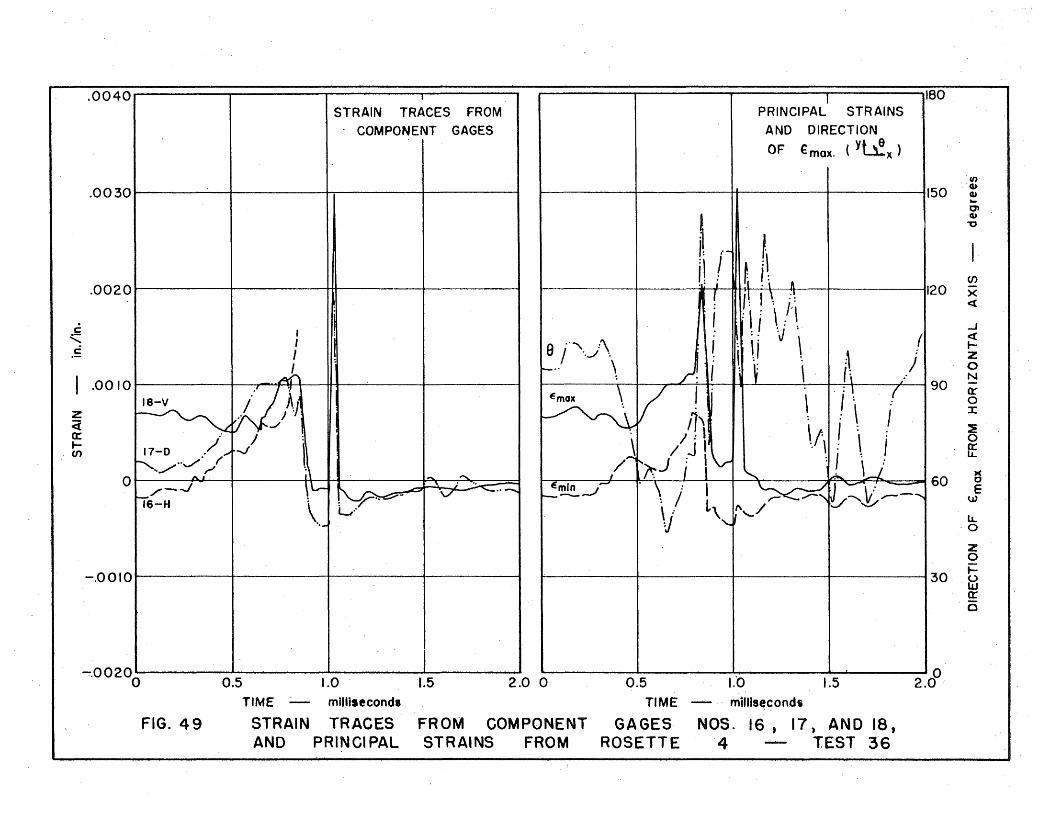
c
" .5
·0040 STRAIN TRACES FROM
COMPONENT GAGES
.00301 I.
.0020' III
, I I I
,All " I .0010 /11
z
1-. _"
~ U . en i\
~/-.J - \L-16-H :
\ "-
~ .. ~
-.OOIOrl----~----+----------+----------~---------;
a'" :\ / '.J.,
1-" \
, PRINCIPAL STRAINS
AND DIRECTION y~ .. 6
OF € max. ( L.l.. x )
180
en· 'a.
OJ .. '" OJ ."
I CJ)
120 x ct
..J ct tZ o
90 ~ 0:-
J ~ : :E
~~~ I [ 60 ~ E
w
11.. ·0
z o ~
30 fd cr (5
~.00200 0.5 1.0 '1.5 2.0 0 0.5 1:0 1.5 2.0
0
TIME -' mll~i'econd. TI ME -' mill19~cond5
FIG. 49 STRAIN TRACES FROM COMPONENT GAGES NOS. 16, 17, AND 18, AND PRINCIPAL STRAINS FROM ROSETTE 4 TEST 36

c
"' .~
z <i 0:: .... (/)
.0040 STRAIN TRACES FROM
COMPONENT GAGES
.0030,1 --------+-------~--------~--------J
.00201 W
~
O~-!I:!!. ~T lTV =t =
-.0010 Ih . .------t-----+------t------J
.1 PRINCIPAL STRAINS
AND DIRECTION Y ... 9 OF € max. ( Ll...x)
180
t-----'-----;-----+-----+----~1150
I I ~ I t20
a 90
i ./
'. /' ......... -., /'
~ 60 t-, -1~ r. ...... ,---" /'-..... -~ \ ,
• min I \ f\ ~ /A.\ ~ ~ \ . .i .. / \/"::c 30
, ( : i \ : : I \ : : I \,.. ..
-.00200 0.5 1.0 1.5 2.0 0 0.5
TIME
1.'0
milliseconds
1.5 2.cP
FIG. 50
TIME . - millisecond.
STRAIN TRACES AND . PRINCIPAL
FROM COMPONENT STRAINS FROM
GAGES ROSETTE
NOS. 21, 22, AND 23, 5 TEST 36
If)
ClJ Q) ... t7' ClJ "0
CJ)
X <t
..J <t tZ o N
0: o :x: :!E o fE
)( o E
w
u.. o z o i= u lLJ a:: o
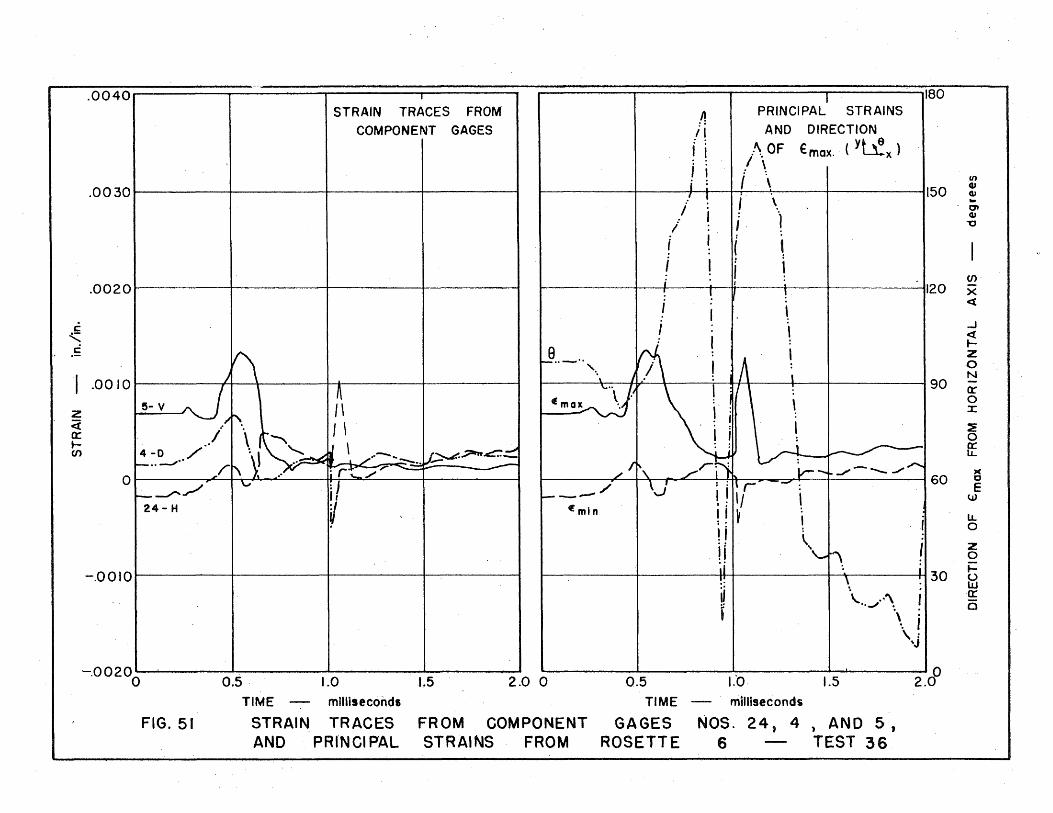
c .:.;::: . ~
z <i 0: .... en
.0040~'========~========~========~========~~========~========~========~========~~------' I ----'100 STRAIN TRACES FROM
COMPONENT GAGES
.0030~1--------~~--------;---------~----------;
,0020Ir ----------+-----------r----------+----------4
.~ PRINCIPAL STRAINS
i i i ~
I
i
/~ AND
i i /\. OF I . i i : \
I , J \ , I . )
I ( \ I
. 1 I
T ~ , \
! , . . ,
DIRECTION
Y~ €max. ( x )
150
1120
.00 10 1-----_++_--+ .-----~-ft~+----T~4---~--4---------J90
6- V
/. 4-0 /"
1--" --./.,
0r==--/,/" I ~ r. 24- H
if 1----/
Emln
-.00 I 0 It---------t---------t--------t--:-------I
'-.0020· I I I I I
0 0.5 1.0 1,5 2.0 0 TIME milliseconds
FIG. 51 STRAIN TRACES FROM COMPONENT
.;' 1, _ /~til \J - II n-'I-' __ "-"""'...,.....J:- -l-------~-·__. 60
.: I !! ~ I 11 : II \, :. ~
·f
:: 30 ~ ~ f \.. .. ~ .. ,
\. i ,: .. J
I I I I Ie? 0.5 J.O 1.5 2. TIME . milliseconds
GAGES NOS. 24, 4 , AND 5, AND PRI"NCIPAL STRAINS FROM ROSETTE 6 TEST 36
If)
cv cv .. at cv
"
en· x ~
..J c:{ .... Z -0 N Q:' o :x: :IE o e:
)( o E
w
LL o Z o ~ u W .0: o
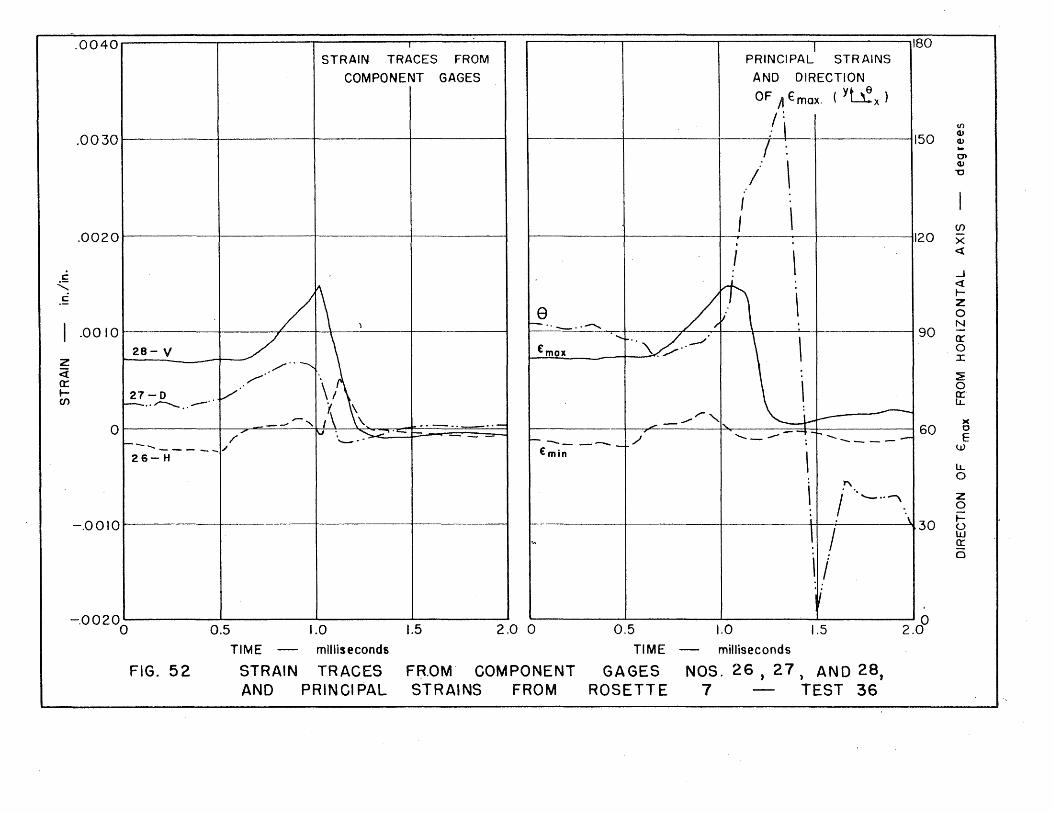
-.0040 I
PRINCIPALI 180
STRAIN TRACES FROM STRAINS
COMPONENT GAGES AND DIRECTION y~ OF It € max. ( x )
/: If)
.0030 : \ 150
Q)
I Q) .. Ol
\ Q)
/ "'0
I \
I I I
(f) !
.0020 . 120 x I
I \ <t
I
I
C ..J .:;:::
~ V\ <t
c:
/ / \ ~ z e 0
I , r-- .. _ .. .-...... N
.0010 ~: " 90 -/ '. ~ .. ~'
\ cr
28- V £max 0 Z /",
::r: <i / ~ a: \, \
0 I- 27-0 /' a:: en - .. ~ .. .--.. f. \
u.. ,....." --i- ~
----" ,.\ \ ..-- )(
0 .. - .. .. - -_ ....... 60 0
/' ~ " .......... - '- I-- '- .---.,.-------- E r-_ ..... ___ __ ~ ""-- .. ------ ./
Emin w 26- H
\ u.. 0
\ 1"\
I """- .. ~ z 0
; \ 30 t= -.0010
\ I 0 w
.... a::
\ f 0
V -.0020
0 0.5 1.0 1.5 2.0 0 0.5 1.0 1.5 2.00
TIME - milliseconds TIME - milliseconds
FIG. 52 STRAIN TRACES FR.OM- COMPONENT GAGES NOS. 26 , 27 ) AND 28, AND PRINCIPAL STRAINS FROM ROSETTE 7 - TEST 36
'-----------

c
" .~
.0040 STRAIN TRACES FROM
COMPONENT GAGES
,0030 rl ------+-----+-------4---___ ---J
,00201 1 . A 1/1 I ,
\ 1\
J li\l .0010
~ "'-"''''/ « -", cr.: . ./
t:; 3~~ •• .,. .. /" /~- -\/
r 0' "-"-~"" - / 29-H--'/ _ .......... ;-,-
~,O 0 10 t-I -----+--------+------t-------i
I I I I
I PRINCIPAL STRAINS
AND DIRECTION YJ .. 9 OF €mox, ( L..l.x)
180
r---------~--------~-------~-------~1150
h, I A ,1120
~' ~A\~I \ I 190
E~;; ""'V \ f \ \ .
,.;.--'"": '-.. '--:... .. / .. '" I \ ~ ____ ' ~"--::;.
I ~. 1\'
E
min./1 i 1 .\.....~ ___ ........ '-_ 1---,--- : r, r I -
. \ .II '\.
" ! ~ I 130 f\ I \ :
t 1 \ : t I \: '1
I I I I I -.00200 0.5 1.0 1.5 2.0 0 0.5 Lo 1.5 2~00 TIME milliseconds TIME 'milliseconds
FIG. 53 STRAIN TRACES FROM COMPONENT GAGES NOS. 29, 32, ANO 31, AND PRINCIPAL STRAINS FROM ROSETTE 8 TEST 36
CI)
Q.J Q.J ... tJI OJ ."
·1 (/)
X <t
...I « Iz o N
r:r o :r:
:e o fE
)( o E
w
LL o .Z o t= u UJ a:: o

~-~00.40 , PRINCIPAL'
180 STRAIN TRACES FROM STRAINS
COMPONENT GAGES AND DIRECTION
OF .' Yb! €max .. ( . x )
en
.0030 150 CI.J Q) .. ~ CI)
"0
. r'-"-';""""'''''''' I /'"
''"-.. -"--:''- CJ)
.0020 ! ! 120 X <t
.. /" I d .J c
(\ ~ "' i : I « ,...j L t-
.!: e ) l~
z I 0
'-.:'_,V· J N .0010 90 -'v \~ 0:
IO-V J "m.x~ ~ 0
'. ! ~ :x: z ~ r~ r----
<i :\ - ~ 0:
~/ .. ~ , 0 t- 9-0 .r--/ 0: Cf)
I---"---.. ~ :''-- u.. r-\-, II --V r, ........ .-.- J(
0 60 c
\J \~'" . ",...
Emin / --' ~J \ E ----/ ~t- ....... ,-_/ ,--.../---" A W 25-H r-- ..........
\ \ \ ,.- --' II u.. ....................... -"' .. \ \ /"-" /-/ 0
'''-.J L .. -,·./'" \... '----l_-- ....... z 0
-.0010 30 t= u w a:: 0
-.00200 0.5 1.0 1.5 2.0 0 0.5 1:0 1.5 2.0
0
TIME milliseconds TIME miflisecondi
FIG. 54 STRAIN TRACES FROM COMPONENT GAGES NOS. 25, 9, AND 10, AND PRINCIPAL STRAINS FROM ROSETTE 9 TEST 36
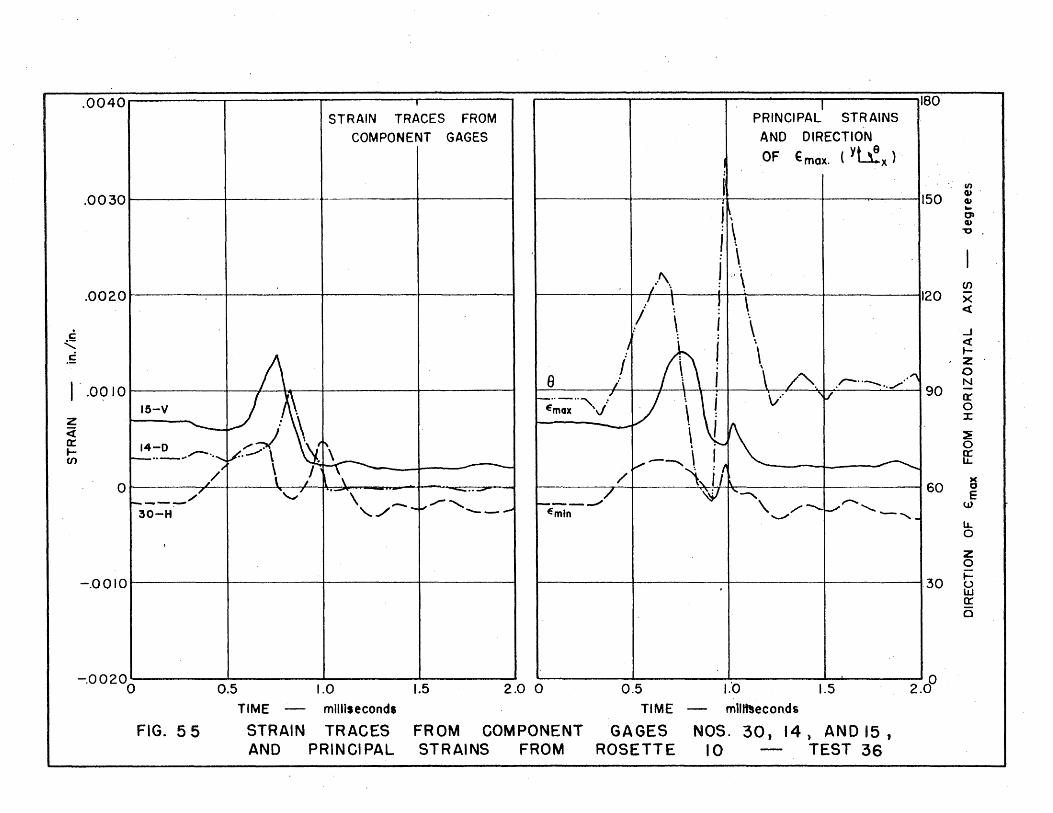
·0040 , I 180 STRAIN TRACES FROM PRINCIPAL STRAINS
COMPONENT GAGES AND DIRECTION
OF y~ €max. ( x )
I If)
.0030 150 Q>' GI
J ~\ ... CP
\ CI)
~ , J
\ /\ .' \
(/)
.0020 - I i. ;
120 .' \ ~ \ x / <{
\ I \ c . . ...J
" .' (\\i <{
.~ 1\ \ t-
i z \ : \ /"'-. .. " 0 B /' \ I .r-.. __ .. / N I' .0010 90 -
J ~\ t-.. _ ......... / LJ \\1 \/ "\,./ IX'
15-V Emax \/ 0 \ : :r: z : ~ \ , <l - - ~ 0= 14-0 /:-..--J " \ I • 0 t- _ .. _ .. ".--........ .. \ . ~---.. \ ! ~ a: (/)
~ -- ~ lJ.. /~ \/ / ,,\, , I
0 ". \ 60 ~ /' ',-I .. ----, -'- - .. - ./ .~ '~ E
r---..-~ ...,,- ........... -----" \. /~ r--''-'''' w 30-H ,./- .... ~ """--- Emtn '-"" ---- "" - u..
0 ,
Z 0
-.0010 30 ~ u w ex: 0
-.002°0 0.5 1.0 1.5 2.0 0 0.5 La 1.5 2.00
TIME milliseconds TIME mll~econds
FIG. 55 STRAIN TRACES FROM COMPONENT GAGES NOS. 30, 14) AND 15 , AND PRINCIPAL STRAINS FROM ROSETTE 10 TEST 36
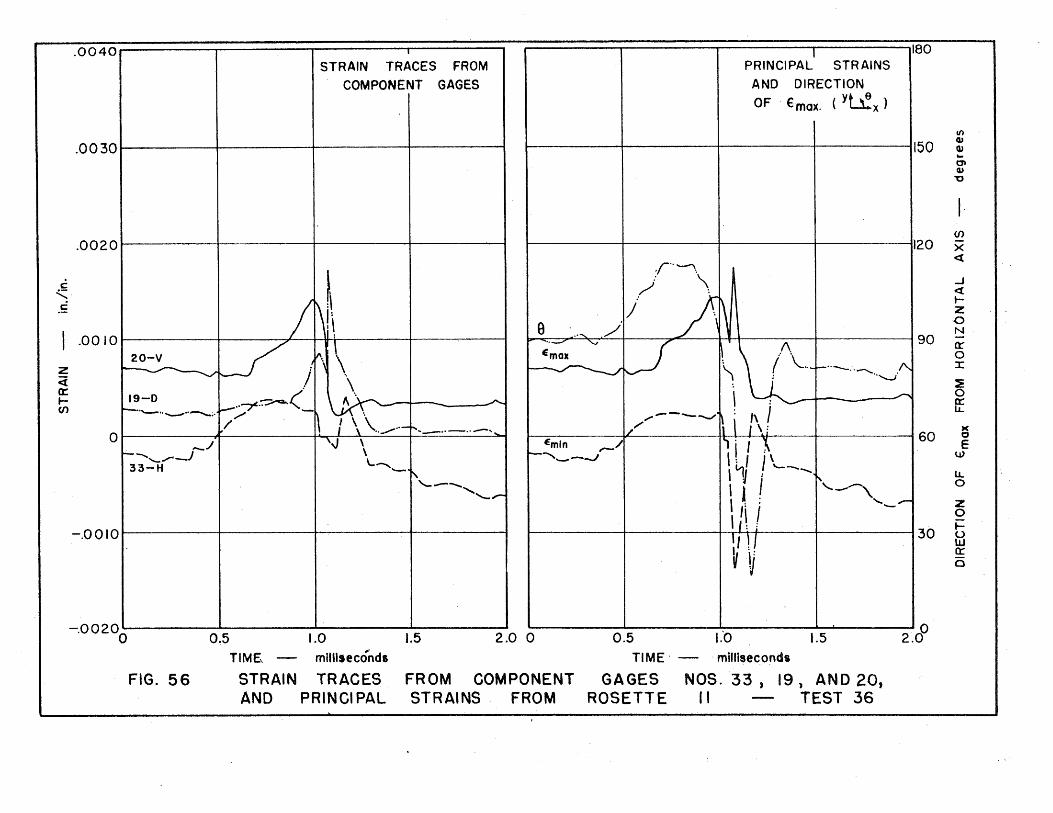
.0040 STRAIN TRACES FROM
COMPONENT GAGES
.00301~---------+---------4--------~~------~
I PRINCI PAL STR AINS
AND DIRECTION Y ... 6
OF . €mox. ( L.J... x )
180
~--------~---------r---------4--------~1150
(f)
~ Q,) ... 0' ~ ~
I Cf) L----------+-----------t----------~----------1,,20 ~
r··....-"\· .00201~---------r----------+----------+----------;
c:
"' .~ J
.: '\ /' :
I .0010 ,
z <i a:
~~~~+---~~~+_--~_t------~90 /\
(" \·-~t .. - .. ---... ."-ICf)
I : "0""",.,..;
---+--------' \ , I /---~f I t\! I . 60 '~~ i I X L Emln ---t I 1-,1 j \ ..... ~--r -----~-..,J I V ,I '-~ ,~; ,--1,1\ f 1
30
9 0 I ~.~(__ " .. I - ....r-" ". I \ \ .. """'*'~_ .. ____ .. ~_,~ r--._ .. _ --.,,/ \ I ~ . ."......_L _____ _ /-
-,~ , 'I 1 \ o _/ L~_~ L--~~_J ~ __ ,~~ 33-H
-.00 101~-----+------4~-----+-------I
-.00200 0.5
FIG. 56
1.0
TIME - milliseconds
STRAIN TRACES AND PRINCIPAL
1.5 2.0 0
FROM COMPONENT STRAINS FROM
I , .. , I 'I ~ V
0.5 1:0 L5 2.00
TIME· . milliseconds
GAGES NOS. 33, 19, AND 20, ROSETTE II TEST 36
-.J <{ tZ .() N
€r o X
~ o fE
)( o E
w
lJ.. o Z o ~ hl cr o

.0040 STRAIN TRACES FROM
COMPONENT GAGES
.0030~1~--------~----------~---------+----------~
.. 0020~1----------~~-------+----------+----------4
I PRINCiPAL STR AINS
AND DIRECTION y&. ... 9
OF €max. ( L.l...x )
180
~--------~----------~------~---+----~----~1150
:1 /. : \ I : . \
! \. 1120
~ I . .5
! \. . \ "1
" \
\
z <i 0:: I-00
.0010 ..
./ \ I 1_ V .. ./ \
.---............. '
"" . '-. 90 ....... Q
Em 01t
o ----...1. ----I- H
e-;;;-n- -- 60 -- --.
~.OOIOI~--------~---------1----------4---------~ r-----------r-----------+-----~----+-------~~130
-.0020' I I I I , I I • 2~OO 0 0.5 1.0 1;5 2.0 0 0.5 1.0 1.5. TIME milli. e conds TIME . milliseconds
FIG. 57 STRAIN TRACES FROM COMPONENT GAGES NOS. I , 2 ) AND 3 , AND . PRINCIPAL STRAINS FROM ROSETTE TEST 3 7
If) ., ell .. C1
'" ~
(/)
X <l
..J « t-Z o N (t' o :x::
~ fE
)(
o e w
LL o z o t= frl a: 0'

.0040 I " I 180
STRAIN TRACES FROM PRINCIPAL STRAINS
COMPONtNT GAGES ANO DIRECTION
OF y~ €max. ( x )
(I)
.0030 150 GJ C1I ... CJ) 41)
"0
r"\ I I .
: \ I \ i en
.0020 ! ~ 120 x
/ <l: I \ t··, I "'-", / ..J c ; / <{
" t· ", .. / .. .5 ,A
t-Z
A 8 0 (, N
.0010 -"-"-"-" - .. _ .. - .. ...,... 90 -
V ' ..
v~ tr 0
Z a-v ./ ./ :r: <i 11'" Emax "~
0: / , 0
t- . ~ 0: en 7-0 ._ .. _ .. ../. V ~ u.. 1--""-"-"- - -
~-_ ...... \ .. ::s::._ .. -"-C:::'~-.::::.:::: •• _ ,r - .. ~\ r-___ • --- ...... L )(
0 60 0 (/ .'
---_// -'" - E ---.--- ----- r-- - - -.--;- W 6 - H \
Emin lL. 0
Z 0
-.0010 30 i= (,) W 0: 0
-,002°0 0.5 1.0 1.5 2.0 ° 0.5 L'O 1.5 2.0
0
TIME millisecond, TIME . milliseconds
FiG. 58 STRAIN TRACES FROM COMPONENT GAGES NOS. 6 , 7 ) AND B, " AND PRINCIPAL STRAINS FROM ROSETTE 2 TEST 37
-- --- ----- --.----.-~~

.s "-.5
z ,Ci a: .... Cf)
.0040 STRAIN TRACES FROM
COMPONENT GAGES
.0030rl ---------+---------4------~~~------~
.0020
.0010 I I·sov I .J]). - .. ~ .. -_.E .. _ . .I_ .. _ .. _ .. _.lj ~I _
r----t-+----,/\...:...,..01& ",..~""'"> ---~--·t- .. - .. -.~-.. ,. .0 _tJ...-2i __ =4-- ___ J '"
-.0010 t-I ---~-r----_+_---.---+_---_____I
I 180 PRINCIPAL . STRAINS
AND DIRECTION
OF € mm(. (y~x)
r---------~--------~---------4--------~1150
~--------~--------~----------;----------11120
9 ~------i------L~~~---4--~--~90 ' . /" "-"-"
max I ~ . " .I '\ . .
'\ :
1 ............ ~ I ~
1- _.m~ __ J . . /' W-,,--- ___ ~ GO _____ - ' ---1
r-------~~-----~---------+~-----~130
-.002°0 0.5 1.0 1.5 2.0 0 , 0.5
TIME
GAGES ROSETTE
1:0 1.5 2.00
FIG. 59 TIME - munlecotid,
STRAIN TRACES AND PRINCIPAL
F'ROM COMPONENT STRAINS FROM
" milliseconds
NOS. I I, 12, AND 13 , 3 TEST 37
If) G) Q) ... 0' GJ "0
en x <l
..J <{ .... Z .() N
cr 0 X
~ fE
)( 0 e
w
u.. ·0
Z 0
~ w a:: is

.6: ..........
.~
·0040 STRAIN TRACES FROM
COMPONENT GAGES
.0030~1 --------~--------~--------+-------~
.0020rl--------~--------~--------+-------~
'1 .0010
z <i a:: fen
18-V
.r· _._ .. _ ..
/ ,..", ---"I"-"~'" .. "",., .~ '._., .. -17 - D ..........
---- ........ -o I ------- - _____ J 11- H
-.00101 I
T PRINCIPAL STRAINS
AND DIRECTION Y .... 6
OF € max~ ( L.l...x)
180
r-------~--------~---------+--------~1150
t-----+------f-------J------I1120
I
I
9 90
em ax '.
"' .... ·'v·'
L-------~------~~------~------_r60
1-'--, +------.J/, ': \..'-/"' ~ /'" Eml" '-/ ,............. ~-' . ....,." .. ~ .. --. .., I ~~ "
Ii i 130 : I I : ./ ~
-.00200
' 0.5 1.0 1.5 2.0 0 0.5 1.0 1.5 2.0
0
FIG. 60
TIME - millisecondi
STRAIN TRACES AND .PRINCIPAL
FROM COMPONENT STRAINS FROM
TIME
~AGES ROSETTE'
, milliseconds
NOS. I 6 , I 7, AND let 4 TEST 37
en QI Cl> ... Ol IV
"'0
CJ)
x <{
-.J <t tZ o N
lr o :r;:
~ o fE
)( o E
w
u.. o z o ~ ~ cr a
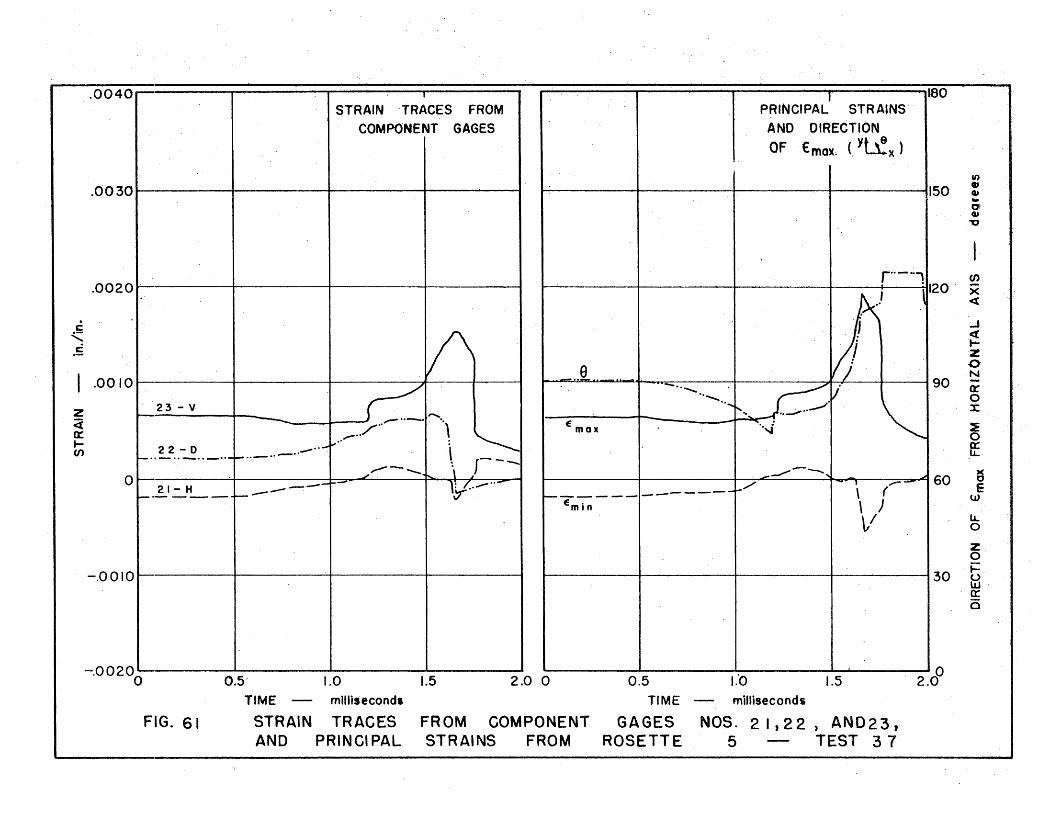
·0040 I
PRINCIPAL1 ISO
STRAIN 'TRACES FROM STRAINS'
COMPONENT GAGES AND DIRECTION
OF y~ €mox; (, x )
fI)
.0030 150 ., QI -OJ QI
" I·
r"-~l Cf) . . 0020
.J \ 120' X
~
c I ;..J
" r <t .E i .....
z e j .0-
N .0010 - .. ,;;,.. 90 -
C -"-'" I Q::' .. -... ...... 0
23 - V ,~ ~
x: z ~ .. , "---... ...... ..-"""
Cl / .. E max ' .. ...j :E a: ~ .. 0 t- 22 - 0 .. -"-.,., cr; CJ) -"-"-"-"--"-"- \ f-- IJ..
. -./"'" - -- ..... "' I"
--""" - -- .... )(
0 60 0 21- H ---... - lV'---oo- _/ I ,.-
E i-'-~-- --- . ------------- \ (
W Emin \ ) ~/ IJ..
0
Z 0
-.0010 30 t= u W· ex: (5
-.00200 0.5" 1.0 1.5 2.0 0 0.5 1.'0 1.5 2.0
0
TIME millisecond. TIME milliseconds
FIG. 61 STRAIN TRACES FROM COMPONENT GAGES NOS. 2 I , 2 2 ) AND 2 3 , AND PRINCIPAL STRAINS FROM ROSETTE 5 TEST 37

.~ "'-.~
z <t a: t-(f)
.0040 STRAIN TRACES FROM
COMPo.NENT GAGES
.0030~1--------~--------~--------~--------~
.0020
-.0010 l 5-V I -4/
T PRINCIPAL STRAINS
AND DIRECTION Y ... 9
OF €max. ( l-J..x)
/
180
/ I'SO i
I
.I .. ---+.----t---!--~r-----~ 120
8 .. , .. -.. - .. / ......... --.......... _ ..... .."" :
Em.. 90
I-E"-- __ j. ____ ../ 60 min
........... ~.{:. ~ 6.4
- . .0 -. j··_"-=;t -J \_~~.'"=.5J! o 24:..!!__ _ __
-.OOIOrl----------+----------+----------~--------~
-.00200 0.5 1.0 1.5 2.0 0
TIME - milliseconds
FIG. 62 STRAIN TRACES FROM COMPONENT AND PRINCIPAL STRAINS FROM
0.5 TIME
GAGES ROSE.TTE
1.'0 milliseconds
1.5
I . l / .. J
/ .. , i 130
V'
2.00
NOS. 24, 4) AND 5, 6 - TEST 37
In ., OJ ... at cu ~
en x <t
..J « tZ -0 N
tr o :J:.
::IE o a:: IJ..
S E
w
lL. o Z o t= frl· €X: a
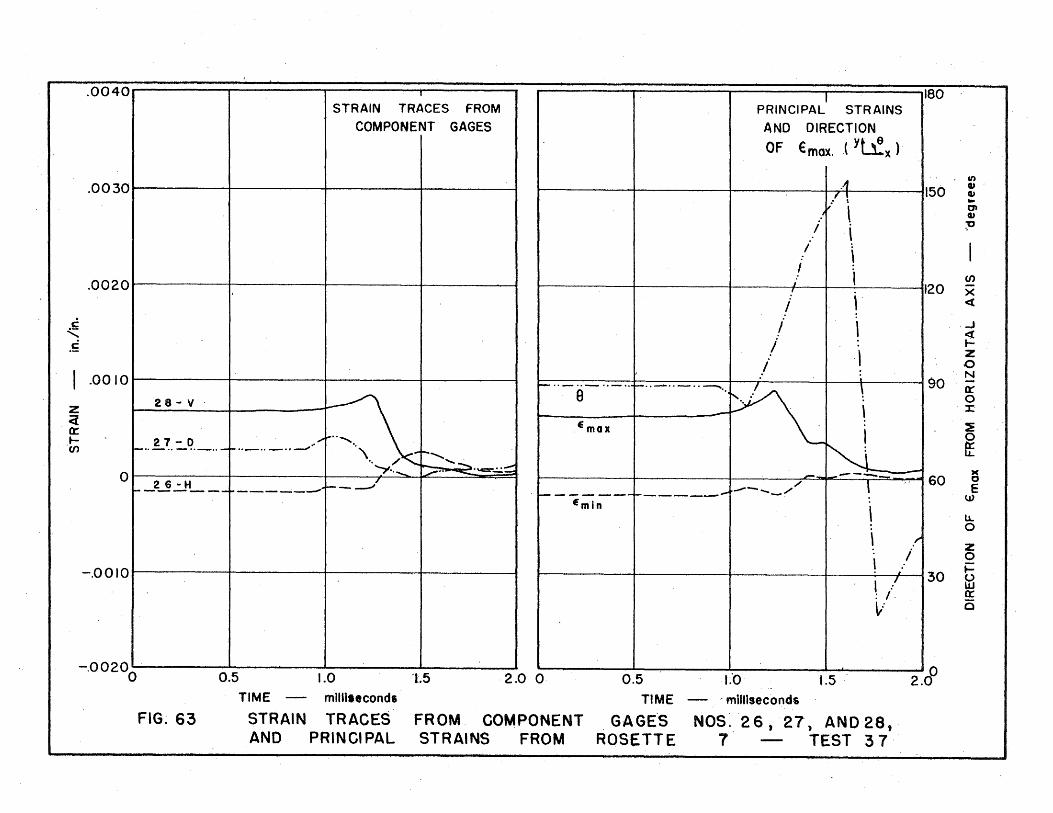
C
"' .S
z <i Q: Ien
.0040 STRAIN TRACES FROM
COMPONENT GAGES
.0030~1---------+--------~----------r-------~
.0020
.0010
28-V
21 =-~._ .. -+ .. _ .. _.,--, .. 1-',-"
0 1 2 6 _ H . I .~ .... _u .. _ .. ~____ ]0:- ---,,' J...-----~-------'
-.0 a 10 t-I --------t------t----'----..,..;------I
I
I
Enlill
-.002°0 0.5 1.0 "L5 2.0 0 0.5 TIME
FIG~ 63 TIME - millisecond,
STRAIN TRACES AND PRINCIPAL
FROM COMPONENT STRAINS FROM
GAGE'S ROSETTE
1.0
I PRINCI PAL STR AINS
AND DIRECTION Y • .,9 OF €max . .( L.J.x)
i I
1.5 , mUlisecond$
NOS.'26, 27, AND28" 7' TEST 37
180
2.&
II) Q) ~ ... '" ~ "'P
en >< <l
..J « I-Z o N
cr o :3:'
:e ~
)( o E
w
LL o Z o t= frl Q:
a

c
"' .£
z <i a:: tCJ)
.0040 STRAIN TRACES FROM
COMPONENT GAGES
.00301~----------~--------r---------r---~---~
.0020
.0010
31-'V ~
32- 0 .-1 "-"- "1"\ r"-"-"-' r'/ "-.--' '. ......-=-;-; -,,",-- --
\ /- .......
""'"' o I I 1 "'-L. .. / L-_~':"'~_+-___ / ' -- ~
r-- _____ __
-.OOIOrl----------+----------+----------~---------;
I I I I
I PRINCIPAL STRAINS
AND DIRECtION Y .... 9
OF € max. ( LJ...x)
180
r----------r---------4----------~--------~1150
9
[ --;---~
Em a x
,/
I------t--- +- /" E , -- /
ml n '-
\
\ }.. ..
_ .......
::::r:=
7.190
\ j \ "J'
_ ==----160
r-----------r-----~----+-----------+---------~130
I I I I I -,002°0 . 0.5 1.0 1.5 2.0 0 0.5 ' 1."0 1.5 2~00 TIME milliseconds TIME milliseconds
FIG. 64 STRAIN TRACES FROM COMPONENT GAGES. NOS. 29 ,:3 2) AND 31, AND PRINCIPAL STRAINS FROM ROSETTE '8 TEST 37
11)
CIJ CIJ ... crt CIJ
"C
(f)
x <{
-' <t tZ o N
Ir o :x:
~ e: ~ E
w
LL o z o t= u W 0: o

.£ .....,.
.5
z ~ a: .... en
.0040~1--------~--------~--~----~~--------
STRAIN TRACES FROM
COMPONENT GAGES
.0030~1--------~----------~--------4---------~
.0020rl--------~r---------~---------4--------~
o L ·1 --------,.1 --'"'... .. .. _ .. --~5-=.~ ___ 1_----/ , _____ _
-.0010 1-1 ------+------I-----t---------I
, 180 PRINCI P~L STR AINS
AND ti\RECTION OF €:I (y ... 8) max. L.l...x
\ 'II 1'50
.1
\
----.1120
- ·90 ~kH--+-t- J
~ ._ .. / ....-.. _ .. _ .. -......... _., /'
9 - .. '-.. ~...
--- I € ma x
1--------+----E min
/
" v/ ~ 60
ill i Wi
--t---1'\,1T Iii 130
\ : : J
\I .:
1.5 -.0020
0 1.0 2.00 0.5
V
2.0 0 1.'0 0.5 1.5
FIG. 65
TIME - milliseconds
STRAIN TRACES AND PRINCIPAL
FROM COMPONENT STRAINS FROM
TI ME - . fY)illiseconds .
GAGES· NOS. 25» 9) AND 10, ROSETTE 9 TEST 3 7
~ QJ .. 0-QJ
'"0
I (f)
X <t
..J <t tZ o N
tt' o J:
:E o cr: lL.
)( o E
w u.. o z o t= frl tt' o

c
"' .S
z <i n:: tm
·00401~---------T--------~----------~---------
STRAIN TRACES FROM
COMPONENT GAGES
.0030rl---------+---c----~----------~------~
I ,180 PRINCIPAL STRAINS'
AND DIRECTION yt- .,9
OF €max. (. Ll..x)
r-------jr------f-----+-----l1150 CI) a" cu ... Ot cu '0
.0020 m ~---------+----------~----------t_--~----~1120 ~
.0010
15 - V
14 - 0 j' ... - .. - ... _ .. - .- ... - .... _ ...
o 30 - H . ~ .. --
_/
-.0010t-1 -----1-----+-----.+------.1
-.002°0 0.5 1.0 1.5 2.0 0 TIME - , millisecond.
FIG. 66 STRAIN TRACES FROM COMPONENT AND PRJNCIPAL STRAINS FROM
0.5
TIME
GAGES -ROSETTE
~ ......
, I 130
1.'0 I.~ 2.00
. milli.second5
NOS. 3 0 J I 4 ,A N 0 I 5 , 10 - TEST 37
-.J <{ tZ o N
Q:' o :C.
~ o ff ~ E
w
LL o Z o ~ frl a: o

c
" .S
·0040 STRAIN TRACES FROM
COMPONENT GAGES
.00301 ,J..- 1-
.00201 A
f 180 PRINCIPAL ST"RAINS
AND DIRECTION , y' ... ~
OF € max. ( u:..x )
150
1\ 120
9
..-r' _ .. ___ .' __ M"" "
\]90 1_ •• -·'-"-" ··_··-......1·/ '-.. ,.....- .. --' \ I .0010 :
' I z Ci 0:: Ien \
. \
20- V ;
~ .. J
//1\ i ~60 /7 \" I l-~mJ..n--_l _____ l/ - \ '-.A-./
"'-f' t- .. I-!..7'-!> .. _ J 1 .. ...- .. ..-/:.. '. .._ .. - .. _ .. f- /-- \
0 1 33 - H I J /' \ I " ~-----+- / \/ ---- V
\ } \ / V
-.0010 It------+-------t------;--------I r-----------r-----------+-----------+---------~130
-.00200 0.5 1.0 1.5 2.0 0
TIME milliseconds
FIG. 67 STRAIN TRACES FROM COMPONENT AND PRINCIPAL STRAINS FROM
0.5
TIME
GAGES ROSETTE
LO milliseconds
1.5
NOS. 33, 19, AND 20, II TEST 37
2.00
en
'" Q) ... at Q)
~
CJ)
)(
ct
...J ~ t-Z .0 ·N
a::-0,' x
~ It
)( o E
w
u. o z o ~ frl ex: 25

.E
" .~
z <i a: t-en
.00401---------~--------------------~---------- I .180 STRAIN TRACES FROM PRINCIPAL STRAINS
COMPONENT GAGES AND DIRECTION
OF Yb! €max. ( x )
en
.0030~1--~----~----~--~--------~--------~ 150 Q,) Q.) .. Ot
.0020 ( ,
~. I Q,)
"0
1\
I \\ ·li20 en x <l
.0010
i 3-V r,:
~~ 2-D .. _ . ./ .. -.. . \ 1--.. _ .. _ .. _.,------ ' \
.,.-.... ..",."",,,- ""- ~ ~
):,\. I : / !
..., - ~ ~ o r I " '- .. _ I-!-H ___ -" ,~ .. .K_
\ ...J ........... <l
t-Z 0 N
90 -«r 1--.,-,,-,,-" 0 :x:
Emax ~ 0 ff
_/".-'- ..... )(
60 0
~~n ____ ~/ e 1 w l '----- LL
0
Z 0
-.0010 t-I -----t-------+-~------4-------I 30 . t; W Q:: 0
-.00200 0.5 1.0 1.5 2.0 0 0.5 1.'0 1.5 2.0
0
TIME - milliseconds
STRAIN TRACES
TIM; miJliseconds
FIG. 68 F60M COMPONENT GAGES NOS. I , 2, AND 3, AND. PRINCIPAL STRAINS FROM ROSETTE I TEST 38

c " .5
.0040 STRAIN TRACES FROM
COMPONENT GAGES
.0030~1--------~----------r---------;---------~
.00201 ~ I
.0010 II ~ 8-V \ ~ . ~ .~/ \ CJ) 7-0 "'" l "_ .. _ .. _,, ,// \ r
oJ/" ,,'\ t\ .. \r\
°r= ____ ::.-:%~- I l.f~~-··'- .. ~ 6-H, I V, ....... , __ /
I 180 PRINCIPAL STRAINS
AND DIRECTION
OF €max. (Yb!x)
r----------+-----------r----------+---------~1150
L--------~--------_t------~_rr_------~l,20 \ I
\ \ \ /". .-.... 90
"".. I ............
Em" . \
8
- 60 /--'
Emln ..... " 1-------
en GJ GJ .. C' G.t
"'0
en X ~
~ <t tZ o ~ 0:: o J:
:::'i! o e: ~ E
w
lJ.. ,0
Z o
-.00101 I' , ~
30 ~
-.00200 0.5 1.0 1.5 2.0 0
TIME - mJlIJsecond,
FIG. 69 STRAIN TRACES FROM COMPONENT AND PRINCIPA'L STRAINS FROM
0.5 TIME
GAGES ROSETTE
1.'0
mlfliseconds
1.5
NOS. 6,7, ANO 8 1
2 TEST 38
'0::
a
2.00

c
" .£
·0040 STRAIN TRACES FROM
COMPONENT GAGES
.0030~1---------+---------4----------~------~
0002°1 1 1 ~ 1 n i \ ,
9 .0010
z .".. /""
"--~max <i
a: t-oo
~
t--....... .-,/ I'
Emin
-.OOIOrl -,..---+-----+-----4-------l
-.00200 0.5
FIG. 70
1.0 1.5 2.0 0
TIME - millisecond.
STRAIN, TRACES' FROM COMPONENT AND . PRINCIPAL STRAINS FROM
0.5,.TIME
GAGES ROSETTE
I PRINCIPAL STRAINS
AND, DIRECTION,
OF €max. (Y~x)
r~/ .. ---.. ,..--...-....... ..
I ; , ; i
""'" \ .. \
: r' \ I . " \ I f \ ~ 1 \~ \ .
. ~~-~
1.'0 milliseconds'
1.5
NOS. II, 12, AND 13, 3 TEST 38
.1180
I/)
150 cu cu ... 0' cu ~
I' 00
120 x <t
...J <t t-Z 0 N
90 tr 0 :I:
~ 0 a::
'lL
)(
60 0 E
w
u.. 0
z 0
30 ~ u w. a:: 0
2.00

.0040 I
PRINCIPAL' 180
STRAIN TRACES FROM STRAINS
COMPONENT GAGES AND DIRECTION
OF y~ € mox. ( x ) I
en .0030 150
Q) Q)
" ... t7t
/\. Q)
"0
l/ \ I \. i .\
(f)
.0020 ; \ 120 x
<{ I
C I \ -.J
" /\ i1\ \-<{
c ..... z
e 0 /., / .. _ ..... , ,N .0010 90 -
V .. ~. \ !--"-"-"--" '.~ y' 0:
L/ 0
Z IS-V / Emax :r.:
<i ./ \ ~ cr: .'/. t- , .. -
\ fE Cf) 17-0 v··---··-·· K'~
!--.. - .. - .. - .. .-/-..., \1' .--........,r-" -,- -.-"--"" .-- )(
0 60 0 /' - ....... JI _
/ .. ~- Emfn I '-J, E ..J-____ _..._ I
~-------/ '
" 1/'--'- W 16-H ' \ /., -- "', ---- \, .. ". ... r LL
0
Z 0
-.0010 30 t= <..> w cr: 0
-.00200
l
2.00
0.5 1.0 1.5 2.0 0 0.5 1.0 1.5 TIME millisecond, TIME milliseconds
FIG. 71 STRAIN TRACES FROM COMPONENT GAGES NOS. 16 , 17, AND 18, AND PRINCIPAL STRAINS FROM ROSETTE 4 TEST 38
-- - --- ---~----

c
"' .E
.0040 STRAIN TRACES FROM
COMPONENT GAGES
.00301~-------+--------~--------~------~
.0020Ir---------r--------~--r-----~~------~
I .0010
z <i 0:: I(f)
23-V
22-0 / .. __ .-.-o /_
--_/
21-H
-.OOIOIt-------+------+------+-----~
I PRINCIPAL STRAINS
AND DIRECTION Y" ... 9 OF €max., ( LJ..x )
180
~--------~--------~--------~------~1I50
120 \ : I I ~'. \ ! \ : "' '. I \ / \; :.1 , i V
~ A
'\ 1\ .. \ i I I '.
: 90
Emox
L-----~~~~--1-lij7~~----~60 Emfn ./ ---
~--------~--------~---------4--------~130
-.00200 \O~5 1.0 1.5 2.0 0 0.5
TIME
.1:0 milnseconds
1.5 2.00
FIG .. 72
TIME -- milliseconds
STRAIN TRACES AND PRINCIPAL
FROM' COMPONENT STRAINS FROM
GAGES ROSETTE
NOS. 21, 22) AND 23, 5 TEST 38
V)
cu GJ .. t7' GJ -0
en x « ...J « tz ·0. N
fr o :t:
~ o a:: IJ..
)( o E
w
\L 'J
Z o ~, u w a: o

.5 "r::
.0040 STRAIN TRACES FROM
COMPONENT GAGES·
.00301~--------~--------~----------~---------i
.0020 rl----------+----------+----------+----------4
J PRINCI PAL STR AINS
AND DIRECTiON Y ... 9'
OF €max. ( w...x)
lao
I . 1150
ft. i \
I ! \ 1120
.: / i \.-A7\' \' e .. ", : \ /
1-.. _ .. -.,-",,- f.{ ___ ·~_ ~. "'~'="""'-- _ ___) iJ .90 I -OOJ0r---~--r_--~--~--~~~~--~
z Ci a: tC/)
5-V
4-0 /A--..., - r~"'r--- t ~ Emln 1// .......,\. . = 60 t-------1 \. ,,/
.. _ ... --.. .-- .. Or-------~~~~~----~~~~~
24-H - - - \,. . ./"-"-....... J
-.0010~1----------+----------+----------+---------~ r---------~~--------~-----------+-----------1130
-.00200 0.5 1.0 1.5 2.0 0
TIME - mlll1second$
FIG. 73 STRAIN TRACES FROM COMPONENT AND PRINCIPAL STRAINS FROM
0.5 1.0 1.5
TIME - milUseconds
GAGES ROSETTE
NOS. 24, 6
4, AND 5, TEST 38
2.00
en
" G> ... C' .~ "0
I _ en X q:
..J .q: tZ o N
t:r o J:
:e o IE
)( o E w
lL. o
Z o t= frl a: o
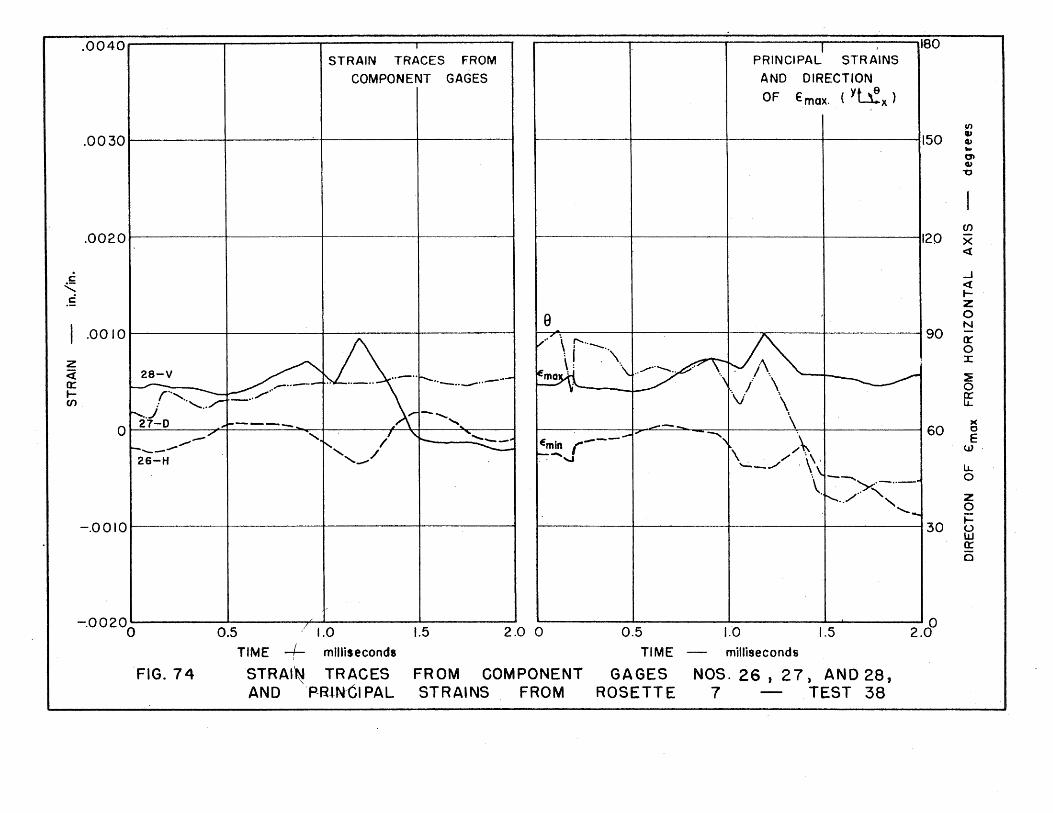
.0040 STRAIN TRACES FROM
COMPONENT GAGES
.0030' . I
I PRINCI PAL STR AINS
AND DIRECTION yt. .. 6
OF €max. ( Ll...x)
laO
~-------+----------r---------+--------~1150
Cf) Q) Q) ... CJ) Q)
~
.0020 en L----+----+----r----i,,20 ~
c:::
"' .~
.0010
z <i 28-V "- / \.-.,-"'-- _,,-a:: ~,.---+'~'.- .. .-'\ I -"-.. _" ~ -,./,.
IA1- ..... ,~ o h. __ 7 "f . / 'F ",::::::::=: ~--- , / 26-H , ___
-.0 0 I 0 ...... -----+--------+---------l---------t r----------+--------~----------+---------I130
-.0020~ I , ,. I I I I I I I I
2~00 0.5 / 1,0 1.5 2,0 0 0.5 1.'0 /.5
TIME + milliseconds TIME milliseconds
FIG. 74 STRAI~ TRACES FROM COMPONENT GAGES NOS. 26,27, AND 28, AND ~!N/CIPAL STRAINS FROM ROSETTE 7 TEST 38
...J <t tZ o N
tr o 'x ~ o ex: IJ...
)( c E
w
IJ... o Z o ~ u w a:: a
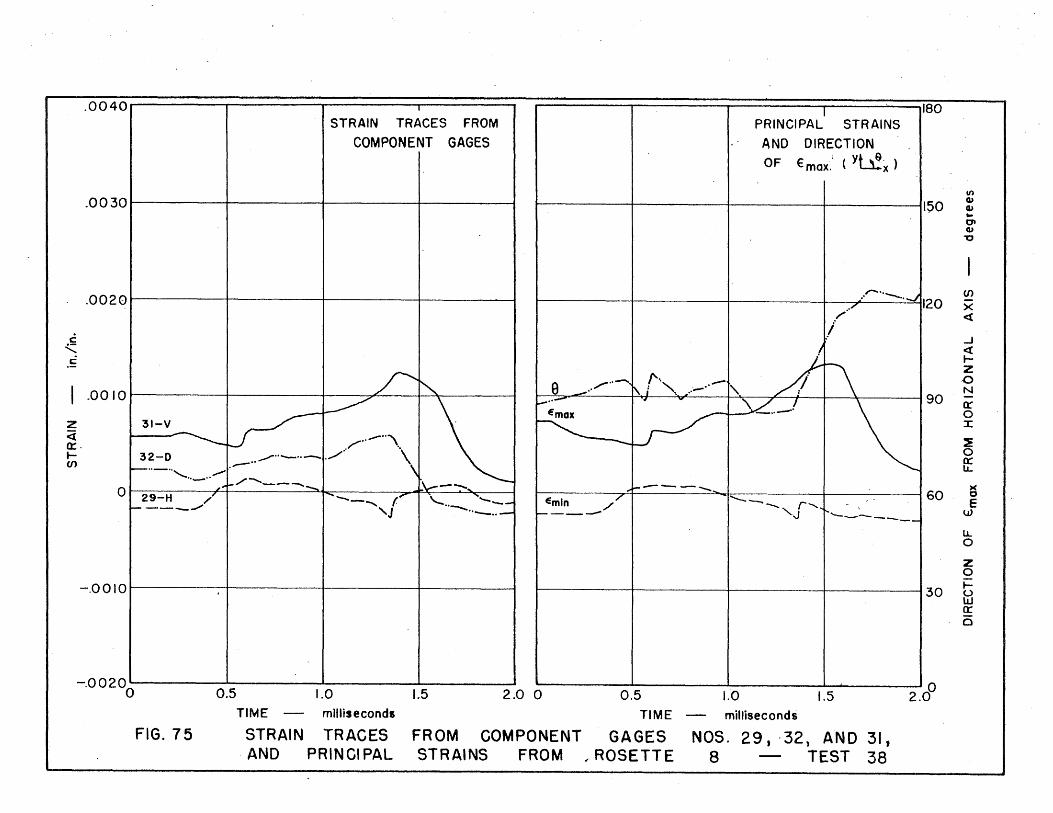
c
" . =
·0040 STRAIN TRACES FROM
COMPONENT GAGES
.oo3o1r---------+---------~--------~--------~
.0020~1 ---------+--------~--------~r_------~
I .0010
z <i 0:::. t(/)
,-"", r" \ ----.. _ .. - ./., \ 32-0 \
l\---:--... a [29-H /' I -r---....... (7"1 ',-.. ~ ......... _-
--_./ 'J "-.. -
-.0 a 10 t-I ------+-----+--------+-------__1
,-- .180 PRINCIPAL STRAINS
AND DIRECTION I y~ .. ~
OF € max. ( L.l...x)
t--------~--------~---------+----------III~O
! .I
.' : "-_.,, I
/'
~··"··--·-.l1I20 . .7
! I \]90 Emax - .. -
e /"-1 /', -t /1\ . - ~ \~.I., '. i
-- -- It· 160 tErnl• /T '-------,I' --.:.....:..:. ___ _ P----
t-------4---------~---------+----------I130
-.00200 0.5 1.0 1.5 2.0 0 0.5
TIME
1.0 milliseconds
1.5 2.00
FIG. 75 TIME - milliseconds
STRAIN TRACES . AND PRINCIPAL
FROM COMPONENT GAGES NOS. 29, ·32, AND 31, STRAINS FROM r ROSETTE 8 TEST 38
en Cl) Cl) ... C1I cu "0
en )( <{
...J <{ tZ o N
cr o :x: ~ o e:
)( o e
w
lJ... o Z o ~ u W 0:: o

c
" .~
·0040 STRAIN TRACES FROM
COMPONENT GAGES
. 0030~1--------~--------~--------+-------~
.. 0020rl---------;---------+--------~-------~
.0010
z ~ . 0::: •. _ •• .-'" t-
...-" ~ _.. ',--.' /-.... C/) _.. \ .. - .. -........ .. _ .. " ",."..----'
-J~\.. /\. /
o L ·V- l-v I' i ~ ------ / \ I \"'-25-H. \ J "-
" '-
-.00 10 t-I -----+-------t---------'I-----~
I ,180 PRINCIPAL STRAINS
AND DIRECTION
OF € max.- (Yll!x)
r---------~---------r--------~--------~1150
r------+------+------+----,..---I1120
8
.. ,...... .. " / .. ./
9".o-_ .. [' .. ~!:/ J--"~
Emox "'-
/-...../'.1 ,. "--/ ..... ,,
~mln ______ .L../"""'" ..,... ~J
\ \
!
71 90
./' I
\ \ \
---+-"~-,I 60 1\ \ / " \ It, \ "f '-\ I \ I 'v 130
-.00200 0.5 1.0 1.5
, 1 '. I 10 2.0 0 0.5 1.0 1.5 2.0
FIG. 76
TIME - millisecondl
STRAIN TRACES AND PRINCIPAL
FROM· COMPONENT STRAINS FROM
TI ME milliseconds
GAGES ROSETTE
NOS. 25, 9
9 ) AND 10, TEST 38
Cf) .. OJ ... c;, .. ~
CJ)
x ~
...i <! t-Z 0 N
(t'
0 ::r::
::! 0 a::: LL .
)( 0
IE _w
lL. 0
Z 0 ~ frl 0::: 0

.0040 STRAIN TRACES FROM
COMPONENT GAGES-
.0030~1--------~----~--~--------~--------~
.00201 . 1 A 1
c::
" .~
.0010
Z .15-V <i L-____ ......... _ .. _ .. __ .'
~ 14-0 /~ ~ "-"-"-.
o 30-H ,/ -----
,~ . \ I ~
: \ I ~
-.0010 .1 --~--+-----+-~-----i~ ___ --J
I 1180 PRINCIPAL STRAINS
AND DIRECTION Y • .,9
OF €max. ( w...x)
r---------~--------r---------~------~1I50
r-------~--------r-----4-+4------~120
L--------k---~--_t~~~t_t_----_;·~l90 . / 8 ./. \ j' >-'E-;;';';-"~ \ /
r--, \ / ~----~t U, - \ I ,)mm - .'~ 60
\J \: i \, (-f. fJ "--.... f' .-.J: --\ I I / \ ------130
Emin ./ 1--------/
I
V
-.00200 0.5 1.0 1.5
, , I I 10 2.0 0 0.5 1.0 1.5 2.0
FIG.77
TIME - milliseconds
STRAIN TRACES AND \ PRINCI PAL
FROM COMPONENT STRAINS FROM
TI ME milliseconds
GAGES NOS. 30, 14, AND 15,. ROSETTE 10 TEST 38
I/)
cv cv 0' cv
"C
(f)
X <t
..J <{ ..... z o· N
cr o :I:
:E o a:: lL.
)( o E
w
u. o z o ~ u w cr o
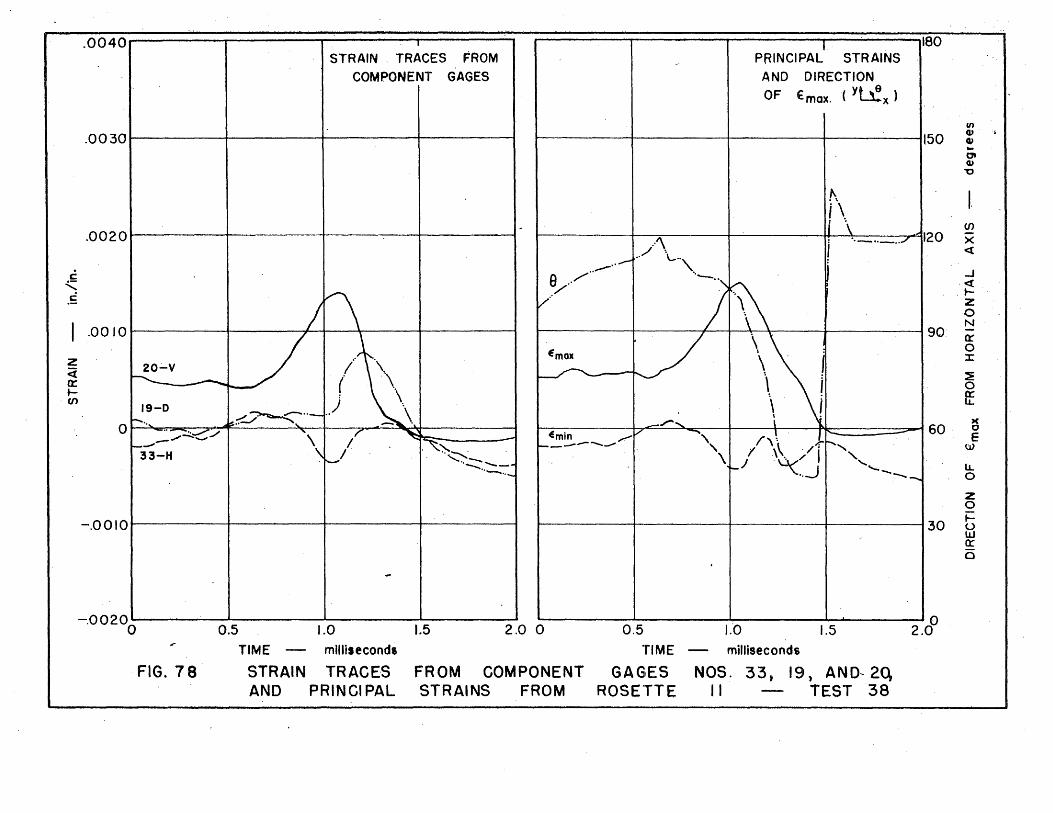
-. .0040 I I. 180
STRAIN. TRACES FROM - PRINCIPAL STRAINS
COMPONENT GAGES AND DIRECTION
OF y~ €mox.( x )
fI)
. 0030 150 cv . cv ... at cv "0
!\ I. .\ I . Ii \ (f)
.0020 /\ "-"-"/ 120 x /' ; <t
.. ....-.. ...-- .' \'-"'\ .. ..J c
9/.·/ / " r\\ <{
.S i\ .f-
I v/ Z
0
I .0010 N
90 -
J J \ tr
Emox I
i 0
z .' \ :r: <i 20-V I \
~ -i'-.. _.--.... ( \ \. ~
0: I 0 t- .\ fE en 19-0 .. ) \ i
r-.... /~ .. - \ \ )(
0 ~;.:::....,/ .... - " _/" .......
60 0 -.. :,.~~./ '\ I/' ~ fmln /" ", r\ \. 1- "- E - - .,,-fo--- \ ,~~::--....- . ~------ " I .\\ / i ...... , w 33-H ._/ \ "-. "-. .. --"""- ) .~/ ' ...... -..... - LL .. _ .. - '- .. -.J ---- 0
Z 0
-.0010 30 t= u W 0: 0
--.0020
0 0.5 1.0 1.5 2.0 a 0.5 La 1.5 0
2.0 .,...
TIME milliseconds TIME - milliseconds -FIG. 78 STRAIN TRACES FROM COMPONENT GAGES NOS. 33, 19) AND,20,
AND PRINCIPAL STRAINS FROM ROSETTE II - TEST 38 - ~--

·0040 STRAIN TRACES FROM
COMPONENT GAGES
.00301~--------~--------~--------+-------~
- , , .1 PRINCIPAL STRAINS
AND DIRECTION y ... 9'
OF €max. (Ll.~)
180
t----------~~~----_r--------_4--~----~, 1150 CI) QJ QJ ~
0' CII ~
.00201r---------+---------~--------~--------~ CJ) L-----t-----t---...:...---i----:1120 ~
c:
" .S
z Ci a: ..... (/)
.00/0 \.
3-V \.
\. Emox
\'0 L.-
a '" [ .. - ............ _ .. .1-- .. _ .. _ .. _.:::, ......... - -- - +-",,- -..,..
/ ........ /., '-"-"-,,"- ",
.'
.,/' 90
--,
\ \ : 60 \.; L .. .J/""-
"\ ,-~-- --\,../ ---./
-.00 10 t-I --------t-------+------+----~ r-------~-----;------+------~·~130
"-0020 I I , I I I I
2~00 . 0 0.5 1.0 1.5 2.0 0 0.5 1.'0 1.5 TIME milliseconds TIME milliseconds
FIG. 79 STRAIN TRACES FROM COMPONENT GAGES NOS. , 2 ) AND 3, AND PRINCIPAL STRAINS FROM ROSETTE TEST 39
...J « t-z o N
tr o ::r: ::!; o e:
)( o E
w
LL o
z o i= u w a:: o

·0040 I I 180 STRAIN TRACES FROM PRINCIPAL STRAINS
COMPONENT GAGES AND DIRECTION
OF y~' €max. ( x')
I/)
.0030 150 Q.I Q.I ... 0' cv
"U
CJ)
.0020 120 x I <t
.. ---" ...J' ./
c .J 'oo~
.. J' ", .:.::: 'v' . r-"'--". ...- .. - <t C (\ / \
t-/ z
r--.8 ./' \ / 0 N
.0010 90 --) 0\\
oc
) /~ ! 0
z 8-V Emax J: : \ ~ I :tt _oo_j 00
~ a: \ ~--
0 t- cr: Cf) 7-0 '.
~ l.I-_ .. _ .. _ .. _.'
~ \ /' -"'-, ~
/ .......... '. )(
0 6-H ,/ \ ./ ". '-"","" /' " - \
60. 0 E
-~/ '---~ .. i--' . _ .. _ .. _ ..• Emin /' " ~/ r ........ - ....... w V/ - - --...-- ........ , ------ \
if __ --................ -""" ... '- ......-'1 lL.
0
Z 0
-.0010 30 ~ u w a: 0
-.00200 0.5 1.0 1.5 2.0 0 0.5 1.'0 1.5
0 2.0
TIME . millitecond$ TIME milliseconds
FIG. 80 STRAIN TRACES FROM COMPONENT GAGES NOS. 6, 7) AND 8 , AND PRINCIPAL STRAINS FROM ROSETTE 2 TEST 39

c: .:.:: .E
z <i a:: ten
.0040 STRAIN TRACES FROM
COMPONENT GAGES
.0030rl ---------+--------~--------~~------~
.0020
.0010
.13-V
1\ /
J
'\ \
o ... ----~~ . ~~ I. .--~ (" J..--- '. " 11- H i", _ .. '- _......;
12- 0 --:1'-" r \. \ 1--.. - .. _.....--... ~ ./.' ~~--.... ~ ."...
.......... -, -....-. .. --
-.OOIOlr------t-----i-------+------I
1 PRINCIPAL STRAINS
AND DIRECTION Y ... 9 OF €max. ( Ll.x )
180
r----------+----------+-~-------+----------~1150
!'.
e Ii
E max 90
.,...-r--' \ ~7m~/ . "~r=-~\7!'t-~--J60
I .-'. . \ :
'. I \ : ~ 130
-.0020 .0 0.5 1.0 1.5 2.0 0 0.5
TIME
1:0
milliseconds
1.5 2.00
TIME - millisecond.
FIG. 81 STRAIN TRACES AND PRINCIPAL
FROM COMPONENT STRAINS FROM
GAGES ROSETTE
NOS. II , 12). AND 13, 3 TEST 39
en Q) cu ... 0' cu ~
(f)
X <t
..J <t r.:. Z o N
cr o :x: ~ o ff
)(
o E
w
IJ.. o
Z o ~ frl 0:: a

~--.~--
.0040 I I 180 STRAIN TRACES FROM PRINCIPAL STRAINS
-COMPONENT GAGES AND DIRECTION
OF y~ €max. (x) I
I/)
.0030 150 (I) Q) ~
~ ~\ C' (I)
"'0
/\/ i', I CJ)
,0020 .""' 120
/ oJ ~i \ ' ,-,,/ '. X
',/ "- <(
1 .I \: ~, " ." / ..J' c
/ ) \ ! <{ .:.;:: ,,/ "/ .S 1\ '-. t-
I : I z : 9 0
... , : , N I .0010 '/ .
90 -
~/t ""'.,_ .. ' .. .,...'
/ 1 ~ Q:' 0
Z IS-V Emax It :r: <i
/~ :~ ~ 0: -I ' . v-- -----... - 0 t- 11- 0 ."-" V \H ~ ex:: en ,,-,,~' . \ I It--- LL ~., ..
/" \ I: f' ,// V '. l\. __ ...... ./ \ ~r )( 0 60 0 -- --'~ .. -" .... -~:.:. -- 1--- ....... \ !: I ,---- r-- . E I---J'S-H € mtn \'1 I.
""""--------.,;., (J)
V u.. 0
z 0
-.0010 30 t= u W 0: 0
-.00200 0,5 1.0 1.5 2.0 0 0,5 1.0 1.5 2.0
0
TIME - milliseconds TIME - milliseconds
FIG. 82 STRAIN TR'ACES FROM COMPONENT GAGES NOS, I 6 , I 7 , AND I 8 , AND PRINCIPAL STRAINS FROM ROSETTE 4 - TEST39

c: ~ C
z <i a:: t-en
·0040 STRAIN TRACES FROM
COMPONENT GAGES
.oo3o1r-------~--------~---------+--------~
.0020
.0010
0
A
11 \
23- V /1 I ~
22-0 .-.. ./ .~ .. - .. -./ .. ' \\ ......... - .. -. ./ ~
.• /.... \ I ". f--- "-,,, /..}--
-_/ 21- H
\ -,--~- -- \' "-
\! \-~r·-:-.- .. _ .. _ 1'--.--
" '----.00 10 It------r------r----~-+__---__I
I PRINCIPAL STRAINS
AND DIRECTION Y ... 9
OF €mox. ( u...x)
180
~--------~---------4----------+---------~1150
8
:f""'"
./ J
'-", . '\. .. _ .. -.. ......,
90
E max 60
1-- ~ ..... E -_//
min
~--------~---------4----------+----------4130
-.00200 0.5 1.0 1.5 2.0 0 0.5
TIME
1.0
milliseconds
1.5 2.00
FIG. 83 TIME - milliseconds
STRAIN TRACES· AND PRINCIPAL
FROM COMPONENT STRAINS' FROM
GAGES ROSETTE
NOS. 21 ,22, AND 23, 5 TEST 39
If)
cv cv ..,; C'I cv "0
CJ)
x ~
..J « tZ o N
cr o :x: ~ o cr: lL
)( c E
w
lL o z o ~ u W 0:: o

-
.0040 I I 180 STRAIN TRACES. FROM PRINCIPAL STRAINS
COMPONENT GAGES AND DIRECTION
OF y~ €max-, ( x ) . i1 U)
.0030 150 ~ QJ
\ ...
I 0\ Q)
I \ 'lJ
, \ I I L,/\ .f/) .0020
\. 120 x I " -'"'""\, <t
/~ "
X ',,-,,, '. -I c
I'--"-"-~:" <t .:.::: '\ t-.S
/~ ", z 0
I .0010 ·N 90 -
j\ "'~ ~IL Q:'
/ r- 0 z
~ ~m·~V ::I: <i ~ \ - -~
~ a:: \ 0 t- /' I \ \ oc f/) r-~-D"./'·
\ lL. '\JlX ~.- .. -~ ~------ -. /1 ~/
r-- ,._., _ .. '" I _ __ .--' ---- - - .-:-. '-------: /--~ ........ )( 0 60 c
24-H .,// : '"",,-~" ~J: I '.....,/ E -- ......... -"~ : / Em1n /'" , I w ~: . ~----- 1/ ~-
V LL-0
Z 0
-,0010 30 t= <..> w cr Q
-.00200 0.5 1.0 1.5 2.0 0 0.5 La 1.5 2.0
0
TIME _. milliseconds TIME - milliseconds ...
FIG. 84 STRAIN TRACES FROM COMPONENT GAGES NOS.24, 4 ) AND 5, AND PRINCIPAL STRAINS FROM ROSETTE 6 - TEST 3 g.

·0040 I I 180 STRAIN TRACES FROM PRINCIPAL STRAINS
COMPONENT GAGES ' AND DIRECTION
OF y~ Emox. { x } -
/ .. -.,--'\ '\
en
.0030 150 ClJ
/ ClJ
\ .. 0'\
r , \ ClJ
. i "C
! \
i I i (J)
.0020 J '. 120 X
-j <{
\
~ c:
(\ I~/~ ...J
" \ <t t-. .5 \ I : Z
e : \ 0 i I '. N
.0010 '-"-"- 90 -):1 ". /f V \
~ \ cr '" I I : 0
Z 28-~ ../~ ~ \ J: "., \ n ,,-1 <i re- I ~ ./ '. \ E. \ a:: .,/ \ \ max 0 t- \ fE Cf) 21-~ .. / /","1 ' IA..." '" \ 1--"-,, /' --l.,J
!'.. .. - .. - .. -.~ : !
............. -/ .... / " "'""-;
" .... 1/- --..L-/ I )(
0 i .' -" ~--' -- " ...- 60 0
"" \/ .. / // l-/ \ : l=---. ....
E 26-H _/ 1----- ----~....".,
\ .1 w 'min \ '\j u..
'\ 0
z 0
-.0010 30 i= u w cr 0
-.00200 0.5 1.0 1.5 2.0 0 0.5 1.-0 1.5 2.0
0
TIME milliseconds TIME milliseconds
FIG. 8·5 STRAIN TRACES FROM COMPONENT GAGES NOS. 2 6 , 27, AND 28, AND PRINCIPAL STRAINS FROM ROSETTE 7 TEST 39

c
"' .E
z <i a:: .... CJ)
.0040 r ~--~180
STRAIN TRACES· FROM PRINel PAL STR AlNS
COMPONENT GAGES AND DIRECTION
.0030~1----------~--------~---------;----------;
OF €max. (Y~x)
(~ I I ~ ; '.150 e . \ ~ rJ" \ ~
i ' ./\.
.0020r.----------+----------+----------4---------~ . w
(. \ 120 I x , ~
I ~ ! ~
.0010 / ~
9 _.d'· 90 ~ lr o ::c 31- V
32-0 ...-.. - .. -"
o ./ ./
- ------29-H
Emax'" ~ // a::
/ ~ /
)(
/ - 60 E ~---- W
E min LL o Z o
-.00 lOr I ------t-----+------+-----~ ~----t30 t; W a::
-.00200 0.5
FIG. 86
1.0
TIME - millisecondl
STRAIN TRACES AND PRINCIPAL
1.5 2.0 0
FROM COMPONENT STRAINS FROM
0.5
TIME
GAGES ROSETTE
1:0
milliseconds
1.5
\ 5 ""-"- •• -- •• -......J
2.00
NOS. 2 9 , 3 2 , AND 31 , 8 TEST 3 9

.0040~1--------~--------~----------~------~
STRAIN TRACES FROM
COMPONENT GAGES
.0030r�----------~---------+----------+----------;
I PRINCIPAL STRAINS
AND DIRECTION Y • ..,6
OF € max. ( Ll..x)
180
r----------r--------~----------4---------~1150 C/)
Cb Cb -0\ (l)
"0
.0020rl----------+----------+------~--+----------1 m L----------+-----------r----------~--------- 11120 ~
c
" c
I .0010
z <i 0:: .-en
IO-V :
/ 9- D .. _-V" ........
1--"-"- "_ .. _
o .,..,--.. - - r l- - ../ 'I/"''''-- - -i-___ --25- H '( V
e 90
60
'-I - - -------~
-.OOIOrl-----------+----------+----------+----------1 r---------~~~-------4------·-----+----------~130
-.00200 ! .' ! I I ! I I '0
0-.5 1.0 1.5 2.0 0 0.5 1.0 1.5 2.0 TIME millis e conds TIME milliseconds
FIG. 87 STRAIN TRACES FROM COMPONENT GAGES NOS. 25, 9 , AND I 0 , AND PRINCIPAL STRAINS FROM ROSETTE 9 TEST 39
-I <t tZ o N
cr o ::r:
~ o a: LL
)( o E
w
lJ... o
z o ~ () W 0:: o
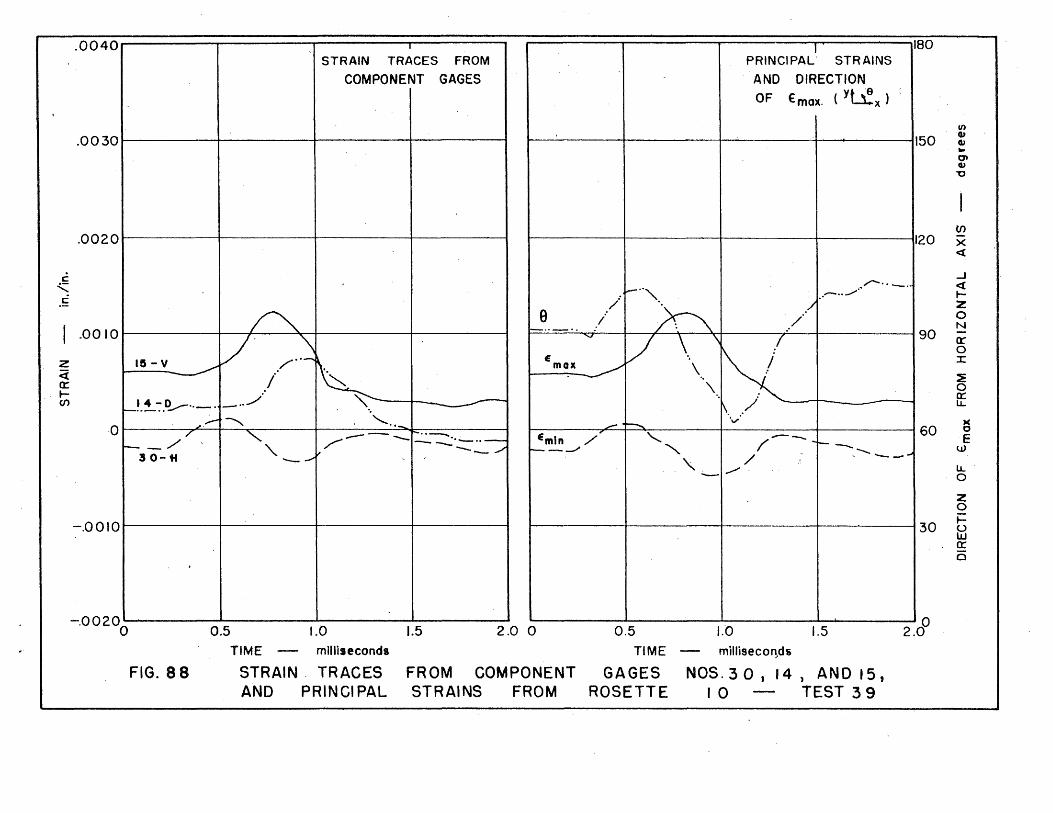
·0040 I I 180 STRAIN TRACES FROM PRINCIPAL" STRAINS
COMPONENT GAGES AND DIRECTION OF y~' €max, ( x)'
If)
.0030 150 Q,J Q,J ... 0-cv ~
tn .0020 120 x
«
c ..J
"' : -"", ~"- .. <! ...-.. ./.- r-c .- /
~ ./ :z
.~ e i / 0 N
,0010 -"-'. : 90 -
/" /.~ '" / \. \
~ tr 0
I~-V~
~ E :J: Z max ~ \. <i I . - ~
Il: '\" 0 .r- _ .. ",/ " - ----- cr
Cf) -~,~:.ty .. -. ~ .. ,/ lJ..
L'':- """" , ....... ,- r-.... 'v )(
·0 60 0 /"
'" /----- r- .• _ Em1" "- 1'--- E -_/ ' ---- -----=. ---- .. - ./ to- __ ---_/ r-- ---" "" w
30- tt -- ~ / -,' ,""'----'
"- .,,/' . LL - 0
Z 0
-.0010 30 t= u W Il: 0
-.00200 0.5 1.0 1.5 2.0 0 0.5 1.0 1.5 2.0
0
TIME milliseconds TIME millisecof1ds
FIG. 88 STRAIN. TRACES FROM COMPONENT GAGES NOS.30 , 14, AND 15, AND PRINCIPAL STRAINS FROM ROSETTE 10 TEST 39

·0040 I I 180 STRAIN TRACES FROM PRINCIPAL STRAINS
COMPONENT GAGES AND DIRECTION
OF y~ €max. ( x )
(/)
.0030 150 CLI CLI ~
at CLI ~
(f)
.0020 120 x cd:
c r·· ... ...J
'= j -4 c:: I-
~ /"X ~ z
/ / 0 .. /" '. /' N .0010 90 -
/ / .. , _ .. _ .. -..
/ \\.~ I Q:'
~ --./'-- I 0 :r: z 20-V
.. J <i -E mox ~ a:: . / 0
I- 19- 0 "-"_ . / \ . ~----
0:: CJ) 1-- 00
-"
._ .. --..... .. /. ~ ./ " I LL
\ :
- .. - "'- ~ .. ' • .-" ...J )(
0 60 0 33-H __ / ... ", // r-- __ -" ." ----" """'- r t-- -..... E f--- -- ">
-- :::: . ..:....- ----- "" / ------- w _../ Emin
... 1- ______
LL 0
Z 0
-.0010 30 ~ u W 0:: a
-.00200 0.5 1.0 1.5 2.0 0 0.5 1.0 1.5 2.0
0
TIME milliseconds TIME milliseconds
FIG.89 STRAIN TRACES FROM COMPONENT GAGES NOS, 3 3, 19 ) AND20, AND PRINCIPAL STRAINS FROM ROSETTE I I TEST 39

c ........
0.0060 _---_----.....,.-----.,..-----'---~------r------"
0.0050~------~--------~--------+-------~--------~------~
. = 0.0040 ~-----+------+-------+-----"7'f~----+-------t
z <i 0:: ten
'0 z 0:: a..
0.0030 1------4-----+--------;'f----,----4------+-------f
. .
::!: 0.0020 ~-----+-------;:~----+-------+-------+----~ ::::> ~ )(
< ~ t= •
0.00 I 0 ~---.-. 7'F------l------+--------f--------i~-------t . •
o~------~----~--~--------~------~--------~------~ o
. FIG. 90
0.0010· 0.0020 0.0030 0.0040 0.0050
MAXIMUM VERTICAL STRAIN - in./ In.
COMPARISON OF MAXIMUM PRINCIPAL AND
VERTICAL STRAIN MAGNITUDES
0.0060

9
. 8
0 TEST 35 . .
c 7 · . w a:: ::::> ~ <.) 6 « a: u. . 0 z «
• w 5 ~ . ~ • · w (f) 0 • a: · · • z .
• UJ 4 lJJ
. ~ · I-W CD . •
W (.)
z « 3 I-CJ)
. . .
a · · ·
• . 2 . . . .
• .. • · . .
• . . "
. ®
~~ ~)
® . .
.001 . 002 .003 .004 .005 .006 MAXIMUM PRINCIPAL STRAIN - in.lin.
FIG.91 MAXIMUM PRINCIPAL STRAIN VERSUS DISTANCE BETWEEN ROSETTE AND FRACTURE

c I
lJJ n: ::> tu ct 0: lJ..
o Z <t
W ltW Cf)
o Q::
z w w ~ tW m
w u z ct tCf)
Q
10 I ROSETTES LOCATED 8 (0) AND
15 ( • ) IN. FROM
INI TlATION EDGE
8 1-1 -----+------1 \ ROSETTES LOCATED 22 IN.
FROM INITIATION EDGE
61 \ \ I
41 '\ \ I ~ \.
21 0\ \ I \-
-.1
L o ,-' ____ ---IL....-____ -'
o 0.002 0.004 0 0·002 0·004 0·006 0
MAXIMUM PRINCIPAL STRAIN in. / in.
T ROSETTES LOCATED 29 IN.
FROM INITIATION EDGE
\
.\
~
.\
.-
0·002 0.004 0.006
FIG. 92 MAXIMUM PRINCIPAL STRAIN VERSUS DISTANCE BETWEEN ROSETTE AND FRACTURE

1°1 I ROSETTES LOCATED 36 ROSETTES LOCATED 43 (0)
IN. FROM INITIATION EDGE AND 50 ( • ) ·IN. FROM
C INITIATION EDGE
8 w 0:: ::> ..... (.) <l 0:: LA..
0 6
0\ z <l
W ..... ..... W C/) . 0 0:: 4 . z w w ~ ~ w m w 2 (.) Z <l ~
I. en 0
\~ @
O~'--------~----------~--------~ o 0.002 0.004 0.006 0 0.002 0.004 0.006
MAXIMUM PRINCIPAL STRAIN - in.! in.
FIG. 93 MAXIMUM PRINCIPAL STRAIN VERSUS DISTANCE BETWEEN ·ROSETTE AND FRACTURE
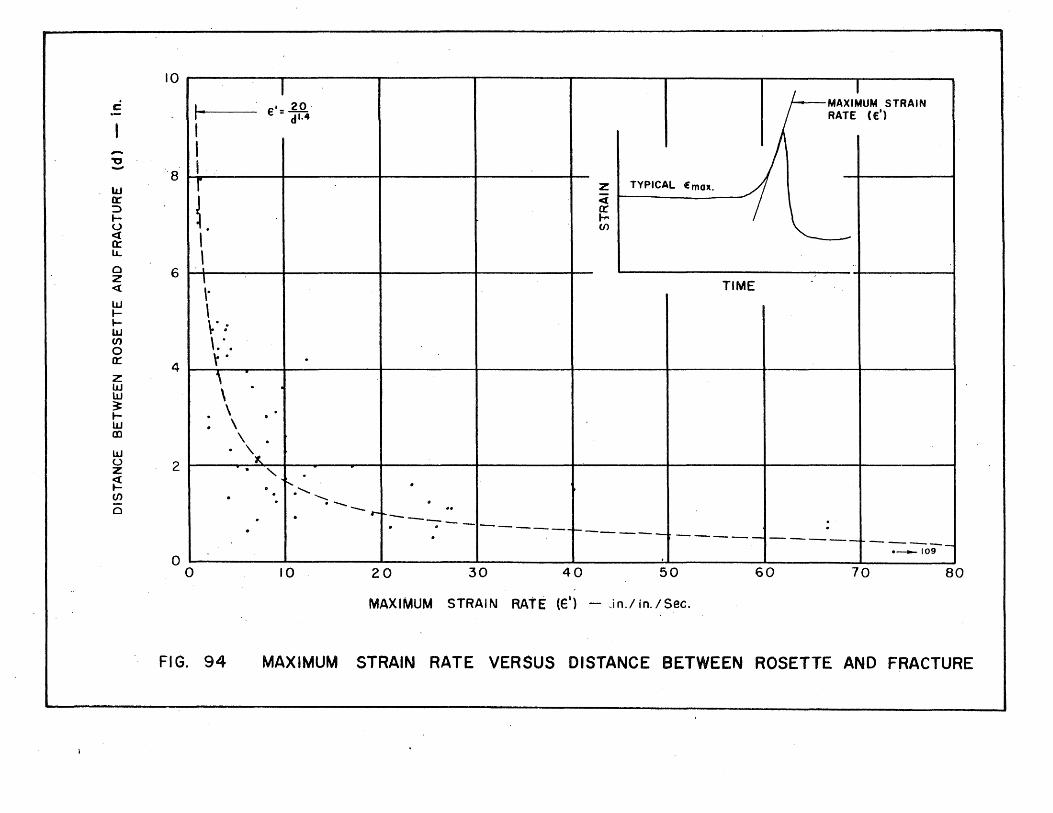
10 I I
.: I .. I 20· MAXIMUM STRAIN
I € = df.4 RATE (E')
- I '"0 - '8 lLJ fr ::> I-0
I r z TYPICAL Emolt.
t Ci cr t-(f)
<t 0:
, -IJ...
a 6 z <t
W l-
\ I
• I !
\ TIME ,. \
I-W
~. : en 0 0:
4 z w w ~ t-W
\: . ~ . . , · \
. . . \ · . . \
m \ · w 2 u
z ~ en
. '\~ · "- .
· r-.... . . . .' .......... . . ~ . a --r- .. . . --. --:--------- .
· ~-----. ----- ---_.- -----• __ 109
o o 10 20 30 40 50 60 70 80
MAXIMUM STRAIN RATE (ell - In.l in. / Sec.
FIG. 94 MAXIMUM STRAIN RATE VERSUS DISTANCE BETWEEN ROSETTE AND FRACTURE

16 z
'W 0: ::J ~ 8 u ~ a:: lL.
~ 0
~~ m
a: o
w > o m <t
LlJ U Z <{ tCf)
a
-8
-16
o
I J
I· I I I I I I~ I~
t 730 (37-8)
00 ~ 950 (37-4) . r-00
,0 n 660 (37- 2)
\Slo~ 850{37-~O + 650 (37-3) o 6 00
+ 800 (33-C) NOTE: TEST LOAD STRAIN ~ + 600.
STRAIN UNITS IN./IN. X 106
/
TEST NO ROSETTE· N
I 570 (38-r o. ~ 660 (37-7)
+ 470 (38-7)
• 670 (37-6) 630 (34-I) 560 (38-4) 560 (38-6) 620 (37-5)
~ 780 (34-E)
640(33-8) 630 (37-1) 570 (39-e5)
620 (39-8) 620(39-7) 500 (38-5) f 560(38-2)460 (38-1) 670 (34-0) 748 (34-H) 680 (33-0) ~ 65_(~3~3---,f,-,) __ _
. 620(39-5) 590(33-Aan. 600 (3g-4) 470(38-3) 570(38-10) 550 (37-9) t 640 (34-C) + 790(37-11)
t 620(39-1) 530(33-J)
II" 820(34-A8J)~ 610(39-2)
590(39-9) t 590(34-8)
580(39-3) 560(38-11) 580(34-f8K)
590 (39-10) # 600 (39-11)
W: 70 ": NET PLATE WIDTH
560 (38-9)
-t=. ~
I - ·1 ~ I
I I l I
8
FRACTION OF NET PLATE WIDTH (W)
15 22 29 DISTANCE FROM· INITIATION
36
EDGE
43
IN.
o
50 57 64, 72
FIG. 95 MAXIMUM PRINCIPAL STRAIN CONTOURS FOR 8 - IN. CRACK
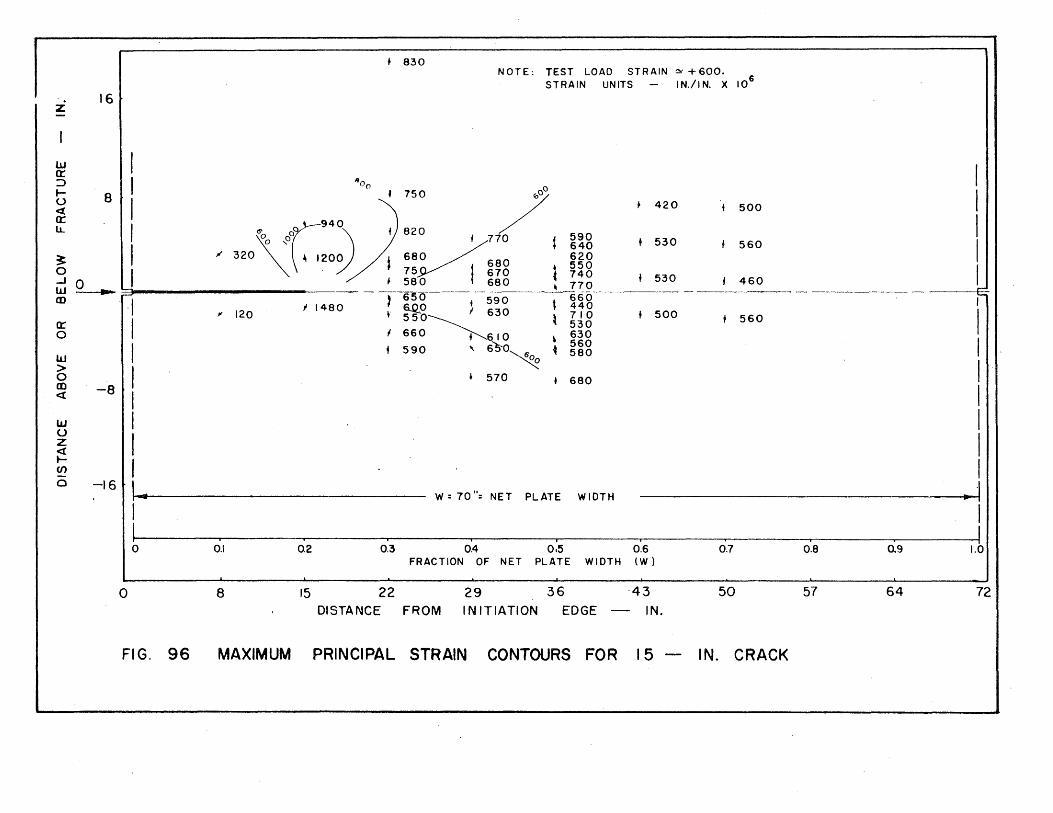
z
lU cr :J ~ U <2: 0:
16
"'00
8
LL I i ~ ~ Cr.94
0
o I "3°,0 ~ ~U 20,\: \ 120~ /'
0: o
LU > o m ~
lIJ U Z <{ t(/)
o
-8
-16
o
". 120 ; 1480
I~
8 15
• 830 NOTE: TEST LOAD STRAIN ~ +600.
STRAIN UNITS IN./IN. X 106
f 750 / f/82~0 I 770 t ~~g
620 680 680 • 550 75 t 670 t 740 580 , 680 ,770 __________ _ --~------ 660 650 t 590 ~ 440
• ~O I 630 ,7 I 0 , 550_________ - , 530
660 ~IO ~ ~~g 590 .... 65'0~6o~ ~ 580
~
420 500
+ 530 f 560
+ 530 f 460
t 500 f 560
i 570 • 680
W = 70 ": NET PL ATE WIDTH
FRACTION OF NET PLATE WIDTH (W)
22 29 36 -43 50 DISTANCE FROM INITIATION EDGE - IN.
FIG. 96 MAXIMUM PRINCIPAL STRAIN CONTOURS FOR 15 - IN. CRACK
57 64
I I I I I
...c:::.
I
I I I I I I I
- .\ ~ I
I I o
72
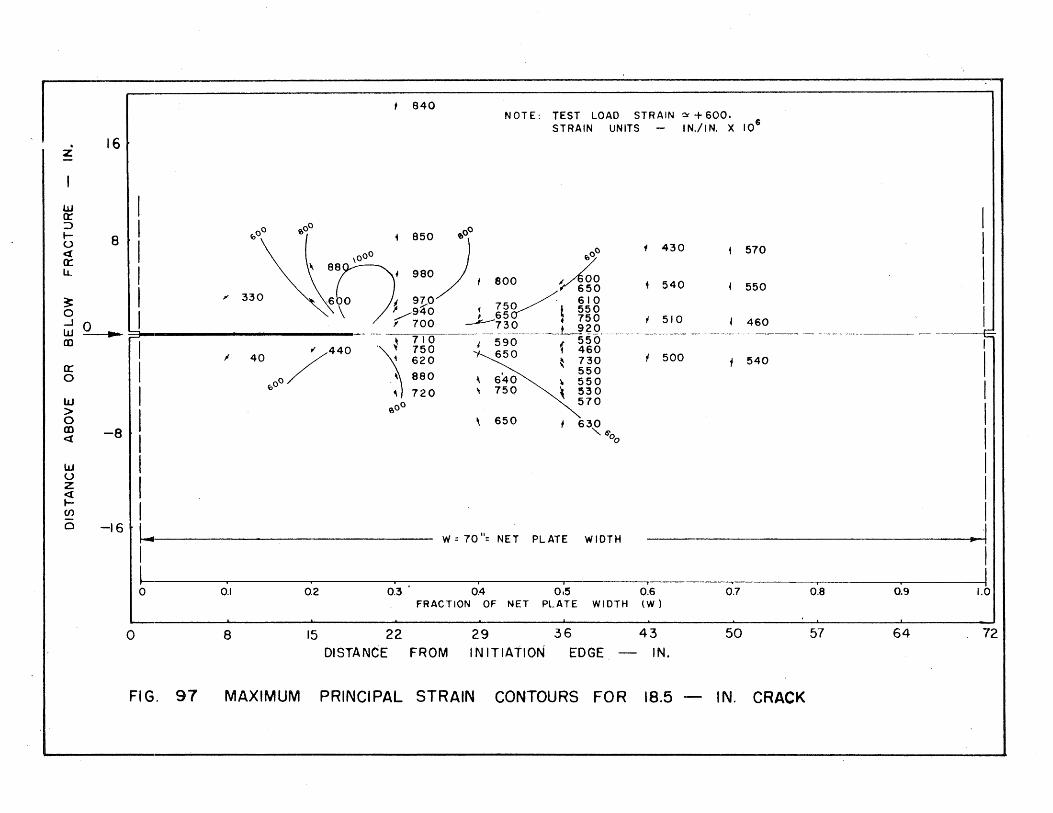
· 16 z
w cr ::> l- S U <f a:: IJ..
~ 0
~~ m
cr o
w > o m <l
LU U Z <l tCf)
o
-8
-16
840 NOT E: TEST LOAD STR AIN ~ + 600.
STRAIN UNITS IN./IN. X 106
1 430
i ~\ 80'OOU 4 980), 800 ~~ I 540 I 550
I 70 ~ 610 ; 330 ·6 0 I 9/ 750 t 550 \ /9·40 : 65 • 750 I 510 460 E I ; 700 ~730 t 9£9 I
---=~:---- - - 550 ~ ~ 7 I 0 I 590 (460 I I ~ 440 .~., 750 650. ! 730 500 540 I 40 / ~ 620 " 550
1 '880 ,640 \ 550 I I .00 :0 720 ,750 \ ~~g 1
I ~ 650, 630 I " 6'0
o 1
I I I I I .1 I- W, 70'" NET PLATE WIDTH I I I L
"0'5 0'6 0.7 0:8 0.9 1.0 02 0.3 0.4 , . o 0.1 . FRACTION OF NET PLATE WIDTH (W)
t 570
o 8 15 22 29 36 43 50 57 64 72
DISTANCE FROM INITIATION EDGE - IN.
FIG. 97 MAXIMUM PRINCIPAL STRAIN CONTOURS FOR 18.5 - IN. CRACK

16 z
W 0:: ::> I- 8 u <t 0:: LL
~ 0 .....J 0 ' W~ a>
cr o
lLJ > o m <t
LIJ U Z <{ .... CJ)
o
-8
-16
i 830 NOT E: TEST LOAD ST R AIN ~ + 600.
STRAIN UNITS IN./IN. X 106
C'
I I ~ I I ,\00 0' ~oo '900 '0
00) 'I 500 650 I I \~ 0 o 0 roO I ' 700 ';,,,-0, 12 ,900 i:V soo soo I
I ; 250 "3~0\ \\~ ~ 1000/'/6058 I "---.. \\ ~ : ;:g,; /) Wl -----\ ijs 0 500 I 450 E I ' IS30 880_____, 110.0 I
] ~ 2520 700 i ~ gg I I ,. 300,/ CI98'O~ 65~0 .. ' 750 '500 ~ 550 ; 50 ,/! 1670 , 490 I I
/
/ 11350 0 900 ~ 500 o 600
1 180''V 0 800 ~1~OO I I ~ ~ I 0 '800, 6 0 I I b
O
~oo 1
I I I I 1 .1 14 W' 70"· NET PLATE WIDTH I I . I 1 I I O· 8 0.9 I. 0 ' • 0,5 0.6 0.7 . 02 0,3 0.4. ) o 0.1 . FRACTION -OF NET PLATE WIDTH (W
o 8 15 22 29 36 43 50 57 64 72 DISTANCE· FROM INITIATION EDGE - IN.
FIG. 98 MAXIMUM PRINCIPAL STRAIN CONTOURS FOR 22 - IN. CRACK

f 800 NOTE: TEST LOAD STRAIN ~ +600.
STRAIN UNITS I N./I N. X 106
16 z
w cr :::> l- e u <f cr lJ...
~ 0
~~ (])
a: 0
w > 0 (]) -8 <t
LIJ U Z <{ I-en
I I
/:
0 I '" 500 b I I 0 ,0
00 &0
0 ,I 610 680
"250 cPo ~ I o ..... 1:)5 00 I <00 '\ \ ,,00 I 1150 ') 1 ~oo i 550 I 560 I
I '250~0 ~~~n~hi40 I "' 7'50 /,78 11~8 I 540 450 ,I I, ' o~ 270/(({ ifg )~\~,~og -,-,t,J~8 530 \ 560 lEI
'1. /, 820 00 \ 1250 :~60
I ; 950 \ -a; )850 ) 700 6 I ~ 6~0 %
I ." \oo~ 1030 740 .1
I 000
.00 I I I I I I 1
0 -16 I... W: 70": NET PLATE WIDTH ... ,
I I l , . . , iii i I o 0.1 0.2 0.3 0.4 0,5 0.6 0.7 0..8 0.9 1.0
FRACTION OF NET PLATE WIDTH (W)
o tL 15 22 2936 43 50 57 64 72
DISTANCE FROM INITIATION EDGE - IN.
FIG. 99 MAXIMUM PRINCIPAL STRAIN CONTOURS FOR 25.5 - I N. CRACK

· 16 z
W Q: ::::> t- 8 u ~ a: l1...
~. 0
~~ CD
a: o
w > ·0 CD <l
w u Z <l tCf)
o
-8
-16
o
I I I I I I I I
, 280
I 70
I 760 NOTE: TEST LOAD STRAIN ~ + 600.
STRAIN UNITS I N./I N. )( 106
" 370 o 00
I~~O' bO~3~0~('rz; ,,500 \ 00
230 . ,b 16 200 '{,2fO\ ~gg
\ 290
t 270 { , '~5/
bo/~:r sOo
700 bOO
780/ ~OJ
~'!~~ 680
) 770. t 590 " 11500 ~ 129_ f 450
",00
~570 860 800 550 660 990 830
~620 • 560
~O
I... W: 70 ": NET PLATE W 10TH •. ,
I I l iii i , I
0.4 0,5 0.6 0.7 0.8 0.9 1.0 FRACTION OF NET PLATE WIDTH (W)
8 15 22 29 36 43 50 57 64 72 DISTANCE FROM INITIATION EDGE - IN.
FIG. 100 MAXIMUM PRINCIPAL STRAIN CONTOURS FOR 29- IN. CRACK

z
w a: ::> lt)
« a:: lL
16
I 8 • I
I I
~ ~ 3 0 I w~
CJ) I cr o
w > o m «
I.IJ t)
z « ...... Cf)
I I
-8 II I I I I
, 280
, 50
760 NOTE: TEST LOAD STRAIN ~ +600.
STRAIN UNITS IN./IN. X 106
raOO
"2~0 0 J ~ 00 \~OOO~ /'
8°00 t 220\ ~\O"OO 1',330 '78~~ 00 'l.. \ ~ t)250 "" 210 750 050
200 ~,,--a..r.0 , 980 -{ 1 §~O '~6 0 '460 "230 "150 t 1619 _____ _
----~~~~------~~----~~970
; ~V39~ c; ~~ug,~ flij 00 /~:O I ~1~ \ iH~ ~ 'l..~ /
~ 1100 ' t 1110 o ...-/' COO 00 00
,0 ,0
roOO
680
250
\' rooo
~.~ bOo
o -16 ~ '--1 ... --------
I W : 70 ": NET PL ATE WIDTH
o
I ,----------,-o 0.1 0.2 0.3 0.4 0,5
8 15
FRACTION OF NET PLATE WIDTH
22 29 DISTANCE FROM INITIATION
36
EDGE
0.6 (W)
43
iN.
0.7
50
FIG. 101 MAXIMUM PRINCIPAL STRAIN CONTOURS FOR 32.5 - IN. CRACK
0.8
57
I I I I I
J:::
I"
I I I I I I I
_'1 ~-I
I I ..,--- - --1
0.9 1.0
64 72

16 z
w cr :::)
..... 8 u ~ a: lJ...
~ 0 :....J w~ CD
a: o
w > o CD <l
ILl U Z « tCf)
o
-8
-16
I I I I I I )
I I I I I I I I I~ I-
I 280
; 30
90
160
I 760 NOTE: TEST LOAD STRAIN ~ +600.
STRAIN UNITS IN./IN. X 106
0° o t) 870
0° 170 EJ\ ° / ~~~o )00 ~~750
\. 550 2400 tO°O
" ~ 1870 + 910 t 790/ , 220 20'0 1850 ~ .~ 250 . \ 550~ 2900 .
2750 '300 t 50 l 5560 '7§.0 / 570
~ 360 350 2520' 250 t 65- ~ 500 /' ~ 2400 "-... _____
yt20 /!' ~2~0 '" 820 I 640
,,-00/ I 170 I' 180 /« I :;6g 6100 ~oo
I 300 "350 00 1410 1000
I 680 1 1300
0° EJ
W = 70 "= NET PLATE WIDTH
I I I I I r-
I
I I I I I \. I
- ., .-----1
I I I I I I
o 0.1 0.2 0.3 0.4 0.5 0.6 0.7 0.8 0.9 1.0
o 8
FIG. 102
15
FRACTION OF NET PLATE WIDTH l W)
22 29 DISTANCE FROM INITIATION
36
EDGE
43 IN.
50
MAXIMUM PRINCIPAL STRAIN CONTOURS FOR 36 - IN~ CRACK
57 64 72

+ 850 NOTE: TEST LOAD STRAIN ~ +600.
STRAIN UNITS IN./IN. X 106
16 z
8 1 ' I 00 ° \ 0 00
'1.-0 { 800 1000 °
~'OOO '1.-00' ~o
'700 ~ \) ~ , 100 1500
3: " 220 180, 220 '~3: ~ I:~~ \ 1300 ~~ 9'20 '000
o ' 230 "300 ~ 790 -.J 0 'T 700 ~ 60 ........ 8 f 1100 600 W~ f
IJJ cr :::> I<..> ~ a: u.
CD I 50 32 " 360 I" 578 I 20 1 2 50 't 460 I" 85
I 200 r ~ I:~g a: o
w > o CD <{
I.I.J <..> z <t tCf)
o
f 70 \ 130 ~ /82'0
I f 260 '350 1( Iggg
I ; 9'0 0 I 1080 -81 / "-I '000 ,000
I I I
-16~1~~.-__ ~ ____________________ __ W : 70 ": NET PL ATE WIDTH
'~150 "\00
\0
~o ~ '-
_'1 .,---- I
I I I, i. " . I o 0.1 0.2 0.3 0.4 0.5 0.6 0.7 0.8 0.9 1.0
FRACTION OF NET PLATE WIDTH lW)
o 8 15 22 29 36 43 50 57 64 72 DISTANCE FROM INITIATION EDGE - IN.
FIG. 103 MAXIMUM PRINCIPAL STRAIN CONTOURS FOR 39.5 - IN. CRACK

z
l1J Q: ::::> ~ u <f: a:: u.
16
I 8 ~ I
I I
~ ~ 3 0 I w~
CD I a:: o
w > o CD <{
w u z <{ ..... C/)
I I
-8 ~ I I I I I
I 60
; 170 " 190
,. 60 I 220
/ 630 NOTE: TEST LOAD STRAIN ~ +600.
STRAIN UNITS I N./I N. X 106
"" 80~OO 90 , 230
l 200
,
00 ,0
&00 '\
\ I 980 ;';" 20
~!~~ '~r:30 \ 1450 1090
320 ) /fJ03-~ 15 /: ) 31 ~ i 2060 '670 , 8.9
t 200 \ I~O 720 ~ 80' 70
. 320 1 40
180
I 670
f 250
350 460
\ 120 I 270
300
\ 300 90/
.{ 3~ " 0
~ 450
/
}I; 370 610
~ 709
0° Ei
" 2300 ~ 840 00
'b
-16·~1~~ ________________________ _ o W: 70 ": NET PLATE WIDTH
I I I I I
J:::: '-
I
I I I I I I I
~'I ~ I
I I
o
Iii , 'i i. I o 0.1 0.2 0.3 0.4 0.5 0.6 0.7 0.8 0.9 1.0
8
FRACTION OF NET PLATE WIDTH tW)
15 22 01 STA NeE FROM
29-
INITIATION
36 43
EDGE - IN.
50 57 64 72
FIG. 104 MAXIMUM PRINCIPAL STRAIN CONTOURS FOR 43 - IN. CRACK
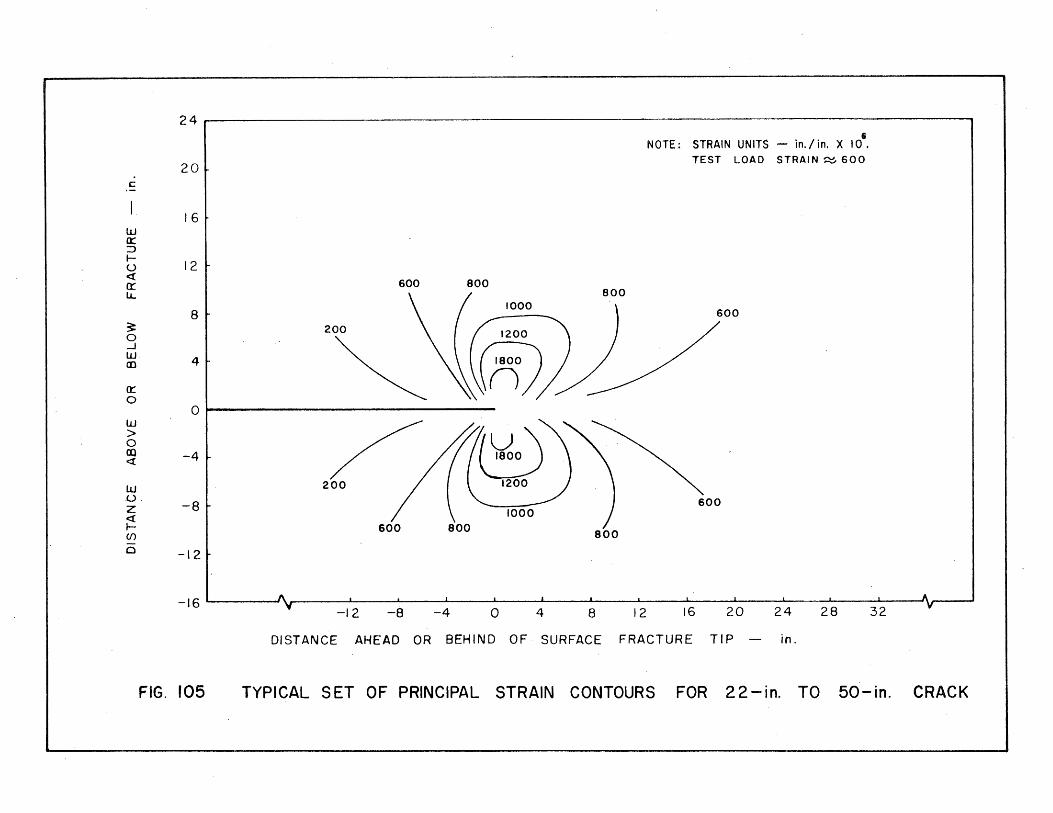
24
20
~
16 w a:: :::> ..--
12 u <t n:: LL
8 3: 0 -l W 4 CD
0:: 0
0 w > 0
-4 Cl) <t
W o.
-8 z <t ..--(f)
0 -12
-16
FIG. 105
600 800
1000 600 800
-12 -8 -4 o 4
800
8 12
6 NOTE: STRAIN UNITS - in./in. X 10.
TEST LOAD STRAIN ~ 600
16 20 24 .28
DISTANCE AHEAD OR BEHIND OF SURFACE FRACTURE TIP - in.
32
TYPICAL SET OF PRINCIPAL STRAIN CONTOURS FOR 22-in. TO 50-in. CRACK

z 16
w cr :::> .-- 8 u <t cr lL.
~ 0
~~ CD
cr o
w > o m <t
w U :2 <t .-Cf)
o
-8
-16
(31-18)
r'
I (31- 15)
I I I I I I I I~ 1-
0·(37-31)
22() 0·(37-8)
226~0 ",0
0'(37-13)
O. (33-7) NOTE: REFERENCE· STRAIN IS TEST LOAD STRAIN.
STRAIN UNITS I N./ I N. X 106
O. (37-28) 40. (38- 28)
~ TEST NO
/ / VERTICAL
60 - (31-5) o. (34-13) o. (34-25) -50. ( 37- 23)
0·(38-31)
o. (38-,8) o· (38-5)
0.(33-4) 0 (39-28) 0 (39-31) • ). O· ( 38 - 23) o (31-3 0:(34-10) 8:(34-22) 0-(38-8) 0.(38-3)
O· (39-5) 0 (33-10) _.(33::..!.6,..!) _______ _
0.(33-1825) 0 (39-18) 0.(39-23) _60"(37-10) 0:(34-7) -40-(38-13)
0-(39-3) 110. (37-20) O· (33-28)
0·(34-1822) 0.(39-8)
0·(39-10) 0'(34-4)
0'(39-15)
0.(39-13)
60 ' (38 - 20) - 0 - (34 - 168 31 )
0·(39-20)
W = 70" = NET PLATE WIDTH
o. (38-15) o· (38-10)
GAGE NO. I I I I I
...r. '--
I I I I I I I I
~I --I
I I l 0:' 0:2 0:'3 0~4 0.'5 0:6 0:7 0:8 0:9 I.b
o 8
FIG. 106
FRACTION OF NET PLATE WIDTH (W)
15 22 29 36 DISTANCE FROM I NITIAT-ION EDGE
VERTICAL STRAIN CONTOURS FOR 8
43 IN.
-IN. CRACK
50 57 64 72

140' NOTE: REFERENCE STRAIN IS TEST LOAD STRAIN.
STRAIN UNITS - IN./IN. X 106
z
W 0:: ::> ..u <t 0:: LL
16
I 120· 8 ~ I ,00 0
I 600 r:J /
,/ ~ ~O. 50-I 1_ ~o O·
:::> ~I -700· 520n -30: ~O. > I \\ 100~ ~O: g -30. 0 W ~ 50.
en I -67 820' :~ - 10· O·
0:: o
w > o CD <t
w u z <{ ..(f)
o
I ,600
• 0: ~ -8 ~ I 0
I I I I
O· O·
o·
o . - 60 •
o o :
58 : -30 . -70 • 40 :
-50 O.
-60 • o .
80 •
O·
-30 •
-40'
-60 •
-16~LI~ ________________________ _ w: 70": NET PLATE WIDTH
I
-50 •
O·
o •
o ·
I i6 d7 FRACTION OF NET PLATE WIDTH (W)
o 8 15 22 29 36 43 50 DISTANCE FROM I NITIATION EDGE - IN.
F'G.107 VERTICAL STRAIN CONTOURS FOR 15 - IN. CRACK
O·
57 64
I I I I I I I I
_I ~I
72

150 • NOTE: REFERENCE STRAIN IS TEST LOAD STRAIN. STRAIN UNITS - IN./IN. X 106
z
w n: :J rU <{ a:: lL.
16
I 150 •
8 ~ I, .00 -'OO~70. '(OO/---~IO' ~ '-3~ 80· -80.
~ ~.II -7~ -39 ~~g: ~g/-~r -.J 0 -20' 50' 238: w ____ - :c-------CD .100. -10 -90.
I y7390 110' -20: -30'
a:: o
w > o CD «
w U 2 ~ r(f)
o
- 6 20' 10 • ~ - c. • 40 :
I O' ~ -40 00 O' - 90. I " ,400
120· -60~ -70:
-8 ~ I 20' 0 40'
I I I I
-16~1~~ ______________________________ ___ W: 70" = NET PLATE
o· 60 •
- 20 • -20·
-60 • o •
-90' - 20 •
WIDTH
I I I I I -E
I I I I I I I I
_I --I
I I I , , , , , , I
0.4 0.5 0.6 0.7 0.8 0.9 I FRACTION OF NET PLATE''\c WIDTH (W)
I ...1. ...1.
o 8 15 22 29 36 43 50 57 64 72 DISTANCE FROM INITIATION EDGE - IN.
FIG. 108 VERTICAL STRAIN CONTOURS FOR 18.5 - IN. CRACK

z 16
w a:: ::J
8 l-t) <! a:: lL.
~ 0
~ JL.-CD
a:: o
w > o CD <!
w u z ~ I(f)
a
-8
-16
I I I I I
00 \~
150 •
--200 <?oo
3\70 • "'0 200.
NOTE: REfERENCE STRAIN IS TEST LOAD STRAIN. STRAIN UNITS IN./IN. X 106
_200/0 -50'
130 • -20 -30·
50'
-20 •
I I I I
J _7::_~~~ 550n. 0 2~g:
7b'O 150 • 730 •
~O' """,------,30 : 400 • -50· o • I
-------E
o
I I I I I I I I I~ 1-
1740: 120.
-6~0' _400'/;~:6~/tJg~20. 5~0' 1'2{>.
..... 6 00 I 59· .00 -5J' 200 •
o .-/' 00
'l-
-100. - 10 •
~IO:
-170 40 .
- 80 :
-5~ O· 0
W=70": NET PLATE
-70 • o •
WIDTH
O'
I I I I I I I I
_I ~I
I I
l 0:1 0:2 0:3 0:4 0.'5 0:6 0:7 0:8 0:9 I.! FRACTION OF NET PLATE WIDTH (W)
8 15 22 29 36 43 50 57 64 72 DISTANCE FROM 1 NITIATION EDGE - IN.
FIG. 109 VERTICAL STRAIN CONTOURS FOR 22 - IN. CRACK

100 • NOTE: REFERENCE STRAIN IS TEST LOAD STRAIN. STRAIN UNITS IN./IN. X 106
z 16
I w cr :::::> to c::t: a:::: tJ..
I -400' a
Sf i -7~·:~:::: ::j~\(r:::)r ~ ~ -488'f\ ~ 2M :/ 3 I -470 • 300 •
/
0'
-50 180 : _ 10 40 •
100--140 •
w JL..... -I. 200.
CD I _22/0-3.80. :~8v8: 100-a:::: o
w > o CD c::t:
w o z ~ tif)
a
-8 ~
I -2l0' 370· 160 - 250. I 6 00
I - 0 410·
I I I I
560 : 0 •
~-1~8: ,68:
~ o •
140. 0
-16~~1~.-______________________ __ W=70"=NET PLATE WIDTH
100 •
20·
-10 •
o •
I . I i6 d7 ~
o 8
FIG. 110
FRACTION OF NET PLATE WIDTH (W)
15 22 DISTANCE FROM
29 36: ..-
INITIATION - EDGE
43 IN.
VERTICAL STRAIN CONTOURS FOR 25.5 - IN. CRACK
50 57 64.
I I I I I ~ ....
I I I I I I I I
~I -I
72

z
w a::: ::::> ~ u <t a:::
.lL.
16
I 8 ~ I
I I
~ W 3 0 I w ____
CD I a::: o
w > o CD <t
tiJ u Z <t .(f)
I I
-8 ~ I I I I
-760·
-620 •
20 • NOTE: REFERENCE STRAIN IS TEST LOAD STRAIN.
STRAIN UNITS IN./IN. X 106
o -500 · 0 n . ~O)
_5:;O'~580' \~ff~"ooo sOo ~:iI -5.0 0 • 5 <Y:\ 2~.,r,. • -48
0 • -4 20 • I ~d • I I Q V •
O • 580 • -400 • 130 -- -----4-.--206,. 1~60 • 338 : -560 • 6
U80 • '1--D0:
-500 ';/. 2
-460 '/~7,g: 26~0: -100' . . 0 ~
'!-o 630 • ~ 2 0 0 •
00 o ~
-----------.. O~ 50· ~
o
o · 160 • o
170 • 100 •
80 -10 •
-380 •
I -16~ IL ..... _-_~--o
W: 70": NET PLATE WIDTH
I I
I I I I I £
I I I I I I I I
_I --I
I I 6 0.1 - ---- O~-2 ~--- 0>3 0~4 0:5 0:6- __ u_ 0.7--- 0:8 0: 9 1.6
o 8
FIG. III
FRACTION OF NET PLATE WIDTH (W)
, 15 22 29 36
DISTANCE FROM ·1 NITIATION EO·GE 43
IN.
VERTICAL STRAIN COINTOURS FOR 29 - IN. CRACK
50 57 64 72

z ,16
w cr ::::> l- 8 u <l: a::: l.J..
~ 0
li1 ~ CD
cr o
w > o CD <l:
w U 2 ~ l(J)
o
-8
-16
o • NOTE: REFERENCE STRAIN IS TEST LOAD STR AIN .
STRAIN UNITS IN./IN. X 106
I 'va
I \0 O· 0 I -560 • \ '/.,0
I -600 • 00 --------- 14
9 "
-640 Po
-760 • 50 7 ",n \ I 'I . -480 • -500 • \ (l 500;) 260;
-380 • -400 \ 230 : 480 :/ ;3 -300 • -658 • 500 • ,{o ·
I . -220 1450 • -----
-630 • -400 • -550 : -400 • 200 •
I =~~~0· _2
60
; I 1~88\·) 0 '1'5\0 ," ~ I I
00 • ~300.{0 0 -300 • /c/o · 540 ': '1,,00 I I 500 •
I /.00 0 400· 500 • I 1 .00 I I I I 1
I.. I I W· 70'" NET PLATE WIDTH I I ~ I o i 0.1 . 0'2 ci • I , .3 0.4 0'5 ' i F • 06 • !
RACTION OF NET PLATE WIDTH (~) 0.7 0.8 0:9 I.
--'-
o 8 15 22 29 36 43 50 57. 64 72 DISTANCE FROM INITIATION EDGE - IN.
FIG. 112 VERTICAL STRAIN CONTOURS FOR 32.5 - IN. CRACK
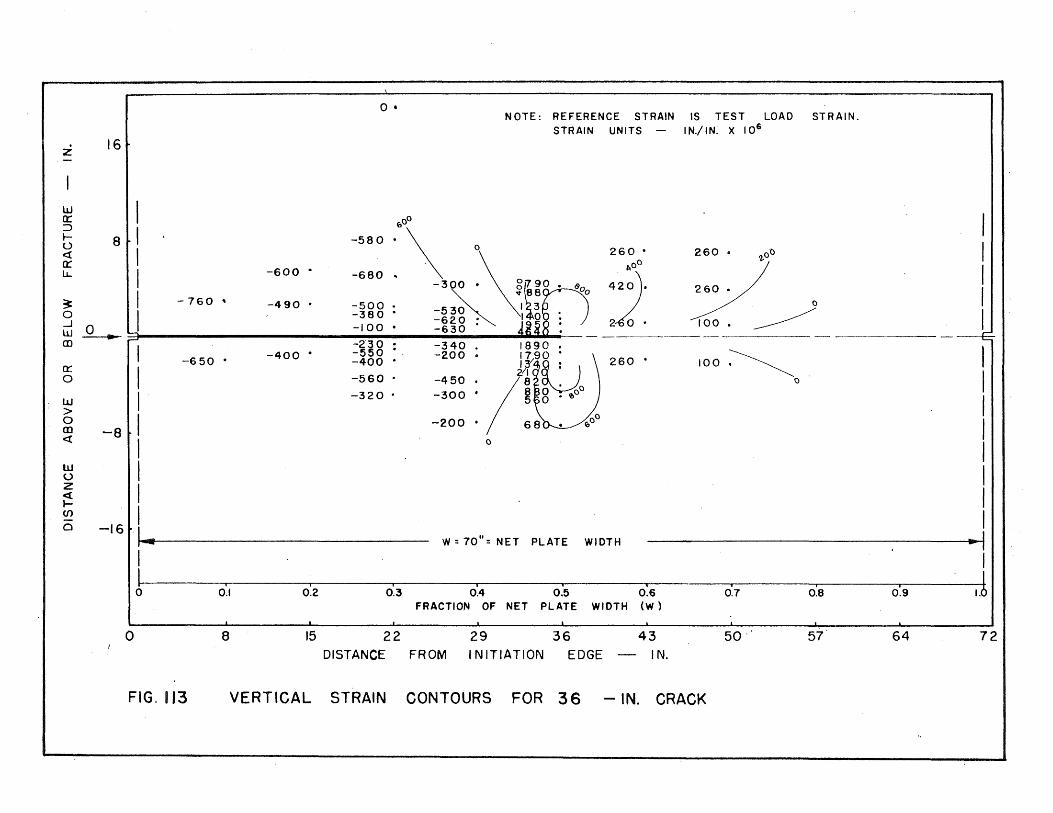
Z 16
w a:: ::::> ..... 8 0 <t a:: ~
~ 0
111 JL.-m
a:: o
w > o m <t
w u z « ~ (f)
a
-8
-16
I I I I I I I I 'I~ 1-
o
-760 '
-650 •
8
FIG. 113
-600 •
-490 •
-400 •
o • NOTE: REFERENCE STRAIN IS TEST LOAD STRAIN. STRAIN UNITS - IN./IN. X 106
'000
-580 • \ 0
-680 , ~ -3 O. gi790
500 "" 88 ::::380 -5~O 1(~3 -100 • -62.0' I~O -630 •
-2' 3 0 - 3 40 I 89 0 •
=~gg . -200 • l~tt9uO ; 21ft -560 • -450 8
-320 . -300 • ! ~ 8 : .00 0
-200 • 68 ./.0 o
260 •
42~O).
2~' 260 •
W: 70": NET PLATE WIDTH
()
;;~ roo. _
IOO~o
I I I I I f
I I I I I I I I
~I --, I
, i , j I ::>.6 0.7 0.8 0.9
FRACTION OF NET PLATE WIDTH (W)
15 22 29 36 43 50 " 57' 64 72 DISTANCE FROM I NITIATION EDGE - IN.
VERTICAL STRAIN CONTOURS FOR 36 - IN. CRACK

z 16
w a:: ::)
I- 8 u <t: a:: u..
~ 0
~~ CD
a:: 0
w > o CD c:::{
w U 2 <{ I(f)
o
-8
-16
o
I I I I I I I I I~ 1-
-600 •
-760 • -490 •
-640 • -400 •
/0
-620 •
-660 •
-500 -400
o · -280 -560 -400 .
-500 .
-330 .
NOTE: REFERENCE STRAIN' IS TEST LOAD STRAIN. STRAIN UNITS I N./ IN. X ,106
.... 400 0
, \ ~oo 280 .00
~380 ·~8 :\( 0780
•
-5£8 . = O. 'Or; -6· ~ 8 . -6 2 0 . - o· 500 •
-340 . -400 . -230 • -441)·--. /-~-gvo: -480'/ -400. -420A -180
.... 1\,00 -280
-200 • 3?O • o
W":. 70"":. NET PLATE
600 ~ &00
WIDTH
300 • 7,.00
38~ 150 •
180,\ 00 'l.
I I I I I I I I
~I --I
I I l 0:1 0:2 0'.3 0:4 0:5 0:6 0:7 0:8 0:9 l.b
FRACTION OF NET PLATE WIDTH (W)
8 15 22 29 36 43 ·50 . 57 64 72 DISTANCE FROM INITIATION EDGE - I N~
FIG. 114 VERTICAL STRAIN CONTOURS FOR 39.5 - IN. CRACK

z 16
w t 0::
::> I ~ 8 u I c::t
0:: l.J.. I
~ ~ 3 0 I w ____
CD I 0::
1/ 0
w
-all > 0 CD <! I w
-Jl u z ~ ~ (f)
0
I l--0
L 0
-10 •
-620 •
-620 • -600 -
-760 •. -500 • -500 • -440 •
-60 •
-640 • -420 •
-300 • -560 • -450 .
-500 •
-360 .
-400 •
- 508 . -64 -620
-360 . -230 •
-480 . -400 •
-300 •
NOTE: REFERENCE STRAIN IS TEST LOAD STRAIN. STRAIN UNITS IN./IN. X 106
"O~
'. 0 ro · -'l~~890n~oo -360 • \ -700 -4§O : 1500 • -4 0 . -2 0 •
:i~8 : 1800 -3V8 . -I 0 - 20 . :i88 : . -200 •
/ .... AOO
390
540) ~oo
20b~ 250~
ZOO
w = 70"= NET PLATE WIDTH
I I I I I -E
I I I I I I I I
_I --I
I I
0:1 6:2 ---([3--------nn--Q4-- 0:5·~~---0:6 0'7 o'a. 0:9 1.6 FRACTION OF NET PLATE WIDTH (W)
8 15 22 29 36 43 50 57 64 72 DISTANCE FROM INITIATION EDGE - IN.
FIG. 115 VERTICAL STRAIN CONTOURS FOR 43 - IN. CRACK

24
2°1 NOTE: REFERENCE STRAIN IS TEST LOAD STRAIN. c:
STRAIN UNITS - in./in. X 106
16 w ex:: ::> .-.
12 I u 200 ~ -400 a::: Ii..
8 ~ 0 ..J W 4 (IJ
a::: 0
0 w > 0 CO -4 <t
w u
-8 z ~ (f) I -zoo- 0 a -12
-16 16 20 24 28 32 -12 -8 -4 0 4 8 12
DISTANCE AHEAD OR BEHIND OF SURFACE FRACTURE TIP '--,. in.
FIG. 116 TYPICAL SET OF VERTICAL STRAIN CONTOURS FOR 22 - in. TO 50 - in. CRACK
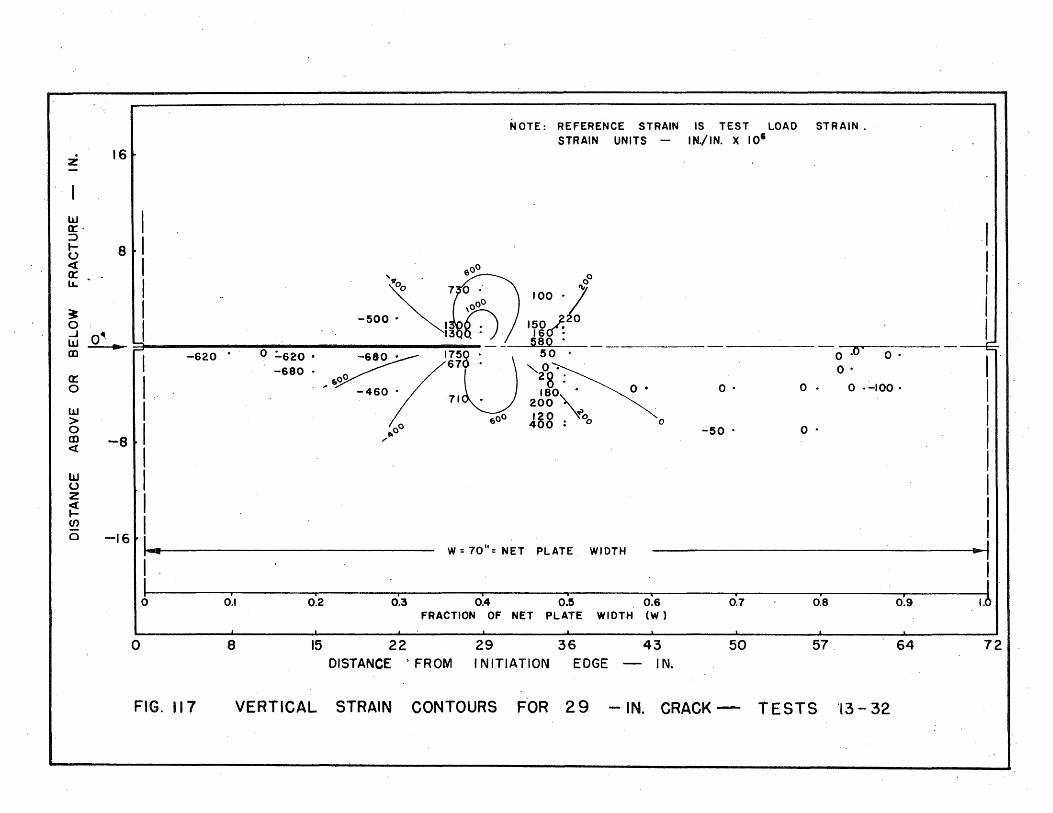
NOTE: REFERENCE STRAIN IS TEST LOAD STRAIN. STRAIN UNITS - IN./IN. X 10'
z
W 0:::)
16t-
I 8 .1
I, . ,,,' , (NfJOO 00
00 . 7 0 . '" 100 •
1 ,000 ~ . I -500 ~ . I n 150 J..! ...J __ • ~'3 . . 160! W ~ _ 580'
tO « a: lL.
a::: ,,00 28 ; o II ' -460 '. 180' 0 •
. -680 • /67 "" o~ 71· 200 '\..
~ II 6 00 128. VOo . 0 o I ~oo 40 • m -8 / « I llJ U Z
~ (f)
o
I I
-16~ I J... W: 70" = NET PLATE. WIDTH
O'
-50 •
o .0 0 .
O· o . o --100 •
o .
-, I I ! 0:, 0:2 0:3 0:4 0:5 0:6 0: 7 0:8 0:9 I.!
FRACTION OF NET PLATE WIDTH (W) .1
o 8 15 22 29 36 43 50 57 . 64 72 DISTANCE 'FROM INITIATION EDGE - IN.
FIG. 117 VERTICAL STRAIN CONTOURS FOR 29 - IN. CRACK - TESTS '13 - 32


TEST 33
TEST 34
TEST 35
FIG. 118 FRACTURE PATHS - TEST 33, 34, AND 35


FIG. 119
FRACTURE PATH
TEST 56
SP!;C!1:EN X2!I "Db. 65790
19.0 kd -l2 F.
ORIGIN OF DOUBLE FRACTURE
FRACTURE PATH - TEST 36


T~ST 3 7
"$;",
~ -J.,."; ... , •• "_
TEST 3 8
./
,...... er"j
TEST 39
FIG. 120 FRACTURE PATHS - TEST 37, 38, AND 39


. , '
FIG. 121
• <'ill
~
1200 FT-LB
TESTED I NOV'S7
TYPICAL FRACTURE SURFACE


SPEC. XF·i NObs c5790
TEST 34
TEST 34
TEST 38
FIG. 122 VIEWS OF PORTIONS OF TYPICAL FRACTURE SURFACES
