lo g - virginia tech
TRANSCRIPT

A Comparison of Two Definitions of Success
for Community Colleges
by
Jean Myers Williams
Dissertation submitted to the Faculty of the
Virginia Polytechnic Institute and State University
in partial fulfillment of the requirements for the degree of
DOCTOR OF PHILOSOPHY
in
Educational Research and Evaluation
APPROVED:
et wn Ge EN ne
S James C. Impara, Chair
JOM Aba S Aare! Sh he CA
* Lawrence H. Cross Steven M. Culver
Lo g hk C1 Done LegleD (4 Jim C. Fortune Daniel E. Végler
July, 1992
Blacksburg, Virginia

A COMPARISON OF TWO DEFINITIONS OF SUCCESS FOR COMMUNITY COLLEGES
by
Jean Myers Williams
Committee Chairman: James Impara Educational Research and Evaluation
(ABSTRACT)
This study examined community college students’ educational goals at the
time of first enrollment in college and the status of attainment of those goals two
and four years later. A comparison of the traditional definition of success for
community college students - on time graduation or transfer to a four-year
institution - and a definition reflecting Southern Association for Colleges and
Schools criteria for institutional effectiveness was conducted to determine what
effect changing success criteria would have numbers of students who are
considered successful. Between 1985 and 1989, 11,553 student attending
community colleges in southwestern Virginia were tracked to determine the
degree to which they attained entry level educational goals. Students who
enrolled for the purpose of attaining a credential were more likely to graduate
and to exceed their educational goals than their non-degree-seeking counterparts.
Non-degree-seekers were more likely to attain their educational goals exactly and
then discontinue their community college enrollment. Differences among
demographic groups are discussed and suggestions for policymakers are given.

ACKNOWLEDGEMENTS
It is truly a pleasure to acknowledge people who have been supportive of
my efforts as this project was developed and completed. First of all, Jim Impara
served as a mentor, counselor, and caring friend who prodded me to complete this
project when it seemed that far too much time had elapsed to have any hope of
finishing. He proved that at least once in my life I made an absolutely perfect
decision - to study under his guidance.
My committee members, Larnie Cross, Steve Culver, Jimmie Fortune, and
Dan Vogler have been patient and understanding as they read materials and
made constructive (always constructive) comments about how to improve this
study. They freely gave me advice, guidance and their valuable time, and shared
not only their expertise but also their positive attitude toward the acquisition of
knowledge and proved that it is possible to cooperatively shepherd a sometimes
hesitant student through the process of attaining a terminal degree.
Sam Morgan provided support, motivation, and much-needed occasional
kicks in the seat of the pants with long distance messages forwarded through
friends and professional acquaintances. He reminded me that someone at
Virginia Tech was cheering for me, and that if I didn’t finish, I wouldn’t even get
the "booby prize".
Max Wingett at Patrick Henry Community College made this study
iii
possible by providing access to the centralized computing system on campus and
being the first person to provide his college’s data. I am grateful for his faith in
my ability as well as his kindness in opening doors for me so other community
colleges would follow his lead and allow me to use their data.
My mother served as a motivator without equal as she frequently told me
about the accomplishments of her friends’ children, ending each conversation
with, "And when will you finish your paper?"
Finally, the two most important people in my life have sacrificed so much
so that I could pursue this goal. There is no way I can ever thank them for all of
the little things they have done to help me through this process. Jonathan spent
the majority of his formative years having to deal with a "Graduate Student Mom"
and never complained when he had to fend for himself on class nights or wait for
a study break to get the attention he so richly deserved. I hope I have provided
him with a positive role model as he strives to make his dreams come true,
embarking on a similar journey down a slightly different path.
My husband David willingly provided enormous financial and emotional
support throughout the "graduate school years". He was always available to help
me through the rough spots and provided balance to my life when I tended to
spend too much time in the pursuit of knowledge and not enough in the pursuit of
happiness. His unwavering faith and optimism are constant reminders that I have
a dear friend on my side. More than anyone else, he helped make this goal
attainable.
IV

CONTENTS
Chapter 1: Introduction .......... 0... ccc eee eee te eee eens 1
Background .......... cc eee eee eee ee eee eee e eens 1
Statement of the Problem ................. 22. eee eee eee 5
The Call for Action ..... 0... .. cece cece eee eens 10
Addressing the Issue ............. cece eee ee eee ene 12
Significance of the Study ......... 0... ce eee ee eee ee eee 13
Limitations of the Study ............. cece eee ee eee eee 17
Chapter 2: Review of Related Literature ....................00. 19
Lessons From Four-Year Colleges and Universities ........... 24
Differences Between Two- and Four-Year Colleges........... 26
Lessons From Other Two-Year Colleges ................... 29
Chapter 3: Methodology... ........... 0 ccc cece eee eee eee 38
Population ........ cee eee 38
Variable Specification .... 2... 0.0... cece eee ees 40
Demographic Variables .................00 0c eeee 40
Student Attribute Variables ................000 ees 44
Educational Goals .......... 0.0... ccc cc ees 47

Attainment Variables .................c cee eccees 50
Pilot Study 2.0... .... cc ccc ce eee ce eee e ee eees 53
Statistical Analysis .......... cece eee teenies 55
Chapter 4: Results
Educational Goals ............ cece eee eee eee tee eens 57
Demographic Factors ............ cece eee eee eee teens 60
Course-Taking Habits and GPAs .................0 sees 63
Graduation Rates and Goal Attainment ................... 65
Degree-Seeking vs. Non-Degree-Seeking ................... 69
Effect of Changing Definition of Success ..................- 90
Chapter 5: Conclusions
Conclusions .......... ccc cece ce eee cee tee ee ee eee ee 94
Recommendations .............. cece cece cece eee ees 100
Suggestions for Further Study ..................-20- 008 102
References Cited ......... 0... ccc ce ee ee ee ee eee eee wees 107
Appendices
Appendix A: Letters of Request and Permission to Use
Computerized Databases of Participating Colleges
Appendix B: Code Book .............. 0. cee eee ene
Appendix C: Application, Patrick Henry
Community College .......... cee ee eee eee
Vita lc ce cc cc ee ee eee et ee ee eee ete ee ee eee
vil

Table 1:
Table 2:
Table 3:
Table 4:
Table 5:
Table 6:
Table 7:
Table 8:
Table 9:
Table 10:
Table 11:
List of Tables and Figures
Relative Size of Participating Colleges Based on Adjusted Fall, 1985 Enrollment Data .............
Demographic Description of Population .............
Students Classified by Attribute Variables ............
Definition of Educational Goals ...................
Criteria for Attainment of Educational Goals .........
Breakdown of Population by Educational Goal ........
Percent of Students In Each Demographic Category Broken Down By Educational Goals Selected at Entry 2... ec cee ee ee ee tee ee eee
Number of Quarter Hours Enrolled and Completed and Grade Point Averages Broken down by Educational Goal at Entry 0... eee ee ee ee ee
Percent of Students Who Graduated or Attained Their
Stated Educational Goals After Two Years and Four
Years of Enrollment ............. 0.0... cece wee eee
Comparison of Goal Attainment of Students Who Enrolled for the Purpose of Attaining a Credential and Those Who Enrolled For Other Purposes, Broken Down by Gender ............ cece eee ee ees
Comparison of Goal Attainment of Students Who Enrolled for the Purpose of Attaining a Credential and Those Who Enrolled For Other Purposes, Broken Down by Race ........... cece eee ee eee
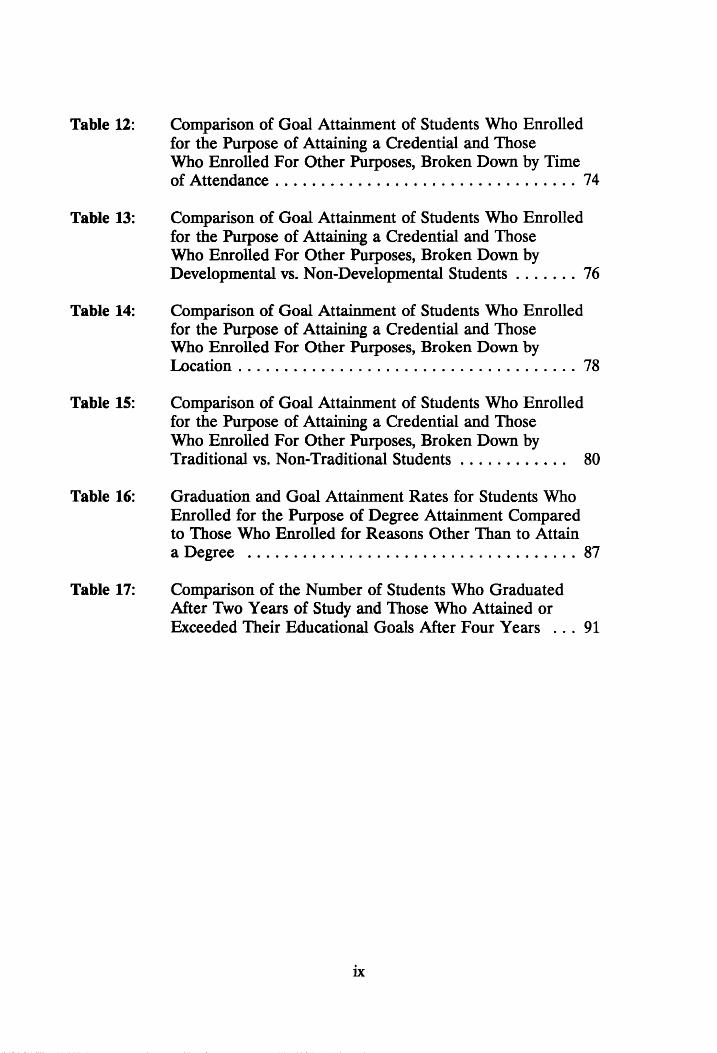
Table 12:
Table 13:
Table 14:
Table 15:
Table 16:
Table 17:
Comparison of Goal Attainment of Students Who Enrolled for the Purpose of Attaining a Credential and Those Who Enrolled For Other Purposes, Broken Down by Time of Attendance ..... 0... . cece eee ee et eee 74
Comparison of Goal Attainment of Students Who Enrolled for the Purpose of Attaining a Credential and Those Who Enrolled For Other Purposes, Broken Down by Developmental vs. Non-Developmental Students ....... 76
Comparison of Goal Attainment of Students Who Enrolled for the Purpose of Attaining a Credential and Those Who Enrolled For Other Purposes, Broken Down by Location .. 0... ce ee eee eee eee 78
Comparison of Goal Attainment of Students Who Enrolled for the Purpose of Attaining a Credential and Those Who Enrolled For Other Purposes, Broken Down by Traditional vs. Non-Traditional Students ............ 80
Graduation and Goal Attainment Rates for Students Who
Enrolled for the Purpose of Degree Attainment Compared to Those Who Enrolled for Reasons Other Than to Attain
a Degree 2.0... ccc ccc eee eee eee nee 87
Comparison of the Number of Students Who Graduated After Two Years of Study and Those Who Attained or Exceeded Their Educational Goals After Four Years ... 91

CHAPTER 1
INTRODUCTION
B un
During the late 1950’s and early 1960’s community colleges began operating
in the United States. From the first private junior college, which opened in the
early days of this century, the number has snowballed, and there are now
community colleges in all fifty states. The phenomenal growth between 1963 and
the end of the decade of the 1980’s has led to challenges for community college
administrators. In 1963, 63 percent of two-year college students were male. In
1989, only 45 percent were male. ... The participation rates of women,
minorities and working adults increased significantly in the 70’s and 80’s. (Wilson,
1989)
This phenomenal growth is partially the result of an emphasis on access to
the educational system. During the 20-year period between 1963 and 1983,
colleges were considered successful if they enrolled more students each year,
regardless of why the students enrolled or what happened to them after
enrollment. (Richardson, 1986, p. 28) "This tendency has produced a downside
to the growth success of the past two decades. In some communities, two-year
institutions are viewed .. . as centers for leisure-time activities, social-welfare

institutions, or places for underprepared learners, but not as educational
institutions providing excellent opportunities." (Wilson, 1989, p. 2)
In 1983, the National Commission on Excellence in Education published a
broad-reaching, comprehensive essay about the status of the nation’s public school
system with its publication of A Nation At Risk. While this was not the first
document to address the topic of "what’s wrong with our schools", it was the first
nationwide study in a number of years to outline specific steps which needed to be
taken to identify and address the problems and hopefully to bring about needed
changes. Among the recommendations was the suggestion that schools attempt to
assess how well their students were learning through a scientifically designed
system of measuring the outcomes of a public school education. Information
obtained from such an assessment should be used to improve school programs for
the benefit of student learning.
In 1984, following closely on the heels of A Nation At Risk, the National
Institute of Education (NIE) issued its own set of recommendations in a report
entitled Involvement In Learning. In the opening remarks of this document, the
authors stated that
When the report of the National Commission on Excellence in Education
was released in the spring of 1983, its recommendations stimulated a
tremendously positive period of self-examination and reform in American
education, particularly at the elementary and secondary school levels. But
the Commission’s background work provided two other valuable services for

all those who care deeply about education in the United States: first, it
underscored the ways in which higher education influences the other levels
of education; and secondly, it drew our attention to the need for using the
knowledge base, the results of research, to inform our debates concerning
improvement in education. (National Institute of Education, 1984, p. ix)
In other words, what A Nation At Risk did for elementary and secondary
schools, Involvement in Learning hoped to do for postsecondary education. While
not so highly critical of the system as a whole as the earlier work, the authors of
this report did attempt to pinpoint specific problems inherent in the system of
higher education in the United States. Among these problems was the fact that
many colleges did not know the extent to which their students were learning, or
what the students "took with them" when they left postsecondary institutions.
There seemed to be few systematic methods in place to measure the value which
attendance at a postsecondary institution added to a person’s quality of life. The
authors of this report found this to be an area in need of improvement and
recommended, among other things, that:
1, Faculty and academic deans should design and implement a
systematic program to assess the knowledge, capacities, and skills
developed in students by academic and co-curricular programs.
(p. 55)

2. Accrediting agencies should hold colleges, community colleges, and
universities accountable for clear statements of expectations for
student learning, appropriate assessment programs to determine
whether those expectations are being met, and systematic efforts to
improve learning as a result of those assessments. (p. 69)
3. State officials should establish special and alternative funding for
both public and private institutions to encourage efforts that
promote student involvement and institutional assessment. (p. 70)
It seems that institutions of higher education, accrediting agencies and state
officials across the nation have taken these recommendations seriously, as they
have established programs to assess the outcomes of higher education for
students. Most of the nation’s accrediting agencies have instituted requirements
that colleges assess the effectiveness of institutional programs, and that a part of
that assessment should be a close look at student outcomes. The Southern
Association of Colleges and Schools (SACS) devoted an entire section of its
Criteria for Accreditation (1984) to issues dealing with institutional effectiveness -
research, planning and evaluation.
In addition, state governing agencies and legislatures have handed down
mandates that require institutions to examine the effects of a college education in
order to justify to constituents that tax monies are being spent on quality
programs which will have long-term benefits. By 1988, only fourteen states had

not established some sort of program to assess the outcomes of higher education.
(National Governors’ Association, 1988, p. 39) Some of these programs were
tied to funding while others were tied to licensing or simply reporting information
to appropriate agencies to satisfy the mandates.
Requirements for assessment of student outcomes range from periodically
ascertaining "the change in the academic achievement of their students"
(Southern Association of Colleges and Schools, 1984, p. 9) to outlines of specific
information which should be collected. Such information usually includes
peer evaluation of educational programs; structured interviews with
students and graduates; changes in students’ values as measured by
standard instruments or self-reported behavior patterns; pre-and post-
testing of students; surveys of recent graduates; surveys of employers of
graduates; student scores on standardized examinations or locally
constructed examinations; performance of graduates in graduate school;
performance of graduates of professional programs on licensure
examinations; or, the placement of graduates of occupational programs in
positions related to their fields of preparation. (pp. 9-10)
Statement of the Problem
As a result of their twenty-year policy of open access, community colleges
find themselves serving a clientele with varying degrees of educational
preparedness. "The typical community college . . . often serves clientele ranging

from third grade reading levels to college levels." (Richardson, 1986, p. 4) The
influx of females and minorities, combined with the number of low-achieving
students, has created a student body with such needs as financial aid, day care
programs, and tutorial or remedial assistance.
The diversity of community college populations is further illustrated by the
fact that students enroll for a wide variety of reasons, such as: to earn an
Associate degree; to obtain transfer credit; to take courses required by their
chosen profession; to prepare for a career change; and to learn more about a
topic of interest to them, often with no educational or vocational goals in mind
and no concern for receiving credit for their work. (Obetz, 1987, p.1)
Community colleges are becoming increasingly concerned with the extent to
which students achieve defined educational objectives (Richardson, 1986, p. 2)
This concern represents a shift away from measuring success in terms of
participation, or equality of opportunity, and toward measurement of excellence in
terms of achievement of educational goals.
"A major concern of community college administrators is the large number
of students who attend college without completing certificate, diploma, or degree
requirements. ... This trend is illustrated by large attrition rates at many
community colleges and the proliferation of short-term programs designed to
attract students. One approach recommended to combat these problems is to
place top priority for the remainder of this decade upon doubling the number of
associate degrees awarded. Additionally, accrediting agencies are revising the

criteria by which institutions are evaluated to incorporate more emphasis on
student outcomes and institutional effectiveness." (Wilson, 1989, p. 2)
The Southern Association of Colleges and Schools (SACS) now focuses on
learning outcomes, specifically concentrating on institutional effectiveness defined
as "ongoing" documented comparison of performances to the institution’s future
mission and purpose. (Southern Association of Colleges and Schools, p. 4) "This
new focus implies that institutional effectiveness is determined by examining how
well an institution meets and fulfills the specific needs of the area that it serves."
(Wilson, 1989, p. 6) "Too often, the effectiveness of community college education
has been evaluated almost exclusively in terms of the number of degrees granted
and the number of students transferring to four-year colleges and universities.
While these statistics are certainly important, they do not adequately describe the
diversity of student goals or the variety of desirable outcomes produced through
the community college experience." (Commission on the Future of Community
Colleges, 1987, p. 46)
"To apply any traditional measure of success, where success is defined as
the attainment of a degree, would ignore the fact that many students never intend
to earn a degree. Therefore it becomes necessary to construct a measure that
adequately allows for both the diversity of student intentions at enrollment, and
institutional baselines that will enable the separation of those who have achieved
a satisfactory level of progress from those who have not." (Obetz, 1987, p.1)
Administrators and faculty at community colleges are beginning to examine
alternative ways of measuring the success of students for whom traditional
measures are inappropriate. One alternative is to compare students’ stated
educational goals with the extent to which these goals are being met, i.e., how
successful are students in attaining their stated goals. This alternative would
define success in terms of goal attainment rather than credential attainment, and is
particularly appropriate for students with no desire or commitment to persist in
their studies until graduation. Using goal attainment as a success criterion takes
into account the diversity of intentions and degrees of commitment present among
community college students.
A second alternative is to consider the protracted attendance patterns
typical of community college students and measure success after an extended
period of time rather that at the end of only two years of study. By giving the
same students four of more years in which to complete their studies, a more
accurate picture of community college effectiveness will emerge.
An examination of the ERIC document system since 1966 and other current
sources of literature in the field of educational research, student attrition and
retention research, student services or database management turned up no studies
dealing with community college student entry goals and their relationship to
outcomes assessment issues. This study is an attempt to "fill that gap", to provide
a model for collection of educational goal information before students enroll in
college, and to discuss methods for utilization of such information for the

assessment of educational outcomes and, more importantly, for the improvement
of learning.
Many published studies have dealt with graduates, their degree of success
after graduation, satisfaction with college experiences, contributions to society
after graduation and employer satisfaction with skills obtained by students while
enrolled in college. While these are important points to be considered for
students who want a credential, they ignore those students who enroll in college
for reasons other than credential attainment. During the five fall semesters from
1985 - 1989, 100,177 students enrolled in the community college system in
Virginia, while only 27,203 degrees have been awarded during that time, with
many students earning more than one degree (Virginia Community College
System Student Enrollment Booklets, 1985-1987, Table 3J). What happens to the
other (at least 72,974 in Virginia alone between 1985 and 1988) students who
enroll in college but do not graduate? Has the system failed them? Have the
students themselves failed?
A study conducted by the Community College System in California suggests
that the answer to both of these questions is no (Slark, 1988, p.12). Slark’s results
indicate that students sometimes enroll in college courses with a specific purpose
in mind other than graduation, and once that purpose is accomplished, they may
or may not choose to enroll in additional courses. The same may be true for
community college students who do not remain in college long enough to attain a
credential.
With recent mandates to assess the outcomes of a college education and
the effectiveness of educational institutions, it is increasingly important to
determine whether students who leave college prior to graduation or transfer do
so because the institution has not met their educational needs or because they
have accomplished their goals. In terms of institutional effectiveness, this
distinction may make the difference between counting a student as a success or a
failure on the effectiveness balance scale, and may affect curricular and
organizational decisions within the institution.
The Call for Action
Alfred (1985) presents a comprehensive analysis of the impact of changing
societal conditions, such as the transition to a global economy, tightening state
control, change in government spending priorities, and transition in the structure
of the family. In light of these conditions, one must question the utility of the
associate degree as a student outcomes measure for all students. Is it possible
that the degree may suffer a decline in utility among student and resource
markets as changing societal conditions alter constituency needs? "To illustrate,
in a labor market marked by increased emphasis on service and technological
jobs, students may perceive the degree as under-education for some jobs and over-
education for others." (Alfred, 1985, p. 5)
Alfred’s view is shared by many people who are involved in community
college education, perhaps the most notable of whom is Arthur Cohen, director of
10

the ERIC Clearinghouse for Junior Colleges, who characterized the community
college as being vastly different from four-year colleges in a variety of ways.
According to Cohen, "the community college is not like a traditional institution
with a faculty dedicated to inquiry, students committed to study, and a
sequestered enclave that supports both. Nor is it like the community itself... .
The (community) college is somewhere between." (Cohen, 1986, p. 14) He
encourages the development of inter-institutional connections which are made
stronger when community college staff work closely with universities in order to
identify and encourage transfers. Such inter-institutional connections include:
(p. 19)
1. Collecting information on intentions from entering students and
alerting the institution to which they are likely to transfer so that
early contact can be made.
2. Identifying characteristics of successful transfers so that the
information may be fed back to the sending institution.
Brawer, director of research at the Center for Study of Community Colleges
seems to agree with Cohen about the differences between community colleges and
four-year colleges. When addressing the Maryland Deans Meeting in March,
1988, Brawer stated that measures of success typically applied to senior colleges
are not sufficient for two-year colleges to demonstrate their contributions. "Some
community colleges offer lower-division courses for recent high school graduates
11

who aspire to the baccalaureate, a group accounting for around 35% of their
matriculants; progress toward degree attainment is a valid measure for that
portion of their effort. But one-third of their students seek skills enabling them to
gain immediate employment; 15% seek retraining or relicensure in a field in
which they are already employed; and 15%, many of whom already hold degrees,
take college-credit courses only for their personal interest. Half the students take
only one or two classes per term. Clearly, different measures must be applied to
account for institutional effect on those variant groups." (Brawer 1988, p. 2)
The first step in sorting out the variety of students, variety of goals, and
variety of outcomes is to establish the reason for the students’ matriculating. One
may not assume that all students in transfer classes want to transfer to four-year
colleges or that all students in vocational classes want to enter the job market.
The fact that courses carry transfer credit is an "artifact of college accreditation,
staffing and financing", (p. 6) and relates to the goals or intentions of only a
portion of the students enrolled.
Addressing the Issue
The current study focuses on the educational goals held by students when
they entered community colleges, the extent to which these goals were achieved or
exceeded, and the types of students most likely to achieve or exceed their stated
educational goals. The study was therefore guided by the following research
question: What is the effect of changing the definition of success for community
12

college students from on-time graduation (the traditional measure of success) to
long-term goal attainment on measures of institutional effectiveness?
1, To what extent are traditional measures of accountability used for
higher education appropriate for community colleges? Would
different measures of accountability be more valid indicators of
success than graduation rates?
2. To what extent do stated goals and goal-attainment differ by the
following groupings?
a. Race
b. Gender
Cc. Age
d. Full time or part time
e. Occupational/Technical or Arts and Sciences/Transfer
Students
f. Day or Evening Students
Significance of the Study
During the past ten years educational researchers have conducted many
studies of student retention. As Brawer stated in her address to Maryland Deans,
this area is an especially hot’ topic now, one that has generated both
considerable research and exhortation." (Brawer, p. 5) Brawer was correct in
Stating that this area has generated considerable research. In his most recent
13

book, Leaving College, Tinto listed no fewer than fifteen pages of references
dealing with attrition/retention studies conducted primarily over the last ten years.
As one of the nation’s leading researchers in the area of student attrition and
retention, Tinto concluded that students’ educational goal or "intentions regarding
participation in higher education generally and attendance at a specific institution
are important predictors of the likelihood of degree completion." (Tinto, 1987,
p. 40)
One problem with most retention studies, according to Brawer, is that their
usefulness “is limited by the fact that they were obtained from samples of younger
students. The CIRP surveys first-time-in-college-, full-time freshmen, 90 percent
of whom are aged nineteen or younger. The samples in other studies are not as
extremely biased, but they usually draw students only from among those taking
credit courses and often use the class itself as the unit of sampling, thus skewing
the sample in the direction of full-time students." (Brawer, p.7) A second
problem is that these studies rely on responses to questions such as "What is the
highest academic degree you intend to obtain?" This question suggests that a
degree is a goal to be reached at some point in the student’s life. Few persons
would admit that they never intend to go any further in the educational system
since doing so would be an admission that they have closed off one of life’s
options (Brawer). This question also does not assess students’ actual educational
goals, or reasons for attending college. A third problem is that these large data
sets do not provide for assessment at the individual college or even the state level.
14

Many administrators feel that, even if their students were included in such a large
study, the results would tend to mask their institutions’ contributions to individual
constituents.
The ERIC Clearinghouse for Junior Colleges in Los Angeles recently
published a report dealing with the types of statistical information available on
two year colleges. The search for information included materials contained in
ERIC, the Statistical Reference Index, the Ameri tatistics Index, and the
libraries of the University of California, Los Angeles. According to this report,
the ERIC Clearinghouse on Junior Colleges frequently receives requests for
information on the educational objectives of community college students.
Information requested frequently includes the percent of students who intend to
transfer to a four-year colleges and the percent who are enrolled to prepare for a
career that does not require a baccalaureate. According to this report, only
scattered data are available on the educational intent questions, and some of the
available data are unreliable. "This is a critical problem for two-year colleges;
often many colleges are criticized for the low proportion of students who transfer,
yet many community college students are enrolled for reasons other than pursuit
of a baccalaureate." (Cohen, 1985, p. 4)
In summarizing this report, Cohen states that
"Available sources of data on community colleges are useful to the
researcher who needs data on total expenditures, total enrollment, and the
demographic characteristics of student, faculty, and administrators. Three
15

limitations, however, circumscribe the value of these data in more complex
research problems: (1) lack of data that are disaggregated by program of
study; (2) the dearth of information on the educational objectives of
students, and (3) the scarcity of information on student outcomes, i.e. the
academic and vocational success of transfer students and program
graduates. In the final analysis, then, most available national and state data
sources are of little help in determining whether community college
students meet their educational objectives and in determining how the
colleges allocate resources between the academic and vocational curricula
in the college program." (p. 5)
To assess whether students are achieving their educational goals, one must
collect data from entering students to determine their reasons for attending
college and the goals they expect to achieve while enrolled. These students may
then be tracked for a number of years to understand goals and their effects on
subsequent college outcomes. One of the major benefits of utilization of such a
data set is that it would help researchers to assess outcomes through a thorough
understanding of educational goals. While such database utilization would not
enable one to assign causality, "the data can be viewed in terms of programmatic
decisions, student services, and other factors that colleges can control. The main
measure of goal attainment must be based on student outcomes. If you... can
16
acquire a valid database on that alone, you will have achieved a major step in
assessing student goals and outcomes." (Brawer, p. 13)
Brawer’s opinions about the importance of assessing outcomes in light of
student educational goals were given credence by the Commission on the Future
of Community Colleges, which stated that, "a community college, tied to local
community and a unique student population, should shape the elements of its own
evaluation.” (Commission on the Future of Community Colleges, 1987, p. 44)
Limitations of th
1. This study is limited to students who enrolled for the first time in
the community college system in Virginia in the fall of 1985.
The study tracked students for only four years, a period of time
which is insufficient to determine how many of the part time or
occasional students will eventually either complete an organized
program and obtain a credential or will attain their goals.
Only small to moderate size schools in rural areas of southwest
Virginia are included in the population.
This study is based upon the assumption that students accurately
reported their educational goal at the time of enrollment.
The racial balance of this population does not necessarily represent
that of the population in general, and conclusions regarding
17

differences among racial categories should be generalized with great
care.
18

CHAPTER 2
REVIEW OF RELATED LITERATURE
To close observers, the quality of higher education in this country is (a) an American triumph or (b) a national disgrace. Apparently our postsecondary system has the characteristics of a Rorschach inkblot: one sees what one is predisposed to see.
William Turnbull
Observers who see an American triumph point to the system of higher
education which has developed over the past two centuries in America, and which
is "unprecedented in its depth and breadth and in its accessibility.". (Turnbull,
1985, p. 23) Our research universities are a notch above those from other parts
of the world. They act as magnets for the ablest students from every continent.
At the same time, the breadth of postsecondary education in unequalled. "Our
colleges and universities now enroll about half of all high school graduates - the
highest proportion of any country in the world. The United States has the world’s
best ’system’ of higher education. This is a result, in part, of the system’s
diversity, ranging from multicampus public institutions to small private colleges
serving special constituencies." (Turnbull, p. 23)
Those who view the system as a national disgrace are appalled at what they
consider to be low quality within this diverse system. This group of observers
19

points to decay in the college course of study, evidence of decline and devaluation
everywhere, remedial programs designed to compensate for lack of skill in using
the English language, foreign language incompetence which is not only a national
embarrassment but a threat to the conduct of international business and
diplomacy, and the difficulty of the business community in recruiting literate
college graduates. (Turnbull, p. 23) During the past ten years, those who point
with pride have been greatly outnumbered by those who view our educational
system with alarm.
The idea of accountability is not new to secondary schools, which have
been repeatedly examined and found lacking in the area of turning out literate
high school graduates. Evidence of this may be found in the large number of
states which now require that all high school students demonstrate minimum
competency on tests of basic skills before they are presented with a high school
diploma. This is the public school system’s attempt to maintain standards of
quality represented by the high school diploma. Many college administrators,
legislators and educators have contended that quality control, or accountability,
measures are needed for postsecondary schools.
A number of important publications have focused attention on the need for
higher education institutions to examine their effect on students. In 1985,
Turnbull stated that, "Twelve states are considering whether or not to adopt a
State assessment policy ... another twenty have taken formal action to develop or
implement such policies." (p. 39) According to a survey sponsored by the
20

National Governor’s Association and reported in Results in Education (1988),
only fourteen states have not taken action to consider or begin campus programs
to assess undergraduate student learning. By 1991 twenty-seven states had
established statewide policy initiatives for higher education assessment, either
through board resolution, executive directive, or statute. "Further initiatives are
expected or planned in an additional dozen states over the next five years."
(Ewell, Finney, & Lenth, 1990.) These initiatives take a variety of forms,
including:
e common statewide testing of basic skills of incoming freshmen.
e periodic statewide testing of college students to determine program
effectiveness, and
e institutional submission of local assessment plans consistent with
their missions.
The National Governor’s Association endorses such actions, stating that "When
results are used to hold institutions accountable and to improve teaching and
learning on campus, improvement follows." (Turnbull, p. 39)
Ewell, Parker and Jones reviewed a number of national reports which have
acted as stimuli for statewide accountability, or assessment, mandates since 1983.
After reviewing A Nation At Risk, Involvement in Learning, To Reclaim a
Legacy, Integrity in the Curriculum: A report to the Academic Commission and
Time For Results: The Governor’s 1991 Report on Education, the authors
21

concluded that two themes are common to all of these reports. These are:
(Ewell, Parker, & Jones, 1988, p. 1)
1. Higher education in the United States must be improved if the
nation is to maintain its competitive edge economically, militarily
and politically. Quality in higher education has thus become an
anchor point for issues of economic development and national
competence.
2. Acquiring information on institutional effectiveness as a device for
improving effectiveness at individual institutions and for enhancing
policy oversight by legislative and other branches of state
government should be stressed.
When the above reports were published, many states already had
assessment programs in place, and many schools had established assessment
programs long before they were required to do so by their governing boards. Two
such schools are frequently cited as examples of the best way to assess outcomes:
Alverno College and Northeast Missouri State. The primary objective of their
programs is to serve as an additional mechanism for gauging an individual
student’s mastery of a particular body of knowledge in order to provide guidance
for future development. This individual developmental focus is the dominant
emphasis of their assessment programs (Ewell, 1985, p. 36). At Northeast
22

Missouri State, the three primary goals for collection of student outcomes data
are: (McClain, 1985, p. 37)
1, To know everything possible about the student.
2. To demonstrate that the university made a positive difference in the
student’s life.
3. To demonstrate that students who graduated from the university
were nationally competitive.
Alfred (1986) suggested that student outcomes may be viewed as a three-
dimensional construct comprised of (1) antecedent conditions such as economic
conditions, social attitudes, changing technology, and other factors that influence
student decisions related to college attendance and major field selection; (2)
educational process conditions such as performance in courses, instructional
strategies employed by faculty, and other factors that combine with antecedent
conditions to shape student decisions relative to degree completion and post-
college plans; and (3) outcomes achieved by students in work and further
education. The views of Alfred and administrators at Northeast Missouri State
are consistent with those of the National Governor’s Association which stated that
an assessment policy should, among other things, encourage faculty and university
officials to define and set goals for what students should know and learn.
A weakness of this point of view is that it does not consider the role of
individual student goals. While it is important for institutions to have stated
23

educational goals which are consistent with their overall mission, it is equally
important to understand students’ educational goals and how they fit in with their
overall career or professional intentions. It would seem that there should be a
shift of focus from strictly institutional goals to inclusion of individual student
goals when determining the success or failure of institutions of higher learning.
There have been very few studies focusing on students’ educational goals
when they enter college. The few which have been conducted dealt primarily with
four-year schools, and none have dealt with educational goals from the standpoint
of tying them to assessment of student outcomes or institutional effectiveness.
What exists in current literature is a call for action on the part of educators and
administrators from all areas of the country to begin collecting the type of data
described in this study and to use such information for the improvement of
college programs, and ultimately to improve student success in college.
ns from Four-Year Coll nd Universiti:
Published attrition research through the 1970s focused primarily on four
year colleges (Walleri, 1981) and on conceptual/statistical models for predicting
attrition (Tinto, 1975, 1982, 1987). The majority of community college studies
appear as unpublished technical reports, or as "published" entries in the ERIC
collection. Across higher education, most attrition occurs from the first to the
second year (Losak, 1986, p.3). National longitudinal data reveal that 40% of
first-time-in-college community college students leave after one year, as do 25%
24
of students in four year colleges (Fetters, 1977). Up to 35% of students in four
year colleges will never attain a degree (Jackley and Henderson, 1979; Ramist,
1981).
In examining why such a large proportion of students leave college before
attaining a degree, Tinto (1987) isolated two attributes which stand out as primary
roots of departure: unfocused intention and lack of commitment. "Each refers to
important dispositions with which individuals enter institutions of higher
education. These not only help set the boundaries of individual attainment but
also mirror the attributes, skills and dispositions of individuals prior to entry and
the effect of external forces on individual participation in college." (p. 39)
Tinto (1987) stated that individual intentions regarding participation in
higher education are good predictors of the likelihood of degree completion.
"Generally speaking, the higher the level of one’s educational goals, the greater
the likelihood of college completion. This is especially true when the completion
of college is seen as part of a wider career goal" (p. 40).
Tinto uses degree attainment, and specifically attainment of a four-year
degree, as the measure of student success or failure. He acknowledges that there
are students who leave college prior to degree completion simply because they
never had an intention to stay until degree completion. In four-year schools, such
students enroll for a specific reason such as the acquisition of additional skills, to
learn a different content area, or to obtain course credits (Tinto, 1987). Such
enrollment goals are associated with specific occupational needs or demands.
25

There is also a smaller group of students of limited participation who enroll in
college for the pleasure of learning.
Tinto also acknowledges other groups of students who leave four-year
colleges prior to degree attainment, such as college graduates who seek to retrain
themselves for the rapidly changing occupational market. Some students also
enroll with the expectation of transferring to a different institution in order to
obtain a degree or further training.
Mishler (1983) conducted a study of older students who returned to a four-
year college and graduated. Data on educational goals collected after students
had graduated indicated two primary reasons for students to return to college: to
develop a new career and to have the satisfaction of having a degree (Mishler,
1983, p. 218). The goal of satisfaction of having the degree also emerged in
research conducted by Eggert (1975) and Astin (1976).
Willingham (1985) stated that freshmen who declare their interest in or
commitment to a particular area of study are more likely to achieve in that area.
The author concluded that when students defined success as the attainment of a
four-year degree, their goals and interests added consistently to high school rank
and SAT scores in predicting success in college,
Differences B n Two-Year and Four-Year Col
As stated above, comparative studies find higher attrition rates at
community colleges than at four-year colleges or universities (Astin, 1975; Tinto,
26

1975, Beal and Noel, 1980). These institutional differences presumably remain
even when controlling for factors mitigating against community college student
success as traditionally defined (Losak, 1986). Many of these studies have been
criticized for applying large numbers of variables to small samples of students
(See, for example, Tinto’s 1975 critique of Astin). Tinto (1975) states that most
comparative findings are tentative at best. A more important consideration is that
all of these studies have been university oriented, utilizing success criteria and
timelines appropriate for four-year college students. They fail to consider the
“several missions of community colleges which may or may not involve attaining a
formal degree" (Losak, 1986) or the diversity of students who attend community
colleges.
Virtually every study of student attrition and retention contains reference
to the model of student persistence developed by Tinto (1975, 1982, 1987) in
which he specifies a reciprocal relationship between academic integration and
social integration. The earliest suggested improvements to Tinto’s model for
community college students was developed by Pascarella, Duby and Iverson
(1983). "These authors found that among first-time two-year college students
attending commuter institutions, student background characteristics had direct
effects on persistence that were unmediated by the extent of either academic or
social integration." (Voorhees, 1987. p. 116)
There does appear to be a general recognition that causes and
consequences of attrition differ greatly between two- and four-year colleges. Bean
27

and Metzner (1985) point out that many of the factors identified as increasing the
likelihood of attrition are especially prevalent for non-traditional students. They
are older, commute rather than live on campus, tend to be married or employed
off campus, and attend part-time. All of these factors limit the possible intensity
and duration of socialization into the academic milieu. Walleri (1981) states that
most community college withdrawals occur for valid reasons such as employment
and family responsibilities. Most students leave in good standing, are generally
satisfied with the help they received at the institution, and many will return to
postsecondary education at a later time (Lenning et al., 1980)
Much research indicates that increasing student involvement within an
institution increases retention. Specifically, activities which increase the amount
of interaction between the student and college personnel have been shown to
have strong positive influences on retention rates (Astin, 1985). Bean and
Metzner (1985) indicated that factors which increase the fit between the
institution and the student increase retention. Because of the diversity of students
present in community colleges, a good "fit" is less likely than at four-year
institutions.
Voorhees (1987) obtained essentially the same results in a replication of
the Pascarella, et.al., study of the effects of demographic variables on persistence.
He concluded that academic integration as measured by persistence, grade-point
average, number of informal interactions with faculty, and number of hours spent
studying each week, was not a predictor of persistence. In other words, none of
28

the explanatory variables could be considered a logit for persistence. This is an
important finding since community college students, because of other
commitments, may have less time to spend studying each week, and since most
live off campus, they have less interaction with faculty and other students.
Voorhees concluded that, "Academic integration may be of less importance in
explaining the persistence of community college students than corresponding
measures are in explaining the persistence of four-year college or university
students.” (p. 127)
Research in Maryland (Tschechtelin, 1976; Tschechtelin & McLean, 1980)
has identified a close relationship between students’ educational objectives and
actual educational attainment. Because of the availability of one- and two-year
career programs and specific-skill courses at community colleges, many students
who enroll in these colleges are not seeking four-year degrees. Most students who
enter four-year colleges, on the other hand are seeking at least a baccalaureate
degree (Eaton, 1988). In addition, students who enter community colleges are
not as likely to hold lofty educational goals as are students in the four-year sector,
and they are more likely to intend to depart prior to program completion even
when holding lofty goals (Tinto, 1987).
n m Other Two-Year Coll
Most community colleges do not survey students prior to enrollment to
determine the degree they hope to attain. An instructive lesson from the
29
California Community College system longitudinal studies is that inferences about
degree intent emerged after the fact when investigators attempted to explain why
so few students were graduating (Hunter and Sheldon, 1981). Students described
in the final report were those who had no intention of completing a degree
(Sheldon, 1982). In a subsequent study in the California Community College
system, information about educational goals was collected before students
enrolled in developmental/remedial courses. Slark and others determined that
many of those students dropped out after completing only the remedial courses.
When comparing the students’ educational goals at entry for the students who
dropped out, it was determined that many of the early dropouts were those whose
stated entry goal was to improve academic skills in order to be prepared for
college level work. They had no intention of doing more than completing
developmental/remedial courses (Slark, 1988).
Some researchers have used surveys conducted after students graduated to
determine the degree to which educational goals were met. Student’s age at entry
has been shown to have an impact on goals and commitment to goal achievement
(Midgen, 1985; Mishler, 1983). Midgen’s (1985) study indicated that both
traditional and nontraditional (those over the age of 24 at the time of enrollment)
students had career-oriented goals, but that while traditional students were
interested in preparing for their first career, nontraditional students were
interested in making a career change or improving their chances for a promotion.
Achievement of educational goals was not found to be related to age in these
30

studies. This is a potentially important finding since community colleges serve a
large number of nontraditional, older students.
As mentioned above, national studies of community college effectiveness
have been limited by the fact that they have not investigated alternative benefits
for those students who do not achieve bachelors degree or other goals. For
community college students, the issue of alternative outcomes is particularly
important, since short-term career program alternatives that do not exist in four-
year colleges are available to community college entrants (Eaton, 1988).
Therefore, the fact that community college students can have a much broader
range of entry-level goals is an important factor to be considered when assessing
community college effectiveness.
Breneman and Nelson (1981) conducted an analysis of data contained in
the National Longitudinal Study of the High School Class of 1972 in which they
examined the outcomes of college attendance. According to these authors, the
diversity which is a source of strength in the community college sector contributes
to a proliferation of judgments on outcomes from community college experiences.
"The analogy of the blind men trying to describe an elephant applies quite well in
that many observers see only a few activities of one institution and assume that
the rest are similar." (pp. 54-55)
As institutions designed to serve a wide variety of students, community
colleges offer no simple criterion or definition of success. At four-year
institutions, good grades, graduation and achievement in one’s chosen field are the
31

standard measures of accomplishment. "But the relevance of these measures for
community colleges is questionable." (Breneman and Nelson, p. 55) Even such a
simple decision as whether dropping out represents success or failure is not simple
for community colleges, where students may enroll in order to learn a specific
skill and not enroll in subsequent terms because the goal has been achieved. Are
such students dropouts, or are they goal attainers?
As mentioned above, national longitudinal data reveal that 40% of first-
time-in-college community college students leave after one year and that 25% of
students at four-year colleges do also. (Fetters, 1977) Up to 35% of students
entering four-year institutions will never get a degree. (Morris and Losak, 1986)
Only recently have research reports emerged which account for the diversity of
community college students educational goals and to speculate that at least some
of the students who leave after one year may be leaving because they have
reached their goals.
Community colleges have just begun to "scratch the surface of the total
adult population desiring postsecondary education." (Lenning and Hanson, 1977)
During the late seventies and early eighties, community colleges enrolled adults
with traditional high school academic backgrounds who were not representative of
low income and academically unprepared students in younger age groups.
"Postsecondary education embraces an increasingly large segment of the public,
yet the public image of the typical undergraduate remains locked in the stereotype
of a middle class, full-time, academically able nineteen-year-old pursuing a
32
baccalaureate degree which ’he’ will complete within four years." (Morris and
Losak, p. 1)
The general public is not the only group maintaining stereotypical images
of higher education students. Research reviewed thus far has focused primarily
on graduates of both four-year and two-year colleges.
"Graduation as a success criterion carries with it the clear implication that
leaving college without a degree is non-success. Students who ’fail’ to graduate
are automatically tallied against college success." (Morris & Losak, p. 3) This is a
potentially dangerous practice since overall graduation rates are expected to
decline as a result of protracted attendance patterns typical of nontraditional
students. The most common criterion of postsecondary educational success, on-
time graduation, ignores the fact that across all higher education in the United
States, "stopping out" of college has become more prevalent and part-time
enrollment is on the rise. (Eckland & Henderson, 1981)
Miami-Dade Community College utilizes three separate dimensions to
measure its success (Morris & Losak):
1. Academic Standing - Most who stop short of a degree leave in good
standing.
2. Persistence
a. Students still enrolled
b. Graduates
C. Attainers - Completed goal and left prior to graduation.
33

3. Goal Attainment - Recognized as an important mitigating variable
in literature on attrition.
An examination of more than forty research reports on dropouts by Bean
and Metzner (1985) concluded that attrition should be defined in relation to
student expectations and attainment of stated goals. The authors stated that
conceptual models used to study college students define a dropout as someone
who "enrolls at an institution one semester but does not enroll the next semester
and has not completed his or her formally declared program of study." (Bean and
Metzner, 1985, p. 189) Such definitions are limited by the fact that they offer an
institutional rather than a national perspective, and that "the period considered
(semester to semester) is brief, so that stopouts would not be differentiated from
dropouts." (p. 189) The difference between stopping out and dropping out is
crucial for non-traditional students, who typically exhibit protracted attendance
patterns or else transfer. Tinto (1982) also emphasized that the term "dropout"
should be reserved for students who fail to complete their goals.
An application of the "traditional" definition of success and goal attainment
to "traditional" students at Miami-Dade (Morris & Losak) revealed a 70% success
rate. After two years, 13% of the students had graduated. This figure increased
to 31% after four years, illustrating protracted attendance patterns discussed
above. More importantly, 9% of the students were still enrolled and 30% had left
in good standing. A problem with the Morris and Losak study is that only
34

traditional, college-age students were included, thereby excluding nontraditional
students who are becoming more and more important to community colleges.
The only study which attempted to relate student educational goals at entry
to goal completion was conducted by Slark, et. al. (1988) for the California
Community College System. At the end of one semester of work, developmental
and remedial students indicated they had accomplished more course objectives
than they had originally intended. Clearly, "student outcomes cannot be
adequately described with only one semester’s worth of work, particularly for
community college students who . .. move through the curriculum and progress
towards their goals slowly." (Slark, et.al, 1988, p. 42), but Slark’s results indicate
that students have educational goals clearly in mind when they enroll. The
practice of identifying entry-level goals and assessing goal completion is in need of
attention for program development and for research methods development.
Two areas may be examined, according to Breneman and Nelson (pp. 61-
62), which will improve future studies:
1. Basic student characteristics such as sex, age, and full-time or part-
time attendance status and information about the type of program
should be identified. Where included, these factors were generally
strongly related to short-term outcomes. Students’ educational goals
or intentions upon first enrolling also seemed important to consider.
2. Comparisons are essential to examinations of outcomes: for
example, between those included in follow-up studies and the rest of
35
the student population, or between a particular kind of student at
one college and his counterpart in another two-year or four-year
institution.
Most research conducted on community college attrition and retention
have focused on graduates who complete their program of study after two years.
This is partly an artifact of the close association of two- and four-year colleges
when community colleges were in their infancy, when many two-year colleges were
created as branches of well-established four-year institutions. Definitions of
success measures typically were prescribed by the four-year institution. While
such close associations were in existence, such definitions were appropriate, but as
community colleges have grown and matured, and as legislation requiring new
accountability measures has been passed, it has become increasingly necessary for
two-year institutions to change their "measuring sticks" for institutional
effectiveness. Ewell stated that "notable changes have taken place in the
conceptual basis of assessment measurement." He suggests that a shift away from
the traditional value-added approach to assessment and toward "complex
formulations demanding truly longitudinal research designs and a theoretical
foundation" is needed. (1991, p. 76)
Seventy-five percent of all college administrators think the assessment of
student outcomes is a good idea whose time has come. More importantly, almost
all, 91%, think that such assessment should be linked to instructional
36

improvement. (El-Khawas, 1986) In other words, the assessment of student
outcomes should not be an end in itself but rather should be an integral part of
an institution’s strategy to improve teaching and learning. (Cross, 1987) How
better to integrate assessment efforts into the total effectiveness framework than
by seeking to provide feedback needed by the institutions to help students achieve
their educational goals?
In addition, community college researchers would do well to heed the
advice of the American Association of Community and Junior Colleges
Commission on the Future of Community Colleges (1987) which stated that in
order to preserve both access and excellence, great care must be exercised to
ensure that "outcomes assessment" and "accountability" do not become code words
for a new elitism, nor should the assessment of student outcomes be considered as
the only dimension of accountability. Quality must not be measured in terms of
how many students are excluded from the educational process, but by meeting
students where they are, by good teaching, and by providing services needed for
students to fulfill their career and educational objectives.
37

CHAPTER 3
METHODOLOGY
This chapter describes the population, variables under consideration, and
data collection and analysis methods. The population description includes
information about which colleges were selected and why. Specific student
selection issues are not discussed because all students on a selected college’s
database are included in the study.
Variable specification and definition includes information about
demographics, student attributes such as their curriculum division, courseload,
time and location of attendance, and whether they were developmental students.
A major part of this section deals with students’ educational goals stated at the
time of application for admission. Closely associated with educational goals is a
definition of how goal attainment is measured.
Finally, statistical analyses are described and information about computer
hardware and software is provided.
Population
All students who enrolled for the first time in fall, 1985, in a community
college whose chief executive officers agreed to participate and whose
computerized student information files are maintained at the Western Regional
38

Computer Center at Virginia Western Community College were included in the
population. In all, nine out of the ten college presidents agreed to participate.
Letters of permission to use college data as well as a copy of the letter of request
are included as Appendix A. Because they were guaranteed anonymity, names of
the institutions are not included in this report. Instead, each college was given a
code number between one and nine, and results are reported by code.
To further ensure anonymity, a log transformation was applied to
enroliment data. This was necessary because enrollment data are public
information and anyone could examine community college system reports and
determine which colleges were involved in the study and nobody can compute the
anti-log. The logarithmic transformation had no effect on percentages, rank
orders, or any other statistics reported and interpreted in this document. It does,
however, disguise exact enrollment figures. All statistics reported are calculated
using transformed data.
Fall, 1985 was selected because it was the first term in which the Virginia
Community College System used the computerized Student Information System,
from which data for this study were extracted. Because of the protracted
attendance patterns of community college students discussed above, it was
important that the earliest possible term be used to provide ample time for
students to attain their goals. Schools in the western region of the state are on
the same central computing system, the Western Regional Computer Center at
Virginia Western Community College, for which access was provided, and data
39

needed to conduct the study were centrally available for all schools on the system.
Additionally, data elements and file structure were consistent for all of these
colleges. As Table 1 indicates, the adjusted total number of students enrolled for
the first time in fall, 1985 is 11,553.
Variabl ification
This study examined demographic, achievement and educational intention
variables to determine which students did not achieve, exactly achieved, or
exceeded their educational goals.
Dem hic Variabl
Demographic variables examined in this study included the following:
1, Student Type - Traditional or Non-Traditional - Age of the student
when enrolled for the first time in the Virginia Community College
System. For the purpose of this study, age was used as a general
indicator of whether the student was a recent high school graduate,
a college student in the traditional sense, or a non-traditional
student who had been away from school for a number of years and
was at least 25 years of age at the time of initial enrollment.
2. Gender
40

3. Race - These three categories are Black’, White’, and Other’. The
Other’ category includes any student who does not fit in the first
two, including native Americans, Asians, Hispanics and Pacific
Islanders.
4. Community College Attended
As Table 2 indicates, 54.4% of the population was female and 45.6% was
male. The most disproportional category is race. Nearly 94% of the population is
white, while only 6% is black, and less than 1% fits in the Other’ category. It is
also evident from Table 2 that non-traditional students far outnumber traditional
college-age students who graduated from high school and then went to college
within a short period of time.
41

Table 1
Relative Size of Participatin Hl B n Adjusted Fall, 1985 Enrollmen
Data
Community College Adjusted Number of Students
1 809
2 855
3 880
4 910
5 1,000
6 1,148
7 1,427
8 2,002
9 2,522
TOTAL 11,553
Source: Fall, 1985 VCCS Student Information System, Subprogram 505
42

Table 2
hic ription of P ion
N %
Gender
Male 5,264 45.6
Female 6,289 54.4
Race
Black 689 6.0 White 10,818 93.6 Other 46 0.4
Non-Traditional /Traditional Non-Traditional 8,191 70.9
Traditional 3,362 29.1
43

Student Attribute Variables
Student attribute variables examined include the following:
1. Curriculum - The specific curriculum in which students enrolled;
included for the purpose of grouping students by program or
division. This is a categorical variable, with each curriculum being
coded according to guidelines established by the Virginia
Community College System. (See Appendix B.)
Division - Students were grouped according to the division with
which their curriculum was most closely associated. The two
divisions are Occupational/Technical and Arts and Sciences.
Courseload - This indicates the number of credit hours students
took each semester. Students were categorized according to the
number of quarter hours for which they were registered. Those
who took fewer than 12 hours were considered to be part-time
students, and those registered for 12 or more were considered to be
full-time. This variable was coded for each academic term, since
students could be part-time one term and full-time another.
Time of Attendance - Classified students by the time of day that
they attended college. This variable was included for each
academic term, since students may attend during the day one term
and in the evening another.

5. Developmental - Classified students according to whether they took
a developmental class or not. This is a general indication of
academic ability at the time of initial enrollment.
6. Place of Attendance - This variable describes whether students took
courses primarily on or off campus. A Separate category is reserved
for those students who took an equal mix of on-campus and off-
Campus courses.
Table 3 breaks down the numbers of students by these attribute variables.
From this table, it is evident that the vast majority of community college students
involved in this study chose to enroll in the occupational/technical division
(63.8%), compared to only 20.0% unclassified and 16.2% in the college transfer
division. This is consistent with information in Table 2 which states that about
70.9% of the students are non-traditional. One would expect that the majority of
college transfer students would be those who have recently graduated from high
school and are collecting credits to transfer to a four-year institution.
45

Table 3
Students Classified by Attribute Variables
N %
College Division Unclassified 2,312 20.0 Occupational/Technical 7,375 63.8 Arts & Sciences/College Transfer 1,866 16.2
Courseload - Number of Quarters of Full-Time’ Study
0 7,826 66.9 1 990 8.6 2 576 5.0 3 596 5.2 4 298 2.6 5 206 1.8 6 575 5.0 7 235 2.0 8 112 1.0 9 91 0.8 10 37 0.3 11 13 0.1 12 2 0.02
Time of Attendance Day 6,523 56.5 Evening 4,183 36.2 Both 847 7.3
Developmental/Non-Developmental Developmental (0) 573 5.0 Non-Developmental (1) 10,980 95.0
Place of Attendance
On Campus 9,560 82.7 Off Campus 1,702 14.7 Both 291 2.5
"Full-Time Study: Student took at least 15 quarter hours during the term.
46

Two-thirds of the students did not complete a single quarter
in which they were enrolled full time (12 or more quarter
hours).
Table 3 also indicates that most students (56.5%) took the majority of their
classes during the day rather than in the evening, and that very few (7.3%)
attended an equal number of classes during the day and in the evening (the
"Both" category). A similar pattern holds true for on campus vs. off campus
attendance. Most students (82.7%) attended class on campus, compared to 14.7%
off campus attendance. Only 2.5% of the students attended nearly equal numbers
of on and off campus courses. Only 5.0% of the students involved in this study
are classified as developmental students, meaning that they took at least one
developmental studies course.
Educational Goal
Community colleges involved in this study ask students to indicate their
educational goals at the time they apply for college admission. A sample copy of
the data collection instrument used at one of the institutions is included as
Appendix C. All colleges involved use similar data collection tools, and computer
codes are standardized for all colleges on the Western Regional Computer Center
system. It may be noted that the Code Book contains far more curricular codes
than those included in Appendix C. This is because each college may select
curricula from the state curriculum guide which contains a much wider variety of
47

curricula than those found in a single school. Codes included in Appendix C
represent all of those in use by participating colleges during fall quarter, 1985.
Educational intention choices are divided into two groups: Curricular and Non-
Curricular choices. Curricular choices include options which eventually lead to a
credential in the form of a certificate, diploma or degree. Non-curricular choices
include options which do not typically lead to the acquisition of a credential.
For the purpose of this study educational goals were grouped into eight
categories. The first category contained students who stated that their primary
purpose was to audit a course (5030), to enroll for personal satisfaction (5024), to
obtain credits to transfer to another community college which they attended
(5025), and to obtain college credit while still attending high school (5027).
Auditors and students attending for personal satisfaction make a natural grouping
because of the manner in which they are handled on the computer system, and
because their stated goals are to attend that particular college for a short period
of time to obtain information, skills, or credits not necessarily leading to a
credential from that college. Typically, students who wish to audit a course are
listed in the personal satisfaction category and are changed to audits after several
weeks of course work if they decide they do not want to receive credit for the
course. Many community colleges discourage students from signing up to audit a
course before they have had an opportunity to try it for credit. Students who
attend high school or a different college were also included in the first category.
48

These students stated that their educational goal was to obtain credits which may
be transferred to the other school which they are attending.
The second category included students who enrolled in a community college
to upgrade job skills, either to improve performance on their current job (5021) or
to develop skills for a new position (5022), and students who are undecided about
career or occupational choices (5023) and wish to explore their options.
The third category included students who desire to obtain more credit
hours than the previous two categories. Such students are enrolled in continuing
career studies (4221), which means they plan to earn 15 to 30 credit hours, or they
are waiting to enroll in a curriculum, either because of lack of space (5029) or
they have not met all entry requirements for the curriculum (5028).
Remaining categories were arranged according to the number of credit
hours needed to complete the program. One-year certificate, two-year diploma,
and A.A.S. programs are primarily occupational/technical programs designed to
provide graduates with skills and knowledge needed to enter or advance in the job
market. They typically do not include the extensive general education
requirements of a A.S. degree, and graduates of these programs usually do not go
on to four-year institutions. A.S. degree programs include a more stringent
general education component and are frequently used as a stepping stone to a
four-year degree. Entry goal categories and their descriptions are included in
Table 4.
49

For the purpose of this study, educational goals were measured at a single
point in time. Virginia community colleges currently collect this information only
at the time of initial application. No attempt was made to determine whether
these goals were stable over time, as students may change their minds about what
they hope to accomplish during their community college careers.
Attainment Variables
Several measures of student attainment were used to determine whether
goals had been met. This information was captured at two points in time:
1, At the end of spring quarter, 1987; two years after initial
enrollment - the amount of time used in traditional success
measures (on-time graduation)
2. At the end of spring semester, 1989.
50

Table 4
Definition of E tional ]
Goal Definition
1 Auditing and do not plan to obtain credit for any courses Taking courses for personal satisfaction High School Student enrolled concurrently in the community college Student enrolled at another college and planning to transfer the credit
Upgrading skills for job currently held Developing skills for new job Undecided about career
Continuing Career Studies Mini Certificate Program (15-30 credit hours) Cannot enroll in program of choice because of limited enrollment Haven’t met entry requirements for program of choice
One-Year Certificate program (45-51 credit hours)
Two-Year Diploma Program (91 credit hours)
Planning to transfer to a four-year college or university before earning a degree
Two-Year College Transfer program (97 credit hours)
Two-Year Associate in Applied Science Program (98 or more credit hours)
51

These two measures represent short-term (1987) and long-term (1989)
measures of attainment and were calculated from data collected at the end of
each academic term. Information collected for each academic term includes:
1. Number of Credit Hours Earned - This was calculated by converting
credits earned after spring, 1988 to quarter hours and then summing
across all terms since fall, 1985.
Grade Point Average - Information about grades was collected in
the form of cumulative grade averages (GPA) in spring, 1987 and
spring, 1989.
Enrollment Status - A dichotomous variable coded ’0’ if the student
is not enrolled and ’1’ if still enrolled each term.
Graduation - Also a dichotomous variable coded ’0’ if student did
not graduate during the academic term in question or ’1’ if
graduation occurred during that term.
Goal Attainment - A dichotomous variable coded ’0’ if student did
not attain stated educational goal and ’1’ if educational goal was
attained. Attainment is defined for credential-seeking (Curricular)
students as earning a credential. For non-curricular students,
attainment is defined in terms of the number of credit hours
required to reach stated educational goals.
52

From these data elements, cumulative information was calculated as
described above. Total number of credit hours earned since fall, 1985, number of
terms required to attain goal, number of terms enrolled and cumulative GPA may
be calculated at the end of spring quarter, 1987 and at the end of spring semester,
1989.
Criteria for determining whether students met their stated goals are
included in Table 5. Because of the make-up of the database, it was necessary to
establish criteria dependent upon the number of quarter hours attained and
credentials awarded. Therefore, a student whose stated educational goal is
development of career skills (Goal 2) was counted as successful if he or she
attained a total of twelve credit hours. Students who did not earn at least twelve
credit hours were counted an non-successes, even if they actually improved skills
needed for their careers.
Pilot Study
Data collection methods were pilot tested using data from one of the mid-
sized colleges. Statistical Analysis System (SAS) software was used to extract data
from computer files at the Western Regional Computer Center in Roanoke, VA,
and to build the database used in this study. SAS programs were tested against
the college’s data files and a complete analysis of data was conducted before
proceeding to the files from other colleges. No institutional identification is
53

Table 5
riteria for Attainment of E tional 1
Goal Criteria
1 Student completed at least one course, either for credit or not
2 Accumulated at least twelve quarter hours
3 Accumulated at least thirty quarter hours
4 Earned a credential in a One-Year Certificate Program (45-51 credit hours)
5 Earned a credential in a Two-Year Diploma Program (91 credit hours)
6 Earned at least 90 quarter hours
7 Earned an A. S. degree (97 credit hours)
8 Earned an A. A. S. degree (98 or more credit hours)
54

included in this report in accordance with the wishes of some of the presidents of
participating colleges.
Statistical analysis consisted of descriptive statistics such as means, standard
deviations, and frequencies or percentages broken down by students’ educational
goals, curriculum, demographic variables, time of attendance, courseload, and
other variables which are described in the variable specification section. For
categorical variables, frequency tables were generated to describe the point in
students’ educational careers at which they leave college as well as describing
types of students who persist until they attain their educational goals. Such tables
contain information for students who leave before attaining their stated
educational goals, who attain their goals exactly, and who exceed their goals.
For continuous variables such as grade point averages (GPA’s) and number
of terms enrolled, means and standard deviations were compared by the following
categories:
1, Curriculum
2. Gender
3. Race
4. Courseload: Part-time /Full-time
5. Time of Attendance: Day/Evening
6. Goal Attainment: Didn’t Achieve, Achieved Exactly, Exceeded
55

10.
Educational Goal
Developmental/Remedial Student
Age at entry
College Division: Occupational Technical or College Transfer
56

CHAPTER 4
RESULTS
Educational Goals
When college enrollment was broken down by students’ educational goals,
it became evident that some schools did not counsel their students to select
certain goals, or that they encouraged them to select others. As Table 6
illustrates, at one school (College 9) more than 52 percent of the students selected
Goal 2 - "To upgrade skills or to develop skills for new job", while no students
listed Goal 6 - "planning to transfer to a two-year college prior to earning a
degree." In contrast, only 0.1% of the students at College 8 stated that they were
enrolling for the purpose of developing career skills, while nearly 36% stated that
they were seeking a one-year certificate (Goal 4). Such trends may be a function
of college philosophy as much as they are student aspirations. Counselors at one
college may encourage students to list as their goals the attainment of a two-year
degree prior to transferring to a four-year institution (Goal 7), while another
college placement officer may encourage students to select Goal 6 - to earn credit
hours which may be transferred to a four-year institution, with no intention of
attaining a two-year degree.
The population of each college was classified by the students’ educational
goals at entry, and is reported in Table 6. For the population as a whole, the
37

Table 6
Breakdown of Population by Educational Goal
Goal 1 2 3 4 5 6 7 8 N= 1906 3443 244 #1702 164 97 940 3057
College
1 (n=809)" 13.2 32.3 0.1 10.2 12.2 3.8 28.1
2 (n=855) 35.1 11.9 21 20.6 3.9 2.4 26.1
3 (n=880) 33.6 23.9 9.4 6.7 0.1 26.6
4 (n=910) 11.0 31.8 27. 99 0.8 2.5 13.7 27.6
5 (n=1000) 18.2 39.8 0.1 1.03 3.5 38.0
6 (n=1148) 30.7 23.2 0.2 14.0 0.8 0.3 30.7
7 (n=1427) 6.9 41.7 17.8 0.1 33.5
8 (n=2002) 15.1 0.1 0.1 35.8 208 281
9 (n=2522) 6.8 52.4 4.4 6.2 0.6 15.7 139
Total (n= 11,553) 16.5 29.8 21 14.7 1.4 0.8 81 26.5
Note: Goal 1 = Auditing, Personal Satisfaction, or only planning to take one course Goal 2 = Developing Career Skills Goal 3 = Career Studies Mini-Certificate
Goal 4 = One-Year Certificate
Goal 5 = Two-Year Diploma Goal 6 = Transfer to Four-Year College (No Degree) Goal 7 = Two-Year Transfer Program (A.S. Degree) Goal 8 = A. A. S. degree
“Community College population figures reported here are logarithmic transformations of actual population figures.
38

most frequently selected goal was to upgrade skills for a current job or to develop
skills for a new job. This goal (Goal 2), selected by 29.8% of the population, was
followed closely by the attainment of a two-year associate degree (Goal 8),
selected by 26.5% of the population. The smallest number of students, only 0.8%,
indicated that they planned to transfer to a four-year college or university prior to
earning a degree, or that they planned to enroll in a two-year diploma program
(1.4 percent).
Between schools comparisons indicate few discrepancies from the
population as a whole. Two of the most dramatic discrepancies are for College 1
students who selected a Two-Year Diploma Program (Goal 5), and College 3
students who selected a Two-Year College Transfer program (Goal 7). In the
first instance, only 1.4% of the population as a whole selected the goal, compared
to 12.2% for the college. In the second example, only 0.1% of the students at
College 3 selected Goal 7, compared to 13.7, 15.7, and 20.8 percent of the other
colleges who offered this option.
While such differences among colleges included in the sample are
important because they may explain some of the variability in the proportion of
students who select educational goals, population totals and percentages should
also be noted. Column percentages, representing the population as a whole,
ranged from 0.84 to 29.8, with all goals represented to some extent. The smallest
number of students stated that they planned to transfer to a four-year college
prior to earning a degree, whereas 8.1% who stated that they planned to earn a
59

degree first. Discussions with community college administrators and placement
officers indicated that this is typical of students who plan to earn two years of
credit at a community college prior to transfer to a four-year college or university;
they decide that they "may as well go for a two-year degree since they must earn
almost enough credits to do so before transferring." (C. R. Joyce, Personal
Communication, April 25, 1989)
Demographic Factors
When demographic factors are broken down by college goals stated at
entry, it is evident that entry-level educational goals are not consistent across all
groups of students. As Table 7 illustrates, there are extreme differences between
some of the categories. For instance, while only 16.5 percent of the population
selected Goal 1 (completing a single course), 80.2 percent of the Unclassified
students selected this goal. These are perhaps the students who are still in high
school and trying to "get ahead of the game" or college students who intend to
take courses at a community college and then transfer the credit to their home
college or university.
Students in the "Other" category for "Race" were far more likely to select
Goal 3 (Upgrading or Developing Job Skills) and far less likely to select Goal 4
(One-Year Certificate Program) than the population. It should be noted that
there are very few students in this category, and the 11.4% represents only eight
60

Table 7
Percent of nts in Each Dem hi ory Broken Down by Educational
Goal Selected at Entry
Goal Total
1 2 3 4 5 6 7 8 N %
n= 1906 3443 244 1702 164 97 940 3057 11,553
% = 16.5 29.8 2.1 14.7 1.4 0.8 8.1 26.5
Gender
Male 13.7 30.5 22 174 2.9 0.7 6.6 268 5,264 45.6
Female 18.8 29.2 2.0 12.5 0.2 0.9 9.4 26.2 6,289 54.4
Race
Black 11.7 23.7 1.7 17.1 3.3 0.8 98 31.8 689 6.0
White 16.8 30.2 2.1 14.7 13 0.8 8.1 26.1 10,818 93.6
Other 20.0 286 11.4 43 0.0 0.0 2.9 32.9 46 0.4
Time
Day 12.4 22.5 1.5 17.6 2.4 O8 10.0 32.7 6,523 56.5
Evening 23.4 42.6 3.0 10.0 0.2 0.6 53 149 4,183 36.2
Neither 14.7 22.3 2.2 15.7 0.1 19 7.9 35.4 847 73
Dev./Non-Dev. Develop. Non-Dev. 13.3 9.1 3.1 13.4 1.7 0.7 148 438 573 5.0
16.6 308 21 148 #14 = «08 78 25.7 10,980 95.0
College Division
Occ./Tech. 0.0 43.7 0.0 230 22 £00 0.0 31.0 7,375 63.8
Coll. Trans. 3.5 0.0 0.0 0.0 0.0 52 50.4 40.9 1,866 16.2
Unclassified 80.2 92 10.6 0.0 00 0.0 0.0 0.0 2,312 20.0
Location
On 15.3 27.0 2.5 15.3 1.7 1.0 9.0 28.4 9,560 82.7
Off 23.2 45.4 05 111 O00 0.1 3.3 163 1,702 14.7
Neither 20.5 31.1 0.0 17.3 0.3 1.4 78 21.6 291 2.5
Age Non-Trad. 15.1 39.0 2.2 16.2 07 08 5.8 203 8,191 70.9
Trad. 199 7.4 20 112 33 11 139 41.4 3,362 29.1
Note: Goal 1 = Auditing, Personal Satisfaction, or only planning to take one course
Goal 2 = Developing Career Skills Goal 3 = Career Studies Mini-Certificate Goal 4 = One-Year Certificate Goal 5 = Two-Year Diploma
Goal 6 = Transfer to Four-Year College (No Degree)
Goal 7 = Two-Year Transfer Program (A.S. Degree) Goal 8 = A. A. S. degree
61

students. To determine whether this is truly representative of Asian, Native
American, Pacific Islanders and other students who might be classified in this
category, it would be necessary to examine the goals of a larger sample of this
segment of the population.
Evening students seem to be less likely to select educational goals which
require long-term commitment, such as the attainment of a degree. On the
contrary, these students seem to be those who have immediate educational needs,
i.e., upgrading skills for a current job, or taking courses for pleasure. The large
number of evening students who selected Goal 2 (Upgrading or Developing Job
Skills) is not surprising since one would expect persons who have full-time jobs to
attend college after working hours.
When time of attendance is compared to location, almost identical patterns
emerge, as nearly equal numbers of day students and on-campus students have
similar goals, and similar numbers of evening and off-campus students have
similar goals.
As would be expected, traditional students, those who have recently
graduated from high school, are more likely to select Goals 6, 7 and 8 (College
transfer or A.A.S. degree) than the population in general. These are students
who are using the community college as a stepping stone to a four-year degree, or
who have career goals which require a two-year degree.
62

Course-Taking Habits and GPAs
An examination of students’ course-taking habits by educational goals
indicates that students who enroll for the purpose of attaining a credential
attempt and complete more quarter hours than students who enroll simply to
enhance their skills and knowledge. Table 8 illustrates that students who selected
Goals 1 and 2 had attempted an average of 6.3 and 5.0 quarter hours respectively
by the end of two years. These numbers changed only slightly by the end of the
four years of study. It is evident that such students enroll with a singular purpose
in mind, to take the courses necessary to accomplish their goal, and then do not
continue their studies. It should be noted that by selecting Goal 1 students
indicated that they intended to take a maximum of one course, and the fact that
the average number of credit hours attempted by this group far exceeds that
number is an indication of community college holding power.
On the other hand, students who wanted to complete a two- or four-year
degree increased the number of quarter hours attempted by greater margins
between 1987 and 1989. For example, students who enrolled in a two-year college
transfer program (Goal 7) took an average of 30.5 quarter hours by the end of the
second year, and had increased that average by 10.2 quarter hours at the end of
four years. Similar patterns are evident for other credential-seeking students.
Students who wanted to earn a two-year diploma seemed to be more persistent at
taking courses, as they attempted an average of 67.3 quarter hours during the first
two years, a figure that increased to 76.8 during the next two years. This average
63

Table 8
Number of quarter hours enrolled and completed and grade point averages
broken down ional n
Goal 1 2 3 4 5 6 7 8
n 1906 3433 244 1702 164 97 940 3057
% 16.5 29.8 2.1 14.7 14 08 8.1 26.5
Number of Quarter Hours x 6.3 5.0 112 176 673 17.4 30.5 37.2
Attempted by Spring 1987 SD = 12.0 82 175 298 640 21.1 39.6 49.1
Number of Quarter Hours x 9.4 6.4 15.2 23.1 768 21.4 40.7 45.9
Attempted by Spring 1989 SD 19.8 12.1 259 37.1 73.8 280 509 83.3
Number of Quarter Hours x 5.8 4.6 9.4 17.2 662 156 286 33.3
Completed by Spring 1987 SD 11.5 7.7 164 28.2 62.7 20.4 38.1 46.1
Number of Quarter Hours «x 8.7 59 13.2 21.0 72.1 249 37.1 41.9
Completed by Spring 1989 SD 189 115 248 35.2 72.2 270 48.7 57.4
n 1547 2603 205 1615 161 94 866 2953
GPA, 1987 x 3.1 3.5 2.4 29 25 26 2.2 2.6
SD 3.1 3.0 2.3 2.7 20 2.5 £22 2.7
GPA, 1989 x 2.7 3.4 2.4 29 24 2.5 2.4 2.6
SD 3.0 3.0 2.4 2.7 20 25 22 2.7
Note: Goal 1 = Auditing, Personal Satisfaction, or only planning to take one course Goal 2 = Developing Career Skills Goal 3 = Career Studies Mini-Certificate
Goal 4 = One-Year Certificate
Goal 5 = Two-Year Diploma Goal 6 = Transfer to Four-Year College (No Degree) Goal 7 = Two-Year Transfer Program (A.S. Degree) Goal 8 = A.A. S. degree
increase of 9.5 quarter hours attempted may seem small, but it is reflection of the
fact that all students who enrolled for the first time during the fall of 1985 were
included in the calculations, whether or not they were still enrolled between 1987
and 1989.
Grade point averages (GPAs) indicate that students who select
Goals 1 and 2 tend to earn higher grades in the few courses that they take than
students who select other goals. At the end of two years, the average GPA for
“occasional” students was above 3.0 on a 4-point scale. This compares to a range
of 2.2 to 2.6 for credential-seeking students. After four years, the trend is the
same. "Occasional" students’ GPAs clustered around the 3.0 mark, while long-
term students ranged from 2.0 to 2.7. It should be noted that GPAs for students
who did not plan to stay at their college through degree completion (goals 1, 2,
and 6) tended to drop during the second two-year period.
r ion n ] Attainmen
Table 9 presents information about the percentage of students who
graduated arranged by students’ educational goals and the extent to which those
goals were attained. Of all students who enrolled for the first time in fall, 1985,
only 4.9% had graduated two years later, the traditional measure of success for
community colleges. When the period allowed for graduation was extended to
four years, the number of graduates increased to 9.0%.
65

Table 9
Percent of Students Who Graduated or Attain tated Educational Goals After
Two-Year and Four-Year Enrollmen
Goal 1 2 3 4 5 6 7 8 Total
n 1906 3433 244 1702 164 97 940 3057 11,553
Graduation
Graduated by 1987 n 10 24 0 97 32 0 39 363 565
%® O05 O07 OO 57 195 00 42 #£411.9 49
Graduated by 1989 n 29 52 8 160 42 2 92 £654 # 1039 % 15 15 34 94 258 21 98 21.4 9.0
Change, 1987 to 89 n 19 28 8 63 10 2 53 #£4«2291 474
% 10 O8 34 37 63 21 56 9.5 4.1
Goal Achievement
Achieved Goal Exactly’87 n 1551 113 0 44 4 0 13 18 #1948 %® 814 $33 O00 26 25 00 1.4 6.0 16.9
Achieved Goal Exactly-’89 n 1628 120 147 46 4 0 64 254 = 2,263
% 854 35 602 2.7 25 00 68 8.3 19.6
Change, 1987 to 89 n “77 7 147 2 0 oO 51 71 315 %® 40 O02 62 O1 00 00 54 2.3 3.15
Exceeded Goal-’87 n 0 203 30 34 28 0 26 180 501
%® O00 59 123 3.0 170 00 28 59 43
Exceeded Goal-’89 n 0 299 34 «=6112 37 2 28 #400 912
%® O00 87 140 66 228 21 3.0 £131 79
Change, 1987 to 89 n 0 96 4 78 9 2 2 220 411
%® 00 28 16 46 58 21 0.2 72 3.6
Note: Goal 1 = Auditing, Personal Satisfaction, or only planning to take one course Goal 2 = Developing Career Skills
Goal 3 = Career Studies Mini-Certificate
Goal 4 = One-Year Certificate Goal 5 = Two-Year Diploma Goal 6 = Transfer to Four-Year College (No Degree)
Goal 7 = Two-Year Transfer Program (A.S. Degree) Goal 8 = A. A. S. degree
66

For all groups of students, the number of graduates increased between 1987
and 1989, even those groups whose entry-level goals did not include graduation.
For instance, by 1987, 10 students who stated that they planned to take a single
course when they originally enrolled in the community college had graduated.
This number increased to 29 by 1989. Similarly, 52 students who selected Goal 2
(Developing Career Studies) and two students who selected Goal 6 (Transfer to a
Four-Year College without earning a degree) had graduated by 1989. These
findings indicate a trend which is consistent across all goal categories - given the
opportunity and time, some students will continue to graduation, even if their
initial goal was to stop short of that level.
For students who aspired to attain a degree, according to educational goals
stated at entry, this trend is even more prevalent. It seems that the more
education to which the student aspired, the more likely he or she was to attain a
degree by the end of four years. Students who stated that they wanted to
complete either a two-year diploma (Goal 5), two-year transfer program (Goal 7)
or an A.A.S. degree (Goal 8) experienced 19.5%, 4.2% and 11.9% graduation
rates by 1987. This figure increased to 25.8%, 9.8% and 21.4% respectively
between 1987 and 1989. Ironically, students who needed only ninety credit hours
to attain their goal (Goal 5) experienced the highest graduation rate. By
1987,19.5% of this group had graduated, compared to 11.9% for those seeking an
A.A.S degree, the next highestgroup. By 1989, the graduation rate for this group
had increased to 25.8%, still higher than any of the other groups.
67

Goal achievement figures demonstrate that the most successful group was
students who selected Goal 1, to complete at least one course, followed by Goal 3
students who stated that they wanted to accumulate at least thirty credit hours.
These two groups had goal achievement rates of 85.4% and 60.2% respectively. It
should be noted that no Goal 3 students had accumulated enough credit hours to
be deemed successful by the end of two years of study. However, a large
percentage of these students persisted until they reached their goals.
To accurately consider goal achievement status of all students, a discussion of
those who exceeded their educational goals should be included. For some groups
it is relatively easy to determine whether goals are exceeded. For instance,
students who state that they want to take only a single course (Goal 1) and end
up attaining a credential would obviously be considered to have exceeded their
goals. However, a student who chooses Goal 6, to transfer to a four-year
institution, was counted as exceeding his or her educational goals only if he or she
earned more than 90 credit hours. Criteria for attainment of educational goals
were described in Table 5. Students who either earned credit hours in excess of
those criteria or earned a credential when they didn’t set out to do so, were
counted as goal exceeders for the purpose of this study.
As Table 9 illustrates, 74.2% of Goal 3 and 85.4% of Goal 1 students either
achieved or exceeded their educational goals. Of the Goal 1 students who
achieved their goals, 1618 (99.4%) would have been considered unsuccessful using
68

traditional success measures since they did not attain a credential during the first
two years of community college enrollment.
Degree-Seeking vs. Non-D -Seeking Student
When educational goals are dichotomized, placing students seeking a
credential into one category and those not seeking a credential into the other, a
clearer picture of student success emerges. Tables 10 through 15 contain such
information broken down by a variety of variables. According to Table 10, by
1987 only 0.6% of the non-degree-seeking students had graduated, compared to
8.7% of the degree-seekers. By 1989 this margin had widened as 15.7% of
degree-seekers had graduated compared to 1.5% of the students who did not
aspire to attain a degree. This increase was not equal for males and females, in
that 5.3% more males graduated between 1987 and 1989, compared to only 3.1%
more females for the same period. After two years of study, only 4.9% of the total
population had graduated, 5.9% of the males and 4.1% of the females. Only
9.0% had graduated after four years.
The largest change between 1987 and 1989 occurred for male students who
enrolled to attain a credential. This group experienced an 8.4% increase (244
additional graduates) between spring, 1987 and spring, 1989, compared to a 5.6%
increase for females. Far fewer students (1.5% of the males and 0.5% of the
females) who enrolled for purposes other than the attainment of a credential had
graduated by the end of four years.
69

Table 10
mparison of 1 Attainment of dents Who Enrolled for the Purpose of
Attainin dential and Those Who Enrolled For Other Purposes, Broken Down nder
Enrolled for Purposes Enrolled to Attain Total Other Than Attainment of a Degree, a Degree, Certificate, or Certificate, or
Diploma Diploma
(Goals 1, 2 and 6) (Goals 3-5 and 7-8)
Male n = 2,368 2,896 5,264 Female n = 3,078 3,211 6,289
Total n= 5,446 6,107 11,553
n % n % n
Graduation
Graduated by 1987 Male 24 1.0 279 9.6 309 5.9 Female 10 0.3 252 78 256 4.1 Total 34 0.6 531 8.7 565 49
Graduated by 1989 Male 59 2.5 526 18.2 585s 11.1 Female 24 0.8 430 13.4 458 73 Total 83 1.5 956 15.7 1,039 9.0
Change, 1987 to 1989 Male 35 1.5 244 8.4 277 5.3 Female 14 0.5 181 5.6 197 3.1 Total 49 0.9 425 7.0 474 41
Note: Goal 1 = Auditing, Personal Satisfaction, or only planning to take one course Goal 2 = Developing Career Skills Goal 3 = Career Studies Mini-Certificate
Goal 4 = One-Year Certificate Goal 5 = Two-Year Diploma Goal 6 = Transfer to Four-Year College (No Degree) Goal 7 = Two-Year Transfer Program (AS. Degree) Goal 8 = A.A. S. degree
70

Table 10 (continued)
Comparison of Goal Attainment of Students Who Enrolled for the Purpose of
Attaining a Credential and Those Who Enrolled For Other Purposes, Broken
Down ender
Enrolled for Purposes Enrolled to Attain Total Other Than Attainment of
a Degree, Certificate, or
a Degree, Certificate, or
Diploma Diploma (Goals 0, 1 and 5) (Goals 2-4 and 6-7)
Male n= 2,368 2,896 5,264
Female n = 3,078 3,211 6,289
Total n= 5,446 6,107 11,553
n % n % n %
Goal Attainment
Ach. Goal Exactly - 87 Male 1,068 45.1 167 58 1,235 23.5 Female 596 19.4 117 3.6 713 113 Total 1,664 30.6 284 4.6 1,948 16.9
Ach. Goal Exactly - 89 Male 1,122 47.4 312 10.8 1,434 27.2 Female 626 20.4 203 6.3 829 13.2 Total 1,748 32.1 515 8.4 2,263 19.6 Change, 1987 to 1989 Male 54 2.3 144 5.0 196 3.7 Female 30 1.0 87 2.7 119 1.9 Total 84 LS 231 3.8 315 2.7
Exceeded Goal - 87 Male 123 5.2 152 53 273 5.2 Female 80 2.6 146 4.5 228 3.6 Total 203 3.7 298 49 501 43 Exceeded Goal - 89 Male 197 8.3 327 11.3 524 10.0 Female 104 3.4 284 8.8 388 6.2 Total 301 5.5 611 10.0 912 79 Change, 1987 to 1989
Male B 3.1 173 6.0 246 4.7 Female 25 0.8 140 4.4 165 2.6 Total 98 1.8 313 §.1 411 3.6
71
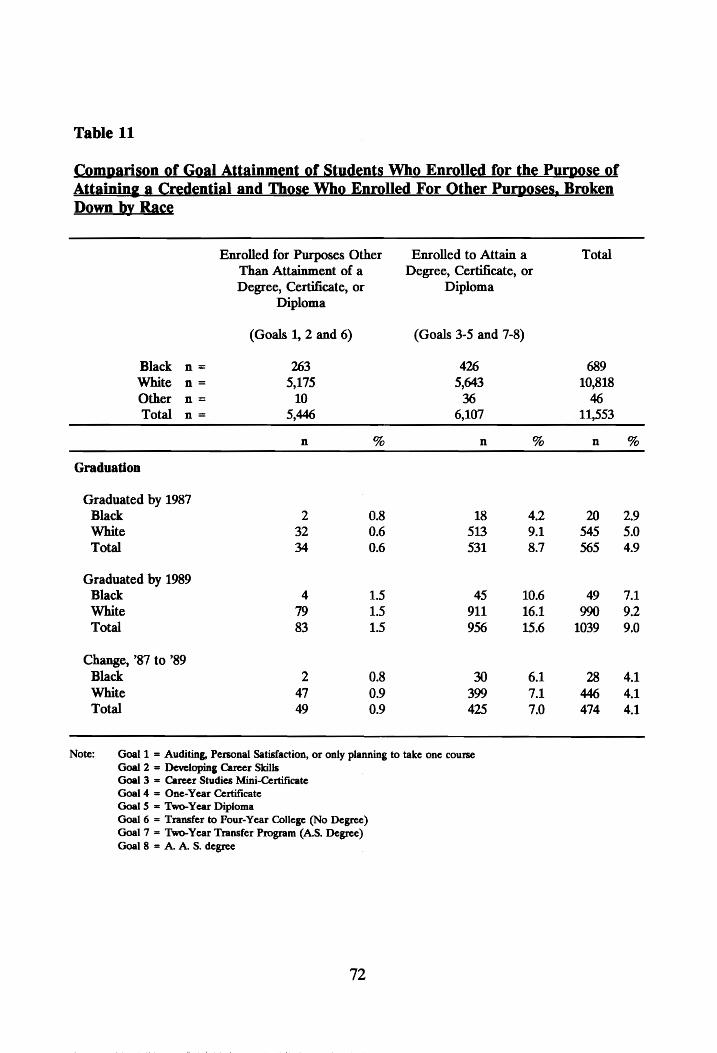
Table 11
Com mparison of Goal Attainment of Students Who Enrolled for the Purpose of
Attainin ntial and Those Who Enrolled For Other Purposes, Broken
Down by Race
Enrolled for Purposes Other Enrolled to Attain a Total Than Attainment of a Degree, Certificate, or Degree, Certificate, or Diploma
Diploma
(Goals 1, 2 and 6) (Goals 3-5 and 7-8)
Black n = 263 426 689 White n= 5,175 5,643 10,818 Other n = 10 36 46 Total n = 5,446 6,107 11,553
n % n % n %
Graduation
Graduated by 1987 Black 2 0.8 18 4.2 20 «29 White 32 0.6 513 9.1 545 5.0 Total 34 0.6 531 8.7 565 49
Graduated by 1989 Black 4 1.5 45 10.6 49 71
White 79 1.5 911 16.1 990 9.2 Total 83 1.5 956 15.6 1039 §=69.0
Change, ’87 to 89 Black 2 0.8 30 6.1 28 «3«641 White 47 0.9 399 71 446 41 Total 49 0.9 425 7.0 474 41
Note: Goal 1 = Auditing, Personal Satisfaction, or only planning to take one course Goal 2 = Developing Career Skills Goal 3 = Career Studies Mini-Certificate Goal 4 = One-Year Certificate Goal 5 = Two-Year Diploma
Goal 6 = Transfer to Four-Year College (No Degree)
Goal 7 = Two-Year Transfer Program (A.S. Degree) Goal 8 = A. A. S. degree
72

Table 11 (continued)
mparison of Goal Attainment of Students Who Enrolled for the Purpose of
Attaining a Credential and Those Who Enrolled For Other Purposes, Broken
Down by Race
Enrolled for Purposes Other Enrolled to Attain a Total Than Attainment of a Degree, Certificate, or Degree, Certificate, or Diploma
Diploma (Goals 1, 2 and 6) (Goals 3-5 and 7-8)
Black n = 263 426 689 White n= 5,175 5,643 10,818
Other n = 10 36 46 Total n = 5,446 6,107 11,553
n % n % n %
Goal Attainment
Ach. Goal Exactly-87 Black 56 21.3 10 2.6 66 10.0 White 1,608 311 274 48 1882 17.4 Total 1,664 30.6 284 46 1,948 169
Ach. Goal Exactly-89 Black 61 23.2 26 6.7 87 = 13.2
White 1,687 32.6 489 8.7 2,176 20.2 Total 1,748 32.1 $15 8.4 2,263 19.6
Change, 1987 to 1989 Black 5 19 16 41 21 = (32 White 79 1.5 215 3.8 294 28 Total 84 1.5 231 3.8 315 2.7
Exceeded Goal - 87 Black 6 2.3 7 18 13.2.0 White 197 3.8 291 5.1 488 45 Total 203 3.7 298 49 501 43
Exceeded Goal - 89
Black 8 3.0 29 6.8 37 556 White 293 5.7 582 10.3 875 8.1 Total 301 5.5 611 10.0 912 79 Change, 1987 to 1989
Black 2 0.8 21 5.4 233 «(3.7
White 96 1.9 292 5.2 388 3.6 Total 98 1.8 313 5.1 411 3.6
73

Table 12
Comparison of Goal Attainment of Students Who Enrolled for the Purpose of
Attainin ntial and Th Enrolled For Other P ses, Broken
Down by Time of Attendance
Enrolled for Purposes Enrolled to Attain Total Other Than Attainment of a Degree, a Degree, Certificate, or Certificate, or
Diploma Diploma
(Goals 1, 2 and 6) (Goals 3-5 and 7-8)
Day n= 2,331 4,192 6,523 Evening = 2,784 1,399 4,183
Both n= 330 517 847 Total n= 5,446 6,107 11,553
n % n % n %
Graduation
Graduated by 1987 Day 10 0.4 452 10.8 462 7.1 Evening 23 0.8 55 3.9 78 1.9 Both 1 0.3 24 46 25 3.0 Total 34 0.6 531 8.7 565 4.9
Graduated by 1989 Day 40 1.7 825 19.7 865 13.3 Evening 40 1.4 92 6.6 132 3.2 Both 3 0.9 39 7.5 42 5.0 Total 83 1.5 956 15.6 1,039 9.0
Change, 1987 to 1989 Day 30 1.3 370 8.8 400 6.1 Evening 17 0.6 40 2.9 57 1.4 Both 2 0.1 15 2.9 17 2.0 Total 49 0.4 425 6.9 474 5.9
Note: Goal 1 = Auditing, Personal Satisfaction, or only planning to take one course
Goal 2 = Developing Career Skills Goal 3 = Career Studies Mini-Certificate
Goal 4 = One-Year Certificate Goal 5 = Two-Year Diploma
Goal 6 = Transfer to Four-Year College (No Degree) Goal 7 = Two-Year Transfer Program (A.S. Degree) Goal 8 = A.A. S. degree
74

Table 12 (continued)
Comparison of Goal Attainment of Students Who Enrolled for the Purpose of
Down by Time of Attendance
Enrolled for Purposes Other —_ Enrolled to Attain a Total Than Attainment of a Degree, Degree, Certificate,
Certificate, or Diploma or Diploma (Goals 1, 2 and 6) (Goals 3-5 and 7-8)
Day n= 2,331 4,192 6,523
Evening n = 2,784 1,399 4,183 Both n= 330 517 847 Total n = 5,446 6,107 11,553
n % n % n %
Goal Attainment Ach. Goal Exactly - 87 Day 610 26.2 191 4.6 801 123
Evening 922 33.1 73 5.2 995 23.8 Both 132 40.0 20 3.9 152 17.9
Total 1,664 30.6 284 46 1,948 169
Ach. Goal Exactly - 89 Day 664 28.5 358 8.5 1,022 15.7 Evening 947 34.0 124 89 1,071 25.6
Both 137 41.5 33 6.4 170 20.1 Total 1,748 32.1 515 8.4 2,263 19.6
Change, 1987 to 1989 Day 45 1.9 145 3.5 199 29 Evening 33 1.2 72 5.1 105 2.5
Both 6 1.8 14 1.0 20 2.4
Total 84 1.5 231 3.8 3152.7
Exceeded Goal - 87 Day 105 2.5 284 6.8 389 §=—s.- 6.0 Evening 84 6.0 8 0.6 92 2.2 Both 14 42 6 1.5 20 2.4
Total 203 3.7 298 4.9 501 43 Exceeded Goal - 89
Day 110 4.7 564 = 13.5 674 103 Evening 174 6.3 28 2.0 202 «48 Both 17 5.2 19 3.7 360 43 Total 301 5.5 611 10.0 912 79
Change, 1987 to 1989 Day 11 0.5 281 6.7 292 «45 Evening 81 2.9 22 1.6 103 2.5
Both 6 1.8 10 1.9 16 1.9
Total 98 18 313 5.1 411 3.6
75

Table 13
omparison of ] Attainment of
Attaining a Credential and Those Who Enrolled For Other Purposes, Broken
Down by Developmental vs. Non-Developmental Students
nts Who Enroll for the Pu e of
Enrolled for Purposes Enrolled to Attain Total Other Than Attainment of a Degree,
a Degree, Certificate, or Certificate, or
Diploma Diploma
(Goals 1, 2 and 6) (Goals 3-5 and 7-8)
Developmental n = 132 441 573 Non-Developmental n = 5,314 5,666 10,980
Total n= 5,446 6,107 11,553
n % n % n %
Graduation
Graduated by 1987 Developmental 0 0.0 0 0.0 0 0.0 Non-Develop. 34 0.6 531 9.4 565 $.1 Total 34 0.6 531 8.7 565 49
Graduated by 1989 Developmental 0 0.0 0 0.0 0 0.0 Non-Develop. 83 1.6 956 16.9 1,039 9.4 Total 83 1.5 956 15.7 1,039 9.0
Change, 1987 to 1989 Developmental 0 0.0 0 0.0 0 0.0 Non-Develop. 49 0.9 425 7.5 474 43 Total 49 0.9 425 7.0 474 41
Note: Goal 1 = Auditing, Personal Satisfaction, or only planning to take one course Goal 2 = Developing Career Skills Goal 3 = Career Studies Mini-Certificate
Goal 4 = One-Year Certificate Goal 5 = Two-Year Diploma Goal 6 = Transfer to Four-Year College (No Degree) Goal 7 = Two-Year Transfer Program (A.S. Degree) Goal 8 = A.A. S. degree

Table 13 (continued)
Comparison of Goal Attainment of Students Who Enrolled for the Purpose of
Attaini ntial and Those Who Enrolled For Other Purposes, Broken Down by Developmental vs, Non-Developmental Students
Enrolled for Purposes Enrolled to Attain Total Other Than Attainment of a Degree, a Degree, Certificate, or Certificate, or
Diploma Diploma (Goals 1, 2 and 6) (Goals 3-5 and 7-8)
Developmental n = 132 441 573 Non-Developmental n = 5,314 5,666 10,980
Total n= 5,446 6,107 11,553
n % n % n %
Goal Achievement Ach. Goal Exactly - 87 Developmental 11 8.3 0 0.0 11 1.9 Non-Develop. 1,653 31.1 284 5.0 1,937 17.6 Total 1,664 30.6 284 47 1,948 16.9
Ach, Goal Exactly - 89 Developmental 11 8.3 3 0.7 14 2.4 Non-Develop. 1,737 33.0 512 9.0 2,249 20.5
Total 1,748 32.1 515 8.4 2,263 19.6
Change, 1987 to 1989 Developmental 0 0.0 3 0.7 3 0.5 Non-Develop. 84 1.6 228 4.0 312 2.8 Total 84 1.5 231 3.8 315 2.7
Exceeded Goal - 87 Developmental 0 0.0 0 0.0 0 0.0 Non-Develop. 203 3.8 298 5.3 501 4.6 Total 203 3.7 298 49 501 43
Exceeded Goal - 89
Developmental 0 0.0 1 0.2 1 0.2 Non-Develop. 301 3.8 610 10.8 911 8.3 Total 301 5.5 611 10.0 912 7.9
Change, 1987 to 1989
Developmental 0 0.0 1 0.2 1 0.2 Non-Develop. 98 1.8 312 5.5 410 3.7 Total 98 18 313 5.1 411 3.6
77

Table 14
mparison of Attainment of nts Who Enrolled for the Pu f
Attaining a Credential and Those Who Enrolled For Other Purposes, Broken Do cation
Enrolled for Purposes Enrolled to Attain Total Other Than Attainment of a Degree,
a Degree, Certificate, or Certificate, or Diploma Diploma
(Goals 1, 2 and 6) (Goals 3-5 and 7-8)
On n= 4,122 5,438 9,560
Off n= 1,170 §32 1,702
Both n = 154 137 291
Total n= 5,446 6,107 11,553
n % n % n %
Graduation
Graduated by 1987 On 25 0.6 513 9.4 538 56
Off 8 0.7 14 2.6 22 1.3
Neither 1 0.6 4 2.9 5 1.7
Total 34 0.6 §31 8.7 565 4.9
Graduated by 1989 On 57 1.4 919 16.9 976 10.2
Off 24 2.1 30 5.6 54 3.2
Neither 2 13 7 5.0 9 3.1
Total 83 1.5 956 15.7 1,039 9.0
Change, 1987 to 1989 On 32 0.8 406 75 438 46
Off 16 1.4 16 3.0 32 1.9
Neither 1 0.6 3 2.2 4 1.4
Total 49 0.9 425 7.0 474 4.1
Note: Goal 1 = Auditing, Personal Satisfaction, or only planning to take one course Goal 2 = Developing Career Skills Goal 3 = Career Studies Mini-Certificate
Goal 4 = One-Year Certificate Goal 5 = Two-Year Diploma
Goal 6 = Transfer to Four-Year College (No Degree) Goal 7 = Two-Year Transfer Program (A.S. Degree) Goal 8 = A. A. S. degree
78

Table 14 (continued)
Comparison of Goal Attainment of Students Who Enrolled for the Purpose of
Attaining a Credential and Those Who Enrolled For Other Purposes, Broken
Down ion
Enrolled for Purposes Other —_ Enrolled to Attain a Total Than Attainment of a Degree, Degree, Certificate,
Certificate, or Diploma or Diploma (Goals 1, 2 and 6) (Goals 3-5 and 7-8)
On n= 4,122 5,438 9,560
Off n= 1,170 532 1,702 Both n= 154 137 291 Total n = 5,446 6,107 11,553
n % n % n %
Goal Attainment Ach. Goal Exactly - 87 On 1,316 31.9 197 3.6 1,513 158 Off 304 26.0 85 15.9 389 228 Both 44 28.6 2 1.4 46 158 Total 1,664 30.6 284 46 1,948 16.9 Ach. Goal Exactly - 89 On 1,350 32.8 440 8.1 1,790 18.7 Off 342 29.2 72 13.5 414 242 Both 56 36.4 3 2.2 59 20.2 Total 1,748 32.1 515 8.4 2,263 19.6 Change, 1987 to 1989 On 36 0.9 226 4.2 262 = 2.7 Off 35 3.0 4 0.7 39-23 Both 13 8.4 1 0.7 14 48 Total 84 1.5 231 3.8 3152.7
Exceeded Goal - 87 On 171 4.1 291 5.4 462 48 Off 27 2.3 5 0.9 32 «19 Both 5 3.2 2 1.4 7 24 Total 203 3.7 298 4.9 501 43 Exceeded Goal - 89
On 247 6.0 589 = 110.8 836 = 8.7 Off 44 3.8 18 3.3 62 3.6 Both 10 6.5 4 2.9 14 48 Total 301 5.5 611 10.0 912 7.9 Change, 1987 to 1989 On 77 1.9 297 5.5 374 3.9 Off 17 1.5 13 2.4 30 «618 Both 4 2.6 3 2.2 7 2.4
Total 98 1.8 313 5.1 411 3.6
79

Table 15
mparison of | Attainment of Students Who Enrolled for the Pu e of
Attaining a Credential and Those Who Enrolled For Other Purposes, Broken
Down by Traditional vs. Non-Traditional Students
Enrolled for Purposes Enrolled to Attain Total Other Than Attainment of a Degree, a Degree, Certificate, or Certificate, or
Diploma Diploma
(Goals 1, 2 and 6) (Goals 3-5 and 7-8)
Non-Traditional n = 4,493 3,698 8,191 Traditional n = 953 2,409 3,362
Total n= 5,446 6,107 11,553
n % n % n %
Graduation
Graduated by 1987 Non-Traditional 32 0.7 229 6.2 261 3.2 Traditional 2 0.2 302 12.5 304 9.0 Total 34 0.6 §31 8.7 565 49
Graduated by 1989 Non-Traditional 53 1.2 395 13.1 448 5.5
Traditional 30 3.1 561 28.6 591 17.6 Total 83 1.5 956 15.7 1,039 9.0
Change, 1987 to 1989 Non-Traditional 8 0.2 169 46 177 2.2 Traditional 41 43 256 10.6 297 8.8 Total 49 0.9 425 7.0 474 4.1
Note: Goal 1 = Auditing, Personal Satisfaction, or only planning to take one course Goal 2 = Developing Career Skills Goal 3 = Career Studies Mini-Certificate Goal 4 = One-Year Certificate Goal 5 = Two-Year Diploma Goal 6 = Transfer to Four-Year College (No Degree) Goal 7 = Two-Year Transfer Program (A.S. Degree) Goal 8 = A. A. S. degree
80

Table 15 (continued)
mparison of
Attainin ntial and Thos
1 Attainment of Students Who Enroll
Wh Down by Traditional vs. Non-Traditional Students
for the Pu f
Enrolled For Other Purposes, Broken
Enrolled for Purposes Enrolled to Attain Total Other Than Attainment of a Degree,
a Degree, Certificate, or Certificate, or
Diploma Diploma (Goals 1, 2 and 6) (Goals 3-5 and 7-8)
Non-Traditional n = 4,493 3,698 8,191 Traditional n = 953 2,409 3,362
Total n= 5,446 6,107 11,553
n % n % n %
Goal Attainment
Ach. Goal Exactly - 87 Non-Traditional 1,187 26.4 170 4.6 1,357 16.6 Traditional 477 50.1 114 4.7 591 17.6
Total 1,664 30.6 284 4.6 1,948 16.9 Ach. Goal Exactly - 89 Non-Traditional 1,213 27.0 301 8.1 1,514 18.5
Traditional 535 56.1 214 8.9 749 22.3 Total 1,748 32.1 515 8.4 2,263 19.6 Change, 1987 to 1989 Non-Traditional 32 0.7 132 3.6 164 2.0 Traditional 52 5.5 99 41 151 45
Total 84 1.5 231 3.8 315 2.7
Exceeded Goal - 87 Non-Traditional 171 3.8 87 2.4 258 3.1 Traditional 32 3.4 211 8.8 243 7.2 Total 203 3.7 298 4.9 501 43 Exceeded Goal - 89
Non-Traditional 255 5.7 210 5.7 465 5.7 Traditional 46 4.8 401 16.6 447 13.3 Total 301 5.5 611 10.0 912 79 Change, 1987 to 1989 Non-Traditional 84 1.9 114 3.1 198 2.4 Traditional 14 1.4 199 8.3 213 6.3
Total 98 1.8 313 5.1 411 3.6
81

Not surprisingly, most of these students were those who indicated that they
intended to graduate when they enrolled (Goals 3-5, 7 and 8). By 1989, 15.7% of
these students had actually earned a credential, compared to 1.5% of the students
who enrolled for purposes other than credential attainment. A higher percentage
of males than females attained credentials.
When goal attainment was considered, 27.2% of the males and 13.2% of the
females had achieved their entry level educational goals by 1989. In addition,
10.0% of the males and 6.2% of the females had exceeded their stated
educational goals by spring 1989, four years after they first enrolled in a
community college. These figures indicate that a total of 37.2% of the males and
19.4% of the females achieved or exceeded their educational goals after four
years (a "new" definition of success), compared to only 5.9% of the males and
4.1% of the females who had graduated after two years of enrollment (the
traditional definition of success).
Similar patterns occurred when an examination by racial categories was
conducted. As Table 11 indicates, after two years of enrollment, only 2.9% of
Black students and 5.0% of White students had graduated. This compares to
7.1% and 9.2% respectively who had graduated after four years. Goal
achievement figures indicate that 18.6% of Black students and 28.3% of White
students had achieved or exceeded their educational goals by spring, 1989.
Table 12 indicates that when graduation is considered, day students are more
successful in terms of graduation rates than either their evening student
82
counterparts or the students who took equal numbers of day and evening courses
(the "Both" category). Not only did more day students graduate by the end of two
years of study (7.1%), than their evening (1.9%) and “Both" (3.0%) counterparts,
but after four years the differences were more pronounced. By 1989, 13.3% of
the day students had graduated, compared to only 3.2% of the evening students,
and 5% of the "Both" category. By 1987, 0.8% of the non-degree seeking evening
students and 0.3% (one student) of the non-degree seeking "Both" students had
graduated. Degree-seeking day students had the highest graduation rate, with
10.8% graduating by 1987 and 19.7% by 1989.
However, goal achievement figures are quite different. The most successful
students, when goal achievement was considered, were non-degree-seeking
students who took equal numbers of day and evening courses (those in the "Both"
category). By 1989, 41.5% of such students had achieved their educational goals
and an additional 5.2% exceeded their goals. This compares to 19.6% of the
population as a whole, 25.6% of evening students, and 15.7% of day students who
had exactly achieved their goals by 1989.
Students who did not find it necessary to take developmental courses when
they enrolled in a community college outperformed their developmental
counterparts by far. (See Table 13.) None of the developmental students had
received a credential of any sort four years after they enrolled in a community
college for the first time. This compares to 5.1% of non-developmental students
who had graduated by 1987 and 9.4% by 1989.
83

Goal attainment provides essentially the same picture. By 1987, 8.3% of the
developmental students whose goals fell into categories 1, 2 and 6 had exactly
achieved their educational goals, a statistic which did not change during the
subsequent two-year period. None of these students exceeded their goals.
It should be noted that developmental students represent a very small
proportion (5%) of the population. Because the formula for funding community
colleges provided fewer dollars for developmental credit hours than for non-
developmental courses, it is possible that some colleges did not encourage their
students to be classified as developmental. In such cases, only those students who
were truly unprepared for college would be placed in this category, and the fact
that even a few were able to complete courses is an indication that the colleges
were successful.
Degree-seeking students who took the majority of their courses on campus
outperformed other groups in terms of the number who graduated, according to
Table 14. After two years of enrollment, 9.4% of these students had graduated,
compared with less than 3% for all other groups. After four years, this gap had
widened to 16.9% for on campus degree-seekers compared to 5.6% or less for all
other students.
The tables seemed to turn, however, when goal achievement was considered.
According to Table 14, by 1987, 26.0% of off campus non-degree-seeking students
had achieved their educational goals exactly compared to 31.9% of on campus
non-degree-seekers and 15.9% of those who enrolled for the purpose of attaining
a credential. By 1989, the group with the highest goal attainment rate was
students who took an equal number of on campus and off campus courses (the
"Both" category). On campus students had the greatest percentage of degree-
seeking students attain their goals.
When age is considered, traditional college-age students outperform their non-
traditional counterparts in terms of graduation rates by a margin of three to one
percentage points. As Table 15 illustrates, after two years of study, 9.0% of
traditional students had graduated, compared to only 3.2% of non-traditional
students. This margin was 17.6% to 5.5% after an additional two years. The
most successful group by far were credential-seeking traditional students, of whom
28.6% graduated when given four years to do so. This compares to only 1.2% of
the non-traditional, non-credential-seeking students and 3.1% of the traditional
aged non-degree-seekers.
Goal attainment figures reveal a similar pattern as 60.9% of traditional non-
credential-seekers either exactly achieved or exceeded their educational goals,
compared to 32.7% of non-traditional students who enrolled for purposes other
than credential attainment. Figures for credential-seekers are similar, although
smaller numbers of students were successful. As Table 15 indicates, 25.5% of
traditional credential-seekers attained or exceeded their goals, compared to only
13.8% of non-credential-seekers.
Table 16 summarizes the previous six tables and clearly illustrates the
difference between the traditional measure of success for community college
i)

students, on-time graduation, and a measure of institutional effectiveness tied to
both students’ aspirations and their protracted attendance patterns. Applying the
traditional measure of success, on-time graduation, to students involved in this
study paints a dismal picture of the effectiveness of participating community
colleges. At the end of two years of study, only 4.9% of the students had earned
a degree, certificate, or diploma. By looking at credential attainment as the
criterion for success, but taking into account the protracted attendance patterns of
community college students, the success rate changes dramatically. As Table 16
indicates, by 1989 (four years after initial enrollment), 9.0% of the students had
attained a credential, nearly doubling the 4.9% who had done so by 1987.
It is reasonable to assume that credential attainment may not be an accurate
measure of success for all students. By examining graduation rates of students
who enrolled in the community college for the purpose of attaining a credential, a
clearer picture emerges. While only 4.9% of the total population had graduated y
1987, of the students who stated up front that they intended to graduate, 8.7%
had done so. By 1989, that figure increased to 15.7%, more than three times the
number traditionally counted in measures of institutional effectiveness. Thus, by
considering only those students who intended to graduate and allowing an
additional two years in which to do so, the success rate more than triples.
As stated above, credential attainment is a reasonable success measure for
some students but not for others. For students who enroll for purposes other than
to acquire a degree, certificate or diploma, graduation may not be an accurate
86

Table 16
Graduation and ] Attainment Rates for Students Who Enrolled for th
fD inmen mpar Th Enrolled for Reason
Other Than to Attain a Degree
Enrolled for Enrolled to Attain a Total Purposes Other Degree, Certificate,
than Attainment of or Diploma a Degree,
Certificate, or Diploma
(Goals 1,2 and 6) (Goals 3-5 and 7-8)
(n = 5446) (n = 6107) (n= 11,553)
n & n % n %
Graduation
Graduated by 1987 34 0.6 531 8.7 565 4.9
Graduated by 1989 83 1.5 956 =—:115.7 1039 9.0
Change, 1987 -> 89 49 0.9 425 7.0 474 41
Goal Achievement
Achieved Goal Exactly by 1987 1664 30.6 284 4.7 1948 169
Achieved Goal Exactly by 1989 1748 = 32.2 515 8.5 2263 «19.6
Change 1987 -> 1989 84 1.5 231 3.8 315 2.7
Exceeded Goal by 1987 203 3.7 298 49 501 43
Exceeded Goal by 1989 301 5.5 611 10.0 912 79
Change 1987 -> 1989 98 1.8 313 5.1 411 3.6
Note: Goal 1 = Auditing, Personal Satisfaction, or only planning to take one course Goal 2 = Developing Career Skills Goal 3 = Career Studies Mini-Certificate Goal 4 = One-Year Certificate
Goal 5 = Two-Year Diploma Goal 6 = Transfer to Four-Year College (No Degree) Goal 7 = Two-Year Transfer Program (A.S. Degree) Goal 8 = A. A. S. degree
87

way to measure their success. As Table 16 illustrates, 47.1% (5,446) of the
students stated at the time of initial enrollment that they did not intend to earn a
credential. Indeed, after two years, only 0.6% of these students had attained any
sort of credential, and only 1.5% had done so after four years of study. The fact
that even a small percentage of such students graduated would seem to be an
indication of the holding power of community colleges, as these students obviously
persisted in their studies far longer than they thought they would at the time of
initial enrollment.
By 1987, 16.9% of the population had exactly attained their stated educational
goals and an additional 4.3% had exceeded them. Therefore, simply changing the
criterion for success from graduation to goal attainment the success rate increases
from 4.9% to 21.2%. By providing an additional two years the number of goal
attainers or exceeders increases to 19.6% and 7.9% respectively, a total increase
of 6.3% over the two-year figure and 22.6% greater than the number who
graduated by 1987.
Of the students who intended to attain a credential, 8.5% exactly achieved
their goal by 1989, while 10.0% exceeded their goals. The latter group of students
would include those who took additional courses after they had earned enough
credits to receive the credential for which they initially enrolled.
Of the students who did not intend to attain a credential, 30.6% exactly
achieved their goals and 3.7% exceeded them by 1987. This figure increased
marginally by 1989, to 32.2% for achievers and 5.5% for exceeders.
88

A comparison among the success measures under consideration reveals that
the traditional measure of success, graduation after two years of study, yields a
success rate of 4.9%. Extending the time allowed for graduation by two years
results in a 4.1% increase in the number of graduates. Examining goal attainment
rather than credential attainment reveals that by 1987, 21.2% of the students had
achieved or exceeded their goals, and that by 1989 this figure had increased to
27.5%, nearly six times the rate of on-time graduates.
It should be noted that students who did not aspire to attain a credential
appear to be far more successful than their degree-seeking counterparts. After
two years of study, non-degree-seekers had a success rate of 34.3% (30.6%
achieved and 3.7% exceeded) compared to a 9.6% rate for degree-seekers. By
1989, this figure had increased to 37.7% for non-degree-seekers and 18.5% for
degree-seekers. An interesting finding is that while non-degree-seekers are more
likely to achieve their goals exactly, degree-seekers appear to be more likely to
exceed their goals when both the two-year and four-year periods are considered.
Rather than looking at on-time graduation as the measure of success for
community college students, it seems reasonable to consider what they wanted to
do when they enrolled and measure their accomplishments against that standard.
To that end, a legitimate measure may be to consider degree-seekers successful
only if their community college careers result in their being awarded a degree.
Non-degree-seekers should be measured against the total number of courses they
intended to complete, either for credit or as audits. Using these criteria, a success
89

rate could be calculated based upon the 15.5% of degree-seekers who graduated
by 1989 and 37.7% of non-degree-seekers who attained their goals by 1989.
These two groups represent 3006 students, or 26% of the population, a far greater
number of "successes" than the 4.9% who graduated by 1987.
Effect of Changing Definition of Success
Table 17 summarizes the effect of changing the definition of success for
community colleges from the attainment of a credential after two years of courses
to goal attainment after four or more years. The most dramatic difference as a
result of such a definitional change occurred for traditional students who stated
that they were not seeking a degree when they enrolled. More than 60% of these
students achieved their educational goals at the end of four years, compared to
only 0.2% who had graduated at the end of two years. Similar results were
attained for males who did not wish to earn a degree as well as non-degree-
seekers in almost every category. These results would seem to indicate that, given
the opportunity, students will persist to attainment of their educational goals,
whether those goals are to attain a credential or some other goal. They also
indicate that community colleges are not only meeting the educational needs of
students, they are helping many to exceed their initial goals.
A consideration of credential-seekers also indicates that protracted attendance
patterns of community college students may play a role in the determination of
success or failure of colleges in meeting their needs. For instance, 14.2% more
90
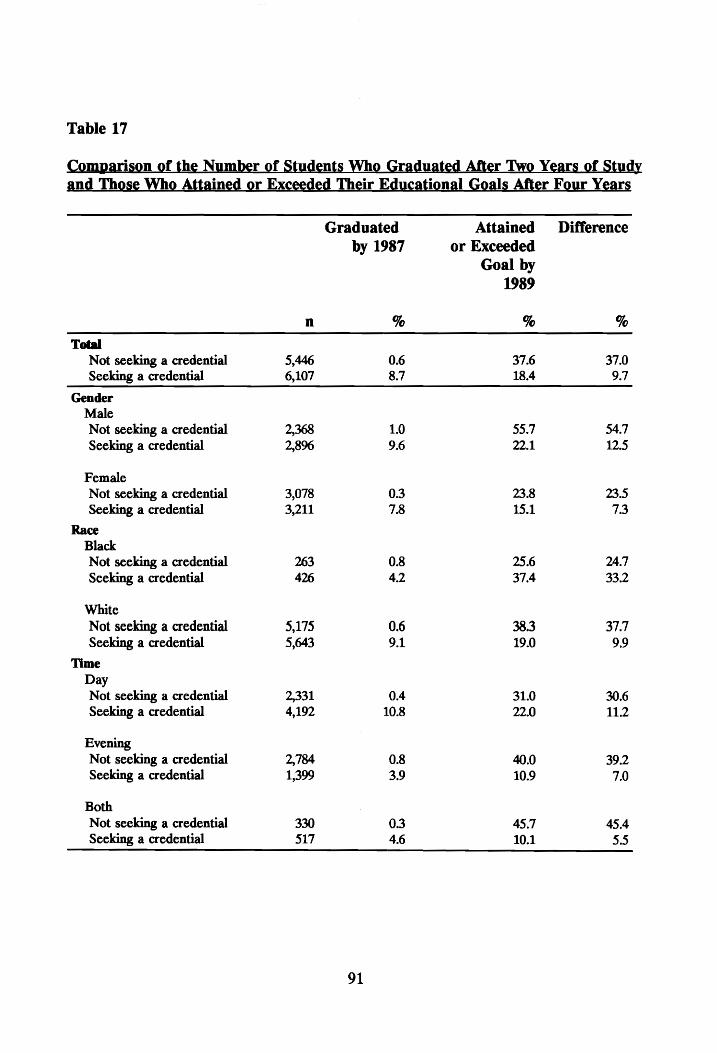
Table 17
Comparison of the Number of Students Who Graduated After Two Years of Study
nd Those Who Attained or Ex Their E ional ] r Four Year
Graduated Attained Difference
by 1987 or Exceeded Goal by
1989
n % % %
Total Not seeking a credential 5,446 0.6 37.6 37.0 Seeking a credential 6,107 8.7 18.4 9.7
Gender
Male Not seeking a credential 2,368 1.0 55.7 54.7 Seeking a credential 2,896 9.6 22.1 12.5
Female Not seeking a credential 3,078 0.3 23.8 23.5 Seeking a credential 3,211 78 15.1 73
Race Black Not seeking a credential 263 0.8 25.6 24.7 Seeking a credential 426 42 37.4 33.2
White
Not seeking a credential 5,175 0.6 38.3 37.7 Seeking a credential 5,643 9.1 19.0 9.9
Time Day Not seeking a credential 2,331 0.4 31.0 30.6 Seeking a credential 4,192 10.8 22.0 11.2
Evening
Not seeking a credential 2,784 0.8 40.0 39.2 Seeking a credential 1,399 3.9 10.9 7.0
Both
Not seeking a credential 330 0.3 45.7 45.4 Seeking a credential 517 4.6 10.1 5.5
91

Table 17 (continued)
Comparison of the Number of Students Who Graduated After Two Years of Study
nd Th Attained or Exceeded Their E tional ] r Four Year
Graduated Attained Difference by 1987 or Exceeded
Goal by 1989
n % % %
Total Not seeking a credential 5,446 0.6 37.6 37.0 Seeking a credential 6,107 8.7 18.4 9.7
Developmental /Remedial Developmental Not seeking a credential 132 0.0 0.9 8.3 Secking a credential 441 0.0 1.1 1.1
Non-Developmental Not seeking a credential 5.314 0.6 36.8 36.2 Seeking a credential 5,666 9.4 19.8 10.4
Location
On Campus Not seeking a credential 4,122 0.6 38.8 38.2 Seeking a credential 5,438 9.4 18.9 9.5
Off Campus Not seeking a credential 1,170 0.7 33.0 32.3 Seeking a credential 532 2.6 16.8 14.2
Both Not seeking a credential 154 0.6 42.9 423 Seeking a credential 137 2.9 5.1 2.2
Age
Non-Traditional
Not seeking a credential 4,493 0.7 32.7 32.0 Seeking a credential 3,698 6.2 13.8 7.6
Traditional Not seeking a credential 953 0.2 60.9 60.7 Seeking a Credential 2,409 12.5 25.5 13.0
92
off campus students who stated that they wished to earn a degree had graduated
by 1989 than by 1987. Similar results were found for males, Black students, and
non-developmental students, all of whom experienced increases in excess of 10%
when the additional two years of study and their educational goals were taken into
consideration before counting them successes or failures in terms of their
community college experiences.
93

Chapter 5
CONCLUSIONS
With the changing demographics of American community colleges as well
as increased emphasis on quality of education in the United States, it has become
more important than ever for institutions of higher education to demonstrate that
they are meeting the educational needs of their students. Accrediting agencies
now focus on learner outcomes and results, concentrating specifically upon a
documentation of institutional effectiveness, and focusing on quality of
instructional programs rather than on ever-increasing enrollments. This focus
implies that "institutional effectiveness is determined by examining how well an
institution meets and fulfills the specific needs of the area that it serves." (Wilson,
1989, p. 5) Institutions can no longer measure their success in terms of the
number of credentials bestowed upon graduates, but on how well they help
students meet their varied educational needs.
This study identified a number of demographic and educational factors
which appear to be associated with the success or failure of community college
students. Administrators and other decision-makers would do well to consider
such factors as they participate in planning and development activities.
The findings of this study indicated that while students who aspire to earn
a community college degree, certificate, or diploma are more likely to graduate
94

than those who do not have such aspirations, they are less likely to attain their
educational goals within a given time frame (of this study). This has far-reaching
implications in terms of the ways in which community colleges have been judged.
Institutional effectiveness criteria for accreditation now require a close inspection
of the outcomes of higher education in terms of the college’s mission and goals.
The mission of community colleges is to meet the educational needs of the
community in which it is located, whether or not those needs include the
attainment of a four-year degree. If students’ diverse educational needs are met,
then the community college should be judged as being successful.
In this study, the extent to which educational goals were achieved was
measured in terms of what the student set out to do when he or she enrolled in
the community college. These diverse goals provided a base from which to
measure student success. If students were able to do what they said they were
going to do when they enrolled, then they were counted as successes. As the
study indicated, 27.5% of community college students are successful in attaining
their entry level educational goals, and many exceed those goals by a wide margin,
even if they do not receive a credential prior to exiting the college setting.
While credential attainment may be a legitimate measure of success for
students who aspire to attain a degree, certificate or diploma, it is not a
reasonable measure for non-degree-seekers. This study proposes a clearer
alignment between students’ goals and their educational outcomes. As
demonstrated in Chapter 4, at the end of two years of study, only 4.9% of the
95

students had attained a credential of any sort, an abominable success rate by any
standard. Such a lack of success on the part of community colleges may not be so
much a function of how well they meet students’ needs as how they are measured.
For instance, the typical community college student does not attend school
full-time, but takes a less than full course load at any one time (Table 8), and may
occasionally drop out for a term only to re-enroll and continue pursuing an
education. Such protracted attendance patterns make the two-year time period
for credential attainment an unreasonable standard. When this time period is
extended to four years, the number of students who attained a credential
increased from 4.9% to 9.0%.
Beyond the obvious findings presented in Chapter 4, a fundamental issue is
brought into question: the practice of evaluating community colleges by counting
graduates and tracking them to determine their degree of success or failure, to the
exclusion of other groups of students. With 47.1% of all students (Goals 1, 2, and
6) in this study indicating that they did not intend to attain a degree at the time of
college entry, an examination of the success or failure of only potential graduates
would ignore nearly half of the student body.
As Table 16 indicates, only 4.9% of the population as a whole earned a
credential within the first two years of their community college careers (the
traditional measure of success). This compares to 8.7% of the students who set
out to earn a credential. However, when of protracted attendance patterns were
considered, the success rate of credential-seekers increased to 15.7%.
96

The above method of examining institutional effectiveness does not take
into account students who enroll in community colleges for purposes other than
credential attainment, nearly half of the students involved in this study. For such
students, it is appropriate to match their stated educational goals with a measure
of the number of courses taken, for credit or audit. If they do indeed take the
courses necessary to reach their goals, then the community college has met their
needs, and could consider itself effective in terms of addressing the educational
requirements of its service area.
According to Table 16, at the end of two years of study, only 0.6% of the
students who did not wish to attain a degree had graduated, a figure that
increased by less than one percent during the next two years. Using traditional
effectiveness measures, these are the only non-degree-seeking students who would
be considered successful. However, when educational goal attainment is used as
the standard for success, 30.6% exactly achieved their educational goals, and an
additional 3.7% had exceeded their goals. These figures increased to 32.2% and
5.5% respectively at the end of four years, for a success rate of 37.7% for non-
degree-seeking students.
To determine the effectiveness of community colleges in meeting students’
educational needs, it is appropriate to deem credential-seekers as successful if
they attain a credential, and non-credential-seekers successful if they attain the
amount of education they set out to acquire when they enroll. Applying this
standard to the population of this study, 956 of the credential-seekers and 2,049 of
97

those not seeking credentials would be considered successful after four years of
study, an success rate of 26%.
While the new definition of success results in an increase of 21.1% of the
students being deemed successful, indicating that the picture of community college
success is not as dismal as some have thought, the population success rate is still
very low and causes one to question why 74% of the students do not meet their
entry level educational goals. Why do such a large majority of students not reach
their goals during the first four years of study? One reason may be protracted
attendance patterns discussed above. Four years may not be long enough for
some students who take light loads and occasionally drop out for a term. Some
students may require five or more years to reach their goals. Other explanations
may rest in the nature of students who attain their goals.
According to Table 17, the single most successful group of students are
those who are recent high school graduates and do not plan to earn a credential
at the community college. In almost every category, students who do not plan to
earn a credential are more likely to attain or exceed their goals than their
credential-seeking counterparts. Within the broad categories of gender, race, time
of attendance, age, etc., certain conclusions may be drawn. Male non-credential-
seekers, for example, are more successful than females, and white students attain
their goals more frequently than minorities. It is interesting, however, that more
Black degree-seekers attain or exceed their goals than do non-degree-seekers, a
pattern directly opposite of that in evidence in all other categories except
98
developmental students.
An interesting finding related to both time of attendance and location is
that non-credential-seeking students who take equal numbers of day and evening
courses, or equal numbers of on campus and off campus courses tend to be more
successful than students who take the majority of the courses in one location or
during one time period. A possible explanation for such a trend may be that
students who are willing to disrupt their personal schedules to take courses
whenever and wherever they are offered are more focused and dedicated to
reaching their goals than are those who establish a schedule and stick with it.
Developmental students are the least successful group of all, with only
about 1% either attaining or exceeding their goals. While it is not surprising that
these students are less successful than students who do not have to begin their
college careers by taking courses to prepare for college-level work, it is
discouraging that so few succeed. Such a low success rate brings into question the
utility of developmental courses as well as the practice of admitting such high-risk
students when their chances for success are so limited.
One of the reasons for the low success rate of developmental students
included in this study is that while students receive college credit for these
courses, the credit may not be applied to degree requirements. Therefore, the
typical developmental studies classroom contains two basic types of students -
those who are very conscientious and want to be absolutely sure they are prepared
for college-level work and those whose basic skills are so very low that they have
99

been counselled to enroll in such courses.
A second reason for the low success rate of developmental students may be
that funding for such courses is at a lower rate than non-developmental courses.
Therefore, current practice is to counsel marginal students to enroll in courses
that receive the higher funding rate. Only the very weakest students are
encouraged to take developmental courses. In this study, only 5.0% of the
population were enrolled in developmental courses, compared to a nationwide
estimate that 65% of community college students would benefit from
developmental coursework. (Personal Communication, Dan Vogler, July 6, 1992)
The results presented here should give community college counselors and
administrators cause to question current practice. If only the weakest students
take developmental courses, and they are no more successful than those in this
study, then the utility of developmental courses may be called into question.
Recommendations
While the picture of community college success is not as dismal as some
people may have thought, it is certainly not as bright as it could be.
Administrators need to determine whether, using the criteria for determining
success outlined here, their institutions are as successful as they can be. In other
words, this picture is better, but is it good enough? Standards for reasonable
expectations of success need to be developed and institutional effectiveness
measured against such pre-established standards.
100

Databases in use at the time these data were collected did not distinguish
between stop-outs, dropouts, and students who transfer to another postsecondary
institution. It is possible that some of the students who were counted here as
non-graduates or non-goal attainers actually continued their education elsewhere
after getting a start at the community college. While efforts are underway in
many states to track students following departure from the community college,
such information is not routinely collected by colleges involved in this study.
Follow-up information should be used to guide decisions about needed program
changes as well as to help counselors and career development officers anticipate
which students may be in need of assistance before they prematurely leave the
institution.
The results presented in this study paint the bleakest possible picture of
community college success. Because the database did not contain information
about students following their exit from the community college, those who stated
that they wanted to earn credits to transfer to a four-year institution (Goal 6) and
earned fewer than 90 credit hours prior to transferring were counted as "non-
successes". Likewise, students who enrolled for the purpose of upgrading job skills
(Goal 2) and who earned fewer than twelve credit hours were not counted as
successes. Both of these groups of students could be counted as successful by the
community colleges, but were not here because of the goal attainment criteria
outlined in Table 5. The actual success rate of all groups of students may be even
higher if goal attainment criteria take into account the unique circumstances of
101

these groups of students or if databases more accurately reflect the extent to
which these goals are attained, e.g., track students to determine whether they
actually transfer.
Community college student personnel services should be closely aligned
with the types of students they are serving and their staff trained to interpret
research findings such as those presented here so they will know when and how to
provide special assistance to students who may be in danger of withdrawing prior
to goal attainment. Such training would also enable them to recognize students
who are likely to change their educational goals in favor of attaining a higher
level of education. They would be prepared to more accurately advise students
early in their educational careers about courses which will meet their short term
educational needs as well as provide necessary prerequisites should they decide to
change their goals.
Suggestions for Further Study
This study tracked community college students from the time that they first
enrolled for four years. Given the protracted attendance patterns of typical
community college students - taking smaller course loads than their college or
university counterparts as well as dropping out and re-enrolling - it seems
reasonable to expect that the logical next step to this study would be to follow
these same students for a more extended period of time to determine whether
additional students eventually graduate or attain their goals. Course-taking habits,
102

such as the average number of courses taken each term by certain groups of
students, should be monitored to determine at what point students either lose
interest and drop out completely or decide to "go for it" and increase their course
load as they pursue a more auspicious goal. Such information would be
invaluable for counselors because it would guide them in advising students about
course-taking strategies and determining at what point in students’ educational
careers they should intervene to help them overcome obstacles or make the
decision to change their goals.
A second area needing study is the point at which students’ educational
goals change. It seems obvious from the findings of this study that at some point
in time, certain students who initially enroll to take a single course actually decide
to pursue a credential, and certain others who initially plan to pursue a credential
eventually decide not to do so. The process involved in making such decisions
should be studied to determine at what point college counselors may be most
beneficial to students in terms of goal clarification and encouragement to stay in
school.
Third, a match between community college missions and their success with
students is essential if colleges are to meet the current criteria for institutional
effectiveness of the Southern Association of Colleges and Schools (SACS), which
defines institutional effectiveness as the ongoing documented comparison of
performance to the institution’s future mission or purpose. (Southern Association
of Colleges and Schools, 1987) This definition implies that member institutions
103
must focus on learner outcomes and results. What better result than to measure
whether students are able to attain their educational goals, and then some, they
desire when they enroll.
The number of crosstabulations included in this study was limited to broad
categories such as race, gender, age, etc. Given recent research related to the
interrelationship between race and gender and its effect on student success,
further research should be conducted to determine whether the relationships
described here hold true for all gender and racial groups. For instance, an area
to be considered would be whether Black females tend to be as successful as their
Black male or White female counterparts. Because of the low proportion of
Black students in this sample, such analyses were not conducted, but follow-up
studies should take such factors into consideration.
The sample used in this study is heavily weighted toward White students.
While the racial balance of this population included only 6% Black students and
less than 1% students of Asian, Pacific Island and other nationalities, according to
the 1990 census the population of the service areas of community colleges
included in the study is closer to 10% Black and 2% "Other". A more
representative sample of the population should be examined to determine whether
the same graduation and goal attainment patterns are consistent across all
segments of the population.
Instruments used to collect information about students’ educational goals
provide a snapshot of the needs of entering students. As mentioned above, there
104

is some question as to the stability of these goals over time since some students
change their minds about their goals. More detailed information should be
collected routinely to provide a guide for college planners, counselors and
researchers. Such information should include entry-level goals as well as
measures of educational goals collected at several points in time, such as the end
of the first term, after accumulating sufficient credit hours to transfer to a four-
year institution, at the time of graduation, and after the student has exited the
community college. By tracking student progress toward meeting goals over time,
community colleges will be better able to determine whether the colleges are
meeting educational needs of their clientele.
Community colleges would do well to encourage counselors and placement
advisors to ensure that the entry-level goal statements are as accurate as possible
at the time of admission. In some instances, students may not understand the
importance of accurately reporting their educational aspirations, or they may not
understand the differences among options contained on data collection
instruments. Wherever possible, students should be apprised of the importance
and meaning of these options. Follow-up counseling should focus on those groups
of students who may be at-risk of leaving the institution prior to attainment of
their goals as well as on helping students who are considering a goal shift.
Finally, this study examined two definitions of success for community
college students - on-time graduation vs. goal attainment over time. It may be
easier for some readers to think of these two definitions as a single concept:
105

completion of the student’s educational goal which may or may not include
graduation. This would really combine two views of institutional effectiveness,
getting students to graduate on time and students’ attaining their educational
goals in their own time frame.
106

References
Alfred, Richard L. (1986). Measuring student outcomes through the associate degree. Los Angeles, CA: Eric Clearinghouse for Junior Colleges.
American Association of Community and Junior Colleges (1985). AACIC public policy agenda. Washington, D.C. Annual Meeting, 25.
Astin, Alexander W., Gamson, Z. F., Blake, J. H., Hodgkinson, H. L., Bowen, H.R.,
Lee, B., & Mortimer, K.P. (1984). Involvement in learning: Realizing the potential of american higher education. Washington, DC: National Institutes of Education.
Astin, Alexander W. (1975). Preventing students from dropping out. San Francisco: Jossey-Bass.
Astin, Alexander W. (1976). The american freshman. Los Angeles: Laboratory for Research on Higher Education.
Astin, Alexander W. (1985). Achieving educational excellence: A critical assessment of priorities and practices in higher education. San Francisco: Jossey-Bass.
Beal, P. E. and Noel, L. (1980). What works in student retention. Iowa City, IA: American College Testing Program.
Bean, J. P. and Metzner, B. S. (1985). A conceptual model of non-traditional student attrition. Review of Educational Research, 55, 485-540.
Bers, T. (1984). Confidence, commitment, and academic performance of community college students. Paper presented at the Association for Institutional Research Forum, Fort Worth.
Brawer, Florence B. (1988). Assessing student goals and outcomes. Paper presented at the Maryland Dean’s Meeting (Arnold, MD, March 25, 1988).
Breneman, David W., and Nelson, Susan C. (1981). Financing community colleges: An economic perspective. Washington, DC: The Brookings Institute.
107

Cohen, Arthur M. (1985). What statistical information is available on two year colleges: A summary of research findings. Los Angeles, CA: ERIC Clearinghouse for Junior Colleges.
Cohen, Arthur M. (1988). Trends and issues in community colleges: Minority student transfer. Los Angeles, CA: ERIC Clearinghouse for Junior Colleges.
Commission on the Future of Community Colleges. (1987). Building communities. Washington, DC: American Association of Community and Junior Colleges.
Cross, K. Patricia (1987). Using assessment to improve instruction. In Assessing the Outcomes of Higher Education: Proceedings of the 1986 ETS Invitational Conference. Princeton, NJ: Educational Testing Service, 63-70.
Curriculum code lists and translation tables: 1982-83. Richmond, VA:
Virginia Community College System.
Easton, John Q. Affective responses of community college students to self- selected criteria of success. Community/Junior College Quarterly of Research and Practice, 8(1-4), 185-191, 1984.
Eaton, Judith S. (1988). Colleges of choice: The enabling impact of the community college. New York: American Council on Education.
Eckland, B. K. & Henderson, L. B. (1981). College attainment four years after high school. Washington, DC: National Center for Education Statistics.
Eggert, (1975). An examination of goals of potential and actual learners: University of Mid-America/State University of Nebraska, Working Paper No. 1. Lincoln, NE: University of Mid-America.
El-Khawas, Elaine. (1988). Campus trends, 1988: Higher education panel reports number 77. Washington, DC: American Council on Education.
Ewell, Peter T. (1991). To capture the ineffable: New forms of assessment in higher education. Review of Research in Education, 17, 75-125.
Ewell, Peter T., Finney, J. E., & Lenth, C. (1990). Filling in the mosaic: The emerging pattern of state-based assessment. AAHE Bulletin, 42, 3-7.
108

Ewell, Peter T., Parker, R., and Jones, D. P. (1988). Establishing a longitudinal student tracking system: An implementation handbook. Boulder, CO: National Center for Higher Education Management Systems.
Ewell, Peter T. and Lisensky, R. P. (1988). Assessing institutional effectiveness: Redirecting the self-study process. Washington, DC: Consortium for the Advancement of Private Higher Education.
Fetters, W. B. (1977). National Longitudinal Study: Withdrawal from institutions of higher education. Washington, DC: U.S. Department of Health, Education, and Welfare, National Center for Education Statistics. (ED 150 913).
Hackman J. Richard and Wendell S. Dysinger. (1970). Commitment to college as a factor in student attrition. Sociology of Education, 43, 311-324.
Hunter, R. and Sheldon, M. S. (1981). Statewide longitudinal study: Report on academic year 1979-80. Part 4 - Spring, 1980 Results. Woodland Hills, CA: Los Angeles Pierce College.
Jackley, J. P. and Henderson, C. (1979). Retention: Tactic for the eighties. Washington, DC: American Council on Education.
Lenning, O. T. & Hanson, G. R. (1977). Adult students at two-year colleges: A longitudinal study. Community/Junior College Quarterly of Research and Practice, 1, 271-287.
Lenning, O. T., Beal, P. E. and Sauer, K. (1980). Retention and attrition: evidence for action and research. Boulder, CO: National Center for Higher Education Management Systems.
Losak, John. (1986). What constitutes student success in the community college? Community College Journal for Research and Planning, 5, No. 2.
McClain, C.J., & Krueger, D.W. (1985). Using outcomes assessment: A case study in institutional change. In Ewell, P.T., editor. Assessing Educational Outcomes. San Francisco: Jossey-Bass, Inc., 33-46.
Midgen, Joseph (1987). "Alumni survey of entry goals, satisfaction and job benefits associated with the associate degree." Community/Junior College Quarterly of Research and Practice. 11(3), 179-88.
Mishler, Carol J. (1983). Adults’ perceptions of the benefits of a college degree. Research in Higher Education, 19(2), 213-231.
109

Morris, Cathy and Losak, John (1986). Student success at Miami-Dade Community College: Issues and data - research report No. 86-22. Miami: Office of Institutional Research, Miami-Dade Community College.
National Governors Association. (1984). Results in education: 1988 Washington, DC: National Governors’ Association.
National Governors’ Association. (1988). Results in education: 1991. Washington, DC: National Governors’ Association.
Obetz, Wayne S. (1987). A proposed model for categorizing successful and non- successful student outcomes at CCP: Institutional research in-brief #42. Philadelphia: Philadelphia Community College, Pennsylvania, Office of Institutional Research.
Palmer, Jim. (1988a). Assessing institutional effectiveness: community college case studies. Presented at the AACJC National Video Teleconference,
March 24, 1988.
Palmer, Jim. (1988b). Setting the AACJC research agenda. AACJC Journal, Feb/Mar, 32-35.
Pascarella, E.T., Duby, P. B., and Iverson, B.K. (1983). A test and reconceptualization of a theoretical model of college withdrawal in a commuter institution setting. Sociology of Education, 56, 88-100.
Planning and Evaluation Division System Offices. (1984). Curriculum code lists and translation tables: 1982-83. Richmond, VA: Virginia Community College System.
Ramist, Leonard. (1981). College student attrition and retention: College Board report no. 81-1. New York: College Entrance Examination Board.
Richardson, R. C., Jr. (1986). Planning for the nineties: Excellence equals Access plus achievement. Position Paper for the N.C. Department of Community Colleges (Raleigh, NC Dept. of Community Colleges), 2.
Sheldon, M. S. (1982). Statewide longitudinal study: Report on academic year 1980-81. Part 5 - Final Report. Woodland Hills, CA: Los Angeles Pierce College.
Slark, Julie. (1988). Learning assessment retention consortium: Student outcomes study, year two final report. Santa Ana, CA: Rancho Santiago College Research Center.
110

Slark, J., Farland, R., Barr, B., Kangas, J., Bogue, C., Kanter, M., Cox, M.A.,
Lewis, M., & Russell, S. (1988). LARC student outcomes study: Follow-Up
of year 1/final report. Sacramento, CA: California Community College System.
Southern Association of Colleges and Schools. (1984). Criteria for accreditation. Atlanta, GA: Commission on Colleges and Schools of the Southern Association of Colleges and Schools.
Southern Association of Colleges and Schools. (1987). Resource manual on institutional effectiveness. Atlanta: The Commission on Colleges and Schools of the Southern Association of Colleges and Schools, 1.
Tinto, Vincent. (1975). Dropout from higher education: A theoretical synthesis of recent research. Review of Educational Research, 45, 89-125.
Tinto, Vincent. (1987). Leaving College: Rethinking the causes and cures of student attrition. Chicago: The University of Chicago Press.
Tinto, Vincent. (1982). Defining dropout: A matter of perspective. In E. T. Pascarella (ed.), Studying Student Attrition. New Directions for Institutional Research, 9. San Francisco: Jossey-Bass.
Tschechtelin, J. D. and McLean, A. D. (1980). Student follow-up of entrants and graduates: Maryland Community Colleges. Annapolis, MD: Maryland State Board for Community Colleges.
Tschechtelin, J. D. (1976). Black and white students in Maryland community colleges. Annapolis, MD: Maryland State Board for Community Colleges.
Turnbull, William W. (1985). Are they learning anything in college: Change, November/December, 23-26.
U. S. Department of Education, National Commission on Excellence in Education. (1983). A nation at risk: The imperative for educational reform. Washington, DC: U. S. Government Printing Office (#065-000-00177-2).
Voorhees, Richard A. (1987). Toward building models of community college persistence: A logit analysis. Research in Higher Education, 26, 2, 115-129.
Walleri, R.D. (1981). Student retention and attrition in the community college: A review and research design. Gresham OR: Mount Hood Community College.
111

Willet, L. H. (1983). One stop or stop out? A five year longitudinal analysis of community college attendance. Community/Junior College Quarterly of Research and Practice, 7, 333-341.
Wilson, B. W. (1989). An assessment of the relationship between institutional planning, resource development and institutional effectiveness in selected two-
year community colleges in the Southern Association region. Unpublished doctoral dissertation, University of North Carolina at Greensboro.
112

Appendix A
Letters of Request and Permission to Use Data Included On the
Western Regional Computer System at Virginia Western Community College
113

\ Institutional Advancement
\ PATRICK HENRY COMMUNITY COLLEGE of P.O. Drawer 5311, Martinsville, Virginia 24115-5311, Phone: (703) 638-8777
MEMORANDUM
TO: Max Wingett
FROM: _ Jean Williams
DATE: April 26, 1989
SUBJECT: Use of PHCC Student Information for Dissertation
As you know I am working on my Ph.D. in Educational Research and Evaluation at Virginia Tech. I am ready to begin work on my dissertation and would like to use data from the Student Information System if possible.
I plan to look at students’ educational goals when they apply and compare them to two different measures of success to determine which measure is more valid in discussions about institutional effectiveness. I expect to find that traditional measures of success (on- time graduation) are appropriate for transfer students who have recently graduated from high school. A more appropriate measure of success for nontraditional and occupational/technical students may be attainment of educational goals after a longer period of time. This is an area which community colleges across the country are just beginning to examine. I have not been able to find any empirical studies on this topic, and discussions with other institutional researchers and college administrators in the state lead me to believe that very few, if any, have conducted similar studies. This may be a chance for PHCC to break new ground in the area of assessment and institutional effectiveness.
With your permission, I would like to track a sample of PHCC students across several quarters/semesters to determine the validity of these two success measures for several groups of students. Information about PHCC students will be combined with that from other colleges in the western region of Virginia. In my report of this study I will not identify PHCC without prior permission from you nor, will I identify any students or provide information which would allow others to identify PHCC or its students. I will be happy to share my findings with you and your staff.
I appreciate you consideration of this request. As always, if you need more information or clarification about my plans, I will be happy to provide it.
pe: Dr. Joanne B. Whitley, Director of Institutional Advancement
114
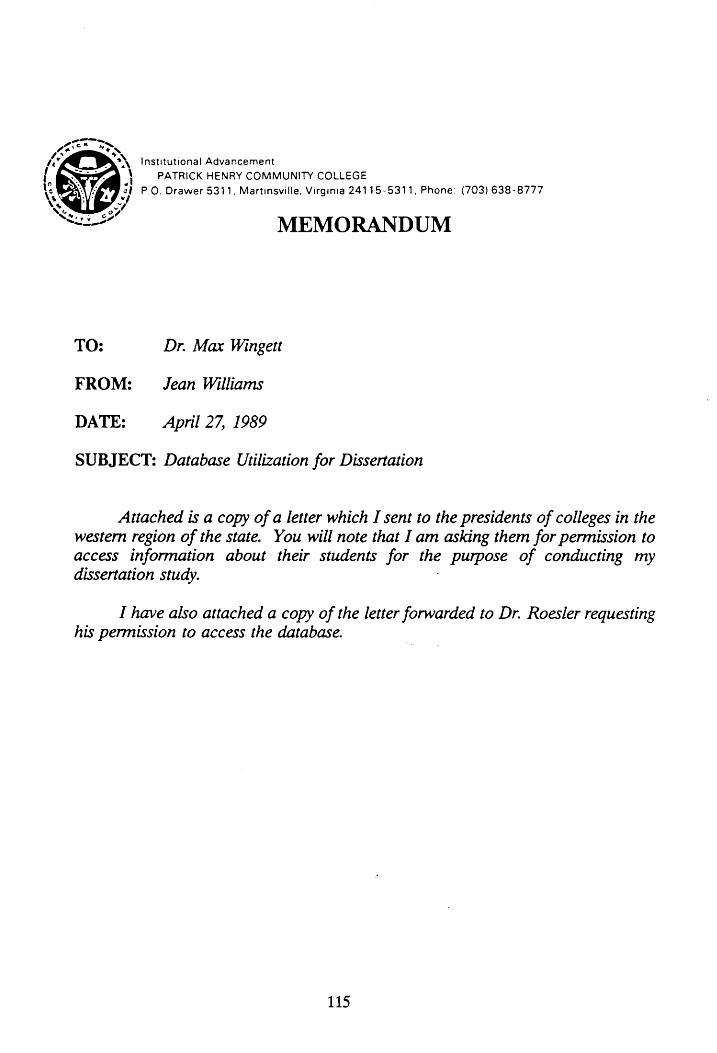
Institutional Advancement
PATRICK HENRY COMMUNITY COLLEGE
P.O. Drawer 5311, Martinsville, Virginia 24115-5311, Phone: (703) 638-8777
MEMORANDUM
TO: Dr. Max Wingett
FROM: = Jean Williams
DATE: April 27, 1989
SUBJECT: Database Utilization for Dissertation
Attached is a copy of a letter which I sent to the presidents of colleges in the western region of the state. You will note that I am asking them for permission to access information about their students for the purpose of conducting my dissertation study.
I have also attached a copy of the letter forwarded to Dr. Roesler requesting his permission to access the database.
115
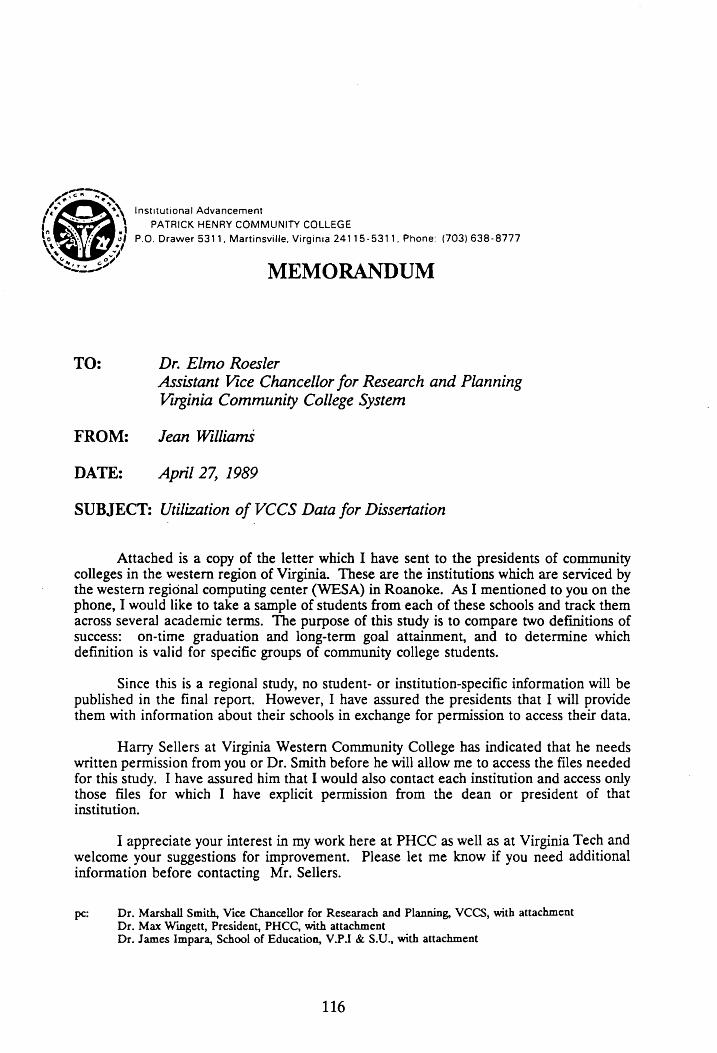
\ Insututional Advancement
\ PATRICK HENRY COMMUNITY COLLEGE
ot P.O. Drawer 5311, Martinsville, Virginta 24115-5311, Phone: (703) 638-8777
SS? MEMORANDUM
TO: Dr. Elmo Roesler Assistant Vice Chancellor for Research and Planning Virginia Community College System
FROM: Jean Williams
DATE: April 27, 1989
SUBJECT: Utilization of VCCS Data for Dissertation
Attached is a copy of the letter which I have sent to the presidents of community colleges in the western region of Virginia. These are the institutions which are serviced by the western regional computing center (WESA) in Roanoke. As I mentioned to you on the phone, I would like to take a sample of students from each of these schools and track them across several academic terms. The purpose of this study is to compare two definitions of success: on-time graduation and long-term goal attainment, and to determine which definition is valid for specific groups of community college students.
Since this is a regional study, no student- or institution-specific information will be published in the final report. However, I have assured the presidents that I will provide them with information about their schools in exchange for permission to access their data.
Harry Sellers at Virginia Western Community College has indicated that he needs written permission from you or Dr. Smith before he will allow me to access the files needed for this study. I have assured him that I would also contact each institution and access only those files for which I have explicit permission from the dean or president of that institution.
I appreciate your interest in my work here at PHCC as well as at Virginia Tech and welcome your suggestions for improvement. Please let me know if you need additional information before contacting Mr. Sellers.
pe: Dr. Marshall Smith, Vice Chancellor for Researach and Planning, VCCS, with attachment
Dr. Max Wingett, President, PHCC, with attachment Dr. James Impara, School of Education, V.P.1 & S.U., with attachment
116
\ Institutional Advancement
\ PATRICK HENRY COMMUNITY COLLEGE ! w
e oS of P.O. Drawer 5311, Martinsville, Virginia 24115-5311, Phone: (703) 638-8777
\ ~ . Sy April 27, 1989
Dr. Marilyn C. Beck, President Lord Fairfax Community College P. O. Box 47 Middletown, VA 22645
Dear Dr. Beck:
I am enrolled in the educational research and evaluation doctoral program at Virginia Tech. The area of study which I have selected for my dissertation deals with educational goal attainment as a measure of institutional effectiveness. Specifically, I plan to test the validity of two definitions of success: on-time graduation and long-term goal attainment.
To conduct this study I need to access information provided by community college students in the western region of Virginia when they apply for enrollment. Specifically, I will be looking: at curriculum codes for a sample of students during their first term of enrollment. I will then track those students over several terms to determine what types of students are successful. My final product will be a set of prediction equations which may be used to identify students who are likely to leave school prior to goal attainment. Early interventions may be provided for such high-risk students.
Since data needed to conduct this study are contained on the computing system, with your permission it may be accessed locally and will not require work on the part of any person on your staff. If you allow me to utilize data about your students, it will be treated in a confidential manner, Lord Fairfax Community College will not be identified in the final report without prior written permission from you, and I will not provide information which will allow anyone to identify your institution or its students. I will provide you with institution-specific information which is collected during the course of this study.
In order to access this information I must have your written permission. I would appreciate your considering this request and providing such permission at your earliest convenience. If you need clarification about the specifics of this study, I will be happy to provide it. I look forward to hearing from you in the very near future.
Yours sincerely,
Jean M. Williams, Coordinator Institutional Research, Planning and Evaluation
pe: Dr. Max F. Wingett, President, PHCC Dr. James Impara, School of Education, V.P.I. & S.U. Dr. Elmo Roesler, Assistant Vice Chancellor for Research and Planning, VCCS
117

Names and Addresses of College Presidents Who Received Letters Requesting Permission
to Access Institutional Databases
Dr. Marilyn C. Beck, President Lord Fairfax Community College P.O. Box 47 Middletown, VA 22645
Dr. John F. Beckels, President
Dabney S. Lancaster Community College P.O. Box 1000 Clifton Forge, VA 24422-1000
Dr. Charles Downs, President
Virginia Western Community College P.O. Box 14005
Roanoke, VA 24038
Dr. Floyd Hogue, President New River Community College Route 100 North Dublin, VA 24084
Dr. Charles R. King, President Southwest Virginia Community College P.O. Box SVCC Richlands, VA 24641
Dr. N. DeWitt Moore, Jr., President
Virginia Highlands Community College P.O. Box 838 Abingdon, VA 24210
Dr. Arnold R. Oliver, President
Danville Community College 1008 South Main Street Danville, VA 24541
Dr. Ruth M. Smith, President Mountain Empire Community College Drawer 700 Big Stone Gap, VA 24219
118

Dr. William F. Snyder, President Wytheville Community College 1000 East Main Street Wytheville, VA 24382
Dr. Max Wingett, President Patrick Henry Community College P.O. Drawer 5311 Martinsville, VA 24112-5311
119

Lord Fairfax Community College
P.O. BOX 47, MIDDLETOWN, VA 22645 703-869-1120
May 24, 1989
Ms. Jean M. Williams, Coordinator Institutional Research, Planning and Evaluation Patrick Henry Community College P. 0. Drawer 5311 Martinsville, Virginia 24115-5311
Dear Ms. Williams:
Your request is approved to access computer information needed to complete your Virginia Tech doctoral dissertation study as explained by your letter of April 27. I will look forward to receiving results of your study.
120

ommunity.
1008 South Main Street ollege Danville, Virginia 2454]
(804) 797-3553
May 8, 1989
Ms. Jean M. Williams Coordinator Institutional Research, Planning and Evaluation Patrick Henry Community College P. O. Drawer 5311
Martinsville, VA 24115-5311
Dear MS. Williams:
This is to advise that I am authorizing you to access Dan- ville Community College data currently contained in the computing system for use in your doctoral research. My only concern is that
the data be treated in a confidential manner as stated in your letter of April 27.
My best wishes to you aS you undertake this project.
Sincerely,
hoot Arnold R. Oliver
President
gb
121
CARROL,
hd Q * @ WYTHEVILLE W Wytheville Community College, 1000 East Main Street, Wytheville, Virginia 24382, Telephone 703/228-5541 D COMMUNITY COLLEGE 5,
1963 s ‘SMyT™
May 12, 1989
Ms. Jean M. Williams, Coordinator Institutional Research, Planning and Evaluation Patrick Henry Cammuinity College P. O. Drawer 5311 Martinsville, VA 24115-5311
Dear Ms. Williams:
As requested in your letter of April 27, 1989, I grant you permission to access the information on Wytheville Camnity College students required for your dissertation at Virginia Tech. This approval is provided under the conditions you outlined in your letter. Your contact at WCC will be Phyllis C. Ashworth, my Administrative Assistant. If you have questions or need additional information as you begin your research, please contact her.
I hope the information will be useful to you and wish you much success in your research study.
Sincerely,
William F. Snyde President
rms
c Phyllis C. Ashworth, Administrative Assistant
to the President
122

A. MOUNTAIN EMPIRE COMMUNITY COLLEGE
DRAWER 700 BIG STONE GAP, VIRGINIA 24219
TELEPHONE: 703/523-2400
Office of the President
May 12, 1989
Ms. Jean M. Williams, Coordinator Institutional Research, Planning & Evaluation Patrick Henry Community College P. O. Drawer 5311 Martinsville, VA 24115-5311
Dear Ms. Williams:
You have permission to access Mountain Empire Community College student data contained on the computer system per your request and under the conditions stipulated in your letter of request dated April 27, 1989.
Your effort in the area of identifying student goals and levels of attainment is an extremely worthwhile endeavor. It is very timely as the community colleges seek to better understand the behavior of "“non- returning" students.
We look forward to you sharing your findings with us.
Sincerely,
Ear. Tertadee mith Ruth Mercedes Smith
President
jb
123

VY VIRGINIA WESTERN COMMUNITY COLLEGE
3095 Colonial Avenue, S.W., P.O. Box 14045, Roanoke, Virginia 24038, Phone: 703/857-7311
OFFICE OF THE PRESIDENT
May 23, 1989
Mrs. Jean Williams
Coordinator Research, Planning & Evaluation
Patrick Henry Community College P.O. Drawer 5311 Martinsville, VA 24115
Dear Mrs. Williams:
You are welcome to include Virginia Western in your study of student goal attainment, with your assurance that our institution and student information will not be identified in any release of the results.
I would appreciate your sharing the results of your study with us, as the findings may be very helpful.
As you get into your study and need assistance accessing our student records, please contact Dr. David Hanson, Director of
Instructional Support Services, at 857-7942.
Good luck with your research.
Sincerely,
CAAT NZ Charles L. Downs,
President
c: Dr. David Hanson Mr. Harry Sellers
124
VIRGINIA HIGHLANDS COMMUNITY COLLEGE
May 2, 1989
Ms. Jean M. Williams, Coordinator
Institutional Research, Planning
and Evaluation
Patrick Henry Community College P. O. Drawer 5311
Martinsville, VA 24115-5311
Dear Ms. Williams:
Please consider this letter as your written authorization to
access information concerning Virginia Highlands Community College students. Certainly I expect and appreciate your assurance that all
information will be treated in a confidential manner. We are not interested in being identified in your final report, but would like
to receive institution-specific information which you collect.
Best wishes to you in your study.
Sincerely,
7 (eit law , N. DeWitt Moore, Jr.
President
lmc
cc: Dr. Max F. Wingett, President, PHCC
Dr. James Impara, School of Education, V.P.I. & S.U. Dr. Elmo Roesler, Assistant Vice Chancellor for Research and
Planning, VCCS
125

C Southwést Virginia Gommurity College
f P.O. BOX SVCC, RICHLANDS, VIRGINIA 24641-1510, TELEPHONE (703) 964-2555 OFFICE OF THE PRESIDENT
June 5, 1989
Ms. Jean M. Williams, Coordinator Institutional Research, Planning, and Evaluation
Patrick Henry Community College P.O. Drawer 5311
Martinsville, VA 24115
Dear Ms. Williams:
Thank you for your letter of May 15. Your proposed dissertation study is of
great interest to us at SVCC and we will look forward to hearing the results of your investigations. Please consider this letter my written permission for you to use Southwest Virginia Community College student data under the terms and conditions described in your letter.
I understand that you have contacted Dean Armand Opitz and discussed your plans directly with him. Please therefore consider Dean Opitz your official campus contact in any concerns pertaining to the study.
Best wishes for a successful project.
Sincerely,
oh wasRA ry Charles R. King
CRK/DDH/ nh
cc: Mr. Armand Opitz, Dean of Student Services
Dr. Max F. Wingett, President, PHCC Dr. James Impara, School of Education, VPIG&SU Dr. Elmo Roesler, Assistant Vice Chancellor for
Research and Planning, VCCS
126

May 4, 1989
Mrs. Jean M. Williams, Coordinator
Institutional Research, Planning §& Evaluation
Patrick Henry Community College
P. O. Drawer 5311
Martinsville, Virginia 24115-5311
Dear Mrs. Williams:
I am pleased to give you permission to utilize data dealing with New River
Community College students for the purposes as you outlined in your letter of April 27, 1989.
Your dissertation area of study of educational goal attainment as a
measurement of institutional effectiveness is a most worthwhile and timely one. On-time graduation and long-term goal attainments are appropriate concerns for institutional effectiveness and assessment purposes. I see the results of your study as being beneficial in providing meaningful data to both SACS and SCHEV.
I do understand that New River will be provided with institutional-specific information which is collected during the course of your study, and that the
data will be treated in a confidential manner.
Without any hesitation, again, I grant you permission to utilize data dealing with New River Community College students and I wish you success with
your doctoral endeavor.
If further needs arise, please let me know.
Sincerely,
Aho Floyd M. Hogue
President
FMH/drq
ec: Dr. Jack M. Lewis, NRCC
Mr. J. Doyle Lyons, NRCC
Dr. Elmo Roesler, VCCS
127

Appendix B
Code Book
128
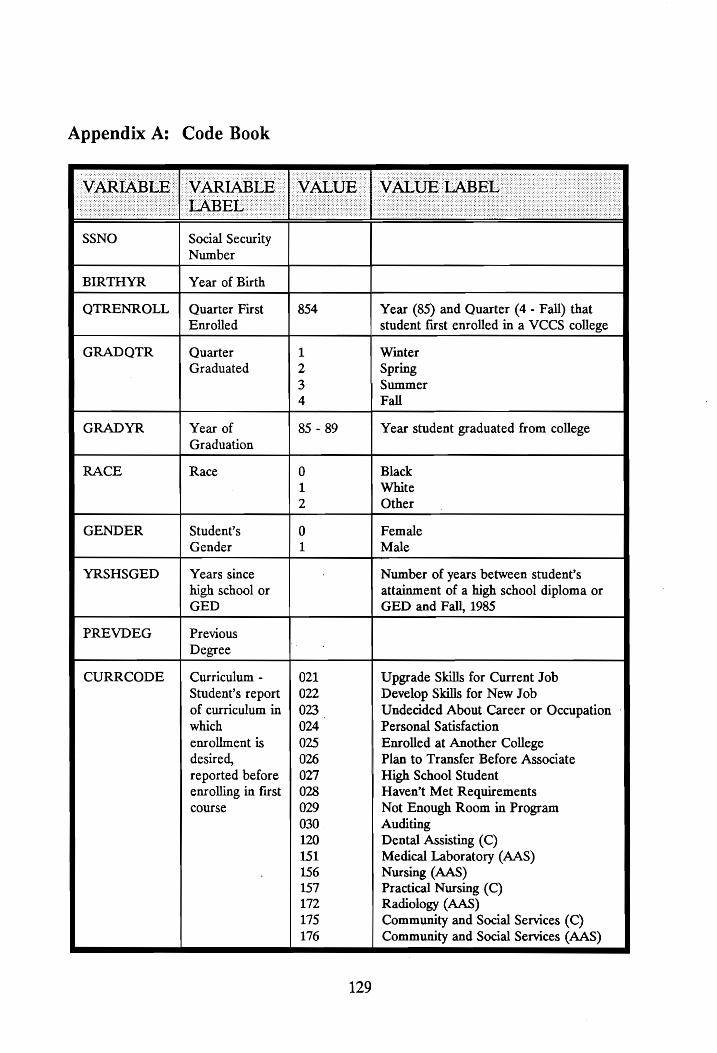
Appendix A: Code Book
Social Security Number
BIRTHYR Year of Birth
QTRENROLL Quarter First
Enrolled
Year (85) and Quarter (4 - Fall) that student first enrolled in a VCCS college
GRADQTR Quarter
Graduated
Winter
Spring Summer
Fall
Year of
Graduation
Year student graduated from college
Race Black
White
Other
GENDER Student’s
Gender
Female
Male
YRSHSGED Years since
high school or GED
Number of years between student’s attainment of a high school diploma or GED and Fall, 1985
PREVDEG Previous Degree
CURRCODE
Curriculum - Student’s report of curriculum in which enrollment is desired, reported before enrolling in first course
129
Upgrade Skills for Current Job Develop Skills for New Job Undecided About Career or Occupation - Personal Satisfaction Enrolled at Another College Plan to Transfer Before Associate High School Student Haven’t Met Requirements Not Enough Room in Program Auditing Dental Assisting (C) Medical Laboratory (AAS) Nursing (AAS) Practical Nursing (C) Radiology (AAS) Community and Social Services (C) Community and Social Services (AAS)

CURRCODE | Curriculum - | Respiratory Therapy Technician (C) | Student’s report Records Management (C)
of curriculum in Accounting (C) which Accounting (AAS) enrollment is Bookkeeping (C) desired, Accounting Clerk (C) reported before General Business (C) enrolling in first Data Processing (AAS) course Computer/Machine Operations (C)
Banking & Financial Mgnt. (C) Management (AAS) Business Administration (AS) Business Administration (AAS) Computer Programming (AAS) Continuing Career Studies (C) Banking (C) Computer Information Science (C) Merchandising (AAS) Management Assistant (C) Clerk Stenographer (C) Secretarial Science (AAS) Business Careers (C) Medical Office Clerk (C) Office Information Procedures (C) Corrections Science (AAS) | Law Enforcement (C) Police Science (AAS) Human Services Careers (C) Forensic Science (C) Human Services (AAS) Education (AAS) Education(AS) Child Care (C) Communication Arts (AA) Liberal Arts (AA) Liberal Arts (AAS) General Studies (AAS) General Studies (AS) Environmental Science (AAS) Engineering (AAS) Science (AS) Science (AAS) Air Cond. & Refrigeration (D) Architecture (AAS) Air Cond. & Refrigeration (C)
130

CURRCODE
Curriculum - Student’s report of curriculum in which enrollment is desired, reported before enrolling in first course
941 942 943 949 950 951 952 958 963 964 968 981 985 991 995 998
Appliance Servicing (C) Auto. Analysis & Repair (D) Auto. Body Mechanics (C) Automotive(AAS) Civil Engineering (AAS) Construction/Const. Mgmt. (AAS) Drafting and Design (AAS) Drafting (C) Drafting and Design (C) Drafting and Design (D) Instrumentation (AAS) Electrical Electronics (D) Electricity/Electronics (AAS) Electricity (C) Electrical Electronics (C) Electronics Servicing (D) Machine Engineering (AAS) Machine Operations (D) Machine Tool Operations (C) Machine Shop (D) Industrial Engineering (AAS)
Printing (D) General Engineering (AAS) Electronics (AAS) Mining Technology & Superv. (C) Industrial Management (C) Welding (C) Mining (AAS)
AAS = Associate in Applied Sciences Degree AS = Associate in Science Degree C = Certificate D = Diploma
Source of Curriculum Codes: Curriculum Code Lists and Translation Tables: 1982-1983
Age at Entry Age of Student When First Enrolled
Age at
Graduation
Age of Student Upon Graduation
NOTERMS
Length of College Career
131
Number of Terms Completed (Calculated by summing across all terms in which at least one credit hour
was earned.)

“ENROLLXX | Enrollment Status
Not Enrolled during current term Enrolled during current term
*“CREDHRXX | Credit Hours Number of credit hours earned during current term
"DEVELXX Developmental Student
Not a Developmental Student during term
Developmental Student during term
"“ACHGOLXX | Achieved Goal Didn’t Achieve Goal during term Achieved Goal during term
*CRSLDXX Courseload Part-time (fewer than 12 credit hours) Full-time (12 or more credit hours)
*"TOTGPAXX Overall GPA Grade point average in all courses. taken while enrolled in the Virginia Community College System
"XX: At the end of a variable name, this indicates that a code will be inserted to show the academic term to which this information applies, i.e.,:
The first digit indicates the term: S = Summer F = Fall W = Winter P = Spring
The second digit indicates the year: 5 = 1985 6 = 1986
= 1987
8 = 1988
9 = 1989
132

TOTCRHRS Total Number
of Credit Hours
completed
Calculated by summing across all academic terms between fall, 1985 and spring, 1987 or spring, 1989. (Semester hours were converted to quarter hours: Each semester hour received 1.5 quarter hour credits.)
DIVISION College Division
Nr
© Unclassified
Occupational/Technical Arts and Sciences
COLLEGE
College Attended
wan
nn
bh WN
133
(To maintain anonymity, colleges are not listed)

Appendix C
Sample Community College Application
134
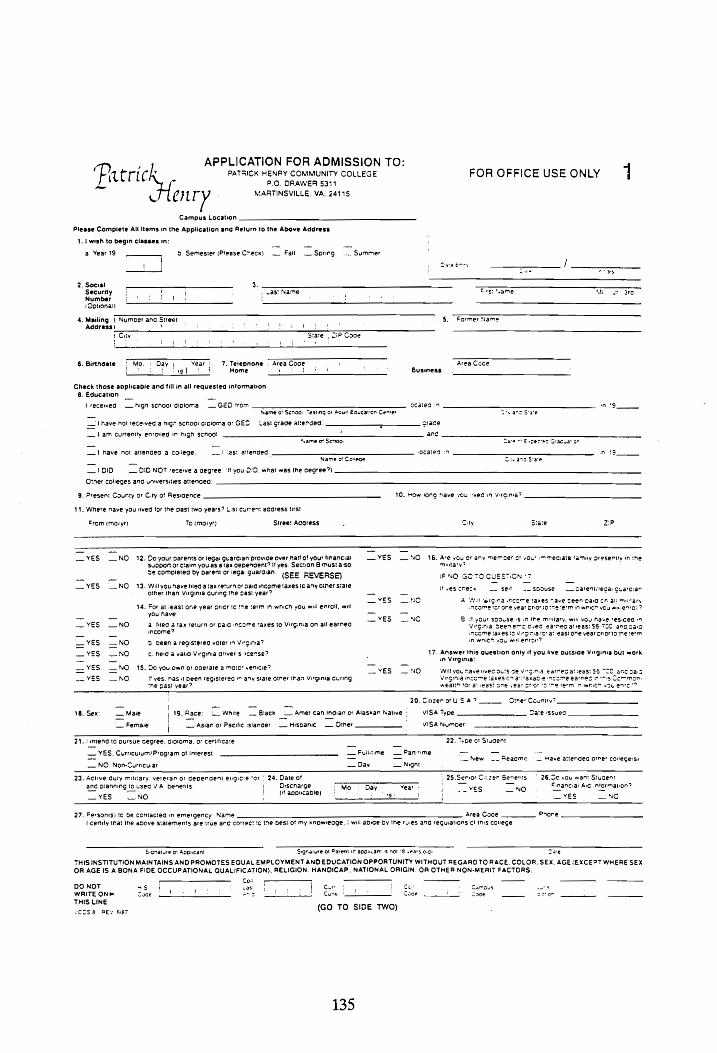
APPLICATION FOR ADMISSION TO: ‘ (hs PATSICK HENRY COMMUNITY COLLEGE FOR OFFICE U Patric ENRY COMMUNITY COLL SEONLY 1
Cnr . MARTINSVILLE. VA. 24115 —
Campus Location
Please Complete All tems in the Application ano Return io the Above Address
1. wish to begin classes in: ‘
a Year 19 | bd Semesier (Please Crecx) . Fali - Soring __ Summer
| 1 | : Sara bos / Ls : lve 7 aS
2. Social —_— eS 3. Security j ! | : , Last Name Ferg: .ame ‘Mi oe are Number | (O52 ot: — : . : st (Optena) oT —OCTCTCOTOTTTT
4. Mailing | Numoer and Street 5. Former Name Address! |; ' So ee '
+ City Sime , CIF Cooe A \ roiotos :
6. Birthaate | Mo |! Day ; Vear 7. Tetephone ; AreaCoce _ ' Area Coce Yo tae ui Home oo 14 4 St Business”
Check those applicable and fill in all requested information 8. Education
\ recewec high scnool diploma __ GED trom ccaies .n ng Name of Scn00: Testing of Aguit Equcar-on Center Bivarc Save
| have not received a hign scnoo! cisioma or GED Last grace atterced : grace
—! am Currently enrotied in high scnoo! and *.ame ot Scnoo. Tare tt Eaceces Sacwat or
—~! Mave not attencec a college —~ | last attenced | ocaied 33 nig Name o! Conece Civ ans S:ave
—1d10 .— DID NOT recewe a degree (tf you DID. wnat was tne cegree”)
Otner colieges anc universities attenced.
9. Present County or City of Resicence 10. How iorg Nave vou “veo in Virginia?
11. Where nave you ived for tne past two years? Lisi Current acoress first
From (moryr} To (mosyr) Street Adcress . Cuty Sate ziP
. YES _ NO 12. Do your carents or iegal quaraian provide over Nai! of your financial —YES NO 16. Are vou or any memoer of Ou" 1m Teciale famuy presently in the Suppor or claim you as a tax cepengent? If yes. Section 8 must aiso mutary?
€ completed rent or iegal Quarcian. a _ _ De completed by dare aig (SEE REVERSE) ENO GOTOGUESTION'? YES NO 13, Willvou have fied atax return or aid income taxes to any oiner siate ~ ~~ ~ — YS — . It sa neon —_— fl _— a rarents uw :
. other than Virginia auring the past year? _ _ scne se soouse warentiiega: Guaraiar — YES NO A Vil @rgina income taxes “ave CeeN Das cn ali Muitary
14, For at least one year prior tc tre term in which you will enroll. will ‘NCOMe "or ONS veal CO tO [re ‘erm in which vou ww enrci 7 you have —_ —_
_ _ —YES NO B i your spouse -$ in tne Neitary wit vou Mave fesiced -n — YES NO a fied a tax return or paid income taxes to Virginia on ail earned Vena Seeremc Cvea ea-necatieas: $6 700 ancsac _ _ income INCOME tax@S 1 virgiria iC’ at east One vear Drior io ine term
YES NO D been a registered voter in Virginia? IN wriER vou wal enroi?
— YES NO € eid a vahe Virgima onver s »cetse? 17. Answer this question only if you live outside Virgima but work — —_ . im Virginia:
t . motor venicie? — — ene = YES NO 15 0 you own or operaie a motor venicie — YES "0 Will VOL Mave vec Ou! ce Vg mia €arrec atieasi $5 “20 anccas ~~ YES NO I! ves. nas it Deen registerec ir ary Stale otner than Virginia Curing Virgina income taxes C3 a 'axad-e ncome earnes ‘ning Common.
ine past year? wealtn tor a east ONE yea’ Deon "CT! term oT WhICT WOU eNe.'?
20. CarzenotUS A? ____ Otmes Country?
18, Sex: — Maile | 19. Race: White __ Black __. American Ing:an or Alaskan Native - VISA Type Date tssuec = ; — — — — Femaie | __ Asian or Pacific isianoer __rispanie = Orner VISA Numoer
21. | intend to pursue degree. aiptorna. or certificate " 22. Type of Stucent
— YES. Curricuium/Program of interest —~ Full-time __ Pan-time | _ —. os _ _ —_ | ._New __Reaomi _ Have atiencec oimer conege's) — NO. Non-Curricuiar — Dav i Night '
23. Active duty mittary veteran or Gepencent engire'or 24. Date of ‘ 25.Semior C.rzen Berents 26.00 vou want Stugent
anc adianning to usec VA benefits ! Oriscnarge Mo; Day Year: : ~ VES ~ NO Financiat Arc Information? — —_ ! (it aopucable} bop ty gy : ; ~- OS _— —_ — — YES — NO ; eee és ! \ — YES — NC
27. Persanis) 10 be contacted in emergency Name Area Coce Prone I certify tnat the above sialements are true anc correct ic tne Desi of my knowieage | wili adice Dy Ine rules and reguiations Cf this college
Signature ot Appucant Signature of Parent ti! aponcant s nor & -ears 0.0) tare
THIS INSTITUTION MAINTAINS AND PROMOTES EQUAL EMPLOYMENT AND EDUCATION OPPORTUNITY WITHOUT REGARO TO RACE. COLOR. SEX. AGE (EXCEPT WHERE SEX OR AGE 1S A BONA FIDE OCCUPATIONAL QUALIFICATION). RELIGION. HANDICAP, NATIONAL ORIGIN. OR OTHER NON-MERIT FACTORS.
eee Cor TT } DO NOT 4S i, a { Cer | | po er Comsus ww S WRITE ON» Coae _ era Lt Gune | cone 1° Coae er
THIS LINE
“COS8 REY 6/67 (GO TO SIDE Two)
135

SECTION B--Compiete this section if you answered YES to question 12 on the reverse of this form.
1. Name of parent or jegai quaraian 3. Citzenship () U.S. ( jNon-US. H Non-US. Give Visa Type 4. How long have you lived in Virginia? 5. Where have you lived for the past two years” Ost current adGress first: From (mo/yr)} To (moyyr) Street Accress City State
2. Fetationsnip to appicant
6. Will you nave filed a tax return or paid income taxes to any State other than Virginia curing the past year? YES{ } NO( 7. Will you have claimed the aopiicant as a cecencent on your tsceral and Virginia income tax returns for the tax year orice to the term
in which the applicant will enroll? YES(} NO) 8. Will you have provided over haif of the appiicant’s financial support for at least one year prior to tne term in which the acpicant will enroll?
YES() NO) : 9. For at least one year prior to the term in which the applicant will enroll. will you have:
a. filed a tax return or paid income taxes to Virginia on all earned income? YES( ) NOC) b. been a registered voter in Virgima? YES{) NO() c. held a valia Virgima driver's icense? YES(} NOC}
10. Do you own or operate a motor vehicle? YES() NO() it yes. has it been registered in any state otner than Virginia during the cast year? YES( )} NOC}
11. Are you or your spouse in the miinary? YES() NO() iF NO, GO TO QUESTION 12. iF YES, CHECK: { )Serf { ‘Spouse a. Will wan income taxes have been said on ail military income for one year prior to the term in whicn the apolicant wil enroll? YES() NO(} b. if the answer to (a) is NO. will the acolicant’s non-military oarent have resided in Virginia. been emdioyed anc earned at least $6.700. paid Virginia income taxes and claimed tne appicant as a cepencent for feceral and Virginia income tax purpeses fcr a ‘east one year prior to tne term in whien the acpucant wil enroll? YES() NO()
12. Answer this question only if you or your sDouse live outsice Virginia Dut work in Virginia: a. Will you or your soouse have lived outsice Virginia, Deen employed in Virginia. earnec at ‘east £6.700. and card Virginia income taxes on all taxable income earned in this Commonweaith tor at least one year orior to the term in which tne acsucant wil enren? YES( 5 NOL) b. If the answer to (a) is YES. will the parent employed in Virginia have ciaimec the applicant as_a Cecencent ‘or feceral ana Virginia income tax purposes for at feast one year prior to the term in which the appiicant will enroll? YES() NOC)
| certify that all the information provided is true.
Signature of Parent or Legal Guardian DATE
CURRICULUM SELECTION--All Applicants Must Complete This Section
PART I. To complete your application, you must select one of the interest areas offered. Mark "X" next to the area that seems to fit your educational goals at this time. If you decide to change programs, go to the counseling office and complete a change form.
TWO-YEAR PROGRAMS—COLLEGE TRANSFER
___BUSINESS ADMINISTRATION (1216) ___GENERAL STUDIES (1697) _ SCIENCE (1881) ___ EDUCATION (1624) __LIBERAL AATS (1650)
TWO-YEAR PROGRAMS--ASSOCIATE IN APPLIED SCIENCE DEGREES
__ACCOUNTING (6203) __CFFICE SYSTEMS TECHNOLOGY (6294) __MANAGEMENT /€212) COMPUTER PROGRAMMING (6234) “INDUSTRIAL ELECTRONICS TECHNCLOGY (6981) ~_NURSING 18156)
~_CFFICE COMPUTER TECHNOLOGY (6234) ~~ TWO-YEAR DIPLOMA
___AUTOMOTIVE ANALYSIS AND REPAIR (3907) __CRIMINAL JUSTICE (pencing approval)
ONE-YEAR PROGRAMS-CERTIFICATE
BOOKKEEPING (4204) INDUSTRIAL WELDING (4995) GENERAL BUSINESS (4208) TT CLERICAL STUDIES (4218) “CRAFTING & DESIGN (4922) TTINDUSTRIAL ELECTRICITY ELECTRONICS (4943)
LESS THAN ONE YEAR OF FULL-TIME STUDY—CAREER STUDIES CERTIFICATE (4221)
( JADULT HOME ADMINISTRATION ( JART STUDIES {( JAUTOMCTIVE SYSTEMS MANAGEMENT ( JAVIATION ( JCHILD CARE ( JENGINE OVERHAUL & TROUBLESHOCTING ( )FCOD SERVICES MANAGEMENT ( )FURNITURE PRCOOUCTICN SPECIALIST
( )GERIATRIC AIDE = ( JGRAPHIC COMMUNICATIONS = ( )HEATING, VENTILATION & AIR CONDITIONING ( JHEAVY EQUIPMENT CPERATIONS & MAINTENANCE ( )INDUSTRIAL MAINTENANCE ELECTRONICS ( JINCUSTRIAL MAINT. MECHANICS
{ JOURNALISM ( \UIGHT CONSTRUCTION ( MEDIA COMMUNICATION = ( MICROCOMPUTER APPLICATIONS ( PHOTOGRAPHY ( )REAL ESTATE ERCKERAGE ( )REAL ESTATE SALES ( )RESIDENTIAL/COMMERCIAL/INOUSTRIAL ELECTRICIAN
( }SALES MANAGEMENT ( )SERVICE SPECIALTIES ( )SUPERVISION ( )THEATER ARTS ( )WELDING
PART Il. if you cannot select a specific program, mark the category which best fits your current educational goals.
You are empicyed and are seeking to uograce your skills in your present position. (5021) You are seexing to develop new skills for a new job. (5022) You are undecided about a career goal or an occupational choice. (5023) You are enrolled to gain general knowiecse and for your own personal satisfaction. (5024)
You are enrolled in another college. but are attending Patrick Henry to earn aaditional credits. (5025) You are planning to transfer to another collece without completing the requirements for,an associate decree. (5C26) You are a high school student and have cermission from your principal to enroli in college. (5027)
You have not met ail the general or specific admission requirements as stated in the college cataiog. (6028) You have met the aamission requirements for a curnculum but enroliment is restricted. (5029)
~_You are auditing a course: that is. you are enrolled. but do not plan to take examinations or receive credit. 15030)
136

Vita
Jean Williams, born November 2, 1948, in McDowell County, West
Virginia, has been concerned with the needs of students of all ages for the past
thirty years. As a teenager, she worked with “underpriviledged youth" at city parks
in High Point, North Carolina, and developed her interest in children with a
Bachelors Degree in early childhood education and a masters in educational
research and evaluation from the University of North Carolina at Greensboro.
Her work with public and private education agencies has taken her to several
states where she has held teaching and administrative positions for students from
two years old through college. Her abiding interest in making a difference for
children who are at risk of failing or dropping out of school has been expressed as
a technical assistance provider for Chapter 1 programs throughout the
southeastern and midwestern states.
Williams works for Indianapolis Public Schools as a research and
evaluation specialist and a facilitator of positive change through the development
and implementation of the system’s five-year strategic plan. She continues her
work with Chapter 1 and locally-developed programs for at-risk students,
branching out to include parent involvement, family literacy, and adult education,
as they impact so significantly on the education of children.
137