lng in the atlantic basin – plain sailing or choppy waters ... · lng in the atlantic basin –...
TRANSCRIPT
LNG in the Atlantic Basin –plain sailing or choppy waters ahead?
Andrew Jamieson
Executive Vice President: Gas and ProjectsProjects
Shell Global Solutions International BV
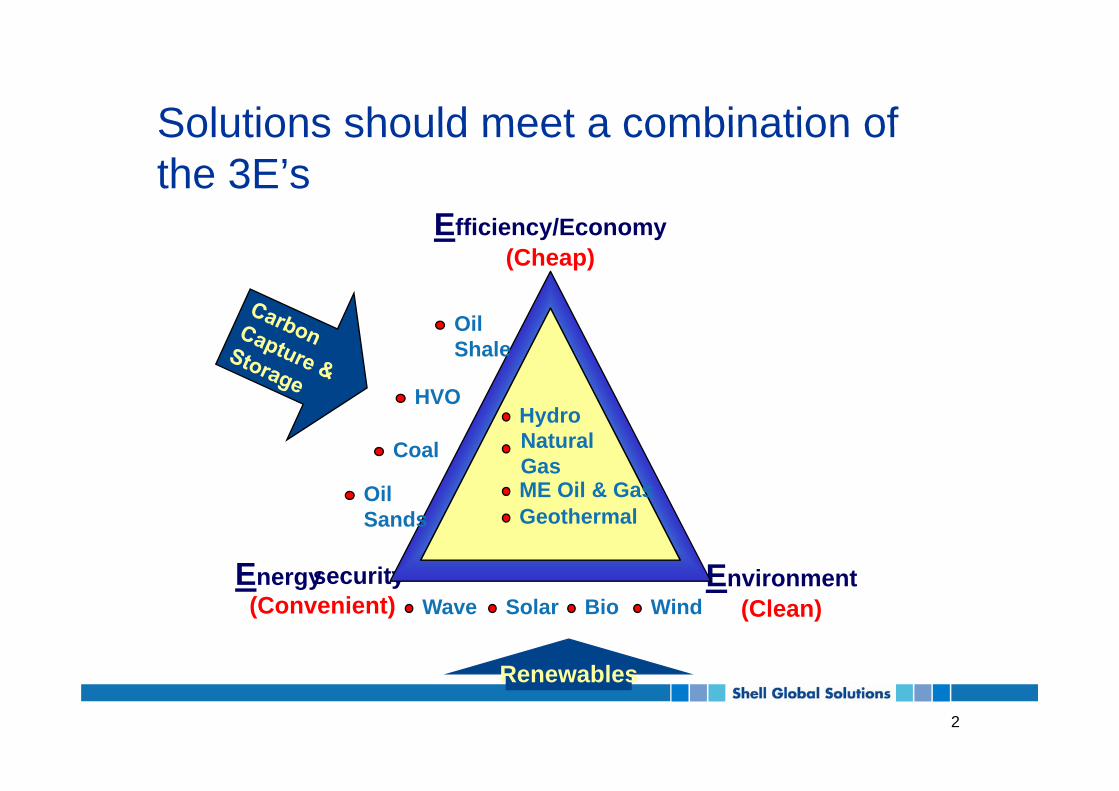
Solutions should meet a combination ofSolutions should meet a combination of the 3E’s
EEfficiency/Economy(Cheap)
HVO
OilShale
NaturalGas
Hydro
ME Oil & G
Coal
HVO
Energysecurity Environment
ME Oil & GasGeothermal
OilSands
Energysecurity Environment(Clean)(Convenient) WindSolar BioWave
2
Renewables
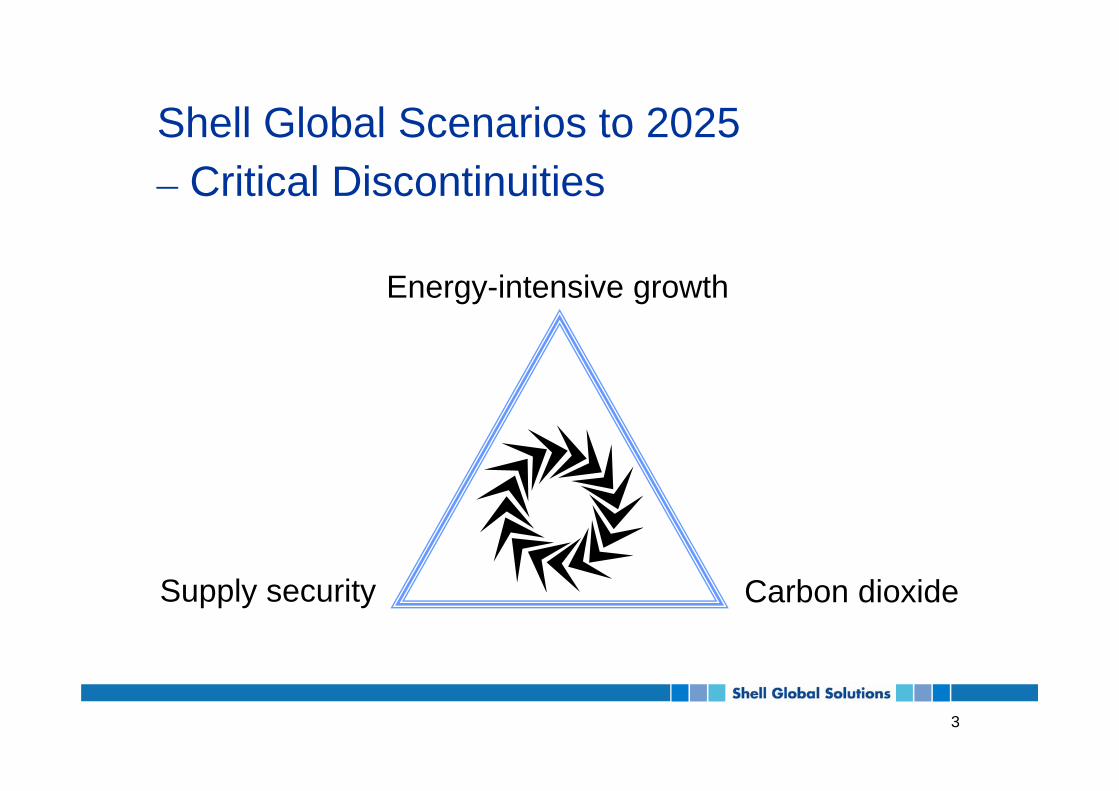
Shell Global Scenarios to 2025Shell Global Scenarios to 2025– Critical Discontinuities
Energy-intensive growth
Supply security Carbon dioxide
3
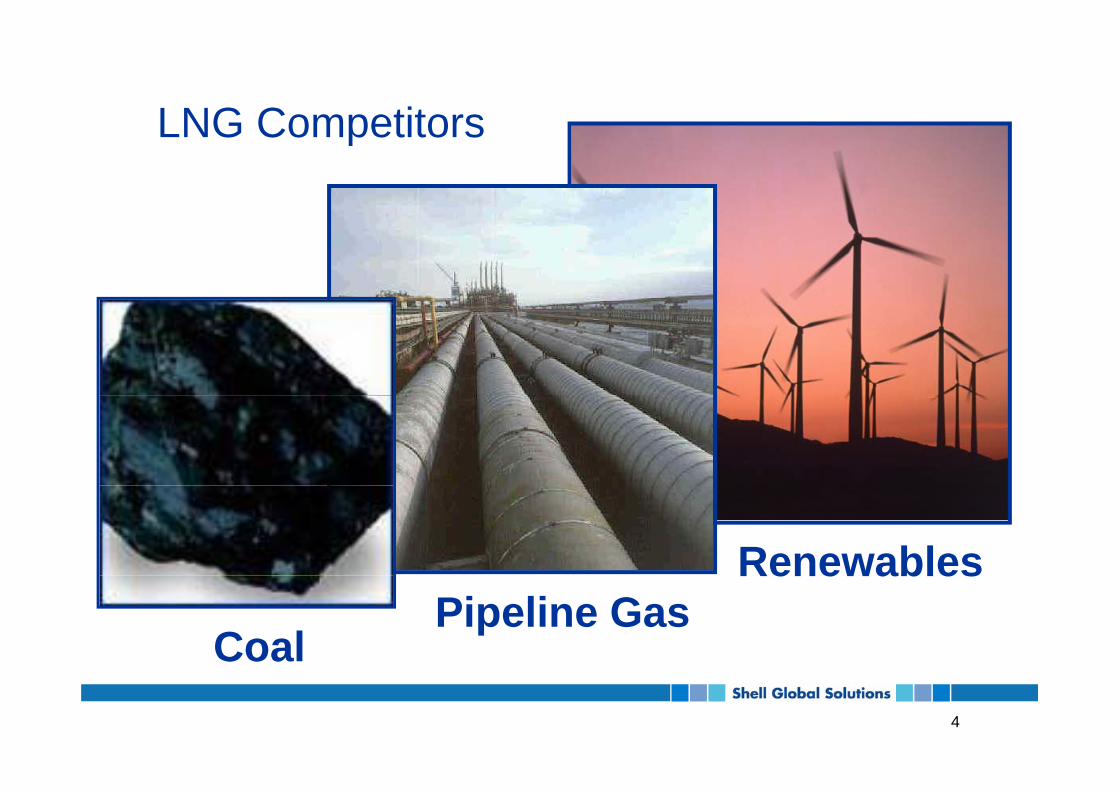
LNG CompetitorsLNG Competitors
RenewablesRenewables
CoalPipeline Gas
4
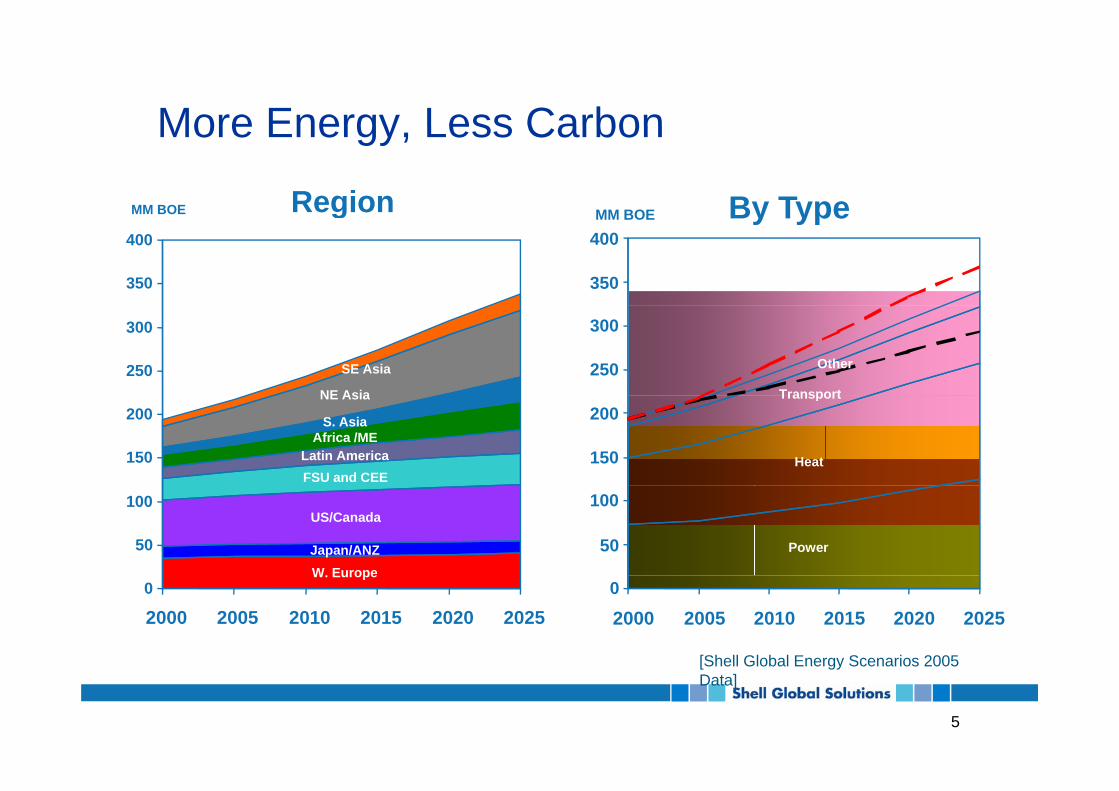
More Energy Less CarbonMore Energy, Less Carbon
RegionMM BOE By TypeMM BOEg
350
400By Type
350
400MM BOE
NE Asia
SE Asia250
300
Transport
Other250
300
FSU and CEELatin America
Africa /MES. Asia
NE Asia
150
200
Heat
Transport
150
200
W EuropeJapan/ANZ
US/Canada
50
100
Power50
100
W. Europe0
2000 2005 2010 2015 2020 2025
[Shell Global Energy Scenarios 2005
0
2000 2005 2010 2015 2020 2025
5
[Shell Global Energy Scenarios 2005 Data]

Setting the energy sceneSetting the energy scene
“Th il i d h“The oil industry has to explore new frontiers, develop new hydrocarbon energy sources and integrate ‘CO2solutions.’ The challenge is to develop technology that can p gyfuel growth without environmental degradation.”
Jeroen van der VeerChief Executive, Royal Dutch Shell plc
World energy demand 1971 – 2030(IEA World Energy Outlook 2004 reference case)
Shell plc
6
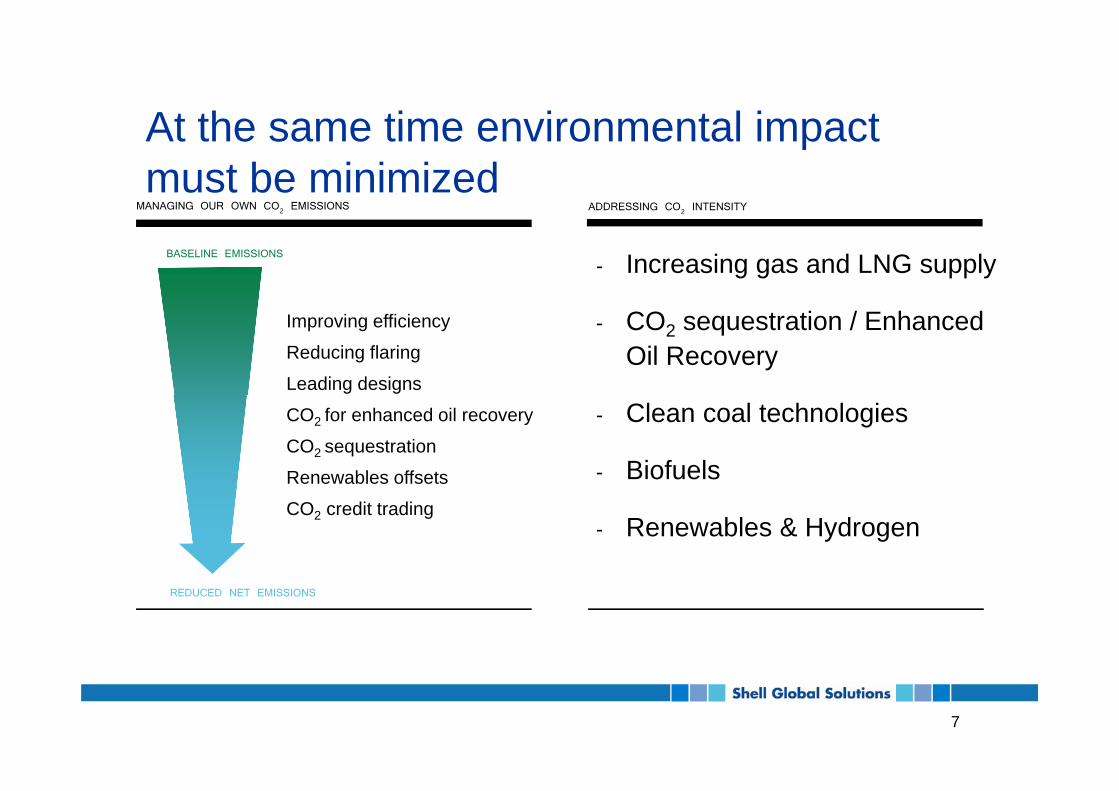
At the same time environmental impactAt the same time environmental impact must be minimized
MANAGING OUR OWN CO2 EMISSIONS ADDRESSING CO2 INTENSITY
- Increasing gas and LNG supplyBASELINE EMISSIONS
- CO2 sequestration / Enhanced Oil Recovery
Improving efficiency
Reducing flaring
Leading designs
- Clean coal technologies
- Biofuels
CO2 for enhanced oil recovery
CO2 sequestration
Renewables offsets
- Renewables & HydrogenCO2 credit trading
REDUCED NET EMISSIONS
7
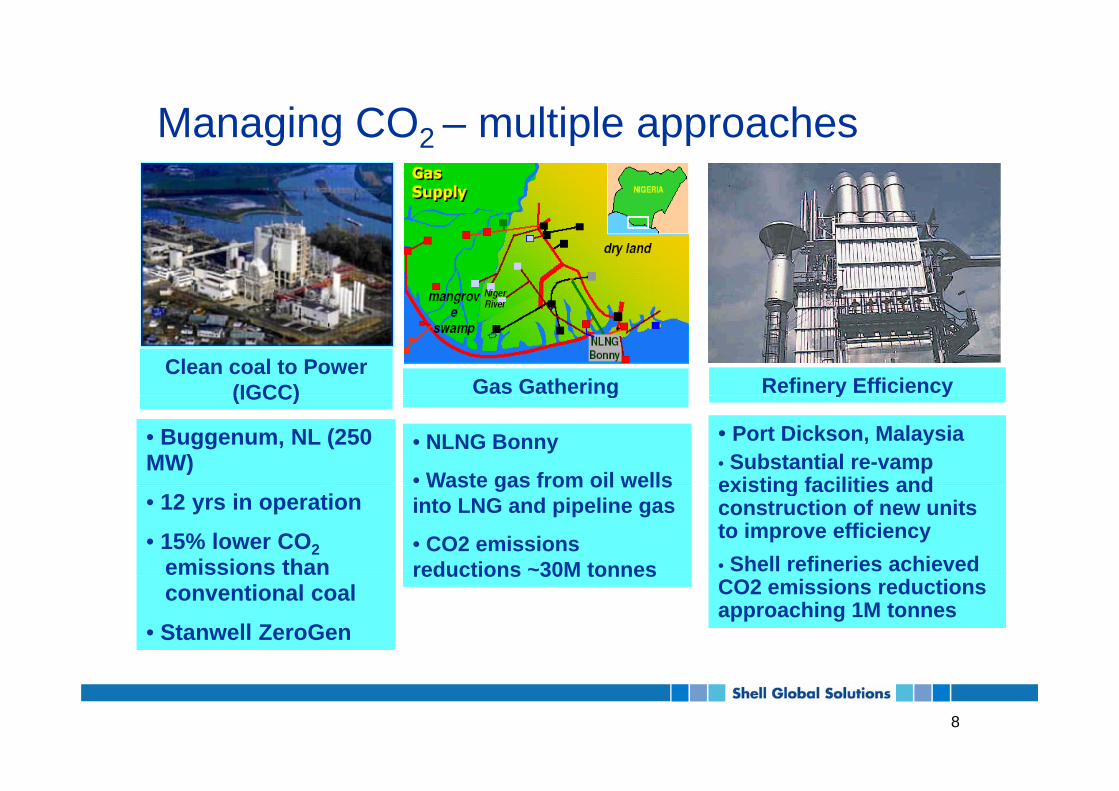
Managing CO – multiple approachesManaging CO2 – multiple approaches
Gas GatheringClean coal to Power
(IGCC) Refinery Efficiencyg(IGCC)
• Buggenum, NL (250 MW)
y y
• Port Dickson, Malaysia• Substantial re-vamp existing facilities and
• NLNG Bonny
• Waste gas from oil wells• 12 yrs in operation
• 15% lower CO2emissions than
existing facilities and construction of new units to improve efficiency• Shell refineries achieved
Waste gas from oil wells into LNG and pipeline gas
• CO2 emissions reductions ~30M tonnes
conventional coal
• Stanwell ZeroGen
CO2 emissions reductions approaching 1M tonnes
reductions 30M tonnes
8
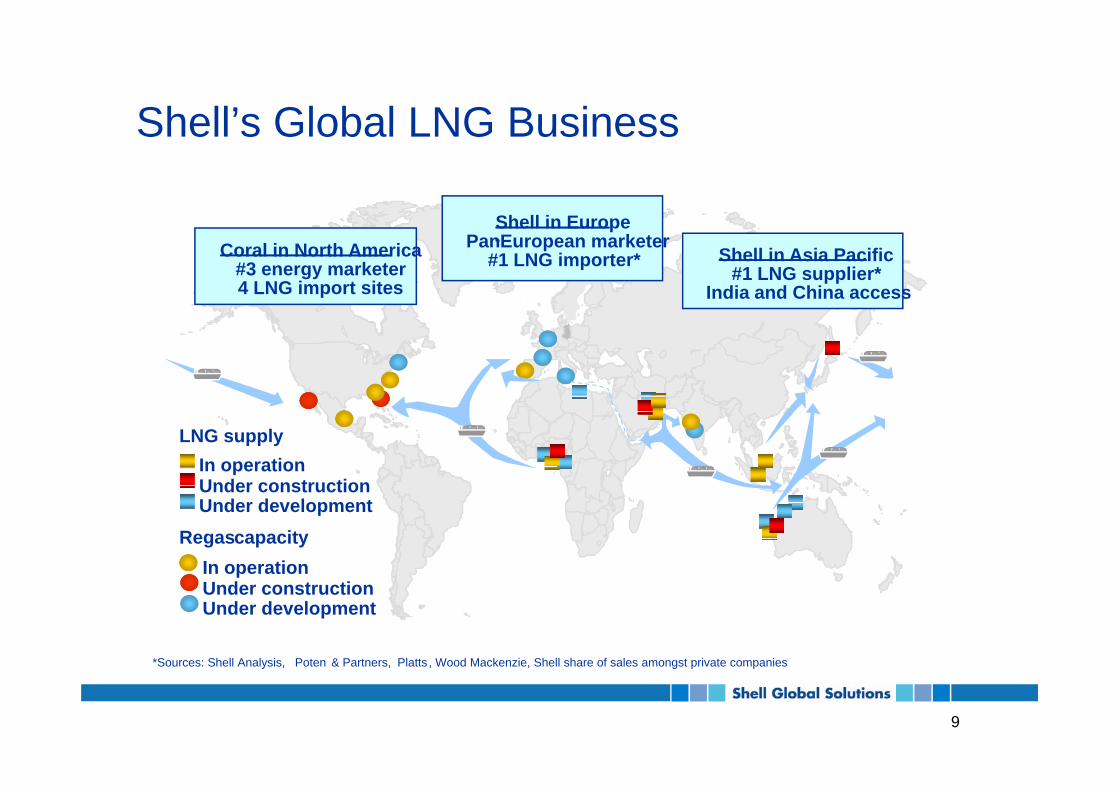
Shell’s Global LNG BusinessShell s Global LNG Business
Sh ll i ECoral in North America
#3 energy marketer4 LNG import sites
Shell in Asia Pacific#1 LNG supplier*
India and China access
Shell in EuropePan-European marketer
#1 LNG importer*
In operationUnder construction
LNG supply
Under constructionUnder development
Regas capacityIn operationpUnder constructionUnder development
*Sources: Shell Analysis Poten & Partners Platts Wood Mackenzie Shell share of sales amongst private companies
9
Sources: Shell Analysis, Poten & Partners, Platts , Wood Mackenzie, Shell share of sales amongst private companies
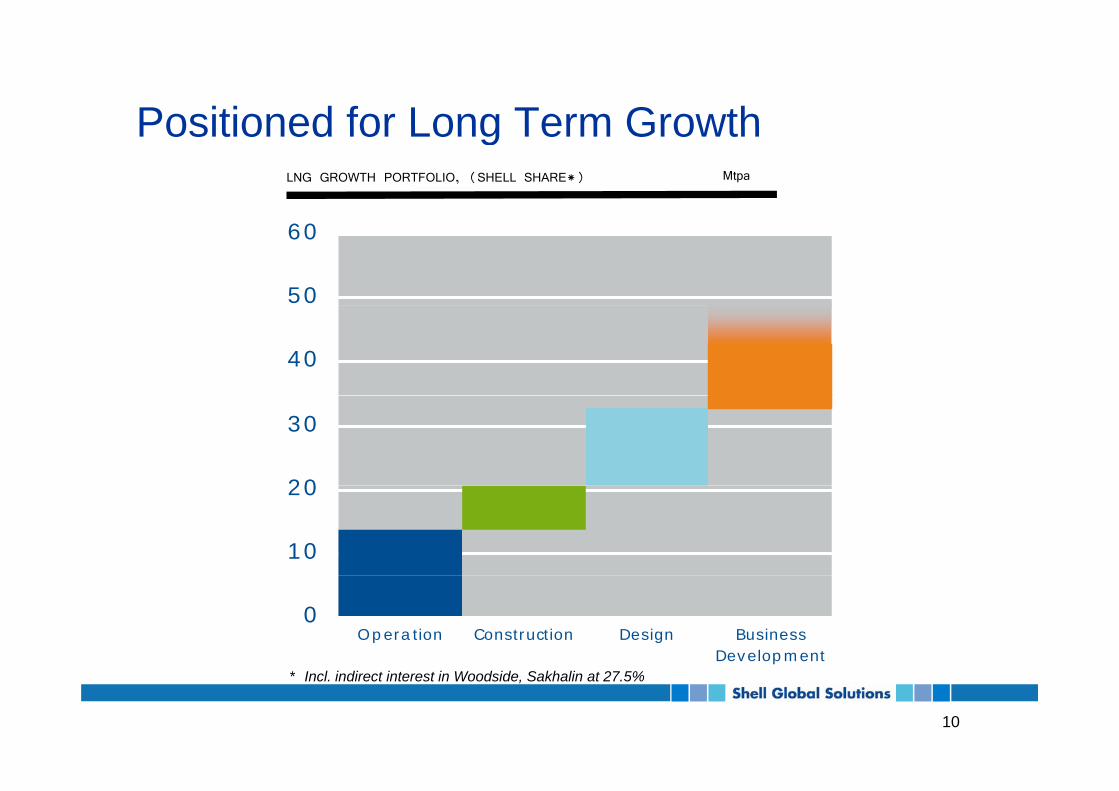
Positioned for Long Term GrowthPositioned for Long Term GrowthLNG GROWTH PORTFOLIO, (SHELL SHARE*) Mtpa
50
60
40
20
30
10
20
0Op era tion Construction Design Business
Develop m ent
10
* Incl. indirect interest in Woodside, Sakhalin at 27.5%
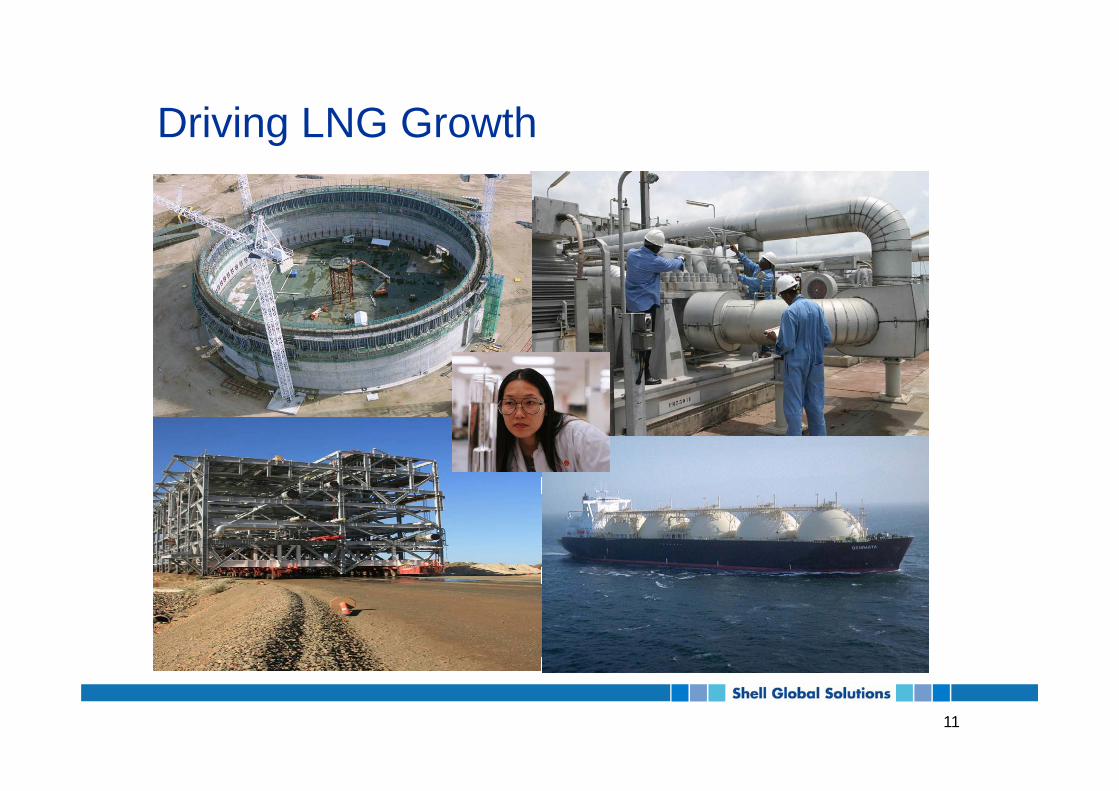
Driving LNG GrowthDriving LNG Growth
11
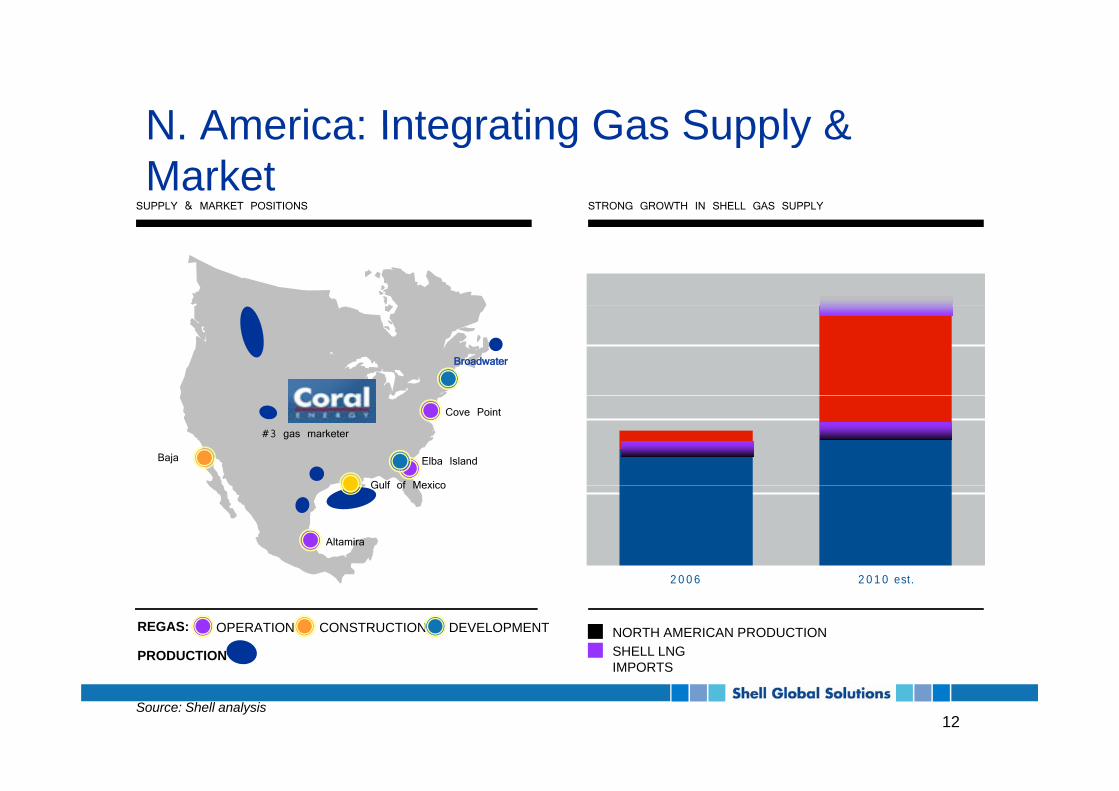
N America: Integrating Gas Supply &N. America: Integrating Gas Supply & Market
STRONG GROWTH IN SHELL GAS SUPPLYSUPPLY & MARKET POSITIONS
Broadwater
Cove Point
Elba Island
Gulf of Mexico
Baja
#3 gas marketer
Gulf of Mexico
Altamira
2 0 0 6 2 0 1 0 t
PRODUCTION
REGAS: OPERATION CONSTRUCTION DEVELOPMENT
2 0 0 6 2 0 1 0 est.
NORTH AMERICAN PRODUCTIONSHELL LNG IMPORTS
12Source: Shell analysis
IMPORTS
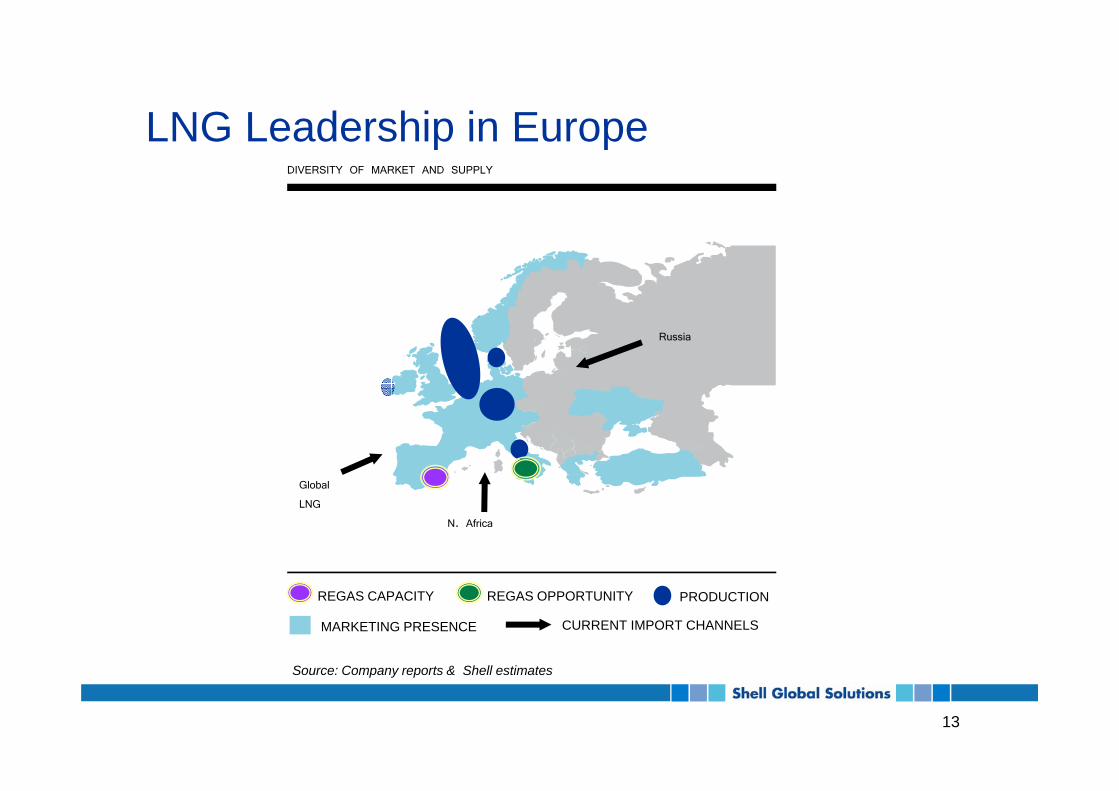
LNG Leadership in EuropeLNG Leadership in EuropeDIVERSITY OF MARKET AND SUPPLY
Russia
Global
N. Africa
Global
LNG
REGAS OPPORTUNITYREGAS CAPACITY PRODUCTION
MARKETING PRESENCE CURRENT IMPORT CHANNELS
13
Source: Company reports & Shell estimates

LNG – Fuelling the FutureLNG – Fuelling the Future
14
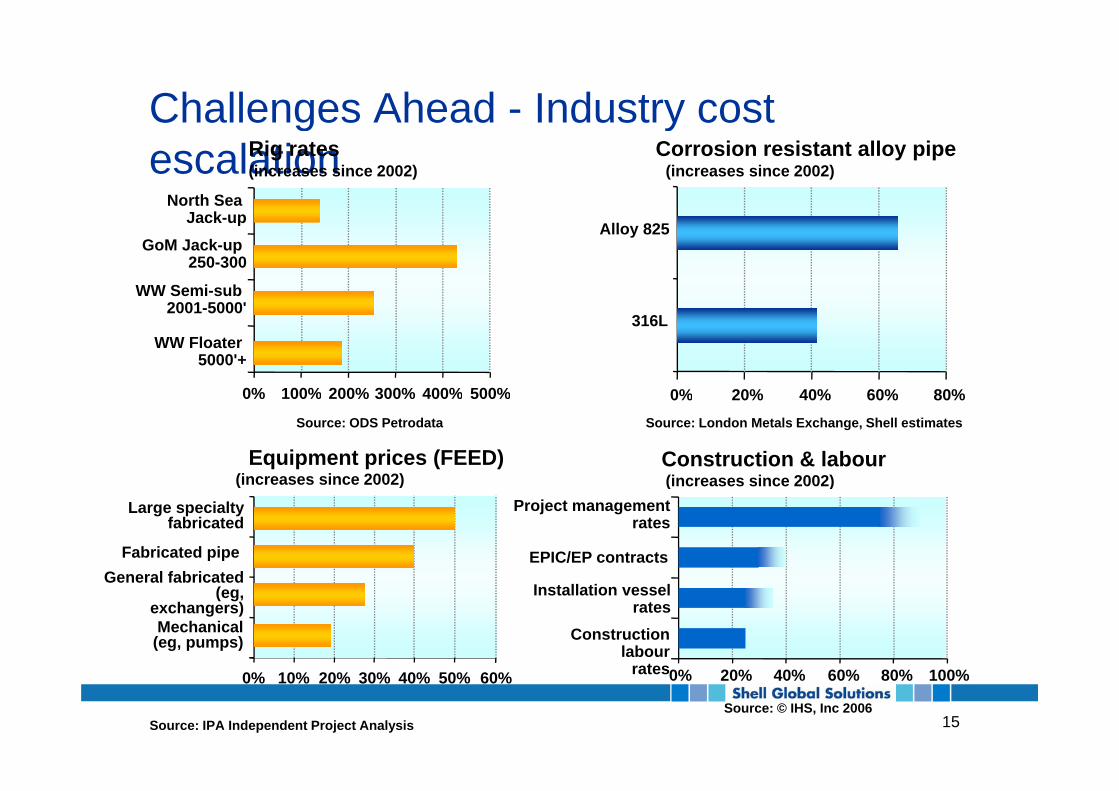
Challenges Ahead - Industry cost g yescalationRig rates
(increases since 2002)Corrosion resistant alloy pipe
(increases since 2002)
North Sea Jack up
Alloy 825
WW Semi-sub 2001 5000'
GoM Jack-up 250-300
Jack-up
0% 20% 40% 60% 80%
316L
0% 100% 200% 300% 400%
WW Floater 5000'+
2001-5000
500%
Source: London Metals Exchange, Shell estimatesSource: ODS Petrodata
Equipment prices (FEED)(increases since 2002)
0% 20% 40% 60% 80%
Construction & labour(increases since 2002)
0% 100% 200% 300% 400% 500%
( ) (increases since 2002)
EPIC/EP contracts
Project management rates
Fabricated pipe
Large specialty fabricated
General fabricated
Construction labour
t
Installation vessel rates
General fabricated (eg,
exchangers)Mechanical
(eg, pumps)
15Source: © IHS, Inc 2006
Source: IPA Independent Project Analysis
0% 20% 40% 60% 80% 100%rates0% 10% 20% 30% 40% 50% 60%
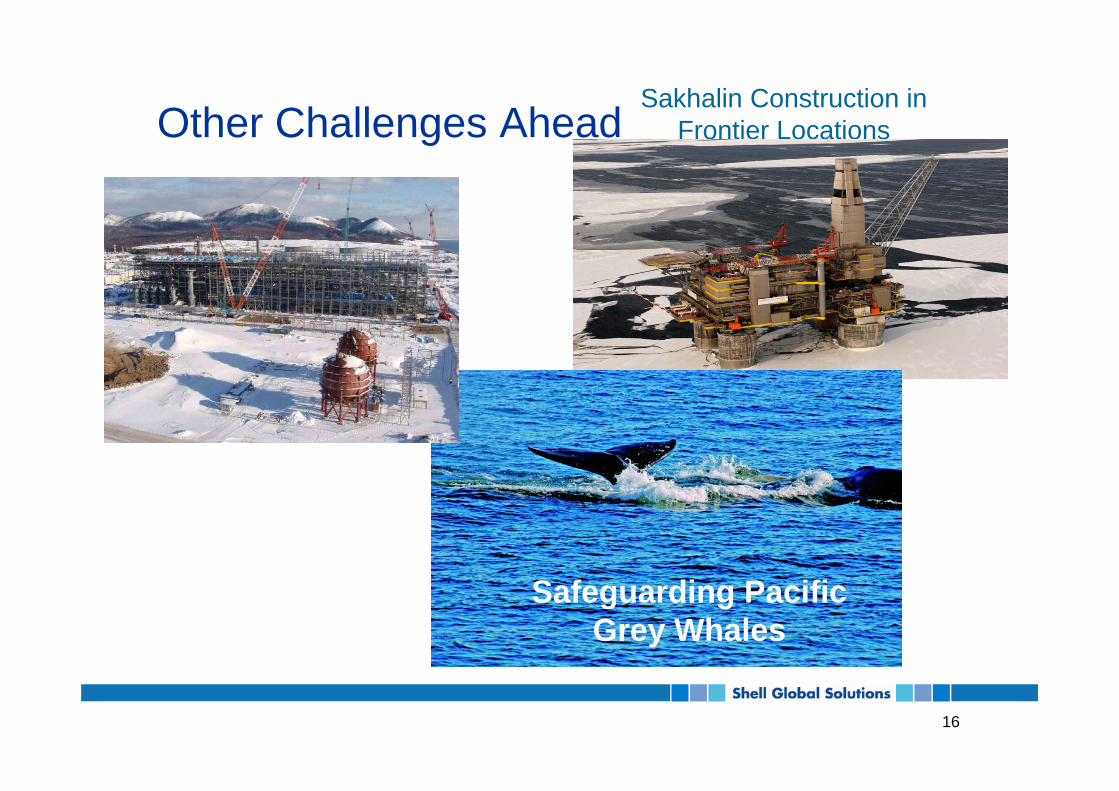
Other Challenges AheadSakhalin Construction in
Frontier LocationsOther Challenges Ahead Frontier Locations
Safeguarding Pacific Grey Whales
16
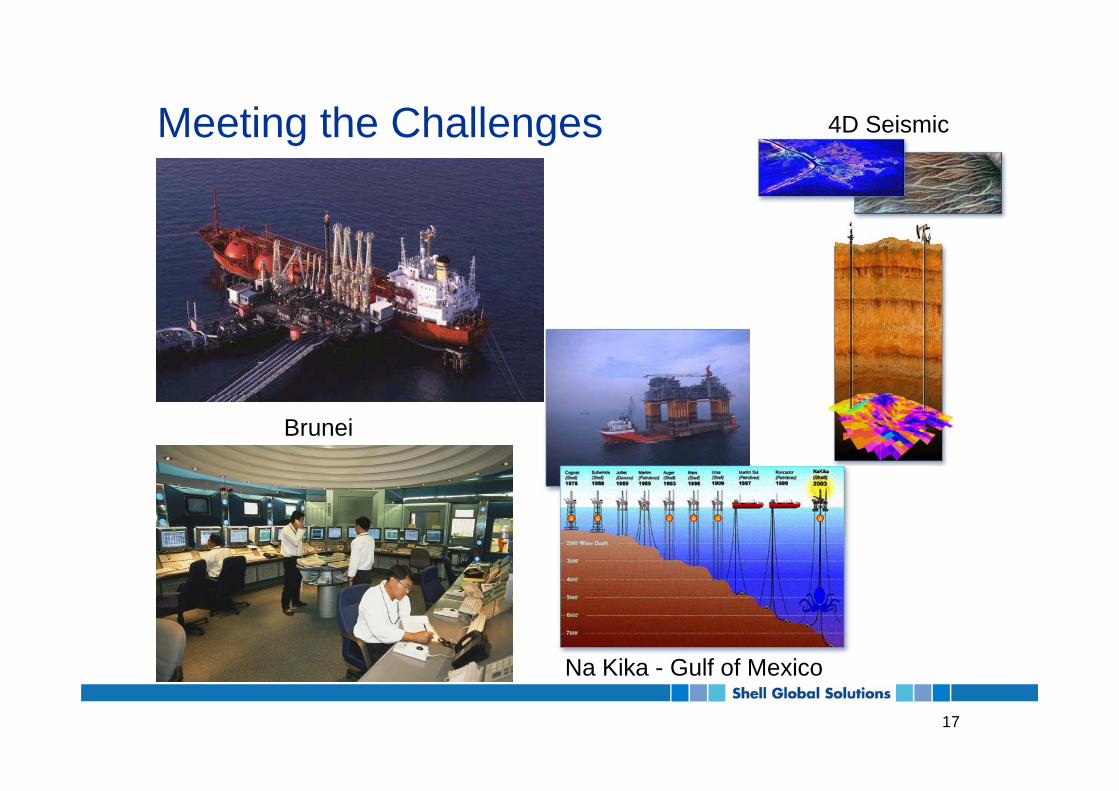
Meeting the Challenges 4D SeismicMeeting the Challenges 4D Seismic
Brunei
Na Kika Gulf of Mexico
17
Na Kika - Gulf of Mexico
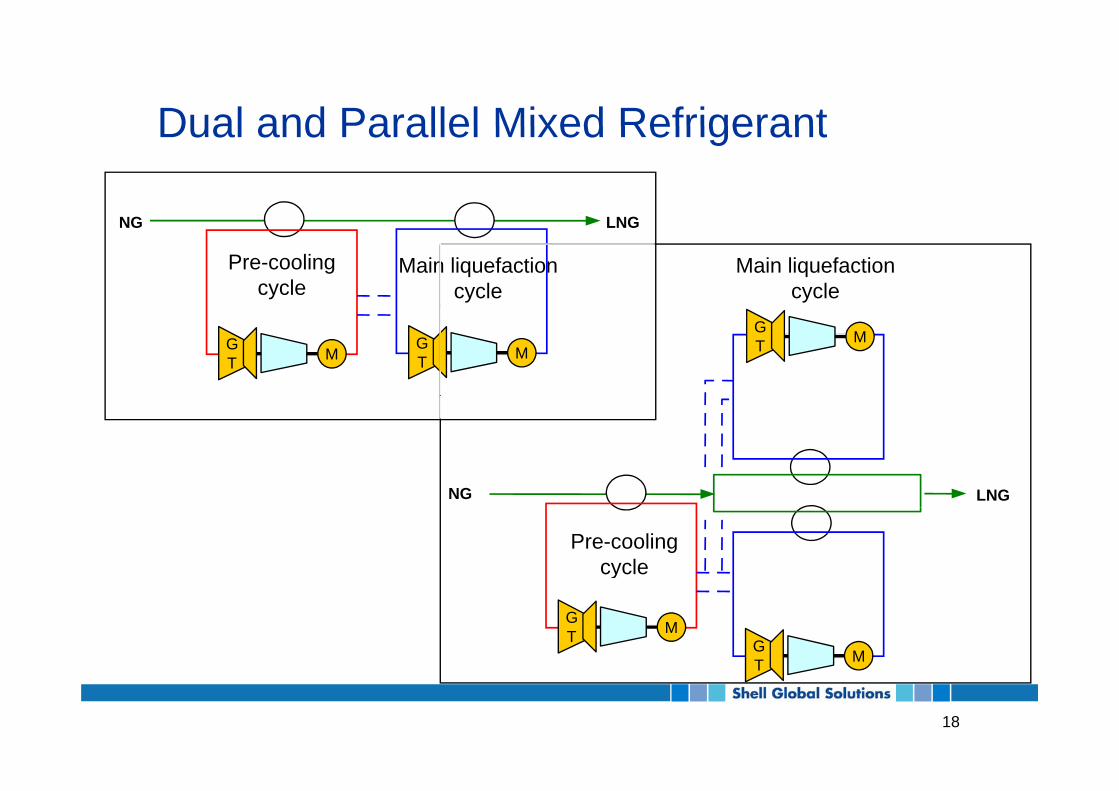
Dual and Parallel Mixed RefrigerantDual and Parallel Mixed Refrigerant
Main liquefaction cycle
Pre-cooling cycle
NG LNG
Main liquefaction cycle
GT M
GT M
GT M
NG LNG
Pre-cooling cycle
GT M
GT M
y
18
T
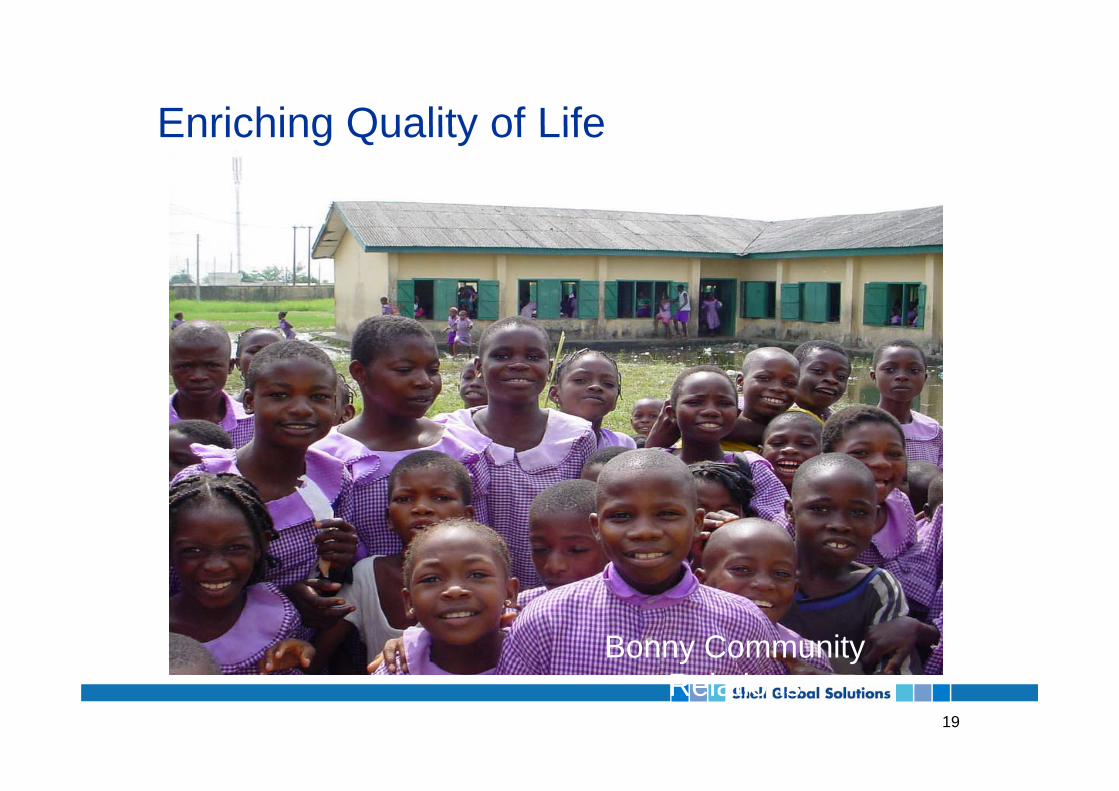
Enriching Quality of LifeEnriching Quality of Life
Bonny Community
19
Relations
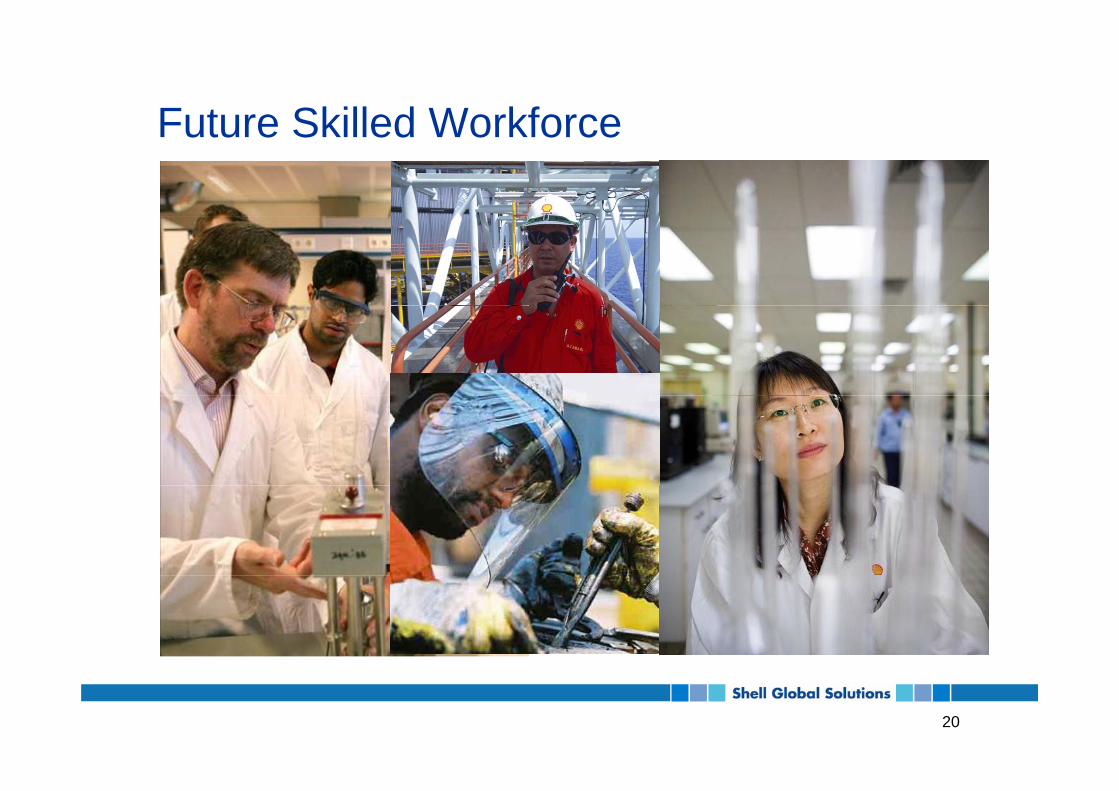
Future Skilled WorkforceFuture Skilled Workforce
20
21