living in the intertidal: desiccation and shading reduce … · coast of france (ouisse, migne´...
TRANSCRIPT

Living in the intertidal: desiccation andshading reduce seagrass growth, but highsalinity or population of origin have noadditional effect
Wouter Suykerbuyk1,2, Laura L. Govers2,3,4, W.G. van Oven1,Kris Giesen1,2, Wim B.J.T. Giesen5, Dick J. de Jong6, Tjeerd J. Bouma1
and Marieke M. van Katwijk1,2
1Department of Estuarine and Delta Systems, and Utrecht University, Royal Netherlands Institute
for Sea Research (NIOZ), Yerseke, Netherlands2 Department of Environmental Science, Institute for Water and Wetland Research, Radboud
University Nijmegen, Nijmegen, Netherlands3 Institute for Evolutionary Life Sciences (GELIFES), Conservation Ecology Group, University of
Groningen, Groningen, Netherlands4 Department of Aquatic Ecology and Environmental Biology, Institute for Water and Wetland
Research, Radboud University Nijmegen, Nijmegen, Netherlands5 Euroconsult Mott MacDonald, Arnhem, Netherlands6 Zee en Delta Department, Ministry of Infrastructure and Environment, Rijkswaterstaat,
Middelburg, Netherlands
ABSTRACTThe limiting effects of stressors like desiccation, light and salinity on seagrass growth
and distribution are well-studied. However, little is known about their interactive
effects, and whether such effects might differ among populations that are adapted to
different local conditions. In two laboratory experiments we tested (a) if growth and
development of intertidal, temperate Zostera noltii is affected by emergence time
(experiment 1 and 2), and (b) how this is affected by an additional, second stressor,
namely shading (experiment 1) or high salinity (25, 30 and 35, experiment 2). In
addition, we tested (c) whether the effects of emergence time and salinity varied
between three different European seagrass populations (Saint-Jacut/France,
Oosterschelde/The Netherlands, and Sylt/Germany), which are likely adapted to
different salinity levels (experiment 2). In both experiments, emergence of 8 h per
tidal cycle (of 12 h) had a negative effect on seagrass relative growth rate (RGR),
and aboveground biomass. Emergence furthermore reduced either rhizome length
(experiment 1) or belowground biomass (experiment 2). Shading (experiment 1)
resulted in lower RGR and a two-fold higher aboveground/belowground ratio.
We found no interactive effects of emergence and shading stress. Salinity
(experiment 2) did not affect seagrass growth or morphology of any of the three
populations. The three tested populations differed greatly in morphology but
showed no differential response to emergence or salinity level (experiment 2).
Our results indicate that emergence time and shading show an additive negative
effect (no synergistic or antagonistic effect), making the plants still vulnerable to
such combination, a combination that may occur as a consequence of self-shading
during emergence or resulting from algal cover. Emergence time likely determines
the upper limit of Z. noltii and such shading will likely lower the upper limit.
How to cite this article Suykerbuyk et al. (2018), Living in the intertidal: desiccation and shading reduce seagrass growth, but high salinity
or population of origin have no additional effect. PeerJ 6:e5234; DOI 10.7717/peerj.5234
Submitted 9 February 2018Accepted 22 June 2018Published 20 July 2018
Corresponding authorMarieke M. van Katwijk,
Academic editorKevin Mueller
Additional Information andDeclarations can be found onpage 16
DOI 10.7717/peerj.5234
Copyright2018 Suykerbuyk et al.
Distributed underCreative Commons CC-BY 4.0

Shading resulted in higher aboveground/belowground ratios as is a general response
in seagrass. Z. noltii of different populations originating from salinity 30 and 35 seem
tolerant to variations in salinity within the tested range. Our results indicate
that the three tested populations show morphotypic rather than ecotypic variation,
at least regarding the salinity and emergence, as there were no interactive effects with
origin. For restoration, this implies that the salinity regime of the donor and
receptor site of Z. noltii is of no concern within the salinity range 25–35.
Subjects Ecology, Ecosystem Science, Marine Biology
Keywords Stress, Desiccation, Light, Salinity, Zostera noltii, Intertidal seagrass, Population of
origin, Morphotypic variation, Ecotypic variation, Donor
INTRODUCTIONDesiccation due to air exposure imposes a stress to marine life in the intertidal zone.
Whereas mobile species can escape to moist places during low tide, sessile intertidal
organisms need to cope with hours of air exposure. In the seagrass species Zostera noltii,
short periods of air exposure are utilized to its advantage to assimilate CO2, as long as
the leaves remain moist (Leuschner, Landwehr &Mehlig, 1998). However, adverse effects of
emergence rapidly increase with duration to air. Emergence periods of only 5 h air
exposure per tide may result in a 50% water loss in the leaves, concomitant with 50%
reduction in photosynthetic rates (Leuschner, Landwehr & Mehlig, 1998). Besides the
physiological effects of drought stress, desiccation of the leaves after low tide exposure
decreases the mechanical strength and subsequently the probability of leaf sloughing
(Vermaat et al., 1993). In addition, this may result in shorter leaf lengths as desiccated
leaf points are prone to break, resulting in a decreased capacity of photosynthesis
(Boese et al., 2003), and reduced water retention by the leaves (Fox, 1996), which is density
dependent (De Fouw et al., 2016).
Desiccation is usually the limiting factor controlling the upper limit of seagrass growth
on the intertidal flat (Philippart & Dijkema, 1995; Leuschner, Landwehr & Mehlig, 1998;
Van Katwijk & Hermus, 2000; Van der Heide et al., 2010). However, risk of desiccation
varies over tides, days, seasons and latitude (Perez-Llorens & Niell, 1993), and actual
emergence stress will depend on the temperature, wind conditions, sediment water
content and seagrass density. For example, although intertidal Z. noltii in the sub-tropical
Mauretania has to cope with an air temperature of 40 �C during 6 h of emergence per tide,
meadows still have high (>75% coverage) shoot density due to the facilitating effects
of such high densities on water retention of meadows (De Fouw et al., 2016). On the other
hand, the productivity during emersion is lower than during submergence in these
beds (Clavier et al., 2011), which was also found in more temperate beds at the Atlantic
coast of France (Ouisse, Migne & Davoult, 2011). In both cases, this was largely attributed
to self-shading by the leaves laying flat, covering each other in the dense beds. It may seem
counterintuitive that light could be limiting in an intertidal bed, but in addition to
self-shading, very turbid water may also limit productivity during the high tide hours,
and cover by epiphytes and green macroalgae can be severe in intertidal beds, particularly
Suykerbuyk et al. (2018), PeerJ, DOI 10.7717/peerj.5234 2/21

since seagrasses facilitate the presence of these algae by providing substrate and shelter
(Michael et al., 2008).
In temperate regions, light availability varies over the year and controls the start and
end of rhizome branching during the growing season (Vermaat & Verhagen, 1996;
Govers et al., 2015). Photo-inhibition is not likely, as Z. noltii is very tolerant to high light
levels (Jimenez, Niell & Algarra, 1987) and also in combination with emergence
(Clavier et al., 2011; Ouisse, Migne & Davoult, 2011). To compensate for light limitation,
shading typically results in an increased aboveground/belowground biomass ratio with
longer shoots compared to plants grown in ambient light conditions (Abal et al., 1994;
Philippart, 1995; Vermaat, Verhagen & Lindenburg, 2000; Peralta et al., 2002). However,
longer shoots may make intertidal seagrass plants more vulnerable to desiccation when
growing at low density.
In general, several stressors may cause a conditional outcome of emergence stress.
For example, in addition to light limitation due to self-shading or algal cover mentioned
above, a stress like a high salinity may influence the tolerance to desiccation. Salinity stress
could be one of the most ubiquitous stressors that marine life and thus also seagrasses
encounter. Marine macrophytes can counteract osmotic stress on the short-term by
internal adjustments of turgor-pressure by up- and down-regulation of simple ions
and on the long-term by synthesis or breakdown of osmotically active compounds
(Touchette, 2007). Both physiological mechanisms require energy and could therefore
reduce plant fitness. A salinity range as wide as 10–35 does not cause increased
mortality in seagrass Zostera marina (Kamermans, Hemminga & de Jong, 1999;
Van Katwijk et al., 1999; Nejrup, Brammer & Pedersen, 2008), whereas salinities of five
and lower increase mortality (Nejrup, Brammer & Pedersen, 2008). With increasing
temperature, salinity stress effects become even more pronounced (Salo & Pedersen, 2014).
Within the non-mortal salinity conditions, a salinity range of 22–23 was found to be the
optimal ex situ for temperate eelgrass Z. marina. At this salinity, maximum production
of shoots and leaves was found whereas growth and vitality were reduced at higher
salinities (>26) (Kamermans, Hemminga & de Jong, 1999; Van Katwijk et al., 1999). Plants
of Z. marina populations grown under high salinity seem to better cope with high salinity
than plants originating from an estuarine or other low salinity habitat (Van Katwijk et al.,
1998, 1999), and reversely, low-salinity grown plants tolerate lower salinities than high
salinity grown plants (Salo, Pedersen & Bostrom, 2014). Also, in Posidonia oceanica,
distinct differences in response to salinity between plants from different origins are found
(Fernandez-Torquemada & Sanchez-Lizaso, 2005). In Z. noltii, different origins were tested
on high salinity tolerance, comparing 15 and 35 (Vermaat, Verhagen & Lindenburg, 2000).
Responses to salinity stress are similar to those of Z. marina: increased mortality was
found at extreme salinities (Vermaat, Verhagen & Lindenburg, 2000; Charpentier et al.,
2005). To our knowledge, the more subtle salinity preferences of Z. marina plants of
different origins described above were never tested for Z. noltii. The outcome of such
tests can be important for restoration projects with different donors originating from
different salinities. Since critical mass is very important for seagrass restoration success
Suykerbuyk et al. (2018), PeerJ, DOI 10.7717/peerj.5234 3/21
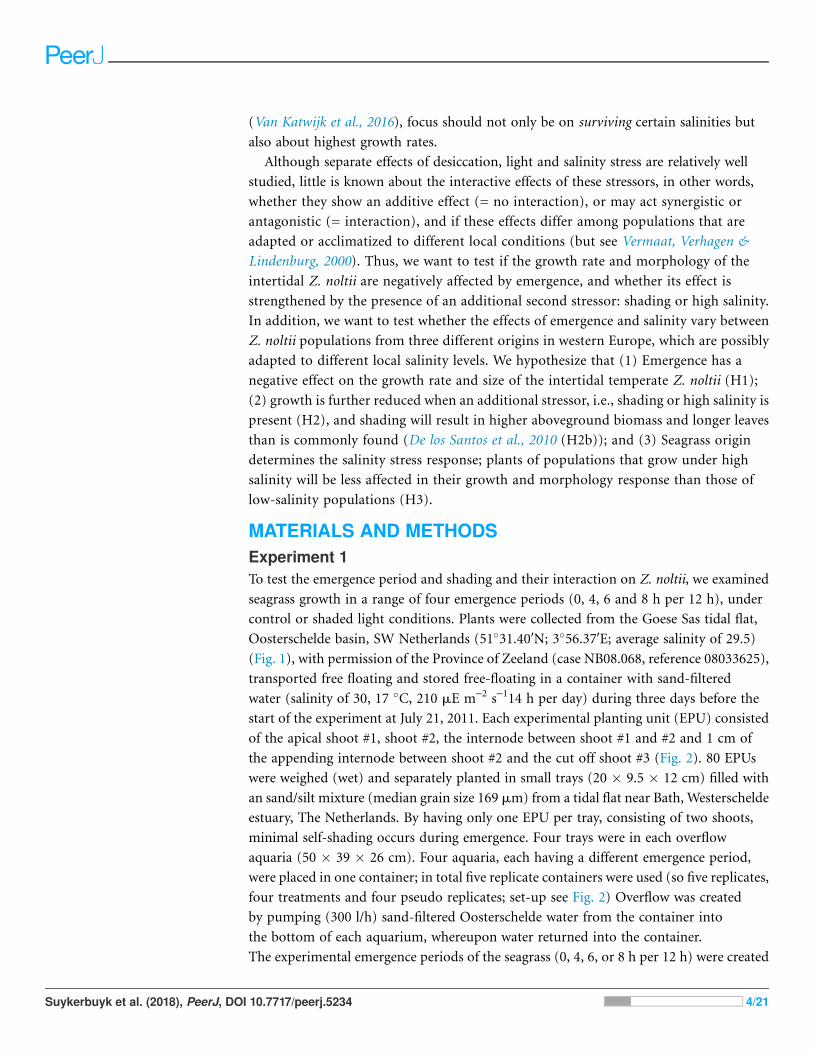
(Van Katwijk et al., 2016), focus should not only be on surviving certain salinities but
also about highest growth rates.
Although separate effects of desiccation, light and salinity stress are relatively well
studied, little is known about the interactive effects of these stressors, in other words,
whether they show an additive effect (= no interaction), or may act synergistic or
antagonistic (= interaction), and if these effects differ among populations that are
adapted or acclimatized to different local conditions (but see Vermaat, Verhagen &
Lindenburg, 2000). Thus, we want to test if the growth rate and morphology of the
intertidal Z. noltii are negatively affected by emergence, and whether its effect is
strengthened by the presence of an additional second stressor: shading or high salinity.
In addition, we want to test whether the effects of emergence and salinity vary between
Z. noltii populations from three different origins in western Europe, which are possibly
adapted to different local salinity levels. We hypothesize that (1) Emergence has a
negative effect on the growth rate and size of the intertidal temperate Z. noltii (H1);
(2) growth is further reduced when an additional stressor, i.e., shading or high salinity is
present (H2), and shading will result in higher aboveground biomass and longer leaves
than is commonly found (De los Santos et al., 2010 (H2b)); and (3) Seagrass origin
determines the salinity stress response; plants of populations that grow under high
salinity will be less affected in their growth and morphology response than those of
low-salinity populations (H3).
MATERIALS AND METHODSExperiment 1To test the emergence period and shading and their interaction on Z. noltii, we examined
seagrass growth in a range of four emergence periods (0, 4, 6 and 8 h per 12 h), under
control or shaded light conditions. Plants were collected from the Goese Sas tidal flat,
Oosterschelde basin, SW Netherlands (51�31.40′N; 3�56.37′E; average salinity of 29.5)(Fig. 1), with permission of the Province of Zeeland (case NB08.068, reference 08033625),
transported free floating and stored free-floating in a container with sand-filtered
water (salinity of 30, 17 �C, 210 mE m-2 s-114 h per day) during three days before the
start of the experiment at July 21, 2011. Each experimental planting unit (EPU) consisted
of the apical shoot #1, shoot #2, the internode between shoot #1 and #2 and 1 cm of
the appending internode between shoot #2 and the cut off shoot #3 (Fig. 2). 80 EPUs
were weighed (wet) and separately planted in small trays (20 � 9.5 � 12 cm) filled with
an sand/silt mixture (median grain size 169 mm) from a tidal flat near Bath, Westerschelde
estuary, The Netherlands. By having only one EPU per tray, consisting of two shoots,
minimal self-shading occurs during emergence. Four trays were in each overflow
aquaria (50 � 39 � 26 cm). Four aquaria, each having a different emergence period,
were placed in one container; in total five replicate containers were used (so five replicates,
four treatments and four pseudo replicates; set-up see Fig. 2) Overflow was created
by pumping (300 l/h) sand-filtered Oosterschelde water from the container into
the bottom of each aquarium, whereupon water returned into the container.
The experimental emergence periods of the seagrass (0, 4, 6, or 8 h per 12 h) were created
Suykerbuyk et al. (2018), PeerJ, DOI 10.7717/peerj.5234 4/21

by automatically switching off the circulation pump, after which the aquaria drained.
Emergence periods were chosen for their ecological relevance to seagrass along the
natural desiccation gradient (ranging from no desiccation to extreme desiccation):
0 h: subtidal zone (Z. noltii grows in this zone in Basque country and Portugal; Valle et al.,
2011 and Cunha, Assis & Serrao, 2013, respectively), 4 h: lower intertidal seagrass zone in
the Oosterschelde; 6 h: average Z. noltii emergence period in the Oosterschelde, 8 h:
the upper extreme of Z. noltii distribution in the Oosterschelde. Light (217 ± 31mEm-2 s-1)
was produced by beams of LED-lights emitting a photo spectrum with peaks at
450 (blue) and 670 (red) nm, a spectrum optimized to emit the absorption spectrum
for plant photosynthesis. To create low light conditions (51 ± 10 mE m-2 s-1),
black neutral density filters (which reduce the intensity of all wavelengths of light equally,
attenuation coefficient of 0.76 screen-1) were placed over half of each aquarium.
The photoperiod was set at 14 h of light per day, with one emergence period during
the light period and one emergence period was during the dark period. The temperature
of the climate controlled room was set at 17 �C. These abiotic settings resemble
natural conditions at the beginning of the experiment. Epiphytes (if any) were gently
removed weekly. Every week, the entire volume of water of each of the five water
containers was refreshed to maintain constant water quality (i.e., salinity, nutrients, etc.)
France
Germany
United Kingdom
50°N
55°N
Saint Jacut (J)
Oosterschelde (O)
Sylt (S)
Figure 1 Origin of the Zostera noltii plants used in the experiments (experiment 1: only Oosterschelde,
experiment 2: all three populations). Full-size DOI: 10.7717/peerj.5234/fig-1
Suykerbuyk et al. (2018), PeerJ, DOI 10.7717/peerj.5234 5/21

among the four replicates within the containers. At the end of the experiment
(t = 92 days), EPUs were harvested after which their growth response to the treatments
was determined by measuring their weight (aboveground and belowground parts
separately) and morphology. Relative growth rate (RGR) was based on EPUs wet weight
(WW, in grams) and was calculated as: RGR = (ln WWend – ln WWstart)/(�t), �t is the
running time of the experiment in days.
0 h 8 h
8 h 0 h
salinity 25
salinity 25salinity 30
salinity 30
salinity 35
salinity 35J
S OJ
S
O
JS
O
1 cm
0 h 4 h
6 h 8 h
1 cm
A. B.
containeraquarium
tray containingone EPU EPU
EPU
Figure 2 Experimental set-up of experiment 1 and 2. (A) Set-up of experiment 1 testing emergence (0, 4, 6 and 8 h per 12 h) and shading (0 and
75% shading of 217 ± 31 mE m-2s-1, shown as grey shading) in a nested design with five true replicates and four pseudoreplicates. (B) Set-up of
experiment two testing three populations of origin (S = Sylt, O = Oosterschelde, J = St Jacut) nested in two replicated emergence regimes (0 and 8 h
emergence per 12 h), nested in three salinities (25, 30 and 35). An experimental plant unit (EPU) consists of two Zostera noltii shoots (of which one
is the apical shoot), plus 1 cm of the adjacent rhizome internode (drawing courtesy of Vanessa Gonzalez-Ortiz).
Full-size DOI: 10.7717/peerj.5234/fig-2
Suykerbuyk et al. (2018), PeerJ, DOI 10.7717/peerj.5234 6/21

Experiment 2To test the effect of emergence, population of origin and salinity and their interaction on
Z. noltii, we examined seagrass growth of plants originating from three temperate seagrass
populations, at two emergence periods, in three natural range salinities. Plants were
collected from three locations in Western Europe: Saint-Jacut, (Brittany, France),
48�36′14. 79′′N, 2�11′41. 49′′W, average salinity of 34.7, Oosterschelde (Southwest
Netherlands), 51�53′20.58′′N, 3�93′88.35′′E, average salinity of 29.5 and Sylt (Wadden Sea,
Germany), 54�47′50.77′′N, 8�17′43.87′′E, average salinity of 29.9 (Fig. 1). At all three
locations, water is relatively clear, namely Saint Jacut:, 1.5–2 m secchi depth (2–4 Formazin
Nephelometric Units; Ifremer, 2014), Oosterschelde: 1.50 m secchi depth (Data Ministry
of Infrastructure and Water Management 2002–2009) and Sylt: 1–3.5 m secchi depth
(0.5–1.9 m-1 light attenuation coefficient at an average tidal range of 1.7 m;
Van Katwijk et al. (1998) and frequent personal observation second and last author in later
years). Plants from Sylt and Saint Jacut were transported to the laboratory within 24 h,
stored in wet tissues, kept at 6 �C temp. Plants from Oosterschelde were transported free
floating within 3 h. Upon arrival, they were replanted in the laboratory to acclimatize
during two months in the same sediments as in experiment 1, in sand-filtered
Oosterschelde water (salinity of 31–32, 17 �C, 210 mE m-2 s-1 14 h per day) until the
start of the experiment on September 30, 2011, (which is at the end of the growing
season in the field, but previous studies had shown vigourous growth of this perennial
plant during autumn in the laboratory, Han et al., 2012). Except for the applied
treatments, the experimental set-up resembled that of the first experiment, i.e., same
EPUs characteristics, planting trays, overflow aquaria, emergence methods, plant care,
artificial lighting, light/dark cycle and climate controlled temperature were used. In this
experiment, two containers per salinity treatment were used; in each container, four
aquaria were placed with either 0 or 8 h emergence per 12 h, and within each aquarium
three pseudoreplicates for each population of origin (Fig. 2). EPUs of each population
were weighted wet. To test the response of seagrass to different salinities, overflow
aquaria were filled with seawater with a salinity of 25, 30 or 35. Seawater with a salinity of
25 was obtained by mixing demineralized water to the ambient (salinity of 30) seawater,
whereas a salinity of 35 was obtained by adding artificial seasalt (Instant Ocean Sea Salt;
Instant Ocean, Blacksburg, VA, USA). pH was assumed not to be influenced by the
dilution with demineralized water (as was found in a salinity experiment described in
Van Katwijk et al., 1999; pH data of this experiment are presented in Table S1). To
maintain stable salinity levels, salinity was checked at least twice a week and if needed
adjusted by adding demineralized water to compensate for evaporation. The water of each
container was refreshed after five weeks. Nutrient levels of the water were measured
after 28 and 61 days and showed no correlation with salinity treatments (Table S2).
EPUs were evenly divided over all treatments (n = 2 true replicates � 3 pseudo replicates
� 2 emergence replicates = 12 per treatment). At the end of the experiment (t = 75 days),
EPUs were harvested and measured for weight (aboveground and belowground parts
separately) and morphology to determine their growth response. RGR was based on
Suykerbuyk et al. (2018), PeerJ, DOI 10.7717/peerj.5234 7/21

EPUs wet weight (WW, in grams) and was calculated as: RGR = (ln WWend –
ln WWstart)/(�t), �t is the running time of the experiment in days.
Statistical analysisThe results of experiment 1 were analyzed by linear mixed models with light and
emergence time as fixed factors. As aquaria were nested within containers (Fig. 2) and
EPUs within one aquarium consisted of pseudoreplicates, we included aquarium nested
in container (container/aquarium) as a random factor in our models. Rhizome length,
shoot length, aboveground biomass, belowground biomass, total biomass, RGR and
aboveground/belowground biomass ratio were analyzed by general linear mixed models
(Pinheiro et al., 2018) and shoot numbers by a generalized linear mixed model with a
Poisson distribution (Bates et al., 2018).
The results of experiment 2 were also analyzed by mixed models with emergence,
salinity and origin as fixed factors. Similar to the set-up of experiment 1, aquaria were
nested in containers (Fig. 2) and we thus included container/aquarium nested as a
random factor in our models. Longest shoot length, rhizome length, aboveground
biomass, belowground biomass, total biomass, RGR, and aboveground/belowground
biomass ratio were analyzed general linear mixed models (Pinheiro et al., 2018)
and shoot numbers by a generalized linear mixed model with a poisson distribution
(Bates et al., 2018).
Normal distribution of all data was tested on model residuals by means of a Shapiro test
and by looking at the histogram, and data were log- or square root-transformed to
meet model assumptions if necessary.
RESULTSDesiccation stress (emergence) significantly reduced aboveground biomass (Fig. 3A,
P = 0.010) and RGR (Fig. 3F, P = 0.045) (Table 1); aboveground biomass was reduced
by 27% and RGR by 32% in the 8 h emergence time treatment compared to the
completely submerged treatment (0 h emergence time). In line with this, emergence
also significantly reduced rhizome length (Fig. 3G, P = 0.049) in the 6 and 8 h
emergence treatment by 26–28%. Next to desiccation stress, Shading (light reduction)
also significantly reduced the RGR (Fig 3F, P = 0.039) by 18%. In addition, shading
significantly reduced belowground biomass by 33% (Fig. 3B, P < 0.001) and total biomass
by 23% (P = 0.010), thereby strongly increasing the aboveground/belowground
biomass ratio (Fig. 3D, P < 0.001). Plant morphology also changed significantly under
light limitation stress; leaves grew 21% longer when shaded (Fig. 3H, P = 0.011).
Although we found clear effects of desiccation and shading stress on growth
(RGR, biomass) and morphology (leaf length and rhizome length), we did not observe
any interactive effects of desiccation and light limitation stress.
The second experiment included exposing Z. noltii from three different locations in
Western Europe (France, the Netherlands and Germany) to desiccation stress (0 vs. 8 h
emergence) and three different salinities (25, 30, 35 ppt). Similar to the first
experiment, we found that desiccation stress (8 h emergence) reduced RGR
Suykerbuyk et al. (2018), PeerJ, DOI 10.7717/peerj.5234 8/21

Figure 3 Zostera noltii development after 60 days in relation to emergence time (x-axis) under light
(grey bars) and shaded (black bars) conditions. (A) Aboveground biomass, (B) belowground biomass,
(C) Total biomass, (D) aboveground/belowground (AG/BG) biomass ratio, (E) shoot numbers
(# shoots), (F) relative growth rate (RGR) of wet weight (WW), (G) rhizome length and (H) longest
shoot length. Statistical results are displayed in the upper right corner of each panel, 0.01 < P < 0.05 = �,P < 0.001 = ���. Detailed statistical results are displayed in Table 1. Error bars represent standard
errors (SEM). Full-size DOI: 10.7717/peerj.5234/fig-3
Suykerbuyk et al. (2018), PeerJ, DOI 10.7717/peerj.5234 9/21

(Fig. 4F, P < 0.001) and aboveground biomass (Fig. 4A, P = 0.003) by 25% and 19%
respectively (Table 2). In addition, belowground biomass (Fig. 4B, P < 0.001) and total
biomass (P = 0.001) were also reduced by desiccation stress by 32% and 29% (Table 2).
Location of origin affected morphology and biomass of the plants; rhizomes (Fig. 4G,
P < 0.001) and leaves (Fig. 4H, P < 0.001) were smaller and aboveground (Fig. 4A, P < 0.001),
belowground (Fig. 4B, P < 0.001) and total biomass (Fig 4C, P < 0.001) lower in a gradient
from France (Saint Jacut) to Germany (Sylt) (Table 2). Leaves and rhizomes from the
French Z. noltii were 22% longer than the German plants and above- and belowground
biomass was approximately 2.4 times larger as compared to Sylt plants at the end of the
experiment (pooled results, Fig. 4). As RGR did not differ between the origins of the
populations (e.g., RGR of Saint Jacut was 1.06 times the RGR of Sylt), the size differences
at the end of the experiment reflect the differences at the beginning of the experiment.
Similar plant size differences between these populations are observed in other years or
Table 1 Effects of light and emergence on Zostera noltii.
Factor Test Transformation Treatment F value DF P
DWAG lme log Light 3.531 1 0.060 n.s.
Emergence 11.290 1 0.010 *
Light � emergence 3.965 1 0.265 n.s.
DW BG lme log Light 14.728 1 <0.001 ***
emergence 3.022 1 0.388 n.s.
light � emergence 3.597 1 0.308 n.s.
DW total lme log Light 6.569 1 0.010 *
Emergence 3.667 1 0.300 n.s.
Light � emergence 3.498 1 0.321 n.s.
AG/BG ratio lme sqrt Light 52.640 1 <0.001 ***
Emergence 1.560 1 0.669 n.s.
Light � emergence 2.404 1 0.493 n.s.
# shoots glmer – Light 2.185 1 0.139 n.s.
Emergence 3.165 1 0.367 n.s.
Light � emergence 2.545 1 0.467 n.s.
RGR WW lme None Light 4.240 1 0.039 *
Emergence 8.042 1 0.045 *
Light � emergence 0.955 1 0.812 n.s.
Rhizome length lme None Light 0.480 1 0.489 n.s.
Emergence 7.865 1 0.049 *
Light � emergence 2.169 1 0.538 n.s.
Longest shoot lme log Light 6.421 1 0.011 *
Emergence 1.388 1 0.708 n.s.
Light � emergence 0.364 1 0.947 n.s.
Notes:Statistical results of Experiment 1. Non-significant test results are marked with “ns,” whereas significant test results arebold and marked with stars: 0.01 < P < 0.05 =*, P < 0.001 =***.lme, general linear mixed model; glmer, generalized linear mixed model with a Poisson distribution; DF, degrees offreedom; P, P-value; DW, dry weight; WW, wet weight; AG, above ground biomass; BG, below ground biomass; RGRWW, Relative growth rate; #, number; SQRT, square root; log, logarithm.
Suykerbuyk et al. (2018), PeerJ, DOI 10.7717/peerj.5234 10/21
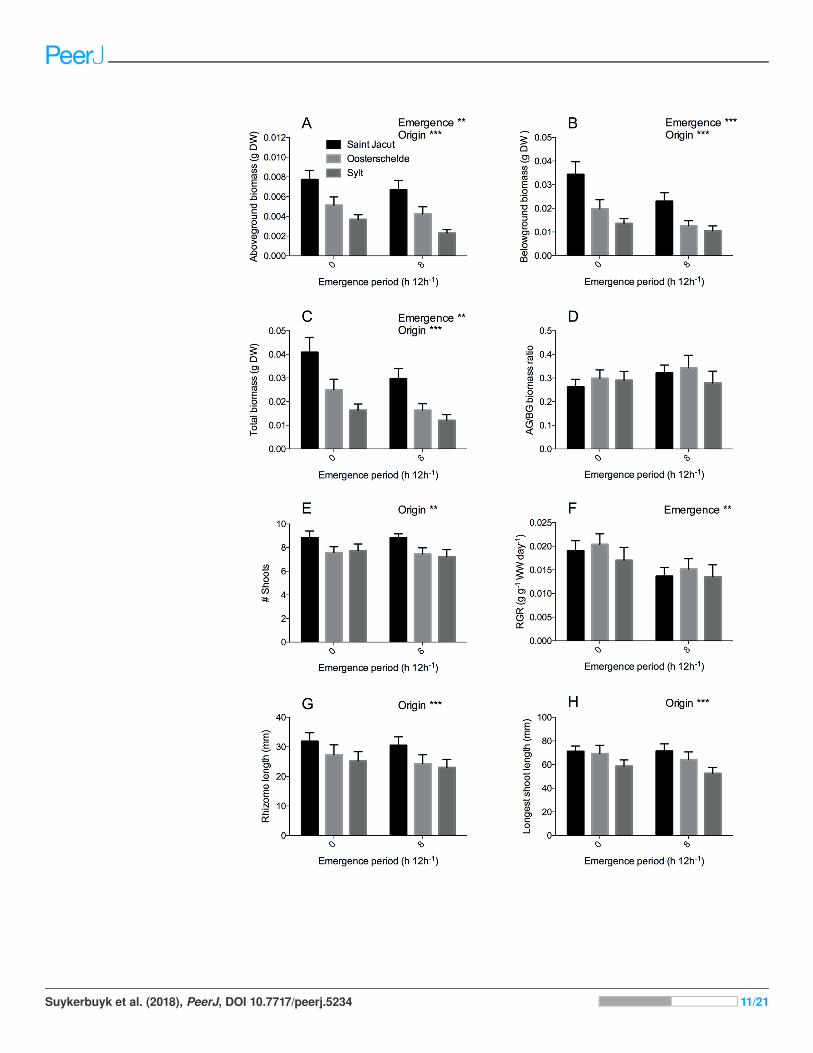
Suykerbuyk et al. (2018), PeerJ, DOI 10.7717/peerj.5234 11/21
seasons (Soissons et al., 2018; Govers, 2014). Plants originating from the Netherlands
(Oosterschelde) were in the middle for all measured traits. In addition, total shoot
numbers were also significantly higher (Fig. 4E, P = 0.004; Table 2) in units with plants
from France than in units with Dutch and German plants. Despite these differences in
morphology and biomass, seagrass plants from different origins were similarly affected by
emergence and salinity as we found no interactive effects for any of our parameters
(salinity � origin � emergence). Surprisingly, we found no effect of our salinity
treatment on any growth or morphological parameters, indicating a broad salt
tolerance of Z. noltii (Table 2).
DISCUSSIONEmergence had a negative effect on seagrass growth in both experiments confirming
our hypothesis (H1). Increasing duration of air exposure hampered seagrass growth,
reflected by a smaller RGR and reduced aboveground biomass of the plants as compared
to the control group that was never subjected to emergence. The reduced growth
might be the consequence of loss of photosynthetic capacity due to desiccation damage to
the leaves (Leuschner, Landwehr & Mehlig, 1998; Vermaat, Verhagen & Lindenburg, 2000;
Fernandez-Torquemada & Sanchez-Lizaso, 2005; Shafer, Sherman & Wyllie-Echeverria,
2007). In the field, the negative effect of desiccation was demonstrated by the higher
biomass found in depressions (which retain water during low tide) as compared to
elevations (dry at low tide) within the same bed (Van Tussenbroek et al., 2016).
Concurrently, these authors found lower sexual reproductive efforts in the depressions,
in line with the general notion that reproductive efforts increases with increasing stress in
seagrasses (Cabaco & Santos, 2012). Further growth reduction from desiccation can be
expected in situ as sediment trapping by Z. noltii often causes the plant to grow on
elevations, making them more prone to desiccation (Reise & Kohlus, 2008; Van der Heide
et al., 2010; Van Tussenbroek et al., 2016). Furthermore, desiccation damaged leaves may be
easier torn by waves than undamaged leaves, leaving significantly shorter leaves for
photosynthesis (Vermaat et al., 1993; Boese et al., 2003), and reducing water retention by
the leaves (Fox, 1996), which is density dependent (De Fouw et al., 2016).
Shading resulted in longer leaves, but reduced belowground biomass and RGR.
Aboveground/belowground biomass ratio increased (experiment 1), similar to previous
studies without emergence treatments (Vermaat et al., 1993; Peralta et al., 2002;
Cabaco, Machas & Santos, 2009). Plants apparently invested more in aboveground
Figure 4 Zostera noltii growth response after 75 days of combined salinity and emergence
treatment. Salinity treatments are pooled as no significant differences were found between treatments
of all measured parameters (Table 2). Locations of origin are displayed in the following colors: Saint
Jacut in black, Oosterschelde in light grey and Sylt in dark grey. (A) Aboveground biomass,
(B) belowground biomass, (C) total biomass, (D) aboveground/belowground (AG/BG) biomass ratio,
(E) shoot numbers (# shoots), (F) relative growth rate (RGR) of wet weight (WW), (G) rhizome length
and (H) longest shoot length. Statistical results are displayed in the upper right corner of each panel,
0.001 < P < 0.01 = ��, P < 0.001 = ���. Error bars represent standard errors (SEM).
Full-size DOI: 10.7717/peerj.5234/fig-4
Suykerbuyk et al. (2018), PeerJ, DOI 10.7717/peerj.5234 12/21

Table 2 Results of statistical tests testing the main and combined effects of emergence time, salinity
and population origin (location) on seagrass growth and morphology.
Factor Test Transformation Treatment DF F value P
DWAG lme sqrt Emergence 1 12.571 0.003 **
Salinity 1 4.109 0.138 n.s.
Origin 2 50.517 <0.001 ***
Emergence � salinity 2 1.201 0.328 n.s.
Emergence � origin 2 0.865 0.423 n.s.
Salinity � origin 4 0.358 0.839 n.s.
Emergence � salinity � origin 4 2.042 0.091 n.s
DW BG lme sqrt Emergence 1 20.036 <0.001 ***
Salinity 1 0.801 0.7871 n.s.
Origin 2 37.318 <0.001 ***
Emergence � salinity 2 1.224 0.322 n.s.
Emergence � origin 2 0.710 0.493 n.s.
Salinity � origin 4 0.664 0.617 n.s.
Emergence � salinity � origin 4 0.591 0.670 n.s
DW total lme sqrt Emergence 1 15.312 0.001 **
Salinity 1 0.180 0.843 n.s.
Origin 2 39.652 <0.001 ***
Emergence � salinity 2 1.150 0.343 n.s.
Emergence � origin 2 0.182 0.834 n.s.
Salinity � origin 4 0.690 0.600 n.s.
Emergence � salinity � origin 4 1.393 0.238 n.s
AG/BG ratio lme sqrt Emergence 1 1.151 0.300 n.s.
Salinity 1 0.460 0.670 n.s.
Origin 2 0.919 0.401 n.s.
Emergence � salinity 2 0.726 0.500 n.s.
Emergence � origin 2 1.577 0.210 n.s.
Salinity � origin 4 0.344 0.848 n.s.
Emergence � salinity � origin 4 1.355 0.252 n.s
# shoots glmer n.a. Emergence 1 0.2851 0.593 n.s.
Salinity 1 1.491 0.222 n.s.
Origin 2 10.793 0.004 **
Emergence � salinity 1 0.013 0.910 n.s.
Emergence � origin 2 0.341 0.843 n.s.
Salinity � origin 2 1.459 0.482 n.s.
Emergence � salinity � origin 2 0.162 0.922 n.s
RGR WW lme sqrt Emergence 1 17.810 <0.001 ***
Salinity 1 1.030 0.457 n.s.
Origin 2 1.770 0.174 n.s.
Emergence � salinity 2 0.690 0.518 n.s.
Emergence � origin 2 0.290 0.746 n.s.
Salinity � origin 4 0.730 0.572 n.s.
Emergence � salinity � origin 4 2.230 0.068 n.s.
(Continued)
Suykerbuyk et al. (2018), PeerJ, DOI 10.7717/peerj.5234 13/21

biomass than in belowground biomass. Confirming our hypothesis (H2), shading
added to the negative effect of emergence on RGR. Effects were additive (no interactive
effect, so no antagonistic or synergistic effects). The combination is thus more stressful
for the plants than singular effects and may explain the strong reduction in net
photosynthesis in Z. noltii beds during low tide as compared to high tide, due to
self-shading by the leaves lying on top of each other during low tide (Clavier et al., 2011;
Ouisse, Migne & Davoult, 2011). When shading in the intertidal is caused by algal
overgrowth, desiccation of the plants during low tide may be less severe as the leaves
are kept wet by the algal cover. However, in such cases, suffocation, sulfide and
ammonium toxicity pose a threat to seagrasses (Goodman, Moore & Dennison, 1995;
Den Hartog, 1996; Holmer & Nielsen, 2007; Govers et al., 2014). In addition, a stronger
reduction in net growth may be expected in the field as the resulting longer leaves
experience more wave induced drag force than the shorter leaves that develop under
ambient light conditions (Bouma et al., 2005; La Nafie et al., 2012).
The tested salinity range (salinities of 25, 30 and 35, experiment 2) did not affect
plant growth over the course of the experiment, which contrasts our hypothesis (H3).
Apparently, Z. noltii was not stressed by salinities of 30 and 35, probably due to its ability
to acclimatize to salinity changes (Touchette, 2007), not resulting in reduced growth
(production of biomass) as observed for Z. marina by Kamermans, Hemminga &
de Jong (1999). This is supported by presence of dense Z. noltii beds in Banc d’Arguin,
Mauritania with salinity levels of over 40 (Vermaat et al., 1993), whereas Z. marina has
an optimum at salinities as low as salinity 25 (Nejrup, Brammer & Pedersen, 2008).
Table 2 (continued).
Factor Test Transformation Treatment DF F value P
Rhizome length lme none Emergence 1 2.033 0.156 n.s.
Salinity 1 2.948 0.161 n.s.
Origin 2 8.581 <0.001 ***
Emergence � salinity 1 0.481 0.489 n.s.
Emergence � origin 2 0.101 0.903 n.s.
Salinity � origin 2 0.250 0.779 n.s.
Emergence � salinity � origin 2 0.800 0.451 n.s.
Longest shoot lme none Emergence 1 1.189 0.277 n.s.
Salinity 1 1.721 0.260 n.s.
Origin 2 9.918 <0.001 ***
Emergence � salinity 1 0.543 0.462 n.s.
Emergence � origin 2 0.450 0.638 n.s.
Salinity � origin 2 0.332 0.718 n.s.
Emergence � salinity � origin 2 0.670 0.513 n.s.
Notes:Non-significant test results are marked with “ns,” whereas significant test results are in bold, marked with *** forP < 0.001 and **0.001 < P < 0.001.DF, degrees of freedom; P, P-value; DW, dry weight; WW, wet weight; AG, above ground biomass; BG, below groundbiomass; RGR WW, Relative growth rate; #, number; sqrt, square root; log, logarithm; lme, general linear mixedmodel; glmer, generalized linear mixed model.1 Indicates chi-square values of the generalized linear mixed model rather than F values.
Suykerbuyk et al. (2018), PeerJ, DOI 10.7717/peerj.5234 14/21

Whereas hypothesis H2 (additional stressors aggravate the effects of emergence) was
confirmed with regards to shading, it was not confirmed regarding salinity in the range
tested. Considering that salinity did not have an effect at all within the tested range, this is
not surprising. Perhaps this implies that Z. noltii is more of a generalist than a specialist
in terms of the environmental extremes it can withstand, making it more of an
opportunistic pioneer species instead of a climax community species, as compared
to Z. marina.
The effects of salinity and desiccation stress (experiment 2) did not differ between
plants of different origin. This contrasts our expectation that plants that are used to
relatively low salinities would encounter more osmotic stress than those that are
already used to relative high salinity conditions, as was shown for Z. noltii comparing a
Spanish and Dutch population in salinity 15 and 35 (Vermaat, Verhagen & Lindenburg,
2000) and for Z. marina in a narrower or lower salinity range (salinity 22–29, Van Katwijk
et al., 1999; salinity 2–25, Salo, Pedersen & Bostrom, 2014). Thus, Z. noltii plants that
normally grow at a salinity of 35 grew equally well at salinities of 25 or 30, and plants
used to salinities of 29–30 grew equally well at salinities of 25 or 35. Perhaps this flexibility
may be explained by plants originating from estuarine and shallow coastal conditions
(as we used in our experiments) being more used to frequent variations in osmotic
stress and thus better able to make fast physiological adaptations, compared to plants
from more osmotically stable, true marine environments. Although plants from the
three populations differed in plant size and morphology (from big (Saint Jacut), medium
(Oosterschelde) to small (Sylt)), in line with the trend over a broader latitudinal
gradient for this species (South Spain to Sylt; Soissons et al., 2018), their plant size
did not influence their ability to cope with emergence or salinity stress.
CONCLUSIONS AND ECOLOGICAL IMPLICATIONSIn this study, we found that desiccation stress imposed by emergence and shading have a
negative effect on Z. noltii. When combined, they show additive effects, there are no
synergistic or antagonistic effects. This makes plants vulnerable to such combination
(although synergistic effects would enhance this vulnerability even more). The three
populations tested show distinctive size difference, but did not respond differentially
to emergence and salinity. This indicates that the populations show morphotypic
rather then ecotypic variation regarding emergence and salinity within the range tested.
Desiccation is likely to determine the upper distribution of Z. noltii, although other
factors than physiological factors (such as predation, competition for space and resources)
can also be important under field conditions. The question arises: why don’t plants
grow towards the mean low water level in our research areas, where emergence times
are shorter? Our study shows that shorter and absent emergence periods are favorable for
Z. noltii. Although seagrass meadows are often light limited at increasing depth
(Philippart, 1995; Ralph et al., 2007; Cabaco, Machas & Santos, 2009; Van der Heide
et al., 2010), light is not likely a limiting factor in the habitats of the three tested
populations (see Materials and Methods). It is probable that, water and/or sediment
dynamics may explain the absence of Z. noltii in the lower ranges of the intertidal
Suykerbuyk et al. (2018), PeerJ, DOI 10.7717/peerj.5234 15/21

(Suykerbuyk et al., 2016a, 2016b). Still, in more southern ranges of its distribution, Z. noltii
occupies the whole intertidal range and expands even in the higher subtidal (e.g., Basque
country, Valle et al., 2011; Portugal, Cunha, Assis & Serrao, 2013) and submerged in seas
where tides are near absent (Mediterranean, Green & Short, 2003). Further research is
required to assess key factors in determining the depth limit of mid-intertidal Z. noltii
beds. However, from our study it is clear that (i) emersion period is a factor controlling
the upper limit, (ii) shading (for example by self-shading during emersion) likely
lowers the upper limit, as the effects shading and emergence were additive, and
(iii) this upper limit is not affected by salinity or origin of the population. For restoration
purposes, there is no need to carefully select donor populations regarding salinity regime
within the range tested, as the plants of different origins (salinity 30 and 35) were not
influenced by applied salinities (25, 30, 35).
ACKNOWLEDGEMENTSThe authors are grateful to Jan Vermaat for his expert opinion on the initial research
plans. We would also like to acknowledge Ragnhild Asmus and Dominik Kneer (Sylt) and
Laurent Godet and Jerome Fournier (Saint Jacut) for their cooperation and help in the
collection of Z. noltii. Lastly, we thank Vanessa Gonzalez-Ortiz for providing the artwork
of the experimental plant unit.
ADDITIONAL INFORMATION AND DECLARATIONS
FundingThis work was supported by Projectbureau Zeeweringen, Middelburg, the Netherlands.
The funders had no role in study design, data collection and analysis, decision to publish,
or preparation of the manuscript.
Grant DisclosuresThe following grant information was disclosed by the authors:
Projectbureau Zeeweringen.
Competing InterestsThe authors declare that they have no competing interests.
Author Contributions� Wouter Suykerbuyk conceived and designed the experiments, performed the
experiments, analyzed the data, prepared figures and/or tables, authored or reviewed
drafts of the paper, approved the final draft.
� Laura L. Govers conceived and designed the experiments, performed the experiments,
analyzed the data, prepared figures and/or tables, authored or reviewed drafts of the
paper, approved the final draft.
� W.G. van Oven conceived and designed the experiments, performed the experiments,
analyzed the data, prepared figures and/or tables, authored or reviewed drafts of the
paper, approved the final draft.
Suykerbuyk et al. (2018), PeerJ, DOI 10.7717/peerj.5234 16/21

� Kris Giesen performed the experiments, analyzed the data, authored or reviewed
drafts of the paper, approved the final draft.
� Wim B.J.T. Giesen conceived and designed the experiments, authored or reviewed
drafts of the paper, approved the final draft.
� Dick J. de Jong conceived and designed the experiments, authored or reviewed drafts
of the paper, approved the final draft.
� Tjeerd J. Bouma conceived and designed the experiments, authored or reviewed
drafts of the paper, approved the final draft.
� Marieke M. van Katwijk conceived and designed the experiments, prepared figures
and/or tables, authored or reviewed drafts of the paper, approved the final draft.
Field Study PermissionsThe following information was supplied relating to field study approvals (i.e., approving
body and any reference numbers):
The Province of Zeeland gave permission to perform research in the study area to
NIOO/CEME (case NB08.068, reference 08033625), the institute that is now named
‘NIOZ,’ where several authors are/were employed.
Data AvailabilityThe following information was supplied regarding data availability:
The raw data are provided in a Supplemental File.
Supplemental InformationSupplemental information for this article can be found online at http://dx.doi.org/
10.7717/peerj.5234#supplemental-information.
REFERENCESAbal EG, Loneragan N, Bowen P, Perry CJ, Udy JW, Dennison WC. 1994. Physiological
and morphological responses of the seagrass Zostera capricorni aschers to light-intensity.
Journal of Experimental Marine Biology and Ecology 178(1):113–129
DOI 10.1016/0022-0981(94)90228-3.
Bates D, Bolker B, Walker S, Christensen RHB, Singmann H, Dai B, Scheipl F, Grothendieck G,
Green P. 2018. lme4: linear mixed effect models using ‘eigen’ en S4. R package version 1.1.
Available at https://cran.r-project.org/web/packages/lme4/index.html.
Boese BL, Alayan KE, Gooch EF, Robbins BD. 2003. Desiccation index: a measure of damage
caused by adverse aerial exposure on intertidal eelgrass (Zostera marina) in an Oregon (USA)
estuary. Aquatic Botany 76(4):329–337 DOI 10.1016/s0304-3770(03)00068-8.
Bouma TJ, De Vries MB, Low E, Peralta G, Tanczos C, Van de Koppel J, Herman PMJ. 2005.
Trade-offs related to ecosystem engineering: a case study on stiffness of emerging macrophytes.
Ecology 86(8):2187–2199 DOI 10.1890/04-1588.
Cabaco S, Machas R, Santos R. 2009. Individual and population plasticity of the seagrass Zostera
noltii along a vertical intertidal gradient. Estuarine, Coastal and Shelf Science 82(2):301–308
DOI 10.1016/j.ecss.2009.01.020.
Cabaco S, Santos R. 2012. Seagrass reproductive effort as an ecological indicator of disturbance.
Ecological Indicators 23:116–122 DOI 10.1016/j.ecolind.2012.03.022.
Suykerbuyk et al. (2018), PeerJ, DOI 10.7717/peerj.5234 17/21

Charpentier A, Grillas P, Lescuyer F, Coulet E, Auby I. 2005. Spatio-temporal dynamics of a
Zostera noltii dominated community over a period of fluctuating salinity in a shallow lagoon,
Southern France. Estuarine, Coastal and Shelf Science 64(2–3):307–315
DOI 10.1016/j.ecss.2005.02.024.
Clavier J, Chauvaud L, Carlier A, Amice E, Van der Geest M, Labrosse P, Diagne A, Hily C. 2011.
Aerial and underwater carbon metabolism of a Zostera noltii seagrass bed in the Banc d’Arguin,
Mauritania. Aquatic Botany 95(1):24–30 DOI 10.1016/j.aquabot.2011.03.005.
Cunha AH, Assis JF, Serrao EA. 2013. Seagrasses in Portugal: a most endangered marine habitat.
Aquatic Botany 104:193–203 DOI 10.1016/j.aquabot.2011.08.007.
De Fouw J, Govers LL, van de Koppel J, van Belzen J, DorigoW, Sidi CheikhMA, ChristianenMJA,
van der Reijden KJ, van der Geest M, Piersma T, Smolders AJP, Olff H, Lamers LPM,
van Gils JA, van der Heide T. 2016. Drought, mutualism breakdown, and landscape-scale
degradation of seagrass beds. Current Biology 26(8):1051–1056
DOI 10.1016/j.cub.2016.02.023.
De los Santos CB, Brun FG, Bouma TJ, Vergara JJ, Perez-Llorens L. 2010. Acclimation of seagrass
Zostera noltii to co-occurring hydrodynamic and light stresses. Marine Ecology Progress Series
398:127–135 DOI 10.3354/meps08343.
Den Hartog C. 1996. Sudden decline of seagrass beds: “wasting disease” and other disasters.
In: Kuo J, Phillips RC, Walker DI, Kirkman H, eds. Seagrass Biology: Proceedings of an
International Workshop. Rottnest Island: Sciences UWA, 307–314.
Fernandez-Torquemada Y, Sanchez-Lizaso JL. 2005. Effects of salinity on leaf growth and survival
of the Mediterranean seagrass Posidonia oceanica (L.) Delile. Journal of Experimental Marine
Biology and Ecology 320(1):57–63 DOI 10.1016/j.jembe.2004.12.019.
Fox AD. 1996. Zostera exploitation by Brent geese and wigeon on the Exe estuary, southern
England. Bird Study 43(3):257–268 DOI 10.1080/00063659609461018.
Goodman JL, Moore KA, Dennison WC. 1995. Photosynthetic responses of eelgrass (Zostera
marina L.) to light and sediment sulfide in a shallow barrier-island lagoon. Aquatic Botany
50(1):37–47 DOI 10.1016/0304-3770(94)00444-q.
Govers LL. 2014. The effects of biogeochemical stressors on seagrass ecosystems. PhD thesis.
Radboud University Nijmegen, The Netherlands.
Govers LL, de Brouwer JHF, Suykerbuyk W, Bouma TJ, Lamers LPM, Smolders AJP,
van Katwijk MM. 2014. Toxic effects of increased sediment nutrient and organic matter
loading on the seagrass Zostera noltii. Aquatic Toxicology 155:253–260
DOI 10.1016/j.aquatox.2014.07.005.
Govers LL, Suykerbuyk W, Hoppenreijs JHT, Giesen K, Bouma TJ, van Katwijk MM. 2015.
Rhizome starch as indicator for temperate seagrass winter survival. Ecological Indicators
49:53–60 DOI 10.1016/j.ecolind.2014.10.002.
Green EP, Short FT. 2003. World Atlas of Seagrasses. Los Angeles: University of California Press.
Han QY, Bouma TJ, Brun FG, Suykerbuyk W, van Katwijk MM. 2012. Resilience of Zostera noltii
to burial and erosion disturbances. Marine Ecology-Progress Series 449:133–143.
Holmer M, Nielsen RM. 2007. Effects of filamentous algal mats on sulfide invasion in eelgrass
(Zostera marina). Journal of Experimental Marine Biology and Ecology 353(2):245–252
DOI 10.1016/j.jembe.2007.09.010.
Ifremer. 2014. Bulletin de la Surveillance de la Qualite du Milieu Marin Littoral 2013.
Departements d’Ille-et-Vilaine et des Cotes d’Armor. Resultats acquis jusqu’en 2013. Ifremer.
Oceanographie et Dynamique des Ecosystemes. Unite Littoral. Laboratoire Environnement
Ressources Bretagne Nord, 150.
Suykerbuyk et al. (2018), PeerJ, DOI 10.7717/peerj.5234 18/21

Jimenez C, Niell FX, Algarra P. 1987. Photosynthetic adaptation of Zostera noltii Hornem.
Aquatic Botany 29(3):217–226 DOI 10.1016/0304-3770(87)90017-9.
Kamermans P, Hemminga MA, de Jong DJ. 1999. Significance of salinity and silicon
levels for growth of a formerly estuarine eelgrass (Zostera marina) population
(Lake Grevelingen, the Netherlands). Marine Biology 133(3):527–539
DOI 10.1007/s002270050493.
La Nafie YA, de los Santos CB, Brun FG, van Katwijk MM, Bouma TJ. 2012. Waves and high
nutrient loads jointly decrease survival and separately affect morphological and biomechanical
properties in the seagrass Zostera noltii. Limnology and Oceanography 57(6):1664–1672
DOI 10.4319/lo.2012.57.6.1664.
Leuschner C, Landwehr S, Mehlig U. 1998. Limitation of carbon assimilation of intertidal Zostera
noltii and Z. marina by desiccation at low tide. Aquatic Botany 62(3):171–176
DOI 10.1016/s0304-3770(98)00091-6.
Michael TS, Shin HW, Hanna R, Spafford DC. 2008. A review of epiphyte community
development: surface interactions and settlement on seagrass. Journal of Environmental Biology
29(4):629–638.
Nejrup LB, Brammer L, Pedersen MF. 2008. Effects of salinity and water temperature on the
ecological performance of Zostera marina. Aquatic Botany 88(3):239–246
DOI 10.1016/j.aquabot.2007.10.006.
Ouisse V, Migne A, Davoult D. 2011. Community-level carbon flux variability over a tidal
cycle in Zostera marina and Z. noltii beds. Marine Ecology Progress Series 437:79–87
DOI 10.3354/meps09274.
Peralta G, Perez-Llorens JL, Hernandez I, Vergara JJ. 2002. Effects of light availability on growth,
architecture and nutrient content of the seagrass Zostera noltiiHornem. Journal of Experimental
Marine Biology and Ecology 269(1):9–26 DOI 10.1016/s0022-0981(01)00393-8.
Perez-Llorens JL, Niell FX. 1993. Temperature and emergence effects on the net photosynthesis of
two Zostera noltii Hornem. morphotypes. Hydrobiologia 254(1):53–64
DOI 10.1007/bf00007765.
Philippart CJM. 1995. Seasonal variation in growth and biomass of an intertidal Zostera noltii
stand in the Dutch Wadden sea. Netherlands Journal of Sea Research 33(2):205–218
DOI 10.1016/0077-7579(95)90007-1.
Philippart CJM, Dijkema KS. 1995. Wax and wane of Zostera noltii Hornem. in the Dutch
Wadden sea. Aquatic Botany 49(4):255–268 DOI 10.1016/0304-3770(94)00431-k.
Pinheiro J, Bates D, DebRoy S, Sarkar D, EISPACK authors, Heisterkamp S, Van Willigen B.
2018. nlme: linear and non-linear mixed effect models. R package version 3.1. Available at
https://CRAN.R-project.org/package=nlme.
Ralph PJ, Durako MJ, Enriquez S, Collier CJ, Doblin MA. 2007. Impact of light limitation
on seagrasses. Journal of Experimental Marine Biology and Ecology 350(1–2):176–193
DOI 10.1016/j.jembe.2007.06.017.
Reise K, Kohlus J. 2008. Seagrass recovery in the Northern Wadden Sea? Helgoland Marine
Research 62(1):77–84 DOI 10.1007/s10152-007-0088-1.
Salo T, Pedersen MF. 2014. Synergistic effects of altered salinity and temperature on estuarine
eelgrass (Zostera marina) seedlings and clonal shoots. Journal of Experimental Marine Biology
and Ecology 457:143–150 DOI 10.1016/j.jembe.2014.04.008.
Salo T, Pedersen MF, Bostrom C. 2014. Population specific salinity tolerance in eelgrass
(Zostera marina). Journal of Experimental Marine Biology and Ecology 461:425–429
DOI 10.1016/j.jembe.2014.09.010.
Suykerbuyk et al. (2018), PeerJ, DOI 10.7717/peerj.5234 19/21

Shafer DJ, Sherman TD, Wyllie-Echeverria S. 2007. Do desiccation tolerances control the vertical
distribution of intertidal seagrasses? Aquatic Botany 87(2):161–166
DOI 10.1016/j.aquabot.2007.04.003.
Soissons LM, van Katwijk MM, Peralta G, Brun FG, Cardoso PG, Grilo TF, Ondiviela B,
Recio M, Valle M, Garmendia JM, Ganthy F, Auby I, Rigouin L, Godet L, Fournier J,
Desroy N, Barille L, Kadel P, Asmus R, Herman PMJ, Bouma TJ. 2018. Seasonal and
latitudinal variation in seagrass mechanical traits across Europe: the influence of local nutrient
status and morphometric plasticity. Limnology and Oceanography 63(1):37–46
DOI 10.1002/lno.10611.
Suykerbuyk W, Bouma TJ, Govers LL, Giesen K, de Jong DJ, Herman PMJ, Hendriks AJ,
van Katwijk MM. 2016b. Surviving in changing seascapes: sediment dynamics as bottleneck for
long-term seagrass presence. Ecosystems 19(2):296–310 DOI 10.1007/s10021-015-9932-3.
Suykerbuyk W, Govers LL, Bouma TJ, Giesen WBJT, de Jong DJ, van de Voort R, Giesen K,
Giesen PT, van Katwijk MM. 2016a. Unpredictability in seagrass restoration: analysing the role
of positive feedback and environmental stress on Zostera noltii transplants. Journal of Applied
Ecology 53(3):774–784 DOI 10.1111/1365-2664.12614.
Touchette BW. 2007. Seagrass-salinity interactions: physiological mechanisms used by submersed
marine angiosperms for a life at sea. Journal of Experimental Marine Biology and Ecology
350(1–2):194–215 DOI 10.1016/j.jembe.2007.05.037.
Valle M, Borja A, Chust G, Galparsoro I, Garmendia JM. 2011. Modelling suitable estuarine
habitats for Zostera noltii, using Ecological Niche Factor Analysis and Bathymetric LiDAR.
Estuarine, Coastal and Shelf Science 94(2):144–154 DOI 10.1016/j.ecss.2011.05.031.
Van der Heide T, Bouma TJ, van Nes EH, van de Koppel J, Scheffer M, Roelofs JGM, van Katwijk
MM, Smolders AJP. 2010. Spatial self-organized patterning in seagrasses along a depth gradient of an
intertidal ecosystem. Ecology 91(2):362–369 DOI 10.1890/08-1567.1.
Van Katwijk MM, Hermus DCR. 2000. Effects of water dynamics on Zostera marina:
transplantation experiments in the intertidal Dutch Wadden Sea.Marine Ecology Progress Series
208:107–118 DOI 10.3354/meps208107.
Van Katwijk MM, Schmitz GHW, Gasseling AP, van Avesaath PH. 1999. Effects of salinity and
nutrient load and their interaction on Zostera marina. Marine Ecology Progress Series
190:155–165 DOI 10.3354/meps190155.
Van Katwijk MM, Schmitz GHW, Hanssen L, den Hartog C. 1998. Suitability of Zostera marina
populations for transplantation to the Wadden Sea as determined by a mesocosm shading
experiment. Aquatic Botany 60(4):283–305 DOI 10.1016/s0304-3770(98)00053-9.
Van Katwijk MM, Thorhaug A, Marba N, Orth RJ, Duarte CM, Kendrick GA, Althuizen IHJ,
Balestri E, Bernard G, Cambridge ML, Cunha A, Durance C, Giesen W, Han Q, Hosokawa S,
Kiswara W, Komatsu T, Lardicci C, Lee KS, Meinesz A, Nakaoka M, O’Brien KR, Paling EI,
Pickerell C, Ransijn AMA, Verduin JJ. 2016. Global analysis of seagrass restoration: the
importance of large-scale planting. Journal of Applied Ecology 53(2):567–578
DOI 10.1111/1365-2664.12562.
Van Tussenbroek BI, Soissons LM, Bouma TJ, Asmus RM, Auby I, Brun FG, Cardoso PG,
Desroy N, Fournier J, Ganthy F, Garmendia JM, Godet L, Grilo TF, Kadel P, Ondeviela B,
Peralta G, Recio M, Valle M, van der Heide T, van Katwijk MM. 2016. Pollen limitation may
be a common Allee effect in marine hydrophilous plants: implications for decline and recovery
in seagrasses. Oecologia 182(2):595–609 DOI 10.1007/s00442-016-3665-7.
Vermaat JE, Beijer JAJ, Gijlstra R, Hootsmans MJM, Philippart CJM, van den Brink NW,
van Vierssen W. 1993. Leaf dynamics and standing stocks of intertidal Zostera noltii Hornem.
Suykerbuyk et al. (2018), PeerJ, DOI 10.7717/peerj.5234 20/21

and Cymodocea nodosa (ucria) Ascherson on the Banc d’Arguin (Mauritania). Hydrobiologia
258(1–3):59–72 DOI 10.1007/bf00006186.
Vermaat JE, Verhagen FCA. 1996. Seasonal variation in the intertidal seagrass Zostera noltii
Hornem.: coupling demographic and physiological patterns. Aquatic Botany 52(4):259–281
DOI 10.1016/0304-3770(95)00510-2.
Vermaat JE, Verhagen FCA, Lindenburg D. 2000. Contrasting responses in two populations of
Zostera noltii Hornem. to experimental photoperiod manipulation at two salinities. Aquatic
Botany 67(3):179–189 DOI 10.1016/s0304-3770(00)00090-5.
Suykerbuyk et al. (2018), PeerJ, DOI 10.7717/peerj.5234 21/21