live webcast hosted by - advisor perspectives asset... · 2017-04-04 · 4-4-17 asset allocation...
TRANSCRIPT

333 S. Grand Ave., 18th Floor || Los Angeles, CA 90071 || 213.633.8200
Live Webcast hosted by:
Jeffrey Gundlach
Chief Executive Officer
April 4, 2017
Asset Allocation Webcast
4-4-17 Asset Allocation Webcast 1
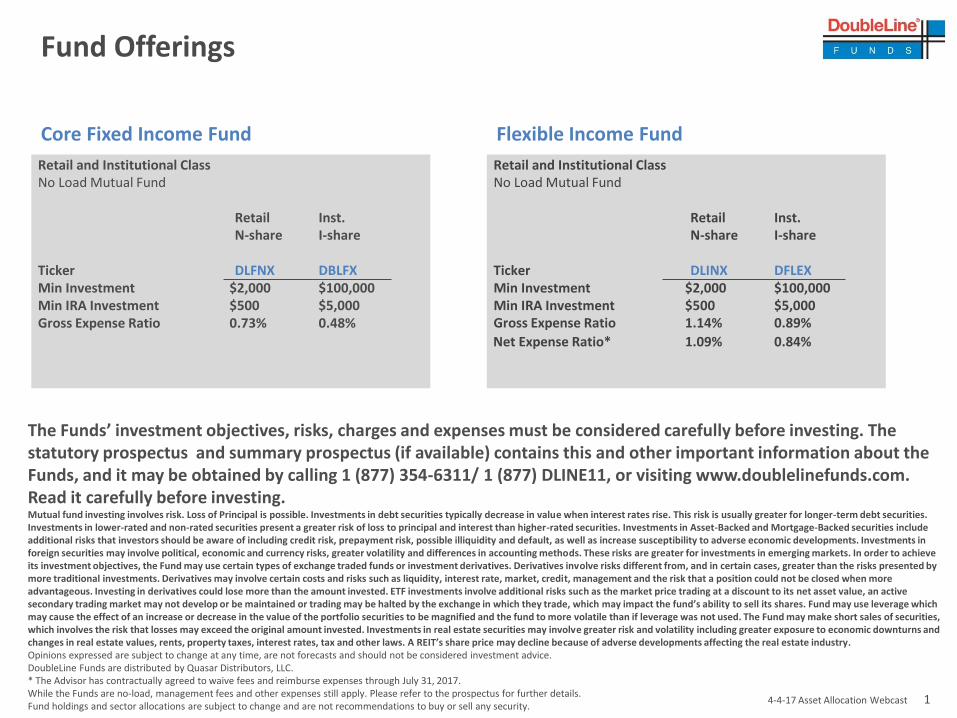
Fund Offerings
Retail and Institutional ClassNo Load Mutual Fund
Retail Inst.N-share I-share
Ticker DLINX DFLEXMin Investment $2,000 $100,000Min IRA Investment $500 $5,000Gross Expense Ratio 1.14% 0.89%
Net Expense Ratio* 1.09% 0.84%
Retail and Institutional ClassNo Load Mutual Fund
Retail Inst.N-share I-share
Ticker DLFNX DBLFXMin Investment $2,000 $100,000Min IRA Investment $500 $5,000Gross Expense Ratio 0.73% 0.48%
Flexible Income FundCore Fixed Income Fund
The Funds’ investment objectives, risks, charges and expenses must be considered carefully before investing. The statutory prospectus and summary prospectus (if available) contains this and other important information about the Funds, and it may be obtained by calling 1 (877) 354-6311/ 1 (877) DLINE11, or visiting www.doublelinefunds.com. Read it carefully before investing.Mutual fund investing involves risk. Loss of Principal is possible. Investments in debt securities typically decrease in value when interest rates rise. This risk is usually greater for longer-term debt securities. Investments in lower-rated and non-rated securities present a greater risk of loss to principal and interest than higher-rated securities. Investments in Asset-Backed and Mortgage-Backed securities include additional risks that investors should be aware of including credit risk, prepayment risk, possible illiquidity and default, as well as increase susceptibility to adverse economic developments. Investments in foreign securities may involve political, economic and currency risks, greater volatility and differences in accounting methods. These risks are greater for investments in emerging markets. In order to achieve its investment objectives, the Fund may use certain types of exchange traded funds or investment derivatives. Derivatives involve risks different from, and in certain cases, greater than the risks presented by more traditional investments. Derivatives may involve certain costs and risks such as liquidity, interest rate, market, credit, management and the risk that a position could not be closed when more advantageous. Investing in derivatives could lose more than the amount invested. ETF investments involve additional risks such as the market price trading at a discount to its net asset value, an active secondary trading market may not develop or be maintained or trading may be halted by the exchange in which they trade, which may impact the fund’s ability to sell its shares. Fund may use leverage which may cause the effect of an increase or decrease in the value of the portfolio securities to be magnified and the fund to more volatile than if leverage was not used. The Fund may make short sales of securities, which involves the risk that losses may exceed the original amount invested. Investments in real estate securities may involve greater risk and volatility including greater exposure to economic downturns and changes in real estate values, rents, property taxes, interest rates, tax and other laws. A REIT’s share price may decline because of adverse developments affecting the real estate industry.Opinions expressed are subject to change at any time, are not forecasts and should not be considered investment advice.DoubleLine Funds are distributed by Quasar Distributors, LLC.* The Advisor has contractually agreed to waive fees and reimburse expenses through July 31, 2017.While the Funds are no-load, management fees and other expenses still apply. Please refer to the prospectus for further details.Fund holdings and sector allocations are subject to change and are not recommendations to buy or sell any security.

4-4-17 Asset Allocation Webcast 2
Performance - DoubleLine Core Fixed Income Fund
Performance data quoted represents past performance; past performance does not guarantee future results. The investment return and principal value of an investment will fluctuate so that an investor's shares, when redeemed, may be worth more or less than the original cost. Current performance of the fund may be lower or higher than the performance quoted. Performance data current to the most recent month-end may be obtained by calling 213-633-8200 or by visiting www.doublelinefunds.com. Past Performance does not guarantee future results. Index performance is not illustrative of fund performance. Bloomberg Barclays U.S. Aggregate Bond Index represents securities that are SEC-registered, taxable, and dollar denominated. The index covers the US investment grade fixed rate bond market, with index components for government and corporate securities, mortgage pass-through securities, and asset-backed securities. These major sectors are subdivided into more specific indices that are calculated and reported on a regular basis. It is not possible to invest in an index.1. The Fund’s inception date is 4/6/2010, thus the calendar year performance for 2010 is an unannualized partial year return.Please see appendix for definition.
Expense Ratio I-Share N-Share
Gross 0.48% 0.73%
Fund Performance
March 31, 2017
Annualized
March 1Q16 1-Year 3-Year 5-Year Since Inception
(6-1-10 to 3-31-17)
I-share (DBLFX) 0.16% 1.34% 2.80% 3.37% 3.52% 5.62%
N-share (DLFNX) 0.05% 1.28% 2.54% 3.12% 3.27% 5.36%
Bloomberg Barclays U.S. Aggregate Bond Index -0.05% 0.82% 0.44% 2.68% 2.34% 3.28%
Calendar Year Returns 2016 2015 2014 2013 2012 2011 20101
I-share (DBLFX) 4.11% 0.63% 6.86% -1.20% 8.15% 11.45% 8.97%
N-share (DLFNX) 3.76% 0.39% 6.60% -1.36% 7.89% 11.12% 8.82%
Bloomberg Barclays U.S. Aggregate Bond Index 2.65% 0.55% 5.97% -2.02% 4.21% 7.84% 2.83%

4-4-17 Asset Allocation Webcast 3
Performance - DoubleLine Flexible Income Fund
Performance data quoted represents past performance; past performance does not guarantee future results. The investment return and principal value of an investment will fluctuate so that an investor's shares, when redeemed, may be worth more or less than the original cost. Current performance of the fund may be lower or higher than the performance quoted. Performance data current to the most recent month-end may be obtained by calling 213-633-8200 or by visiting www.doublelinefunds.com. London Interbank Offering Rate (LIBOR) is an indicative average interest rate at which a selection of banks known as the panel banks are prepared to lend one another unsecured funds on the London money market.Past Performance does not guarantee future results. Index performance is not illustrative of fund performance.1. The Fund’s inception date is 4/7/2014, thus the calendar year performance for 2014 is an unannualized partial year return.2. The Advisor has contractually agreed to waive fees and reimburse expenses through July 31, 2017.Please see appendix for definition.
Expense Ratio I-share N-share
Gross 0.89% 1.14%
Net2
0.84% 1.09%
Fund Performance
March 31, 2017
Annualized
March 1Q16 1-YearSince Inception
(4-7-14 to 3-31-17)
I-share (DFLEX) 0.32% 1.51% 6.48% 3.29%
N-share (DLINX) 0.40% 1.55% 6.23% 3.05%
LIBOR USD 3 Month 0.09% 0.26% 0.83% 0.50%
Calendar Year Returns 2016 2015 20141
I-share (DFLEX) 5.48% 0.50% 2.33%
N-share (DLINX) 5.23% 0.16% 2.17%
LIBOR USD 3 Month 0.73% 0.30% 0.17%

4-4-17 Asset Allocation Webcast 4
Upcoming Webcast Announcements
Jeffrey Gundlach – May 2, 2017Closed End Fund WebcastGo to www.doublelinefunds.com, Home page under “Events”2017 Webcast Schedule to register1:15 pm PDT/4:15 pm EDT
Jeffrey Gundlach – June 13, 2017Total Return WebcastGo to www.doublelinefunds.com, Home page under “Events”2017 Webcast Schedule to register1:15 pm PDT/4:15 pm EDT
To Receive Presentation Slides:
Email: [email protected]

333 S. Grand Ave., 18th Floor || Los Angeles, CA 90071 || 213.633.8200
Live Webcast hosted by:
Jeffrey Gundlach
Chief Executive Officer
April 4, 2017
Asset Allocation Webcast
4-4-17 Asset Allocation Webcast 6
TAB IU.S. Overview

4-4-17 Asset Allocation Webcast 7
The Most Synchronized Economic Upturn in YearsDecember 31, 2009 to April 4, 2017
Source: Citigroup, BloombergThe Surprise Indices are objective and quantitative measures of economic news. They are defined as weighted average historical standard deviations of data surprises for countries indicated. Major Economies refers to developed markets. You cannot invest directly in an index.

4-4-17 Asset Allocation Webcast 8
EU PMI suggests rate hike on horizon
Source: MarkitEU = European Union, PMI = Purchasing Managers’ Index, ECB = European Central Bank.

4-4-17 Asset Allocation Webcast 9
0%
10%
20%
30%
40%
50%
60%
70%
80%
90%
100%
9/2
6/2
01
6
9/3
0/2
01
6
10
/6/2
01
6
10
/12
/20
16
10
/18
/20
16
10
/24
/20
16
10
/28
/20
16
11
/3/2
01
6
11
/9/2
01
6
11
/15
/20
16
11
/21
/20
16
11
/25
/20
16
12
/1/2
01
6
12
/7/2
01
6
12
/13
/20
16
12
/19
/20
16
12
/23
/20
16
12
/29
/20
16
1/4
/20
17
1/1
0/2
01
7
1/1
6/2
01
7
1/2
0/2
01
7
1/2
6/2
01
7
2/1
/20
17
2/7
/20
17
2/1
3/2
01
7
2/1
7/2
01
7
2/2
3/2
01
7
3/1
/20
17
3/7
/20
17
3/1
3/2
01
7
3/1
7/2
01
7
3/2
3/2
01
7
3/2
9/2
01
7
4/4
/20
17
Market Implied Probability of Hike in 2017
ECB
BOE
BOJ
Fed may not be the only DM Central Bank to Hike in 2017
Source: BloombergDM = Developed Markets

4-4-17 Asset Allocation Webcast 10
Citigroup Global Inflation Surprise IndexDecember 31, 1999 to March 31, 2017
Source: Citigroup, BloombergCSIIGL Index = The Citigroup Surprise Index, Global measures price surprises relative to market expectations. A positive reading means that inflation has been higher than expected and a negative reading means that inflation has been lower than expected. You cannot invest directly in an index.

4-4-17 Asset Allocation Webcast 11
Chinese, South Korea and Japan PPIDecember 31, 2006 through February 28, 2017
Source: BloombergThe Producer Price Index (PPI) program measures the average change over time in the selling prices received by domestic producers for their output. The prices included in the PPI are from the first commercial transaction for many products and some services. One cannot invest directly in an index.

4-4-17 Asset Allocation Webcast 12Source: Bloomberg, DoubleLineEUR = Euro is the currency of the Eurozone. You cannot invest directly in an index.
French vs. German Unemployment % Since EURO Introduction March 31, 2000 to December 31, 2016

4-4-17 Asset Allocation Webcast 13Source: DoubleLine, Bloomberg
50 Year French Bond PriceMarch 1, 2016 to April 4, 2017
4-4-17 Asset Allocation Webcast 14
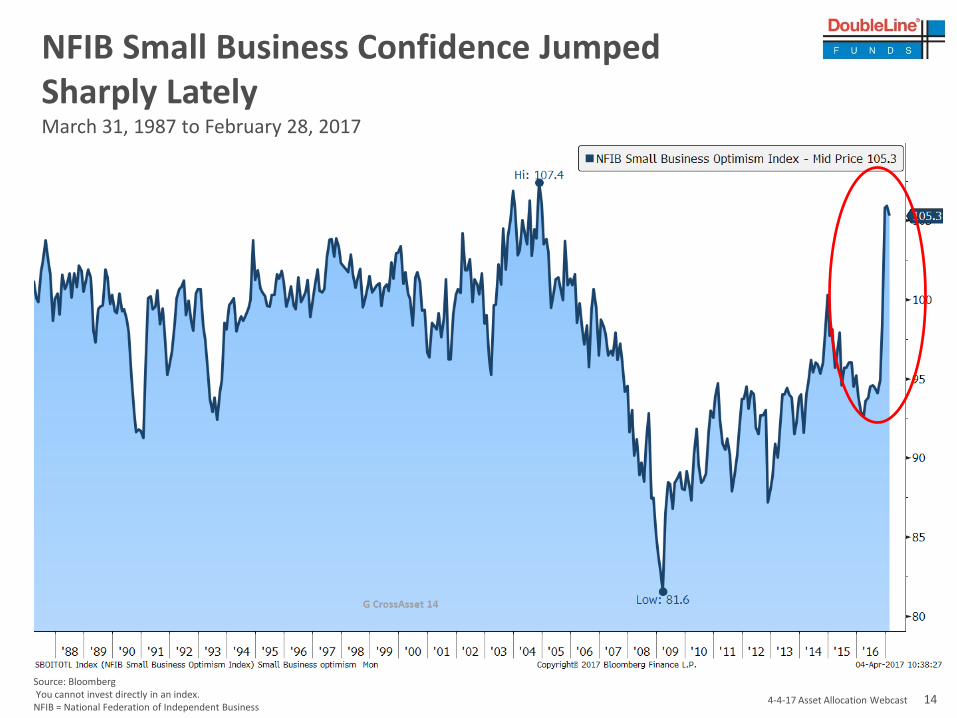
NFIB Small Business Confidence Jumped Sharply LatelyMarch 31, 1987 to February 28, 2017
Source: BloombergYou cannot invest directly in an index.NFIB = National Federation of Independent Business

4-4-17 Asset Allocation Webcast 15
ISM Manufacturing and Services PMIJanuary 31, 1997 to March 31, 2017
Source: Bloomberg, DoubleLine
MAG-1APP
ISM Manufacturing Index is based on surveys of more than 300 manufacturing firms by the Institute of Supply & Management. PMI = Purchasing Managers’ Index is an indicator of the economic health of the manufacturing sector based on five major indicators: new orders, inventory levels, production, supplier deliveries and the employment environment. You cannot invest directly in an index.

4-4-17 Asset Allocation Webcast 16Source: WSJ
Consumer Confidence by Political ViewAs of February 24, 2017
4-4-17 Asset Allocation Webcast 17
-200-150-100
-500
50100150200250300
1/31/03 1/31/04 1/31/05 1/31/06 1/31/07 1/31/08 1/31/09 1/31/10 1/31/11 1/31/12 1/31/13 1/31/14 1/31/15 1/31/16 1/31/17
Soft less Hard
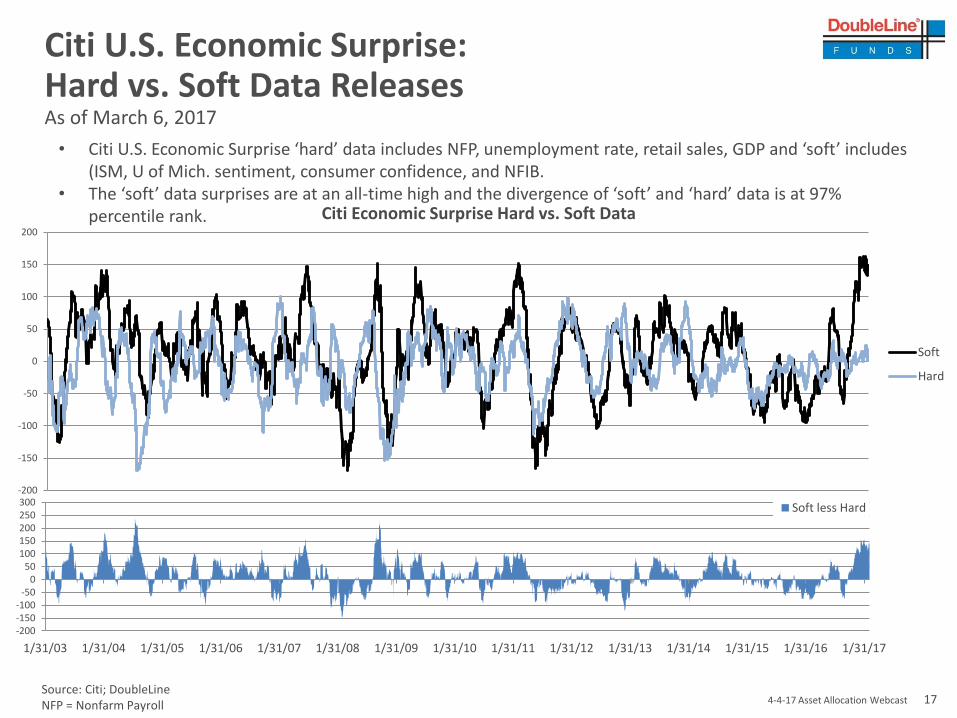
Citi U.S. Economic Surprise: Hard vs. Soft Data ReleasesAs of March 6, 2017
-200
-150
-100
-50
0
50
100
150
200
Citi Economic Surprise Hard vs. Soft Data
Soft
Hard
• Citi U.S. Economic Surprise ‘hard’ data includes NFP, unemployment rate, retail sales, GDP and ‘soft’ includes (ISM, U of Mich. sentiment, consumer confidence, and NFIB.
• The ‘soft’ data surprises are at an all-time high and the divergence of ‘soft’ and ‘hard’ data is at 97% percentile rank.
Source: Citi; DoubleLineNFP = Nonfarm Payroll
4-4-17 Asset Allocation Webcast 18
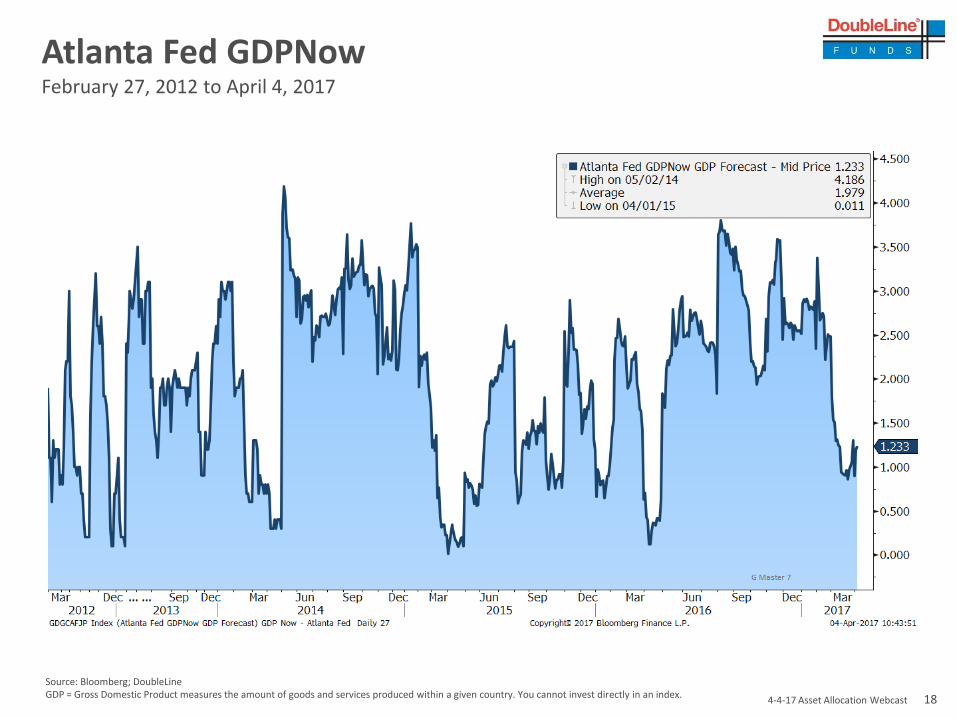
Atlanta Fed GDPNowFebruary 27, 2012 to April 4, 2017
Source: Bloomberg; DoubleLineGDP = Gross Domestic Product measures the amount of goods and services produced within a given country. You cannot invest directly in an index.

4-4-17 Asset Allocation Webcast 19
2s10s Spread and RecessionsJune 1, 1976 through March 31, 2017
-3
-2
-1
0
1
2
3
4
6/1
/19
76
8/1
/19
77
10
/1/1
97
8
12
/1/1
97
9
2/1
/19
81
4/1
/19
82
6/1
/19
83
8/1
/19
84
10
/1/1
98
5
12
/1/1
98
6
2/1
/19
88
4/1
/19
89
6/1
/19
90
8/1
/19
91
10
/1/1
99
2
12
/1/1
99
3
2/1
/19
95
4/1
/19
96
6/1
/19
97
8/1
/19
98
10
/1/1
99
9
12
/1/2
00
0
2/1
/20
02
4/1
/20
03
6/1
/20
04
8/1
/20
05
10
/1/2
00
6
12
/1/2
00
7
2/1
/20
09
4/1
/20
10
6/1
/20
11
8/1
/20
12
10
/1/2
01
3
12
/1/2
01
4
2/1
/20
16
2s10s and Recessions
Recession
2s10s
Source: Bloomberg, DoubleLine

4-4-17 Asset Allocation Webcast 20
U.S. Conference Board Leading Economic IndicatorDecember 31, 1986 to February 28, 2017
Source: Bloomberg, DoubleLineConference Board US Leading Index Leading indicators include economic variables that tend to move before changes in the overall economy including average workweek, production, jobless claims, new order manufacturing, build permits, S&P 500 stock index, leading credit index, average consumer expectations, etc.. You cannot invest directly in an index.
MAG-1APP

4-4-17 Asset Allocation Webcast 21
U.S. Nominal GDP ForecastJanuary 1, 2011 to January 25, 2017
Source: BAMLGDP = Gross domestic product is the amount of goods and services produced within a given country. You cannot invest directly in an index.

4-4-17 Asset Allocation Webcast 22
0
0.5
1
1.5
2
2.5
3
3.5
4
Nu
mb
er
of
Hik
es
Deviation of Fed Projected Rate Hikes and Market Implied
Number of Hikes Expected in 2017December 17, 2015 to April 4, 2017
Source: Bloomberg; DoubleLine
0.0
0.5
1.0
1.5
2.0
2.5
3.0
3.5
4.0
4.5
Nu
mb
er
of
25
bp
s H
ike
s
Number of 25 basis points Hikes in 2017 (based on Fed Fund futures and Fed 'Dots')
Market
Fed Dots

4-4-17 Asset Allocation Webcast 23
Fed Dots March 2017
Source: Bloomberg
4-4-17 Asset Allocation Webcast 24
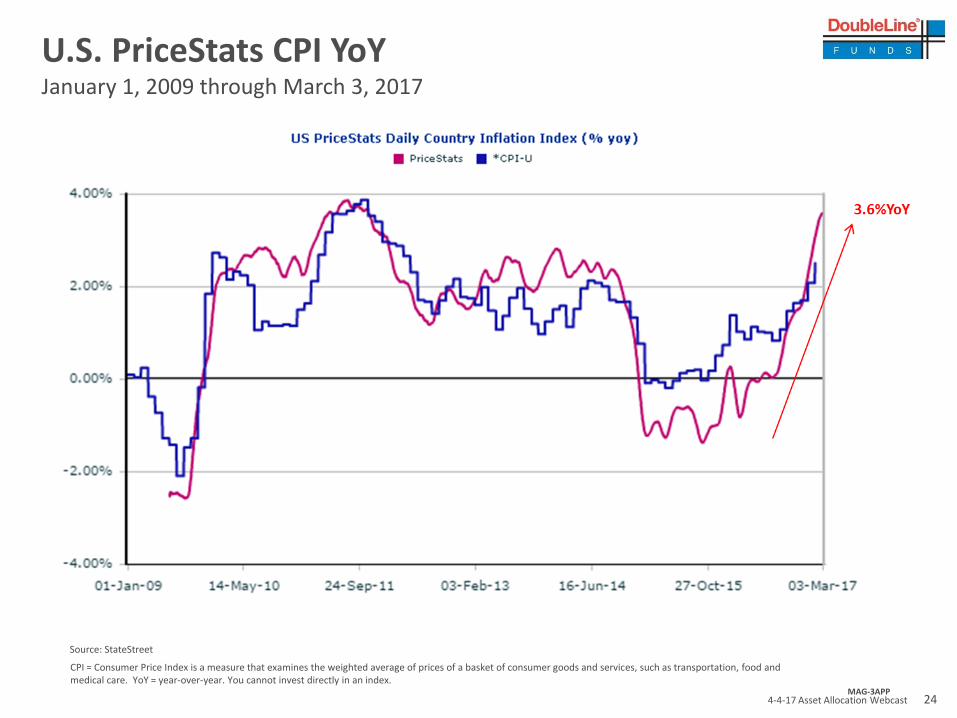
U.S. PriceStats CPI YoYJanuary 1, 2009 through March 3, 2017
Source: StateStreet
CPI = Consumer Price Index is a measure that examines the weighted average of prices of a basket of consumer goods and services, such as transportation, food and medical care. YoY = year-over-year. You cannot invest directly in an index.
MAG-3APP
4-4-17 Asset Allocation Webcast 25
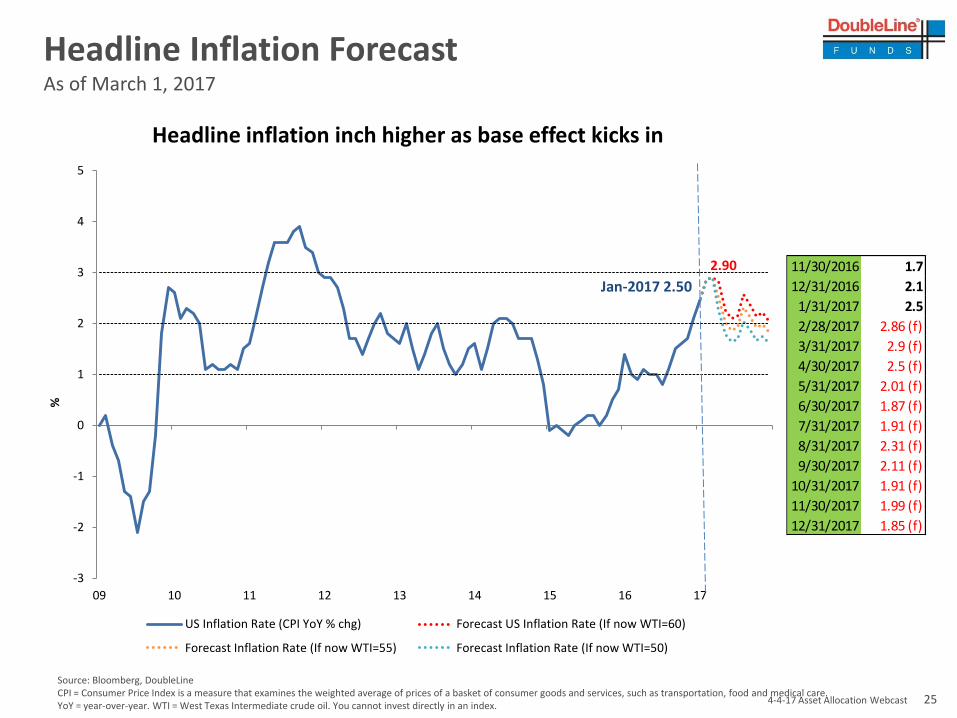
Headline Inflation ForecastAs of March 1, 2017
Source: Bloomberg, DoubleLineCPI = Consumer Price Index is a measure that examines the weighted average of prices of a basket of consumer goods and services, such as transportation, food and medical care. YoY = year-over-year. WTI = West Texas Intermediate crude oil. You cannot invest directly in an index.
11/30/2016 1.7
12/31/2016 2.1
1/31/2017 2.5
2/28/2017 2.86 (f)
3/31/2017 2.9 (f)
4/30/2017 2.5 (f)
5/31/2017 2.01 (f)
6/30/2017 1.87 (f)
7/31/2017 1.91 (f)
8/31/2017 2.31 (f)
9/30/2017 2.11 (f)
10/31/2017 1.91 (f)
11/30/2017 1.99 (f)
12/31/2017 1.85 (f)
Jan-2017 2.50
2.90
-3
-2
-1
0
1
2
3
4
5
09 10 11 12 13 14 15 16 17
%
Headline inflation inch higher as base effect kicks in
US Inflation Rate (CPI YoY % chg) Forecast US Inflation Rate (If now WTI=60)
Forecast Inflation Rate (If now WTI=55) Forecast Inflation Rate (If now WTI=50)
4-4-17 Asset Allocation Webcast 26
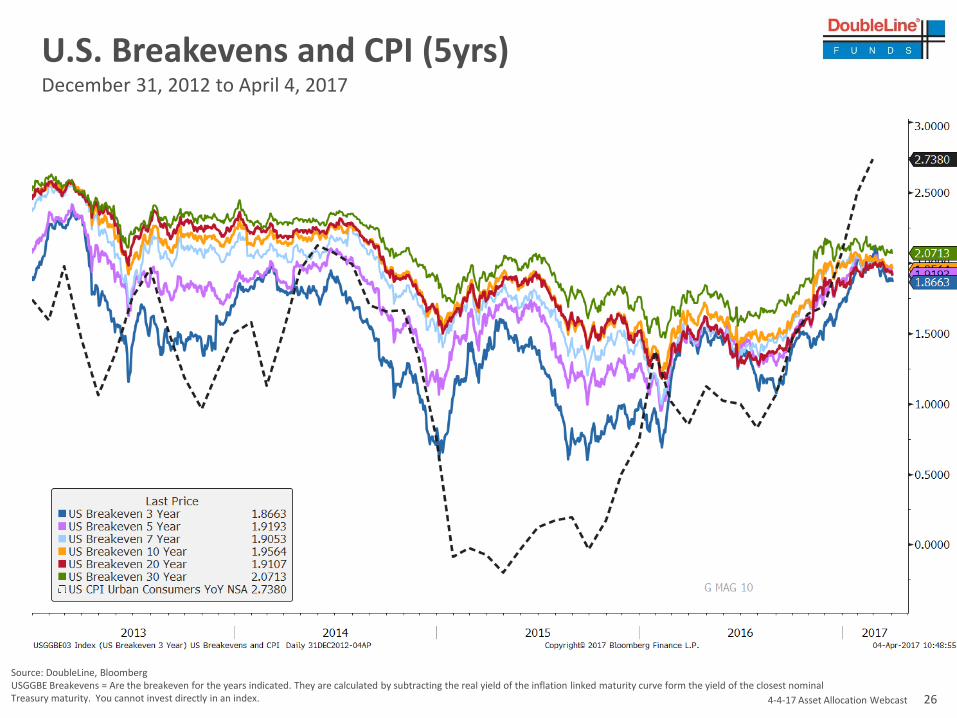
U.S. Breakevens and CPI (5yrs)December 31, 2012 to April 4, 2017
Source: DoubleLine, BloombergUSGGBE Breakevens = Are the breakeven for the years indicated. They are calculated by subtracting the real yield of the inflation linked maturity curve form the yield of the closest nominal Treasury maturity. You cannot invest directly in an index.

4-4-17 Asset Allocation Webcast 27
BofA/Merrill Fixed Income Index Returns
Data Source: BofA/Merrill Lynch Indices through year-end December 31, 2016 and March 31, 2017 for the respective years indicated.Please see the Appendix for index definitions. An investment cannot be made directly in an index.
0.63%
0.40%
-0.45%
1.28%
3.78%
1.41%
4.10%
1.15%
1.67%
4.36%
5.96%
9.48%
17.34%
11.94%
Government (G0A0)
Mortgages (MOAO)
International-Developed (NOGO)
Corporate (COAO)
International-Emerging (IGOV)
High Yield (JOAO)
Convertibles (VOSO)
Grey = Year 2016Blue = Year-To-Date 2017
4-4-17 Asset Allocation Webcast 28
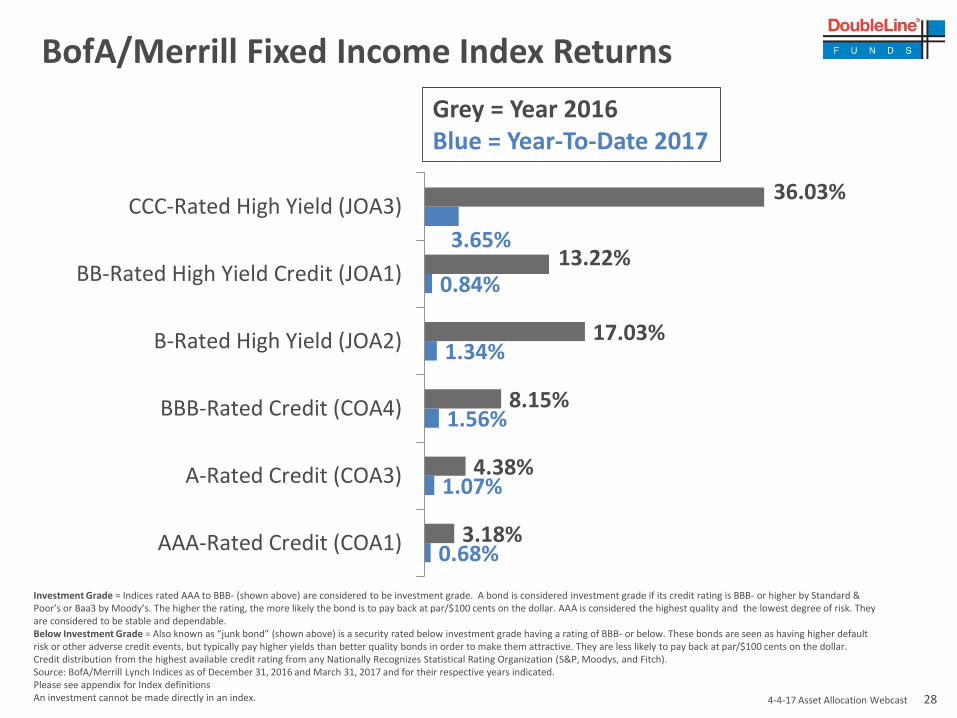
BofA/Merrill Fixed Income Index Returns
0.68%
1.07%
1.56%
1.34%
0.84%
3.65%
3.18%
4.38%
8.15%
17.03%
13.22%
36.03%
AAA-Rated Credit (COA1)
A-Rated Credit (COA3)
BBB-Rated Credit (COA4)
B-Rated High Yield (JOA2)
BB-Rated High Yield Credit (JOA1)
CCC-Rated High Yield (JOA3)
Investment Grade = Indices rated AAA to BBB- (shown above) are considered to be investment grade. A bond is considered investment grade if its credit rating is BBB- or higher by Standard & Poor’s or Baa3 by Moody’s. The higher the rating, the more likely the bond is to pay back at par/$100 cents on the dollar. AAA is considered the highest quality and the lowest degree of risk. They are considered to be stable and dependable.Below Investment Grade = Also known as “junk bond” (shown above) is a security rated below investment grade having a rating of BBB- or below. These bonds are seen as having higher default risk or other adverse credit events, but typically pay higher yields than better quality bonds in order to make them attractive. They are less likely to pay back at par/$100 cents on the dollar.Credit distribution from the highest available credit rating from any Nationally Recognizes Statistical Rating Organization (S&P, Moodys, and Fitch).Source: BofA/Merrill Lynch Indices as of December 31, 2016 and March 31, 2017 and for their respective years indicated.Please see appendix for Index definitionsAn investment cannot be made directly in an index.
Grey = Year 2016Blue = Year-To-Date 2017
4-4-17 Asset Allocation Webcast 29
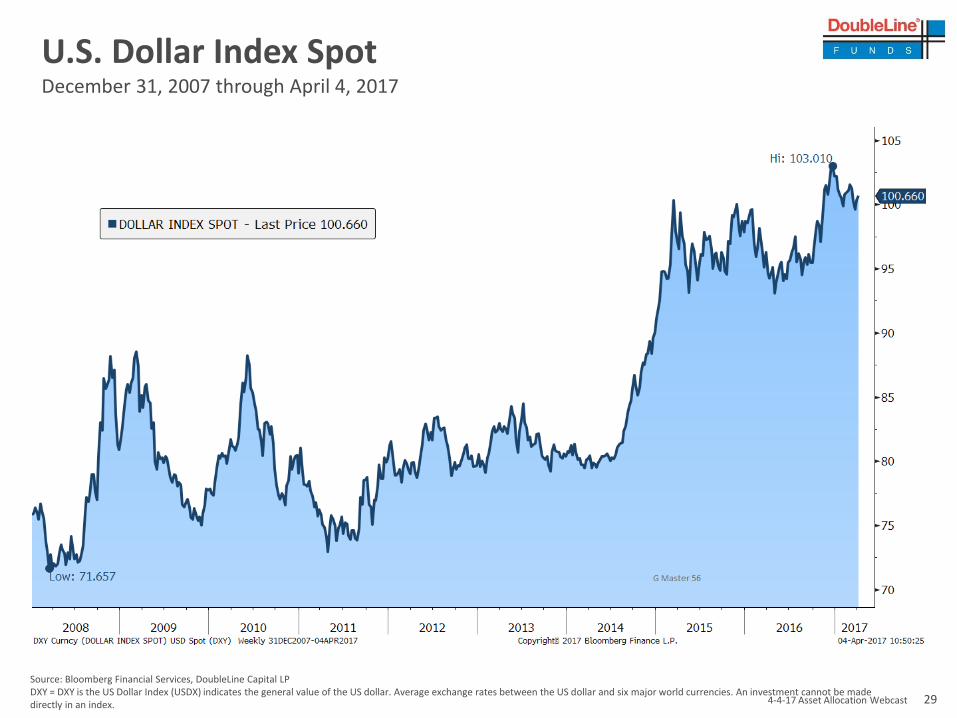
U.S. Dollar Index SpotDecember 31, 2007 through April 4, 2017
Source: Bloomberg Financial Services, DoubleLine Capital LPDXY = DXY is the US Dollar Index (USDX) indicates the general value of the US dollar. Average exchange rates between the US dollar and six major world currencies. An investment cannot be made directly in an index.

4-4-17 Asset Allocation Webcast 30
Fed Rate Hike = Dollar DownAs of April 4, 2017
Source: Bloomberg
4-4-17 Asset Allocation Webcast 31
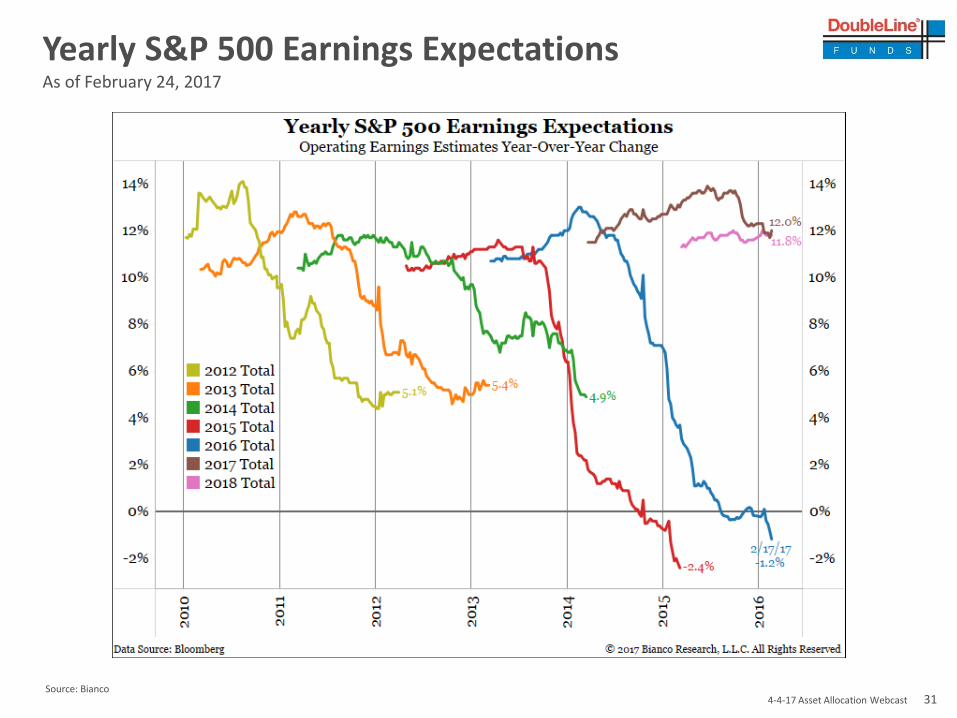
Yearly S&P 500 Earnings ExpectationsAs of February 24, 2017
Source: Bianco
4-4-17 Asset Allocation Webcast 32
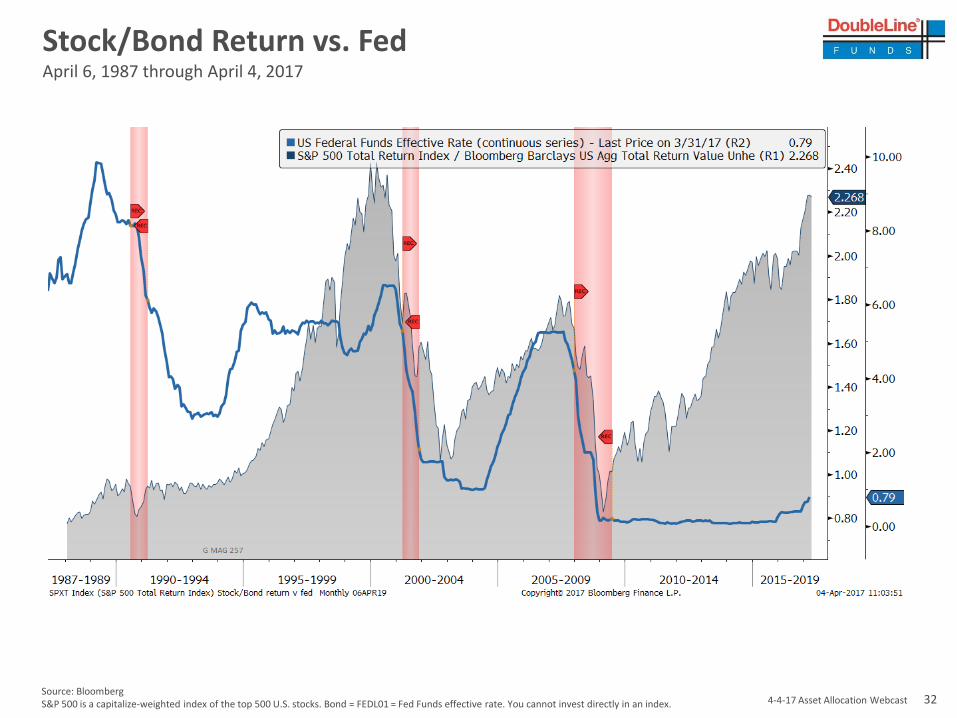
Stock/Bond Return vs. FedApril 6, 1987 through April 4, 2017
Source: BloombergS&P 500 is a capitalize-weighted index of the top 500 U.S. stocks. Bond = FEDL01 = Fed Funds effective rate. You cannot invest directly in an index.
4-4-17 Asset Allocation Webcast 33
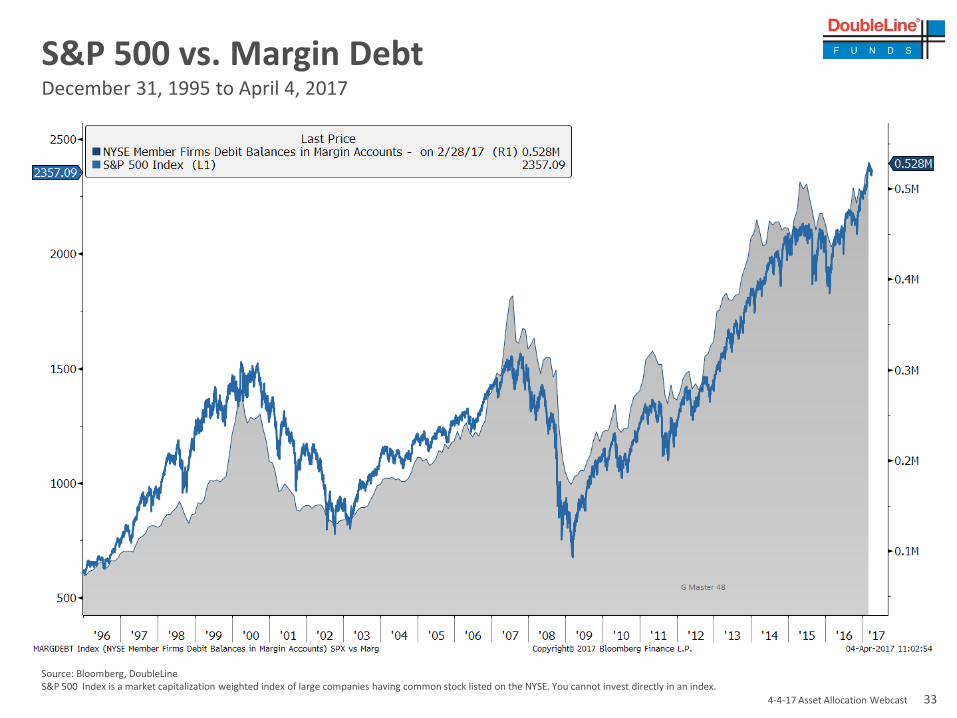
S&P 500 vs. Margin DebtDecember 31, 1995 to April 4, 2017
Source: Bloomberg, DoubleLineS&P 500 Index is a market capitalization weighted index of large companies having common stock listed on the NYSE. You cannot invest directly in an index.

4-4-17 Asset Allocation Webcast 34
S&P 500 Price to Sales RatioAs of March 31, 2017
Source: Bloomberg, DoubleLineS&P 500 Index is a market capitalization weighted index of large companies having common stock listed on the NYSE. Price-to-sales ratio (P/S ratio) is a valuation metric for stocks calculated by dividing the company’s market cap by the re3venue in the most recent year or divide the per-share stock price by the per-share revenue. You cannot invest directly in an index.
0.5
0.7
0.9
1.1
1.3
1.5
1.7
1.9
2.1
2.3
2.5
1/1
/19
90
10
/1/1
99
0
7/1
/19
91
4/1
/19
92
1/1
/19
93
10
/1/1
99
3
7/1
/19
94
4/1
/19
95
1/1
/19
96
10
/1/1
99
6
7/1
/19
97
4/1
/19
98
1/1
/19
99
10
/1/1
99
9
7/1
/20
00
4/1
/20
01
1/1
/20
02
10
/1/2
00
2
7/1
/20
03
4/1
/20
04
1/1
/20
05
10
/1/2
00
5
7/1
/20
06
4/1
/20
07
1/1
/20
08
10
/1/2
00
8
7/1
/20
09
4/1
/20
10
1/1
/20
11
10
/1/2
01
1
7/1
/20
12
4/1
/20
13
1/1
/20
14
10
/1/2
01
4
7/1
/20
15
4/1
/20
16
1/1
/20
17
S&P 500 Price to Sales Ratio
Price/Sales
Average
1 St. Dev
2 St. Dev

4-4-17 Asset Allocation Webcast 35
Valuations Continue to ClimbAs of February 27, 2017
Source: Bianco ResearchCyclically Adjusted Price to Earnings (CAPE) Ratio = A measure of the price of a company's stock relative to average earnings growth over the past 10 years.

4-4-17 Asset Allocation Webcast 36
EM Continues to Outperform U.S.December 30, 2016 through April 4, 2017
Source: BloombergMSCI EM Index = A float-adjusted market capitalization index designed to measure equity market performance in global emerging markets. The index consists of 26 emerging economies, including but not limited to, Argentina, Brazil, China, India, Poland, Thailand, Turkey, and Venezuela.One cannot invest directly in an index.
4-4-17 Asset Allocation Webcast 37
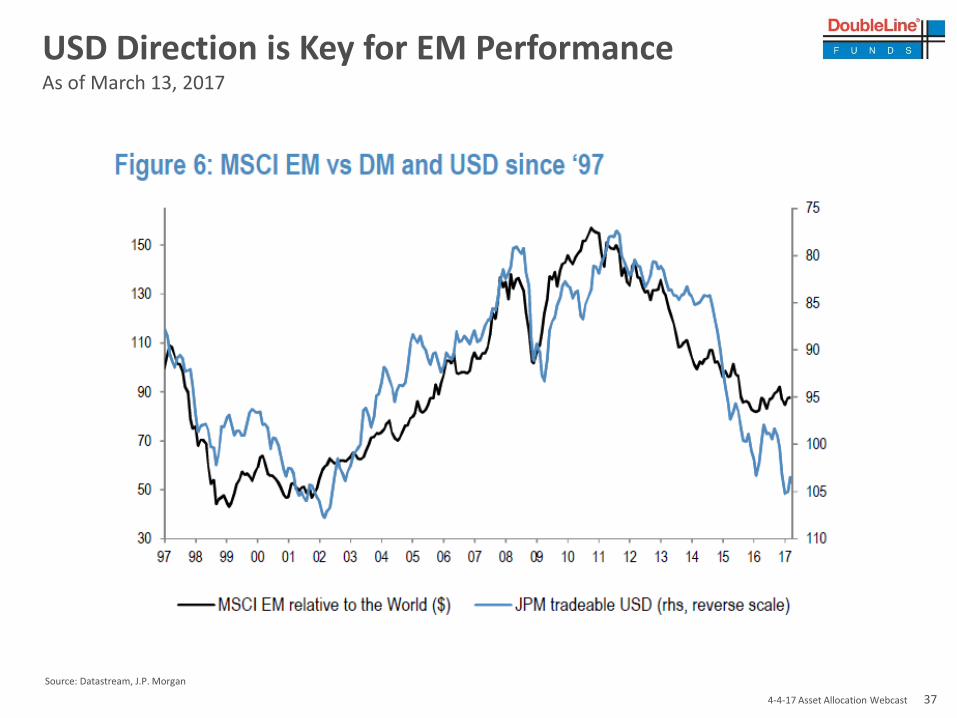
USD Direction is Key for EM PerformanceAs of March 13, 2017
Source: Datastream, J.P. Morgan

4-4-17 Asset Allocation Webcast 38
LIBORFebruary 27, 2015 to April 4, 2017
Source: BloombergICE LIBOR = London Interbank Offered rate administered by ICE Benchmark Administration Fixing for U.S. Dollar. The fixing is conducted each date at 11 am. It’s an average derived from the quotations provided by the banks determined by the ICE Benchmark Administration. You cannot invest directly in an index.
4-4-17 Asset Allocation Webcast 39
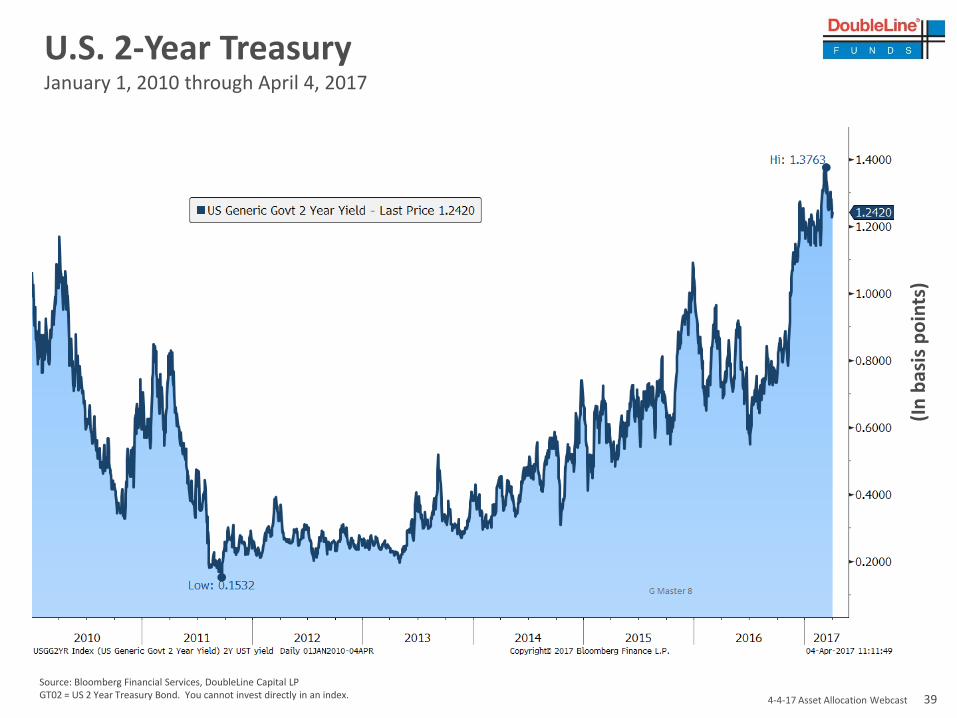
U.S. 2-Year TreasuryJanuary 1, 2010 through April 4, 2017
Source: Bloomberg Financial Services, DoubleLine Capital LPGT02 = US 2 Year Treasury Bond. You cannot invest directly in an index.
(In
bas
is p
oin
ts)

4-4-17 Asset Allocation Webcast 40Source: Bloomberg Financial Services, DoubleLine Capital LPGT5 = US 5 Year Treasury Bond. You cannot invest directly in an index.
U.S. 5-Year TreasuryJanuary 1, 2010 through April 4, 2017

4-4-17 Asset Allocation Webcast 41
Source: Bloomberg Financial Services, DoubleLine Capital LPGT10 = US 10 Year Treasury Bond. You cannot invest directly in an index.
U.S. 10-Year TreasuryJanuary 1, 2010 through April 4, 2017

4-4-17 Asset Allocation Webcast 42
Fed Rate Hike = Rates DownAs of March 29, 2017
Source: Bloomberg

4-4-17 Asset Allocation Webcast 43
CFTC Treasury Speculative Positioning (All)March 5, 2007 to March 28, 2017
Source: BloombergCFTC = Commitment of Traders Report. You cannot invest directly in an index.

4-4-17 Asset Allocation Webcast 44
10y UST – G7 Yield SpreadAs of March 24, 2017
Source: Bloomberg; DoubleLineG7 is Germany, France, UK, Canada, Japan, Italy
-2
-1.5
-1
-0.5
0
0.5
1
1.5
2
10y UST-G7 Spread
UST-AVG Avg. +/- StDev +/- 2 StDev

4-4-17 Asset Allocation Webcast 45
Copper/Gold Ratio and 10-Year U.S. Treasury Yield December 31, 2010 to April 4, 2017
Source: BloombergUSGG10Yr Index = 10-year U.S. treasury index. HG = Copper futures contract/GC = Gold futures contraqct. You cannot invest directly in an index.

4-4-17 Asset Allocation Webcast 46
10 Year U.S. Breakevens Vs. CopperDecember 31, 2015 through March 28, 2017
Source: Bloomberg, DoubleLineLHS = Left Hand Side, RHS = Right Hand Side
3600
4100
4600
5100
5600
6100
6600
1.0%
1.2%
1.4%
1.6%
1.8%
2.0%
2.2%
Co
pp
er
Spo
t P
rice
10
Ye
ar U
S B
reak
eve
n
10 Year US Breakeven (LHS)
Copper Spot Price (RHS)

4-4-17 Asset Allocation Webcast 47
Source: Bloomberg Financial Services, DoubleLine Capital LPGT30 = US 30 Year Treasury Bond. You cannot invest directly in an index.
U.S. 30-Year TreasuryJanuary 1, 2010 to April 4, 2017

4-4-17 Asset Allocation Webcast 48
High Yield OAS vs Investment Grade OASFebruary 23, 2012 to February 23, 2017
Source: Bloomberg, BAML OAS = Option adjusted spread. One cannot invest directly in an index.Investment Grade = A level of credit rating for stocks regarded as carrying a minimal risk to investors. Ratings are based on corporate bond model. The higher the rating the more likely the bond will pay back par/100 cents on the dollar.Please see index definition in the back of this presentation.
0
100
200
300
400
500
600
700
800
900
1000
Spre
ad (
Bas
is P
oin
ts)
BAML High Yield Index Spread
BAML Investment Grade Index Spread
4-4-17 Asset Allocation Webcast 49
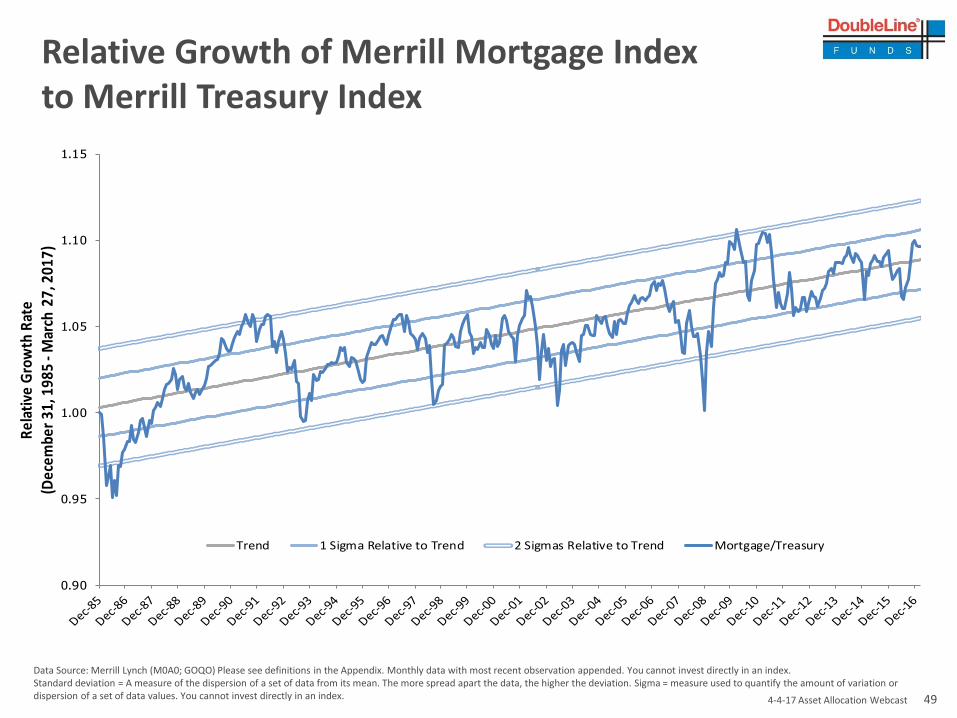
Relative Growth of Merrill Mortgage Index to Merrill Treasury Index
Data Source: Merrill Lynch (M0A0; GOQO) Please see definitions in the Appendix. Monthly data with most recent observation appended. You cannot invest directly in an index.Standard deviation = A measure of the dispersion of a set of data from its mean. The more spread apart the data, the higher the deviation. Sigma = measure used to quantify the amount of variation or dispersion of a set of data values. You cannot invest directly in an index.
0.90
0.95
1.00
1.05
1.10
1.15
Rel
ativ
e G
row
th R
ate
(Dec
embe
r 31
, 198
5 -M
arch
27,
201
7)
Trend 1 Sigma Relative to Trend 2 Sigmas Relative to Trend Mortgage/Treasury
4-4-17 Asset Allocation Webcast 50
0.50
0.60
0.70
0.80
0.90
1.00
1.10
1.20
1.30
1.40
1.50
Re
lati
ve G
row
th R
ate
(D
ece
mb
er
31
, 19
97
-M
arch
27
, 20
17
)
Trend 1 Sigma Relative to Trend 2 Sigmas Relative to Trend CMBS/Treasury
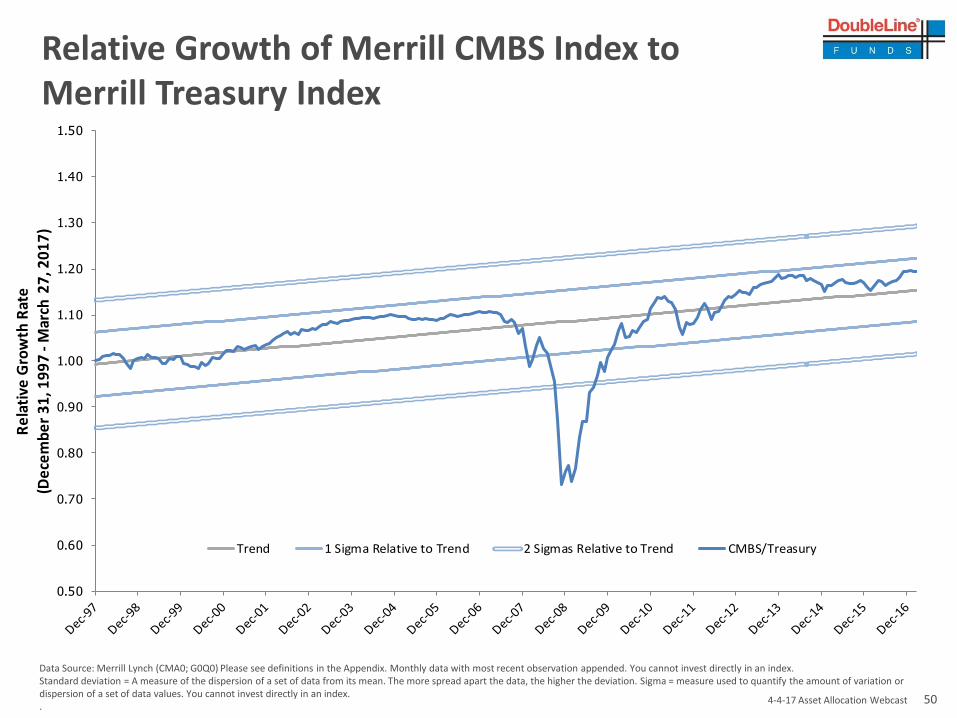
Relative Growth of Merrill CMBS Index toMerrill Treasury Index
Data Source: Merrill Lynch (CMA0; G0Q0) Please see definitions in the Appendix. Monthly data with most recent observation appended. You cannot invest directly in an index.Standard deviation = A measure of the dispersion of a set of data from its mean. The more spread apart the data, the higher the deviation. Sigma = measure used to quantify the amount of variation or dispersion of a set of data values. You cannot invest directly in an index..
4-4-17 Asset Allocation Webcast 51
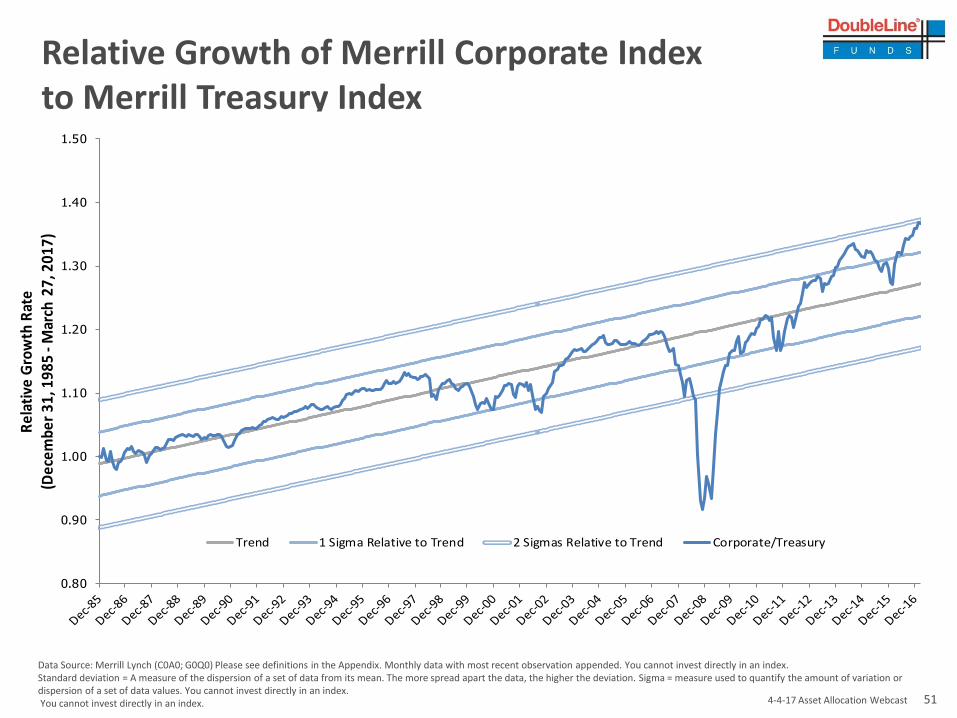
Relative Growth of Merrill Corporate Index to Merrill Treasury Index
Data Source: Merrill Lynch (C0A0; G0Q0) Please see definitions in the Appendix. Monthly data with most recent observation appended. You cannot invest directly in an index.Standard deviation = A measure of the dispersion of a set of data from its mean. The more spread apart the data, the higher the deviation. Sigma = measure used to quantify the amount of variation or dispersion of a set of data values. You cannot invest directly in an index.You cannot invest directly in an index.
0.80
0.90
1.00
1.10
1.20
1.30
1.40
1.50
Rel
ativ
e G
row
th R
ate
(Dec
embe
r 31
, 198
5 -M
arch
27,
201
7)
Trend 1 Sigma Relative to Trend 2 Sigmas Relative to Trend Corporate/Treasury
4-4-17 Asset Allocation Webcast 52
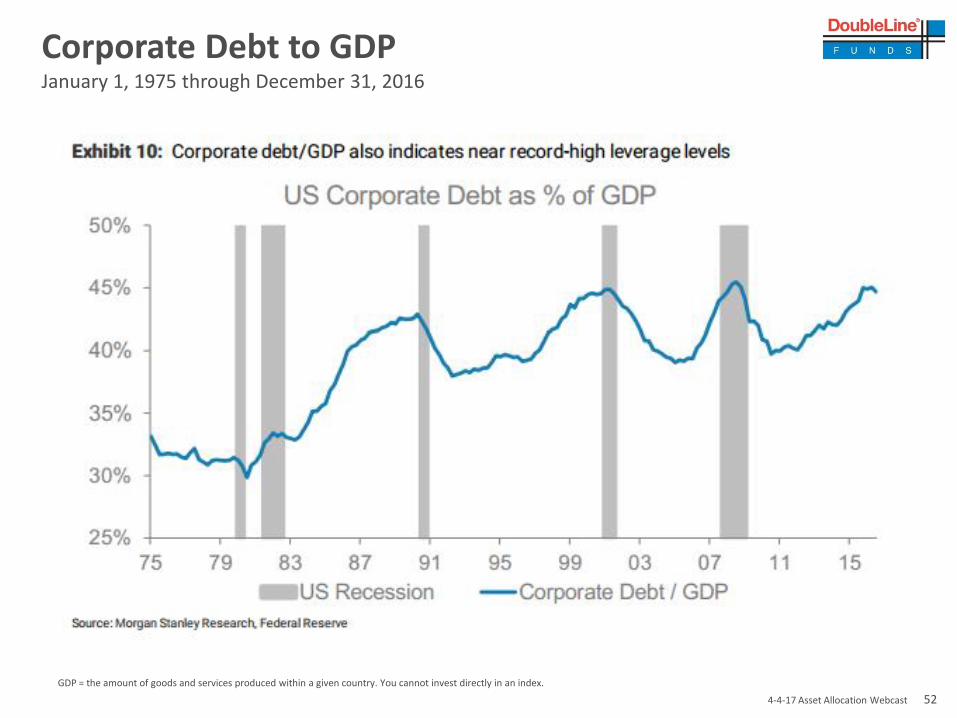
Corporate Debt to GDPJanuary 1, 1975 through December 31, 2016
GDP = the amount of goods and services produced within a given country. You cannot invest directly in an index.

4-4-17 Asset Allocation Webcast 53
Relative Growth of Merrill High Yield Cash Pay Index to Merrill 15+ Year Treasuries Index
Data Source: Merrill Lynch (J0A0; G802) Please see definitions in the Appendix. Monthly data with most recent observation appended. You cannot invest directly in an index.Standard deviation = A measure of the dispersion of a set of data from its mean. The more spread apart the data, the higher the deviation. Sigma = measure used to quantify the amount of variation or dispersion of a set of data values. You cannot invest directly in an index.. You cannot invest directly in an index.
0.50
0.60
0.70
0.80
0.90
1.00
1.10
1.20
1.30
Re
lati
ve G
row
th R
ate
(D
ece
mb
er
31
, 19
85
-M
arch
27
, 20
17
)
Trend 1 Sigma Relative to Trend 2 Sigmas Relative to Trend High Yield/Treasury
4-4-17 Asset Allocation Webcast 54
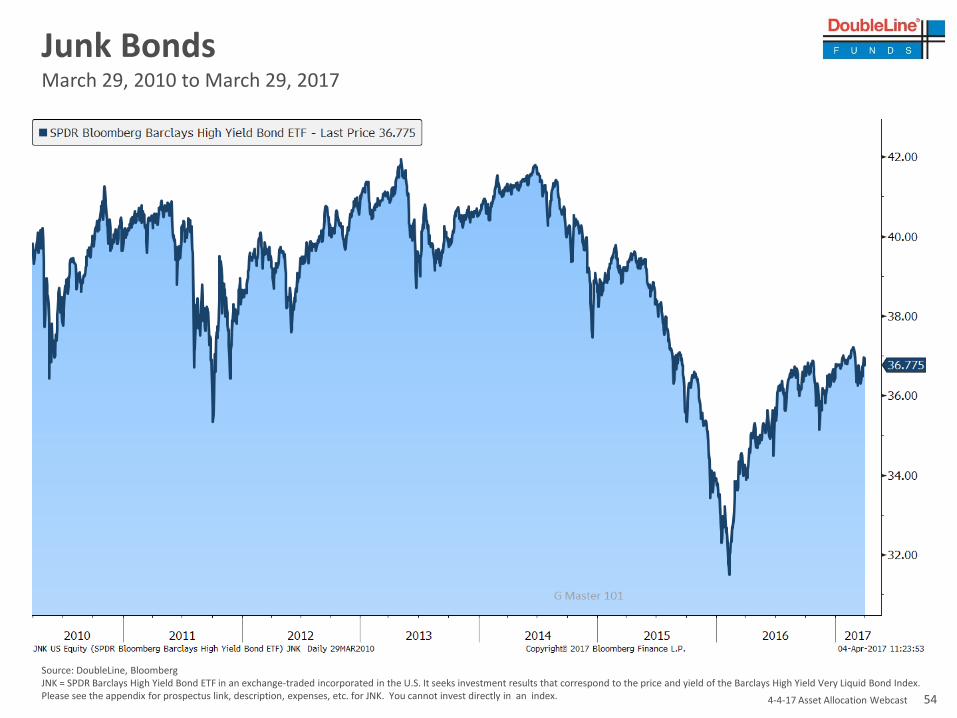
Junk Bonds March 29, 2010 to March 29, 2017
Source: DoubleLine, BloombergJNK = SPDR Barclays High Yield Bond ETF in an exchange-traded incorporated in the U.S. It seeks investment results that correspond to the price and yield of the Barclays High Yield Very Liquid Bond Index. Please see the appendix for prospectus link, description, expenses, etc. for JNK. You cannot invest directly in an index.

4-4-17 Asset Allocation Webcast 55
U.S. Corporate BB Effective Convexity December 31, 1996 to March 31, 2017
• The convexity of High Yield BB went negative for the fist time in September 2016.
Source: Bloomberg, DoubleLineHOA1 = BofA Merrill Lynch BB US High Yield Index is a subset of the BofA Merrill Lynch High Yield Index including all securities rated BB1 through BB3, inclusively. It tracks the performance of US dollar denominated below investment grade corporate debt. You cannot invest directly in an index.

4-4-17 Asset Allocation Webcast 56
0.00
0.50
1.00
1.50
2.00
2.50
3.00
3.50
4.00
Re
lati
ve G
row
th R
ate
(D
ece
mb
er
31
, 19
91
-M
arch
27
, 20
17
)
Trend 1 Sigma Relative to Trend 2 Sigmas Relative to Trend Emerging Market/Treasury
Relative Growth of Merrill Emerging Market Index to Merrill Treasury Index
Data Source: Merrill Lynch (IGOV; GOQO) Please see definitions in the Appendix. Monthly data with most recent observation appended. You cannot invest directly in an index.Standard deviation = A measure of the dispersion of a set of data from its mean. The more spread apart the data, the higher the deviation. Sigma = Sigma = measure used to quantify the amount of variation or dispersion of a set of data values. You cannot invest directly in an index.

4-4-17 Asset Allocation Webcast 57
DoubleLine Funds Overview
TAB III

4-4-17 Asset Allocation Webcast 58
Core Fixed Income Fund Portfolio Statistics
Portfolio statistics as of February 28, 2017 based on market weighted averages. Subject to change without notice.Average price = A measure of the weighted average price paid for the securities calculated by taking the prices and dividing by the number of securities and does not include cash. Average price should not be confused with net asset value.Average Duration = Duration is used as a risk measure. It measures the price volatility of a security given a change in interest rate movements. Average Life = The average number of years that each dollar of unpaid principal due on the mortgage remains outstanding. Average life is computed as the weighted average time to the receipt of all future cash flows, using as the weights the dollar amounts of the principal paydowns.Source: DoubleLine Capital LP
Core Fixed Income Fund
Barclays Capital U.S Aggregate Index
Average Price $102.58 $103.03
Duration 5.03 5.95
Average Life 7.10 8.25

4-4-17 Asset Allocation Webcast 59
Portfolio composition as of February 28, 2017. Subject to change without notice. * Excludes U.S. Treasuries.Bank Loans = A debt financing obligation issued by a bank or similar financial institution to a company.Commercial Mortgage-Backed Securities (CMBS) = Commercial Mortgage-Backed Securities. Securitized loans made on commercial rather than residential property. Collateralized Loan Obligations (CLOs) = A form of securitization where payments from multiple middle sized and large business loans are pooled together and passed on to different classed of owners in various tranches. Cash = Cash holding include the value of assets that can be converted into cash immediately. Can include marketable securities, such as government bonds, banker's acceptances, cash equivalents on balance sheets that may include securities that mature within 90 days. Government = Government debt (also known as public debt or national debt) is money (or credit) owed by any level of government; either central government, federal government, municipal government or local government. Mortgage-Backed Securities (MBS)= A mortgage-backed security (MBS) is an asset-backed security or debt obligation that represents a claim on the cash flows from mortgage loans, most commonly on residential property. Emerging Markets Fixed Income = Emerging market debt (EMD) is a term used to encompass bonds issued by less developed countries.Investment Grade (IG) and High Yield Corporates (HY) = Investment grade and non-investment grade corporate credit. Bonds issued by corporations to raise money in order to expand its business. Credit distribution is determined from the highest available credit rating from any Nationally Recognized Statistical Rating Organization (S&P, Moody’s, and Fitch). A bond rated BBB or higher would be considered Investment Grade. Any bond rated BBB or below would be High Yield.Source: DoubleLine Capital LP. Sector allocations are subject to change and should not be considered a recommendation to buy or sell any security.
Core Fixed Income Fund Portfolio Composition
Cash3.7%
Govt26.6%
MUNI0.3%
MBS23.8%
EM8.1%
IG Corporate13.0%
CMBS7.6%
Bank Loan2.5%
HY Corporate2.1%
Infrastructure3.5%
Global*3.3% ABS
1.8%
CLO3.6%
4-4-17 Asset Allocation Webcast 60
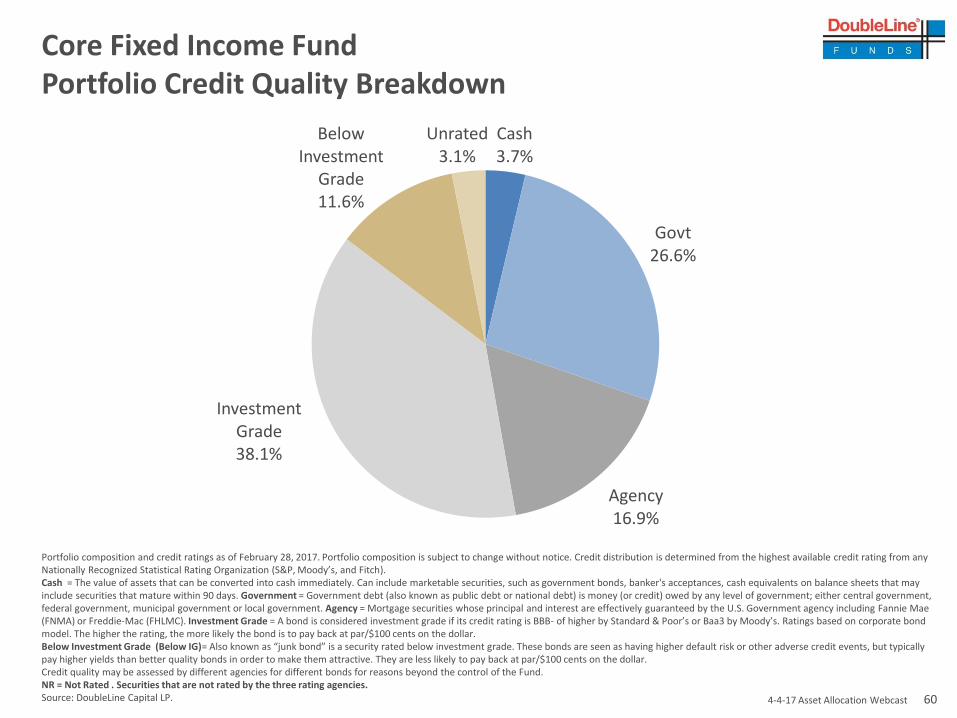
Portfolio composition and credit ratings as of February 28, 2017. Portfolio composition is subject to change without notice. Credit distribution is determined from the highest available credit rating from any Nationally Recognized Statistical Rating Organization (S&P, Moody’s, and Fitch).Cash = The value of assets that can be converted into cash immediately. Can include marketable securities, such as government bonds, banker's acceptances, cash equivalents on balance sheets that may include securities that mature within 90 days. Government = Government debt (also known as public debt or national debt) is money (or credit) owed by any level of government; either central government, federal government, municipal government or local government. Agency = Mortgage securities whose principal and interest are effectively guaranteed by the U.S. Government agency including Fannie Mae(FNMA) or Freddie-Mac (FHLMC). Investment Grade = A bond is considered investment grade if its credit rating is BBB- of higher by Standard & Poor’s or Baa3 by Moody’s. Ratings based on corporate bond model. The higher the rating, the more likely the bond is to pay back at par/$100 cents on the dollar.Below Investment Grade (Below IG)= Also known as “junk bond” is a security rated below investment grade. These bonds are seen as having higher default risk or other adverse credit events, but typically pay higher yields than better quality bonds in order to make them attractive. They are less likely to pay back at par/$100 cents on the dollar.Credit quality may be assessed by different agencies for different bonds for reasons beyond the control of the Fund. NR = Not Rated . Securities that are not rated by the three rating agencies.Source: DoubleLine Capital LP.
Core Fixed Income Fund Portfolio Credit Quality Breakdown
Cash3.7%
Govt26.6%
Agency16.9%
Investment Grade38.1%
Below Investment
Grade11.6%
Unrated3.1%

4-4-17 Asset Allocation Webcast 61
Portfolio statistics as of February 28, 2017 based on market weighted averages. Subject to change without notice.Average price = A measure of the weighted average price paid for the securities calculated by taking the prices and dividing by the number of securities and does not include cash. Average price should not be confused with net asset value.Average Duration = Duration is used as a risk measure. It measures the price volatility of a security given a change in interest rate movements.Average Life = The average number of years that each dollar of unpaid principal due on the mortgage remains outstanding. Average life is computed as the weighted average time to the receipt of all future cash flows, using as the weights the dollar amounts of the principal paydowns.Source: DoubleLine Capital LP
Flexible Income Fund Portfolio Statistics
Flexible Income Fund
Barclays Capital U.S. Aggregate Index
Average Price $100.01 $103.03
Duration 1.87 5.95
Average Life 4.77 8.25
4-4-17 Asset Allocation Webcast 62
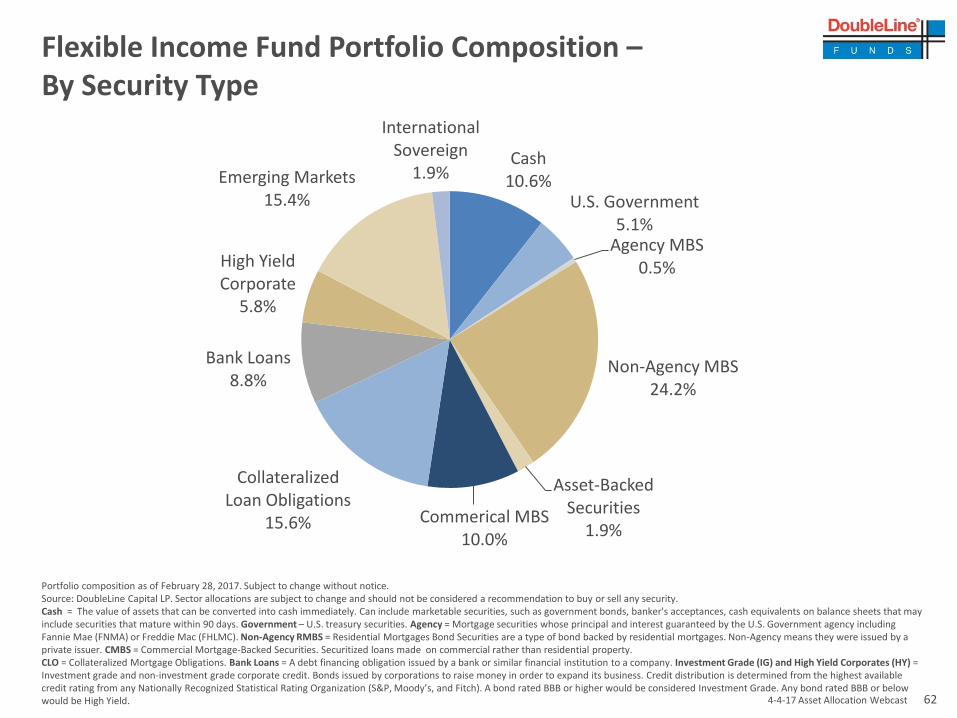
Portfolio composition as of February 28, 2017. Subject to change without notice.Source: DoubleLine Capital LP. Sector allocations are subject to change and should not be considered a recommendation to buy or sell any security.Cash = The value of assets that can be converted into cash immediately. Can include marketable securities, such as government bonds, banker's acceptances, cash equivalents on balance sheets that may include securities that mature within 90 days. Government – U.S. treasury securities. Agency = Mortgage securities whose principal and interest guaranteed by the U.S. Government agency including Fannie Mae (FNMA) or Freddie Mac (FHLMC). Non-Agency RMBS = Residential Mortgages Bond Securities are a type of bond backed by residential mortgages. Non-Agency means they were issued by a private issuer. CMBS = Commercial Mortgage-Backed Securities. Securitized loans made on commercial rather than residential property.CLO = Collateralized Mortgage Obligations. Bank Loans = A debt financing obligation issued by a bank or similar financial institution to a company. Investment Grade (IG) and High Yield Corporates (HY) = Investment grade and non-investment grade corporate credit. Bonds issued by corporations to raise money in order to expand its business. Credit distribution is determined from the highest available credit rating from any Nationally Recognized Statistical Rating Organization (S&P, Moody’s, and Fitch). A bond rated BBB or higher would be considered Investment Grade. Any bond rated BBB or below would be High Yield.
Flexible Income Fund Portfolio Composition –By Security Type
Cash10.6%
U.S. Government5.1%
Agency MBS0.5%
Non-Agency MBS24.2%
Asset-Backed Securities
1.9%Commerical MBS
10.0%
Collateralized Loan Obligations
15.6%
Bank Loans8.8%
High Yield Corporate
5.8%
Emerging Markets15.4%
International Sovereign
1.9%
4-4-17 Asset Allocation Webcast 63
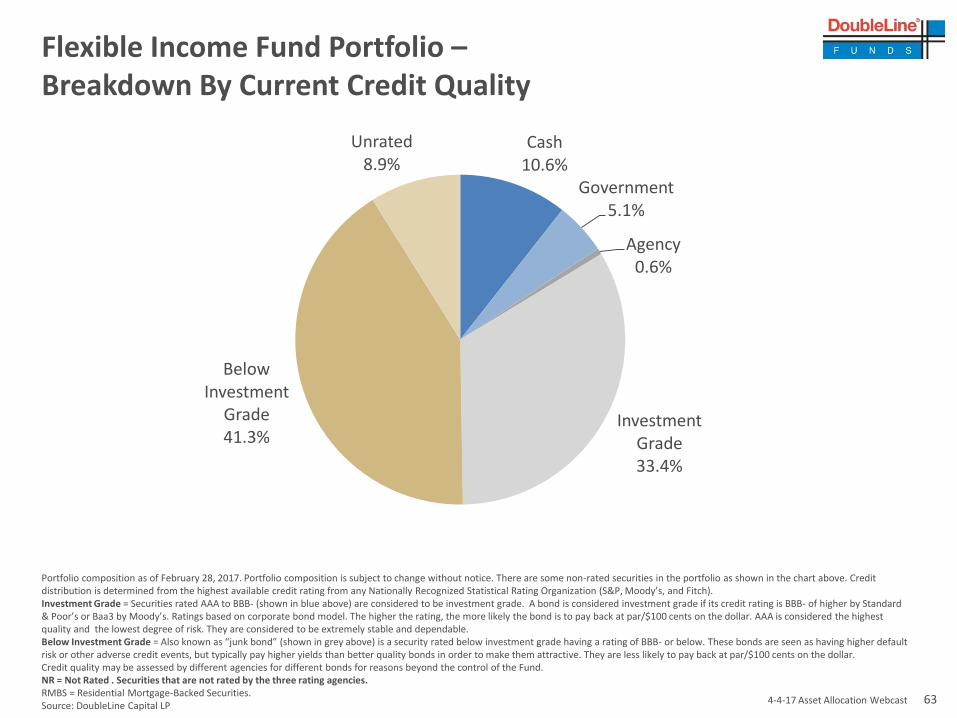
Flexible Income Fund Portfolio –Breakdown By Current Credit Quality
Portfolio composition as of February 28, 2017. Portfolio composition is subject to change without notice. There are some non-rated securities in the portfolio as shown in the chart above. Credit distribution is determined from the highest available credit rating from any Nationally Recognized Statistical Rating Organization (S&P, Moody’s, and Fitch).Investment Grade = Securities rated AAA to BBB- (shown in blue above) are considered to be investment grade. A bond is considered investment grade if its credit rating is BBB- of higher by Standard & Poor’s or Baa3 by Moody’s. Ratings based on corporate bond model. The higher the rating, the more likely the bond is to pay back at par/$100 cents on the dollar. AAA is considered the highest quality and the lowest degree of risk. They are considered to be extremely stable and dependable.Below Investment Grade = Also known as “junk bond” (shown in grey above) is a security rated below investment grade having a rating of BBB- or below. These bonds are seen as having higher default risk or other adverse credit events, but typically pay higher yields than better quality bonds in order to make them attractive. They are less likely to pay back at par/$100 cents on the dollar.Credit quality may be assessed by different agencies for different bonds for reasons beyond the control of the Fund. NR = Not Rated . Securities that are not rated by the three rating agencies.RMBS = Residential Mortgage-Backed Securities.Source: DoubleLine Capital LP
Cash10.6%
Government5.1%
Agency0.6%
Investment Grade33.4%
Below Investment
Grade41.3%
Unrated8.9%

4-4-17 Asset Allocation Webcast 64
Appendix
TAB IV

333 S. Grand Ave., 18th Floor || Los Angeles, CA 90071 || 213.633.8200
Live Webcast hosted by:
Jeffrey Gundlach
Chief Executive Officer
April 4, 2017
Asset Allocation Webcast

4-4-17 Asset Allocation Webcast 66
SPDR Barclays High Yield Bond ETF(JNK)
Investment Objective & SummaryThe investment objective of the SPDR Barclays High Yield Bond ETF seeks to provide investment results that, before fees and expenses, corresponds generally to the price and yield performance of the Barclays High Yield Very Liquid Index. The ETF invests in U.S. high yield bonds.
The Barclays High Yield Very Liquid Index is designed to measure the performance of publicly issued U.S. dollar denominated high yield corporate bonds with above-average liquidity. High yield securities are generally rated below investment grade and are commonly referred to as "junk bonds." The Index includes publicly issued U.S. dollar denominated, non-investment grade, fixed-rate, taxable corporate bonds that have a remaining maturity of at least one year, regardless of optionality, are rated high-yield (Ba1/BB+/BB+ or below) using the middle rating of Moody's Investors Service, Inc., Fitch Inc., or Standard & Poor's, Inc. Respectively, and have $500 million or more of outstanding face value
Important Risk Information - In general, ETFs can be expected to move up or down in value with the value of the applicable index. Although ETF shares may be bought and sold on the exchange through any brokerage account, ETF shares are not individually redeemable from the Fund. Investors may acquire ETFs and tender them for redemption through the Fund in Creation Unit Aggregations only. Please see the prospectus for more details.Bond funds contain interest rate risk (as interest rates rise bond prices usually fall); the risk of issuer default; issuer credit risk; liquidity risk; and inflation risk.Investing in high yield fixed income securities, otherwise known as "junk bonds" is considered speculative and involves greater risk of loss of principal and interest than investing in investment grade fixed income securities. These lower-quality debt securities involve greater risk of default or price change due to potential changes in the credit quality of the issuer.The Fund invests by sampling the Index, holding a range of securities that, in the aggregate, approximates the full Index in terms of key risk factors and other characteristics which may cause the fund to experience tracking errors relative to performance of the Index.Distributor: State Street Global Markets, LLC, member FINRA, SIPC, a wholly owned subsidiary of State Street Corporation. References to State Street may include State Street Corporation and its affiliates. Certain State Street affiliates provide services and receive fees from the SPDR ETFs.
Before investing, consider the funds' investment objectives, risks, charges and expenses. To obtain a prospectus or summary prospectus which contains this and other information, call 1-866-787-2257 or talk to your financial advisor. Read it carefully before investing.JNK is distributed by State Street Global Markets, LLC
4-4-17 Asset Allocation Webcast 67
Index Descriptions
Barclays Capital US Aggregate Index - The Barclays Capital US Aggregate Index represents securities that are SEC-registered, taxable, and dollar denominated. The index covers the US investment grade fixed rate bond market, with index components for government and corporate securities, mortgage pass-through securities, and asset-backed securities. These major sectors are subdivided into more specific indices that are calculated and reported on a regular basis.Barclays Capital European Aggregate Total Return Index - The Barclays Capital European Aggregate Total Return Index is a fixed-rate, rules-based index includes all dated investment grade securities (treasuries, agencies, securitized, corporates, sovereigns and supranationals) denominated in euros and with a final maturity of one year or greater.Barclays Capital US Treasury Index - This index is the US Treasury component of the US Government index. Public obligations of the US Treasury with a remaining maturity of one year or more.Barclays Capital US Treasury 10 Year Index - This index is the 10 year component of the US Government index.Barclays Capital Capital US Treasury 30 Year Index - This index is the 30 year component of the US Government index.Barclays Capital US High Yield Index - The Barclays Capital US High Yield Index covers the universe of fixed rate, non-investment grade debt. Eurobonds and debt issuer from countries designated as emerging markets (e.g. Argentina, Brazil, Venezuela, etc.) are excluded, but Canadian and global bonds (SEC registered) of issuers in non-EMG countries are included. Original issue zereos, step-up coupon structures, 144-As and pay-in-kind (PIK, as of October 1, 2009) are also included.BofA Merrill Lynch US Government Index (GOAO) - The Merrill Lynch US Government Index tracks the performance of US government (i.e. securities in the Treasury and Agency indices.)BofA Merrill Lynch US 15+ Year Treasury Index “Long Treasuries” (G802)- This index is a subset of the BofA Merrill Lynch US Treasury Index including all securities with a remaining term of final maturity greater than 15 years..BofA Merrill Lynch US Corporate Index (COAO) “Investment Grade”- The Merrill Lynch Corporate Index tracks the performance of US dollar denominated investment grade corporate debt publicly issued in the US domestic market. Qualifying securities must have an investment grade rating (based on an average of Moody’s, S&P and Fitch) and an investment grade rated country of risk (based on an average of Moody’s, S&P and Fitch foreign currency long term sovereign debt ratings). Securities must have at least one year remaining term to final maturity, a fixed coupon schedule and a minimum amount outstanding of $250MM.BofA Merrill Lynch US All Convertibles Index (VOSO) - The Merrill Lynch All Convertible Index is a rule driven index. which includes all bonds and preferred stocks of U.S.-registered companies, which have $50 million or more in aggregate market value and are convertibles in U.S. dollar-denominated common stocks, ADRs or cash equivalents. Please note an investor cannot invest directly in an index.CRB Commodity Index (CRY)- An unweighted geometric average of some important commodities. It averages prices across 17 commodities and across time. The index tracks energy, grains, industrials, livestock, precious metals, and agriculturals.S&P 500 (SPX)- S&P 500 is a free-float capitalization-weighted index published since 1957 of the prices of 500 large-cap common stocks actively traded in the United States.Standard Deviation – Sigma = standard deviation. It shows how much variation there is from the “average” (mean, or expected/budgeted value). A low standard deviation indicated that the data point tend to be very close to the mean, whereas high standard deviation indicated that the date is spread out over a large range of values.Dow Jones – UBS DJ Commodity Index - The Dow Jones UBS – Commodity index is composed of commodities traded on U.S. exchanges, with the exception of aluminum, nickel and zinc, which trade on the London Metal Exchange (LME).“Copper”= Copper Spot Price (HGI) Copper is the world’s third most used metal behind iron and aluminum primarily used in highly cyclical industries including construction and industrial machinery manufacturing. Spot price quoted in USD/lb.“Gold”= Gold Spot Price (Golds) The Gold Spot price is quoted as US Dollar per Troy Ounce.Crude Oil= Crude oil varies greatly in appearance depending on its composition. West Texas intermediate (WTI )= Texas light sweet crude is used as a benchmark in oil pricing. It’s “light” because of the low density and sweet because of low sulfur. Brent crude = Is a major trading classification of sweet light crude. Brent is the oil maker also known as Brent Blend.Volatility Index (VIX) -The VIX shows the market's expectation of 30-day volatility. It is constructed using the implied volatilities of a wide range of S&P 500 index options. This volatility is meant to be forward looking and is calculated from both calls and puts. The VIX is a widely used measure of market risk and is often referred to as the "investor fear gauge.”BofA Merrill Lynch U.S. Commercial Mortgage-Backed Securities Index (CMA0) - The BofA Merrill Lynch US Fixed Rate CMBS Index tracks the performance of US dollar denominated investment grade fixed rate commercial mortgage backed securities publicly issued in the US domestic market. Qualifying securities must have an investment grade rating (based on an average of Moody’s, S&P and Fitch), a fixed coupon schedule, at least one year remaining term to final maturity and at least one month to the last expected cash flow.

4-4-17 Asset Allocation Webcast 68
Index DescriptionsBofA Merrill Lynch US Dollar Emerging Markets Sovereign Plus Index (IGOV) - This index tracks the performance of US dollar denominated emerging market and cross-over sovereign debt publicly issued in the eurobond or US domestic market. Qualifying countries must have a BB1 or lower foreign currency long-term sovereign debt rating (based on an average of Moody’s, S&P, and Fitch).BofA Merrill Lynch U.S. High Yield Cash Pay Index (J0A0) “Below Investment Grade”- The Merrill Lynch High Yield Index tracks the performance of US dollar denominated below investment grade corporate debt, currently in a coupon paying period, that is publicly issued in the US domestic market. Qualifying securities must have a below investment grade rating (based on an average of Moody’s, S&P and Firth foreign currency long term sovereign debt ratings). Must have one year remaining to final maturity and a minimum outstanding amount of $100MM.BofA Merrill Lynch International Government Index (NOGO) - The Merrill Lynch International Index tracks the performance of Australia, Canadian, French, German, Japan, Dutch, Swiss and UK investment grade sovereign debt publicly issued and denominated in the issuer’s own domestic market and currency. Qualifying securities must have at least one year remaining term to final maturity, a fixed coupon schedule and a minimum amount outstanding.BofA Merrill Lynch Mortgage-Backed Securities Index (MOA0) - This index tracks the performance of US dollar denominated fixed rate and hybrid residential mortgage pass-through securities publicly issued by US agencies in the US domestic market. 30-year, 20-year, 15-year and interest only fixed rate mortgage pools are included in the Index provided they have at least one year remaining term to final maturity and a minimum amount outstanding of at least $5 billion per generic coupon and $250MM per production year within each generic coupon.BofA Merrill Lynch U.S. Municipal Securities Index (UOA0) - This index tracks the performance of US dollar denominated investment grade tax-exempt debt publicly issued by US states and territories, and their political subdivisions, in the US domestic market. Qualifying securities must have at least one year remaining term to final maturity, a fixed coupon schedule and an investment grade rating (based on Moody’s, S&P and Fitch). Minimum size vary based on the initial term to final maturity at time of issuance.Barclays Capital Global Emerging Markets Index - The Barclays Capital Global Emerging Markets Index represents the union of the USD-denominated US Emerging Markets index and the predominately EUR-denominated Pan Euro Emerging Markets Index, covering emerging markets in the following regions: Americas, Europe, Middle East, Africa, and Asia. As with other fixed income benchmarks provided by Barclays Capital, the index is rules-based, which allows for an unbiased view of the marketplace and easy replicability.JP Morgan Investment Grade Corporate Index - JP Morgan Investment Grade Corporate Index includes performance of US dollar denominated investment grade corporate debt publicly issued in the US domestic market. Qualifying securities must have an investment grade rating (based on an average of Moody’s, S&P and Fitch) and an investment grade rated country of risk (based on an average of Moody’s, S&P and Fitch foreign currency long term sovereign debt ratings). Securities must have at least one year remaining term to final maturity, a fixed coupon schedule and a minimum amount outstanding of $250MM.Draw Down - The peak-to-trough decline during a specific record period of an investment, fund or commodity. A drawdown is usually quoted as the percentage between the peak and the trough. NAV – A mutual fund's price per share or exchange-traded fund's (ETF) per-share value. In both cases, the per-share dollar amount of the fund is calculated by dividing the total value of all the securities in its portfolio, less any liabilities, by the number of fund shares outstanding. CMO – A type of mortgage-backed security that creates separate pools of pass-through rates for different classes of bondholders with varying maturities, called tranches. The repayments from the pool of pass-through securities are used to retire the bonds in the order specified by the bonds' prospectusTIPS– Treasury Inflation Protection. A treasury security that is indexed to inflation in order to protect investors from the negative effects of inflation. TIPS are considered an extremely low-risk investment since they are backed by the U.S. government and since their par value rises with inflation, as measured by the Consumer Price Index, while their interest rate remains fixed.CPI– Consumer Price Index. A measure that examines the weighted average of prices of a basket of consumer goods and services, such as transportation, food and medical care.Cash Flow – Cash flow measures the cash generating capability of a company by adding non-cash charges (e.g. depreciation) and interest expense to pretax income.BofA/Merrill Lynch High Yield Cash Pay CCC –rated Index (JOA3) – .A component of the BofA/Merrill Lynch High Yield Cash Pay Index concentrating on CCC rated High Yield credit only. BofA/Merrill Lynch High Yield Cash Pay BB–rated Index (JOA1) – .A component of the BofA/Merrill Lynch High Yield Cash Pay Index concentrating on BB rated High Yield credit only.BofA/Merrill Lynch High Yield Cash Pay B–rated Index (JOA2) – .A component of the BofA/Merrill Lynch High Yield Cash Pay Index concentrating on B rated High Yield credit only.BofA/Merrill Lynch Credit Index BBB-rated Index (COA4) – .A component of the BofA/Merrill Lynch Credit Index concentrating on the lower rated BBB investment grade credits.BofA/Merrill Lynch Credit Index A–rated Index (COA3) – . A component of the BofA/Merrill Lynch Credit Index concentrating on the A rated investment grade credits.BAML High Yield Index - An index that tracks the performance of U.S. dollar denominated below investment grade corporate debt, currently in a coupon paying period, that is publicly issued in the U.S. domestic market. Qualifying securities must have a below investment grade rating (based on an average of Moody’s, S&P and Firth foreign currency long term sovereign debt ratings). Must have one year remaining to final maturity and a minimum outstanding amount of $100MM.BAML Investment Grade Index - An index that tracks the performance of U.S. dollar denominated below investment grade corporate debt, currently in a coupon paying period, that is publicly issued in the U.S. domestic market. Qualifying securities must have a below investment grade rating (based on an average of Moody’s, S&P and Firth foreign currency long term sovereign debt ratings). Must have one year remaining to final maturity and a minimum outstanding amount of $100MM.
4-4-17 Asset Allocation Webcast 69
Index Descriptions
BofA/Merrill Lynch Credit Index AAA –rated Index (COA1) – . A component of the BofA/Merrill Lynch Credit Index concentrating on the highest rated AAA investment grade credits.BofA Merrill Lynch US Treasury Index (G0Q0) -The Merrill Lynch US Treasury Index tracks the performance of US dollar denominated sovereign debt publicly issued by the US government in its domestic market. Qualifying securities must have at least one year remaining term to final maturity, a fixed coupon schedule and a minimum amount outstanding of $1 billion.BofA/Merrill Lynch 1-3 Year Treasury Index (G1O2) – is a subset of the BofA Merrill Lunch US Reasury Index including all securities with a remaining term to final maturity less than 3 years. The BofAMerrill Lynch US Treasury Index tracks the performance of US dollar denominated sovereign debt publicly issued by the US government in its domestic market.BofA Merrill Lynch US 10-15 Year Treasury Index “Long Treasury” (G7O2) -The Merrill Lynch US 10-15 Treasury Index tracks the performance of US dollar denominated 10-15 year sovereign debt publicly issued by the US government in its domestic market. It is a subset of the BofA Merrill Lynch U.S. Treasury Index (GOQO).BofA Merrill Lynch Municipal Index-The Merrill Lynch Municipal BofA Merrill Lynch Current 10 year UST Index –- This index is the 10 year component of the US Government index.BofA Merrill Lynch Current 30 year UST Index –- This index is the 30 year component of the US Government index.JPMorgan Corporate EMBI Broad Diversified Index (JBCDCOMP) – This index tracks the performance of investment grade corporate debt publically issued across a range of emerging market countries.Shanghai Index - The Shanghai Stock Exchange Composite is a capitalization-weighted index tracking daily price performance of all A and B-shares listed on the Shanghai Stock Exchange. This index was developed December 19, 1990 with a base value of 100.S&P/Case-Shiller Composite Home Price Index - The Case-Shiller Home Price Indices, one comprised of price changes within all 20 metropolitan markets, and another comprised of price changes within the following subset of 10 metropolitan markets: Boston, Chicago, Denver, Las Vegas, Los Angeles, Miami, New York, San Diego, San Francisco and Washington DC. In addition to those 10 markets, the 20-Home Price index reflects price changes for Atlanta, Charlotte, Dallas, Detroit, Minneapolis, Phoenix, Portland, Seattle and Tampa.NASDAQ- A computerized system that facilitates trading and provides price quotations on more than 5,000 of the more actively traded over the counter stocks. Created in 1971, the Nasdaq was the world's first electronic stock market.Transports- The Industrials Sector includes companies whose businesses are dominated by one of the following activities: The manufacture and distribution of capital goods, including aerospace & defense, construction, engineering & building products, electrical equipment and industrial machineryUtilities- A public utility is a business that furnishes an everyday necessity to the public at large. Public utilities provide water, electricity, natural gas, telephone service, and other essentials. Utilities may be publicly or privately owned, but most are operated as private businesses.Basis Point- A basis point is a unit that is equal to 1/100th of 1%, and is used to denote the change in a financial instrument.REIT- Real Estate Trust. A security that sells like a stock on the major exchanges and invests in real estate directly, either through properties or mortgagesDuration – Duration is a commonly used measure of the potential volatility of the price of a debt security, or the aggregate market value of a portfolio of debt securities, prior to maturity. Securities with a longer duration generally have more volatile prices than securities of comparable quality with a shorter duration.BofA/Merrill Lynch Inflation Linked Index (G0Q1) – The BofA Merrill Lynch US Inflation-Linked Treasury Index tracks the performance of US dollar denominated inflation linked sovereign debt publicly issued by the US government in its domestic market. Citigroup TIPS (SBUSILSI)– . It measures the returns of the inflation-linked bonds with fixed-rate coupon payments that are linked to an inflation index. The price of each issue in the USLSI is adjusted by using an index ratio. The index ratio is determined by dividing the current inflation index level by the inflation index level at the time of issue of the security. The inflation index is published on a monthly basis, and the intra-month index ratio is calculated using linear interpolation.Barclays Capital CMBS Index – tracks the performance of US dollar-denominated securitized commercial mortgage-backed securities.Russell 2000 – measures the performance of the small-cap segment of the US equity universe. Russell 2000 is a subset of the Russell 3000 index representing approximately 10% of the total market capitalization of that index.S&P GSCI – is a composite index of commodity sector return representing an unleveraged, long-only investment in commodity futures that is broadly diversified across the spectrum of commodities. The Barclays European Aggregate Index tracks fixed-rate, investment-grade securities issued in the following European currencies: euro, British pounds, Norwegian krone, Danish krone, Swedish krona, Czech koruna, Hungarian forint, Polish zloty and Swiss franc.

4-4-17 Asset Allocation Webcast 70
Index DescriptionsS&P GSCI Agriculture – is a composite index of agriculture commodity futures unleveraged, long-only investment.Barclays Capital U.S. 30 Year TIPS Index - . Barclays Capital 30-year TIPS on-the-run index quoted in US Dollars traded intradayCitigroup Economic Surprise Index - . The Citigroup Economic Surprise Indices are objective and quantitative measures of economic news. They are defined as weighted historical standard deviations of data surprises (actual releases vs Bloomberg survey median). A positive reading of the Economic Surprise Index suggests that economic releases have on balance beating consensus. The indices are calculated daily in a rolling three-month window. The weights of economic indicators are derived from relative high-frequency spot FX impacts of 1 standard deviation data surprises. The indices also employ a time decay function to replicate the limited memory of markets.DAX - This index is the German Stock Index is a total return index of 30 selected German blue chip stocks traded on the Frankfurt Stock Exchange.CAC 40 – This index the most widely-used indicator of the Paris market, reflects the performance of the 40 largest equities listed in France, measured by free-float market capitalization and liquidity.FTSE 100 – Is a capitalization-weighted index of the 100 most highly capitalized companies traded on the London Stock Exchange.Mexico IPC – The Mexican IPC index is a capitalization weighted index of the leading stocks traded on the Mexican Stock Exchange.Hang Seng – The Hang Seng China Enterprises Index is a freefloat capitalization-weighted index comprised of H-shares listed on the Hong Kong Stock Exchange and included in the Hang Seng Mainland Composite Index.KOSPI - This index is a capitalized-weighted index of all common shares on the Korean Stock Exchanges.Nikkei 225 – The Nikkei-225 Stock average is a price-weighted average of 225 top-rated Japanese companies listed in the First Section of the Tokyo Stock Exchange.Australia AORD – S&P/ASX All Ordinaries represents 500 largest companies in the Australian equities market. Index constitutes are drawn from eligible companies listed on the Australian Stock Exchange.Brazil Bovespa Index (IBOV) -The Bovespa Index is a gross return index weighted by traded volume and is comprised of the most liquid stocks traded on the Sao Paulo Stock Exchange. The Bovespa Index has been divided 10 times by a factor of 10 since January 1, 1985.Shanghai Index (SHCOMP) -The Shanghai Stock Exchange Composite Index is a capitalization-weighted index. The index tracks the daily performance of all A-shares and B-shares listed on the Shanghai Stock Exchange. The index was developed on December 19,1990 with a base value of 100.BSE India Sensitive Index (Sensex) -The Sensex is a cap-weighted index. The selection of the index members has been made on the basis of liquidity, depth and floating-stock-adjustment depth and industry representation.S&P LSTA Lev Loan Index (Bank Loans)- Created by the Leveraged Commentary & Data (LCD) team at S&P Capital IQ, the review provides an overview and outlook of the leveraged loan market as well as an expansive review of the S&P Leveraged Loan Index and sub-indexes. The review consists of index general characteristics, results, risk-return profile, default/distress statistics, and repayment analysis. It is not possible to invest directly in an index.Citigroup 3 Month T-Bill (SBMMTB3) – 3 Month US T-Bill in US dollars.Moody’s U.S. Speculative Grade Default Rate: A speculative-grade default occurs if a defaulting issuer held an speculative-grade rating (Ba1 or lower) at the start of latest 12 month period. The rate is established by dividing the number of Spec-grade defaults by the number of Spec-grade issuers at the beginning of the sample period.Moody’s Distressed Rate: Percentage of High Yield Issuers whose debt is trading at distressed levels. Distressed issuers are defined as having debt with OAS or CDS of 1000 bps or more.

4-4-17 Asset Allocation Webcast 71
Disclaimer
Important Information Regarding This ReportThis report was prepared as a private communication and was not intended for public circulation. Clients or prospects may authorize distribution to their consultants or other agents.
Issue selection processes and tools illustrated throughout this presentation are samples and may be modified periodically. Such charts are not the only tools used by the investment teams, are extremely sophisticated, may not always produce the intended results and are not intended for use by non-professionals.
DoubleLine has no obligation to provide revised assessments in the event of changed circumstances. While we have gathered this information from sources believed to be reliable, DoubleLine cannot guarantee the accuracy of the information provided. Securities discussed are not recommendations and are presented as examples of issue selection or portfolio management processes. They have been picked for comparison or illustration purposes only. No security presented within is either offered for sale or purchase. DoubleLine reserves the right to change its investment perspective and outlook without notice as market conditions dictate or as additional information becomes available. This material may include statements that constitute “forward-looking statements” under the U.S. securities laws. Forward-looking statements include, among other things, projections, estimates, and information about possible or future results related to a client’s account, or market or regulatory developments.
Important Information Regarding Risk FactorsInvestment strategies may not achieve the desired results due to implementation lag, other timing factors, portfolio management decision-making, economic or market conditions or other unanticipated factors. The views and forecasts expressed in this material are as of the date indicated, are subject to change without notice, may not come to pass and do not represent a recommendation or offer of any particular security, strategy, or investment. All investments involve risks. Please request a copy of DoubleLine’s Form ADV Part 2A to review the material risks involved in DoubleLine’s strategies. Past performance is no guarantee of future results.
Important Information Regarding DoubleLineIn preparing the client reports (and in managing the portfolios), DoubleLine and its vendors price separate account portfolio securities using various sources, including independent pricing services and fair value processes such as benchmarking.
To receive a complimentary copy of DoubleLine Capital’s current Form ADV (which contains important additional disclosure information, including risk disclosures), a copy of the DoubleLine’s proxy voting policies and procedures, or to obtain additional information on DoubleLine’s proxy voting decisions, please contact DoubleLine’s Client Services.

4-4-17 Asset Allocation Webcast 72
Important Information Regarding DoubleLine’s Investment StyleDoubleLine seeks to maximize investment results consistent with our interpretation of client guidelines and investment mandate. While DoubleLine seeks to maximize returns for our clients consistent with guidelines, DoubleLine cannot guarantee that DoubleLine will outperform a client's specified benchmark or the market or that DoubleLine’s risk management techniques will successfully mitigate losses. Additionally, the nature of portfolio diversification implies that certain holdings and sectors in a client's portfolio may be rising in price while others are falling; or, that some issues and sectors are outperforming while others are underperforming. Such out or underperformance can be the result of many factors, such as but not limited to duration/interest rate exposure, yield curve exposure, bond sector exposure, or news or rumors specific to a single name.DoubleLine is an active manager and will adjust the composition of client’s portfolios consistent with our investment team’s judgment concerning market conditions and any particular sector or security. The construction of DoubleLine portfolios may differ substantially from the construction of any of a variety of bond market indices. As such, a DoubleLine portfolio has the potential to underperform or outperform a bond market index. Since markets can remain inefficiently priced for long periods, DoubleLine’s performance is properly assessed over a full multi-year market cycle.
Important Information Regarding Client ResponsibilitiesClients are requested to carefully review all portfolio holdings and strategies, including by comparing the custodial statement to any statements received from DoubleLine. Clients should promptly inform DoubleLine of any potential or perceived policy or guideline inconsistencies. In particular, DoubleLine understands that guideline enabling language is subject to interpretation and DoubleLine strongly encourages clients to express any contrasting interpretation as soon as practical. Clients are also requested to notify DoubleLine of any updates to Client’s organization, such as (but not limited to) adding affiliates (including broker dealer affiliates), issuing additional securities, name changes, mergers or other alterations to Client’s legal structure.
DoubleLine® is a registered trademark of DoubleLine Capital LP.
© 2017 DoubleLine Capital LP
Disclaimer

333 S. Grand Ave., 18th Floor || Los Angeles, CA 90071 || 213.633.8200
Live Webcast hosted by:
Jeffrey Gundlach
Chief Executive Officer
April 4, 2017
Asset Allocation Webcast

4-4-17 Asset Allocation Webcast 74
Upcoming Webcast Announcements
Jeffrey Gundlach – May 2, 2017Closed End Fund WebcastGo to www.doublelinefunds.com, Home page under “Events”2017 Webcast Schedule to register1:15 pm PDT/4:15 pm EDT
Jeffrey Gundlach – June 13, 2017Total Return WebcastGo to www.doublelinefunds.com, Home page under “Events”2017 Webcast Schedule to register1:15 pm PDT/4:15 pm EDT
To Receive Presentation Slides:
Email: [email protected]