littera-scripta.comlittera-scripta.com/wp-content/uploads/2019/05/177.pdflittera-scripta.com
TRANSCRIPT

2/2018
Economics
Management
Marketing
Linguistics
Pedagogy
Education
History
LITTERA SCRIPTA
LITTERA SCRIPTA
(Economics, Management, Marketing, Linguistics, Pedagogy, Education, History)
Doc. Ing. Marek Vochozka, MBA, Ph.D. (chairman of the editorial board)
Mgr. Zdeněk Caha, MBA, Ph.D. (editor-in-chief)
Doc. PhDr. František Stellner, Ph.D. (editor-in-chief)
Ing. Michal Ruschak (managing editor)
Ing. Vendula Velková (editor)
Address Editor:
Institute of Technology and Business in České Budějovice
Okružní 10
370 01 České Budějovice
Czech Republic
Tel.: +420 387 842 183
e-mail: [email protected]
http://journals.vstecb.cz/publications/littera-scripta/
ISSN 1805-9112 (Online)
Date of issue: December 2018
Periodicity: Twice a year
Since 2008
The Journal is indexed in:
ERIH PLUS (European Reference Index for the Humanities and Social Sciences)
– in 2015
CEJSH (Central European Journal of Social Sciences and Humanities) – in 2015
EZB (Elektronische Zeitschriftenbibliothek) - in 2017
GOOGLE SCHOLAR – in 2017
©2018 Institute of Technology and Business in České Budějovice
EDITORIAL BOARD
Doc. dr. sc. Mario BOGDANOVIĆ University of Split, Croatia Prof. Dr. Franz BOSBACH Universität Duisburg-Essen, Germany Prof. Lisa BURKE-SMALLEY, Ph.D., SPHR University of Tennessee Chattanooga, USA
Mgr. Zdeněk CAHA, MBA, Ph.D. Institute of Technology and Business in České Budějovice Doc. PhDr. Václav DRŠKA, Ph.D. Charles University in Prague Prof. Dr. Elena B. DVORYADKINA Ural State University of Economics, Russia Prof. Ing. Zuzana DVOŘÁKOVÁ, CSc. University of Economics Prague Prof. Allen D. ENGLE, DBA Eastern Kentucky University, USA Prof. zw. dr hab. Stefan FORLICZ WSB University in Wrocław, Poland PhDr. Jan GREGOR, Ph.D. Institute of Technology and Business in České Budějovice Prof. Ing. Ivan GROS, CSc. The College of Logistics in Přerov Prof. em. Dr. Dr. h. c. Alois HEIßENHUBER Technical University of Munich, Germany Prof. Ing. Jan HRON, DrSc., dr. h. c. Czech University of Life Sciences Prague Ing. Veronika HEDIJA, Ph.D. College of Polytechnics Jihlava Prof. Ing. Jiřina JÍLKOVÁ, CSc. Jan Evangelista Purkyně University in Ústí nad Labem ao. Univ.-Prof. Dr. Barbara JUEN Universität Innsbruck, Austria
Ass. Prof. MMag. Dr. Katharina Anna KALTENBRUNNER Universität Salzburg, Austria
Plk. Mgr. Štěpán KAVAN, Ph.D. College of European and Regional Studies České Budějovice Prof. Kevin P. KEARNS, Ph.D. University of Pittsburgh, USA Doc. Maxim A. PONOMAREV, Ph.D. Plekhanov Russian University of Economics, Russia Dr. József POÓR, DSc. Szent István University, Hungary Prof. Dr. Sean Patrick SAßMANNSHAUSEN Regensburg University of Applied Sciences, Germany Ing. Marie SLABÁ, Ph.D. Institute of Technology and Business in České Budějovice Prof. zw. Dr. hab. Bogusław ŚLIWERSKI, dr. h. c. Adam Mickiewicz University in Poznan, Poland Doc. PhDr. František STELLNER, Ph.D. Institute of Technology and Business in České Budějovice Ing. Jarmila STRAKOVÁ, Ph.D. Institute of Technology and Business in České Budějovice Prof. Ing. Miroslav SVATOŠ, CSc. Czech University of Life Sciences Prague Prof. Ing. Miloslav SYNEK, CSc. University of Economics Prague Prof. PaedDr. Gabriel ŠVEJDA, CSc. College of European and Regional Studies České Budějovice Prof. Ing. Pavel TOMŠÍK, CSc. Mendel University in Brno Prof. dr. Manuela Manuela TVARONAVIČIENĖ Vilnius Gediminas Technical University. Prof. Ing. Jan VÁCHAL, CSc. Institute of Technology and Business in České Budějovice

Ing. Marek VOKOUN, Ph.D. Institute of Technology and Business in České Budějovice Doc. Ing. Marek VOCHOZKA, MBA, Ph.D. Institute of Technology and Business in České Budějovice Prof. Liu YONGXIANG North China University of Technology, China

CONTENT
Codes of Ethics and the Economic Results of Companies
Zdeněk Caha
7
Dependence of Brand Loyalty on Customer Relationship Management
Lubica Gajanová, Margareta Nadányiová
20
Factors Influencing Employee Turnover and Personnel
Stability in Hotels in Slovakia
Jaroslav Kubaľa, Milota Vetráková
35
Innovative Method for Assessing the Quality of Special Wood Products during the Production Process
Eva Ružinská
46
Functioning of Ukrainian Phraseological Neologisms in Russian Political Media DiscourseMarta
Elena Tomášková
59
Applying the Options Framework to a Value-based Model of the Firm
Jan Vlachý
69
Multi-criteria Comparison of Savings Accounts on the Czech Market
Martina Kuncová, Lenka Lízalová
80
Financing Innovation, Neo-Schumpeterian Theory and the Reduction of Regional Disparities in the European Union
Petr Jiříček, Zdeňka Dostálová
95
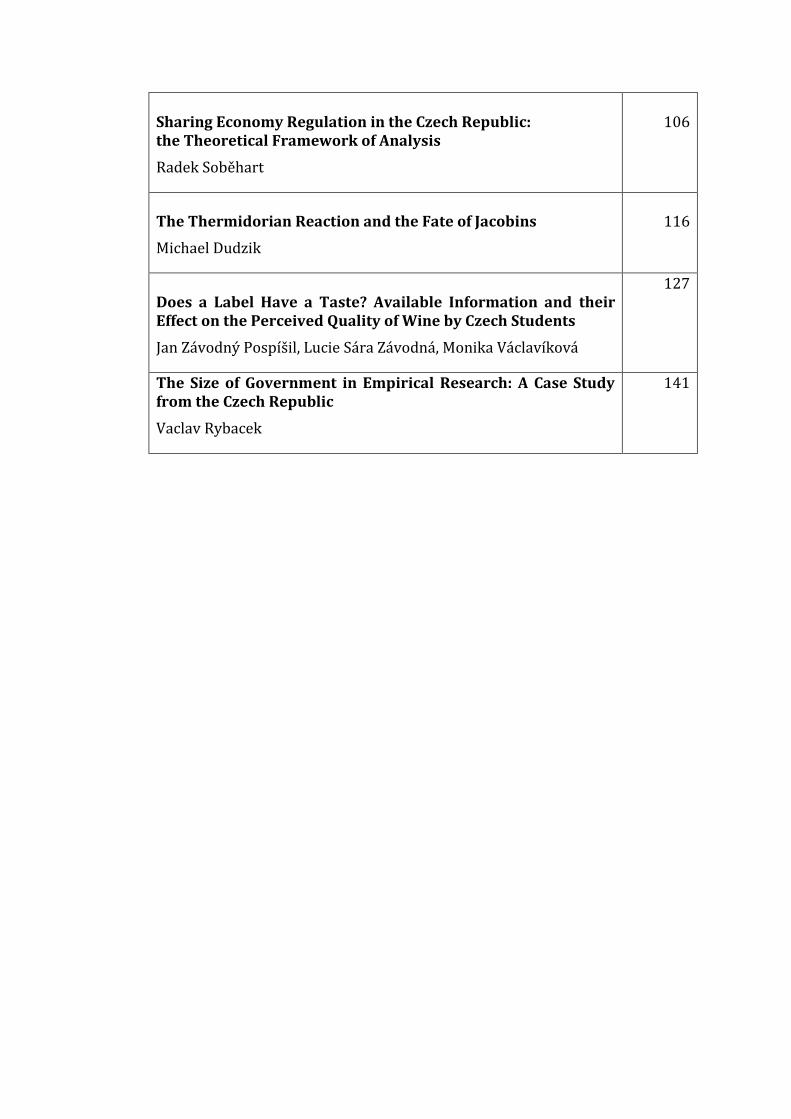
Sharing Economy Regulation in the Czech Republic: the Theoretical Framework of Analysis
Radek Soběhart
106
The Thermidorian Reaction and the Fate of Jacobins
Michael Dudzik
116
Does a Label Have a Taste? Available Information and their Effect on the Perceived Quality of Wine by Czech Students
Jan Závodný Pospíšil, Lucie Sára Závodná, Monika Václavíková
127
The Size of Government in Empirical Research: A Case Study from the Czech Republic
Vaclav Rybacek
141
7
Codes of Ethics
and the Economic Results of Companies
Zdeněk Caha
Institute of Technology and Business in České Budějovice
Abstract
The goal of this paper is to determine how widespread the presence of a code of ethics is and the
possible relationship between the presence of a code of ethics in Czech companies and the positive
economic results of those companies over the last five years. The number of companies that are
introducing ethical management continues to grow globally, including in the Czech Republic. A
code of ethics is a tool with which to determine the ethical infrastructure of a company, as well as
manage it. However, expert opinions on the possible economic impact of ethical management
differ considerably. A statistical analysis of the results obtained from a questionnaire survey
conducted among a sample of 297 companies showed that the presence of a code of ethics, or a
lack thereof, has no demonstrable impact on the economic results of a company regardless of its
size.
Keywords: Code of ethics, economic impact, prosperity, management, company, ethical.
Introduction
A code of ethics is the basic, traditional and most widely used tool for the ethical
management of a company (Farrell, Cobbin and Farrell, 2002). According to Caha and
Urban (2017), the advantages of having a code of ethics are that it: modifies behaviour by
providing possible instructions and examples of how to behave; solves conflict situations;
defines acceptable and unacceptable behaviours thereby clarifying company policy;
positively influences employee’s awareness of their sense of place and identity with
regards to the company, and of the support they receive (codes of ethics force employees
to think about their roles and obligations towards the company and/or its customers,
whilst making employees feel safe and protected); improves a company’s reputation with
its customers and the general public; helps solve disputable questions with regards to the
introduction of innovations; keeps managers in check by preventing them from abusing
their positions in relation to other employees; helps to reveal illegal activities and
transactions; prevents superiors from requiring subordinates to behave inappropriately.
Mazák (2010) states similar reasons for organisations to create and apply a code of ethics:
Littera Scripta, 2018, Volume 11, Issue 2
8
it defines the limits of desirable behaviour for company employees as well as entities
outside the organisation; it eases decision making by unambiguously specifying company
principles; it may be a criterion on which basis an organisation can be assessed externally;
it is an undertaking to adhere to a set of principles which improves the credibility of a
company. It should be noted at this point that codes of ethics are not strict rules and laws,
but only manuals, which can also work counterproductively if undue pressure is brought
to bear on organisations and employees to apply them. A code of ethics does not therefore
only represent a tool of management or autoregulation within an organisation, it also
contributes to improving the credibility of a particular entity in the eyes of its
stakeholders.
The importance of a code of ethics in current company practice is also related to its
capacity to strengthen a company´s ability to manage information (Weller 1988).
Examples of ethical questions that might arise are: What can managers expect from the
employees with regards to the non-disclosure of confidential information if an employee
decides to leave a company and start working elsewhere? What information is owned by
a company and what know-how is owned by an employee? Should an employee know that
their activities will be monitored under certain circumstances? Does the collection of data
on an employee violate their right to privacy? Should systems liable to a breach of data
protection be controlled? What are the responsibilities of a manager and an organisation
with regards to data protection? Another problem within this context is the increasing
use of social networks by employees for communication purposes, both on company
profiles and on private accounts.
Companies are increasingly becoming aware of the fact that improper communications
through social media can have serious consequences for their reputation and their image
in the eyes of the general public. In fact, a digital footprint is permanent. There are
therefore fully legitimate reasons why companies are stepping up their efforts to set
principles and rules for employees with regards to such communications. At present, two
models are being applied in practice: a company prepares a special document containing
adjustments to the rules of communication with regards to social networks; or a company
integrates new rules on communications on social networks for their employees into an
existing code of ethics. Irrespective of which model a company decides to apply, it is
imperative that they act promptly and do not postpone implementing effective measures.
Failure to do so may result in numerous labour disputes.
Globalisation and the existence of global companies also raises numerous issues with
regards to the preparation of global codes of ethics. This is primarily due to intercultural
differences in business ethics on how to effectively solve ethical dilemmas. This therefore
requires the building of a consensus around the setting up of “global standards” (McLeod,
Payne and Everet, 2016).
According to Caha and Urban (2017b), the key instruments of ethical management, to
which codes of ethics belong, are:
Littera Scripta, 2018, Volume 11, Issue 2
9
Ethical leadership - leading by example every day throughout working hours. The
behaviour of company officials should conform with each other. Potentially unethical
behaviour by company management leads to the degradation of the ethical behaviour of
its employees. Low cost and authenticity, or genuineness and credibility in the approach
to business ethics are some of the advantages of ethical leadership as an organisational
management tool. It is also gives a clear signal about the credibility of the ethical
declarations of an organisation.
Use of whistleblowing - this means the active notification of a particular unfair practice
that takes place within the workplace. Employees are usually among the first to learn
about unfair practices and can point them out. An employee may however face various
dilemmas in such a situation, in particular with regards to the question of whether they
should be disloyal to their colleague(s), line manager or employer, thereby putting their
own position at risk, or whether it is more important to protect the public interest.
Whistleblowing therefore requires an arrangement to be in place, usually integrated in an
organisation’s code of ethics, which includes an undertaking not to sanction in any way
the person that provides the information on the unethical behaviour. Whistleblowing is
therefore one of the most important tools for making disclosures and preventing
fraudulent and corruptive practices in public administration and in private companies.
Such disclosures can lead to the saving or recovery of substantial public funds, and
prevent the loss of life. The contribution of whistleblowers to the prevention of corruption
is undisputable, however the credibility of the policy depends wholly on the precondition
that no sanctions are imposed on or retaliatory measures taken against the person making
the disclosure. The credibility of this tool is therefore higher if the code of ethics of an
organisation contains guarantees that the organisation supports an environment in which
employees are not afraid to report potential fears and problems, that it does not tolerate
any kind of retaliatory measures against anyone who in good faith reports an alleged
breach of obligations or provides any information in relation to an investigation of an
alleged breach. These guarantees should also ensure that the organisation will investigate
all cases of potential retaliatory measures taken against anyone who reports incorrect
behaviour and punish those employees that do so.
Education and training of employees and managers – education in the field of ethical
behaviour should unify the opinions of all employees on the importance of ethics in
everyday work and teach effective communication supporting openness and confidence
inside a company. The following is an example of ethical management within a
construction company and the consistent application of the tool. The construction
company decided that all new employees must attend training on the principles that
govern the company´s code of ethics and the observance thereof, no later than three
months after the commencement of their employment. Furthermore, all the employees
should be trained in ethical behaviour at least once every two years. The company
maintains exact records on the completed training sessions, including lists of the
employees who participated. After each course the employees must confirm that they
Littera Scripta, 2018, Volume 11, Issue 2
10
attended the course, that they understand the code of ethics and that they agree that they
will behave in an appropriate way within their activities as employees of the company.
Reporting the risk of a breach of ethics rules - this practice pursues similar goals to
whistleblowing, but does so in a slightly different way. It is based on the obligation of
managers and employees to provide the line manager or an appointed company officer
with timely and relevant information about a situation in which there is a risk of a breach
of the ethics rules. The reporting of such situations can be combined with a preliminary
risk assessment and accompanying action plan. Such situations include events which
might either tarnish the brand name of the company (business ethics, the environment,
safety, health), or lead to a breach of legal obligations e.g. a deadly injury or another
serious accident, pollution of the environment, serious environmental accident, etc.
Internal ethics committee – such committees are subordinate to an organisation´s
management and consist of its managers and employees. It usually includes the company
lawyer, human resource manager and an experienced operational manager. The areas of
responsibility of an ethics committee include the provision of counsel on ethics issues, the
investigation of alleged breaches of the code of ethics, and the making of
recommendations to management.
Ethics audit – this is a systematic evaluation of the ethics programme within a company
and the verification of its ethical standards.
Corporate social responsibility, corporate governance and compliance management – the
code of ethics of an organisation is closely related to other management tools which
include ethics, in particular those systems and tools utilised to implement a company´s
strategies with regards to corporate social responsibility, corporate governance and
compliance management (the system for monitoring and assessing whether a company
adheres to certain internal and external rules regarding its business operations). In some
cases the sources for the code of ethics also include the concept of the sustainable
development of society or of a particular company.
Codes of ethics form a systemic framework for a company´s ethical infrastructure and for
the application of an integrated system of ethical management (Seknička and Putnová,
2016). The term “code of ethics” (code of conduct) is understood to be a clearly elaborated
set of standards and regulations that defines and modifies relations between members of
a certain community (Rolný, 2007).
A code of ethics defines in detail the moral principles of a company and their application
to company practice (Murphy, 1998). The purpose of a code of ethics and similar
documents is to cultivate a particular company environment and culture. According to
Remišová (2011), a code of ethics should not be perceived as a legal document. In fact, a
code by its very definition points out the intention to behave ethically in all the above
mentioned aspects and to respect the current social and legal standards. A code of ethics
should be comprehensible, communicable, specific, up-to-date and enforceable.
Littera Scripta, 2018, Volume 11, Issue 2
11
According to Ho (2010), a code of ethics only has a positive influence on the ethical
behaviour of employees if it is presented in the right and appropriate way. Numerous
factors play an important role in this process, including the overall orientation of the
company, an employees´ field of work, etc. Singh (2011), for example, recommends that
codes of ethics should be evaluated and revised every two years, whereby all company
employees should be informed of any changes during a training session. New employees
should also be familiarised with the code of ethics, namely prior to the commencement of
their employment.
However, codes of ethics are also subject to criticism. Their poor efficacy, poor
enforceability, formalism and high level of generality are particularly reproached, as is the
fact that the behaviour of individuals is more or less determined by the values they
acquire during childhood (Putnová and Seknička, 2007). The question as to what extent a
code of ethics is useful for small companies and small entrepreneurs with a fixed
organisational culture that works mainly on the basis of informal relations, is also
disputable (Čaník and Čaníková, 2006). Some companies may see the only advantage of
creating a code of ethics as the improvement in their image in the eyes of customers and
the general public. The fact that employees do not know the code of ethics well enough,
which leads to its violation, is another problem (Ho, 2010).
A code of ethics is also not necessarily accompanied by an improvement in company
ethics. Several empirical studies have revealed that codes of ethics give companies a
negligible advantage, if any advantage at all. Research conducted by McKendall, DeMarr
and Jones-Rikkers (2002) is an example of one of these studies. In their research, Kaptein
and Schwartz (2008) also concluded that the efficacy of codes of ethics was relatively low.
Nevertheless, despite the mixed results of studies into the efficacy of codes of ethics in
companies, it is possible to observe that well-functioning codes provide a high potential
for improvements in overall business and company culture. Caha and Urban (2017b) deal
with the main principles of the contents, creation and enforcement of codes of ethics in
organisations, the extent to which this management tool is used by Czech companies,
including differences in its usage in different types of organisations, the frequency of its
evaluation and subsequently make suggestions for changes.
A global survey conducted by KPMG (2008) points to the worldwide trend for increasing
numbers of companies to define and implement a code of ethics. The research showed
that in 2008 the proportion of companies with a code of ethics stood at 86%. It is clear
from the above that in recent years a code of ethics has become a standard basic tool for
ethics programmes within large and renowned companies. This is also backed up by an
informal survey conducted by IBE in 2012, which showed that a code of ethics was
implemented by 92% of those companies with the highest market capitalisation based in
Great Britain whose shares are traded on the London Stock Exchange (IBE, 2012). The IBE
survey also reported that in 2012, 73% of all companies had a code of ethics. The CGMA
(2015) conducted a survey the overall results of which showed that the proportion of
companies with a code of ethics stood at 82% (and among large companies 93%). In 2016,
according to a worldwide survey conducted by PwC, the largest of its kind, in which 6,337
Littera Scripta, 2018, Volume 11, Issue 2
12
companies from 115 countries participated (including 79 prominent companies from the
Czech Republic), revealed that on average 82% of companies had a formally established
code of ethics (PricewaterhouseCoopers, 2016).
One of the latest surveys was conducted in 2016 by Dow Jones and Metricstream (2016)
and showed that 96% of the 330 questioned companies had a code of ethics. The
aforementioned surveys indicate the growing trend towards the introduction of codes of
ethics in business practice. However, it is important to highlight that not all these surveys
are compatible. In reality, the results depend on numerous factors, in particular on the
structure of the respondents. Whilst a higher proportion of large US based companies
have codes of ethics, this proportion is smaller for small and medium-sized companies
and companies operating in Asia. It is clear that only global surveys with large numbers
of respondents from all business sectors and companies of different sizes will therefore
provide the relevant information required. Unfortunately, such surveys are difficult to
realise.
According to a survey conducted by the Association of Chartered Certified Accountants
(ACCA), one in five managers or accountants in the Czech Republic has had to deal with a
serious ethical dilemma in their work. This only confirms the necessity of introducing
effective ethical management tools (Transparency International – Czech Republic 2015).
Džbánková (2003) concluded, on the basis of her smaller less representative survey
conducted in 2002, in which 60 representatives participated from middle and top
management in companies operating in Prague and Central Bohemia, that 35% of the
questioned companies had a code of ethics in place and 22% were considering drafting
and implementing one. In contrast, Transparency International – Czech Republic, in
conjunction with the Economic University in Prague, conducted a very representative
survey in 2005, which was repeated in 2006. The surveys sought to determine the degree
to which codes of ethics were applied in companies that operated on the Czech market.
The conclusion was that in the second half of 2005 only 59 companies (i.e. 10.3%) of the
574 questioned had a code of ethics in place. This situation was similar when the survey
was repeated in the first half of 2006, whereby only 104 companies (i.e. 8.4%) of the 1,240
in the sample set had a code of ethics in place. The survey also proved that the larger the
company the greater the chance a code of ethics existed. Dytrt et al. (2011) state that in
2011, less than 15% of domestic companies had a code of ethics in place. In a more recent
survey conducted by Transparency International in 2013, the results showed that this
percentage had increased to 46% of domestic companies. However, this compares to the
world average of 74% (Transparency International – Czech Republic 2015). According to
the respondents of a questionnaire survey conducted in 2015, the results of which were
processed by the Financial and Economic Institute, 68% of companies had a code of ethics,
but only 23% of companies saw the code of ethics as a binding set of rules (Finanční a
ekonomický institut, 2015). According to the previously mentioned PwC survey, in which
6,337 organisations from 115 countries participated, 86% of the 79 prominent Czech
companies questioned had a formally established code of ethics. However, the low
Littera Scripta, 2018, Volume 11, Issue 2
13
number and the size of the companies involved belies reality (Global Economic Crime
Survey 2016 – Report for the Czech Republic 2016).
Despite these results, the number of companies in the Czech Republic that are establishing
a code of ethics is gradually growing, although the numbers remain well below the global
average (which is higher than 70%). In the Czech Republic, the presence of a code of ethics
tends to be limited to larger companies and public institutions. Smaller companies are still
only exploring their options with regards to this ethical management tool.
The application of ethical management principles is a long-term intention, which does not
usually lead to an immediate effect. When creating a code of ethics a company must take
into account that significant efforts will be required to make the staff understand the
principles maintained therein (Erwin, 2011). In some cases, having to deal with ethical
issues may generate unwillingness among some employees to cooperate. Under such
circumstances it is necessary to create a motivational system which encourages the
involvement of employees in the creation and the application of a code of ethics.
Materials and Methods
In order to fulfil the set goal of the contribution, quantitative research was carried out on
the basis of an electronic questionnaire survey conducted between June 2016 and August
2016. The aim of the survey was to obtain a statistically representative cross-sectional
data set on small, medium-sized and large companies. In total, questionnaires were
sent/given to 710 targeted companies selected from random industries. In total, 297
responses were received, which is equivalent to a response rate of 41.83%. The analysis
of the survey results set out to verify the hypothesis that the presence of a code of ethics
in a company has no influence on its economic prosperity. Unfortunately, the
representativeness of the data is limited because the analysis only focuses on three
categories of company size (see Table 1). The differences between the categories of
company size are evaluated using the standard, unpaired, two-tailed statistical Chi-square
test of relative frequency differences. R statistical software was used for the relationship
tests and the calculation of the interval estimates. All the statistical tests and calculations
of interval estimates were performed at a confidence level of 95% (i.e. at a significance
level of 0.05).
The initial survey was subsequently followed up with a second electronic questionnaire,
the results of which are not included in this paper due to ongoing data processing. The
second data set will be used to analyse companies in more detail at a later date.
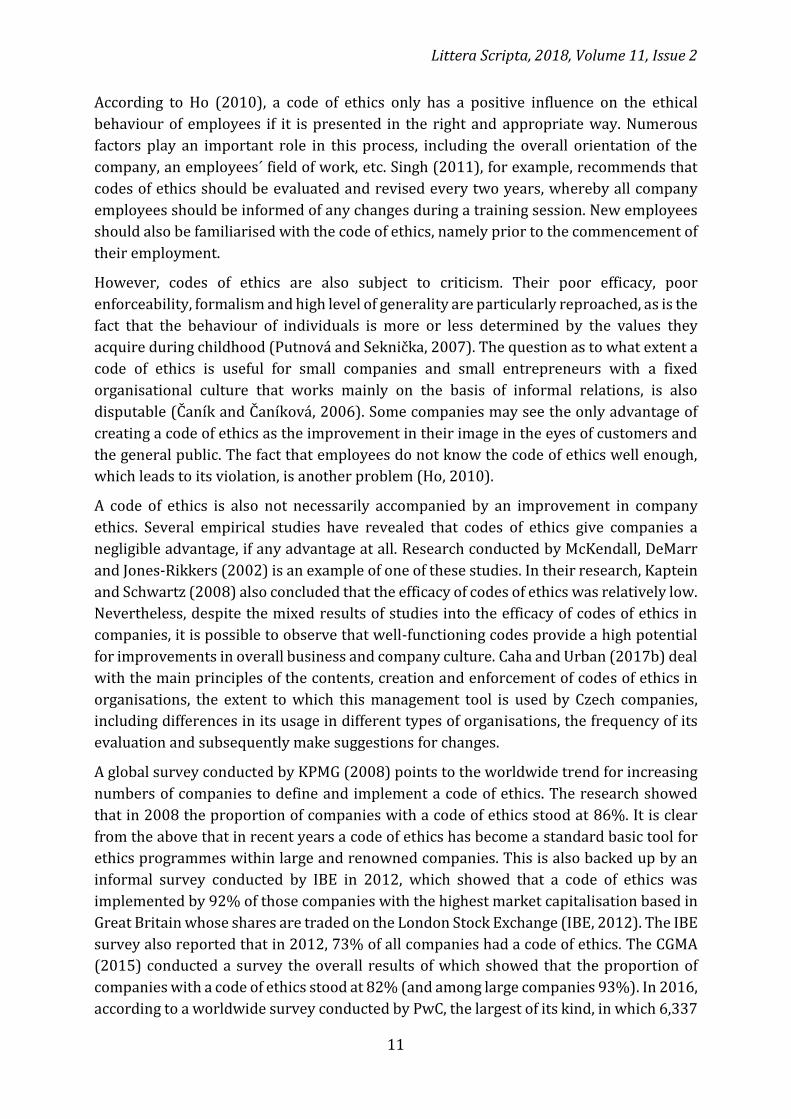
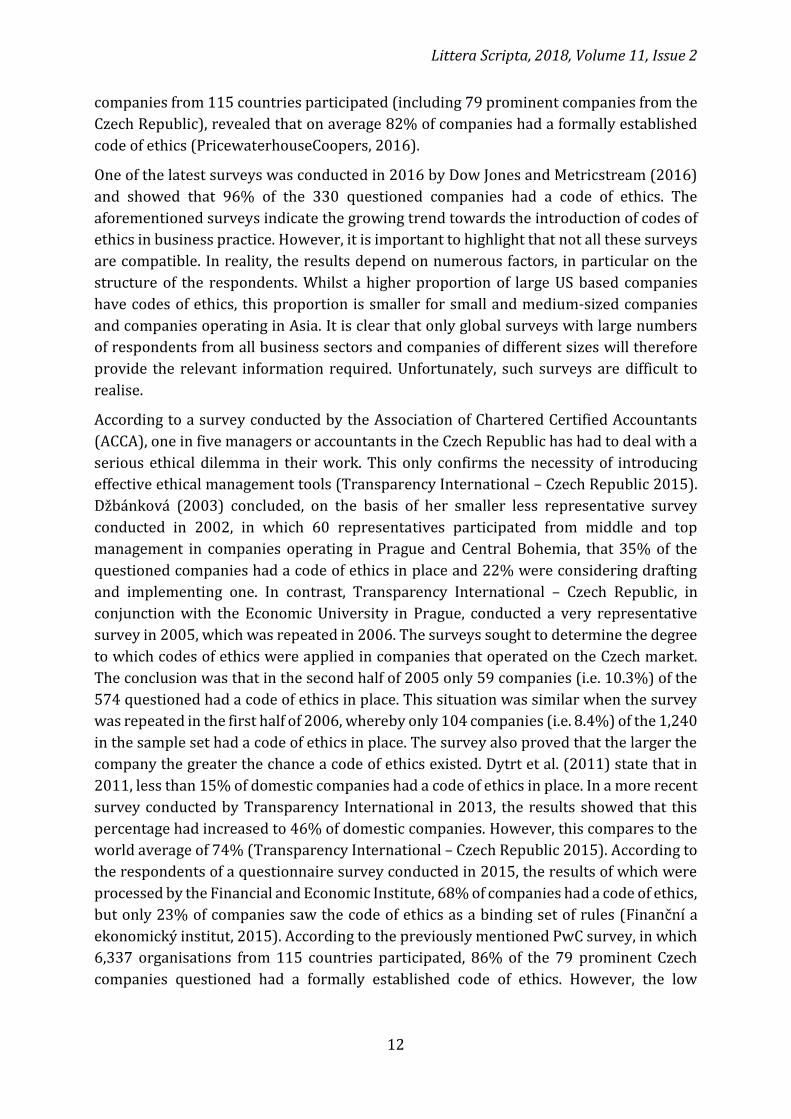
Table 1. Absolute numbers and relative frequencies according to company size
Company size Number Frequency in % Small/micro-companies 110 37.0% Medium-sized companies 103 34.7% Large companies 84 28.3% Total 297 100.0%
Source: Author
Littera Scripta, 2018, Volume 11, Issue 2
14
It is important to note at this point that there is a potential systemic and confounding bias
in the design of the survey because the outcome of the categorical variable is self-
evaluated. Another issue is the overrepresentation of active companies because failing
companies are less likely and willing to provide true information. In response to this,
further research will be conducted into the financial situation of companies. In this way,
more precise differences between various categories of companies can be analysed.
For the analysis, three categories of companies were identified, namely large companies
(≥ 250 employees), medium-sized companies (50 – 249 employees), and small and micro-
companies (< 50 employees). The purpose of the analysis was to determine how
widespread the presence of a code of ethics is and the possible relationship between the
presence of a code of ethics in Czech companies and the positive economic results of those
companies over the last five years. Within the sample dataset, there were several
companies that gave no response to the question “Does your company have a code of
ethics?” It was decided to assign the answer “No, we do not miss it” to these cases on the
basis of the assumption that omitting to answer the question automatically shows that the
company does not have a code of ethics. In addition, our interest was only in whether a
company does or does not have a code of ethics. As a result, it was decided, for this
analysis, to combine the number of responses for “No, we do not miss it” and “No, we miss
it” into one group “No”.
As part of the analysis of the relationship between the presence of a code of ethics and a
company´s profit or loss, it was necessary to discount five companies which failed to
declare whether their economic results were positive, balanced or negative. In these
cases, it was not possible to automatically assign any other option.
Results
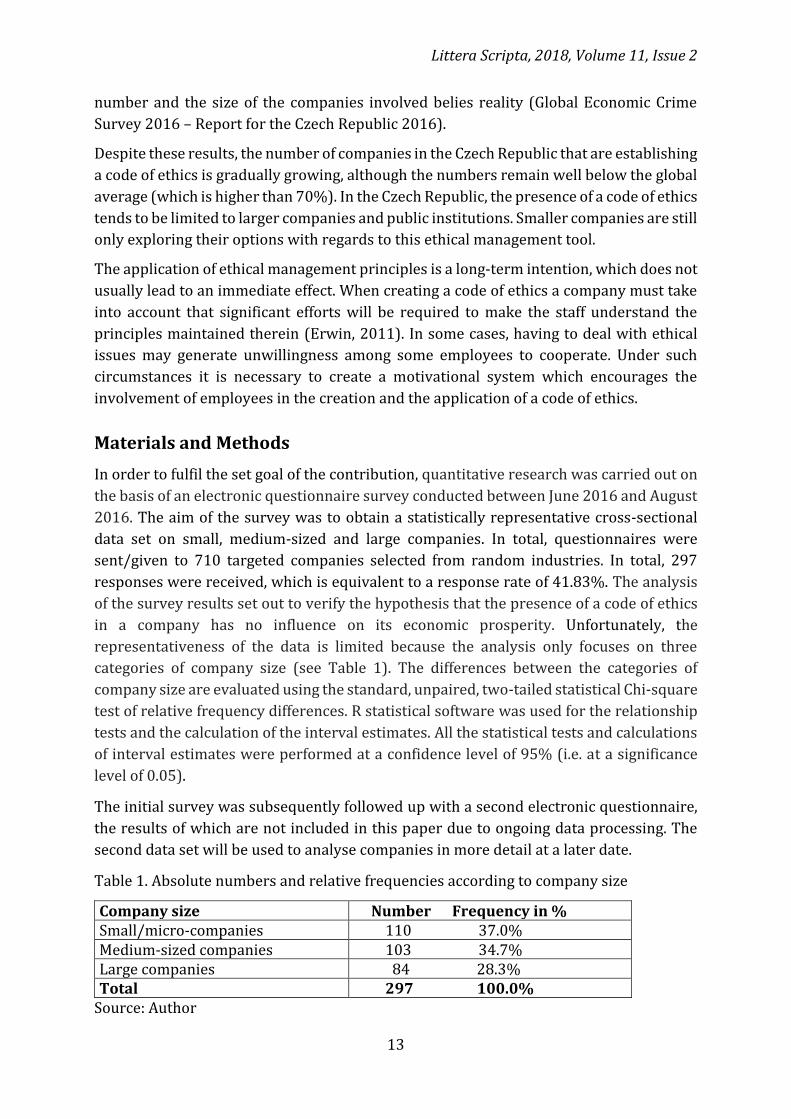
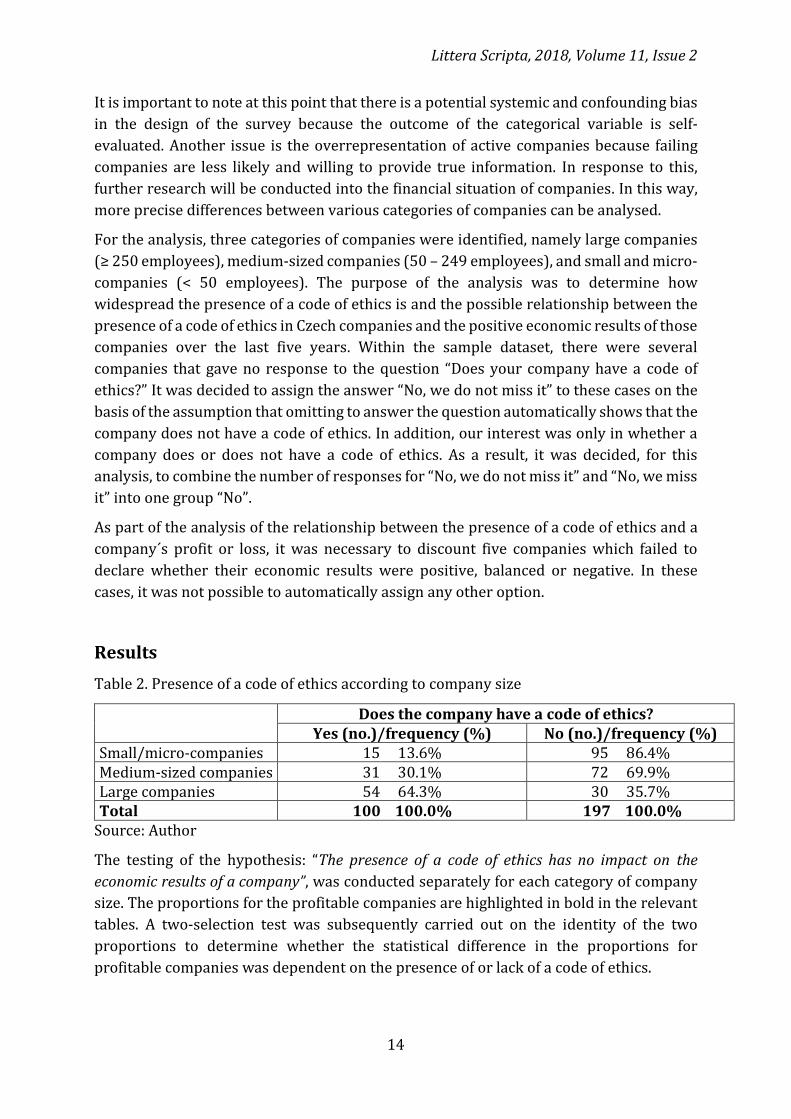
Table 2. Presence of a code of ethics according to company size
Does the company have a code of ethics?
Yes (no.)/frequency (%) No (no.)/frequency (%) Small/micro-companies 15 13.6% 95 86.4% Medium-sized companies 31 30.1% 72 69.9% Large companies 54 64.3% 30 35.7% Total 100 100.0% 197 100.0%
Source: Author
The testing of the hypothesis: “The presence of a code of ethics has no impact on the
economic results of a company”, was conducted separately for each category of company
size. The proportions for the profitable companies are highlighted in bold in the relevant
tables. A two-selection test was subsequently carried out on the identity of the two
proportions to determine whether the statistical difference in the proportions for
profitable companies was dependent on the presence of or lack of a code of ethics.
Littera Scripta, 2018, Volume 11, Issue 2
15
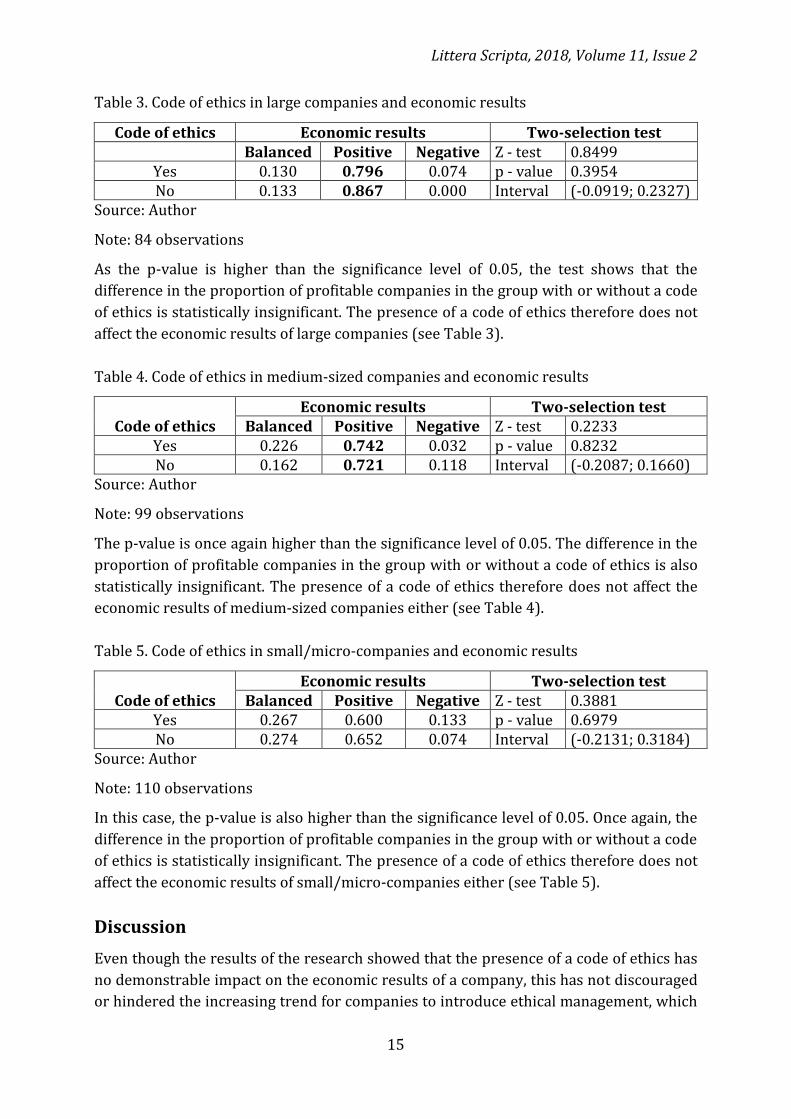
Table 3. Code of ethics in large companies and economic results
Code of ethics Economic results Two-selection test Balanced Positive Negative Z - test 0.8499
Yes 0.130 0.796 0.074 p - value 0.3954 No 0.133 0.867 0.000 Interval (-0.0919; 0.2327)
Source: Author
Note: 84 observations
As the p-value is higher than the significance level of 0.05, the test shows that the
difference in the proportion of profitable companies in the group with or without a code
of ethics is statistically insignificant. The presence of a code of ethics therefore does not
affect the economic results of large companies (see Table 3).
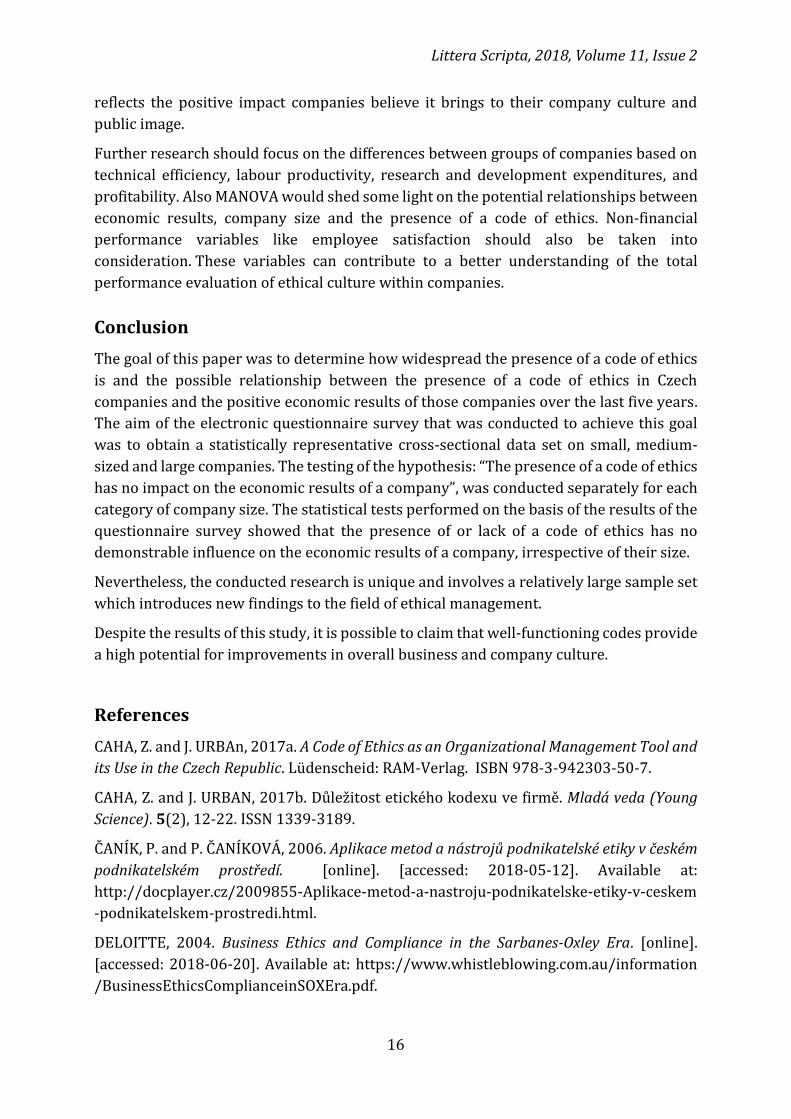
Table 4. Code of ethics in medium-sized companies and economic results
Code of ethics Economic results Two-selection test
Balanced Positive Negative Z - test 0.2233 Yes 0.226 0.742 0.032 p - value 0.8232 No 0.162 0.721 0.118 Interval (-0.2087; 0.1660)
Source: Author
Note: 99 observations
The p-value is once again higher than the significance level of 0.05. The difference in the
proportion of profitable companies in the group with or without a code of ethics is also
statistically insignificant. The presence of a code of ethics therefore does not affect the
economic results of medium-sized companies either (see Table 4).
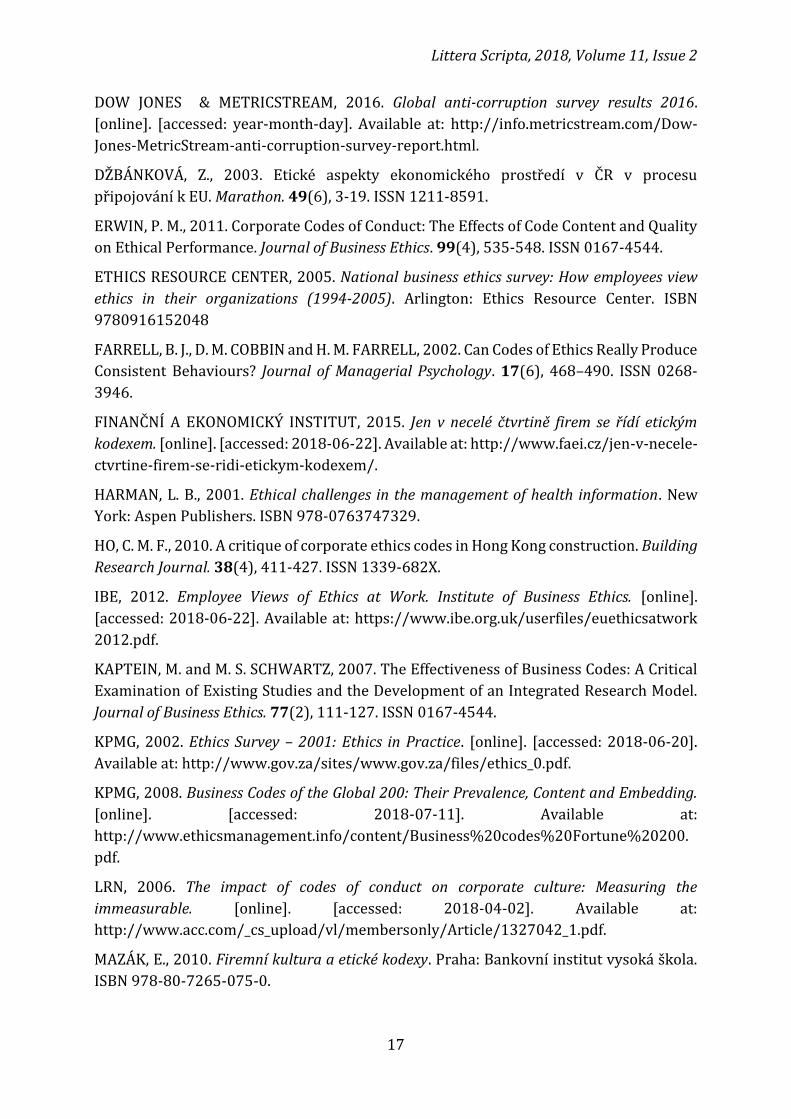
Table 5. Code of ethics in small/micro-companies and economic results
Code of ethics Economic results Two-selection test
Balanced Positive Negative Z - test 0.3881 Yes 0.267 0.600 0.133 p - value 0.6979 No 0.274 0.652 0.074 Interval (-0.2131; 0.3184)
Source: Author
Note: 110 observations
In this case, the p-value is also higher than the significance level of 0.05. Once again, the
difference in the proportion of profitable companies in the group with or without a code
of ethics is statistically insignificant. The presence of a code of ethics therefore does not
affect the economic results of small/micro-companies either (see Table 5).
Discussion
Even though the results of the research showed that the presence of a code of ethics has
no demonstrable impact on the economic results of a company, this has not discouraged
or hindered the increasing trend for companies to introduce ethical management, which
Littera Scripta, 2018, Volume 11, Issue 2
16
reflects the positive impact companies believe it brings to their company culture and
public image.
Further research should focus on the differences between groups of companies based on
technical efficiency, labour productivity, research and development expenditures, and
profitability. Also MANOVA would shed some light on the potential relationships between
economic results, company size and the presence of a code of ethics. Non-financial
performance variables like employee satisfaction should also be taken into
consideration. These variables can contribute to a better understanding of the total
performance evaluation of ethical culture within companies.
Conclusion
The goal of this paper was to determine how widespread the presence of a code of ethics
is and the possible relationship between the presence of a code of ethics in Czech
companies and the positive economic results of those companies over the last five years.
The aim of the electronic questionnaire survey that was conducted to achieve this goal
was to obtain a statistically representative cross-sectional data set on small, medium-
sized and large companies. The testing of the hypothesis: “The presence of a code of ethics
has no impact on the economic results of a company”, was conducted separately for each
category of company size. The statistical tests performed on the basis of the results of the
questionnaire survey showed that the presence of or lack of a code of ethics has no
demonstrable influence on the economic results of a company, irrespective of their size.
Nevertheless, the conducted research is unique and involves a relatively large sample set
which introduces new findings to the field of ethical management.
Despite the results of this study, it is possible to claim that well-functioning codes provide
a high potential for improvements in overall business and company culture.
References
CAHA, Z. and J. URBAn, 2017a. A Code of Ethics as an Organizational Management Tool and
its Use in the Czech Republic. Lüdenscheid: RAM-Verlag. ISBN 978-3-942303-50-7.
CAHA, Z. and J. URBAN, 2017b. Důležitost etického kodexu ve firmě. Mladá veda (Young
Science). 5(2), 12-22. ISSN 1339-3189.
ČANÍK, P. and P. ČANÍKOVÁ, 2006. Aplikace metod a nástrojů podnikatelské etiky v českém
podnikatelském prostředí. [online]. [accessed: 2018-05-12]. Available at:
http://docplayer.cz/2009855-Aplikace-metod-a-nastroju-podnikatelske-etiky-v-ceskem
-podnikatelskem-prostredi.html.
DELOITTE, 2004. Business Ethics and Compliance in the Sarbanes-Oxley Era. [online].
[accessed: 2018-06-20]. Available at: https://www.whistleblowing.com.au/information
/BusinessEthicsComplianceinSOXEra.pdf.
Littera Scripta, 2018, Volume 11, Issue 2
17
DOW JONES & METRICSTREAM, 2016. Global anti-corruption survey results 2016.
[online]. [accessed: year-month-day]. Available at: http://info.metricstream.com/Dow-
Jones-MetricStream-anti-corruption-survey-report.html.
DŽBÁNKOVÁ, Z., 2003. Etické aspekty ekonomického prostředí v ČR v procesu
připojování k EU. Marathon. 49(6), 3-19. ISSN 1211-8591.
ERWIN, P. M., 2011. Corporate Codes of Conduct: The Effects of Code Content and Quality
on Ethical Performance. Journal of Business Ethics. 99(4), 535-548. ISSN 0167-4544.
ETHICS RESOURCE CENTER, 2005. National business ethics survey: How employees view
ethics in their organizations (1994-2005). Arlington: Ethics Resource Center. ISBN
9780916152048
FARRELL, B. J., D. M. COBBIN and H. M. FARRELL, 2002. Can Codes of Ethics Really Produce
Consistent Behaviours? Journal of Managerial Psychology. 17(6), 468–490. ISSN 0268-
3946.
FINANČNÍ A EKONOMICKÝ INSTITUT, 2015. Jen v necelé čtvrtině firem se řídí etickým
kodexem. [online]. [accessed: 2018-06-22]. Available at: http://www.faei.cz/jen-v-necele-
ctvrtine-firem-se-ridi-etickym-kodexem/.
HARMAN, L. B., 2001. Ethical challenges in the management of health information. New
York: Aspen Publishers. ISBN 978-0763747329.
HO, C. M. F., 2010. A critique of corporate ethics codes in Hong Kong construction. Building
Research Journal. 38(4), 411-427. ISSN 1339-682X.
IBE, 2012. Employee Views of Ethics at Work. Institute of Business Ethics. [online].
[accessed: 2018-06-22]. Available at: https://www.ibe.org.uk/userfiles/euethicsatwork
2012.pdf.
KAPTEIN, M. and M. S. SCHWARTZ, 2007. The Effectiveness of Business Codes: A Critical
Examination of Existing Studies and the Development of an Integrated Research Model.
Journal of Business Ethics. 77(2), 111-127. ISSN 0167-4544.
KPMG, 2002. Ethics Survey – 2001: Ethics in Practice. [online]. [accessed: 2018-06-20].
Available at: http://www.gov.za/sites/www.gov.za/files/ethics_0.pdf.
KPMG, 2008. Business Codes of the Global 200: Their Prevalence, Content and Embedding.
[online]. [accessed: 2018-07-11]. Available at:
http://www.ethicsmanagement.info/content/Business%20codes%20Fortune%20200.
pdf.
LRN, 2006. The impact of codes of conduct on corporate culture: Measuring the
immeasurable. [online]. [accessed: 2018-04-02]. Available at:
http://www.acc.com/_cs_upload/vl/membersonly/Article/1327042_1.pdf.
MAZÁK, E., 2010. Firemní kultura a etické kodexy. Praha: Bankovní institut vysoká škola.
ISBN 978-80-7265-075-0.
Littera Scripta, 2018, Volume 11, Issue 2
18
McKENDALL, M., B. DEMARR and C. jones-rikkers, 2002. Ethical Compliance Programs
and Corporate Illegality: Testing the Assumptions of Corporate Sentencing Guidelines.
Journal of Business Ethics. 37(4), 367-383. ISSN 0167-4544.
McLEOD, M. S., G. T. PAYNE and R. E. EVERT, 2016. Organizational Ethics Research: A
Systematic Review of Methods and Analytical Techniques. Journal of Business Ethics.
134(3), 429-443. ISSN 0167-4544.
MURPHY, P. J., 1988. Implementing Business Ethics. Journal of Business Ethics. 7(12), 907–
15. ISSN 0167-4544.
PRICEWATERHOUSECOOPERS, 2016. Celosvětový průzkum hospodářské kriminality -
zpráva za Českou republiku. [online]. [accessed: 2018-04-16]. Available at:
https://www.pwc.com/cz/cs/hospodarska-kriminalita/assets/pdf/global-economic-
crime-survey-2016-cz.pdf.
REMIŠOVÁ, A., 2011. Etika a ekonomika. Bratislava: Kalligram. 978-80-247-4293-9.
PUTNOVÁ, A. and P. SEKNIČKA, 2007. Etické řízení ve firmě: nástroje a metody: etický a
sociální audit. Praha: Grada Publishing a. s. ISBN 9788024716213.
ROGERS, P. S. and J. M. SWALES, 1990. We the People? An Analysis of the Dana
Corporation Policies Document. Journal of Business Communication. 27(3), 293-313. ISSN
0021-9436.
ROLNÝ, I., 2007. Etika v podnikové strategii. Metodologické postupy integrace etiky do
PODNIKOVÉ STRATEGIE. OSTRAVA: KEY PUBLISHING. ISBN 8085834000.
SEKNIČKA, P. and A. PUTNOVÁ, 2016. Etika v podnikání a hodnoty trhu. Praha: Grada
Publishing. ISBN 978 -80-247-5545-8.
SINGH, J. B., 2011. Determinants of the Effectiveness of Corporate Codes of Ethics: An
Empirical Study. Journal of Business Ethics. 101(3), 385-395. ISSN 0167-4544.
TRANSPARENCY INTERNATIONAL – CZECH REPUBLIC, 2006. Průzkum aplikace etických
kodexů. [online]. [accessed: 2018-06-02]. Available at: http://transint.xred.cz/doc
/ve_pruzkum_aplikace_etickych_kodexu.pdf.
TRANSPARENCY INTERNATIONAL – CZECH REPUBLIC, 2008. Korupce a protikorupční
politika ve veřejné správě. [online]. [accessed: 2018-07-01]. Available at:
http://www.prevencekorupce.cz/files/files/korupce_a_protikorupcni_politika.pdf.
TRANSPARENCY INTERNATIONAL – CZECH REPUBLIC, 2015. Každý pátý finanční
manažer v česku řešil v zaměstnání etické dilema. [online]. [accessed: 2018-04-28].
Available at: https://www.transparency.cz/kazdy-paty-financni-manazer-v-cesku-resil-
v-zamestnani-eticke-dilema/.
TRANSPARENCY INTERNATIONAL – CZECH REPUBLIC, 2015. Stát ochrání firmy před
stíháním, ty přitom v boji s konkurencí zaostávají. In: Neovlivní.cz. [online]. [accessed:
2018-04-01]. Available at: http://neovlivni.cz/stat-ochrani-firmy-pred-stihanim-ty-
pritom-v-boji-s-korupci-zaostavaji/.
Littera Scripta, 2018, Volume 11, Issue 2
19
WELLER, S., 1988. The Effectiveness of Corporate Codes of Ethics. Journal of Business
Ethics. 7(5), 389–395. ISSN 0167-4544.
Contact address of the author:
Mgr. Zdeněk Caha, MBA, Ph.D., Faculty of Corporate Strategy, Institute of Technology and
Business in České Budějovice, Okružní 517/10, České Budějovice, 370 01, Czech Republic,
e-mail: [email protected]
CAHA, Z., 2018. Codes of Ethics and the Economic Results of Companies.
Littera Scripta [online]. České Budějovice: Institute of Technology and
Business in České Budějovice, 11(2), 7-19 [accessed: 2018-12-20]. ISSN 1805-
9112. Available at: http://journals.vstecb.cz/category/littera-scripta/11-
rocnik-2018/2_2018/.
20
Dependence of Brand Loyalty
on Customer Relationship Management
Lubica Gajanová, Margareta Nadányiová
University of Žilina
Abstract
Customer relationship management (CRM) is growing in importance due to the
challenging business environment facing organisations around the world. CRM
includes employees, business processes and technologies to maximise customer
loyalty and, as a result, business profitability. This paper focuses on CRM as a tool with
which to strengthen brand loyalty. The aim of the research was to verify the positive
impact of CRM on customer loyalty, respectively brand loyalty for a Slovak company,
i.e. to determine whether there is a statistically significant relationship between
customer relationship management and brand loyalty. This was achieved through the
application of the Chi-square test of independence and subsequent correspondence
analysis. The analysis of the research results confirmed that the more loyal a customer
is to a brand, the more important the CRM activities of the company are with regards
to addressing, acquiring and retaining them, as are their activities for achieving
customer satisfaction and the determination of customer priorities.
Keywords: Customer Relationship Management, brand loyalty.
Introduction
Customer Relationship Management (CRM) is an interactive process designed to achieve
an optimal balance between corporate investment and customer satisfaction. The optimal
balance is determined as that point where both parties achieve maximum profit
(Storbacka and Lehtinen 2002). CRM is a set of tools that promotes marketing, sales, and
customer service within a company. A prerequisite for supporting these tools is perfect
customer knowledge that guarantees the delivery of the product or service at the right
Littera Scripta, 2018, Volume 11, Issue 2
21
time and in the right place (Wessling 2003). CRM includes employees, business processes
and technologies (information systems and information and communication
technologies) to maximise customer loyalty and, as a result, business profitability. It is an
integral part of corporate strategy and is becoming an integral part of corporate culture,
too (Černý 2003). The goal of CRM is to build business relationship strategies that
cultivate these relationships and therefore increase their value and profitability
(Lošťáková, 2009). The fundamental objective of CRM is to create a long-term strategic
partnership that provides added value to all stakeholders (Storbacka and Lehtinen 2002).
Currently, there are a number of technical tools that enable and support CRM to provide
information, analyses and communication, regardless of the overall business strategy.
In other words, the goal of CRM is to describe customer relationships in a sufficiently
detailed manner so that direct sellers can offer products that induce customers to buy
them. Fundamental success in trading is a reflection of the quality of the relationships. A
company must create a desire and give the impression that the product they are offering
is something special. The goals of CRM are to: maintain current customers and increase
their loyalty; acquire new customers; increase customer satisfaction; determine the
priorities of customers; increase profitability of the product portfolio; increase market
share; increase sales; increase profit margins; successfully manage the marketing process
(Kozák 2008). Strong and lasting relationships between a customer and a seller form the
cornerstone of long-term profitability. According to Mitchell (2003), only a customer-
oriented business can acquire loyal customers over time, and with it achieve higher
profitability.
Loyalty can be viewed as a synonym for allegiance or devotion. If the concept is seen from
a sociological point of view, it can be expressed as the allegiance or devotion of someone
towards a particular person or an impersonal organisation. Another insight is that loyalty
is voluntary in nature, that is, the person who proves their loyalty does so of their own
free will and choice. At the same time, however, this generally interacts with the emotional
dimension that narrows this choice (Maříková et al. 1996). For the needs of customer
loyalty research, the definition needs to be more detailed. At a very general level,
customer loyalty is a sense of commitment or affection for a company - its employees,
products or services (Jones and Sasser 1995). According to Kim et al. (2009), loyalty can
broadly be defined as the customer's positive attitude and devotion to a retailer, resulting
in repeated buying behaviour. Nenadal (2001) defines loyalty as the behaviour of a
customer in relation to its market implications in terms of repeated orders and positive
references in the neighbourhood. Loštáková (2007) states that loyalty is dependent on
the level of customer satisfaction, the degree to which this is maintained and the
willingness to recommend products or services to other people.
Many authors deal with loyalty in connection with brands. Brand loyalty has been a
central structure of marketing for almost a century, yet this research topic is still actual
and relevant. Brand loyalty is a complex construct, which leads to many definitions that
are often very different. Pelsmacker et al. (2003) suggest that loyalty is a mentally positive
correlation or relationship between a customer and a brand. Reischeld (1996) defines
Littera Scripta, 2018, Volume 11, Issue 2
22
loyalty as the long-term preference for a brand or firm based on the maximum satisfaction
with the provided value and the positive expectations of the customer for the future.
Jacoby and Kyner (1973) defined brand loyalty with six conditions, videlicet (1) biased
(i.e., non-random), (2) behavioural response (i.e, purchase), (3) expressed over time, (4)
by some decision-making unit, (5) with respect to one or more alternative brands out of
a set of such brands, and (6) is a function of psychological (decision-making evaluative)
processes. The American Marketing Association defines brand loyalty as a situation in
which a consumer generally buys the same manufacturer originated product or service
repeatedly over time rather than buying from multiple suppliers within the category, or
the degree to which a consumer consistently purchases the same brand within a product
class (Moisescu 2006). Aaker (1991) suggests that brand loyalty reflects the likelihood
that a customer will switch to another brand, especially if a brand makes changes to its
price, product function, communication, or distribution channels. Brand loyalty is also
defined as a measure of consumer loyalty to a particular brand as expressed by repeat
purchases, regardless of the market pressure generated by competing brands. When
consumers commit to a brand, they make repeated purchases over time. Brand loyalty is
the result of consumer behaviour and is influenced by personal preferences. Faithful
customers consistently buy the products of their preferred brands, regardless of
convenience or price. Brand loyalty is a key goal and the result of successful marketing
programmes, business initiatives and product development efforts. The core of every
successful brand is the core of loyal customers. They understand the brand better, buy
more often and recommend the brand to others. Roy (2011), referring to Aaker, states
that brand loyalty reflects the extent to which a customer is willing and able to switch
from one brand to another. Tuominen (1999) defines brand loyalty as a positive attitude
towards a brand, which leads to the consistent purchasing of the brand over time. It is the
result of knowing the consumer that only one brand can satisfy its needs. One of the
newest definitions of brand loyalty comes from Chegini (2010) who describes it in terms
of theory, guidance leadership and positive behaviour, including repurchase, support and
offer to purchase, which may influence a new potential customer.
Various typologies of customer loyalty are given for consideration in scientific literature
(Aaker 2003; Gibbsons 2012; Dick and Basu 1994; Jones and Sasser 1995; Kotler and
Keller 2013; Lizbetinová 2017; Moisescu 2006; Reicheld, 2003; Schuller, 2014;
Worthington, 2010). Reichheld and Teal (2001) argue that classical methods of measuring
loyalty and subsequent segmentation are unnecessarily complicated. They present a new
idea, namely that just one question is enough to measure customer loyalty. That question
relates to the willingness of a customer to recommend a brand to other people. From the
results of this one question, it is possible to simply and efficiently generate a single
number (as the authors say "The one number you need to grow."), from which you derive
the current state of brand loyalty. Reichheld (2003) argues that this is also an effective
measurement for testing both the rational and emotional dimensions of a customer.
Littera Scripta, 2018, Volume 11, Issue 2
23
Material and Methods
Based on the analysis of secondary data on the research topic, it can be assumed that
customer relationship management and brand loyalty are dependent. In order to confirm
this hypothesis on the basis of primary data, we conducted empirical research into the
influence of customer relationship management on customer loyalty, respectively brand
loyalty for a Slovak company. At the time of the research, this anonymous company did
not have a CRM strategy or programme in place. For the purposes of this research, data
collection took place in the form of a questionnaire survey. The questionnaire was
developed and distributed online. The expectation was that the research results would
confirm the positive influence of CRM on customer loyalty to the brand of the company.
Based on the research problem identified in the first phase of the research, a method for
selecting a suitable sample, sample size and appropriate survey tools was established. We
defined the customers of the analysed enterprise as the suitable sample. So we had to use
the stratified sampling method. The size of the research sample was determined on the
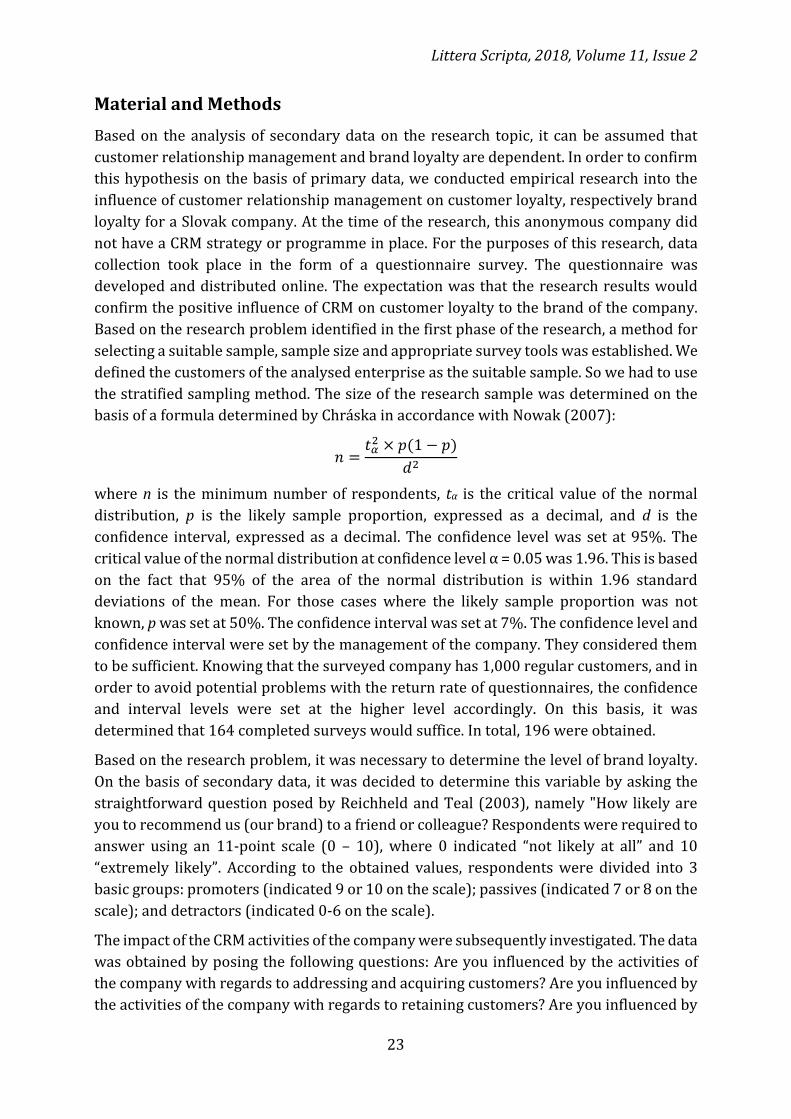
basis of a formula determined by Chráska in accordance with Nowak (2007):
𝑛 =𝑡𝛼2 × 𝑝(1 − 𝑝)
𝑑2
where n is the minimum number of respondents, tα is the critical value of the normal
distribution, p is the likely sample proportion, expressed as a decimal, and d is the
confidence interval, expressed as a decimal. The confidence level was set at 95%. The
critical value of the normal distribution at confidence level α = 0.05 was 1.96. This is based
on the fact that 95% of the area of the normal distribution is within 1.96 standard
deviations of the mean. For those cases where the likely sample proportion was not
known, p was set at 50%. The confidence interval was set at 7%. The confidence level and
confidence interval were set by the management of the company. They considered them
to be sufficient. Knowing that the surveyed company has 1,000 regular customers, and in
order to avoid potential problems with the return rate of questionnaires, the confidence
and interval levels were set at the higher level accordingly. On this basis, it was
determined that 164 completed surveys would suffice. In total, 196 were obtained.
Based on the research problem, it was necessary to determine the level of brand loyalty.
On the basis of secondary data, it was decided to determine this variable by asking the
straightforward question posed by Reichheld and Teal (2003), namely "How likely are
you to recommend us (our brand) to a friend or colleague? Respondents were required to
answer using an 11-point scale (0 – 10), where 0 indicated “not likely at all” and 10
“extremely likely”. According to the obtained values, respondents were divided into 3
basic groups: promoters (indicated 9 or 10 on the scale); passives (indicated 7 or 8 on the
scale); and detractors (indicated 0-6 on the scale).
The impact of the CRM activities of the company were subsequently investigated. The data
was obtained by posing the following questions: Are you influenced by the activities of
the company with regards to addressing and acquiring customers? Are you influenced by
the activities of the company with regards to retaining customers? Are you influenced by
Littera Scripta, 2018, Volume 11, Issue 2
24
the activities of the company with regards to achieving customer satisfaction? Are you
influenced by the activities of the company with regards to determining the priorities of
customers? Respondents were asked to choose from the following options: strongly agree
(SA); agree (A); neither disagree nor agree (NDNA); disagree (D); strongly disagree (SD).
It should be noted that the questions were developed on the basis of the defined objectives
for a CRM system according to Kozak (2008).
The respondent's responses were used to statistically test and confirm or refute the
hypotheses that were set, that is, with regards to the positive influence of customer
relationship management on customer loyalty, respectively brand loyalty. Statistical
hypothesis testing is one of the most important statistical inference procedures. The role
of statistical inference is to decide on the basis of information on the available choices
whether to accept or reject certain hypotheses with respect to the basic sample set. In
order to do so, we proceeded in accordance with the methodology of statistical hypothesis
testing, which consists of the following steps: Formulation of the null hypothesis (H0);
Formulation of the alternative hypothesis (H1); Determination of the level of significance
(α); Calculation of test statistics and probability; and Conclusion (Rimarčík 2007).
The goal of most statistical tests is to evaluate the relationship between variables. The null
hypothesis expresses the independence of those variables. However, in the majority of
cases we want to prove the validity of the alternative hypothesis, which expresses the
actual relationship between the variables. The validity of the alternative hypothesis is
proven indirectly by showing that the null hypothesis is incorrect and the alternative (the
only remaining one) is correct. The null and alternative hypotheses must be mutually
exclusive. The level of significance (α) is the probability of the first type error, which
occurs when the null hypothesis is rejected even though it actually holds true, that is, we
come to the conclusion that there is and there is not a relationship between the variables.
The significance level is traditionally set at between 1% and 10%. For this research, the
significance level was set at 0.05, which corresponds to a confidence interval of 95%. A
confidence level of 95% is sufficient for conjoined analysis because it belongs to the set of
multivariate methods and also combines data on preferences to a greater extent than
standard methods. The test statistic is calculated from the sample set. It has an
appropriate probability distribution based on the validity of the null hypothesis. Because
the primary data in this research is of a nominal nature, the test statistic is a Chi-square
test of independence. The p-value is the probability that the test statistic, assuming the
veracity of the null hypothesis, achieves a value that is at least equal to the value calculated
from the sample set. The p-value is the probability that the relationship found in the
sample is only a consequence of chance. The p-value is the lowest value of the significance
level that leads to the rejection of the null hypothesis. The smaller the p-value is, the more
likely the null hypothesis is not true and should be rejected. If the p-value is so low that
the statement is valid (the null hypothesis is rejected) at the significance level of 0.01 as
well, it can be assumed that there is a statistically significant relationship between the
observed variables. To calculate the test statistic for the hypothesis, IBM SPSS Statistics
software was used. This software also calculates the correlation coefficient. In this case,
Littera Scripta, 2018, Volume 11, Issue 2
25
because the nominal variables are being examined in the number of 3+ x 2+, it was
appropriate to investigate the strength of the dependence between the variables using
Cramer's V measure of association. Cramer’s V is the most common strength test with
which to test data when a significant Chi-square result has been obtained. If the calculated
p-value is less than the determined significance level, the null hypothesis is rejected (thus
the alternative hypothesis is accepted). The conclusion is that the difference found in the
sample set is too large to be reasonably considered as random, so it is statistically
significant. If the p-value is equal to or greater than the established significance level, the
difference found in the sample is not statistically significant and the null hypothesis is not
rejected (Rimarčík 2007; Durica and Svabova 2015; McHugh 2013).
Correspondence analysis is a multivariate graphical technique designed to explore
relationships among categorical variables. When the study variables of interest are
categorical, correspondence analysis is an appropriate technique to explore the
relationships amongst variable response categories and can play a complementary role in
analysing data (Sourial et al. 2010). This method therefore lends itself well to marketing
surveys that explore customer preferences and attitudes, and which seek to assess brand
attractiveness. Examining the internal structure of the variables only makes sense if there
is a dependency between the observed characters (factors). The use of correspondence
analysis must therefore be preceded by the testing of hypotheses on the independence of
the observed characters (Kráľ et al. 2009).
As previously stated, our research was aimed at determining the relationships between
the level of brand loyalty and the activities of the anonymous company with regards to
addressing and acquiring customers, their retention, the achievement of customer
satisfaction and the determination of customer priorities.
Results
Hypothesis A – Level of Brand Loyalty/Addressing and Acquiring Customers
H0: There is not a significant relationship between the level of brand loyalty and the
impact of the activities of the company with regards to addressing and acquiring
customers.
H1: There is a significant relationship between the level of brand loyalty and the impact
of the activities of the company with regards to addressing and acquiring customers.
The calculated test statistics are presented in Table 1.
Table 1: Chi-Square test results for Hypothesis A
Value df Asymptotic Significance (2-sided)
Pearson Chi-square 57.185a 8 0.000
No. of valid responses 196
Source: Authors according to SPSS
Littera Scripta, 2018, Volume 11, Issue 2
26
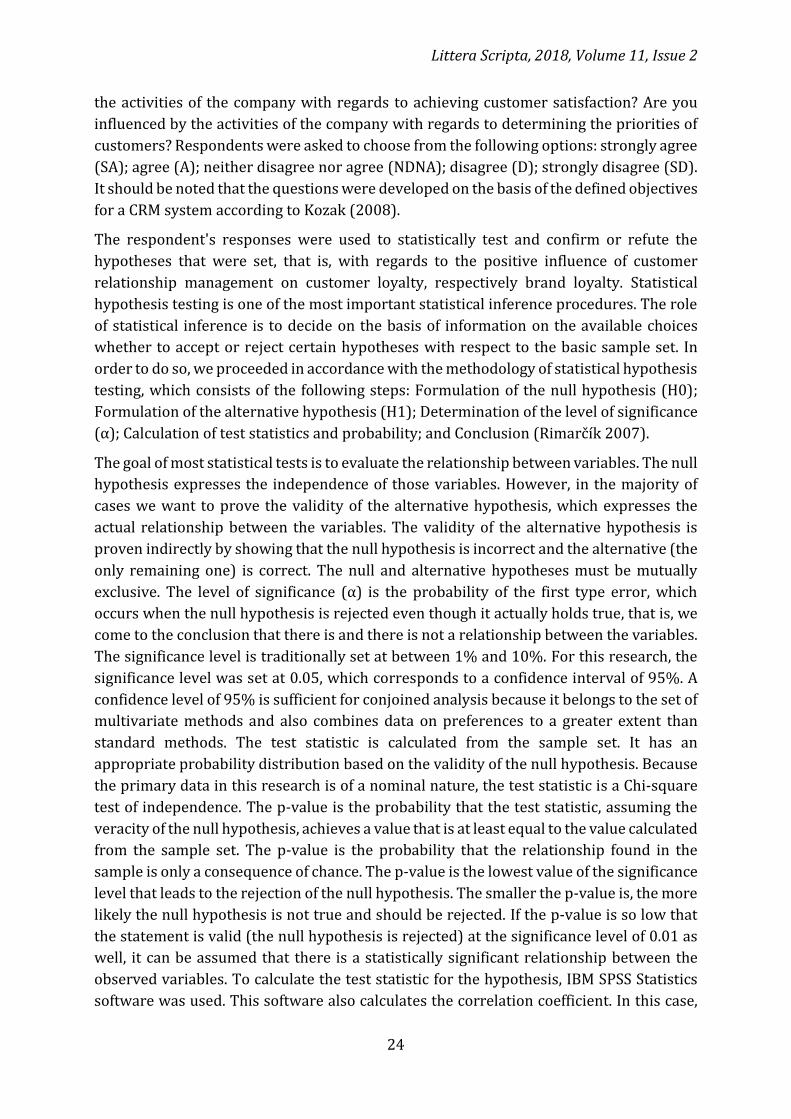
Based on the comparison of the significance level with the p-value (Asymptotic
Significance), the null hypothesis was rejected and the alternative hypothesis confirmed,
i.e. there is a statistically significant relationship between the variables examined. The
intensity of the dependence of the variables according to Cramer's V (0.382) indicates a
moderate dependency. Based on the existence of dependence between the variables, it
made sense to examine the internal structure of the contingency table by conducting a
correspondence analysis. The data were processed using IBM SPSS Statistics software, the
results of which are presented in Figure 1.
Figure 1: Correspondence map - level of brand loyalty/approach and acquisition
Source: Authors according to SPSS
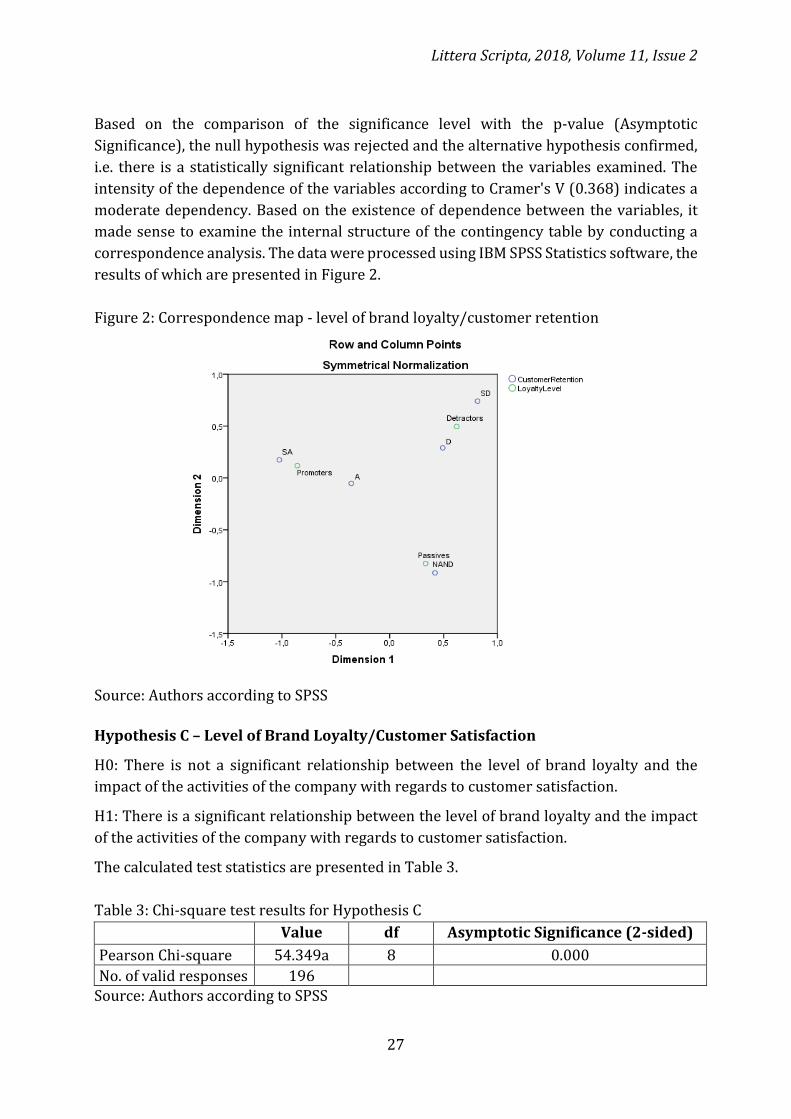
Hypothesis B – Level of Brand Loyalty/Customer Retention
H0: There is not a significant relationship between the level of brand loyalty and the
impact of the activities of the company with regards to customer retention.
H1: There is a significant relationship between the level of brand loyalty and the impact
of the activities of the company with regards to customer retention.
The calculated test statistics are presented in Table 2.
Table 2: Chi-square test results for Hypothesis B
Value df Asymptotic Significance (2-sided)
Pearson Chi-square 53.071a 8 0.000
No. of valid responses 196
Source: Authors according to SPSS
Littera Scripta, 2018, Volume 11, Issue 2
27
Based on the comparison of the significance level with the p-value (Asymptotic
Significance), the null hypothesis was rejected and the alternative hypothesis confirmed,
i.e. there is a statistically significant relationship between the variables examined. The
intensity of the dependence of the variables according to Cramer's V (0.368) indicates a
moderate dependency. Based on the existence of dependence between the variables, it
made sense to examine the internal structure of the contingency table by conducting a
correspondence analysis. The data were processed using IBM SPSS Statistics software, the
results of which are presented in Figure 2.
Figure 2: Correspondence map - level of brand loyalty/customer retention
Source: Authors according to SPSS
Hypothesis C – Level of Brand Loyalty/Customer Satisfaction
H0: There is not a significant relationship between the level of brand loyalty and the
impact of the activities of the company with regards to customer satisfaction.
H1: There is a significant relationship between the level of brand loyalty and the impact
of the activities of the company with regards to customer satisfaction.
The calculated test statistics are presented in Table 3.
Table 3: Chi-square test results for Hypothesis C
Value df Asymptotic Significance (2-sided)
Pearson Chi-square 54.349a 8 0.000
No. of valid responses 196
Source: Authors according to SPSS

Littera Scripta, 2018, Volume 11, Issue 2
28
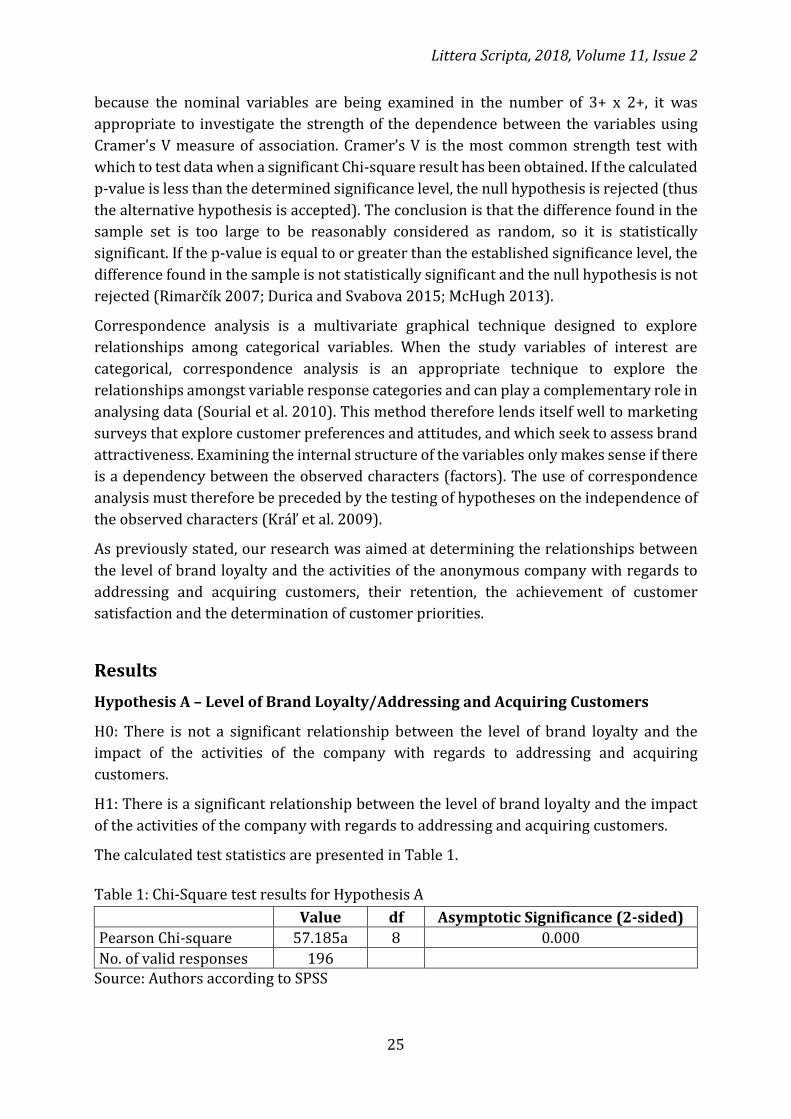
Based on the comparison of the significance level with the p-value (Asymptotic
Significance), the null hypothesis was rejected and the alternative hypothesis confirmed,
i.e. there is a statistically significant relationship between the variables examined. The
intensity of the dependence of the variables according to Cramer's V (0.372) indicates a
moderate dependency. Based on the existence of dependence between the variables, it
made sense to examine the internal structure of the contingency table by conducting a
correspondence analysis. The data were processed using IBM SPSS Statistics software, the
results of which are presented in Figure 3.
Figure 3: Correspondence map – level of brand loyalty/customer satisfaction
Source: Authors according to SPSS
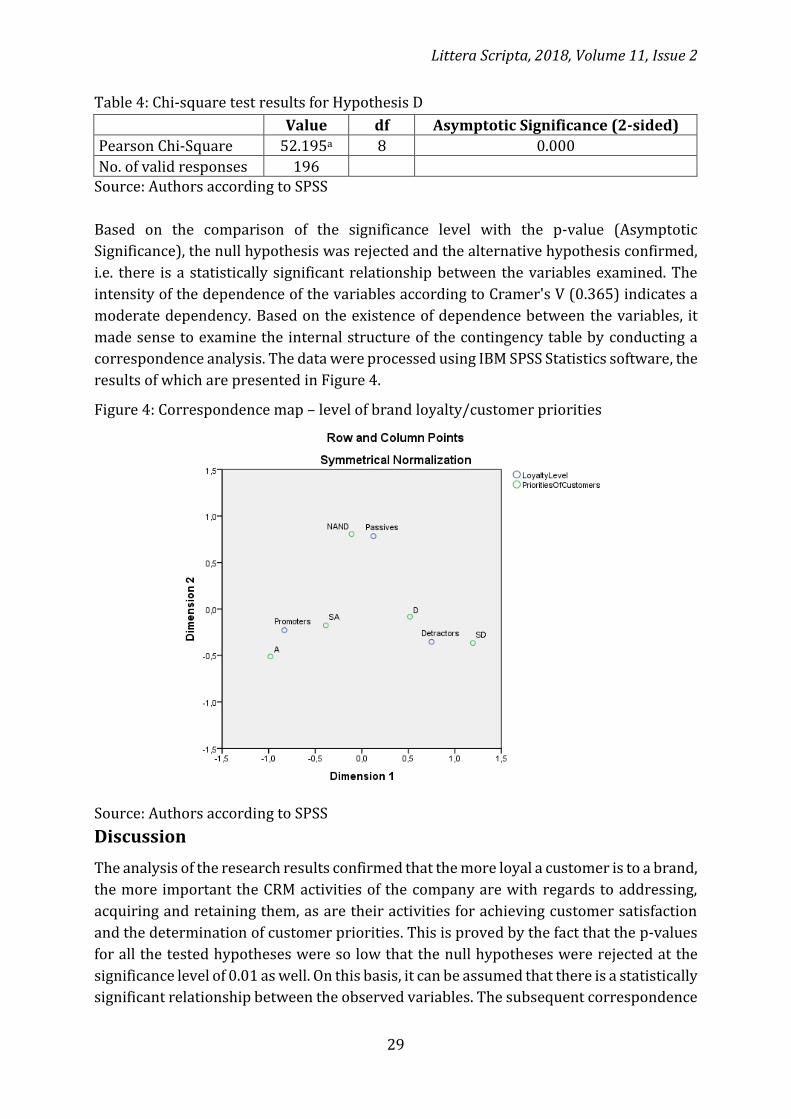
Hypothesis D – Level of Brand Loyalty/Customer Priorities
H0: There is not a significant relationship between the level of brand loyalty and the
impact of the activities of the company with regards to the determination of customer
priorities.
H1: There is a significant relationship between the level of brand loyalty and the impact
of the activities of the company with regards to the determination of customer priorities.
The calculated test statistics are presented in Table 4.
Littera Scripta, 2018, Volume 11, Issue 2
29
Table 4: Chi-square test results for Hypothesis D
Value df Asymptotic Significance (2-sided)
Pearson Chi-Square 52.195a 8 0.000
No. of valid responses 196
Source: Authors according to SPSS
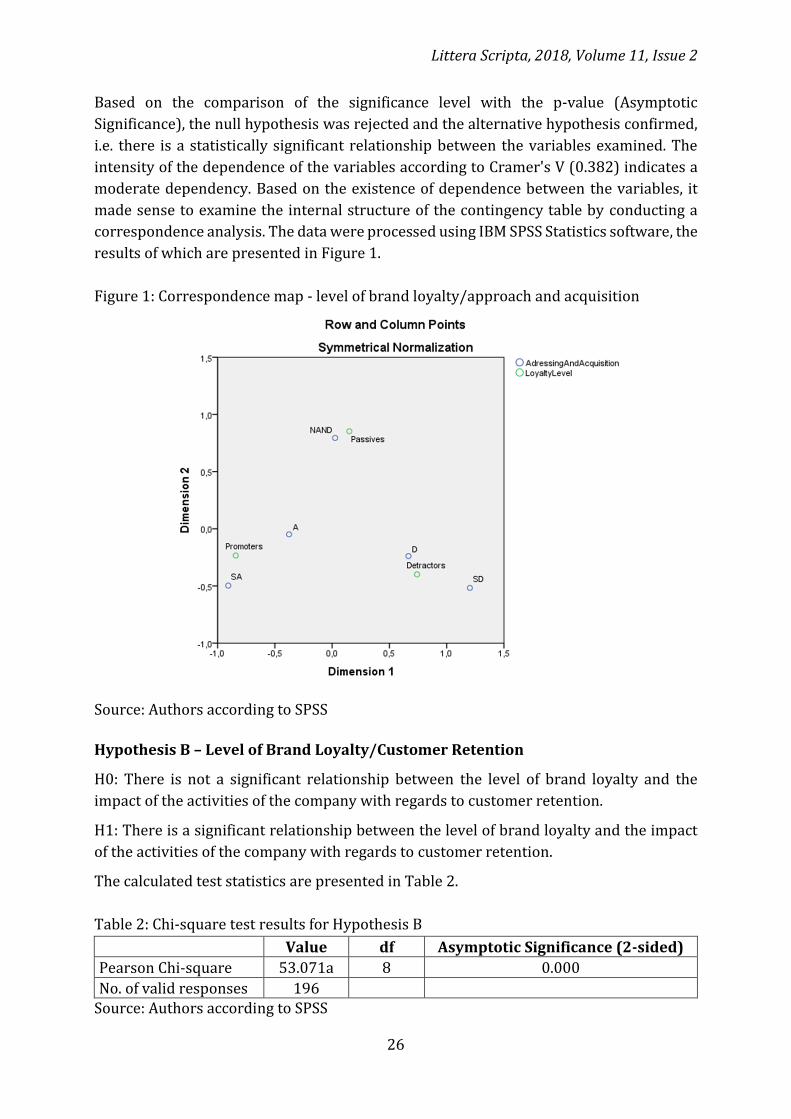
Based on the comparison of the significance level with the p-value (Asymptotic
Significance), the null hypothesis was rejected and the alternative hypothesis confirmed,
i.e. there is a statistically significant relationship between the variables examined. The
intensity of the dependence of the variables according to Cramer's V (0.365) indicates a
moderate dependency. Based on the existence of dependence between the variables, it
made sense to examine the internal structure of the contingency table by conducting a
correspondence analysis. The data were processed using IBM SPSS Statistics software, the
results of which are presented in Figure 4.
Figure 4: Correspondence map – level of brand loyalty/customer priorities
Source: Authors according to SPSS
Discussion
The analysis of the research results confirmed that the more loyal a customer is to a brand,
the more important the CRM activities of the company are with regards to addressing,
acquiring and retaining them, as are their activities for achieving customer satisfaction
and the determination of customer priorities. This is proved by the fact that the p-values
for all the tested hypotheses were so low that the null hypotheses were rejected at the
significance level of 0.01 as well. On this basis, it can be assumed that there is a statistically
significant relationship between the observed variables. The subsequent correspondence
Littera Scripta, 2018, Volume 11, Issue 2
30
analysis revealed that the most loyal customers (promoters) of the company
predominantly strongly agree or agree with the statement that they are influenced by the
activities of the company with regards to addressing, acquiring and retaining them, as are
their activities for achieving customer satisfaction and the determination of customer
priorities, i.e. activities defined as objectives of CRM. In direct contrast to this, the least
loyal customers (detractors) of the company predominantly disagree and strongly
disagree with the same statement. In summary, it can be concluded that more loyal
customers are more influenced by company activities defined as objectives of CRM.
This therefore implies that customer relationship management indeed has a positive
impact on customer brand loyalty for companies. Similar findings were also confirmed in
other research. Lawson-Body and Limay (2004) analysed the impact of customer
relationship management on customer loyalty and found that customer-oriented
partnerships and the personalisation of services had a direct impact on customer loyalty.
This means that an effective CRM strategy increases the customer's social and behavioural
commitment. Amin (2011) found that engagement and dedication to customer
requirements and needs increases customer loyalty. Seyyed Javadin, in accordance with
Mohammadpour (2014), concluded that the main factors influencing customer loyalty
include customer relationship management in the form of manpower, processes and
technology and that all these factors had a significant effect on customer loyalty in his
study. Further research confirms that a significant relationship has been observed
between customer relationship management and customer loyalty. Accordingly, it can be
said that emphasis has to be placed on customer relationship management (Kocoglu and
Kirmaci 2012). The results of another statistical analysis show that customer relationship
management not only has an influence on customer satisfaction, but also on customer
loyalty (Khedkar 2015). Customer loyalty can be achieved through the successful
implementation of a CRM strategy and programme. An effective customer relationship
management strategy is positively linked to customer loyalty. CRM helps organisations to
build long-term relationships with their customers (Kamrul and Rahman 2015). As a
result, emphasis, once again must be placed on customer relationship management. It is
suggested that companies should invest in relationship building and customer intimacy
with loyal customers because it will in turn lead to even greater loyalty (Ndubisi 2004).
Businesses that develop business relationships with customers through frequent product
and service adjustments will have a high customer engagement rate and will win their
loyalty (Weberova 2016). If an organisation truly wants to create a group of loyal
customers, it must use a CRM marketing strategy that leads to a personal dialogue with
each of its clients. In this way, they can slowly recognise them and start using their
feedback to provide the best products and specific services for each one.
Conclusion
This article looked at the influence of customer relationship management on customer
and brand loyalty with regards to the anonymous company at the heart of the research.
Customer relationship management can be considered to be an important tool for the
Littera Scripta, 2018, Volume 11, Issue 2
31
competitiveness of businesses. This is because the strengthening of the relationships with
customers by delivering higher customer value and the application of differentiated
approaches to them can change the relationship to the benefit of both sides and therefore
increase the potential for maintaining customer loyalty. This conclusion is mainly based
on theoretical knowledge and secondary research data. However, this was also confirmed
by the results of our research, which revealed that the most loyal customers of the
company predominantly strongly agree or agree with the statement that they are
influenced by the activities of the company with regards to addressing, acquiring and
retaining them, as are their activities for achieving customer satisfaction and the
determination of customer priorities, i.e. activities defined as objectives of CRM. On the
basis of the research results, the importance and benefits of customer relationship
management in relation to brand loyalty were highlighted, all of which form the
theoretical and practical basis (reasons) for the potential implementation of a CRM
strategy and programme within an enterprise.
Acknowledgement
This paper is an outcome of the science project APVV-15-0505: Integrated model of
management support for building and managing brand value under the specific
conditions of the Slovak Republic.
References
AAKER, D. A., 1991. Managing Brand Equity: Capitalizing on the Value of a Brand Name.
New York: The Free Press. ISBN 978-00-2900-101-1.
AAKER, D. A., 2003. Brand building: budování obchodní značky: vytvoření silné značky a
její úspěšné zavedení na trh. Brno: Computer Press. ISBN 80-7226-885-6.
AMINE, A., 2011. Consumers' true brand loyalty: the central role of commitment. Journal
of Strategic Marketing. 6(4), 305-319. ISSN 1466-4488.
CHRÁSKA, M., 2007. Metody pedagogického výzkumu: Základy kvantitativního výzkumu.
Praha: Grada Publishing. ISBN 80-247-1369-4.
ČERNÝ, V., 2003. Prodejní techniky. Brno: Computer Press. ISBN 80-251-0032-4. 30.
DURICA, M. and SVABOVA, L. 2015. Improvement of company marketing strategy based
on Google search results analysis. Procedia Economics and Finance. 26(-), 454-460. ISSN
2212-5671.
GIBBSONS, P., 2012. The loyalty matrix. In: https://www.walkerinfo.com [online]. 2012.
[accessed: 2018-3-12]. Available at: https://www.walkerinfo.com/docs/WP-The-
Walker-Loyalty-Matrix.pdf.
CHEGINI, M. G., 2010. Customer loyalty and value key dimenssions interaction in
organization. China-USA Business Review. 9(8), 8-14. ISSN 1537-1514.
Littera Scripta, 2018, Volume 11, Issue 2
32
DICK, A. S. and K. BASU, 1994. Customer Loyalty: Towards an Integrated Framework.
Journal of The Academy of Marketing Science. 22(2), 99-113. ISSN 0092-0703.
JACOBY, J. and D. B. KYNER, 1973. Brand Loyalty vs. Repeat Purchasing Behavior. Journal
of Marketing Research. 10(1), 1-9. ISSN 0022-2437.
JONES, T. O. and W. E. SASSER, 1995. Why satisfied customers defect. Harvard Business
Review. 73(6), 88-99. ISSN 0017-8012.
KAMRUL ISLAM SHAON, S. M. and H. Rahman, 2015. A theoretical review of crm effects
on customer satisfaction and loyalty. Central European Business Review. 4(1), 23-36. ISSN
1805-4854.
KHEDKAR, E. B., 2015. Effect of customer relationship management on customer
satisfaction and loyalty. International journal of management. 6(5), 1-7. ISSN 0976-6510.
KIM, J., JIN, B. and J. L. SWINNEX, 2009. The role of etail quality, e-satisfaction and e-trust
in online loyalty developement process. Journal of Retailing and Consumer Services. 16(-),
239-247. ISSN 0969-6989.
KOCOGLU, D. and S. KIRMACI, 2012. Customer relationship management and customer
loyalty; A survey in a sector of banking. International Journal of Business and Social Science.
3(3), 282-291. ISSN 2219-6021
KOTLER, P. and K. L. KELLER, 2013. Marketing management. Praha: Grada Publishing.
ISBN 978-80-247-4150-5.
KOZÁK, V., 2008. Řízení vztahů se zákazníky (CRM) pro firemní praxi. Brno: Tribun. ISBN
978-80-7399-521-8.
KRÁĽ, P. et al., 2010. Viacrozmerné štatistické metódy so zameraním na riešenie problémov
ekonomickej praxe. Banská Bystrica: Univerzita Matej Bela. ISBN 978-80-8083-840-9.
LAWSON-BODY, A. and M. LIMAYEM, 2004. The Impact of Customer Relationship
Management on Customer Loyalty: The Moderating Role of Website Characteristics.
Journal of Computer- Mediated Communication. 9(4), 1-20. ISSN 1083-6101.
LIZBETINOVA, L., 2017. Clusters of Czech Consumers with Focus On Domestic Brands.
Sustainable economic growth, education excellence and innovation management trhough
vision 2020, I-VII. 1703-1718. ISBN 978-0-9860419-7-6.
LOŠŤÁKOVÁ, H., 2007. Loajalita zákazníků a její řízení. Marketing a komunikace. [online]. [accessed: 2011-09-22]. Available at: <http://www.mandk.cz/view.php?cisloclanku= 2007010022>.
LOŠŤÁKOVÁ, H., 2009. Diferencované řízení vztahu se zákazníky. Praha: Grada Publishing.
ISBN 978-80-247-3155-1.
MAŘÍKOVÁ, H. et al., 1996. Velký sociologycký slovník. Praha: Karolinum. ISBN 80-7184-
310-5.
McHUGH, M. L. 2013. The Chi-square test of independence. Biochemia Medica. 23(2), 143-
149. ISSN 1846-7482.
Littera Scripta, 2018, Volume 11, Issue 2
33
MITCHELL, J., 2003. Hug Your Customers: The Proven Way to Personalize Sales and Achieve
Astounding Results. New York: Hachette Books. ISBN 978-1401300340.
MOISESCU, O. I., 2006. A Conceptual Analysis of Brand Loyalty As Core Dimension of Brand
Equity. Competitiveness and Stability in the Knowledge-Based Economy. Craiova: Editura
Universitaria, 1128-1136. ISBN 978-973-742-445-7.
MOHAMMADPOUR, A., HAJNAZARIHERIS, Y. and EBRAHIMPOUR, A., 2014. The efect of
using customr relatinship management systém on customer loyalty case study: Ansar
bank’s branches in east Azarbaijan. Indian Journal of Scientific Research. 8(1), 98-106.
ISSN 2250-0138.
NDUBISI, O. N., 2004. Understanding the salience of cultural dimensions on relationship
marketing, its underpinnings and aftermaths. Cross Cultural Management: An
International Journal. 11(3), 70-89. ISSN: 1352-7606.
NENADÁl, J., 2001. Měření v systémech managementu jakosti. Praha: Management Press.
ISBN 80-7261-054-6.
PELSMACKER, P., M. GEUNES, M. and J. VAN DEN BERGH, 2003. Marketingová komunikace.
Praha: Grada Publishing. ISBN 80-2470-254-1.
REICHELD, F. F. and T. TEAL, 2001. The Loyalty Effect - The hidden forces behind growth,
profits and lasting value. Boston: Harvard Business School Press. ISBN 978-1578516872.
REICHELD, F. F., 2003. The one number you need to grow. Harvard business review.
81(12), 47-54. ISSN 0017-8012.
RIMARČÍK, M., 2007. Štatistika pre prax. ISBN 978-80-969813-1-1.
ROY, S., 2011. Brand Loyalty Measurement A Framework, SCMS Journal of Indian
Management. 8(2), 112-122. ISSN 0973-3167.
SCHULLER, A., 2010. Loyalitätsbasiert: Eine neuem Zielgruppen-Segmentierung. In:
https://www.anneschueller.de/startseite.html. [online]. [accessed: 2018-03-17].
Available at: http://www.anneschueller.de/fachartikel.html.
SOURIAL, N. et al, 2010. Correspondence analysis is a useful tool to uncover the
relationships among categorical variables. Journal of Clinical Epidemiology. 63(6), 638-
646. ISSN 0895-4356.
STORBACKA, K. and J. LEHTINEN, 2002. Řízení vztahú se zákazníky: Customer relationship
management. Praha: Grada Publishing. ISBN 80-7169-813-X.
TUOMINEN, P., 1999. Managing brand equity. The Finnish Journal of Business Economics.
48(1), 65–100. ISSN 0024-3469.
WEBEROVA, D., STARCHON, P. and L. LIZBETINOVA, 2016. Product Information and its
Impact on Consumer Brand Perception. In: VISION 2020: Innovation management,
development sustainability, and competitive economic growth, I-VII. 1964-1974. ISBN 978-
0-9860419-8-3.
Littera Scripta, 2018, Volume 11, Issue 2
34
WESLLING, H., 2003. Aktívni vztah k zákazníkum pomocí CRM. Praha: Grada Publishing.
ISBN: 80-247-0569-9.
WORTHINGTON, S., RUSSELL-BENNETT, R. and C. HARTL, 2010. A Tri-Dimensional
Approach for Auditing Brand Loyalty. Journal of Brand Management. 17(4), 243-253.
ISSN: 1479-1803.
Contact address of the authors:
Ing. Lubica Gajanová, Ph.D., Department of Economics, The Faculty of Operation and
Economics of Transport and Communications, University of Žilina, Univerzitna 1, 010 26
Zilina, Slovakia, e-mail: [email protected]
Ing. Margaréta Nadányiová, PhD., Department of Economics, Faculty of Operation and
Economics of Transport and Communications, University of Žilina, Univerzitná 1, 010 26
Žilina, Slovak Republic, e-mail: [email protected]
GAJANOVÁ, L. and M. NADÁNYIOVÁ, 2018. Dependence of Brand Loyalty on
Customer Relationship Management. Littera Scripta [online]. České
Budějovice: Institute of Technology and Business in České Budějovice, 11(2),
20-34 [accessed: 2018-12-20]. ISSN 1805-9112. Available at:
http://journals.vstecb.cz/category/littera-scripta/11-rocnik-2018/2_2018/.
35
Factors Influencing Employee Turnover and Personnel
Stability in Hotels in Slovakia
Jaroslav Kubaľa, Milota Vetráková
Matej Bel University
Abstract
The development of tourism and hotel management depends on the ability of
managers to recruit qualified employees, create an appropriate working environment
and retain employees. The main issue for managers is to determine how to stabilise
personnel numbers and reduce employee turnover. The main aim of this paper is
therefore to identify the key factors that affect employee turnover and personnel
stability in Slovak hotels. The research was conducted in selected hotels operating in
Slovakia. The results revealed that poor career prospects and non-transparent and
unfair remuneration have the greatest impact on employee turnover and personnel
stability. It was also shown that personnel stability is mostly influenced by an
appropriate corporate culture and personal recognition.
Key words: Employee turnover, hotel, personnel stability, employees.
Introduction
A hotel is a difficult and complex organism that consists of a whole range of activities and
processes. Employees represent the most important resource for the existence and
development of this organism. Within this context, human resources management is a
challenging process, the results of which depend on the prosperity, progress and success
of a hotel. The importance and the role of employees in the work process has been
discussed in a wide variety of contexts, but clear evidence of their true value is the
situation in hotels that lack the right people. The situation becomes even more
complicated when the need for competent, loyal and efficient employees is more urgent.
In both cases, the implications for hotel management should not only be an impulse for
reflection, but also for improving the range and the depth of the system of work with
people.
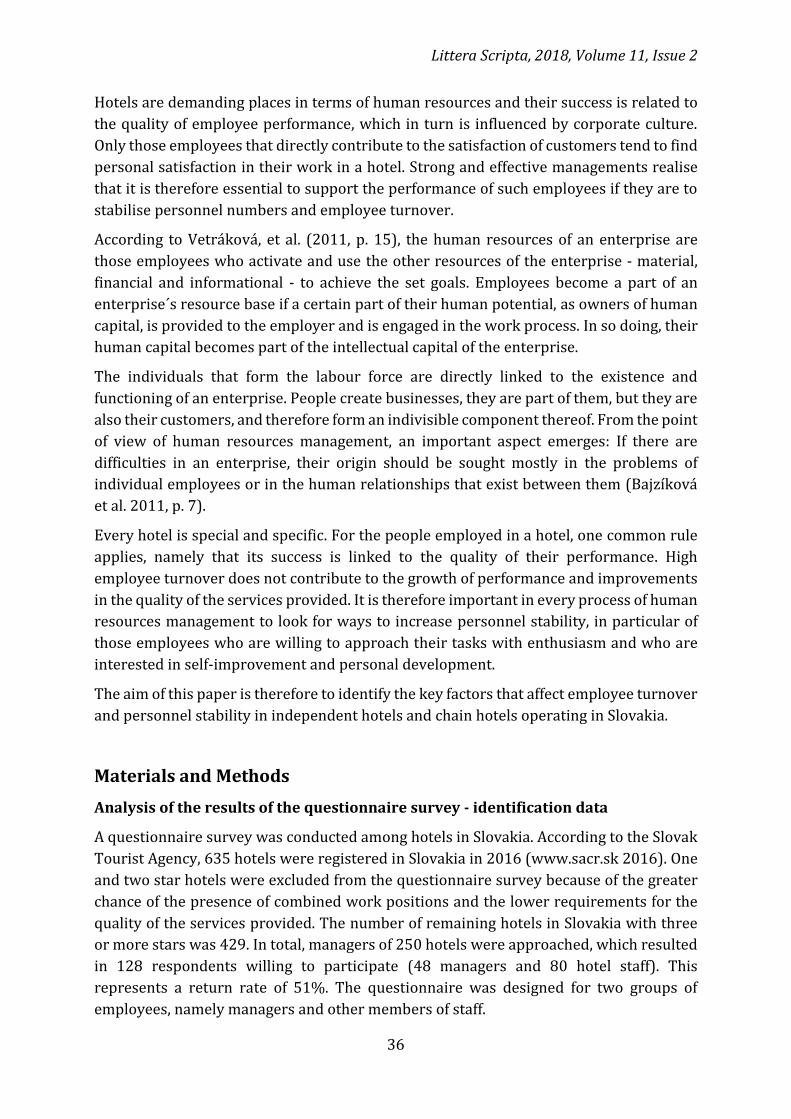
Littera Scripta, 2018, Volume 11, Issue 2
36
Hotels are demanding places in terms of human resources and their success is related to
the quality of employee performance, which in turn is influenced by corporate culture.
Only those employees that directly contribute to the satisfaction of customers tend to find
personal satisfaction in their work in a hotel. Strong and effective managements realise
that it is therefore essential to support the performance of such employees if they are to
stabilise personnel numbers and employee turnover.
According to Vetráková, et al. (2011, p. 15), the human resources of an enterprise are
those employees who activate and use the other resources of the enterprise - material,
financial and informational - to achieve the set goals. Employees become a part of an
enterprise´s resource base if a certain part of their human potential, as owners of human
capital, is provided to the employer and is engaged in the work process. In so doing, their
human capital becomes part of the intellectual capital of the enterprise.
The individuals that form the labour force are directly linked to the existence and
functioning of an enterprise. People create businesses, they are part of them, but they are
also their customers, and therefore form an indivisible component thereof. From the point
of view of human resources management, an important aspect emerges: If there are
difficulties in an enterprise, their origin should be sought mostly in the problems of
individual employees or in the human relationships that exist between them (Bajzíková
et al. 2011, p. 7).
Every hotel is special and specific. For the people employed in a hotel, one common rule
applies, namely that its success is linked to the quality of their performance. High
employee turnover does not contribute to the growth of performance and improvements
in the quality of the services provided. It is therefore important in every process of human
resources management to look for ways to increase personnel stability, in particular of
those employees who are willing to approach their tasks with enthusiasm and who are
interested in self-improvement and personal development.
The aim of this paper is therefore to identify the key factors that affect employee turnover
and personnel stability in independent hotels and chain hotels operating in Slovakia.
Materials and Methods
Analysis of the results of the questionnaire survey - identification data
A questionnaire survey was conducted among hotels in Slovakia. According to the Slovak
Tourist Agency, 635 hotels were registered in Slovakia in 2016 (www.sacr.sk 2016). One
and two star hotels were excluded from the questionnaire survey because of the greater
chance of the presence of combined work positions and the lower requirements for the
quality of the services provided. The number of remaining hotels in Slovakia with three
or more stars was 429. In total, managers of 250 hotels were approached, which resulted
in 128 respondents willing to participate (48 managers and 80 hotel staff). This
represents a return rate of 51%. The questionnaire was designed for two groups of
employees, namely managers and other members of staff.
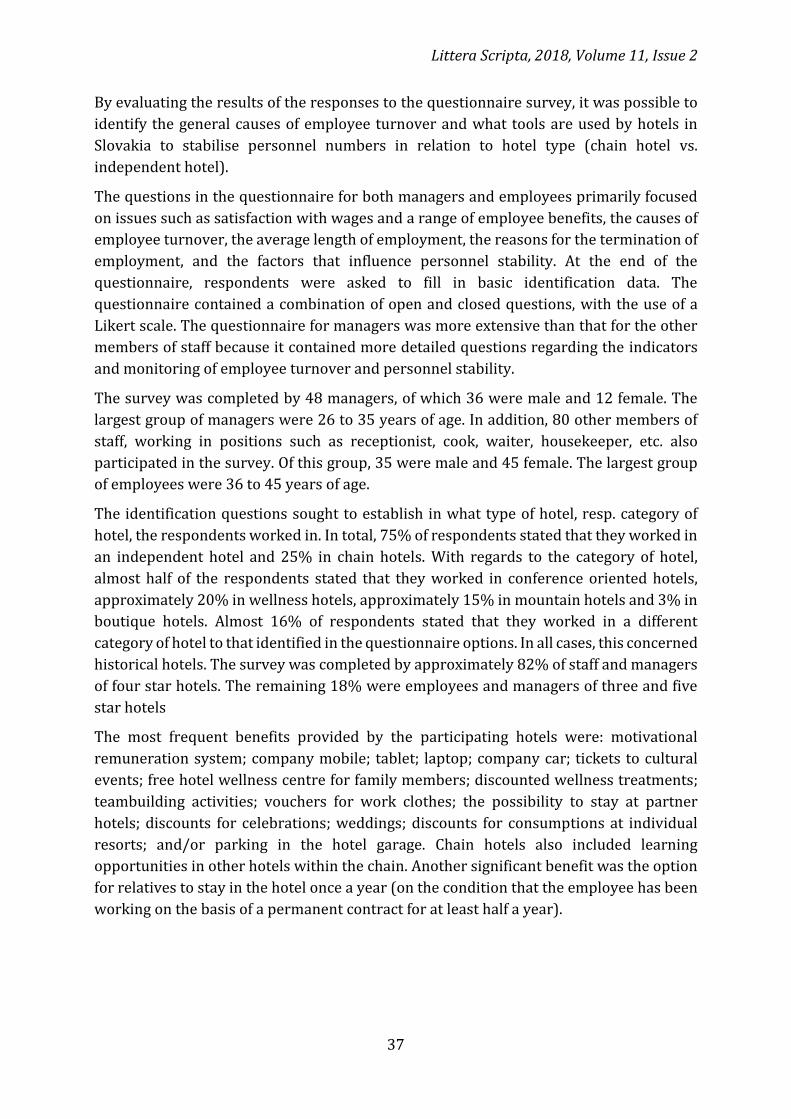
Littera Scripta, 2018, Volume 11, Issue 2
37
By evaluating the results of the responses to the questionnaire survey, it was possible to
identify the general causes of employee turnover and what tools are used by hotels in
Slovakia to stabilise personnel numbers in relation to hotel type (chain hotel vs.
independent hotel).
The questions in the questionnaire for both managers and employees primarily focused
on issues such as satisfaction with wages and a range of employee benefits, the causes of
employee turnover, the average length of employment, the reasons for the termination of
employment, and the factors that influence personnel stability. At the end of the
questionnaire, respondents were asked to fill in basic identification data. The
questionnaire contained a combination of open and closed questions, with the use of a
Likert scale. The questionnaire for managers was more extensive than that for the other
members of staff because it contained more detailed questions regarding the indicators
and monitoring of employee turnover and personnel stability.
The survey was completed by 48 managers, of which 36 were male and 12 female. The
largest group of managers were 26 to 35 years of age. In addition, 80 other members of
staff, working in positions such as receptionist, cook, waiter, housekeeper, etc. also
participated in the survey. Of this group, 35 were male and 45 female. The largest group
of employees were 36 to 45 years of age.
The identification questions sought to establish in what type of hotel, resp. category of
hotel, the respondents worked in. In total, 75% of respondents stated that they worked in
an independent hotel and 25% in chain hotels. With regards to the category of hotel,
almost half of the respondents stated that they worked in conference oriented hotels,
approximately 20% in wellness hotels, approximately 15% in mountain hotels and 3% in
boutique hotels. Almost 16% of respondents stated that they worked in a different
category of hotel to that identified in the questionnaire options. In all cases, this concerned
historical hotels. The survey was completed by approximately 82% of staff and managers
of four star hotels. The remaining 18% were employees and managers of three and five
star hotels
The most frequent benefits provided by the participating hotels were: motivational
remuneration system; company mobile; tablet; laptop; company car; tickets to cultural
events; free hotel wellness centre for family members; discounted wellness treatments;
teambuilding activities; vouchers for work clothes; the possibility to stay at partner
hotels; discounts for celebrations; weddings; discounts for consumptions at individual
resorts; and/or parking in the hotel garage. Chain hotels also included learning
opportunities in other hotels within the chain. Another significant benefit was the option
for relatives to stay in the hotel once a year (on the condition that the employee has been
working on the basis of a permanent contract for at least half a year).
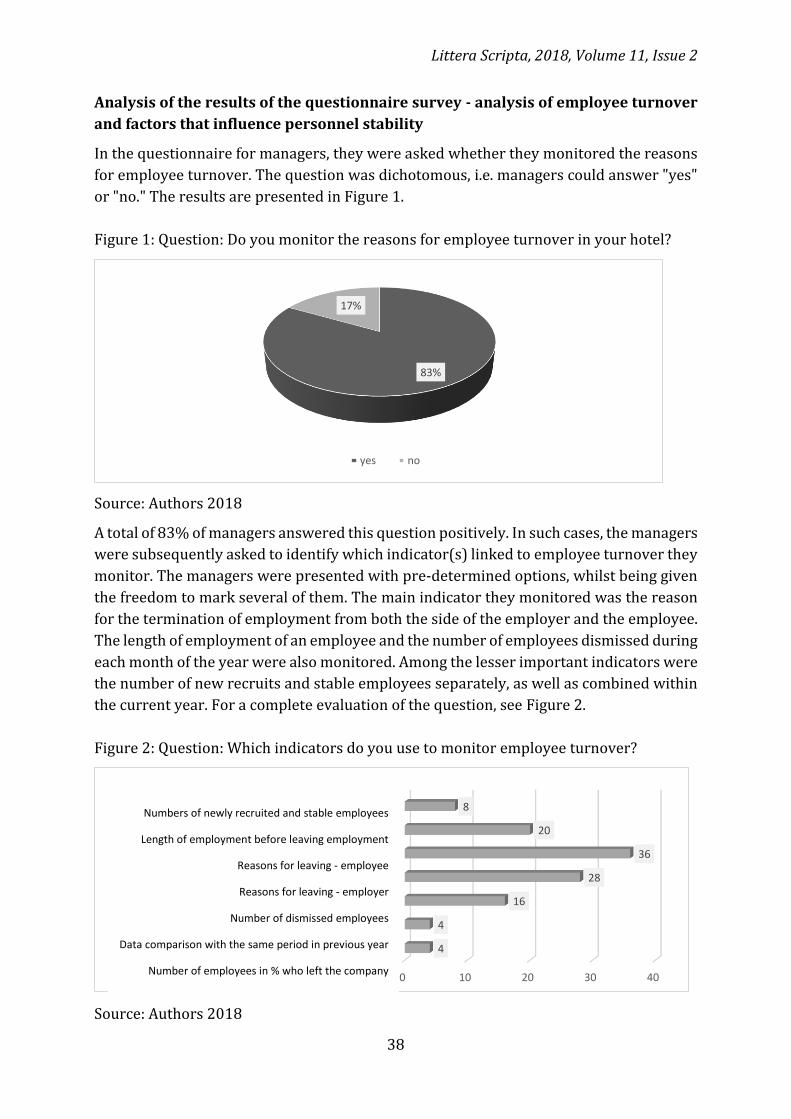
Littera Scripta, 2018, Volume 11, Issue 2
38
Analysis of the results of the questionnaire survey - analysis of employee turnover
and factors that influence personnel stability
In the questionnaire for managers, they were asked whether they monitored the reasons
for employee turnover. The question was dichotomous, i.e. managers could answer "yes"
or "no." The results are presented in Figure 1.
Figure 1: Question: Do you monitor the reasons for employee turnover in your hotel?
Source: Authors 2018
A total of 83% of managers answered this question positively. In such cases, the managers
were subsequently asked to identify which indicator(s) linked to employee turnover they
monitor. The managers were presented with pre-determined options, whilst being given
the freedom to mark several of them. The main indicator they monitored was the reason
for the termination of employment from both the side of the employer and the employee.
The length of employment of an employee and the number of employees dismissed during
each month of the year were also monitored. Among the lesser important indicators were
the number of new recruits and stable employees separately, as well as combined within
the current year. For a complete evaluation of the question, see Figure 2.
Figure 2: Question: Which indicators do you use to monitor employee turnover?
Source: Authors 2018
83%
17%
yes no
0 10 20 30 40
4
4
16
28
36
20
8Numbers of newly recruited and stable employees
Length of employment before leaving employment
Reasons for leaving - employee
Reasons for leaving - employer
Number of dismissed employees
Data comparison with the same period in previous year
Number of employees in % who left the company

Littera Scripta, 2018, Volume 11, Issue 2
39
The results presented in Figure 2 reveal that managers are more interested in monitoring
the reasons why employees terminate their work contract than in quantitative indicators
such as the numbers of newly recruited employees, dismissed employees, or the
percentage of employees who left the hotel in a given year.
The next question in the manager´s questionnaire focused on finding out whether and to
what degree managers apply quantitative measures to monitor employee turnover and
personnel stability in the hotel they operate in. The results are presented in Figure 3
below.
Figure 3: Question: Which quantitative measures do you apply to monitor
employee turnover and personnel stability?
Source: Authors 2018
Of the total number of managers that responded, more than half (58%) only use
estimation to determine the rate of employee turnover and the level of personnel stability.
The rate of employee turnover is monitored only by 17% of the managers, with only 8%
monitoring the level of personnel stability. A further 8% of managers either do not apply
quantitative measures at all or use other means to assess the total number of employees
leaving the hotel. In these cases, they state that they are particularly interested in the
reasons why an employee leaves. This is confirmed by the results attained through the
responses to the previous question.
The next question sought to determine whether managers are able to put a figure on the
percentage of employee turnover in the hotel they operate in. The results are presented
in Figure 4 below.
0% 20% 40% 60%
17%
8%
8%
58%
8%We apply other methods
We only use an estimate
We do not measure staff turnover or stability
We apply stability indicators
We apply indicators of staff turnover
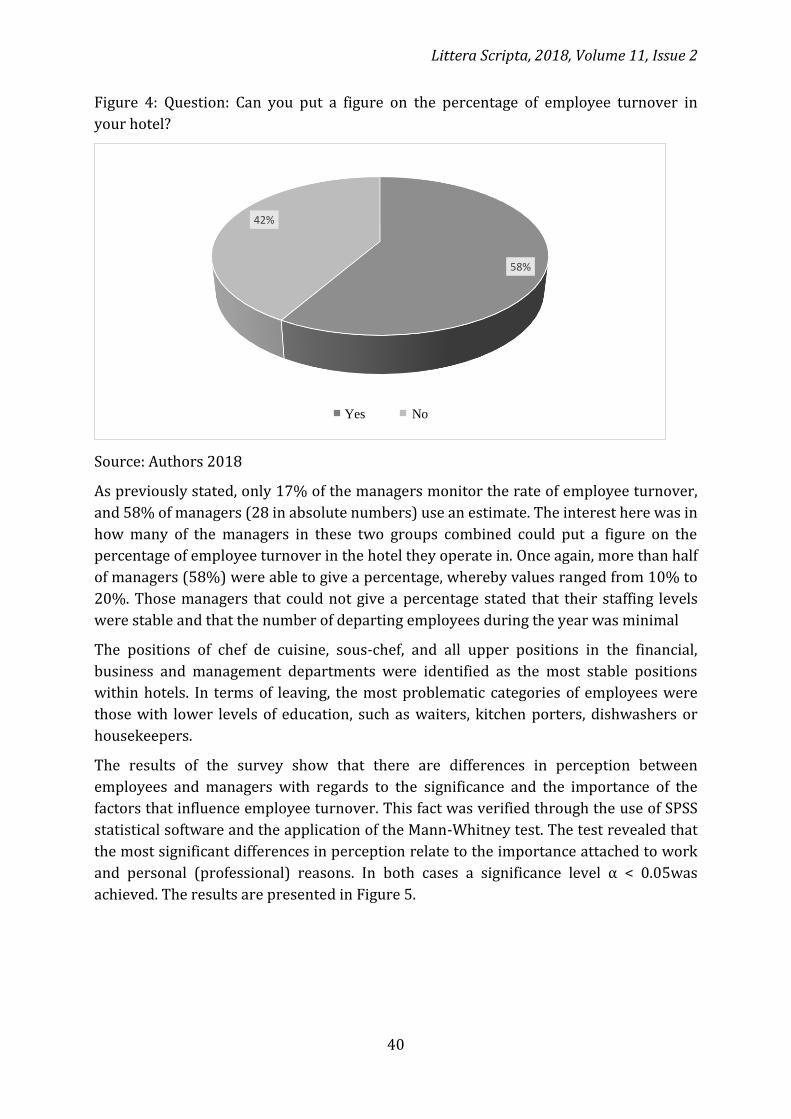
Littera Scripta, 2018, Volume 11, Issue 2
40
Figure 4: Question: Can you put a figure on the percentage of employee turnover in
your hotel?
Source: Authors 2018
As previously stated, only 17% of the managers monitor the rate of employee turnover,
and 58% of managers (28 in absolute numbers) use an estimate. The interest here was in
how many of the managers in these two groups combined could put a figure on the
percentage of employee turnover in the hotel they operate in. Once again, more than half
of managers (58%) were able to give a percentage, whereby values ranged from 10% to
20%. Those managers that could not give a percentage stated that their staffing levels
were stable and that the number of departing employees during the year was minimal
The positions of chef de cuisine, sous-chef, and all upper positions in the financial,
business and management departments were identified as the most stable positions
within hotels. In terms of leaving, the most problematic categories of employees were
those with lower levels of education, such as waiters, kitchen porters, dishwashers or
housekeepers.
The results of the survey show that there are differences in perception between
employees and managers with regards to the significance and the importance of the
factors that influence employee turnover. This fact was verified through the use of SPSS
statistical software and the application of the Mann-Whitney test. The test revealed that
the most significant differences in perception relate to the importance attached to work
and personal (professional) reasons. In both cases a significance level α < 0.05was
achieved. The results are presented in Figure 5.
58%
42%
áno nie Yes No
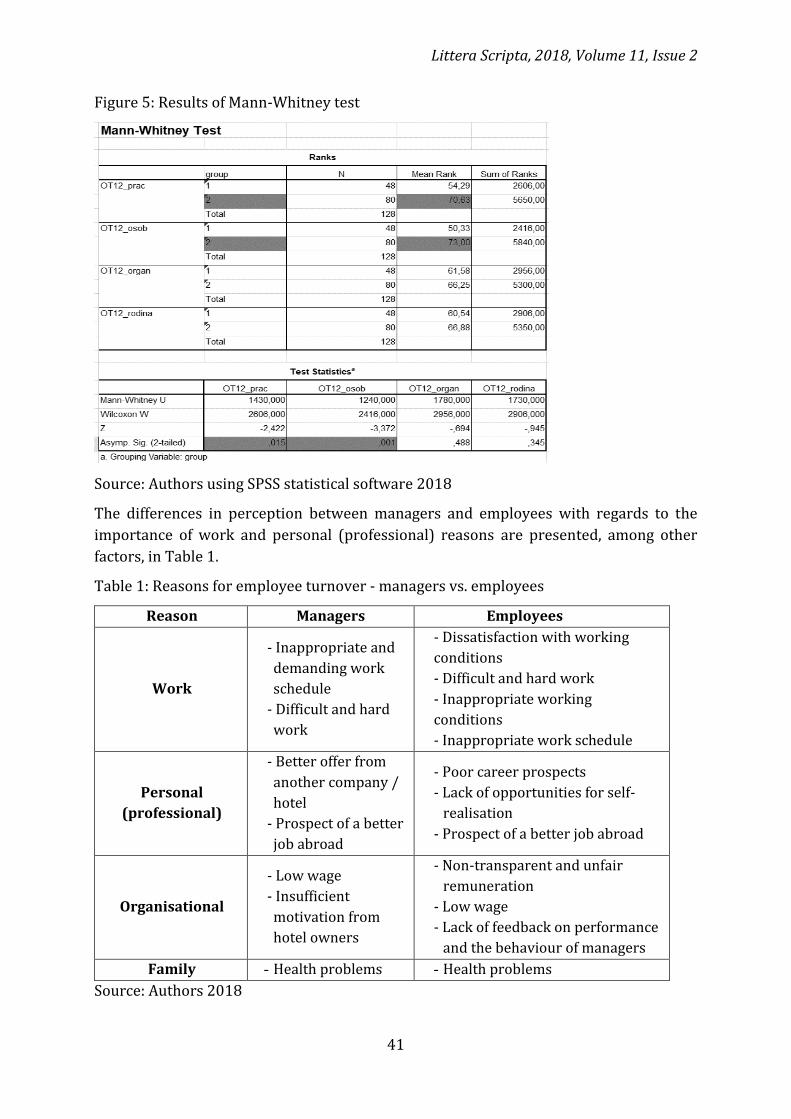
Littera Scripta, 2018, Volume 11, Issue 2
41
Figure 5: Results of Mann-Whitney test
Source: Authors using SPSS statistical software 2018
The differences in perception between managers and employees with regards to the
importance of work and personal (professional) reasons are presented, among other
factors, in Table 1.
Table 1: Reasons for employee turnover - managers vs. employees
Reason Managers Employees
Work
- Inappropriate and
demanding work
schedule
- Difficult and hard
work
- Dissatisfaction with working
conditions
- Difficult and hard work
- Inappropriate working
conditions
- Inappropriate work schedule
Personal
(professional)
- Better offer from
another company /
hotel
- Prospect of a better
job abroad
- Poor career prospects
- Lack of opportunities for self-
realisation
- Prospect of a better job abroad
Organisational
- Low wage
- Insufficient
motivation from
hotel owners
- Non-transparent and unfair
remuneration
- Low wage
- Lack of feedback on performance
and the behaviour of managers
Family - Health problems - Health problems
Source: Authors 2018

Littera Scripta, 2018, Volume 11, Issue 2
42
Although managers believe that recognition is one of the most important factors
influencing personnel stability, employees disagree and state that career development
and personal growth are more important. These and other differences between managers
and employees are presented in Table 2 below.
Table 2: Factors influencing personnel stability - managers vs. employees
Managers Employees
Factors
- Recognition
- Appropriate
corporate culture
- Transparent
remuneration
- Career development and
personal growth
- Possibility of increased wages
during career
- Recognition
- Transparent and fair
remuneration
Source: Authors 2018
As part of the analysis of the research results, confirmation was sought of the link between
the personal and professional development of employees and the level of personnel
stability in hotels. The calculated Spearman coefficients confirmed the dependence of the
two variables and the appropriateness of the corporate culture. The Spearman coefficient
results are presented in Figure 6.
Figure 6: Results of Spearman's coefficient calculations
Source: Authors using SPSS statistical software 2018
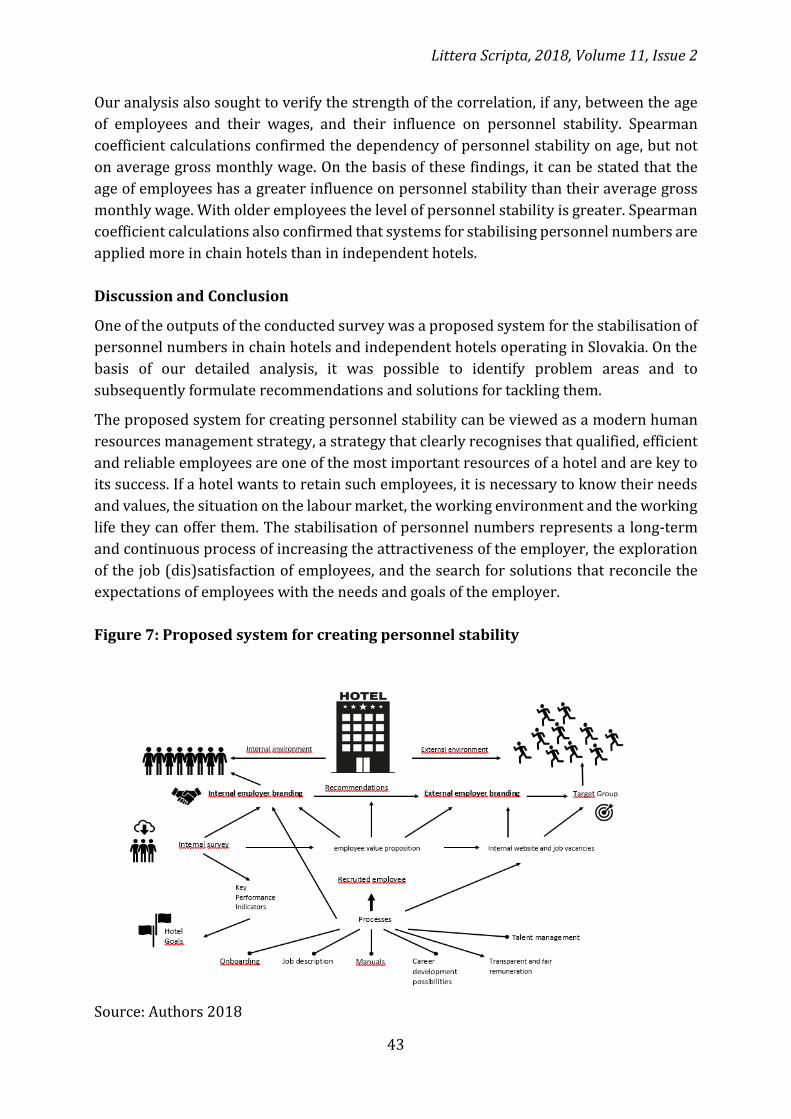
Littera Scripta, 2018, Volume 11, Issue 2
43
Our analysis also sought to verify the strength of the correlation, if any, between the age
of employees and their wages, and their influence on personnel stability. Spearman
coefficient calculations confirmed the dependency of personnel stability on age, but not
on average gross monthly wage. On the basis of these findings, it can be stated that the
age of employees has a greater influence on personnel stability than their average gross
monthly wage. With older employees the level of personnel stability is greater. Spearman
coefficient calculations also confirmed that systems for stabilising personnel numbers are
applied more in chain hotels than in independent hotels.
Discussion and Conclusion
One of the outputs of the conducted survey was a proposed system for the stabilisation of
personnel numbers in chain hotels and independent hotels operating in Slovakia. On the
basis of our detailed analysis, it was possible to identify problem areas and to
subsequently formulate recommendations and solutions for tackling them.
The proposed system for creating personnel stability can be viewed as a modern human
resources management strategy, a strategy that clearly recognises that qualified, efficient
and reliable employees are one of the most important resources of a hotel and are key to
its success. If a hotel wants to retain such employees, it is necessary to know their needs
and values, the situation on the labour market, the working environment and the working
life they can offer them. The stabilisation of personnel numbers represents a long-term
and continuous process of increasing the attractiveness of the employer, the exploration
of the job (dis)satisfaction of employees, and the search for solutions that reconcile the
expectations of employees with the needs and goals of the employer.
Figure 7: Proposed system for creating personnel stability
Source: Authors 2018
Littera Scripta, 2018, Volume 11, Issue 2
44
The results from the conducted survey show that chain hotels have developed systems in
place in the form of internal documents to promote greater personnel stability. It is for
this reason that the proposed system for personnel stability, as presented in this paper, is
more oriented towards independent hotels. It should be noted that personnel stability is
a process that is always affected by the staff of a hotel.
The proposed system for creating personnel stability contains key elements, including
employer branding - the creation of unique/key values of the employer: (a) target group
definition; (b) defined job advertisement as a marketing tool; (c) defined search and
recruitment channels; (d) transparent remuneration system; (e) elimination of factors
that influence the termination of employment; and (f) defined career development
options for employees (including for existing personnel).
The value, importance and role of people in the work process is beyond question. As
stated by Vetráková (2017), working with people in the work process, i.e. with human
resources, is a significant and important activity in the entire management system of a
hotel.
In the rapidly changing market environment, it is imperative that hotels know where their
competitive advantage lies and what form(s) this takes. In tourism businesses, human
capital is a basic prerequisite for their success. Mikoláš (2005) suggests that there is a
new dimension to a company's competitiveness, one that involves an interdisciplinary
view and which is very closely connected with the intangible value of an enterprise. The
overall market value of an enterprise is not only financial, but also intellectual capital, the
core of which is human capital. Human capital is therefore an irreplaceable asset for every
enterprise.
References
ALONSO, A.D. and M. A. O’NEILL, 2009. Staffing issues among small hospitality
businesses: a college town case. International Journal of Hospitality Management. 28(4),
573–578. ISSN 1447-6770.
BAJZÍKOVÁ, Ľ. et al., 2011. Manažment ľudských zdrojov. 4. vyd. Bratislava: Univerzita
Komenského. ISBN 978-80-223-2989-7.
BAUM, T. 2008. Implications of hospitality and tourism labour markets for talent
management strategies. International Journal of Contemporary Hospitality Management.
20(7), 720-729. ISSN 0959-6119.
FITZ-ENZ, J. 2010. The New HR Analytics: Predicting the Economic Value of Your Companys
Human Capital Investments. New York: Amacom. ISBN 978-0-8144-1643-3.
DAVIDSON, M., MCPHAIL, R. and S. BARRY, 2011. Hospitality HRM: past, present and the
future. International Journal of Contemporary Hospitality Management. 23(4), 498-516.
ISSN 0959-6119.
Littera Scripta, 2018, Volume 11, Issue 2
45
CHALKITI, K. and M. SIGALA, 2010. Staff turnover in the Greek tourism industry:
a comparison between Insular and Peninsular regions. International Journal of
Contemporary Hospitality Management. 22(3), 335–359. ISSN 0959-6119.
CHO, S. et al., 2006. Measuring the impact of human resource management practices on
hospitality firms’ performances. International Journal of Hospitality Management. 25(2),
262–277. ISSN 1447-6770.
KULLOVÁ, Z. 2008. Ako stúpať v kariére stále nahor. In: Internetový portál
pravda.sk [online]. [accessed: 2015-10-25] Available at:
http://spravy.pravda.sk/ekonomika/clanok/187737-ako-stupat-v-kariere-stale-nahor/
LUCAS, R. and M. DEERY, 2004. Significant developments and emerging issues in human
resource management. International Journal of Hospitality Management. 23(3), 459 – 472.
ISSN 1447-6770.
MIKOLÁŠ, Z. 2005. Jak zvýšit konkurenceschopnost podniku. Konkurenční potenciál
a dynamika podnikaní. Praha : Grada Publishing. ISBN 80-247-1277-6.
REISS, CH. 2008. Fluktuation: Mitarbeiterfluktuation [online]. [accessed 2015-09-23].
Available at: http://www.personaler-online.de/typo3/fluktuation/kosten-der-
fluktuation.html
VETRÁKOVÁ, M., 2011. Ľudské zdroje a ich riadenie. Banská Bystrica : Univerzita Mateja
Bela. ISBN 978-80-557-0149-3.
VETRÁKOVÁ, M. 2017. Riadenie ľudských zdrojov v ubytovacích zariadeniach hotelového
typu. Bratislava : Wolters Kluwer. ISBN 978-80-8168-612-2.
Contact address of the authors
Ing. Jaroslav Kubaľa, Department of Tourism and Hospitality, Faculty of Economics, Matej
Bel University, Tajovskeho 10, Banska Bystrica, Slovakia, email:
Prof. Ing. Milota Vetráková PhD., Department of Tourism and Hospitality, Faculty of
Economics, Matej Bel University, Tajovskeho 10, Banska Bystrica, Slovakia, email:
KUBAĽA J. and M. VETRÁKOVÁ, 2018. Factors Influencing Employee Turnover
and Personnel Stability in Hotels in Slovakia. Littera Scripta [online]. České
Budějovice: Institute of Technology and Business in České Budějovice, 11(2),
35-45 [accessed: 2018-12-20]. ISSN 1805-9112. Available at:
http://journals.vstecb.cz/category/littera-scripta/11-rocnik-2018/2_2018/.

46
Innovative Method for Assessing the Quality of Special Wood
Products during the Production Process
Eva Ružinská
Institute of Technology and Business in České Budějovice
Abstract
Innovations in the assortment of special wood products made by small
manufacturers, and not by major manufacturers in terms of quality and
environmental credentials, enables them to compete successfully on the market. For
the final phase of the production process, these products require a precisely chosen
surface finishing treatment.
The purpose of wood treatment is to protect a specific adherend against the adverse
effects of external influences, as well as mechanical, chemical and biological damage.
The requirements for the quality of the surface treatment are dependent on the
function and purpose of a particular product.
At present, beyond surface characteristics, there are no other evaluation criteria that
take into account the diverse morphological characteristics of wood, e.g. reflectance
as a result of the surface reaction of wood to the application of different types and
layers of coatings.
The research presented in this article focuses on determining the most important
qualitative criteria with regards to the surface treatment of special wood products
(by assessing the morphological characteristics of the wood´s surface by means of
an experimental optical laser) during the production process of these products, which
are produced by a limited number of small manufacturers, are produced in an
environmentally friendly way, and are competitive and sustainable.
Keywords: qualitative criteria, production process, innovative optical laser
Littera Scripta, 2018, Volume 11, Issue 2
47
Introduction
At present, the issue of the impact of environmentally friendly technologies is still
relevant. Within this context, it is necessary to build an optimal production chain, one that
is effective, but environmentally friendly, yet economically efficient, competitive and
sustainable in the market, and which delivers products according to customer demands
as a result of innovative production processes (Brashaw 2009; Lindermann et al. 2013,
Ružinská 2015b, 2018b).
The production process, as the main activity of a production company, directly influences
the efficiency of a business and the ability of its products to compete under competitive
market conditions (Caha 2017; Grewal 2008; Synek et al. 2007; Vochozka et al. 2011,
2015; Lindermann et al. 2013). This relies on the minimisation, respectively optimisation
of inputs and the maximisation of outputs.
For small producers in these markets to supply customers with desirable products
requires a lot of effort and innovation. Their success in markets dominated by large
manufacturers depends on the uniqueness of their products, effective management of
quality, environmental credentials, and the requirements of customers (Grewal 2008;
Guerrero et al. 2017; Lindermann et al. 2013; Sujová et al. 2015).
The innovativeness of special wood products is determined by the identification of all the
decisive factors in the production management process. The most important factor is the
preparation of the substrate, i.e. wood for subsequent surface treatment. Of similar
importance is the selection of the desired product quality criteria. However, although
relevant qualitative criteria exist for a wide range of products, such as furniture or
construction materials, this does not apply to special wood products (sports articles, toys,
jewellery, music instruments, gift items, etc.) (Kalendová 2004; Kúdela and Liptáková
2005; Jabloński et al. 2009; Sedliačik et al. 2013; Zhong et al., 2013; Badida et al. 2016;
Seabra et al. 2017; Ružinská 2018a).
The aim of the research presented in this article was therefore to empirically determine
the most important qualitative criteria for the evaluation of the surface finishing
treatment of special wood products. The focus was on the application of our own
experimental method (optical laser) for assessing the surface characteristics of wood.
This is considered important because it is the surface of the wood and its subsequent
surface treatment that determines all its other important properties (physico-mechanical,
chemical, resistance, thermodynamic and specific) during its lifetime and under the
conditions of use by consumers.
Quality management during surface treatment of special wood products
The definition of quality within the framework of quality management usually changes in
line with changes in production processes and the conditions in which products are made.
It should (also) be taken into consideration that customer demands change over time,
which suggests that quality does not remain unchanged (Synek et al. 2007).
Littera Scripta, 2018, Volume 11, Issue 2
48
Every product has its own qualitative characteristics, i.e. relevant product features that
serve to describe its quality. These features should form the properties of products that
significantly meet the demands of consumers and positively affect their satisfaction.
These include: usability, functionality and performance, equipment, reliability,
compliance with standards, durability, ecological credentials, and design (Sedliačik et al.
2013; Sujová et al. 2015; Ružinská 2018a).
For good quality management it is important to understand what quality criteria are
essential, to determine the methods for measuring and testing them, and, where
appropriate, to find alternatives and understand the relationships between them. It is only
in this way that the quality of the products produced by manufacturers will meet
consumer's requirements (Vochozka et al. 2011, 2015; Lindermann et al. 2013).
For this research, the product-oriented quality management approach was applied,
whereby the definition of quality is indicative of both accuracy and measurability; current
principles of quality management during the surface treatment of wood products were
also taken into consideration (Ružinská et al. 2014 a, b, 2015 a, b, 2018 a, b).
Product-oriented definitions are based on whether a product has the properties as
prescribed in the accompanying technical documentation. Any increase in the level of a
particular product parameter is understood to reflect an increase in its quality. However,
quality defined in this way leads to quality assurance activities that are purely focused on
technical control. This is evidenced by the many key standards or mandatory methods for
assessing the primary (mechanical, physical, chemical, resistance, ecological, hygienic,
specific) characteristics of surface treated wood products (Kalendová et al. 2004; Kúdela
and Liptáková 2005; Ružinská 2014a, 2018a, b; Sain et al. 2006; Salmén et al. 2014; Zhong
et al. 2013).
These standardised qualitative criteria only apply to defined groups of wood products
(furniture, building and carpentry, woodworking products), but do not exist for special
wood products.
An indispensable part of protecting wood products is the surface finish, which can extend
the life of wood and highlight its natural beauty. It is important that the method and type
of surface treatment be determined correctly. Wood is a "living material" with natural
beauty, which can be accentuated by the appropriate surface finish, but which can see its
utility value fall and lifetime shortened with an inappropriate one (Sedliačik et al. 2013;
Madhoushi et al. 2017).
The primary goal of wood treatment is to protect a specific adherend against the adverse
effects of external influences, as well as mechanical, chemical and biological damage. An
important aspect of this is the need to increase the aesthetic appearance of wood products
in their final form and the need to preserve all of its other quality characteristics
(mechanical, physical-chemical, ecological, biological, resistant and specific). After all, the
sale of wood products depends on this and a lack of disturbing defects (Kalendová et al.
2004; Berenjan et al. 2012; Ružinská 2014a, 2018a, b; Zhong et al. 2013).

Littera Scripta, 2018, Volume 11, Issue 2
49
The properties of wood primarily affect the surface treatment of the wood. However, the
influence of the chemical composition of the type of coatings used is also significant, as
are other factors that influence the interaction between the wood and the coatings during
their application and/or curing (Seabra et al. 2017; Zhong et al. 2013; Salmén et al. 2014).
Wood can be characterised as a homogeneous, porous-capillary, limited swelling colloid.
The porous character of wood is the result of its morphological properties. Wood is an
extensive capillary system with cavities. The different morphology of the wood surface
and its various properties in individual anatomical directions is based on the knowledge
of a specific adherend (wood) having a heterogeneous, anisotropic polymeric
composition (Sain et al. 2006; Zhong et al. 2013; Madhoushi et al. 2017).
The differences in the surface roughness (as an important morphological characteristic)
of wood in different anatomical directions, which is an important factor during the surface
treatment process, are also taken into account in the resulting qualitative properties of
surface finishing (Kúdela and Liptáková 2005; Boruszewski et al. 2012; Salmén et al.
2014; Zhong et al. 2013; Salmén 2014; Ružinská 2018a).
The requirements for the quality of the surface treatment are dependent on the function
and purpose of a particular product. In addition to assessing the characteristics of the
appearance of different types of coatings, it is important to know the geometry of the
wood, especially its surface roughness, because it is at this interface where the interaction
takes place between the substrate and the applied coating (Kúdela and Liptáková 2005;
Brashaw 2009; Zhong et al. 2013; Salmén 2014; Ružinská 2014a, 2015a, 2018a).
At present, beyond surface characteristics, there are no other evaluation criteria that take
into account the diverse morphological characteristics of wood (e.g. reflectance as a result
of the surface reaction of wood to the application of coatings). Such criteria would help to
clarify the interactions between wood and coatings because this interface conditions the
success and appearance of the resulting special wood products.
Materials and Methods
Proposed primary quality characteristics for the surface treatment of special wood
products
This research focuses on the application of an experimental method (optical laser) for the
assessment of the surface characteristics of wood, since it is the surface of the wood and
its subsequent surface treatment that determines all its other important properties
(physico-mechanical, chemical, resistance, thermodynamic and specific) during its
lifetime and under the conditions of use by consumers.
The assessment of the quality of the surface treatments is based on a comprehensive set
of criteria, including those in previously published research in the field (Ružinská 2014a,
b; 2015a, b; 2018a, b).
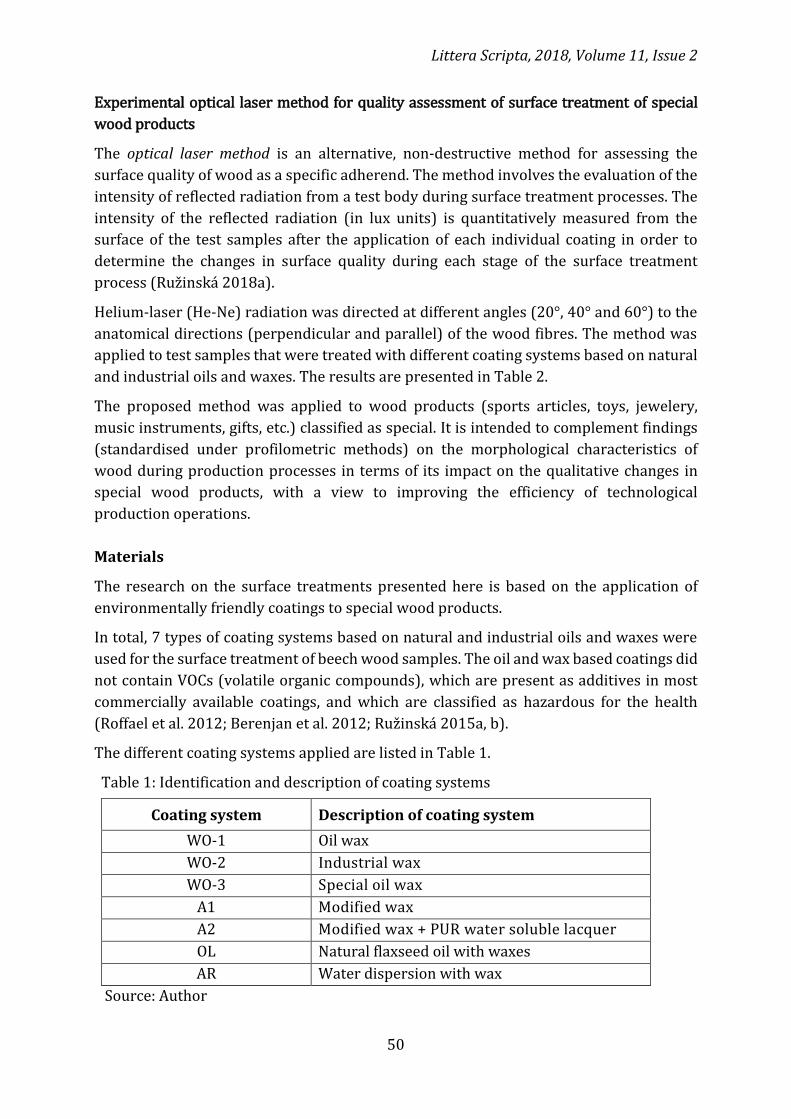
Littera Scripta, 2018, Volume 11, Issue 2
50
Experimental optical laser method for quality assessment of surface treatment of special
wood products
The optical laser method is an alternative, non-destructive method for assessing the
surface quality of wood as a specific adherend. The method involves the evaluation of the
intensity of reflected radiation from a test body during surface treatment processes. The
intensity of the reflected radiation (in lux units) is quantitatively measured from the
surface of the test samples after the application of each individual coating in order to
determine the changes in surface quality during each stage of the surface treatment
process (Ružinská 2018a).
Helium-laser (He-Ne) radiation was directed at different angles (20°, 40° and 60°) to the
anatomical directions (perpendicular and parallel) of the wood fibres. The method was
applied to test samples that were treated with different coating systems based on natural
and industrial oils and waxes. The results are presented in Table 2.
The proposed method was applied to wood products (sports articles, toys, jewelery,
music instruments, gifts, etc.) classified as special. It is intended to complement findings
(standardised under profilometric methods) on the morphological characteristics of
wood during production processes in terms of its impact on the qualitative changes in
special wood products, with a view to improving the efficiency of technological
production operations.
Materials
The research on the surface treatments presented here is based on the application of
environmentally friendly coatings to special wood products.
In total, 7 types of coating systems based on natural and industrial oils and waxes were
used for the surface treatment of beech wood samples. The oil and wax based coatings did
not contain VOCs (volatile organic compounds), which are present as additives in most
commercially available coatings, and which are classified as hazardous for the health
(Roffael et al. 2012; Berenjan et al. 2012; Ružinská 2015a, b).
The different coating systems applied are listed in Table 1.
Table 1: Identification and description of coating systems
Coating system Description of coating system
WO-1 Oil wax
WO-2 Industrial wax
WO-3 Special oil wax
A1 Modified wax
A2 Modified wax + PUR water soluble lacquer
OL Natural flaxseed oil with waxes
AR Water dispersion with wax
Source: Author

Littera Scripta, 2018, Volume 11, Issue 2
51
Results and Discussion
Primary quality characteristics of surface treatments of special wood products
The assessment of the quality of the surface treatments is based on a comprehensive set of criteria, including those in previously published research in the field (Ružinská et al. 2014a, b; 2015 a, b; 2018a).
For this research, the following qualitative criteria are considered to be key to the assessment of the coatings applied to special wood products during surface treatment processes (see Figure 1):
Properties of the coatings:
- chemical composition of the film-forming components
Properties of the wood as an adherend:
- morphological properties of the wood
- chemical composition of the wood
- internal and external wood surface
- physical and mechanical properties of the wood
Interaction of wood and coatings:
- wetting of wood surface
- penetration of coatings into the structure of the wood
- phase interface during application and drying (curing).
The morphological properties of wood as an adherend is one of the most important
factors influencing the quality of wood surface treatments. Special attention was therefore
paid to this qualitative characteristic. The proposed non-destructive experimental laser
method provided complementary data on the changes in the profile characteristics of
special wood products during surface treatment processes. This not only gave valuable
insights into the morphological (profileometric) characteristics of adherence (surface
roughness), but also into the optical characteristics of the surface treatments (gloss
measurement, coating defect identification) (Ružinská 2015a; 2018a).
The results presented in Table 2 and Figures 2-4 show that the intensity of the reflected
narrow beam of laser radiation (He-Ne) not only depends on the quality of the type and
layer of coating, but also on the interaction with the substrate (wood) and the anatomical
direction (perpendicular and parallel to the direction of the wood fibres).
The beam of the He-Ne lasers behaved in response to the test samples as follows:
For test samples with non-milled surfaces there was a diffuse reflection, as a result of
which the intensity of the reflected radiation to the ultrasonic sensing device was low. In
contrast, milled test samples contributed to a reduction in surface roughness, which
resulted in an increase in the amount of reflected radiation from the substrate.
The application of the first coat caused an increase in the amount of reflected radiation
from the test samples, which can in all probability be put down to the fact that it acts like
a mirror. In contrast, pre-treatment of the wood prior to the application of the first coat
caused a reduction in the amount of reflected radiation from the test samples. This is
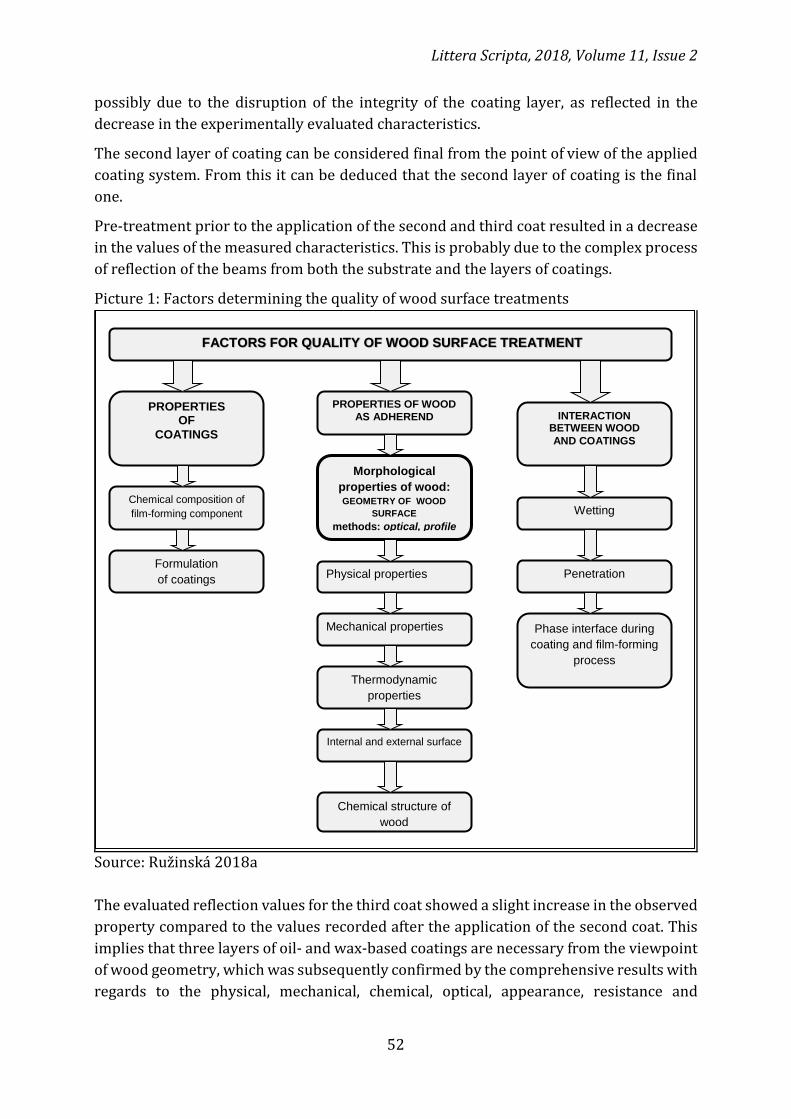
Littera Scripta, 2018, Volume 11, Issue 2
52
possibly due to the disruption of the integrity of the coating layer, as reflected in the
decrease in the experimentally evaluated characteristics.
The second layer of coating can be considered final from the point of view of the applied
coating system. From this it can be deduced that the second layer of coating is the final
one.
Pre-treatment prior to the application of the second and third coat resulted in a decrease
in the values of the measured characteristics. This is probably due to the complex process
of reflection of the beams from both the substrate and the layers of coatings.
Picture 1: Factors determining the quality of wood surface treatments
Source: Ružinská 2018a
The evaluated reflection values for the third coat showed a slight increase in the observed
property compared to the values recorded after the application of the second coat. This
implies that three layers of oil- and wax-based coatings are necessary from the viewpoint
of wood geometry, which was subsequently confirmed by the comprehensive results with
regards to the physical, mechanical, chemical, optical, appearance, resistance and
FACTORS FOR QUALITY OF WOOD SURFACE TREATMENT
PROPERTIES OF
COATINGS
PROPERTIES OF WOOD
AS ADHEREND INTERACTION BETWEEN WOOD
AND COATINGS
Chemical composition of
film-forming component
Formulation
of coatings
Wetting
Physical properties
Morphological
properties of wood: GEOMETRY OF WOOD
SURFACE
methods: optical, profile
Penetration
Phase interface during
coating and film-forming
process
Mechanical properties
Thermodynamic
properties
Chemical structure of
wood
Internal and external surface
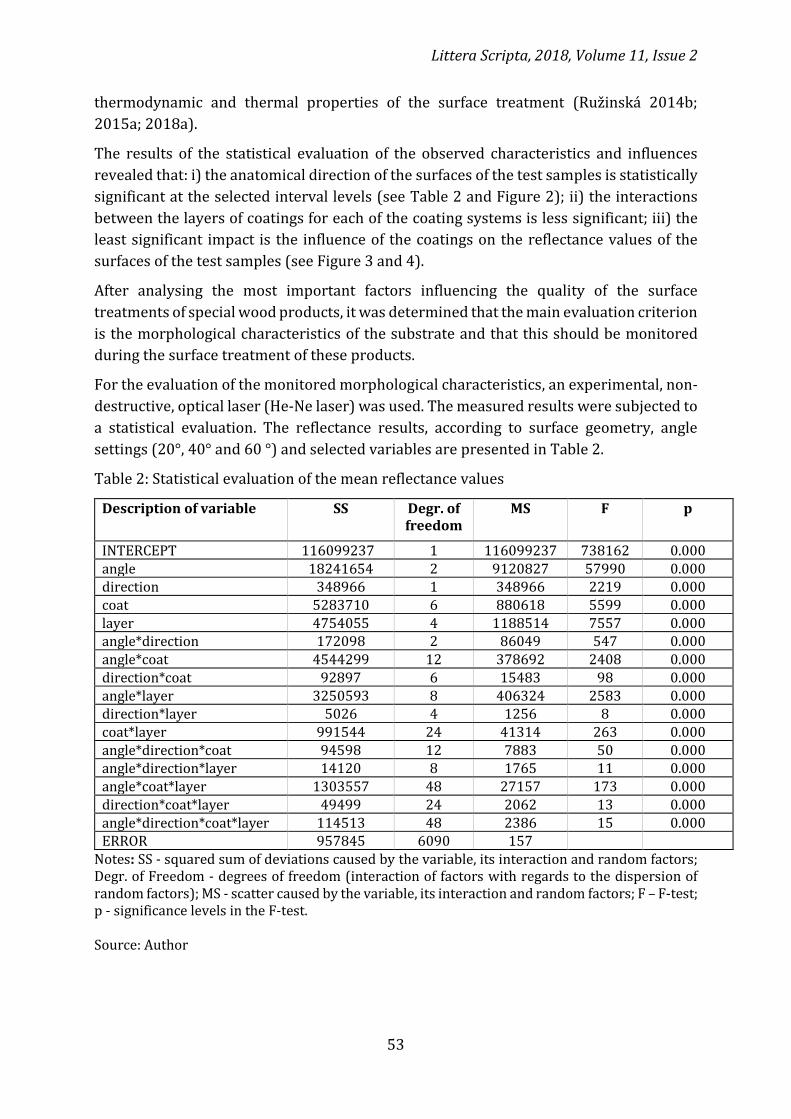
Littera Scripta, 2018, Volume 11, Issue 2
53
thermodynamic and thermal properties of the surface treatment (Ružinská 2014b;
2015a; 2018a).
The results of the statistical evaluation of the observed characteristics and influences
revealed that: i) the anatomical direction of the surfaces of the test samples is statistically
significant at the selected interval levels (see Table 2 and Figure 2); ii) the interactions
between the layers of coatings for each of the coating systems is less significant; iii) the
least significant impact is the influence of the coatings on the reflectance values of the
surfaces of the test samples (see Figure 3 and 4).
After analysing the most important factors influencing the quality of the surface
treatments of special wood products, it was determined that the main evaluation criterion
is the morphological characteristics of the substrate and that this should be monitored
during the surface treatment of these products.
For the evaluation of the monitored morphological characteristics, an experimental, non-
destructive, optical laser (He-Ne laser) was used. The measured results were subjected to
a statistical evaluation. The reflectance results, according to surface geometry, angle
settings (20°, 40° and 60 °) and selected variables are presented in Table 2.
Table 2: Statistical evaluation of the mean reflectance values
Description of variable SS Degr. of freedom
MS F p
INTERCEPT 116099237 1 116099237 738162 0.000 angle 18241654 2 9120827 57990 0.000 direction 348966 1 348966 2219 0.000 coat 5283710 6 880618 5599 0.000 layer 4754055 4 1188514 7557 0.000 angle*direction 172098 2 86049 547 0.000 angle*coat 4544299 12 378692 2408 0.000 direction*coat 92897 6 15483 98 0.000 angle*layer 3250593 8 406324 2583 0.000 direction*layer 5026 4 1256 8 0.000 coat*layer 991544 24 41314 263 0.000 angle*direction*coat 94598 12 7883 50 0.000 angle*direction*layer 14120 8 1765 11 0.000 angle*coat*layer 1303557 48 27157 173 0.000 direction*coat*layer 49499 24 2062 13 0.000 angle*direction*coat*layer 114513 48 2386 15 0.000 ERROR 957845 6090 157
Notes: SS - squared sum of deviations caused by the variable, its interaction and random factors; Degr. of Freedom - degrees of freedom (interaction of factors with regards to the dispersion of random factors); MS - scatter caused by the variable, its interaction and random factors; F – F-test; p - significance levels in the F-test. Source: Author
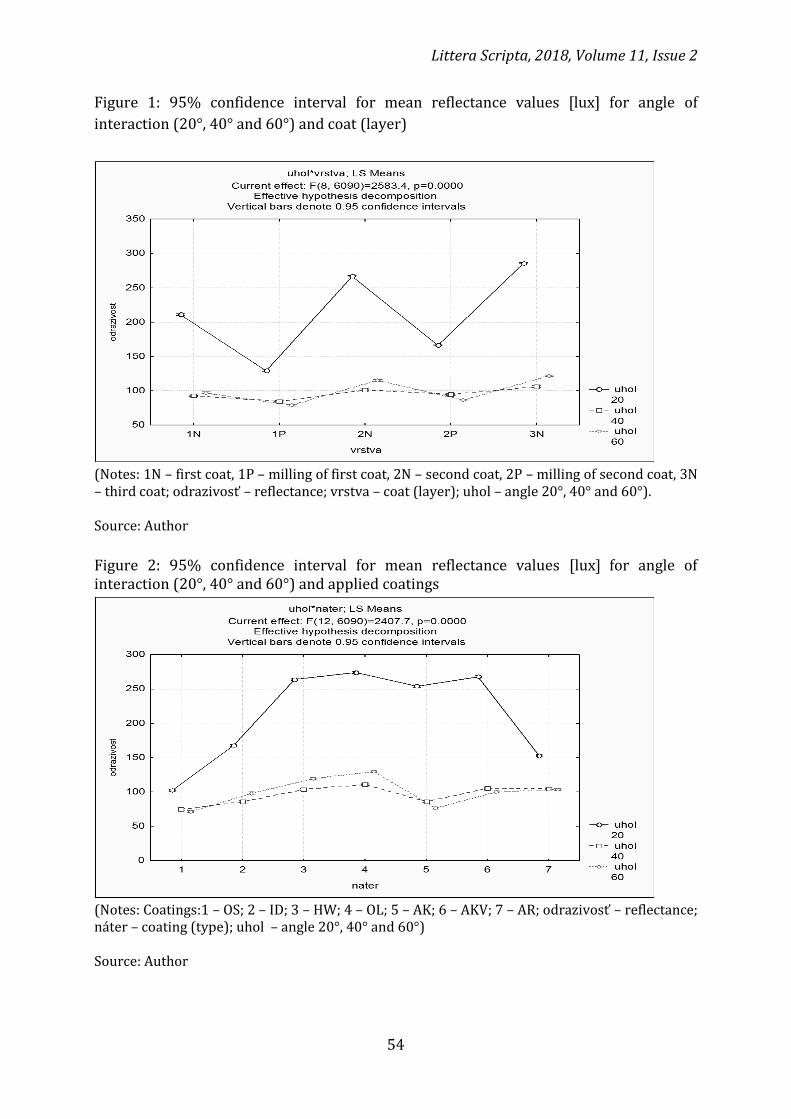
Littera Scripta, 2018, Volume 11, Issue 2
54
Figure 1: 95% confidence interval for mean reflectance values [lux] for angle of
interaction (20°, 40° and 60°) and coat (layer)
(Notes: 1N – first coat, 1P – milling of first coat, 2N – second coat, 2P – milling of second coat, 3N – third coat; odrazivosť – reflectance; vrstva – coat (layer); uhol – angle 20°, 40° and 60°). Source: Author
Figure 2: 95% confidence interval for mean reflectance values [lux] for angle of interaction (20°, 40° and 60°) and applied coatings
(Notes: Coatings:1 – OS; 2 – ID; 3 – HW; 4 – OL; 5 – AK; 6 – AKV; 7 – AR; odrazivosť – reflectance; náter – coating (type); uhol – angle 20°, 40° and 60°) Source: Author

Littera Scripta, 2018, Volume 11, Issue 2
55
Figure 3: 95% confidence interval for mean reflectance values [lux] for angle of interaction (20°, 40° and 60°) and anatomical direction of the test samples
(Notes: odrazivosť – reflectance; uhol – angle 20°, 40° and 60°, smer r – parallel to the direction of the wood fibres, smer k – perpendicular to the direction of the wood fibres) Source: Author
Conclusion
The research focused on determining the most important qualitative criteria with regards
to the surface treatment of special wood products (by assessing the morphological
characteristics of the wood´s surface by means of an experimental optical laser) during
the production process of these products, which are produced by a limited number of
small manufacturers, are produced in an environmentally friendly way, and are
competitive and sustainable.
The research focused on the application of an experimental method (optical laser) for the
assessment of the surface characteristics of wood, since it is the surface of the wood and
its subsequent surface treatment that determines all its other important properties
(physico-mechanical, chemical, resistance, thermodynamic and specific) during its
lifetime and under the conditions of use by consumers. Based on the proposed
experimental laser method, it was possible to determine the optimal number of coating
layers for each coating system and to monitor the qualitative characteristics of the wood
during the individual stages of the surface treatment process.
The results can be considered as an innovative application of laser radiation in the study
of coatings during surface treatment, in particular with regards to the monitoring of
changes in the characteristics of various wood substrates in terms of their surface
properties and important qualitative indicators.
The evaluation of the results generated through the use of this alternative laser method
confirmed the results of surface roughness evaluations according to the standard profile
Littera Scripta, 2018, Volume 11, Issue 2
56
method (Ružinská, 2015a; 2018a), but provided more detailed and comprehensive
knowledge of the surface properties of the substrate (wood), whilst enabling a relatively
rapid and objective evaluation of its quality during surface treatment processes.
The proposed criteria and innovative monitoring method for determining the quality of
coatings for special wood products should contribute to speeding up the evaluation and
objectification of quality in practice.
References
BADIDA, M. et al. 2016. The Contribution to Coating Quality by Statistical Methods.
Metalurgija. 55(3), 445-448. ISSSN 0543-5846.
BERENJAN, A. et al. 2012. VOC Removal Methods: A Review. American Journal of
Biochemistry and Biotechnology. 8(4), 220-229. doi:10.3844/ajbbsp.2012.220.229
BORUSZEWSKI, P. et al. 2012. Raw materials and particleboards – a current status and
perspectives. Warszaw: SGGW Press, Publish. ISBN 978-83-7583-389-8.
BRASHAW, B. K. et al. 2009. Nondestructive testing and evaluation of wood: a worldwide
research update. Forest Products Journal, 59(3), 7-14. ISSN 0015-7473.
CAHA, Z. 2017. Exploitation of External Financial Resources for Corporate Training
Purposes in the Czech Republic. Littera Scripta, České Budějovice: Vysoká škola technická
a ekonomická v Českých Budějoviciach, 10(1), 10-19. ISSN 1805-9112.
GREWAL, C. 2008. An initiative to implement lean manufacturing using value stream
mapping in a small company. Journal of Manufacturing Technology and Management.
15(3/4), 404–417. ISSN 1368-2148.
GUERRERO, J. E. et al. 2017. Applying lean six sigma in the wood furniture industry. Quality
Management Journal. 24, (3), 6-19. ISSN 1068-6967.
KALENDOVÁ, A. et al. 2004. Metody testování organických povlakú. Acta Mechanica
Slovaca. 3-B(2). 101 – 108. ISSN 1335-2393.
KÚDELA, J., LIPTÁKOVÁ, E. 2005. Evaluation of Various Ways of Mechanical Wood Surface
Freatment. Acta Mechanica Slovaca, Košice, 3-A(9), 135 – 142. ISSN 1335-2393.
JABŁOŃSKI, M. et al. 2009. Synthetic polymers and coating materials in woodworking
industry. Warzsaw: SGGW Publish. ISBN 978-83-7583-044-6.
LINDERMANN, C. et al. 2013. Impact and Influence Factors of Additional Manufacturing
on Product Lifecycle Costs. 24th Annual International Solid Freeform Fabrication
Symposium the Additive Manufacturing Conference. Austin, Texas, USA.
MADHOUSHI, M. et al. 2017. Mechanical and Physical Properties of Green Biocomposite
Based on MDF. Journal of Polymers and Environment. 25(2), 221-228. ISSN 1566-2543
ROFFAEL, E. et al. 2012. On the formaldehyde release of wood particles. European Journal
of Wood and Wood Products. 70(6), 911-912. ISSN 0018-3768.

Littera Scripta, 2018, Volume 11, Issue 2
57
RUŽINSKÁ E. et al. 2014a. The study of selected fire-technical characteristics of special
wood products surface treatment by environmentally problematic coatings. Advanced
materials research, 1001(-), 373-378. ISSN 1022-6680.
RUŽINSKÁ, E. et al. 2014b. Evaluation of thermal degradation of wood with
environmentally problematic application of coatings. Advanced materials research.100(-),
300-305. ISSN 1022-6680.
RUŽINSKÁ, E. et al. 2015a. The Evaluation of specific environmental and degradation
characteristics of surface treated wood. Materials Science Forum. 818(-), 185-189.
ISSN 1662-9752.
RUŽINSKÁ, E. et al. 2015b. The New Progressive Polymeric Materials for the Reduction of
VOC in woodworking industry. Applied Mechanics and Materials. 711(-), 214-217. ISSN
1662-7482.
RUŽINSKÁ. E. 2018a. Analýza faktorov podmieňujúcich kvalitu povrchových úrav dreva
pre optimalizáciu výrobných procesov finalizácie drevárskych výrobkov. Mladá Veda.
6(2), 162-173. ISSN 1339-3189.
RUŽINSKÁ, E. et al. 2018b. Product and technological innovation – new fibrous wood
composites. 31. IBIMA Proceedings, Italy, 6074-6078. ISBN 978-0-99985551-0-2.
SAIN, M. et al. 2006. Fiberboard from wood-fiber bonded with renewable wood resin.
Journal of Reinforced Plastics and Composites. 25(16), 22-39. ISSN 0731-6844.
SALMÉN, L. 2014. Wood morphology and properties from molecular perspectives. Annals
of Forest Science. 72(6), 679-684. ISSN 1286-4560.
SEABRA, E.J. et al. 2017. Statistical and quality control tools applied to the process of
wooden furniture production. International Wood Produts Journal. 8(3), 136-142. ISSN
0020-3203.
SEDLIAČIK, J. et al., 2013. Adhesives and Coatings. Zvolen: ES TU Zvolen. ISBN 978-80-228-
2500-9.
SUJOVÁ, A. et al. 2015. The analysis of performance in the wood processing industry
through ratio indicators. Acta Facultatis Xylologiae. 57(2), 165−178. ISSN 1336-3824.
SYNEK, M. a kol. 2007. Manažerská ekonomika. Praha: Grada Publishing. ISBN 978-80-
247-1992-4.
VOCHOZKA, M., J. VÁCHAL and J. STRAKOVÁ, 2015. Measuring Technical Efficiency Using
the Example of Construction Companies. Ekonomika a management. –(2).-. ISSN 1802-
8934.
VOCHOZKA, M. 2011. Metody komplexního hodnocení podniku. Praha: Grada Publishing.
246 s. ISBN 978-80-247-3647-1.
ZHONG, Z. W. et al. 2013. Measurement of the surface roughness of wood based materials
used in furniture manufacture. Measurement. 46(4), 1482-1487. ISSN 0263-2241.
Littera Scripta, 2018, Volume 11, Issue 2
58
Contact address of the author:
doc. Ing. Eva Ružinská, PhD., MBA, Ing.Paed.IGIP, Institute of Technology and Business in
České Budějovice, Faculty of Corporate Strategy, Department of Economics, Okružní
517/10, 370 01 České Budějovice, Czech Republic, [email protected];
RUŽINSKÁ, E., 2018. Innovative Method for Assessing the Quality of Special
Wood Products during the Production Process. Littera Scripta [online]. České
Budějovice: Institute of Technology and Business in České Budějovice, 11(2),
46-58 [accessed: 2018-12-20]. ISSN 1805-9112. Available at:
http://journals.vstecb.cz/category/littera-scripta/11-rocnik-2018/2_2018/.
59
Functioning of Ukrainian Phraseological Neologisms
in Russian Political Media Discourse
Elena Tomášková
Institute of Technology and Business in České Budějovice
Abstract
Russian and Ukrainian political media discourse, despite complex relations between countries, is a
part of single information space. As a result, phraseological innovations arising from one of its
segments quickly become the property of another. Borrowing a certain neophraseme is possible
due to the relevance of the denotations for the political and socio-cultural situation of the country,
whose language is borrowed from. Functioning of a phraseological unit in a new environment (in a
different segment of media discourse) is subject to certain regularities relating to both form
(phrasemes can be translated or transliterated), and the semantics of phraseological unit. There are
three possible alternatives: the neophraseme can preserve both the form and the meaning; it can
keep the form, but change the meaning; or it can change the form, but keep the meaning. The choice
of an alternative is determined by both linguistic and extralinguistic factors.
Keywords: phraseologism – phraseological neologism – neophraseme – political media discourse –
semantics of phraseologism.
Introduction
Despite the fact that Russia and Ukraine are in rather complicated relations, the Russian
and Ukrainian political media discourse is closely interrelated. This is facilitated by the fact
that the Russian language is spoken almost by the entire population of Ukraine, and the
Ukrainian language, closely related to Russian, is understandable to the inhabitants of
Russia without need for translation. The conflict between the countries, historically closely
connected with each other, causes intensified mutual attention – all significant processes or
events occurring in one country become important informational occasions in the media of
the other. One of the consequences of the foregoing is the exchange of new phraseological
units arising in Russian or Ukrainian political media discourse. Acceptance of
Littera Scripta, 2018, Volume 11, Issue 2
60
neophrasemes is firstly connected with the relevance for the borrowing of a phenomenon,
event or process, which is denoted by phraseological units. As V. Mokienko rightly points
out, fixing of a phraseological unit, its movement from the periphery to the very center of
literary use depends on many objective and subjective factors. Nevertheless, it is precisely
the “journalistic” test that is now the first and, apparently, the most important stage of such
language selection. After all, journalistic discourse reveals and fixes the main qualities of
phraseological units – their expressiveness and characterization (Mokienko 2016, p.14).
The cognitive processing of an event, sociocultural, communicative, pragmatic and
linguistic information takes place in the media discourse (Alefirenko 2016, p. 51). It reflects
the most significant social conflicts. At the same time, the media discourse, combining the
informing, influencing and ideological functions, does not exactly reflecting the reality, how
it interprets, assesses, comments, sets a certain ideological background and regulates
public opinion (Antonova 2017, p.12).
In the study, the author relies on works that explore general trends in the modern
phraseology development (Aleifirenko 2016; Steyer 2015; Gray and Bieber 2015), the
phraseological subsystem of language (V. Melikyan, A. Melikyan and Dzyubenko 2017),
communicative functions of phraseological units ( Dobrovolsky 2016), the phrasemes
semiosis (Aleifirenko 2015), the language policy (Mokienko 2015), bilingual practice in
Ukraine (Nedashkivska 2015), the media image of the Ukrainian crisis in the world media
(Bushev 2016), the linguistic specificity of the political media discourse (Sivenkova 2016;
Gazizov and Nagovitsyna 2017), lexical processes in Russian political discourse (Belov
2016), peculiarities of the phraseological units functioning in the media discourse
(Kablukov 2016). Despite the close attention of researchers given to the phraseological
components of the political media discourse, the issue of penetration and features of
Ukrainian neophrasemes functioning in the language of Russian media remains not fully
studied. Now, there are no studies on the ways of borrowing Ukrainian phraseological
neologisms by the Russian media discourse. In this regard, the purpose of this study is to:
1. Analyze the variants for borrowing Ukrainian phraseological neologisms by Russian
media discourse in terms of form and semantics.
2. Determine the reasons for choosing a specific variant of borrowing.
3. Identify factors that contribute to the penetration of phraseological innovation from one
segment of the political media discourse to another one.
Studying the patterns of implementing of Ukrainian neophrasems in Russian political
media discourse will help to contribute to a comprehensive analysis of the mechanisms of
interaction between the Ukrainian and Russian languages.
Notion of phraseological neologism
As the notion of “phraseological neologism” in modern linguistics is not sufficiently clear,
the author relies on a broad approach to understanding phraseology as a relatively stable,
reproducible, expressive combination of lexemes, which has (as a rule) a holistic meaning,
as proposed by V. Mokienko (Mokienko 1989, 5). According to this approach,

Littera Scripta, 2018, Volume 11, Issue 2
61
neophraseology includes winged phrases (usually statements made by politicians or public
figures), Internet memes and other stable set phrases, even when they are paremias. The
exception is transformed phraseological units (phraseological modifications), even if they
have several textual implementations.
Material and Methods
The material for the study was the political texts of Internet media in Russia and Ukraine
over the past five years (Ukrainian media were analyzed both in Ukrainian and in Russian).
The data collection process was as follows: at the first stage, the content of Russian media
was studied using the keyword “Ukraine” by web pages analyzing method, with the result
that Ukrainian phraseological units that were popular in the Russian media discourse were
found; at the second stage, using the same method, all cases of the use of these
phraseological units in the Ukrainian media were analyzed. The study provides examples of
19 Ukrainian Internet mass media and 13 Russian ones. It is important to note that among
them there are both national media (Russian “Комсомольская правда”, “РИА Новости”,
“Взгляд”, Ukrainian “Сегодня”,“Вести”,“Обозреватель”,“Стана.ua”) and regional (for
example, the Russian edition “Голос Севастополя”and the Ukrainian “НА Харьков”). In the
research, a descriptive method for studying the functioning of phraseological neologisms
and their characteristics, a comparative method for comparing the use of neophrasemes in
Russian and Ukrainian media discourse, and a component analysis for investigating the
semantics of phraseological units were used. The cognitive-discursive approach was also
important for research.
Results and discussion
Before the events of 2014 (a revolution in Ukraine and subsequent crisis in relations
between the two countries), Russia and Ukraine were in the same information space: the
most popular media (primarily television channels) in Ukraine were Russian.
Phraseological neologisms that arose in Russian political media discourse as an important
component of the media language were actively borrowed by the Ukrainian segment. For
example, the famous statement of the first president of the Russian Federation B. Yeltsin “Я
устал, я ухожу” (I'm tired, I'm leaving), which was made in 2000, is still actively used by
Ukrainian media in the most diverse contexts (concerning different situations and
phenomena): Путин: я устал, я ухожу. Вот мой преемник! (Putin: I'm tired, I'm leaving.
Here is my successor!) (Newsonline24.com.ua, 2016); Я устал, я ухожу: как решиться на
увольнение, когда больше нет сил оставаться (I'm tired, I'm leaving: how to decide on
the dismissal, when there is no more strength left) (Work.ua 2017); Я устал, я ухожу:
Шулявский мост в Киеве закроют на 1,5 года (I'm tired, I'm leaving: Shulyavsky bridge in
Kiev will be closed for 1.5 years) (Украина 2018). It should be noted that Ukrainian political
neophrasemes until 2014 were little known in Russian media discourse. So, the legendary
statement of the first Ukrainian president L. Kravchuk “Маємо те, що маємо” (“We have
that we have”), describing the complex socio-political situation in which Ukraine was after
independence, was used in the Russian media only to characterize the Ukrainian politician:

Littera Scripta, 2018, Volume 11, Issue 2
62
“Имеем, что имеем”: 80-летие первого президента Украины Леонида Кравчука широко
отпразднуют на государственном уровне (“We have what we have”: The 80th
anniversary of Ukraine's first president Leonid Kravchuk will be widely celebrated at the state
level) (Новая газета 2013). Let's pay attention to the fact that the aphorism is given in the
translation into Russian.
After 2014 (the revolution in Ukraine and crisis in Russian-Ukrainian relations), the
situation changed radically. Ukraine moved from the periphery of Russian interests to its
center – the Ukrainian issue became topical not only in the news, but also in a variety of
political talk shows. In addition, a large number of Ukrainian politicians, political scientists,
journalists and bloggers who were in opposition to the new Kiev government, immigrated
to Russia. These factors influenced the activity of borrowing Ukrainian neophrasemes and
the ways of their transfer into Russian-language texts. Before, only translation was used;
now many phrases are often transliterated, as the Russian audience understands them
without need for translation.
The phraseological unit functioning in a new environment (in a different segment of the
media discourse) is subject to certain regularities relating to both form (phrasemes can be
translated or transliterated) and semantic. It should also be noted that the same
phraseologism is often used by Russian and Ukrainian media discourse segments with
different connotations. Analysis of Ukrainian and Russian media material showed that
there are three possible variants for borrowing Ukrainian phraseological neologisms by
Russian media discourse.
In the first case, phraseologism preserves both form and meaning. As examples, we can
quote the words of the Kiev mayor Vitali Klitschko. So, once making a statement, he urged
the people of Kiev to prepare not for winter, but for the ground (in Russian зима and
земля). The statement immediately turned into a popular phraseologism with the
semantics “to get ready for death”. Neophraseme is actively used in the same form and with
the same semantics in both Russian and Ukrainian media. Ukraine media: Депутат
Кадыров в Госдуме посоветовал Зеленскому “готовиться к земле” (Deputy Kadyrov in
the State Duma advised Zelensky “to prepare for the ground” (Обозреватель 2014),
Реформа медицины: пора готовиться к земле! (Medicine reform: it's time to get ready for
the ground!) (From-ua, 2016), Нужно готовиться к земле: Гройсман объяснил обвал цен
на Украине ростом экономики (We need to prepare for the ground: Groysman explained
the collapse of prices in Ukraine by economic growth) (НА Харьков 2017), Кличко давно
призывал готовиться к земле (Klitschko long ago called for preparing for the ground)
(Народный корреспондент 2017). Russian mass media: Зато честно: Кличко призвал
киевлян готовиться к “земле” (But honestly: Klitschko urged the people of Kiev to prepare
for the ground) (Pravda.ru 2014), Правильно “готовиться к земле”: в Венгрии рыли
могилы на скорость (Correctly “prepare for the ground”: in Hungary, burial graves for
speed) (Rusnext.ru 2016), Пентагон “готовится к земле” в Сирии (The Pentagon
“prepares for ground” in Syria) (Русская весна 2017). In one of the television shows, Vitali
Klitschko allowed himself the unfortunate wording: “А сегодня в завтрашний день не все
могут смотреть. Вернее, смотреть могут не только лишь все, мало кто может это
Littera Scripta, 2018, Volume 11, Issue 2
63
делать” (And today not everyone can look at tomorrow. To be more precise, not only can
everyone look at it, but few can do it), after which the phraseologism “to look at tomorrow”
with the meaning “to assume yourself as a skilful forecaster without any reason to do that”
has appeared. Neophraseme is used by Russian media: Кличко посмотрел в завтрашний
день Трампа (Klitschko looked at tomorrow's Trump) (Дни. ру 2016).
A vivid example of this variant is also the phraseologism “the Kremlin’s hand”, meaning
“Russia's interference in the affairs of Ukraine”. Ukrainian media: Везде “рука Кремля”:
стало известно, как власти Украины подыгрывают Путину (Everywhere the “Kremlin’s
hand”: it became known how the authorities of Ukraine play up to Putin) (Апостроф 2018),
Рука Кремля: военный эксперт сравнил “убийство” Бабченко и отравление Скрипаля
(The Kremlin's hand: the military expert compared “Babchenko's murder” and the poisoning
of Skripal) (Обозреватель 2018), Яценюк считает, что “Стену” дискредитирует “рука
Кремля” (Yatseniuk believes that “the Kremlin’s hand” discredits “The Wall”) (Страна.ua
2018), Ромські погроми. Рука Кремля чи домашня ксенофобія?(Roma massacres. The
Kremlin's Hand or Home Xenophobia?) (Главком 2018), Кириленко рассказал о длинной
кремлевской руке с бутылкой (Kirilenko told about a long Kremlin’s hand with a bottle)
(Вести 2018). Russian media: И тут рука Кремля: генпрокуратура Украины
заподозрила в публикации “списка 47” Россию (And here is the Kremlin’s hand: the
Prosecutor General's Office of Ukraine suspected Russia in the publication of the “list of 47”)
(Rusnext.ru 2018), Рука Кремля: на Украине ответили на обвинения американских
СМИ в предательстве (The Kremlin's hand: in Ukraine they responded to accusations of
American media in betrayal) (Русская весна 2018), Вездесущая “рука Кремля” в Украине
(The Omnipresent “Kremlin’s hand” in Ukraine) (РИА Новости 2018), Нападение на
венгров: в Киеве увидели руку Кремля, а в Москве – “немощные руки” Киева (Attack on
the Hungarians: in Kiev they saw the Kremlin’s hand, and in Moscow – the “weak hands” of
Kiev) (Bigmir.net 2018). The popularity of any phraseologism is conditioned by its
unconditional relevance – Russia's aggressive intervention in the affairs of Ukraine is one
of the main theses of the Ukrainian political agenda. In addition, the phrase is universal,
because equally spelled and almost equally pronounced in both Russian and Ukrainian.
In 2018, Ukrainian political phraseology replenished the vocabulary with one more unit,
which has the same meaning as the “the Kremlin’s hand”, but more expressive – “tentacles
of the Russian world / Moscow”. Vladimir Vyatrovich, the head of the Ukrainian National
Memory Institute, was the first to introduce it, then the president of Ukraine Petro
Poroshenko repeated it several times: Вятрович: Кремль использует Высоцкого и Цоя
как “щупальца русского мира” (Vyatrovich: The Kremlin uses Vysotsky and Tsoi as the
“tentacles of the Russian world”) (Сегодня 2018), В'ятрович: Такі щупальця “русского
мира”, як булгакови, висоцькі і цої, в руках Кремля не менш небезпечні, аніж совок і
московська церква (Vyatrovich: Such tentacles of the “Russian world” as Bulgakov, Vysotsky
and Tsoi, in the hands of the Kremlin are no less dangerous than the Moscow church)
(Гордон.ua 2018), “Щупальці Москви міцно проникли в соцмережі”: Кремль готується
до нової маніпулятивної кампанії – Порошенко (“The tentacles of Moscow firmly
penetrated the social network”: The Kremlin prepares for a new manipulative campaign –
Poroshenko) (5.ua 2018), Порошенко про автокефалію: ми обрубаємо щупальця Москви,

Littera Scripta, 2018, Volume 11, Issue 2
64
час настав (Poroshenko about autocephaly: we cut the tentacles of Moscow, the time has
come) (Обозреватель 2018), Порошенко пообіцяв не втручатися у справи церкви, але й
“обрубати щупальця” агрессора (Poroshenko promised not to interfere in the affairs of the
church, but to “cut the tentacles” of the aggressor( (BBC 2018). The phraseologism is aimed
at dehumanizing the opponent: if “the Kremlin’s hand” implies anthropomorphism, then
“tentacles of Moscow” represents the zoomorphism of a political opponent. The reaction of
the Russian media did not take long to appear: Порошенко напугали “щупальца Москвы”
(Poroshenko scared of the tentacles of Moscow) (Взгляд 2018), Порошенко нашел
“щупальце Москвы” (Poroshenko found the “tentacle of Moscow”) (Комсомольская правда
2018), Порошенко увидел “щупальца Москвы” в выборах на Украине (Poroshenko saw the
“tentacles of Moscow” in the elections in Ukraine) (Lenta.ru 2018). The emergence of a new
phraseologism is largely due to the fact that the phrase “the Kremlin’s hand” (which
Ukrainian politicians perceived absolutely in everything, reaching the point of absurdity)
acquired an ironic shade even in the Ukrainian media discourse: Надежда Савченко: У
властей Украины один ответ – “рука Кремля” (Nadezhda Savchenko: The authorities of
Ukraine have one answer – “the Kremlin's hand”) (Deutsche Welle 2018). In connection with
this, a new, more expressive analogue of phraseologism was required. It should be noted
that the phraseology of the “tentacles of Moscow” was created in analogy with the phrase
“tentacle of mafia”. In the studies of the metaphor in the Russian media discourse Yu
Fedeneva draws attention to the image of an octopus, all-pervading, predatory animal
capable of sucking blood out of its victim (Fedeneva 1999, p. 346). E. Stoyanova notes that
the popularity of this image is due to the success of the TV series of European
cinematographers that was on the screens in the USSR at the end of the 1980s about the
Sicilian mafia and corruption, embracing the highest power, like the octopus. (Stoyanova
2013, p. 76).
It is also necessary to add that these phraseological units are extended political metaphors
that are known not only in the above form, but also in others (for example, “рука
Вашингтона”, “рука Берлина”, “рука ЦРУ” etc.).
The second variant of the phraseological unit transition from Ukrainian into the Russian
political media discourse presupposes the preservation of the form, but a change in the
meaning. An example is the famous aphorism “Ukraine is not Russia”, authored by the
second president of Ukraine, L. Kuchma. In Ukrainian media, phraseologism is used with
the semantics “Ukraine is different from Russia for the better”: Почему Украина – не
Россия: Бутусов объяснил на примере трагедии в Кемерово (Why Ukraine is not Russia:
Butusov explained in the example of the tragedy in Kemerovo) (Сегодня 2018) – according
to the author, Ukraine is more united, “Украина – не Россия”: Бабченко показал основные
различия ... (“Ukraine is not Russia”: Babchenko showed the main differences ...) (Факты и
комментарии 2018) – according to the author, Ukraine is freer. In Russian media, the
expression has the opposite semantics: “Ukraine is different from Russia for the worse”:
Почему Россия не Украина (Why Russia is not Ukraine) ((Украина.ру 2018), “Украйна” –
не Россия, “Украйна” – это болезнь” (“Ukraine” is not Russia, “Ukraine” is a disease”)
(Золотой лев 2016) – according to the authors, in modern Russia color revolutions are
Littera Scripta, 2018, Volume 11, Issue 2
65
impossible, Украина – не Россия (Ukraine is not Russia) (Голос Севастополя 2018) –
according to the author, Russia is among world powers, and Ukraine is a poor province.
The third variant assumes that Ukrainian phraseological neologism in the Russian media
discourse changes its form, but preserves the semantics. In this case, of the form change
refers to the translation into Russian. As an illustrative example, we can quote the
phraseologism “Ці руки нічого не крали” (“These hands did not steal anything”) which is
used in an ironic sense and has the opposite meaning to the author's assertion, as Viktor
Yushchenko's government was remembered for the large scale of corruption. Examples
from the Ukrainian media: “Ці руки нічого не крали”. І не ремонтували? (“These hands did
not steal anything”. And did not repair?) (Високий замок 2015), “Ці руки нічого не крали”?
Как Ющенко с сыном проворачивают мошеннические схемы (“These hands did not steal
anything”? As Yushchenko and his son are turning fraudulent schemes) (Укроп 2018),
Володимир Гройсман або “Ці руки нічого не крали-2” (Volodymyr Groisman or “These
hands did not steal anything-2”) (Голос 2018), Ці руки нічого не крали: Аваков пообещал
отправить сына в суд (These hands did not steal anything: Avakov promised to send his son
to court) (Ділова столиця 2017). As the examples above show, the phraseologism in the
Ukrainian media discourse is used in relation to various politicians. In Russian media, the
phrase is translated and serves exclusively to characterize V. Yushchenko: “Эти руки
ничего не крали”: Из всех экс-президентов Украины содержание из бюджета получает
только Ющенко (“These hands did not steal anything”: Only Yushchenko gets the budget
from all the ex-presidents of Ukraine) (Rusnext.ru 2018).
Currently, the third variant is not productive. Now in the Russian media we often meet
macaronic texts, in which Ukrainian lexemes and phrases are given in a transliterated form.
As an example, we can quote a fragment of the article by journalist of “Komsomolskaya
Pravda” A. Grishin “Ukrainian users of the network ridiculed Klimkin for his pants on his
arrival in Avdeevka” (Ukrainian lexemes and phrasemes are highlighted):
Странный наряд министра иностранных дел незалежной вызвал смех и недоумение.
(…) В общем, все как обычно – шукайте гроши, панове! Бо Украйна ще не вмерла. А
ведь все разгадывается гораздо проще – над костюмами и Климкина, и Порошенко
явно поработала “рука Кремля” (Комсомольская правда 2018).
The strange dress of the Minister of Foreign Affairs of an independent country caused
laughter and bewilderment. (…) In general, everything as usual – look for money, gentlemen!
Because Ukraine has not yet died. But everything is solved much easier – over the costumes
and Klimkin, and Poroshenko has clearly worked “the Kremlin's hand”.
The use of the Ukrainian lexeme “незалежна” and the expressions “шукайте гроши,
панове!”, “Украйна ще не вмерла” in the Russian text suggests that the media audience
understands them even without translation. Moreover, if they were translated into Russian,
the text would lose much of its expressiveness. The use of Ukrainian phrase also increases
the text´s emotiveness and evaluation, allows to implement the impact function more fully,
which is the main objective of the political media discourse.
Littera Scripta, 2018, Volume 11, Issue 2
66
Conclusion
The active penetration of Ukrainian phraseological neologisms into Russian media
discourse is due, first of all, to the fact that the conflict with Ukraine has become one of the
most important events in political life of Russia.
Analysis of the Ukrainian phraseological neologisms use in Russian political media
discourse allows us to draw certain conclusions. The phraseologism form is preserved in
cases where: 1) the phraseologism was originally used in Russian (“готовиться к земле”,
“смотреть в завтрашний день”); 2) differences in spelling and pronunciation of Ukrainian
and Russian variants are minimal (“Україна не Росія” and «Украина не Россия”,
“щупальця Москви” and “щупальца Москвы”) or none at all (“рука Кремля” is equally
spelled in both languages); 3) translation of phraseologism from Ukrainian into Russian
leads to significant losses in the expressiveness of the journalistic text (“Маємо те, що
маємо” and “Имеем, что имеем”, “Ці руки нічого не крали” and “Эти руки ничего
не крали”). Translation of Ukrainian phraseological units is carried out only in the case
when it is necessary to convey only the meaning of the statement, regardless of the changes
in its expresiveness (“We have what we have” and “These hands did not steal anything”).
Translation leads to the loss of an element of exoticism, attribution to Ukrainian realities
(as in the case of the translation of the word “пан” as “господин”). Therefore, currently the
most popular variant for the transfer of Ukrainian phraseological neologisms is
transliteration.
In Russian media discourse, Ukrainian neophrasemes retain their semantics when there is
a consensus on audiences that are opposed to each other in relation to the denotations of
phraseologism (“to prepare for the ground”, “to look at tomorrow”). The meanings are
reversed when the attitudes towards the denotations are fundamentally different
(“Ukraine is not Russia” in the meaning of “Ukraine is better” and in the meaning “Ukraine
is worse”).
The choice of one of the three variants is determined by both linguistic and extralinguistic
factors.
The Ukrainian political neophrasemes borrowing is firstly related to the relevance for
media discourse borrowing of the phenomenon, event or process that phraseological units
designate. Those Ukrainian phraseological neologisms that either characterize the
phenomena universal for both countries, or brightly convey the specificity of Ukrainian
political life in the aspect of its influence on Russia's policy, fall in the Russian media
discourse and are fixed in it.
References
ALEFIRENKO, N. F., 2015. Сognitive-semiotic mechanisms of phraseme building.
Jazykovedny casopis. 66(2), 81–99. ISSN 0021-5597
ALEFIRENKO, N. F., 2016. Mediadiskurs i yego kommunikativno-pragmaticheskaya
sushchnost'. Medialingvistika. 1(11), 49–57. ISSN 2312-0274.
Littera Scripta, 2018, Volume 11, Issue 2
67
ALEFIRENKO, N. F. et al., 2016. Sovremennaya frazeologiya: tendentsii i innovatsii. Moskva,
Sankt-Peterburg, Bryansk: Novyy proyekt. ISBN 978-5-9908370-0-3.
ANTONOVA, T. G., 2017. Konflikt na Ukraine “glazami Yevropy”: metaforicheskoye
modelirovaniye obraza v britanskom izdanii “Guardian”. Vestnik Tomskogo
gosudarstvennogo universiteta. 419, 12–22. ISSN 1561-7793
BELOV, V., 2016. Nekotoryye leksicheskiye protsessy v rossiyskom politicheskom diskurse
(na materiale rossiyskikh Internet-gazet). Zeitschrift für Slavische Philologie, 72(2), 383–
411. ISSN 0044-3492.
BUSHEV, A. B., 2016. Ukrainskiy krizis v osveshchenii mirovykh media. In: A. B. BUSHEV,
Global'nyy mediadiskurs i mezhkul'turnaya kommunikatsiya. Saarbrücken: Palmarium
Academic Publishing, -, 270–288. ISSN 1999-2629.
DOBROVOL’SKIJ, D. and M. DALMAS, 2016. Idiome und ihre kommunikative Leistung: Zur
Theorie der informationsstrukturellen Gestaltung von Äußerungen. Zeitschrift für
Germanistische Linguistik. 44(2), 257–284. ISSN 0301-3294.
GAZIZOV, R. R. and T. A. NAGOVITSYNA, 2017. Political manipulation of the media (on the
example of mass media of the Republic of Tatarstan). Astra Salvensis. 5(10), 11–16.
ISSN 2393-4727.
GRAY, B. and D. BIBER, 2015. Phraseology. In: BIBER, D. and R. REPPEN (Eds.), The
Cambridge Handbook of English Corpus Linguistics (Cambridge Handbooks in Language and
Linguistics.). Cambridge: Cambridge University Press, 125–145. ISBN 978-1107037380
KABLUKOV, E., 2016. The metamorphosis of the phraseological unit “the fifth column” in
modern Russian media discourse. Slavia Orientalis. 65(4), 805–821. ISSN 0037-6744.
MELIKYAN, V., A. MELIKYAN and A. DZYUBENKO, 2017. Syntactic phraseological units.
Syntactic phraseology. Phraseological subsystem of language. Zeitschrift für
Slawistik. 62(1), 23–47. ISSN 0044-3506.
MOKIENKO, V., 2015. Jazyková politika a národná identita. Jazykovedný časopis. Vedecký
časopis pre otázky teórie jazyka. Journal of Linguistics. Scientific Journal for the Theory of
Language. 66(2), 168–173. ISSN 0021-5597.
MOKIENKO, V. M., 1989. Slavyanskaya frazeologiya. Moskva: Vysshaya shkola. ISBN 5-06-
001467-3.
MOKIENKO, V. M., 2016. Funktsii frazem v sovremennykh SMI. Medialingvistika. 3(13), 7–
18. ISSN 2312-0274.
NEDASHKIVSKA, A., 2015. “Ukraine is United” Campaign: Public Discourse on Languages in
Ukraine at a Time of Political Turmoil. Zeitschrift für Slawistik. 60(2), 294–311. ISSN 0044-
3506.
SIVENKOVA, M. A., 2016. Intertextual references in British, German and Russian political
interviews and blogs. Zeitschrift für Slawistik. 61(1), 161–183. ISSN 0044-3506.

Littera Scripta, 2018, Volume 11, Issue 2
68
STEYER, K., 2015. Patterns. Phraseology in a state of flux. International Journal of
Lexicography. 28(3), 279–298. ISSN 0950-3846.
STOYANOVA, E., 2013. Metafora prez prizmata na lingvokulturnata situatsiya. Shumen:
Universitet·sko izdatelstvo “Episkop Konstantin Preslavski”. ISBN 978-954-577-663-2.
FEDENEVA, U. B., 1999. Metaforicheskoye modelirovaniye v agitatsionno-politicheskom
tekste. In: A. P. CHUDINOV (Ed.), Mnogoznachnost' v leksike sovremennogo russkogo yazyka.
Yekaterinburg: Ural'skiy gosudarstvennyy pedagogicheskiy universitet, 304–355. ISBN 5-
7186-0291-3.
Contact address of the authors:
Mgr. Elena Tomášková, Department of Foreign Languages, Faculty of Corporate Strategy, Institute of Technology and Business in České Budějovice, Okružní 517/10, České Budějovice, 370 01, Czech Republic, e-mail: [email protected].
TOMÁŠKOVÁ, E., 2018. Functioning of Ukrainian Phraseological Neologisms
in Russian Political Media Discourse. Littera Scripta [online]. České
Budějovice: Institute of Technology and Business in České Budějovice, 11(2),
59-68 [accessed: 2018-12-20]. ISSN 1805-9112. Available at:
http://journals.vstecb.cz/category/littera-scripta/11-rocnik-2018/2_2018/.
69
Applying the Options Framework
to a Value-based Model of the Firm
Jan Vlachý
Czech Technical University in Prague, MIAS School of Business
Abstract
This paper develops the value-based model of a firm from a conventional accounting-
based approach to one that acknowledges individuals' human capital and firms'
competences as fundamental creators of value. Both have distinctive characteristics,
but may be integrated from the perspective of their holders through various
contracts, which then constitute contractual assets enhancing a firm´s capital. Product
ownership constitutes another vital component of value determination and is one of
the reasons firms enhance its value, either by taking protective action, or by designing
hard-to-replicate strategies.
This paper addresses a current issue and presents potential means by which to
determine firms' strategies in highly competitive business environments driven
primarily by innovations, as well as for the design of appropriate types and terms of
contracts. In its reasoning, the paper is exceptional by aggregating the findings of firm
theory with those of modern financial theory, proposing real and embedded options
within an appropriate quantitative framework.
Keywords: business valuation, human capital, strategy, options theory
Introduction
Conventional valuation methods originated in times when firms directed most of their
capital investments into tangible means of production, such as machines, equipment and
real estate, as premised by Babcock (1932) or Williams (1938). The value of a business
therefore broadly corresponded to the intrinsic value of its tangible assets. However, since
the mid-20th century, theoreticians as well as practitioners have started to acknowledge
the gap between the traditional intrinsic value-based perspective and the fact that
growing numbers of successful firms have made substantial investments in intangibles by
means of research and development, registering trademarks, acquiring market share or

Littera Scripta, 2018, Volume 11, Issue 2
70
developing human resources. A historical outline of this development has been provided
by Rubinstein (2006) and Carson (2011).
The potential magnitude and diversity of this gap can be illustrated by comparing the
book and market values of several large companies in different markets according to
recently audited reports (see Table 1). The results clearly suggest that there is a need to
employ new approaches in both academia and practice.
Table 1: Book values and market capitalisations of selected firms
Company Exchange Book Value Market Value Mkt/Bk
General Electric Co.(1) NYSE $75.8 bil. $272.7 bil. 3.6
Deere & Co.(2) NYSE $6.5 bil. $27.7 bil. 4.3
Citigroup Inc.(1) NYSE $225.1 bil. $166.0 bil. 0.7
Microsoft Corp.(3) Nasdaq $72.0 bil. $385.1 bil. 5.3
Volkswagen AG(1) Xetra €184.9 bil. €67.9 bil. 0.4
Nestlé AG(1) SIX SFr66.0 bil. SFr228.1 bil. 3.5
ČEZ, a.s.(1) BCPP Kč261.4 bil. Kč229.7 bil. 0.9
Source: Vlachý (2018, p. 19); (1)As of fiscal year ending on 31-12-2016; (2)ditto 31-10-
2016; (3)ditto 30-6-2016.
Penrose (1959) initiated pioneering work in the domain of firm theory with her
resource-based perspective. In contrast to her predecessors, influenced primarily by
Schumpeter (1912), rather than looking at the external environmental effects, she
focused on an organization's internal environment, resources and skills, highlighting the
creation of value within a firm, rather than its redistribution. In the late 1980s, this line of
reasoning became one of the factors contributing to the development of the concept of
the targeted creation of comparative advantage and its protection in order to draw
entrepreneurial rent, as demonstrated by Hodgson (1988) and Barney (1991).
Another important highlight relates to the key competences proposition, as formulated
by Hamel and Prahalad (1994). These are capabilities that are essential for the
implementation of strategies facilitating the discovery of potentially valuable courses of
knowledge that fill in existing gaps. Ghoshal et al. (1999) introduced a broader and deeper
insight into the value of people as an essential component of firms' resources by
highlighting the importance of management skills.
In parallel, Kogut and Zander (1992) developed their knowledge-based theory of the firm,
claiming that the primary resource is actually people's capabilities. This ultimately
supports the concept of a "learning firm" (Lundvall and Johnson, 1994), evoking the
impression of a collective, rather than individual learning process.
Summarily, all of these frameworks have led to a general understanding that factors such
as business licences, development potential or know how are qualitatively important.
Littera Scripta, 2018, Volume 11, Issue 2
71
However, as argued by Ortiz (2006), Saaty (2009) or Wang et al. (2014), in actual
decision-making, such intuitive reasoning is a poor substitute for a robust valuation
model that enables the comparison of alternative opportunities for the allocation of
scarce resources.
Last but not least, as explained by Anderson et al. (2014) or Birdi et al. (2016), there is a
clear conceptual benefit to separating an individual's generation of new ideas from the
implementation of those ideas, which is even more critical whenever decisions need to be
made in respect to valuation, contracting or transaction pricing.
The objective of this paper is to therefore define the position and role of assets
representing a particular form of knowledge within the framework of a structured value-
based model of the firm, and coupling that role with the personal endowment,
development and contracting decisions of an individual. It is innovative in integrating
financial theory with the theory of the firm, providing a sound theoretical
contextualisation in an area which has commonly been based mainly on heuristic
approaches.
It will be shown that the factor, commonly designated as human capital, constitutes a
particular source of value, manifest in a firm's intangible assets. This combines
managerial, technical and economical perspectives and may constitute a useful lead in
strategic decision-making, as well as various types of contracting. Real options are
proposed as the preferred means of quantitative analysis.
Relating Contractual Assets and Human Capital
The theory of the firm does not primarily focus on which types of assets should be
attributed primarily to individuals, or to firms. In the following discussion, a point is
therefore made of consistently distinguishing between human capital as an attribute of
individuals and competences constituting part of a firm´s intangible assets, while
capabilities constitute a bundling of resources (which can be generated by firms as well
as individuals), which only becomes a competence upon attaining a competitive
advantage (Sirmon, Hirt and Ireland, 2007).
Moreover, besides competences, sometimes designated as knowledge assets, intangibles
also include contractual assets, whose value is determined by the existence of a contract,
be it private, public, written or implicit, and its enforcement potential (Vlachý, 2010).
Contractual assets therefore include intellectual property (patents, licenses, copyright,
trade secrets, trademarks, software), as well as various kinds of commercial, employment
and other contracts.
This framework is illustrated in Table 2, which presents a conventional accounting view
(in particular regarding the specification of intangibles), and compares the perspectives
of firms as well as individuals.
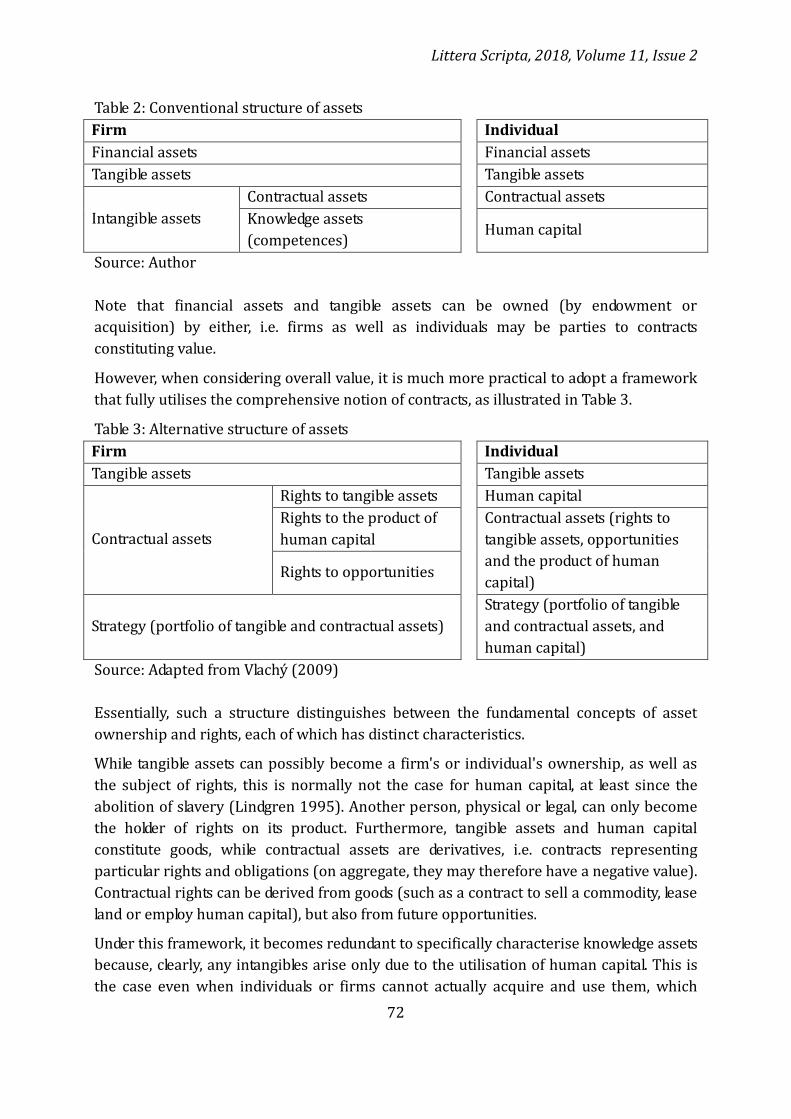
Littera Scripta, 2018, Volume 11, Issue 2
72
Table 2: Conventional structure of assets
Firm Individual
Financial assets Financial assets
Tangible assets Tangible assets
Intangible assets
Contractual assets Contractual assets
Knowledge assets
(competences) Human capital
Source: Author
Note that financial assets and tangible assets can be owned (by endowment or
acquisition) by either, i.e. firms as well as individuals may be parties to contracts
constituting value.
However, when considering overall value, it is much more practical to adopt a framework
that fully utilises the comprehensive notion of contracts, as illustrated in Table 3.
Table 3: Alternative structure of assets
Firm Individual
Tangible assets Tangible assets
Contractual assets
Rights to tangible assets Human capital
Rights to the product of
human capital
Contractual assets (rights to
tangible assets, opportunities
and the product of human
capital) Rights to opportunities
Strategy (portfolio of tangible and contractual assets)
Strategy (portfolio of tangible
and contractual assets, and
human capital)
Source: Adapted from Vlachý (2009)
Essentially, such a structure distinguishes between the fundamental concepts of asset
ownership and rights, each of which has distinct characteristics.
While tangible assets can possibly become a firm's or individual's ownership, as well as
the subject of rights, this is normally not the case for human capital, at least since the
abolition of slavery (Lindgren 1995). Another person, physical or legal, can only become
the holder of rights on its product. Furthermore, tangible assets and human capital
constitute goods, while contractual assets are derivatives, i.e. contracts representing
particular rights and obligations (on aggregate, they may therefore have a negative value).
Contractual rights can be derived from goods (such as a contract to sell a commodity, lease
land or employ human capital), but also from future opportunities.
Under this framework, it becomes redundant to specifically characterise knowledge assets
because, clearly, any intangibles arise only due to the utilisation of human capital. This is
the case even when individuals or firms cannot actually acquire and use them, which
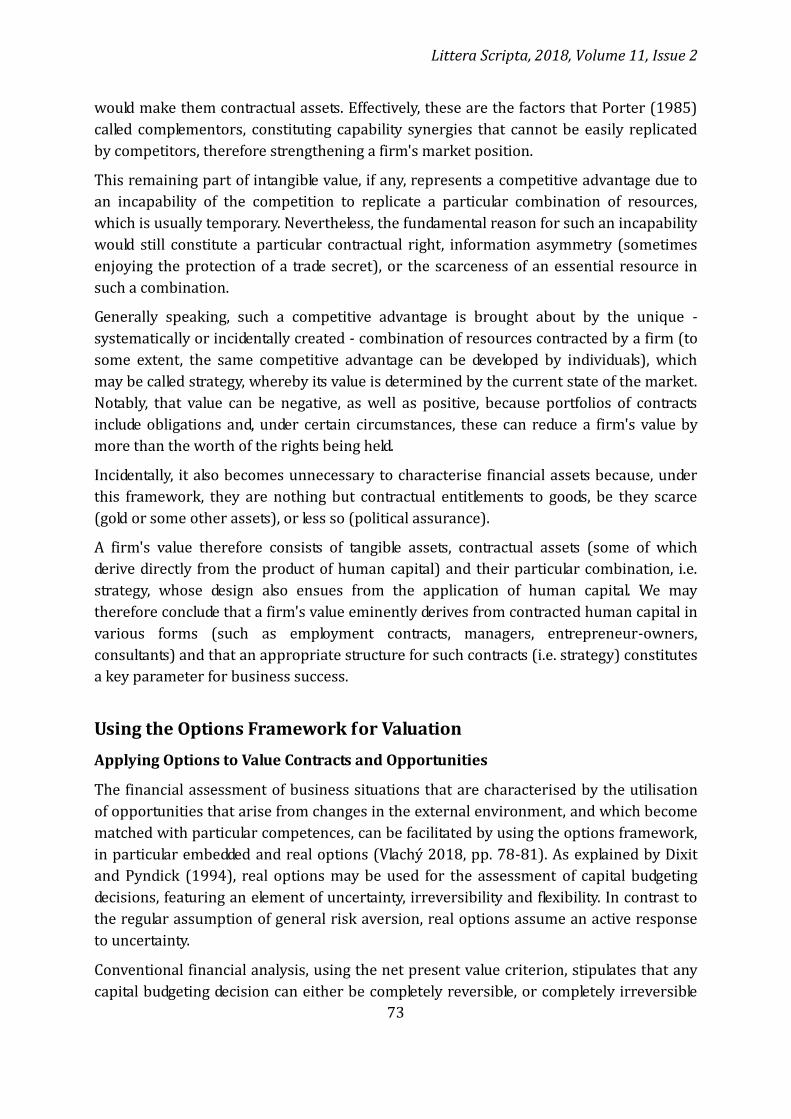
Littera Scripta, 2018, Volume 11, Issue 2
73
would make them contractual assets. Effectively, these are the factors that Porter (1985)
called complementors, constituting capability synergies that cannot be easily replicated
by competitors, therefore strengthening a firm's market position.
This remaining part of intangible value, if any, represents a competitive advantage due to
an incapability of the competition to replicate a particular combination of resources,
which is usually temporary. Nevertheless, the fundamental reason for such an incapability
would still constitute a particular contractual right, information asymmetry (sometimes
enjoying the protection of a trade secret), or the scarceness of an essential resource in
such a combination.
Generally speaking, such a competitive advantage is brought about by the unique -
systematically or incidentally created - combination of resources contracted by a firm (to
some extent, the same competitive advantage can be developed by individuals), which
may be called strategy, whereby its value is determined by the current state of the market.
Notably, that value can be negative, as well as positive, because portfolios of contracts
include obligations and, under certain circumstances, these can reduce a firm's value by
more than the worth of the rights being held.
Incidentally, it also becomes unnecessary to characterise financial assets because, under
this framework, they are nothing but contractual entitlements to goods, be they scarce
(gold or some other assets), or less so (political assurance).
A firm's value therefore consists of tangible assets, contractual assets (some of which
derive directly from the product of human capital) and their particular combination, i.e.
strategy, whose design also ensues from the application of human capital. We may
therefore conclude that a firm's value eminently derives from contracted human capital in
various forms (such as employment contracts, managers, entrepreneur-owners,
consultants) and that an appropriate structure for such contracts (i.e. strategy) constitutes
a key parameter for business success.
Using the Options Framework for Valuation
Applying Options to Value Contracts and Opportunities
The financial assessment of business situations that are characterised by the utilisation
of opportunities that arise from changes in the external environment, and which become
matched with particular competences, can be facilitated by using the options framework,
in particular embedded and real options (Vlachý 2018, pp. 78-81). As explained by Dixit
and Pyndick (1994), real options may be used for the assessment of capital budgeting
decisions, featuring an element of uncertainty, irreversibility and flexibility. In contrast to
the regular assumption of general risk aversion, real options assume an active response
to uncertainty.
Conventional financial analysis, using the net present value criterion, stipulates that any
capital budgeting decision can either be completely reversible, or completely irreversible
Littera Scripta, 2018, Volume 11, Issue 2
74
over the life of the project or asset. In the real world this is not realistic, and the decision-
maker usually has some discretion regarding future choice, with the uncertainty
decreasing over time. In other words, we speak about the process of the gradual
accumulation of knowledge and experience, i.e. learning (Payzan-LeNestour and
Bossaerts 2011). Combined in a portfolio with embedded contractual options, real
options therefore constitute the essence of a firm's strategy, which applies continuous
flexibility in response to newly acquired knowledge (Luehrman 1998).
Once real options are related to firms' strategies, it becomes quite intuitive to translate
this framework to the concept of knowledge and learning. Kogut and Kulatilaka (2001)
applied options to firms' competences, claiming (p. 3) that "A real option is the
investment in physical assets, human competence, and organisational capabilities that
provide the opportunity to respond to future contingent events." As an example, they
quoted an investment into a loss-making distribution network in a developing country,
which brought with it an improved understanding of the local environment, therefore
facilitating rapid business expansion once the economy started to grow.
Competences within a firm include individual knowledge and the capabilities of its
managers and staff (i.e. contracted human capital), as well as social relations ensuing
from the firm's procedures, management processes and communication and cultural
norms. This enables Pandza et al. (2003) to conclude that in general, the building up of
competences is analogous to the application of real options to strategy because a firm's
competences, similarly to its resources, create future opportunities. Berg and Kaše
(2005) endeavour to value human capital accordingly by applying an option-based model
to the assessment of human resources management policy.
The earliest applications of real options, pioneered by Myers (1984) and Brennan and
Schwartz (1985), tended to focus on problems with a clear analogy to financial options,
facilitating their valuation using known analytical methods, such as variants of the Black-
Scholes model. This requires, among other constraints, exclusive ownership of future
opportunities by the option holder, which may be due to legal or regulatory factors
hindering competitors' entry (mining or broadcasting rights, patent or trademark
protection), as well as temporary economic barriers.
More recently, researchers have started addressing situations where the value of real
options may be actively impacted by the behaviour of competitors. Typically, an
investment delay with such shared (competitive) options may substantially reduce future
incomes due to competitors' entry into the industry. The value of various strategies can
then be assessed using game theory, as shown by Smit and Trigeorgis (2004).
Applying Options to Value the Product of Human Capital
The most obvious case of an individual utilising their capabilities (i.e. human capital) to
generate future incomes arises when they become an entrepreneur, taking decisions on
their own account and at their own risk. In a broader sense, however, they also take
Littera Scripta, 2018, Volume 11, Issue 2
75
entrepreneurial decisions when they become employed or acquire an equity stake in a
company; the incomes resulting from their decisions then only become subject to a
particular type of contract.
In fact, individuals take entrepreneurial decisions even when making choices that - from
the perspective of their actual capabilities - do not maximise future incomes (such as
when a nuclear scientist uses their personal savings to spend the remainder of their life
travelling and studying exotic insects); such a choice can be assessed based on
opportunity costs. All such scenarios are part of an individual's strategy with regards to
human capital, as noted in Table 3.
Human capital has several specific features. An individual´s capabilities may be
indigenous (which is an analogy to the endowment of goods commonly considered in
macroeconomic analysis); it is possible to develop them through investment (for example,
in education), and they determine opportunities for future incomes or other gains.
Capabilities, once acquired, become irrevocable, which makes investments in human
capital risky in terms of its change in value due to external environmental changes.
Capabilities therefore constitute real options and investments in human capital can be
considered purchases of real options.
For all intents and purposes, such an option is proprietary, in some cases, however, it is
possible to transfer the rights to its pay-outs. The forms of such transfer may include
employment contracts or partnership deeds. Nevertheless, in contrast to tangible assets,
there is no ownership title, but rather a bilateral contractual arrangement, where the
holders of capabilities have their own rights, including that of leaving a firm or deciding
whether to invest in their own capabilities. Such rights, similar to firms' rights, therefore
always constitute a set of embedded options.
It is important to note here that the transfer of rights to the options' pay-outs need not
always be completely voluntary from the holder's point of view. One typical example
involves income tax, as explained in a similar context by Vlachý (2007).
The Value of Discovering Options
The most valuable component of human capital is its capability to discover new real
options because this is the one option that is, in comparative terms, the least competitive.
This is what most people would describe as creative capabilities in the broadest sense,
and contrasts with the highly competitive commodity component of human capital
("manpower"), which is essentially a substitute for tangible assets (such an assumption is
made by Becker 1975).
In some specific, and rather unique cases, as with inventors or artists, the product of
their creative activity constitutes a contractual asset, which can be sold outright. In this
context, Tunaru et al. (2005) consider professional sports clubs, whose own value derives
from the ownership of negotiable rights on individual athletes.
Littera Scripta, 2018, Volume 11, Issue 2
76
Notwithstanding all other things, valuation principally depends on whether the real
option can be exercised by the particular individual, who therefore retains its protected
ownership, or whether its discovery or publication makes the option publicly available,
i.e. shared. The discoverer is then often left with the only choice of associating with a
stronger partner, such as a firm, capable of taking the necessary steps to safeguard the
value of the option, at the cost of forsaking part of its pay-outs. This explains why many
capable individuals work as employees, even though ostensibly at a disadvantage from the
perspective of profit sharing.
Finally, some options can be discovered only by teams of capable individuals, or using
tangible assets not available to the individuals themselves. This may relate to research
laboratories for scientists, but also large firms when the capabilities are borne by
managers. This creates incentives to retain such groups of individuals, or their particular
pairings with the tangible assets.
Conclusion
Option analysis, which on the one hand describes contractual relationships (embedded
options), and on the other hand intangible assets (real options), all constituting products
of human capital, may be used for the optimisation of contracting. From the perspective
of a firm, it indicates that different forms and terms of contracts must be used for
different ways of using human capital.
The most valuable product of human capital relates to the discovery of real options, which
also determines the value of investment in human capital. However, the principal´s actual
behaviour will be determined by the extent to which their options are owned or shared.
Provided there is an ownership potential, the person will be strongly motivated to invest
in their capabilities, not only with regards to the options´ time to expiry, but also with
regards to the uncertainty of future incomes, in analogy to financial options.
In contrast, when the options are typically shared, as with commodity labour or scientific
research, which is published rather than patented, value is enhanced by comparative
advantages (unique skills) and early market entry. Higher incomes from real options then
tend to be realised by individuals with capabilities acquired at an earlier stage, for
example, by getting their training or education at an earlier age, or skipping non-essential
phases (note the successful entrepreneurs who did not graduate in order to develop their
businesses). In such cases, the value of the options need not be determined primarily by
future uncertainty, but by sunk costs. There is also a much greater role for firms to
enhance the value of an individual´s human capital product developing strategies that may
be hard to replicate.
A similar line of reasoning can be taken in regard to public policies. In the first case, when
the options are mostly owned, it can be shown that any government policies aimed at
mitigating uncertainty, including a generous social security system, industrial
interventions or pro-active education capacity planning, may have a detrimental effect on
Littera Scripta, 2018, Volume 11, Issue 2
77
an individual´s investment in their own human capital. Any subsidies supporting the
development of human capital can therefore be perceived as a net rent appropriated to
individuals, who were granted real options (for example through tuition waiver). In the
second, where shared options prevail, the outcome is similar, however, the rent is
allocated primarily to firms that take advantage of an increased supply of skilled
workforce, which diminishes the incentive to share in the product, either through profit-
sharing or by investing in the development of human capital themselves.
References
ANDERSON, N., K. POTOČNIK and J. ZHOU, 2014. Innovation and creativity in
organizations: A state-of-the-art review, prospective commentary, and guiding
framework. Journal of Management. 40(5), 1297-1333. ISSN 0149-2063.
BABCOCK, F. M., 1932. The valuation of real estate. New York: McGraw-Hill.
BARNEY, J., 1991. Firm resources and sustained competitive advantage. Journal of
Management. 17(1), 99-120. ISSN 0149-2063.
BECKER, G., 1975. Human capital. 2nd ed. New York: Columbia University Press.
BERK, A. and R. KAŠE, 2005. Merjenje vrednosti prakse ravnanja s človeškimi viri
z uporabo realnih opcij. Ljubljana: Ekonomska Fakulteta, Working Paper No. 71.
BIRDI, K., D. LEACH and W. MAGADLEY, 2016. The relationship of individual capabilities
and environmental support with different facets of designers' innovative behavior.
Journal of Production Innovation Management. 33(1), 19-35. ISSN 0737-6782.
BRENNAN, M. and E. SCHWARTZ, 1985. Evaluating national resource investments. Journal
of Business. 58(2), 135-157. ISSN 0021-9398.
CARSON, R. T., 2011. Contingent valuation: A comprehensive bibliography and history.
Cheltenham: Edward Elgar. ISBN: 978-1840647556
DIXIT, A. and R. PINDYCK, 1994. Investment under uncertainty. Princeton: Princeton
University Press. ISBN 978-0-691-03410-2.
GHOSHAL, S., M. HAHN and P. MORAN, 1999. Management competence, firm growth and
economic progress. Contributions to Political Economy. 18(1), 121-150. ISSN 0277-5921.
HAMEL, G. and C. PRAHALAD, 1994. Competing for the future: Breakthrough strategies.
Boston: Harvard Business School Press. ISBN 978-0-875-84716-0.
HODGSON, G., 1988. Economics and institutions: A Manifesto for modern institutional
economics. Cambridge: Polity Press.
KOGUT, B. and N. KULATILAKA, 2001. Capabilities as real options. Organization Science.
12(6), 744-758. ISSN 1047-7039.
KOGUT, B. and U. ZANDER, 1992. Knowledge of the firm, combinative capabilities and the
replication of technology. Organization Science. 3(3), 383-397. ISSN 1047-7039.

Littera Scripta, 2018, Volume 11, Issue 2
78
LINDGREN, J., 1995. Measuring the value of slaves and free persons in ancient law.
Chicago-Kent Law Review. 71(1), 149-215. ISSN 0009-3599.
LUEHRMAN, T., 1998. Strategy as a portfolio of real options. Harvard Business Review.
76(5), 89-99. ISSN 0017-8012.
LUNDVALL, B. and B. JOHNSON, 1994. The Learning economy. Journal of Industry Studies.
1(2), 23-42. ISSN 1320-6095.
MIRLEES, J., 1971. An exploration in the theory of optimum income taxation. Review of
Economic Studies. 38(2), 175-208. ISSN 0034-6527.
MYERS, S., 1984. The capital structure puzzle. Journal of Finance. 39(3), 575-592. ISSN
0022-1082.
ORTIZ, M., 2006. Intellectual capital (intangible assets) valuation considering the context.
Journal of Business & Economics Research. 4(9), 35-42. ISSN 1542-4448.
PANDZA, K. et al., 2003. A real options approach to managing resources and capabilities.
International Journal of Operations & Production Management. 23(9), 1010-1032. ISSN
0144-3577.
PAYZAN-LENESTOUR, E. and P. BOSSAERTS, 2011. Risk, unexpected uncertainty, and
estimation uncertainty: Bayesian learning in unstable settings. PLoS Computational
Biology. 7(1), 1-14. ISSN 1553-734X.
PENROSE, E., 1959. The Theory of the growth of the firm. New York: Wiley.
PORTER, M., 1985. Competitive advantage. New York: Free Press.
RUBINSTEIN, M., 2006. A history of the Theory of investments. Hoboken: John Wiley. ISBN
978-0-471-77056-5.
SAATY, T., 2009. Extending the measurement of tangibles to intangibles. International
Journal of Information Technology & Decision Making. 8(1), 7-27. ISSN 0219-6220.
SCHUMPETER, J., 1912. Theorie der wirtschaftlichen Entwicklung. Leipzig: Duncker &
Humblot.
SIRMON, D.G., M.A. HITT and R.D. IRELAND, 2007. Managing firm resources in dynamic
environments to create value: Looking inside the black box. The Academy of Management
Review. 32(1), 273-292. ISSN 0363-7425.
TUNARU, R., E. CLARK and H. VINEY, 2005. An option pricing framework for valuation of
football players. Review of Financial Economics. 14(3/4), 281-295. ISSN 1058-3300.
VLACHÝ, J., 2007. Dodatečné zdanění nejistých osobních příjmů v důsledku daňové
progrese. Politická ekonomie. 55(5), 625-636. ISSN 0032-3233.
VLACHÝ, J., 2009. Strategie podniku a finanční teorie. Politická ekonomie. 57(2), 147-162.
ISSN 0032-3233.
VLACHÝ, J., 2010. Oceňování smluvních aktiv. Oceňování. 3(2), 29-40. ISSN 1803-0785.
Littera Scripta, 2018, Volume 11, Issue 2
79
VLACHÝ, J., 2018. Corporate finance. Praha: Leges. ISBN 978-80-7502-291-2.
WANG, Z., N. WANG and H. LIANG, 2014. Knowledge sharing, intellectual capital and firm
performance. Management Decision. 52(2), 230-258. ISSN 0025-1747.
WILLIAMS, J., 1938. Theory of investment value. Cambridge: Harvard University Press.
Contact address of the author:
doc. Ing. Jan Vlachý, Ph.D., Czech Technical University in Prague, MIAS School of Business,
Kolejní 2637/2a, 160 00 Praha 6, Czech Republic, [email protected]
VLACHÝ, J., 2018. Applying the Options Framework to a Value-based Model of the Firm.
Littera Scripta [online]. České Budějovice: Institute of Technology and Business in České
Budějovice, 11(2), 69-79 [accessed: 2018-12-20]. ISSN 1805-9112. Available at:
http://journals.vstecb.cz/category/littera-scripta/11-rocnik-2018/2_2018/.

80
Multi-criteria Comparison
of Savings Accounts on the Czech Market
Martina Kuncová, Lenka Lízalová
College of Polytechnics Jihlava
Abstract
Even though interest rates have fallen and the profitability of savings accounts has
declined, the range of savings accounts on offer on the Czech market remains
relatively broad due to their popularity, especially among conservative banking
clients. The choice of account is not usually only affected by interest rates, but also by
other factors, such as the minimum deposit, minimum balance, cash withdrawals, the
possibility to open and operate online, various bank fees, etc. The purpose of this
article is to compare the savings accounts on offer in the years 2013 and 2018 in the
Czech Republic through selected multi-criteria evaluation of alternatives methods
and according to different clients’ requirements. The main aim is not only to assess
whether the focus of the banks is on a certain type of client (versatility or non-
universality of the account parameters), but also to assess the development and
changes in the range of products on offer in the given years.
Keywords: savings accounts, Czech market, comparison, multi-criteria evaluation.
Introduction
Saving can be characterised as an activity where a person or family sets aside some of
their income with the intention of using it at a later date. Due to inflation, money kept at
home gradually decreases in value. It is therefore preferable to use one of the currently
available bank accounts; savings accounts, savings books or term deposits, or to invest in
stock bonds or mutual funds. Unlike the various investment options, saving is not risky
and there is no need to worry about any financial loss(es). However, when interest rates
are lower than the level of inflation, the value of the deposited money may decrease. There
are several studies that compare savings accounts’. Loke and Sherraden (2006) compared
Littera Scripta, 2018, Volume 11, Issue 2
81
children savings accounts in 5 countries based on 6 main factors. They concluded that it
is not only the savings accounts’ parameters but also the promotion, levels of
inclusiveness, participation, and savings in the various schemes that increased interest
among parents saving money for their children. In the analysis, Shoven and Sialm (1999)
use an optimization model for the situation when the investor maximizes expected utility
at the time of retirement by choosing an optimal portfolio using tax-deferred and
conventional savings accounts – their results show that the conventional savings accounts
are not entirely preferred by the high-income and risk-tolerant individuals but more by
low-income and risk-averse people. An analysis of the situation among poor households
in Nepal produced similar results (Prina 2013). The main finding was that poor
households saved more when given access to basic savings accounts with no fees. The
analysis of the savings accounts in Chile via regression model proved that access to a fully
liquid savings account can help individuals (especially those on low-incomes) improve
consumption smoothing in the face of economic shocks.
Comparisons of the savings accounts in the Czech Republic are usually conducted by
students writing their Bachelor thesis (for example Bílá 2014; Ducarová 2014;
Ligmajerová 2013 or Mocharová 2018). On the one hand, it seems to be easy for the
students to find real data (mainly on the web pages of the banks), whilst on the other, the
information and prices change every year. Making such comparisons may be viewed as an
easy task because of the various online calculators (for example Mesec.cz 2018 or
Usetreno.cz 2018) that exist. However, such comparisons are usually limited to
comparisons of savings accounts according to the interest rates. In the rare cases where
such comparisons include other parameters, they are, unfortunately, not always up-to-
date.
A few years ago, savings accounts were very popular in the Czech Republic because
interest rates were relatively high. This encouraged consumers to deposit money rather
than to borrow from banks. With the gradual fall in interest rates, which currently are up
to or around 1% for savings accounts, and not much higher for term deposits, the situation
has changed. Today, savings accounts offer minimal appreciation, with little hope for a
growth in rates (Ligmajerová 2013). The low interest rates have stimulated the demand
for consumer loans rather than saving for worse times. With more than CZK 1 trillion
deposited in Czech bank accounts, banks have sufficient funds to deal with this demand
and have little interest in attracting new deposits. As a result, they do not need to raise
interest rates on savings accounts (Ligmajerová 2013). Despite this unfavourable
situation, it is better to deposit money into savings accounts than current accounts.
Since account selection does not have to depend solely on the interest rate, the analysis
presented in this paper seeks to compare a range of savings account on offer in the years
2013 and 2018 based on several criteria. The criteria were selected based on information
provided by banks online or provided by bank staff personally (data was collected by
students and used for example in Mocharová 2018). For this comparison, multi-criteria
evaluation of alternatives methods are used.
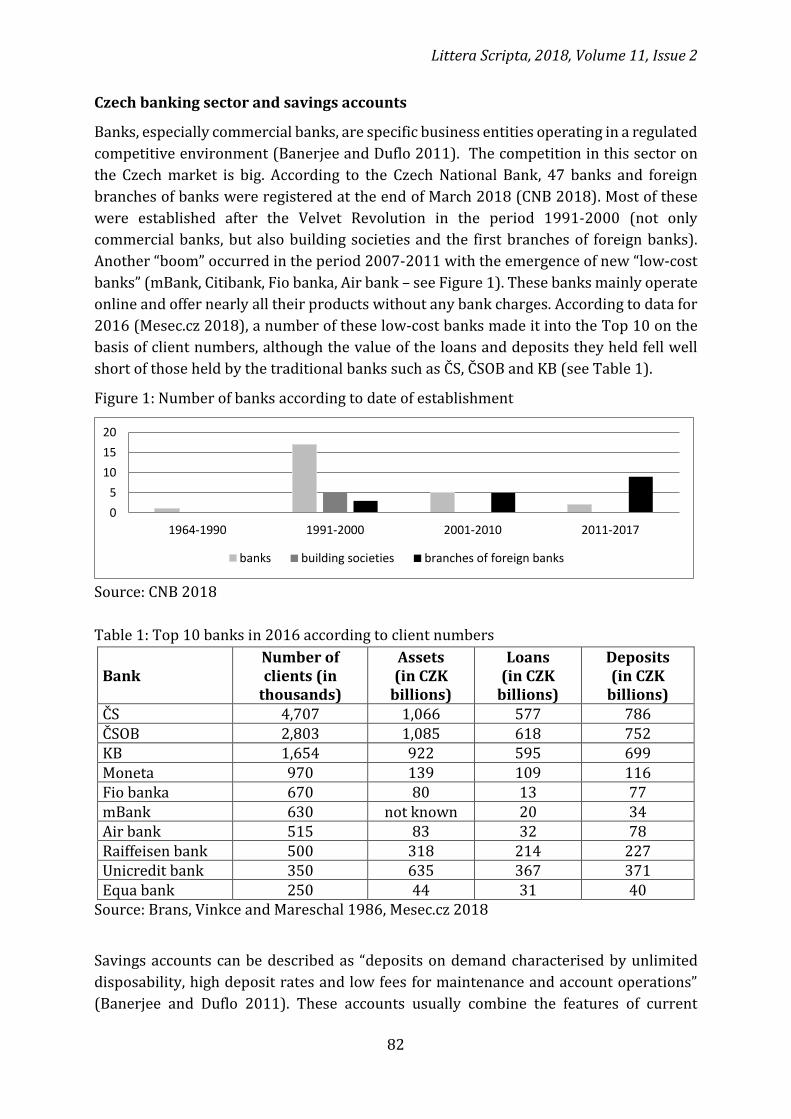
Littera Scripta, 2018, Volume 11, Issue 2
82
Czech banking sector and savings accounts
Banks, especially commercial banks, are specific business entities operating in a regulated
competitive environment (Banerjee and Duflo 2011). The competition in this sector on
the Czech market is big. According to the Czech National Bank, 47 banks and foreign
branches of banks were registered at the end of March 2018 (CNB 2018). Most of these
were established after the Velvet Revolution in the period 1991-2000 (not only
commercial banks, but also building societies and the first branches of foreign banks).
Another “boom” occurred in the period 2007-2011 with the emergence of new “low-cost
banks” (mBank, Citibank, Fio banka, Air bank – see Figure 1). These banks mainly operate
online and offer nearly all their products without any bank charges. According to data for
2016 (Mesec.cz 2018), a number of these low-cost banks made it into the Top 10 on the
basis of client numbers, although the value of the loans and deposits they held fell well
short of those held by the traditional banks such as ČS, ČSOB and KB (see Table 1).
Figure 1: Number of banks according to date of establishment
Source: CNB 2018
Table 1: Top 10 banks in 2016 according to client numbers
Bank Number of clients (in
thousands)
Assets (in CZK
billions)
Loans (in CZK
billions)
Deposits (in CZK
billions) ČS 4,707 1,066 577 786 ČSOB 2,803 1,085 618 752 KB 1,654 922 595 699 Moneta 970 139 109 116 Fio banka 670 80 13 77 mBank 630 not known 20 34 Air bank 515 83 32 78 Raiffeisen bank 500 318 214 227 Unicredit bank 350 635 367 371 Equa bank 250 44 31 40
Source: Brans, Vinkce and Mareschal 1986, Mesec.cz 2018
Savings accounts can be described as “deposits on demand characterised by unlimited
disposability, high deposit rates and low fees for maintenance and account operations”
(Banerjee and Duflo 2011). These accounts usually combine the features of current
0
5
10
15
20
1964-1990 1991-2000 2001-2010 2011-2017
banks building societies branches of foreign banks
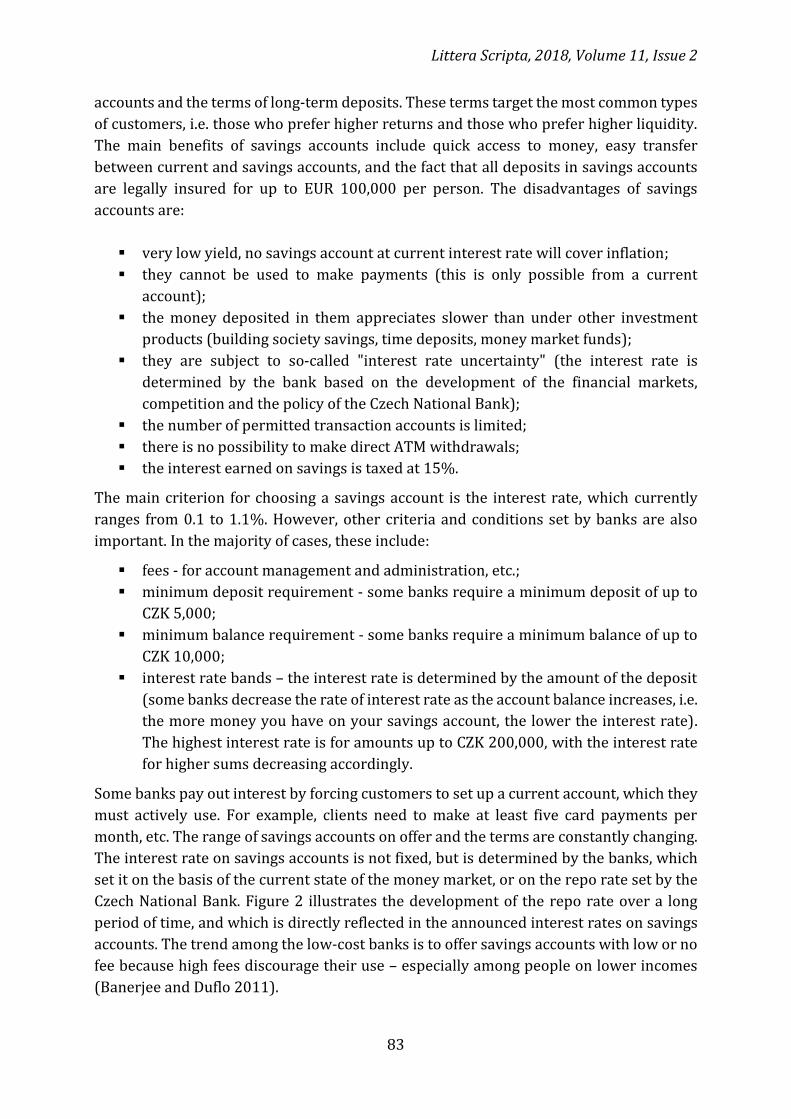
Littera Scripta, 2018, Volume 11, Issue 2
83
accounts and the terms of long-term deposits. These terms target the most common types
of customers, i.e. those who prefer higher returns and those who prefer higher liquidity.
The main benefits of savings accounts include quick access to money, easy transfer
between current and savings accounts, and the fact that all deposits in savings accounts
are legally insured for up to EUR 100,000 per person. The disadvantages of savings
accounts are:
very low yield, no savings account at current interest rate will cover inflation;
they cannot be used to make payments (this is only possible from a current
account);
the money deposited in them appreciates slower than under other investment
products (building society savings, time deposits, money market funds);
they are subject to so-called "interest rate uncertainty" (the interest rate is
determined by the bank based on the development of the financial markets,
competition and the policy of the Czech National Bank);
the number of permitted transaction accounts is limited;
there is no possibility to make direct ATM withdrawals;
the interest earned on savings is taxed at 15%.
The main criterion for choosing a savings account is the interest rate, which currently
ranges from 0.1 to 1.1%. However, other criteria and conditions set by banks are also
important. In the majority of cases, these include:
fees - for account management and administration, etc.;
minimum deposit requirement - some banks require a minimum deposit of up to
CZK 5,000;
minimum balance requirement - some banks require a minimum balance of up to
CZK 10,000;
interest rate bands – the interest rate is determined by the amount of the deposit
(some banks decrease the rate of interest rate as the account balance increases, i.e.
the more money you have on your savings account, the lower the interest rate).
The highest interest rate is for amounts up to CZK 200,000, with the interest rate
for higher sums decreasing accordingly.
Some banks pay out interest by forcing customers to set up a current account, which they
must actively use. For example, clients need to make at least five card payments per
month, etc. The range of savings accounts on offer and the terms are constantly changing.
The interest rate on savings accounts is not fixed, but is determined by the banks, which
set it on the basis of the current state of the money market, or on the repo rate set by the
Czech National Bank. Figure 2 illustrates the development of the repo rate over a long
period of time, and which is directly reflected in the announced interest rates on savings
accounts. The trend among the low-cost banks is to offer savings accounts with low or no
fee because high fees discourage their use – especially among people on lower incomes
(Banerjee and Duflo 2011).
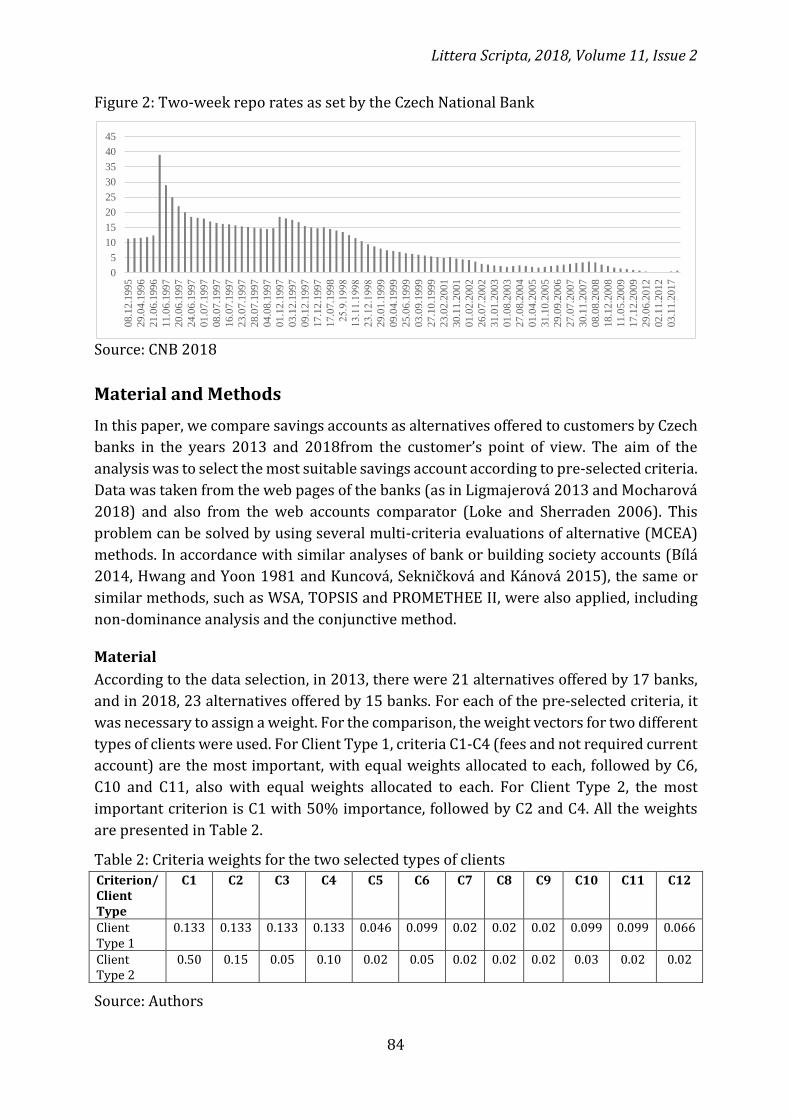
Littera Scripta, 2018, Volume 11, Issue 2
84
Figure 2: Two-week repo rates as set by the Czech National Bank
Source: CNB 2018
Material and Methods
In this paper, we compare savings accounts as alternatives offered to customers by Czech
banks in the years 2013 and 2018from the customer’s point of view. The aim of the
analysis was to select the most suitable savings account according to pre-selected criteria.
Data was taken from the web pages of the banks (as in Ligmajerová 2013 and Mocharová
2018) and also from the web accounts comparator (Loke and Sherraden 2006). This
problem can be solved by using several multi-criteria evaluations of alternative (MCEA)
methods. In accordance with similar analyses of bank or building society accounts (Bílá
2014, Hwang and Yoon 1981 and Kuncová, Sekničková and Kánová 2015), the same or
similar methods, such as WSA, TOPSIS and PROMETHEE II, were also applied, including
non-dominance analysis and the conjunctive method.
Material
According to the data selection, in 2013, there were 21 alternatives offered by 17 banks,
and in 2018, 23 alternatives offered by 15 banks. For each of the pre-selected criteria, it
was necessary to assign a weight. For the comparison, the weight vectors for two different
types of clients were used. For Client Type 1, criteria C1-C4 (fees and not required current
account) are the most important, with equal weights allocated to each, followed by C6,
C10 and C11, also with equal weights allocated to each. For Client Type 2, the most
important criterion is C1 with 50% importance, followed by C2 and C4. All the weights
are presented in Table 2.
Table 2: Criteria weights for the two selected types of clients Criterion/ Client Type
C1 C2 C3 C4 C5 C6 C7 C8 C9 C10 C11 C12
Client Type 1
0.133 0.133 0.133 0.133 0.046 0.099 0.02 0.02 0.02 0.099 0.099 0.066
Client Type 2
0.50 0.15 0.05 0.10 0.02 0.05 0.02 0.02 0.02 0.03 0.02 0.02
Source: Authors
0
5
10
15
20
25
30
35
40
4508
.12.1
99
5
29
.04.1
99
6
21
.06.1
99
6
11
.06.1
99
7
20
.06.1
99
7
24
.06.1
99
7
01
.07.1
99
7
08
.07.1
99
7
16
.07.1
99
7
23
.07.1
99
7
28
.07.1
99
7
04
.08.1
99
7
01
.12.1
99
7
03
.12.1
99
7
09
.12.1
99
7
17
.12.1
99
7
17
.07.1
99
8
25.9.1998
13.11.1998
23.12.1998
29
.01.1
99
9
09
.04.1
99
9
25
.06.1
99
9
03
.09.1
99
9
27
.10.1
99
9
23
.02.2
00
1
30
.11.2
00
1
01
.02.2
00
2
26
.07.2
00
2
31
.01.2
00
3
01
.08.2
00
3
27
.08.2
00
4
01
.04.2
00
5
31
.10.2
00
5
29
.09.2
00
6
27
.07.2
00
7
30
.11.2
00
7
08
.08.2
00
8
18
.12.2
00
8
11
.05.2
00
9
17
.12.2
00
9
29
.06.2
01
2
02
.11.2
01
2
03
.11.2
01
7

Littera Scripta, 2018, Volume 11, Issue 2
85
The comparison is based on 12 pre-selected criteria that describe all the main factors of the savings accounts that are published by the banks. These are:
1. Interest rate – usually the most important factor for clients (this criterion should
be maximised).
2. Transaction fees - charges associated with the transfer of money between accounts (this criterion should be minimised).
3. Current account – a necessity to have a bank account in the given bank – these are allocated binary values, either 0 or 1, where 0 means no current account is necessary (this criterion should be minimised).
4. Current account fees - maintenance fees that are necessary to pay for the current account (this criterion should be minimised).
5. Standing orders – the possibility to set up a standing order – 0/1 value representing no/yes respectively (this criterion should be maximised).
6. Online creation – the possibility to set up the savings account online -0/1 value representing no/yes respectively (this criterion should be maximised).
7. Frequency interest is credited – the more frequent the interest is credited, the more the resulting amount increases for the client. In most cases, interest is accrued monthly. As the criterion is expressed by the annual frequency interest is credited, it should be maximised.
8. Interest bands – this criterion is only of interest to clients if they want to put more money into their account and are wondering if a limit is set for the account – 0/1 values were allocated, where 1 is the better case for the client (this criterion should be maximised).
9. Fixed rate – this rate is usually a bonus rate added to the basic rate of interest – 0/1 value allocated (this criterion should be maximised).
10. Minimum deposit requirement – minimum amount of money that must be deposited into the account (this criterion should be minimised).
11. Minimum balance – minimum amount of money that must always be in the account (this criterion should be minimized).
12. Cash withdrawal option – the possibility to withdraw money from an ATM.
Methods For the comparison of the accounts it is possible to use various methods, such as statistical
methods, econometric models, data envelopment analysis (DEA) models, or multi-criteria
decision making (MCDM) models, especially the multi-criteria evaluation of alternatives
(MCEA), which is sometimes referred to as the multi-attribute decision-making method
(MADM). The theory of the multi-criteria evaluation of alternatives offers many different
methods for solving this kind of problem, such as conjunctive and disjunctive methods,
WSA, TOPSIS, ELECTRE, PROMETHEE, VIKOR, AHP, etc. (Fiala 2006, Figueira, Greco and
Ehrgott 2005 and Prina 2013). The selection of the method is influenced by the aim of the
decision because some methods are only able to find good (or acceptable) and bad (non-
acceptable) alternatives, whereas the aim might be to find the winner, i.e. the best
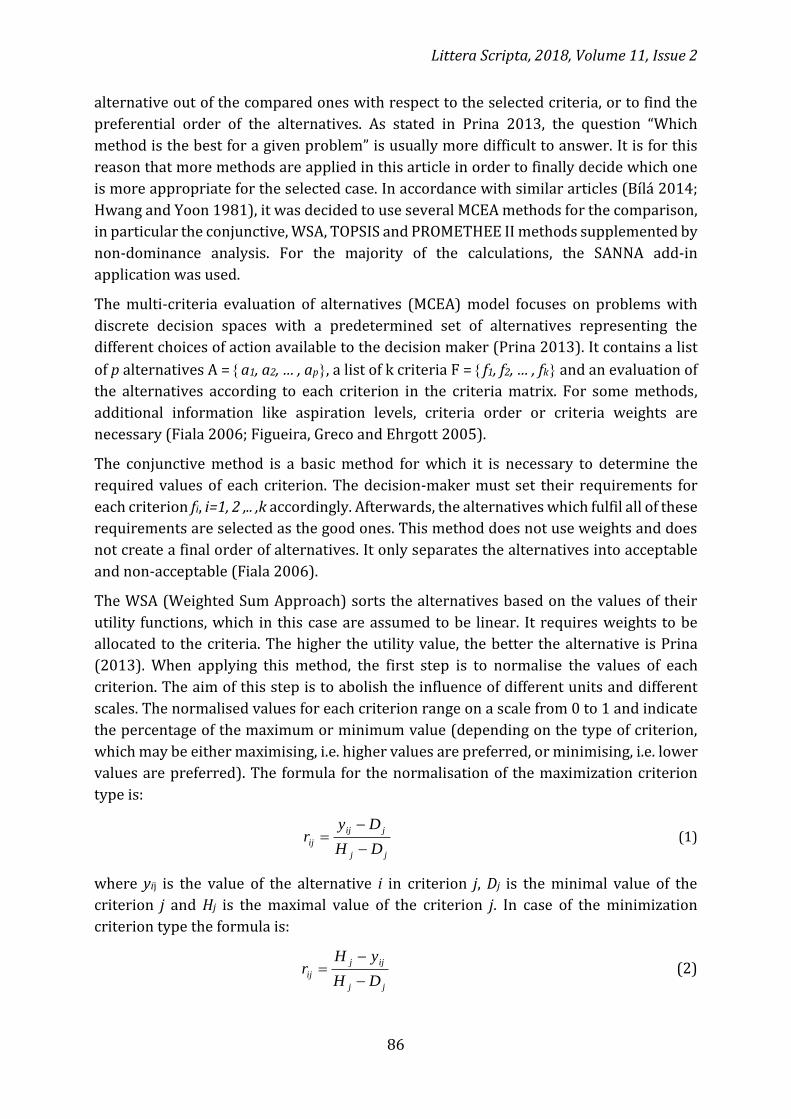
Littera Scripta, 2018, Volume 11, Issue 2
86
alternative out of the compared ones with respect to the selected criteria, or to find the
preferential order of the alternatives. As stated in Prina 2013, the question “Which
method is the best for a given problem” is usually more difficult to answer. It is for this
reason that more methods are applied in this article in order to finally decide which one
is more appropriate for the selected case. In accordance with similar articles (Bílá 2014;
Hwang and Yoon 1981), it was decided to use several MCEA methods for the comparison,
in particular the conjunctive, WSA, TOPSIS and PROMETHEE II methods supplemented by
non-dominance analysis. For the majority of the calculations, the SANNA add-in
application was used.
The multi-criteria evaluation of alternatives (MCEA) model focuses on problems with
discrete decision spaces with a predetermined set of alternatives representing the
different choices of action available to the decision maker (Prina 2013). It contains a list
of p alternatives A = a1, a2, … , ap, a list of k criteria F = f1, f2, … , fk and an evaluation of
the alternatives according to each criterion in the criteria matrix. For some methods,
additional information like aspiration levels, criteria order or criteria weights are
necessary (Fiala 2006; Figueira, Greco and Ehrgott 2005).
The conjunctive method is a basic method for which it is necessary to determine the
required values of each criterion. The decision-maker must set their requirements for
each criterion fi, i=1, 2 ,.. ,k accordingly. Afterwards, the alternatives which fulfil all of these
requirements are selected as the good ones. This method does not use weights and does
not create a final order of alternatives. It only separates the alternatives into acceptable
and non-acceptable (Fiala 2006).
The WSA (Weighted Sum Approach) sorts the alternatives based on the values of their
utility functions, which in this case are assumed to be linear. It requires weights to be
allocated to the criteria. The higher the utility value, the better the alternative is Prina
(2013). When applying this method, the first step is to normalise the values of each
criterion. The aim of this step is to abolish the influence of different units and different
scales. The normalised values for each criterion range on a scale from 0 to 1 and indicate
the percentage of the maximum or minimum value (depending on the type of criterion,
which may be either maximising, i.e. higher values are preferred, or minimising, i.e. lower
values are preferred). The formula for the normalisation of the maximization criterion
type is:
jj
jij
ijDH
Dyr
(1)
where yij is the value of the alternative i in criterion j, Dj is the minimal value of the
criterion j and Hj is the maximal value of the criterion j. In case of the minimization
criterion type the formula is:
jj
ijj
ijDH
yHr
(2)
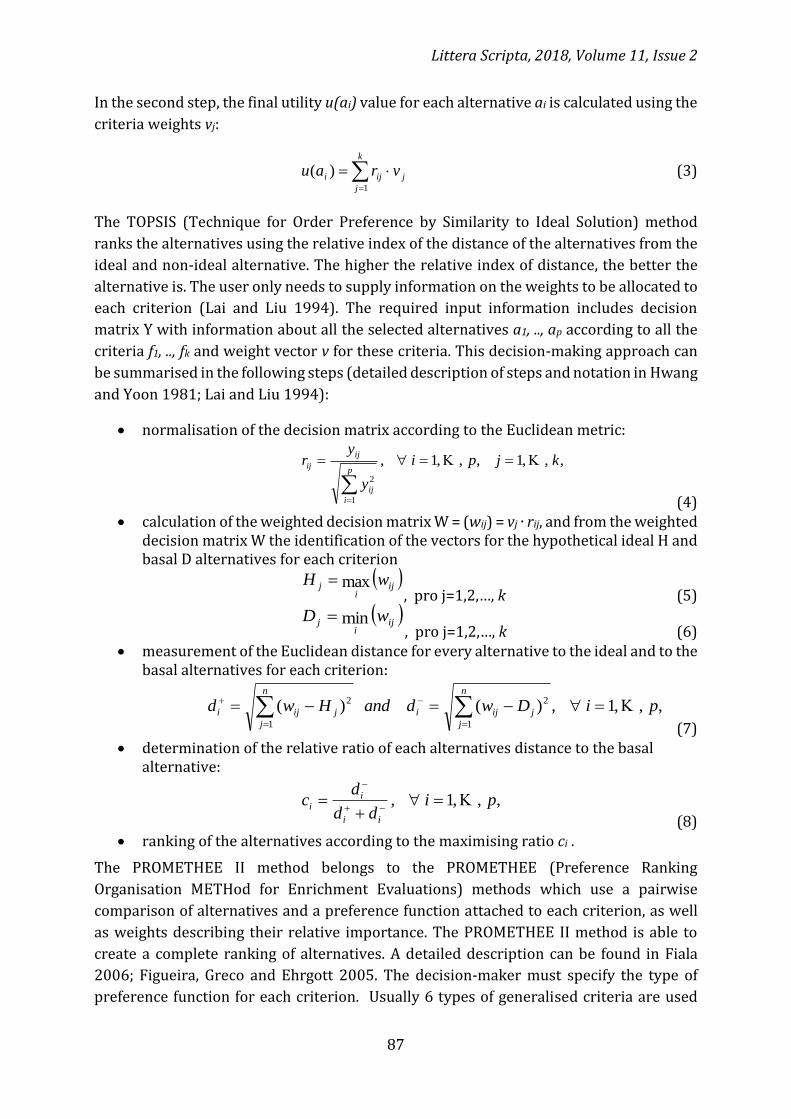
Littera Scripta, 2018, Volume 11, Issue 2
87
In the second step, the final utility u(ai) value for each alternative ai is calculated using the
criteria weights vj:
k
j
jiji vrau1
)( (3)
The TOPSIS (Technique for Order Preference by Similarity to Ideal Solution) method
ranks the alternatives using the relative index of the distance of the alternatives from the
ideal and non-ideal alternative. The higher the relative index of distance, the better the
alternative is. The user only needs to supply information on the weights to be allocated to
each criterion (Lai and Liu 1994). The required input information includes decision
matrix Y with information about all the selected alternatives a1, .., ap according to all the
criteria f1, .., fk and weight vector v for these criteria. This decision-making approach can
be summarised in the following steps (detailed description of steps and notation in Hwang
and Yoon 1981; Lai and Liu 1994):
normalisation of the decision matrix according to the Euclidean metric:
,,,1,,,1,
1
2
kjpi
y
yr
p
i
ij
ij
ij
(4)
calculation of the weighted decision matrix W = (wij) = vj ∙ rij, and from the weighted decision matrix W the identification of the vectors for the hypothetical ideal H and basal D alternatives for each criterion
ij
ij wH max
, pro j=1,2,…, k (5)
ij
ij wD min
, pro j=1,2,…, k (6) measurement of the Euclidean distance for every alternative to the ideal and to the
basal alternatives for each criterion:
,,,1,)()(1
2
1
2 piDwdandHwdn
j
jiji
n
j
jiji
(7) determination of the relative ratio of each alternatives distance to the basal
alternative:
,,,1, pidd
dc
ii
ii
(8) ranking of the alternatives according to the maximising ratio ci .
The PROMETHEE II method belongs to the PROMETHEE (Preference Ranking
Organisation METHod for Enrichment Evaluations) methods which use a pairwise
comparison of alternatives and a preference function attached to each criterion, as well
as weights describing their relative importance. The PROMETHEE II method is able to
create a complete ranking of alternatives. A detailed description can be found in Fiala
2006; Figueira, Greco and Ehrgott 2005. The decision-maker must specify the type of
preference function for each criterion. Usually 6 types of generalised criteria are used
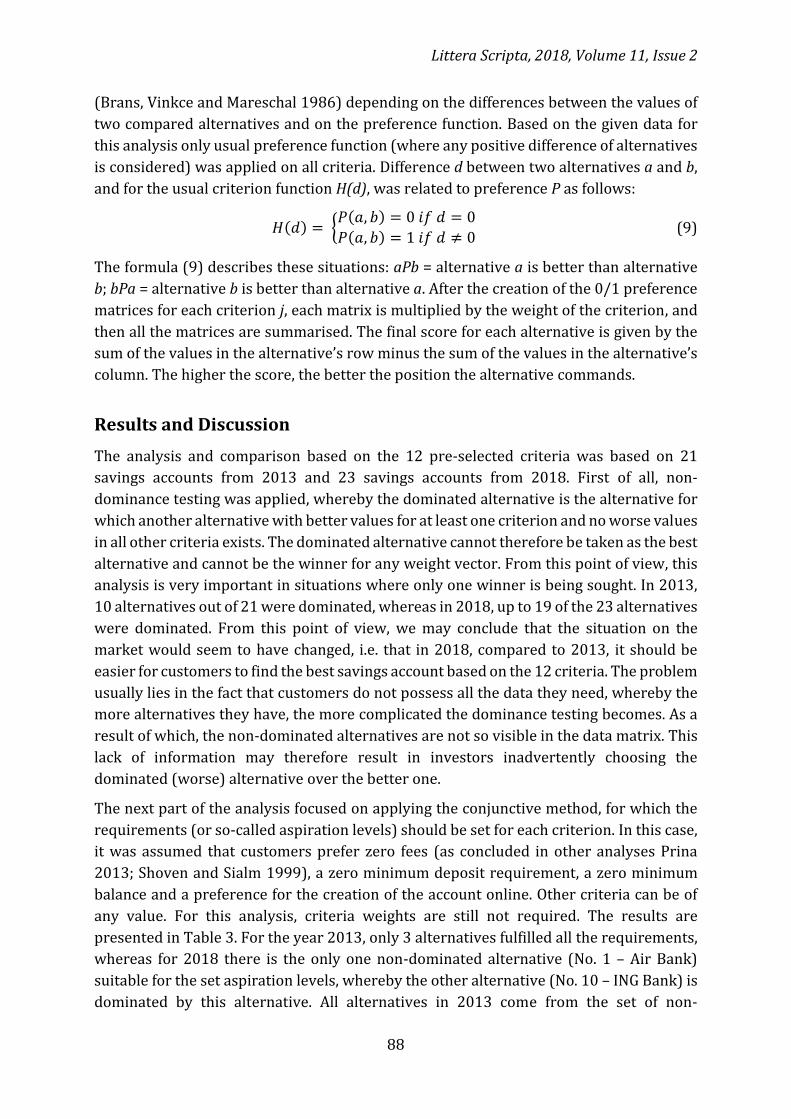
Littera Scripta, 2018, Volume 11, Issue 2
88
(Brans, Vinkce and Mareschal 1986) depending on the differences between the values of
two compared alternatives and on the preference function. Based on the given data for
this analysis only usual preference function (where any positive difference of alternatives
is considered) was applied on all criteria. Difference d between two alternatives a and b,
and for the usual criterion function H(d), was related to preference P as follows:
𝐻(𝑑) = {𝑃(𝑎, 𝑏) = 0 𝑖𝑓 𝑑 = 0
𝑃(𝑎, 𝑏) = 1 𝑖𝑓 𝑑 ≠ 0 (9)
The formula (9) describes these situations: aPb = alternative a is better than alternative
b; bPa = alternative b is better than alternative a. After the creation of the 0/1 preference
matrices for each criterion j, each matrix is multiplied by the weight of the criterion, and
then all the matrices are summarised. The final score for each alternative is given by the
sum of the values in the alternative’s row minus the sum of the values in the alternative’s
column. The higher the score, the better the position the alternative commands.
Results and Discussion
The analysis and comparison based on the 12 pre-selected criteria was based on 21
savings accounts from 2013 and 23 savings accounts from 2018. First of all, non-
dominance testing was applied, whereby the dominated alternative is the alternative for
which another alternative with better values for at least one criterion and no worse values
in all other criteria exists. The dominated alternative cannot therefore be taken as the best
alternative and cannot be the winner for any weight vector. From this point of view, this
analysis is very important in situations where only one winner is being sought. In 2013,
10 alternatives out of 21 were dominated, whereas in 2018, up to 19 of the 23 alternatives
were dominated. From this point of view, we may conclude that the situation on the
market would seem to have changed, i.e. that in 2018, compared to 2013, it should be
easier for customers to find the best savings account based on the 12 criteria. The problem
usually lies in the fact that customers do not possess all the data they need, whereby the
more alternatives they have, the more complicated the dominance testing becomes. As a
result of which, the non-dominated alternatives are not so visible in the data matrix. This
lack of information may therefore result in investors inadvertently choosing the
dominated (worse) alternative over the better one.
The next part of the analysis focused on applying the conjunctive method, for which the
requirements (or so-called aspiration levels) should be set for each criterion. In this case,
it was assumed that customers prefer zero fees (as concluded in other analyses Prina
2013; Shoven and Sialm 1999), a zero minimum deposit requirement, a zero minimum
balance and a preference for the creation of the account online. Other criteria can be of
any value. For this analysis, criteria weights are still not required. The results are
presented in Table 3. For the year 2013, only 3 alternatives fulfilled all the requirements,
whereas for 2018 there is the only one non-dominated alternative (No. 1 – Air Bank)
suitable for the set aspiration levels, whereby the other alternative (No. 10 – ING Bank) is
dominated by this alternative. All alternatives in 2013 come from the set of non-
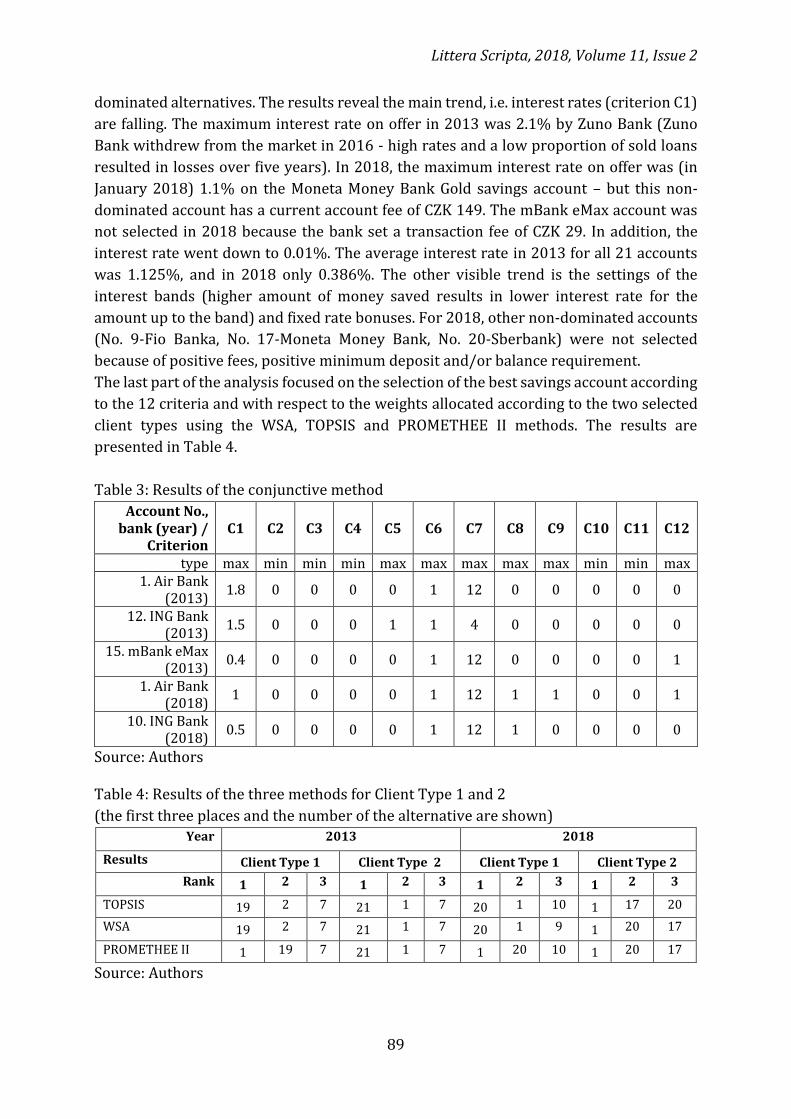
Littera Scripta, 2018, Volume 11, Issue 2
89
dominated alternatives. The results reveal the main trend, i.e. interest rates (criterion C1)
are falling. The maximum interest rate on offer in 2013 was 2.1% by Zuno Bank (Zuno
Bank withdrew from the market in 2016 - high rates and a low proportion of sold loans
resulted in losses over five years). In 2018, the maximum interest rate on offer was (in
January 2018) 1.1% on the Moneta Money Bank Gold savings account – but this non-
dominated account has a current account fee of CZK 149. The mBank eMax account was
not selected in 2018 because the bank set a transaction fee of CZK 29. In addition, the
interest rate went down to 0.01%. The average interest rate in 2013 for all 21 accounts
was 1.125%, and in 2018 only 0.386%. The other visible trend is the settings of the
interest bands (higher amount of money saved results in lower interest rate for the
amount up to the band) and fixed rate bonuses. For 2018, other non-dominated accounts
(No. 9-Fio Banka, No. 17-Moneta Money Bank, No. 20-Sberbank) were not selected
because of positive fees, positive minimum deposit and/or balance requirement.
The last part of the analysis focused on the selection of the best savings account according
to the 12 criteria and with respect to the weights allocated according to the two selected
client types using the WSA, TOPSIS and PROMETHEE II methods. The results are
presented in Table 4.
Table 3: Results of the conjunctive method
Account No., bank (year) /
Criterion C1 C2 C3 C4 C5 C6 C7 C8 C9 C10 C11 C12
type max min min min max max max max max min min max 1. Air Bank
(2013) 1.8 0 0 0 0 1 12 0 0 0 0 0
12. ING Bank (2013)
1.5 0 0 0 1 1 4 0 0 0 0 0
15. mBank eMax (2013)
0.4 0 0 0 0 1 12 0 0 0 0 1
1. Air Bank (2018)
1 0 0 0 0 1 12 1 1 0 0 1
10. ING Bank (2018)
0.5 0 0 0 0 1 12 1 0 0 0 0
Source: Authors Table 4: Results of the three methods for Client Type 1 and 2
(the first three places and the number of the alternative are shown) Year 2013 2018
Results Client Type 1 Client Type 2 Client Type 1 Client Type 2
Rank 1 2 3 1 2 3 1 2 3 1 2 3
TOPSIS 19 2 7 21 1 7 20 1 10 1 17 20
WSA 19 2 7 21 1 7 20 1 9 1 20 17
PROMETHEE II 1 19 7 21 1 7 1 20 10 1 20 17
Source: Authors
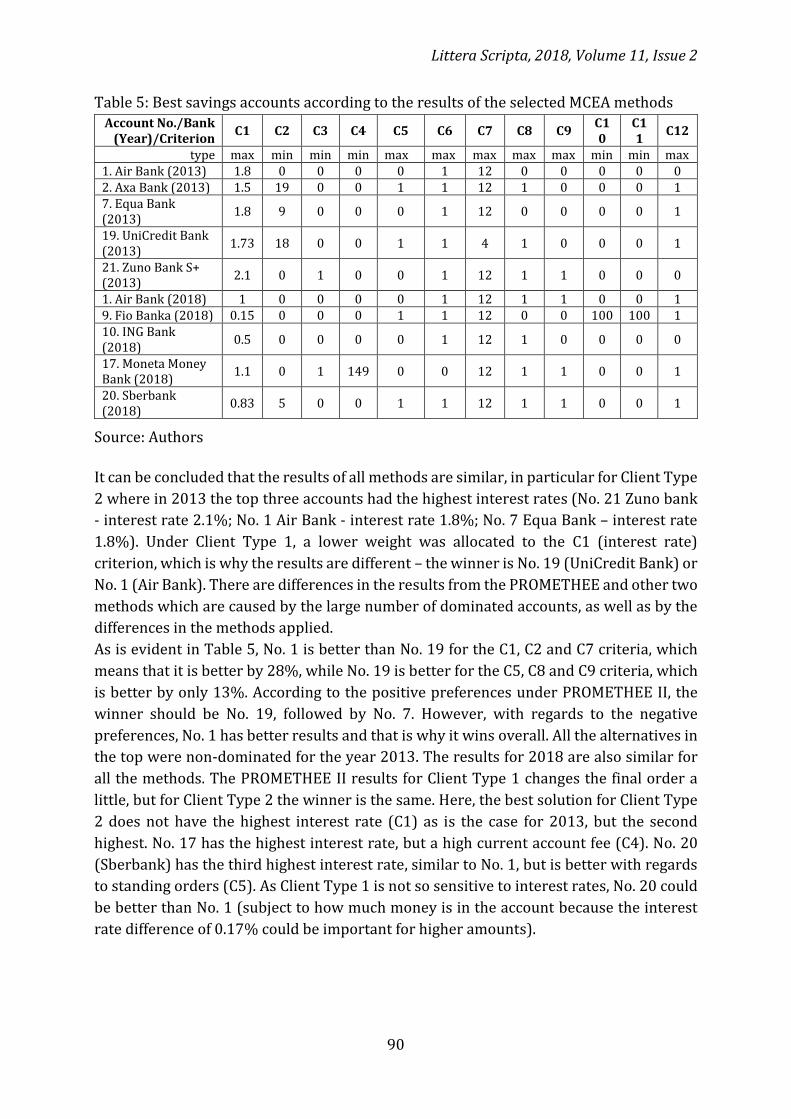
Littera Scripta, 2018, Volume 11, Issue 2
90
Table 5: Best savings accounts according to the results of the selected MCEA methods Account No./Bank
(Year)/Criterion C1 C2 C3 C4 C5 C6 C7 C8 C9
C10
C11
C12
type max min min min max max max max max min min max 1. Air Bank (2013) 1.8 0 0 0 0 1 12 0 0 0 0 0 2. Axa Bank (2013) 1.5 19 0 0 1 1 12 1 0 0 0 1 7. Equa Bank (2013)
1.8 9 0 0 0 1 12 0 0 0 0 1
19. UniCredit Bank (2013)
1.73 18 0 0 1 1 4 1 0 0 0 1
21. Zuno Bank S+ (2013)
2.1 0 1 0 0 1 12 1 1 0 0 0
1. Air Bank (2018) 1 0 0 0 0 1 12 1 1 0 0 1 9. Fio Banka (2018) 0.15 0 0 0 1 1 12 0 0 100 100 1 10. ING Bank (2018)
0.5 0 0 0 0 1 12 1 0 0 0 0
17. Moneta Money Bank (2018)
1.1 0 1 149 0 0 12 1 1 0 0 1
20. Sberbank (2018)
0.83 5 0 0 1 1 12 1 1 0 0 1
Source: Authors
It can be concluded that the results of all methods are similar, in particular for Client Type
2 where in 2013 the top three accounts had the highest interest rates (No. 21 Zuno bank
- interest rate 2.1%; No. 1 Air Bank - interest rate 1.8%; No. 7 Equa Bank – interest rate
1.8%). Under Client Type 1, a lower weight was allocated to the C1 (interest rate)
criterion, which is why the results are different – the winner is No. 19 (UniCredit Bank) or
No. 1 (Air Bank). There are differences in the results from the PROMETHEE and other two
methods which are caused by the large number of dominated accounts, as well as by the
differences in the methods applied.
As is evident in Table 5, No. 1 is better than No. 19 for the C1, C2 and C7 criteria, which
means that it is better by 28%, while No. 19 is better for the C5, C8 and C9 criteria, which
is better by only 13%. According to the positive preferences under PROMETHEE II, the
winner should be No. 19, followed by No. 7. However, with regards to the negative
preferences, No. 1 has better results and that is why it wins overall. All the alternatives in
the top were non-dominated for the year 2013. The results for 2018 are also similar for
all the methods. The PROMETHEE II results for Client Type 1 changes the final order a
little, but for Client Type 2 the winner is the same. Here, the best solution for Client Type
2 does not have the highest interest rate (C1) as is the case for 2013, but the second
highest. No. 17 has the highest interest rate, but a high current account fee (C4). No. 20
(Sberbank) has the third highest interest rate, similar to No. 1, but is better with regards
to standing orders (C5). As Client Type 1 is not so sensitive to interest rates, No. 20 could
be better than No. 1 (subject to how much money is in the account because the interest
rate difference of 0.17% could be important for higher amounts).

Littera Scripta, 2018, Volume 11, Issue 2
91
Conclusions
The current situation in the savings accounts market is worse than in the year 2013.
Although the number and range of accounts on offer is a little higher, the interest rates
are lower and many of the accounts are dominated. The analysis showed that clients who
choose a savings account mainly based on the interest rate, in particular where it concerns
low-cost banks, can expect changes in the parameters after a few years or possibly the
failure of the bank. Zuno Bank disappeared after just five years, and LBBW Bank was
transformed into Expobank. At the same time, Bank Creditas, which grew out of the credit
union, entered the sector. Deposits are legally insured up to EUR 100,000, but any change
is uncomfortable for a client who expects stability from their bank. That is why it is
necessary to consider other parameters when choosing a savings accounts. With interest
rates as low as they currently are, the rate of appreciation is not the most important
criterion, it is rather the total value of the service that the relationship with the service
provider brings that is. According to KPMG, customer experience depends on six pillars:
specifically, personalisation, integrity, expectation, problem solving, time and effort and
empathy. Clients are sensitively to these parameters and take them into account when
choosing savings accounts.
Money interventions by the CNB against the Czech Crown resulted in a noticeable fall in
interest rates on savings accounts. Prior to the commencement of the exchange rate
interventions rates were typically above 1% p.a., now only a few banks offer up to 0.5%,
but subject to conditions. As other criteria are becoming more important, it might be
useful to use mathematical methods for multi-criteria comparisons to find the best offer
for a given client. According to our results, it is evident that a lot of products offered by
banks are dominated, which means they are worse in all criteria than some of the other
products. As clients usually do not see all data together, they are not able to identify this
fact and that is why they potentially risk choosing a worse product. This implies that non-
dominance testing can decrease the number of products that should be compared and
shows only the good ones. The application of other multi-criteria evaluation of
alternatives methods afterwards may be very helpful in making the final decision because
the clients can express their needs through criteria weights. However, the main problem
does not lie in ignorance of information or the frequent changes to it, but in the lack of
clarity with regards to the products (for a particular client) banks create and which do not
match the officially published data (part of the parameters is usually better, but this fact
is not easy to verify). Based on the above analysis, it is recommended that clients should
primarily seek out available data and apply some multi-criteria comparison methods
before they seek contact with a bank (or before the selection of a savings account online).
In this way, the client can compare the offers on the market so that they are not solely
dependent on a choice of bank that may not always be the best for them.
Littera Scripta, 2018, Volume 11, Issue 2
92
Acknowledgements
The paper was supported by the contribution of long term institutional support for
research activities of the College of Polytechnics Jihlava and by the VSPJ internal grant no.
1170/004/185.
References
BANERJEE, A. and E. DUFLO, 2011. Poor Economics: A Radical Rethinking of the Way to
Fight Global Poverty. New York: NY, Public Affairs. ISBN 978-1610390934.
BÍLÁ, L., 2014. Srovnání obchodních podmínek při sjednávání spořicích účtů. [online].
[accessed: 2018-11-21]. Available at: https://is.muni.cz/th/u11gm/?so=nx.
BOROVIČKA, A., 2017. Selection of the suitable building savings in the Czech Republic using
multicriteria evaluation method. Proceedings of the 35th conference Mathematical Methods
in Economics. Hradec Králové: University of Hradec Králové, 72-77.
BRANS, J. P., P. Vinkce and B. Mareschal, 1986. How to select and how to rank projects:
The PROMETHEE method. European Journal of Operational Research. 24(1986), 228-238.
ISSN
BUBÁK, Z., 2017. Hospodářské výsledky bank v roce 2016. [online]. [accessed: 2018-04-17].
Available at: http://finparada.cz/4209-CSOB-i-Komercni-banka-byly-za-rok-2016-v-
zisku.aspx?mobile=full.
CNB, 2018. Jak se vyvíjela dvoutýdenní repo sazba ČNB? [online]. [accessed: 2018-04-17].
Available at: https://www.cnb.cz/cs/faq/jak_se_vyvijela_dvoutydenni_repo_sazba_cnb.
html.
CNB, 2018. Regulated institutions and registered financial market entities lists. [online].
[accessed: 2018-04-17]. Available at: https://apl.cnb.cz/apljerrsdad/
JERRS.WEB33.SUBJECTS_COUNTS_DETAIL?p_lang=cz&p_DATUM=31.03.2018&p_ses_id
x=1.
DZMURANOVA, H. and P Teply, 2016. Why are savings accounts perceived as risky bank
products? Prague Economic Papers. 25(5), 617-633. ISSN 1210-0455.
DUCAROVÁ, A., 2014. Srovnání spořicích účtů v České republice. [online]. [accessed: 2018-
11-21]. Available at: http://hdl.handle.net/10084/102511.
FIALA, P., 2006. Modely a metody rozhodování. Praha: Oeconomica. ISBN 80-245-0622-x.
FIGUEIRA, J., S. GRECO and M. Ehrgott, 2005. Multiple Criteria Decision Analysis - State of
the Art Surveys. New York : Springer Science + Business Media Inc. ISBN 978-0-387-
23081-8.
HWANG, C. L. and K. YOON, 1981. Multiple Attribute Decision Making: Methods and
Applications. New York: Springer- Verlag. ISBN 978-0-387-23081-8.
KAST, F. and D. Pomeranz, 2013. Saving More to Borrow Less: Experimental Evidence
from Access to Formal Savings Accounts in Chile. NBER Working Paper Series, No. 20239,
Littera Scripta, 2018, Volume 11, Issue 2
93
June 2014. Featured by La Tercera. Harvard Business School Working Paper, No. 14-001,
July 2013. [online]. [accessed: 2018-11-17]. Available at: https://dash.harvard.e
du/handle/1/11508214.
KUNCOVÁ, M. a L. LÍZALOVÁ, 2013. Konkurenceschopnost českých bank z pohledu
konotkorentních úvěrů. Proceedings of the 5th conference Konkurence/Comptition 2013.
Jihlava: College of Polytechnics. 187-197.
KUNCOVÁ, M., J. SEKNIČKOVÁ and E. KÁNOVÁ, 2015. Srovnání vybraných běžných účtů v
ČR. Proceedings of the 5th conference Hradec Economic Days. Hradec Králové: University
of Hradec Králové. 99-105.
LAI,Y., J., and T. Y. LIU, 1994. TOPSIS for MODM. European Journal of Operation Research.
76(3), 486-500. ISSN 0377-2217.
LIGMAJEROVÁ, M., 2013. Komparace nabídky spořicích účtů. Bachelor Thesis, Jihlava:
College of Polytechnics.
LOKE, V. and M. Sherraden, 2006. Building Assets from Birth: A Comparison of the Policies
and Proposals on Children Savings Accounts in Singapore, the United Kingdom, Canada,
Korea, and the United States. [online]. [accessed: 2018-11-17]. Available at:
https://openscholarship.wustl.edu/cgi/viewcontent.cgi?article=1127&context=csd_rese
arch.
Mesec.cz, 2018. Spořící účty 2018. [online]. [accessed: 2018-04-17]. Available at:
https://prodej.mesec.cz/sporeni/texty/sporici-ucty-2018/ , [cit. 2018-04-17]
MOCHAROVÁ, A., 2018. Srovnání nabídky spořicích účtů. Bachelor Thesis, Jihlava: College
of Polytechnics.
POKORNÝ, O., 2018. Banky podle velikosti? Počty klientů a aktiva v roce 2018! [online].
[accessed: 2018-04-17]. Available at: https://www.duofinance.cz/banky-cr-podle-poctu-
klientu.
PRINA, S., 2013. Banking the Poor via Savings Accounts: Evidence from a Field
Experiment. [online]. [accessed: 2018-11-17]. Available at:
https://pdfs.semanticscholar.org/46e4/5642c7cdbd259cb990918de11117d48f2729.p
df.
SHOVEN, J. B. and C. Sialm, 1999. Asset Location in Tax-Deferred and Conventional Savings
Accounts. [online]. [accessed: 2018-11-17]. Available at: https://core.ac.uk
/download/pdf/6708603.pdf.
TRIANTAPHYLLOU, E., 2000. Multi-Criteria Decision Making Methods: A Comparative
Study. Dordrecht: Kluwer Academic Publishers. ISBN 978-1-4757-3157-6.
USETRENO.CZ, 2018. Spořící účty. [online]. [accessed: 2018-11-17]. Available at:
https://www.usetreno.cz/sporici-ucty/?utm_source=google&utm_medium=cpc&utm
_content=sporici_ucty_frazova&utm_campaign=SE_sporici_ucty&gclid=EAIaIQobChMI3P
3UmJLk3gIVFamaCh0--gEXEAAYASAAEgKc7_D_BwE.
Littera Scripta, 2018, Volume 11, Issue 2
94
Contact address of the authors:
Ing. Martina Kuncová, Ph.D., Department of Economic Studies, College of Polytechnics
Jihlava, Tolstého 16, 586 01 Jihlava, Czech Republic, e-mail: [email protected]
Ing. Lenka Lízalová, Ph.D., Department of Economic Studies, College of Polytechnics
Jihlava, Tolstého 16, 586 01 Jihlava, Czech Republic, e-mail: [email protected]
KUNCOVÁ, M. and L. LÍZALOVÁ, 2018. Multi-criteria Comparison of Savings
Accounts on the Czech Market. Littera Scripta [online]. České Budějovice:
Institute of Technology and Business in České Budějovice, 11(2), 80-94.
[accessed: 2018-12-20]. ISSN 1805-9112. Available at:
http://journals.vstecb.cz/category/littera-scripta/11-rocnik-
2018/2_2018/.
95
Financing Innovation, Neo-Schumpeterian Theory
and the Reduction of Regional Disparities in the European
Union
Petr Jiříček, Zdeňka Dostálová
College of Polytechnics Jihlava
Abstract
The paper analyses at the European Union’s support policy for research,
development and innovation and the financial instruments used to implement this
policy. The impact of the policy is analysed within the context of economical,
territorial and social cohesion and the reduction of regional disparities. The aim of
the paper is to highlight the influence of neo-Schumpeterian innovation theory on
the formation of EU innovation policy and regional innovation strategies after the
year 2000. The analysis revealed that pursuant to the conclusions of this theory,
new financial instruments to support the competitiveness of and innovation in small
and medium-sized enterprises can contribute to solving regional disparities. The
paper also highlights the new intermediary institutions and agencies that were
established in the European Union after the year 2000 and the role they play in the
transfer of research results to the business sector in order to support innovation.
Keywords: financing innovation, European Union, neo-Schumpeterian innovation
theory, regional disparities
Introduction
The origins of EU support policies for research, development and innovation, and
cohesion, go all the way back to the signing of the Treaty of Rome in 1957. In the initial
stage of its implementation, cohesion policy only focused on individual structural
problems in the member states of the European Community. Regional disparities were
not considered an important problem for the further political and economic integration
of the member states participating in the European project. The support policy for
research, development and innovation was also mostly only a part of the policies of the
Littera Scripta, 2018, Volume 11, Issue 2
96
individual member states. Its links to other EU policies, in particular with regards to the
reduction of regional disparities, cannot be found until after 1973. The economic crisis
of 1973 resulted in a change of view and the realisation of the need for a coordinated
response. There was a need for innovation in regionally affected industries, especially
within heavy industries and the energy sector, even in those member states that did not
feel the full impact of the crisis at that time (Baldwin and Wyplosz 2012). The first signs
of a coordinated common regional policy and the emergence of common support
policies for research, development and innovation came in 1974 in the form of the
European Regional Development Fund, the focus of which was to solve regional
disparities and structural problems in crisis affected regions (Dostálová and Jiříček
2012). During the period 1983-2000, financial instruments were developed to support
the research, development and innovation policy. Just like the financial instruments of
the structural and regional policies of that time, they tended to be multi-annual
programmes linked to the financial framework of the European Union. Archibugi and
Filippeti (2011) describe the impact of innovation performance in Europe on the
convergence of regions after the crisis and the influence of creating national innovation
systems. Audretsch and Link (2012) define the amount of utility for public policy
through commercial innovations. The theoretical concept that economic growth is
driven by the creative role of small and medium-sized enterprises was applied within
the European Union´s strategies for solving regional disparities (Granieri and Renda
2012). It is only after 2000, and within the context of the Lisbon Treaty and the Europe
2020 strategy, that it is possible to speak of a higher degree of linking between the
support policy for research, development and innovation and the EU´s cohesion policy
(Wamser, Nam and Schoenberg 2013). The issue of innovation policy and its relation to
the divergence or the convergence of EU regions after the economic and financial crisis
of 2008-2009 is described by Izsak and Radoševič (2017).
Materials and Methods
The aim of the paper is to determine how, beyond the endogenous growth theories
focused on internal sources of regional development, Aghion and Howitt´s neo-
Schumpeterian growth theory, based on innovation as a growth factor, influenced a
change in the approach to solving regional disparities. The analysis includes a
comparison of fundamental theoretical concepts from the field of economics and
Schumpeterian innovation theory and specifies their contribution to the EU´s long-term
innovation policy. With regards to individual EU financial frameworks, reference is
made to financial programmes that were/are instrumental for the support of research,
development and innovation in the entrepreneurial sphere. For the analysis, aggregate
data were used according to:
a) individual EU financial framework periods:
1973-1999 - annual or multi-annual programmes based on exogenous growth
theories,
Littera Scripta, 2018, Volume 11, Issue 2
97
2000–2006; 2007–2013; and 2014–2020 – shift from endogenous growth
theories to neo-Schumpeterian growth theory based on innovation for solving
regional disparities.
b) the area/field the financial instruments targeted:
technological innovation in the commercial sphere,
innovation in energy production,
research programmes.
Results
Financing of EU innovation policy and reduction of regional disparities in the period 1973-2000
The concept and financing of the policy for research, development and innovation and
the creation of the financial tools to support it were a reflection and a reaction to the
situation after the world economic crisis. The crisis led to the emergence of regional
disparities in the, up to then, relatively homogenous regions of the six founding member
states of the European Economic Community. From the perspective of postulates of the
exogenous economic growth theories that prevailed at that time, namely Keynesian
theory, investment in innovation in heavy industries and traditional energy production
was considered crucial to eliminate regional disparities. As a result, the financial
instruments that emerged were oriented towards supporting research, development
and innovation in these sectors. These included, for example, HYDROCARB, ENSALT,
LIGASF and ENDEMO. The predecessor of the research programmes was the COST
programme, which focused on supporting the formal cooperation between research
institutions within the EEC (Babjaková et al. 2014). The onset of the technological
revolution in the area of new materials and computing led, in 1984, to the emergence of
new joint multi-annual programmes called Framework Programmes. The objective of
these programmes was to support research institutions. The impact of new economic
theories based on the influence of technological capital (Romer’s endogenous growth
model) (Romer 1990) was reflected in an essentially different view of dealing with
regional disparities. As a result of focusing on these very factors of economic growth, EU
innovation policy began to take shape. Figure 1 shows the time sequence with regards to
the implementation of the individual financial instruments of the policy, including the
sums of money spent until 2000, whereby ENERGY indicates the support for traditional
energy production, FP the support for research institutions, SME the support for small
and medium-sized enterprises, and RES the support for renewable sources of energy.
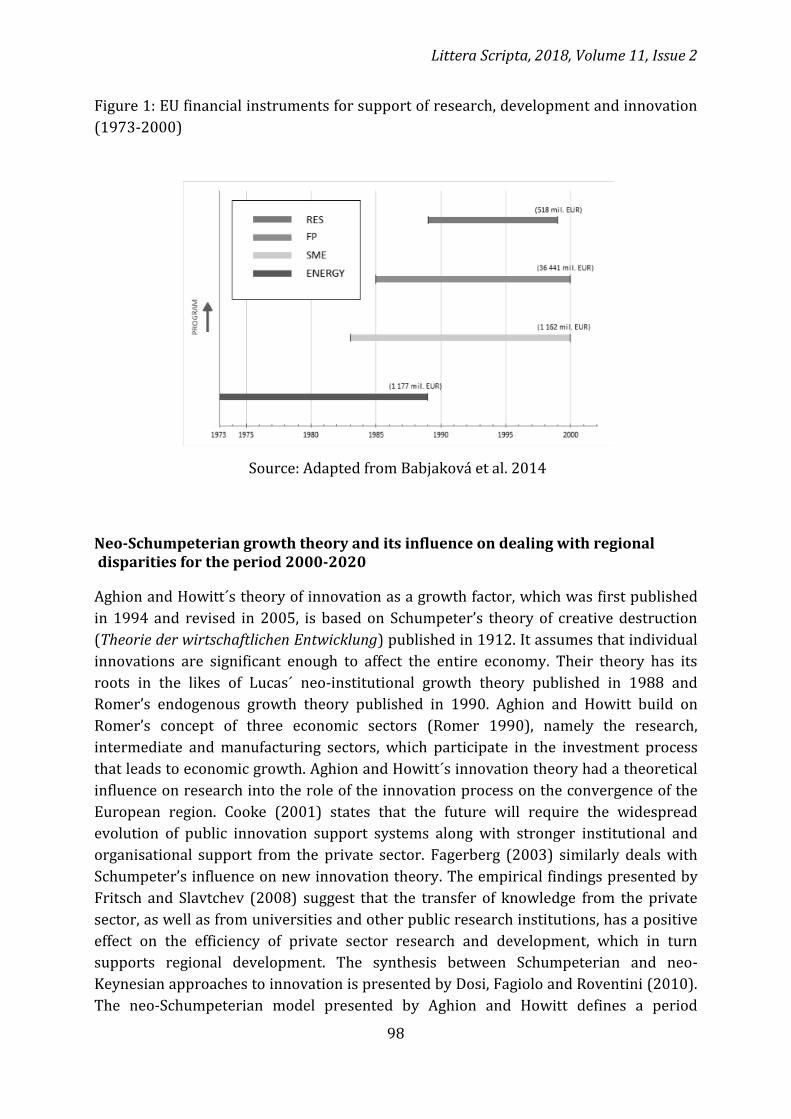
Littera Scripta, 2018, Volume 11, Issue 2
98
Figure 1: EU financial instruments for support of research, development and innovation
(1973-2000)
Source: Adapted from Babjaková et al. 2014
Neo-Schumpeterian growth theory and its influence on dealing with regional disparities for the period 2000-2020
Aghion and Howitt´s theory of innovation as a growth factor, which was first published
in 1994 and revised in 2005, is based on Schumpeter’s theory of creative destruction
(Theorie der wirtschaftlichen Entwicklung) published in 1912. It assumes that individual
innovations are significant enough to affect the entire economy. Their theory has its
roots in the likes of Lucas´ neo-institutional growth theory published in 1988 and
Romer’s endogenous growth theory published in 1990. Aghion and Howitt build on
Romer’s concept of three economic sectors (Romer 1990), namely the research,
intermediate and manufacturing sectors, which participate in the investment process
that leads to economic growth. Aghion and Howitt´s innovation theory had a theoretical
influence on research into the role of the innovation process on the convergence of the
European region. Cooke (2001) states that the future will require the widespread
evolution of public innovation support systems along with stronger institutional and
organisational support from the private sector. Fagerberg (2003) similarly deals with
Schumpeter’s influence on new innovation theory. The empirical findings presented by
Fritsch and Slavtchev (2008) suggest that the transfer of knowledge from the private
sector, as well as from universities and other public research institutions, has a positive
effect on the efficiency of private sector research and development, which in turn
supports regional development. The synthesis between Schumpeterian and neo-
Keynesian approaches to innovation is presented by Dosi, Fagiolo and Roventini (2010).
The neo-Schumpeterian model presented by Aghion and Howitt defines a period
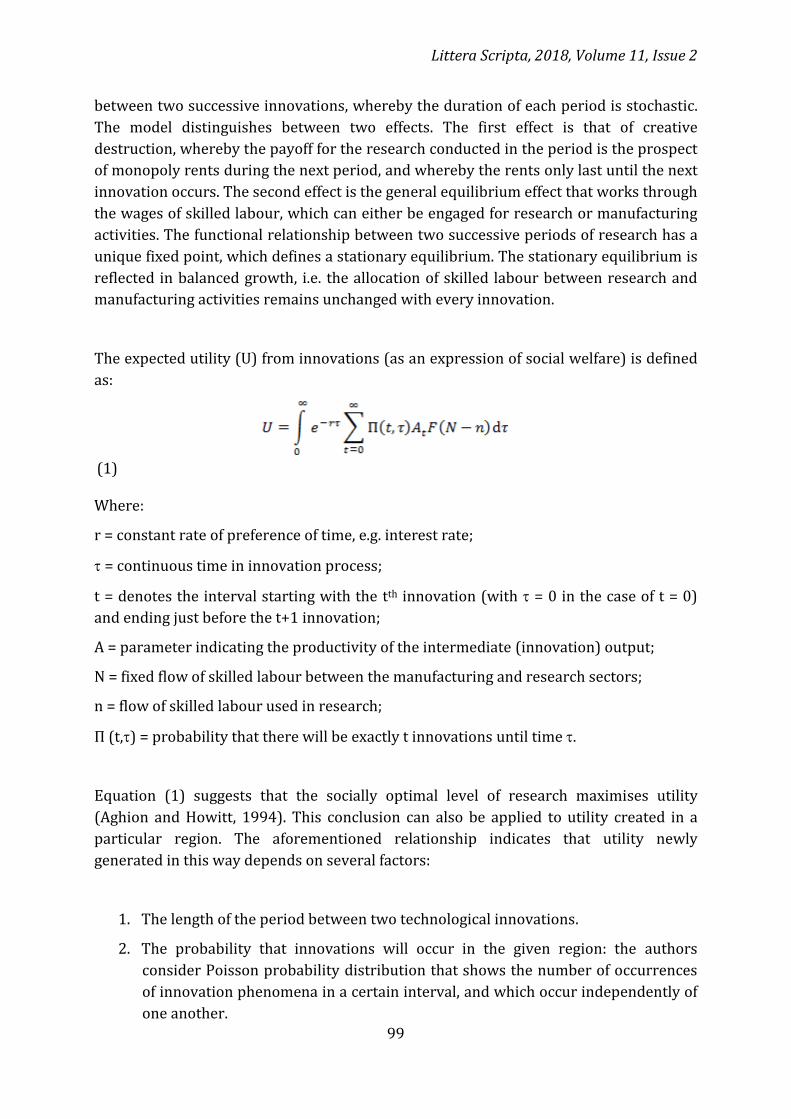
Littera Scripta, 2018, Volume 11, Issue 2
99
between two successive innovations, whereby the duration of each period is stochastic.
The model distinguishes between two effects. The first effect is that of creative
destruction, whereby the payoff for the research conducted in the period is the prospect
of monopoly rents during the next period, and whereby the rents only last until the next
innovation occurs. The second effect is the general equilibrium effect that works through
the wages of skilled labour, which can either be engaged for research or manufacturing
activities. The functional relationship between two successive periods of research has a
unique fixed point, which defines a stationary equilibrium. The stationary equilibrium is
reflected in balanced growth, i.e. the allocation of skilled labour between research and
manufacturing activities remains unchanged with every innovation.
The expected utility (U) from innovations (as an expression of social welfare) is defined
as:
(1)
Where:
r = constant rate of preference of time, e.g. interest rate;
= continuous time in innovation process;
t = denotes the interval starting with the tth innovation (with = 0 in the case of t = 0)
and ending just before the t+1 innovation;
A = parameter indicating the productivity of the intermediate (innovation) output;
N = fixed flow of skilled labour between the manufacturing and research sectors;
n = flow of skilled labour used in research;
П (t,) = probability that there will be exactly t innovations until time .
Equation (1) suggests that the socially optimal level of research maximises utility
(Aghion and Howitt, 1994). This conclusion can also be applied to utility created in a
particular region. The aforementioned relationship indicates that utility newly
generated in this way depends on several factors:
1. The length of the period between two technological innovations.
2. The probability that innovations will occur in the given region: the authors
consider Poisson probability distribution that shows the number of occurrences
of innovation phenomena in a certain interval, and which occur independently of
one another.
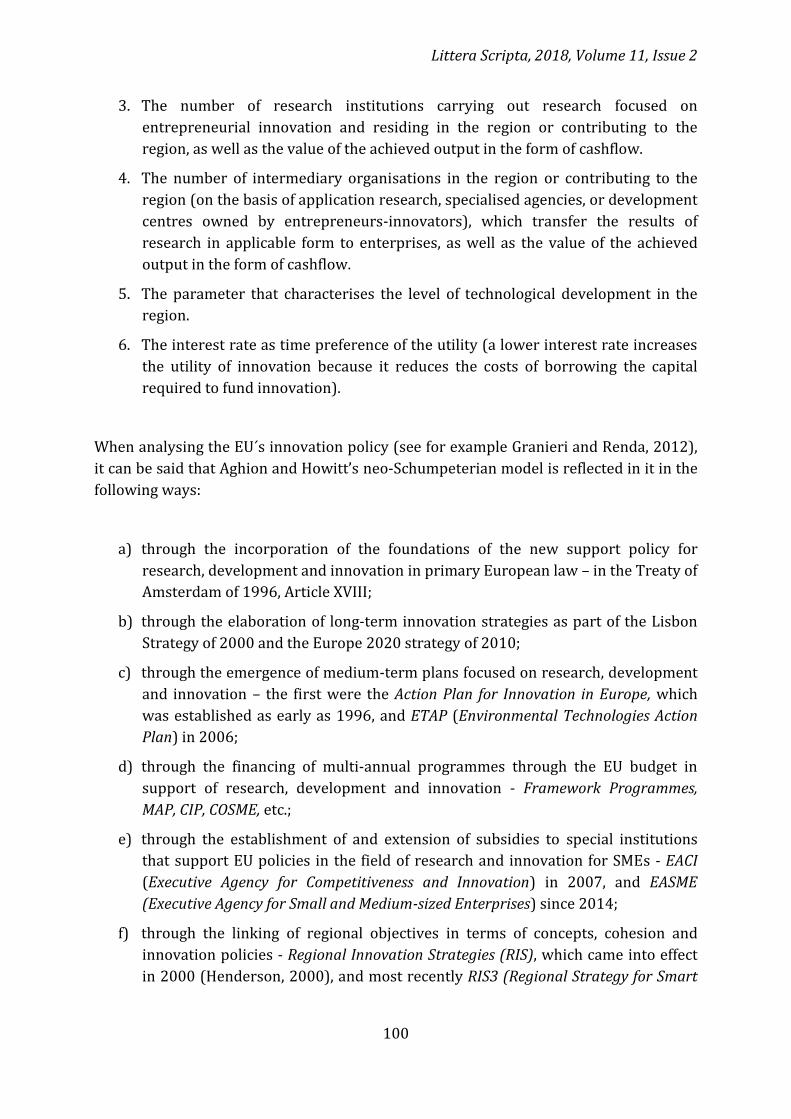
Littera Scripta, 2018, Volume 11, Issue 2
100
3. The number of research institutions carrying out research focused on
entrepreneurial innovation and residing in the region or contributing to the
region, as well as the value of the achieved output in the form of cashflow.
4. The number of intermediary organisations in the region or contributing to the
region (on the basis of application research, specialised agencies, or development
centres owned by entrepreneurs-innovators), which transfer the results of
research in applicable form to enterprises, as well as the value of the achieved
output in the form of cashflow.
5. The parameter that characterises the level of technological development in the
region.
6. The interest rate as time preference of the utility (a lower interest rate increases
the utility of innovation because it reduces the costs of borrowing the capital
required to fund innovation).
When analysing the EU´s innovation policy (see for example Granieri and Renda, 2012),
it can be said that Aghion and Howitt’s neo-Schumpeterian model is reflected in it in the
following ways:
a) through the incorporation of the foundations of the new support policy for
research, development and innovation in primary European law – in the Treaty of
Amsterdam of 1996, Article XVIII;
b) through the elaboration of long-term innovation strategies as part of the Lisbon
Strategy of 2000 and the Europe 2020 strategy of 2010;
c) through the emergence of medium-term plans focused on research, development
and innovation – the first were the Action Plan for Innovation in Europe, which
was established as early as 1996, and ETAP (Environmental Technologies Action
Plan) in 2006;
d) through the financing of multi-annual programmes through the EU budget in
support of research, development and innovation - Framework Programmes,
MAP, CIP, COSME, etc.;
e) through the establishment of and extension of subsidies to special institutions
that support EU policies in the field of research and innovation for SMEs - EACI
(Executive Agency for Competitiveness and Innovation) in 2007, and EASME
(Executive Agency for Small and Medium-sized Enterprises) since 2014;
f) through the linking of regional objectives in terms of concepts, cohesion and
innovation policies - Regional Innovation Strategies (RIS), which came into effect
in 2000 (Henderson, 2000), and most recently RIS3 (Regional Strategy for Smart
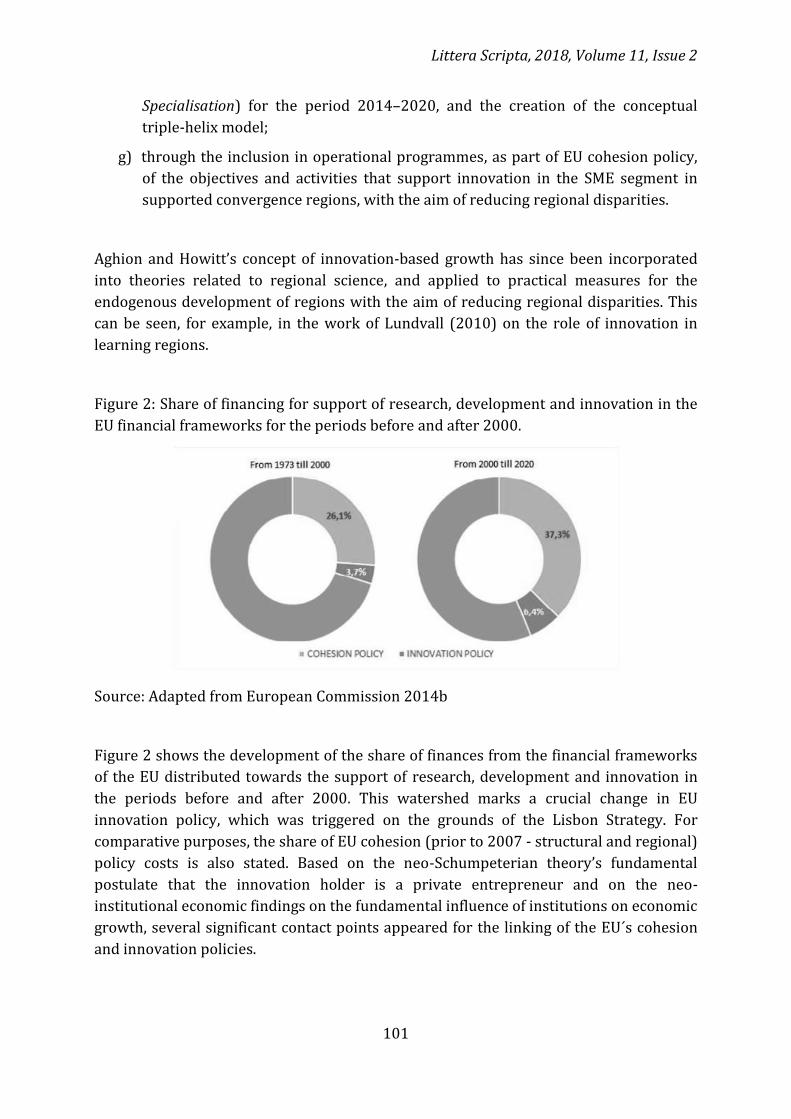
Littera Scripta, 2018, Volume 11, Issue 2
101
Specialisation) for the period 2014–2020, and the creation of the conceptual
triple-helix model;
g) through the inclusion in operational programmes, as part of EU cohesion policy,
of the objectives and activities that support innovation in the SME segment in
supported convergence regions, with the aim of reducing regional disparities.
Aghion and Howitt’s concept of innovation-based growth has since been incorporated
into theories related to regional science, and applied to practical measures for the
endogenous development of regions with the aim of reducing regional disparities. This
can be seen, for example, in the work of Lundvall (2010) on the role of innovation in
learning regions.
Figure 2: Share of financing for support of research, development and innovation in the
EU financial frameworks for the periods before and after 2000.
Source: Adapted from European Commission 2014b
Figure 2 shows the development of the share of finances from the financial frameworks
of the EU distributed towards the support of research, development and innovation in
the periods before and after 2000. This watershed marks a crucial change in EU
innovation policy, which was triggered on the grounds of the Lisbon Strategy. For
comparative purposes, the share of EU cohesion (prior to 2007 - structural and regional)
policy costs is also stated. Based on the neo-Schumpeterian theory’s fundamental
postulate that the innovation holder is a private entrepreneur and on the neo-
institutional economic findings on the fundamental influence of institutions on economic
growth, several significant contact points appeared for the linking of the EU´s cohesion
and innovation policies.
Littera Scripta, 2018, Volume 11, Issue 2
102
Discussion
From the perspective of the application of endogenous growth theories, the use of
financial instruments to support innovation in small and medium-sized enterprises is
highly important for reducing regional disparities. According to Aghion and Howitt’s
theory, which deals with the role of innovation in economic growth, such instruments do
so by supporting the competitiveness of small and medium-sized enterprises. For the
period 1998-2002, as part of the 5th Framework Programme, research and innovation
in SMEs was financially supported to the tune of ECU 359 million under the
Innovation/SME programme. After 2000, the financial support for research and
development in SMEs was gradually separated from technological innovation support. In
the 6th Framework Programme (2002–2006) the financing for research support was
increased, whereby specific activities covering a wider field of research in SMEs and
cooperation had a budget of ECU 1.3 billion. In addition, for the period 2001–2005, a
specialised community programme MAP (Multi-annual Programme for SMEs) was newly
established. This programme included modern financial instruments for the support of
SMEs, such as start-up support (ETP Start-up Scheme), guarantee facilities (SME
Guarantee Facility), and a special innovation fund (Seed Capital Action). For the financial
framework period 2007–2013, the Competitiveness and Innovation Programme (CIP) was
established. Its sub-programme, the EIP (Entrepreneurship Innovation Programme),
focused on supporting technological innovation in SMEs and had a budget of EUR 2.2
biillion (Babjaková et al. 2014). In 2007–2013, the cohesion policy was already directly
linked to private sources with the aim to finance innovation in SMEs through multiple
sources. In addition to community programmes supporting innovation, the modern
financial engineering instruments JEREMIE (European Commission 2014d) and JASMINE
(European Commission 2014c) were established; they were financed under EU cohesion
policy. The European Commission coordinated the JEREMIE initiative with the EIB and
the European Investment Fund (European Commission 2014d). For the current financial
framework period, the EU established COSME (Competitiveness of Enterprises and Small
and Medium-sized Enterprises) to support innovation in SMEs. For the period 2014–
2020, a budget of EUR 2.3 billion has been allocated for the programme´s
implementation (European Commission 2014a). The research activities in SMEs are
financed separately through the HORIZON 2020 community programme, which is a
financial instrument under the EU policy. For this purpose, an Industrial Leadership
pillar was set up with a budget of EUR 17 billion (Babjaková et al. 2014).
Conclusion
The neo-Schumpeterian approach to dealing with regional disparities means using the
innovation potential of entrepreneurs to stimulate utility growth in a region. In a
narrower sense, it is the use of economic growth factors from the implementation of
innovations, or in a broader sense, the use of social capital as a contributor to the growth
of utility through interactions between entrepreneurs, the general public and scientific
research sectors within the so-called triple-helix model. The aim of European Union

Littera Scripta, 2018, Volume 11, Issue 2
103
policy after 2000 has been to achieve synergy in its cohesion policy and its support
policy for research, development and innovation. The priority is to transfer the results of
research, development and innovation to small and medium-sized enterprises because
of their essential role in regional development. When comparing the period before 2000,
when the influence of economic theories focused on exogenously conceived growth
prevailed in EU strategies, it is evident that there has been a substantial increase in the
concentration of European Union funds spent on financing this priority. This is reflected
in the establishment of new institutions and agencies to support and mediate the
transfer of scientific research results to stimulate innovation as assumed under Aghion
and Howitt’s neo-Schumpeterian growth theory. Although the neo-Schumpeterian
innovation theory does not deal with the form of financial support for innovation at the
entrepreneurial level, the analysis of the EU´s regional and innovation policies in this
paper clearly shows the importance of a system of public support, especially for SMEs.
Due to the conservativeness of the banking system, this segment could not fully fund its
innovation activities and contribute to regional development without financial support
from EU funds.
References
AGHION, P. and P. HOWITT, 1992. A Model of Growth through Creative Destruction.
Econometrica. 60(2), 323-351. ISSN 1468-0262.
ARCHIBUGI, D. and A. FILIPPETTI, 2011. Innovation in times of crisis: National systems
of innovation, structure, and demand. Research Policy. 40(2), 179-192. ISSN 0048-7333.
AUDRETSCH, D. and A. LINK, 2012. Entrepreneurship and innovation: public policy
frameworks. The Journal of Technology Transfer. 37(1), 1-17. ISSN 0893-12.
BABJAKOVÁ, B. et al., 2014. Financování a management inovačních programů Evropské
unie. Brno: Akademické nakladatelství CERM. ISBN 978-80-7204-905-9.
BALDWIN, R. and CH. WYPLOSZ, 2012. The Economics of European Integration.
Maidenhead: McGraw Hill Education. ISBN 978-0077131722.
COOK, P. Regional Innovation Systems, Clusters, and the Knowledge Economy. Industrial
and Corporate Change. 10(4), 945-974. ISSN 0960-6491
DOSI, G., G. FAGIOLO and A. ROVENTINI, 2010. Schumpeter meeting Keynes: a policy-
friendly model of endogenous growth and business cycles. Journal of Economic Dynamics
and Control. 34(9). 1748-1767. ISSN 0165-1889.
DOSTÁLOVÁ, Z. and P. JIŘÍČEK, 2012. 55 Years of Financing Structural and Regional
Policy in the context of the Economic Development of the European Union. In: KLÍMOVÁ,
V. and V. ŽÍTEK [online]. 15th International Colloquium on Regional Sciences. Conference
Proceedings. Brno: Masarykova univerzita, 2012-06-20, 128-139 [accessed 2018-04-25].
ISBN 978-80-210-5875-0. Available at:
https://munispace.muni.cz/index.php/munispace/catalog/book/65.
Littera Scripta, 2018, Volume 11, Issue 2
104
EUROPEAN COMMISSION, 2014a. COSME. [online]. Luxembourg: Office for Official
Publications of the European Communities [accessed 2018-05-02]. Available at:
http://ec.europa.eu/enterprise/initiatives/cosme/index_en.htm
EUROPEAN COMMISSION, 2014b. European Union Public Finance. Luxembourg: Office
for Official Publications of the European Communities. ISBN 978-92-79-35004-7.
EUROPEAN COMMISSION, 2014c. JASMINE: Joint Action to Support Micro-finance
Institutions in Europe [online]. Luxembourg: Office for Official Publications of the
European Communities [accessed 2018-05-02]. Available at:
http://ec.europa.eu/regional_policy/en/funding/special-support-instruments/jessica/
EUROPEAN COMMISSION, 2014d. JEREMIE: Joint European Resources for Microloans to
Small and Medium Enterprises [online]. Luxembourg: Office for Official Publications of
the European Communities [accessed 2018-05-02] Available at:
http://ec.europa.eu/regional_policy/en/funding/special-support-instruments/jeremie/
FAGERBERG, J., 2003. Schumpeter and the revival of evolutionary economics: an
appraisal of the literature. Journal of Evalutionary Economics. 13(2),125-159. ISSN 0936-
9937
FRITSCH, M. and SLAVTCHEV, V. 2008. Determination of the efficiency of Regional
Innovation Systems. Regional Studies. 45(7), 905-918. ISSN 0034-3404
GRANIERI, M. and A. RENDA, 2012. Innovation Law and Policy in the European Union.
Milano: Springer Verlag Italia. ISBN 978-88-470-1916-4.
HENDERSON, D., 2000. EU Regional Innovation Strategies: Regional Experimentalism in
Practice? European Urban and Regional Studies. 7(4), 347-358. ISSN 0936-9937.
IZSAK, K. and S. RADOŠEVIČ, 2017. EU research and innovation policies as factors of
convergence or divergence after crisis. Science and Public Policy. 44(2), 274-283. ISSN
0302-3427.
LUNDVALL, B. A., 2010. National systems of innovation: towards a theory of innovation
and interactive learning. London: Anthem Press. ISBN 9780857286741.
ROMER, P., 1990. Endogenous Technological Change. The Journal of Political Economy,
98(5), 71-102 [online]. Chicago: The University of Chicago Press [accessed 2018-04-25].
Available at: http://links.jstor.org/sici?sici=0022-
3808%28199010%2998%3A5%3CS71%3AETC%3E2.0.CO%3B2-8.
WAMSER, G., C. V. NAM and A. SCHOENBERG, 2013. The Lisbon Agenda and innovation-
oriented cohesion policy: A new challenge for economic integration among the EU
regions. Journal of Economic Integration. 28(1), 37-58. ISSN 1225-651X.
Littera Scripta, 2018, Volume 11, Issue 2
105
Contact address of the authors:
Ing. Petr Jiříček, Ph.D., Department of Economic Studies, College of Polytechnics Jihlava,
Tolstého 16, 586 01 Jihlava, Czech Republic, e-mail: [email protected]
Mgr. Zdeňka Dostálová, Department of Technical Studies, College of Polytechnics Jihlava,
Tolstého 16, 586 01 Jihlava, Czech Republic, e-mail: [email protected]
JIŘÍČEK, P. and Z. DOSTÁLOVÁ, 2018. Financing Innovation, Neo-
Schumpeterian Theory and the Reduction of Regional Disparities in the
European Union. Littera Scripta [online]. České Budějovice: Institute of
Technology and Business in České Budějovice, 11(2), 95-105 [accessed:
2018-12-20]. ISSN 1805-9112. Available at: http://journals.vstecb.cz
/category/littera-scripta/11-rocnik-2018 /2_2018/.
106
Sharing Economy Regulation in the Czech Republic:
the Theoretical Framework of Analysis
Radek Soběhart
Institute of Technology and Business in České Budějovice
Abstract
Sharing economy iscurrently one of the main phenomena, primarily in the context of
developing Smart Cities and smart economy. The most well-known examples of
sharing economy have been in the fields of accomodation and car sharing. However,
the possibilities of sharing economy are much larger. The quick development of
sharing economy soon encountered the restrictions of traditional regulatory
frameworks of national economies and decision-making processes of municipalities
and cities, which were not ready for this phenomenon. This resulted in massive
protests of traditional economy branches that request that the regulatory measures
do not change - these were often implemented before the invention of the internet or
the development of IT technologies. Politicians have had similar reactions, without
effectively solving problems connected to the commencement of sharing economies.
The paper focuses on defining the term sharing economy and on the possibilities of a
new regulatory environment that would be governed by the principles of the so-called
better regulation. The text defines clear critearia how to evaluate sharing economy
and how to correctly estimate its potential for the development of cities,
municipalities, and national economies.
Keywords: sharing economy, regulation, Czech Republic, Public Policy.
Introduction
Although the topic of collaborative (sharing) economy is very popular, the collaborative
economy itself has got a quite small market share in both the EU and the Czech Republic.
This is probably the main reason why it isn’t regulated as much as other sectors. However,
it is growing rapidly and in specific branches of economy, traditional business models
Littera Scripta, 2018, Volume 11, Issue 2
107
must deal with a competition based on new, “unknown” pillars – online platforms, mobile
applications, sharing of knowledge and business without borders. According to the
European Commission, the collaborative economy generated gross revenue in the EU
around 28 billion € in 2015. Revenues in the EU in five key sectors almost doubled
compared with the previous year and are set to continue expanding robustly. (EC 2016)
Some experts estimate that the collaborative economy could generate additional 160-572
billion € in the EU economy in a close future. Nevertheless, this future cannot do without
transparent and stable regulatory conditions. The management of all these new
opportunities will be very challenging because it is new phenomenon and the agreement
of all involved interest groups in this area is nowhere near. The biggest challenge will be
finding a solution that is fair and efficient and implementing it into current state of
economy. Some interest groups are already asking for a bit of fairness regarding the
problematics of services provided by P2P (peer-to-peer) platforms. It is important to
balance between fairness and effectiveness. Some say instead of regulating the
collaborative economy, we should deregulate the traditional economy to make the
conditions for all participants equal. However, the arguments reflecting a broad research
of economic theory are missing. Therefore, we are going to determinate the most urgent
problems as market accessibility, taxation, employment in the area of collaborative
economy, also quantify and qualify their impacts and and suggest a complex theoretical
environment for sharing economy regulation.(Pildes and Sunstein 2005)
A phenomenon of sharing economy is usually represented by car-sharing (e.g. Uber),
accommodation (e.g. AirBnB) and crowdfunding (e.g. Kickstarter). These services always
existed, but they weren’t usually picked in the past due to high searching costs and this is
probably why they were often overlooked even though they were cheaper or in other
ways more suitable alternative. The problem of high search costs was solved by modern
technologies such as GPS, high speed internet, social networks and mobile applications.
In the past, people used to say “you are what you wear” but “you are what you can access”
(Belk 2014). It is much more suitable in today’s era. The collaborative economy brings
disruptive innovations in this matter and its scale is as big as a discovery of a video for
broadcasting industry. This revolution produces a whole new sector filled with new
possibilities. The possibilities are connected with lowering the transaction costs, using
capital that lays idle, new matchmaking systems between customers and providers and
many more. This leads to higher effectiveness in the end, which is beneficial to whole
society as it can solve other seemingly unrelated problems. These platforms could also
lower the costs of public sector, since most of the platforms have their own self-regulation
system, which lowers the need for regulation and consumers’ protection – these standard
regulations are rather costly. Therefore, the regulation of sharing economy should follow
an existing state of digital development.
The fact that sharing economy is a major challenge for decision-makers could be proven
by protests against it. The current state of collaborative economy in the Czech Republic is
quite stormy. There have been several protests against P2P platforms and collaborative
economy itself. Taxi drivers did most of the protesting as they feel that Uber and other
Littera Scripta, 2018, Volume 11, Issue 2
108
P2P platforms providing car-sharing/carpooling services are not respecting legislative
rules of the game. One example for all is the protest that was held in Prague where the
Taxi drivers, protesting against Uber among other things, blocked 2 out of 3 traffic lanes
in one of the most important traffic artery for eight hours (Bun 2016). Another pressing
matter is that subjects providing accommodation have to pay certain fees to municipality
for providing such services and there is a suspicion that people using P2P platforms such
as Airbnb are not doing so. There is no evidence for this claim but the municipality of
Prague is already investigating this matter (Černý 2017).
We suppose the pressure on regulators will be even bigger. Estimates of the size of
collaborative economy in the Czech Republic vary, but generally we can say that current
state is around 0,1 % GDP and is expected to rise to 0,5 % GDP in 2020 (Bostl 2016). The
problem is that such estimations can’t be accurate, because there is no proper generally
acknowledged definition of what the collaborative economy is, so it is impossible to
measure it. Anyway, the legal framework regarding collaborative economy in the Czech
Republic is very vague. There are no special regulations regarding collaborative economy
yet. We can’t expect that it is going to change in close future. So far only rigid general rules,
laws and regulations e.g. Trade Act, Income Tax Act, Road Transport Act, etc. are applied
on collaborative economy, which leaves many parts of the system uncovered. We can’t
expect that the situation is going to change in close future because of the election cycle,
however, the new government serving 2017-2021 will have to upgrade the legislation
according to collaborative economy requirements. As far as individuals (voters) like
sharing, politicians must follow this fact.
Moreover, sharing economy regulation has a significant behavioural aspect. Human
behavior tends to be heavily context dependent - we buy more things when we are
hungry, we use alternative (even though more dangerous) means of transport after a
major plane crash or we prefer rebates over deductibles. In last 30 years, these violations
of expected utility are being addressed by the behavioral economics. This contemporary
branch of economics - interested in the nature of human decision making and judgment -
connects insights from economics, psychology, cognitive science and evolutionary
biology. The cornerstone of this field is a program of heuristics and biases by a Nobelist
Daniel Kahneman and Amos Tversky. A heuristic (or a rule-of-thumb) reduces the
complex tasks of decision making to simpler judgmental operation (Tversky and
Kahneman 1974).
However, any reduction of task complexity almost inevitably leads to errors in decision-
making (Allais 1953). Facing limited information processing time and ability, brains of
hominids were equipped with function-specific mechanisms with special design for
solving problems such as mating, problems of food choice, predator avoidance and social
exchange (Haselton, Nettle a Andrews 2015). Given the brief modern period, the same
mechanics is used in solving more complex tasks than what they were designed for. This
is probably the reason for why the decisions are prone to breakdown in systematic ways
(Haselton, Nettle a Andrews 2015). As long as both sides of markets are composed of
predictably irrational individuals who systematically fail in acquiring, processing and
Littera Scripta, 2018, Volume 11, Issue 2
109
evaluating information, cognitive biases might be viewed simply as a fourth type of
market failure (Bennett et al. 2010). Like in a case of the other three causes of the market
failure (market power, information asymmetry and externalities), also this failure needs
to be somehow fixed to secure an efficient market.
Adam Oliver suggests that by appealing to the cognitive affects and processes that people
employ when making automatic decisions, we might expect that behavioural economic-
informed interventions will have more effect that interventions that are otherwise
informed (Oliver 2013). In line with this statement, the United Kingdom BIT - Behavioural
Insights Team (aka. “the Nudge Unit”) has pioneered an increasing trend in the
mainstream application of behavioral economics insights into public policy making. In
recent years, leading countries across the globe have started running their own “nudge
units”. The growing interest in the importance of behavioral economics in the public
sector is also obvious from activities of the European Union which has established its own
‘Foresight and Behavioural Insights Unit’ or of the United States which has established
‘Social and Behavioral Sciences Team’. Unfortunately, this progress seen in other
countries has not been matched in Czech Republic which is somewhat lacking in the
development and application of these new trends.
The basic method for delivery of well-designed behaviorally informed public policies is
an experimental approach. The core idea is that all policies should be first tested in
controlled conditions and only then - if proved functional - put to work. By ‘controlled
conditions’ we usually mean between-subjects experimental studies in form of a
laboratory experiment or a field experiment. These studies are based on asking subjects
to evaluate either real or hypothetical prospects that are manipulated by the investigator
while using either real or hypothetical rewards and costs can be used (money, health,
level of comfort or discomfort). Participants of experimental studies are usually divided
into two (or more) groups where one group do not face any treatment and the other does.
The treatment is usually a measure or set of measures by which a proposed policy aims
to modify the behaviour of subjects (Wilkinson and Klaes, 2012). To better demonstrate
the idea, we present a few examples.
Material and Methods
Hypotheses:
It is very important to be aware of a fact that overregulating this sector will take away all
the positive things that it can bring to the whole society. Therefore, we can test several
hypotheses for a formulation of concluding recommendations:
Definition of collaborative economy: What is and what isn’t part of the
collaborative economy and what are the key factors for determining it? The
definition is rather based on a way of service provided rather than on a type of
service provided.
Littera Scripta, 2018, Volume 11, Issue 2
110
Legislation: A new legislative framework should include the collaborative
economy and it should keep in mind that it is an evolving, flexible new sector with
no real space for rigid regulations could cause severe damage.
Transparency: The most serious problem for consumers is an ambiguity of
conditions for providing services. Online platforms and real-time trackable
services provide better conditions for limiting information asymmetry between
supply side of the market and demand side of the market than rigid laws, which
are very administratively very costly to enforce.
Taxation: Every individual follow opportunity how to control own money. By
making paying taxes and social security obligation more simple, easy and possibly
online, P2P platforms provide very efficient conditions for tax obligation
fulfillment.
Behavioral aspect: When regulation sharing economy, some aspects from
behavioral economics could be used on both supply and demand side. This
approach could bring Pareto efficient moves in the society.
Methodology
Since we were trying to examine the legal framework of collaborative economy in the
Czech Republic, we need a lot of data about the problem. We will do interviews with
members of involved parties and a thorough research of the Czech legal framework in this
area. After we transform this data into information, we evaluate possible adjustments of
the legal framework. We used cost-benefit analysis and regulatory impact assessment to
evaluate possible regulatory policies.
Regulatory Impact Assessment (RIA) is an efficient method of policy analysis which is
intended to assist policymakers in the design, implementation and monitoring of
improvements to regulatory systems, by providing a methodology for assessing the likely
consequences of proposed regulation and the actual consequences of existing regulations.
A modern government, however, has to ensure a balance between the legislative activity
at the state level and the efficient operation of local governments, communities and
settlement. The process of Regulatory Impact Assessment in the Czech Republic adheres
to the Guidelines for Regulatory Impact Assessment (RIA). (Baldwin 2010; Jacobs 2006).
Identification of all new, large-scale impacts in areas of the state budget and other public
budgets, administrative burden for public authorities and economic and legal relations
between public authorities and private entities is defined as the main task of the
Regulatory Impact Assessment process. Genuinely, the process of Regulatory Impact
Assessment affects decision-making with nationwide and regional effectiveness, which
helps to understand the current situation and possible outcome of proposed legislative
change. Then we can decide whether to regulate, deregulate or better regulate and predict
the resulting effect – the EU15 aims to stimulate debate on regulatory policy and how to
do it better, to bring about real reform that improves lives.( Alonso, Clifton and Díaz-
Fuentes 2015)
Littera Scripta, 2018, Volume 11, Issue 2
111
The main approach used in the process of impact assessment is an analysis of costs and
benefits – Cost & Benefit Analysis (CBA). This universal method is used to evaluate project
proposals spilling over into the public sector. It compares positive effects (benefits) on
one side and negative effects (costs) on the other. In general, the recommended procedure
is an essential element of the impacts analysis on actors, the quantification of the impacts
and their conversion to a common comparative basis, ideally financial unit. Based on this
procedure, it is possible to extend the CBA by other economic, mathematical or
econometric tools such as net present value, discounting formulas, regression analysis,
scenario analysis and probit/logit model, etc. This allows a comparison of non-financial
benefits to the financial statements and to compare the broader social benefits with the
zero option (no action). Implementation of the local CBA element into decision-making of
state and local government bodies produces enormous research potential. (Hahn and
Tetlock 2008).
Criteria:
The paper is proposed to meet a key goal, i.e. to design a regulatory framework for both
central and local authorities regulating sharing economy (Weatherill 2007). The
framework follows up these points:
Market access requirement: Sharing platforms’ creation and operation are not
regulated because they are merely the “notice-boards”, where producers and
consumers meet. The only exception are the crowdfunding/collaborative finance
platforms, which are regulated and supervised by the Czech National Bank.
Collaborative finance platforms have to acquire same licenses as traditional
investment platforms and they also have to fulfill other requirements such as
regular reporting, regular trainings and they must comply with several others
strict laws. The main topic is not the regulation of platforms, but the regulation of
the actual service providers (e.g. Uber drivers). The biggest disputes in the Czech
Republic are in the taxi service and car-sharing/carpooling area. Where taxi
drivers provide the service under Road Transport Act and a taxi concession. To
become a taxi driver, one has to take 4 steps: obtain a taxi driver’s ID, pass a taxi
driver’s exam, register the car as a taxi and acquire a Trade license in form of taxi
concession. The car of a taxi driver must be marked and equipped with a taximeter.
Municipality of Prague also applies a maximum price cap (1€/km) on top of all
that. Carpooling is defined as a contract based on Civil Code. The nature of
carpooling is that the driver satisfies his own needs e.g. driving to work and
another individual just shares the cost with the driver. In other words, carpooling
isn’t a profit-seeking activity a but a cost-sharing activity. The mentioned dispute
is about legality of such service. Uber pop defines itself as a carpooling and
consequently they don’t fulfill the same obligations as taxi drivers do (mentioned
above) even though they provide very similar service. Representatives of
traditional industries are trying to make it sound like a serious problem, but rather
than problem it is a glitch in a legal system. The dispute can go on forever, if the

Littera Scripta, 2018, Volume 11, Issue 2
112
legislative framework doesn’t change. The project should analyze this issue, use
best practices and make recommendation for regulators. (Adelle 2012)
Consumers’ protection: Even though it might seem that this area will be
problematic, the opposite is true. The legislation in most cases treats the customer
to customer service C2C interactions as the business to customer service B2C
interactions, where the provider of service is considered as B (business). All the
rules and laws regarding the Czech or EU policy in terms of protection of users are
mostly applicable. Details are often specified in contracts (e.g. cancelation policy).
Huge perk of collaborative economy in terms of protection of users is self-control,
self-regulation and user-based ratings, which significantly lowers the transaction
costs of verifying counterparties and improves the safety of both the provider and
the consumer. The project will cover this area.
Employment: There are no available data regarding the influence of collaborative
economy on employment and we can assume that collaborative platforms have
created new opportunities for economic activity, i.e. the overall effect is rather
positive. However, there are almost no employees of P2P platforms in the Czech
Republic. The cooperation is mostly based on contracts, which means that the
platform and the providers (e.g. Uber drivers) are in a partnership agreement. The
project team will deal with this point and include economics effect into project
conclusions.
Tax obligation: The whole sector of collaborative economy is very complex and
therefore very difficult to control, which causes the problems with taxation and tax
evasion. This can become tricky, because entities that don’t pay taxes have an
advantage and they are pushing out those who pay taxes, which makes the impact
on the state budget more significant. Difficulties pile up in situation mentioned
earlier. There is a blurry line between carpooling and taxi service, which means
that the situation around paying taxes is unclear. The tax obligation is transferred
to the service providers (e.g. Uber driver) and they should, according to tax
experts, pay income tax. The providers also get the services from platforms from
abroad (e.g. Uber – Netherlands), “therefore they should pay value added tax from
the commissions, similarly to people who advertise through Google AdWords.”
(4Liberty Review 2016).
Conclusion
Sharing economy has been becoming an essential topic in public policy in the Czech
Republic (Peterka, Soběhart and Jílková 2018). Sadly, municipalities, as well as state
institutions, still choose to implement restrictions and bans which causes higher prices,
dissatisfied customers, and costs connected to poorly calibrated regulations. The Czech
academic environment has also not been paying enough attention to the sharing economy
topic; Czech scientists rather reflect on events presented in Czech press without
producing their own analyses or solution propositions. Mainstream media and politics are
controlled by powerful interest groups (cab drivers, hotel owners) who demand bans and
Littera Scripta, 2018, Volume 11, Issue 2
113
the enforcement of the current policy, which does not reflect the changer in user
preferences and new challenges in connection to the sharing economy. An institutional
framework has not been created yet in the Czech Republic, which would make it possible
to discuss not only new challenges in the area of sharing economy but also the need for
revising the current regulatory framework which by itself causes more issues than
effective solutions. This paper aims to introduce a theoretical framework which would be
a base for creating an effective regulatory set of rules for the actions of key players on the
sharing economy market.
References
ADELLE, C. and S. WEILAND, 2012. Policy assessment: the state of the art. Impact
Assessment and Project Appraisal 30(1), 25-33.ISSN 1471-5465.
ADLER, M. D. and E. A. POSNER, 2006. New Foundations of Cost-Benefit Analysis.
Cambridge, MA : Harvard University Press. ISBN 978-0674022799.
ALONSO, J. M., J. CLIFTON and D. DIAZ-FUENTES, 2015. Did new public management
matter? An empirical analysis of the outsourcing and decentralization effects on public
sector size. Public Management Review. 17(5), 643-660. ISSN 1540-6210.
ALLAIS, P. M., 1953. Le Comportement de l’Homme Rationnel devant le Risque: Critique
des Postulats et Axiomes de l’Ecole Americaine, Econometrica. 21(4), 503–546. ISSN
1468-0262.
BALDWIN, R., 2010. Better Regulation: The Search and the Struggle. In: Baldwin, R., M.
Cave and M. Lodge (eds.). The Oxford Handbook of Regulation, Oxford : Oxford University
Press, 259-278. ISBN 9780199560219.
OECD, 2017. Behavioural Insights and Public Policy. Paris: OECD Publishing. ISBN 978-92-
64-26907-1.
BELK, R., 2014. You are what you can access: Sharing and collaborative consumption
online. Journal of Business Research. 67(8), 1595-1600. ISSN 0148-2963.
BENNETT, M. et al., 2010. What does behavioral economics mean for competition policy?,
Competition Policy Internationa. 6(1), 111–137. ISSN 1554-6853.
BOARDMANN, A. E. et al., 2006). Cost-benefit analysis: concepts and practice. Cambridge:
Cambridge University Press. ISBN 978-1108448284.
BOSTL, F., 2016. Sdílím, šetřím, vydělávám. Hospodářské noviny. 16. 3. 2018. [online].
[accessed 2018-05-12]. Available at: https://ihned.cz/nazory/c1-65208800-sdilim-
setrim-vydelavam).
BUN, E., 2016. Taxikáři zablokovali pražskou magistrálu, Krnáčovou nepřilákali. iDnes.cz.
8. 2. 2016. [online]. [accessed 2018-03-16]. Available at: https://ihned.cz/nazory/c1-
65208800-sdilim-setrim-vydelavam.
Littera Scripta, 2018, Volume 11, Issue 2
114
The Commission's European Agenda for the Collaborative Economy, 2016. [online].
[accessed 2018-08-03]. Available at: http://ec.europa.eu/DocsRoom/documents/16881
/attachments/2/translations
CREW, M. A. and D. PARKER (Eds.), 2006. International handbook on economic regulation.
Cheltenham: Edward Elgar Publishing. ISBN 1-84376-671-X
ČERNÝ, A., 2017. Praze přes Airbnb utíkají desítky milionů ročně. Jinde už poplatky
vymohli. iDnes.cz. 12. 3. 2017. [online]. [accessed 2018-05-20]. Available at:
https://ekonomika.idnes.cz/mesta-versus-airbnb-048-/ekonomika.aspx?c=A170311_
2311463_ekonomika_rny.
DUNLEAVY, P. and C. HOOD, 1994. From old public administration to new public
management. Public money & management. 14(3), 9-16. ISSN 1467-9302.
HAHN, R. W. and P. C. TETLOCK, 2008. Has Economic Analysis Improved Regulatory
Decisions? Journal of Economic Perspectives. 22(-), 67-84. ISSN 0895-3309.
HASELTON, M. G., D. NETTLE nad P. W. ANDREWS, 2015. The Evolution of Cognitive Bias.
The Handbook of Evolutionary Psychology. 2(-), 724–746. ISBN 9781118755808.
CHOVANCULIAK, R. et al., 2016. Less Regulation, More Reputation! 4Liberty.eu.
JACOBS. S., 2006. Current Trends in Regulatory Impact Analysis : The Challenge of
Mainstreaming RIA into Policy – Making, Washington, DC : Jacobs and Associates
(http://regulatoryreform.com/wp-content/uploads/2014/11/ Jacobs_Current__
Trends_and_Processes_in_RIA_May_2006.pdf)
KASPROWICZ, T., 2016. The Emergence and Development of Sharing Economy 4Liberty.eu
- Sharing economy, pp. 4-17.
KRULIŠ, K., 2016. The Emergence and Development of Sharing Economy 4Liberty.eu -
Sharing economy, 102-11.
OLIVER, A. et al., 2013 Behavioural Public Policy. Cambridge University Press. ISBN 978-
1107617377.
PETERKA, P., R. SOBEHART and J. JILKOVA, 2018. Sharing Economy – a Challenge of the
21st Century?. Littera Scripta [online]. Ceske Budejovice: Institute of Technology and
Business in Ceske Budejovice, 11(1), 155-169. ISSN 1805-9112.
PILDES, R. and C. SUNSTEIN, 2005. Reinventing the Regulatory State. University of Chicago
Law Review. 62(-), 1-129. ISSN 1939-859X.
THALER, R. H. and C. R. SUNSTEIN, 2008. Nudge. Improving Decisions About Health, Wealth
and Happiness. Focus. ISBN. 978-0141040011.
TVERSKY, A. and D. KAHNEMANN, D., 1974. Judgment under Uncertainty: Heuristics and
Biases, Science. 185(4157), 1124–1131. ISSN 0036-8075.
Littera Scripta, 2018, Volume 11, Issue 2
115
WEATHERILL, S. et al., 2007. Better Regulation, Oxford : Hart Publishing. ISBN 978-
1841137155.
WILKINSON, N. and M. KLAES, 2012. An Introduction to Behavioral Economics.
Basingstoke: Palgrave Macmillan. ISBN 978-0230291461.
Contact adress of the author:
PhDr. Radek Sobehart, Ph.D., Department of Humanities, Faculty of Corporate Strategy,
Institute of Technology and Business in Ceske Budejovice, Okruzni 517/10, 370 01 Ceske
Budejovice, Czech Republic; e-mail: [email protected].
SOBĚHART, R., 2018. Sharing Economy Regulation in the Czech Republic:
the Theoretical Framework of Analysis. Littera Scripta [online]. České
Budějovice: Institute of Technology and Business in České Budějovice,
11(2), 106-115 [accessed: 2018-12-20]. ISSN 1805-9112. Available at:
http://journals.vstecb.cz/category/littera-scripta/11-rocnik-2018/2
_2018 /.
116
The Thermidorian Reaction and the Fate of Jacobins
Michael Dudzik
Charles University
Abstract
The article will focus on existence of the Jacobins and their influencein France after
28th July 1794, including the fate of their supporters, ex-Terrorists, sans-culottes and
Jacobin clubs. It will mainly focus on two aspects: excluding the Jacobins from political
and social life in Thermidorian France (July 1794 – October 1795). The text will
successively discuss the Conventional purges, removal of sans-culottes from
provincial political arenas and their social isolation, issues with poor distributing of
rations and consequent uprisings, dissolving of the Jacobin clubs across the country,
mass releasing of alleged suspects and at the same time imprisoning political enemies,
subsequent prison massacres, installing new supporters of the regime and overall
institutional changes in new, cleansed France.
Key words: Jacobins, Thermidorian Reaction, Convention, French Revolution, 1794.
Introduction
The execution of Maxmilien Robespierre is probably the most famous scene of the French
Revolution. But this act, in which much more people were executed, was not in fact the
end. Same atrocities and cruelties had ocurred in a period following the execution of the
most prominent Jacobins and not many authors incline to tell this story. Fortunately, there
are some exceptions that are worth mentioning.
Since this article will mainly focus on political and social life from which the Jacobins were
excluded, the political history and social history are the main methods used for this work.
There are only few major figures dealing with this era: while republican Jules Michelet
ended the Revolution with Robespierre’s execution, the liberalism of Adolphe Thiers
ventured far beyond July 1794 and was accompanied by Alphonse Aulard‘s republican
and anticlerical view on the bourgeois class in the course of the Reaction. The more leftist
and social view on low-classes is provided by Louis Blanc whose narration pays attention
to situation in the departements and the Jacobin clubs themselves.
Littera Scripta, 2018, Volume 11, Issue 2
117
Mette Harder’s insight to Conventional functioning and purges that followed deserves a
special notion. Furthermore,with Laura Mason’s exquisite works and with Stephen
Miller‘sand Noah Shusterman’s fresh approaches to old challenges we have a chance to
look at the social stratification: how sans-culottes, a low-class, were repressed until being
slowly dissipated among others and replaced by wealthier supporters of the regime.
Constitutional details provided by Jean-Baptiste Duvergier and Michael Kennedy’s
exahustive look at the Jacobin clubs and their circulars complete the view of the
atmosphere of a direct Thermidorian Reaction for decrees disadvantaging the Jacobins
and their supporters while favouring well-to-do citizens showed the true potential of a
new, purged and cleansed Convention – to find scapegoats, eliminate political enemies
and distract France from real struggles.
When French had found out they didn't need a repressive regime because they were
winning against enemy, the Jacobin era must have come to an end. The so-called coup
d'état deprived twenty-two prominent Jacobins – including infamous Maximilien de
Robespierre, Louis de Sant-Just and Georges Couthon – of their rule over France. The day
after, on 10 Thermidor Year II or 28th July 1794, the power in country shifted to extremists
who "feared of retreating from the Terror", to moderates who wanted to "foster that
retreat" and to disgraced deputies who "hoped to protect themselves" (Mason 2013, p.
315).
The following period of 15 months had been in hands of "corrupted politicians, people
without scruples and means" (Furet 1996, p. 225) who were even further regicides and
took part in previous terrorist actions. France was governed by the Committe of Public
Safety, leading figures were Jean-Baptiste Tallien and Paul Barras who had both gained an
immense power and influence in the country. Tallien's wife Thérésa was the main figure
in organizing "balls for victims" and salons, Louis-Marie Fréron was considered as the
chief of journalists.
A new era of Thermidorians – also called Perpétuels for they survived both the Girondin
purge in May – June 1793 and that of June 1794 – put an end to the Laws of Maximum and
of 22 Prairial. Furthermore, they eliminated the Revolutionary tribunal (Shusterman
2014, p. 235). Their rule was, however, a "victory of mediocrity over talent" (Shusterman
2014, p. 237) and the reign was famed for an aforementioned "corruption, extravagance
and revenge" (Mason 2015, p. 1). The victorious men "advanced the Montagnard project of
a consolidated state while, paradoxically, destroyed the Mountain itself" (Mason 2013, p.
314) and were cautious in not inviting royalists or Jacobins to seize control (Connelly
2006, p. 68).
News concerning the fall of the triumvirate reached the surroundings of Parison 29th or
30th July, southern cities and villages were informed between 3rd and 5th August (Kennedy
1989, p. 309), a week later. When the Medusa's head was cut off there were still thousands
of parts that needed to be dealt with. As Mary Miller says, the Jacobin volcano was in 1793
"bursting passions set ablaze by the sudden appearance of a great Republic" but for
Thermidorians in autumn 1794 they represented dangerous, overzealous revolutionaries
Littera Scripta, 2018, Volume 11, Issue 2
118
who could ignite the fragile Republic (Miller 2011, p. 162). That's why Jacobins were the
first on the list.
As Mette Harder claims, the coup's purge of the triumvirate was followed by purge of
another ninety-nine partisans (Harder 2015, p. 34) from outside the Convention who
were guillotined with their leaders. It is unrealistic to think that with the end of the Terror
all the violence and murders would have suddenly stopped. Thermidorians not only
expelled and arrested the Incorruptible's closest allies, but also former members of the
previous government, majority of remaining Montagnard and Jacobin deputies and finally
several right-leaning members (Harder 2015, p. 35).
Endangered were of course the Terrorists themselves for "the ex-prisoners thirsted for
vengeance against them" (Kennedy 1989, p. 313). Some of them, like artful Joseph Fouché,
could have washed off their allegiance to Robespierre but most of them couldn't. Jean-
Baptiste Carrier, infamous representant on mission in Nantes, was executed in December.
Bertrand Barère, Jacques Billaud-Varenne, Collot d'Herbois and Marc Vadier were
accused of being the right hand of Robespierre and were in April 1795 deported to French
Guyana (Shusterman 2014, p. 236; Harder, 2015, pp. 37–38). On the contrary, the
Girondins, such as Jean-Baptiste Louvet, Maximin Isnard or Jean Lanjuinais, had been
reinstated in their positions again and families of purged deputies were paid state
pensions (Shusterman 2014, pp. 236–237; Harder 2015, p. 41).
Jean-Baptiste Carrier's trial is worth mentioning. Indignation of the people broke out after
9 Thermidor when 133 citizens of Nantes described his "republican marriages" in which
he had tied up a naked man with a naked woman and drowned them together. He had
been arrested and nearly freed like Robespierre, but Carrier in the end stood before the
tribunal. In his final speech, he declared that "everyone is guilty here, up to the bell of the
president" (Thiers 1839, pp. 370–374). The general panic developed and Carrier was
quickly, with his fellows of the Nantes' revolutionary committee, sent to death.
Not only Jacobins, but also their supporters sans-culottes needed to be swept away. Sans-
culottes referred to a miserable group of labourers who wore short trousers (culottes) to
differentiate themselves from non-working nobles with long trousers. A new social group
had emerged against them – four or five hundred of the rich gilded youth "flaunted their
wealth, insulted sans-culottes and attacked ex-Terrorists" (Connelly 2006, p. 68; Mason
2013, p. 318; Palmer 2014, pp. 531–532) while also physically attacking the Parisian
Jacobin club and beating up people inside the building (Shusterman 2014, p. 237). The
sans-culottes in municipalities were – altogether with merchants, artisans and petty
property owners – replaced by former nobles, federalists and affluent landowners (Miller
2008, p. 244). For example in Languedoc's municipal councils landlords, jurists or lawyers
had replaced the artisans and shopkeepers (Miller 2008, pp. 245–247).
Furthermore, the Convention "purged 81 legislators and incarcerated them," it "deported
two former members to a prison colony in French Guyana, sent to death 6 deputies" and
"drove at least five into suicide" (Harder 2015, p. 35). Harder summarizes that 230 of 749
deputies of the Convention were arrested throughout years 1793 and 1795 and points out
Littera Scripta, 2018, Volume 11, Issue 2
119
that all purges were motivated to "favor the public opinion in expelling unpopular
members" (Harder 2015, pp. 36, 43). Stephen Miller agrees and rightly states that the
"restored" Thermidorian Convention in no case stopped purging its unsuitable members
and was even more active than its Jacobin predecessor (Miller 2008, p. 28).
On the other hand, the new Convention differed from previous one in permitting religious
opinions, but it forbade showing it in public assemblies. That's why the people of northern
Seine-Inférieure shifted from celebrating the fêtes décadaires on workdays to celebrate
them on Sundays in church (Sirich 1954, p. 335). When the citizens of eastern region of
Côte d'Or were deprived of singing Masses and vespers in the church, the people rose up
and summoned others to sing it by themselves. Similar accident happened in south-
eastern region of Isère:women had marched to home of the national agent and "forced him
to hand over the keys of the church in order that Mass could be said" (Sirich 1954, p. 335).
The new government soon regretted abolishing the Maximum. Since the Law was
establishing price controls for "items like meat, writing paper or workers' wage"
(Shusterman 2014, p. 196), price of bread was continually growing and workers couldn't
afford buying
it – especially when the assignats were "floating" and therefore became worthless
(Connelly 2006, p. 69). In addition, a terrible winter that "froze the Seine and suspended
grain transports" made inflation possible so the working class was starving while "high
society danced on the tomb of Jacobin austerity" (Mason 2013, p. 319). When the Maximum
was violated in the departements, 4 persons were arrested or the local committee with
gendarmerie made an expedition to certain commune which had "refused to satisfy
requisitions" (Sirich 1954, p. 334).
The suspension of the Jacobin clubs
Once the Convention had made sure it got rid of sans-culottes and was controlling all
citizens who would deliver its power to distant places in France, it focused on popular
clubs and public life. Jacobin clubs split in two groups: (1) one was strictly against the
Convention depriving country of the "lawful" ruler while (2) the second "felicitated the
Convention on saving the fatherland again" (Kennedy 1989, p. 310). Knowing that it will
be their turn to be beaten up, discredited or possibly killed like they were organizing, the
Jacobins began to either turn their coats or act like they serve the country no matter who
was in power.
There were some clubs, however, who opposed the overall upheaval. The Chambéry club
in Savoy warned about "moderates wanting to substitute ,indulgence' and sowing troubles
in the departments" (Kennedy 1989, p. 314) while the Marseille club was against "freeing
of the aristocrats and the persecution of patriots" (Kennedy 1989, p. 314). However,
neither of them could have not withstood the reaction and were successively dissolved on
24th August and 21th September 1794 (Aulard 1910, p. 230; Kennedy 1989, pp. 320–321).
The most radical was Dijon club – it declared incarceration of those who were pointed out
as suspects plus it wanted to remove priests and nobles from public offices (Kennedy
Littera Scripta, 2018, Volume 11, Issue 2
120
1989, p. 315). It went even further – it had imprisoned all voyagers or habitants "who had
signed on the list that would bring the emmigrants into the city" (Thiers 1839, p. 333). Local
representative on mission had commonly chose twenty to thirty moderate members,
installed them in a certain Jacobin club and instructed his fellows to purge the remaining
radical Jacobins (Thiers 1839, p. 333). The Dijon purge culminated on 31st October
(Kennedy 1989, p. 342) and the society club in Paris lost one of her most loyal supporter.
The Jacobins' fate at Lyon and Marseille was similar. Since they were "chased in
municipalities and provinces, they retired to the Jacobin club" (Thiers 1839, p. 334). There
was a chance they would form another society so they needed to be eliminated. Lyon's
orators were attacking the Convention decrees concerning freeing imprisoned "suspects"
and therefore were dissolved by the representant on mission. Marseille had witnesed
gathering of a considerable group of people thatsurrounded the room of two
representants and "with saber and gun in hand" demanded liberty for incarcerated Jacobin
patriots. Present gendarmes thought the representants guilty and helped the mob to
suffocate and kill the two men (Thiers 1839, p. 334). Jacobins at Toulouse had organized
riots, too, but were soon imprisoned (Thiers 1839, p. 335).
Similar activities had occured in numerous clubs and committees where Jacobins still held
power but the clubs' lifes were slowly evaporating. Although these remote clubs still
existed, they were prohibited from "associating with one another or engaging further in
local politics" so they simply lost their purpose and ceased to exist in the summer of 1795
(Mason 2013, p. 318) when they were dissolved.
The Parisian mother club stood alone and was purified. Two days after the coup the
"aristocrats had rushed to publish that the Jacobins were closed and would not be reopened"
(Aulard 1897, p. 295) which occured at the turn of the month – on 31th July there was the
last session, the club reopened on 3rd August. Presiding Louis Legendre had appealed to
some Jacobins'consciences and threatened to "grab the keys, leave them to the National
Convention and keep the club closed" until only true Jacobins come back because the club
will be "forever closed for conspirators" (Aulard 1897, p. 297).
Jacobins were completely expelled from all areas and were called "cannibals, partisans,
accomplices and successors of Robespierre" (Thiers 1839, p. 335). Pointless were their
shouts against Thermidorians destroying their nation, against "the aristocracy and the
moderantism raising a daring head" (Thiers 1839, p. 336). They didn’t show up neither in
theatres nor in salons and were excluded from all public life with their wifes, mockingly
called the "furies of the guillotine" (Thiers 1839, p. 342) for they had surrounded the
scaffold throughout the Revolution.
However, Jacobins' doom was near. Bourdon de l’Oise cried that the populat societies
consisted of "men who were choosing only themselves, like monkeys," that the
representation which rules together with the Convention "sits at the Jacobin’s club" and
therefore it must be dealt with (Thiers1839, p. 354). The session of 22Brumaire, or 12th
November, sealed their fate – the four Committeescharged one of the Jacobin to read out
their motives why the Parisian club should be dissolved: the popular ocieties didn't
Littera Scripta, 2018, Volume 11, Issue 2
121
govern anything and they weren’t deliberating no issues, their public functions were
prohibited and – maybe the most important of all – none society was superior or had more
power than other society (Aulard 1897, pp. 674, 680–681).
Talking about not having two different attitudes in the Convention, the representatives
were requested to punish the Jacobins because "if there are two parties, the Republic isn't
united and neither is the Convention" (Aulard 1897, p. 675).For maintaining the public
tranquility their removal was essential even though it was not political, but "it's necessary
for the people's safety, so I support it" said Ernest Duquesnoy (Aulard 1897, p. 676). The
first article of 21 Brumaire, or 11th November, declared the Society of Jacobins suspended,
its building transformed into a storehouse for weapons and its keys be given to the
Committe of the General Security (Aulard 1897, pp. 677, 680).
Situation in departements
The second civil war in the south was slowly evolving although royalists, emigrés and the
clergy weren't endorsed by the regime. In the department of Ariège members of the
revolutionary army humiliated the priests and wealthy citizens and tried to "inspire fear
in the local population" (Aulard, 1911, p. 96; Miller 2008, p. 249). They had continued with
Jacobins' politics – cleansing local administrations and installing real patriots were
supported by the Convention for it was looking for "demeanour, dedication and ability to
manipulate assemblies" (Miller 2008, p. 250) that perfectly fit those militant people. We
can then assume that these erstwhile soldiers had served for the same purpose as in 1793
and the first half of 1794: as a reaching hand of the government, they were useful tool to
eliminate enemies far from the capital and those citizens who would dare to oppose the
then course of the Revolution. The centralization was still on the agenda.
The atmosphere of omnipresent fear declared by the Law of Suspects in September 1793
was swept away by the law from 5th August: massive releasing of "suspects" affected
towns with populations less than twelve hundred (Duvergier 1845, p. 216) and local clubs
were forced to free even more prisoners because they were "excellent patriots" (Aulard
1897, p. 308). Some of those "patriots" were – by annuling preceding laws – welcomed
back in Paris and
17 dismissed people were given three hundred livres each. Many French had been either
freed of their accusation or released from prisons whereas most of the then members of
municipalities were arrested and imprisoned (Aulard, 1911, p. 412; Duvergier 1845, pp.
238–241, 245–246, 248 and 265–266).
The clubs had also been ordered to let supporters of the Girondins and the Girondins
themselves out and to fill prisons with political enemies and scapegoats. No wonder that
prison massacres soon occured. One of them, in southern Gard department, was justified
that "nothing has been spared to assure these execrables crimes a scandalous and
reprehensible impunity" (Miller 2008, p. 248), while the other one was filled with
terrorists who had been disarmed and their "weapons handed over to the good citizens
summoned to assure the execution of the law" (Sirich 1954, p. 338).
Littera Scripta, 2018, Volume 11, Issue 2
122
A quiet destroying of less-earning social groups suddenly evolved in departements.
Despite the sans-culottes' dismal financial situation – or maybe because of it – new local
administrators deliberately allowed inflation and declined to fix prices which resulted in
many petty-bourgeois quickly sinking into groups of merchants or day labourers.
Furthermore, many overlooked professions (e.g. clerks, farmers) wanted an esteemed
position so much they "accused one another of debauchery, sexual perversity and
unspeakable acts of cruelty" (Miller 2008, p. 251–252).
After the main nerve of the Jacobin era had been in turmoil and later cut off, jacobinism
survived and was present all over the country. Members of the Committees of Public
Safety, General Security and Revolutionary committees were considered as conspirators
so the institutions were to be reorganized. According to the law of 24th August 1794, its
articles "suppressed all committees save those in district capitals" and in "communes of
more than eight thousands inhabitants" and chose people who were eligible to write and
read (Sirich 1954, p. 329) by which the law eliminated low-class people.
Provincial revolutionary committees had been closely cooperating with communes of
certain districts and the communes' agents ought to "report all information that would
tend to trouble public order or delay the progress of the revolution" (Sirich 1954, p.
330).Suspects were then questioned and given a copy of the charges against them. What
is surprising, citizens were not eager, in many cases, to join the infamous committees –
some of the committees threatened the citizens (whom they had named before) to accept
the positions otherwise they would be "regarded as suspect and treated as such" (Sirich
1954, p. 331).
Concerning the committees' organization, they always consisted of 12 people. In most
cases half of the citizens were chosen from the city and half from the country, some
committees included members of the previous terrorist committees (Sirich 1954, p. 331).
Duties of each organization were as follows: overseeing the food supply, the public
property, the armed forces and the political situation with public opinion (Sirich 1954 p.
332). The government had in no time entrusted them with overseeing hurt soldiers, who
returned home, to be sent back to the army right after they recover: the committees'
warrants had arrested "eight delinquent soldiers," they "failed to locate three and
discovered one to be dead" (Sirich 1954, p. 333).
The thorniest issue has beenthe question of murdering and nearly exterminating all
supporters of previous regime. The most threatened were Jacobins, Montagnards,
erstwhile terrorists and simply all citizens who contributed and helped to maintain the
Terror. The members of revolutionary committees all around country had begun to
"investigate the acts of their Jacobin predecessors" and denounced their colleagues who
were either taken revenge on or were cleansed (Sirich 1954, p. 337). New committees had
not only arrested betrayers but also their wives. The Dijon committee arrested a vinegar
manufacturer who had declared that Robespierre was a "brave man" and had insulted the
local representative on mission (Sirich 1954, p. 337). Many raids into small villages and
Littera Scripta, 2018, Volume 11, Issue 2
123
combing inns, suspicious houses and surrounding forests soon followed (Aulard 1912, p.
728; Sirich 1954, p. 337).
Horrors of 1793 in the south, especially in Lyon and Nantes, had fomented reversed
horrors on those who had participated in republican marriages, drowning people or
organizing "infernal columns", raids sent to Vendée to slaughter people. The civil war
continued no matter who was battling: Jacobins, Montagnards, royalists or émigrés still
represented one nation and thousands of dead were only to prove that the Republic, as
transformed as it was, was still bolstering pointless murders just to take the focus off
country's internal problems.
The slaughtersof 1793 had consequently "driven peasants into guerrilla bands" (Connelly
2006, p. 72) known as Chouans (Aulard, 1911, p. 338). General Lazare Hoche soon
suppressed the Vendée uprising and even concluded a peace with their leader François
de Charette in February 1795 (Connelly 2006, p. 72). Discords were, however, not solved
and more united group named Companion of Jehu has been from April 1795 massacring
Jacobins in the Vendée region. Although the exact number of dead couldn't be specified, it
is believed that several hundreds victims succumbed to royalists' blades (Aulard 1897,
1911; Blanc 1870; Thiers 1839).
When the British had supported the royal cause in France and helped 4 500 émigrés to
land in the north, royalists with help of 15 000 Chouan reinforcements tried to turn the
tide of battle. More than 8 000 of them were captured, 748 of émigrés sent to death
(Connelly, 2016, pp. 72–73) and a considerable amount of them freed. However this act
of mercy didn't win Tallien more respect than he had at the time and his reign was coming
to an end. Paul Barras replaced him in October 1795 and royalists once more believed
they could seize the Convention. But they were proved wrong when young Brigadier
General Napoleon Bonaparte blew their masses up and helped to establish a new regime
that ended the Revolution.
Conclusion
Historians describe with enthusiasm Robespierre's fall and the aftermath of his execution.
However they have mostly studied only the closest aftermath and the whole period of 15
months of an unstabled regime wasn't thoroughly examined. The aim of this article was
to clarify the Jacobin's fate after they lost power and how they were hunted and
eliminated not only from political, but also from cultural and social life alike.
A new era of Thermidorians, an odd alliance of moderate and indecisive group of
representants, took care of liquidating all pro-Jacobin and pro-Montagnard citizens. They
began with their colleagues: up to 90 representants had been purged from the
Convention, imprisoned or deported from France. This included infamous ex-Terrorists
like Jean-Baptiste Carrier or Jacques-Billaud Varenne. We found out that remaining men
cleansed their ranks to favor the public opinion but somehow neglected to remove also
Jean-Baptiste Tallien and Paul Barras who were the right hand of Robespierre and voted
for him every month to stay in the Committee of Public Safety.
Littera Scripta, 2018, Volume 11, Issue 2
124
Tallien husbands became a driving force of the Reaction. While her spouse was dealing
with Jacobins in a more cruel way, Thérésa Tallien was organizing "balls for victims",
theatres and salons from which Jacobins were expelled. Their expulsion was completed
by a chief journalist Louis-Marie Fréron who had publicly accused Jacobins of their crimes
and even listed their names in his newspapers Orateur du Peuple to hunt them down.
The leaders knew they could not completely eliminate Jacobins from functioning until
they destroy their nests, clubs all around the country. The staunchest were those of Dijon,
Marseille and Lyon. The Dijon club had managed to preserve its Jacobins and to intimidate
others as well as the Lyon's. The Marseille club went even further and killed two
representants of the Convention while demanding freedom for arrested Jacobins. Since
the clubs were closely cooperating with revolutionary committees, both institutions were
slowly suspended, reorganized and clubs completely dissolved in 1795.
Once the Parisian headquarters of the Jacobins was gone, it was sans-culottes' turn to be
repressed. In Paris, they had been attacked by the gilded youth, children of wealthy
citizens, whereas in departements they were disadvantaged and their ranks were
expanding for well-to-do citizens sank among thembecause of inflation. Sans-culottes
were replaced by wealthier people and many of them were imprisoned. Furthermore,
cruel winter of 1794/1795 and high prices had caused dissatisfaction and a shortage of
bread which resulted in uprisings that were drown in blood because the Thermidorians
considered them as Jacobins' actions.
As soon as the main threats were eliminated, various citizens took care of remaining
Jacobins and ex-Terrorists by themselves without a notion from the Convention. Decrees
freed alleged suspects and incarcerated the Jacobins with their supporters which resulted
in cruel prison massacres– surviving citizens had no mercy with their erstwhile local
rulers and mass murders occured at many places across France. If they hadn’t found a
supporter of the Jacobin regime, they killed scapegoats instead.
Although the Thermidorians had dissociated themselves from the Jacobin era, we could
see a continuation in its steps. The Thermidorians had excluded ex-Jacobins from the
Convention like Montagnards did with the Girondins. Fréron presented regime's opinions
like Jean-Paul Marat did. The Jacobins were split in deciding whether to join the
moderates or to stay loyal to jacobinism – as citizens, whose families‘ membersdiminished
due to wilfulnesses of the representants on mission, didn't differentiate between a Jacobin
or a non-Jacobin, the matter of faction wasn't really important.
The regime tried to remove its connection to the previous era and by choosing victims it
was only a matter of time when citizens will take up arms and will do the dirty job for the
Convention that was as unstable as the French's emotions. The purged Convention hadn't
however changed and used the citizens' rage, caused by the representants' incompetence
to distribute rations, to eliminate its enemies and distract the people from real difficulties.

Littera Scripta, 2018, Volume 11, Issue 2
125
AULARD, François-Alphonse. La Société des Jacobins. Tome 6. Paris: Maison Quantin,
1897.
AULARD, Alphonse. Recueil des actes du Comité de salut public: avec la correspondance
officielle des représentants en mission. T. 20. Paris: Imprimerie nationale, 1910.
AULARD, Alphonse. Recueil des actes du Comité de salut public: avec la correspondance
officielle des représentants en mission. T. 21. Paris: Imprimerie nationale, 1911.
AULARD, Alphonse. Recueil des actes du Comité de salut public: avec la correspondance
officielle des représentants en mission. T. 22. Paris: Imprimerie nationale, 1912.
BLANC, Louis. Histoire de la Révolution française. T. 11. Paris: Pagnerre, 1870.
The Government of Thermidor and Establishment of the Directory. CONNELLY, Owen. The
wars of the French Revolution and Napoleon, 1792-1815. New York, NY: Routledge, 2006,
s. 68-76. ISBN 978-0415-23984-4.
DUVERGIER, Jean-Baptiste. Collection complète des lois, décrets, ordonnances, règlemens et
avis du Conseil d'État... : de 1788 à 1830 inclusivement, par ordre chronologique. T. 7. Paris:
A. Guyot et Scribe, 1845.
FURET, François. The French Revolution, 1770-1814. Cambridge, Mass., USA: Blackwell,
1996. ISBN 978-0631202998.
HARDER, Mette. A Second Terror: The Purges of French Revolutionary Legislators after
Thermidor. French Historical Studies 1 February 2015; 38 (1): pp. 33–60.
KENNEDY, Michael L. The "Last Stand" of the Jacobin Clubs. French Historical Studies.
North Carolina: Duke University Press, 1989, 16 (2.), pp. 309–344.
MASON, Laura. Introduction: Thermidor and the French Revolution. French Historical
Studies. 1 February 2015; 38 (1): pp. 1–7.
MASON, Laura. The Thermidorian Reaction. MCPHEE, Peter. A companion to the French
Revolution. Malden, MA: John Wiley, 2013, s. 311–328. ISBN 978-1-4443-3564-4.
MILLER, Mary Ashburn. A natural history of revolution: violence and nature in the French
revolutionary imagination, 1789-1794. Ithaca [N.Y.]: Cornell University Press, 2011. ISBN
978-0801449420.
MILLER, Stephen Jacobus. State and society in eighteenth-century France: a study of
political power and social revolution in Languedoc. Washington, D.C.: The Catholic
University of America Press, c2008. ISBN 978-0813215174.
The French Directory: Mirage of the Moderates. PALMER, R. R. The age of the democratic
revolution: a political history of Europe and America, 1760-1800. Princeton, NJ: Princeton
University Press, 2014, s. 530-533. Princeton classics. ISBN 978-0691161280.
SHUSTERMAN, Noah. The French Revolution: faith, desire, and politics. New York:
Routledge, Taylor, 2014, xiii, 265 pages. ISBN 978-041-5660-211.
Littera Scripta, 2018, Volume 11, Issue 2
126
SIRICH, J.. The Revolutionary Committees after Thermidor. The Journal of Modern History.
December 1954; 26(4), pp. 329–339.
THIERS, Marie Adolphe. Histoire de la Révolution francaise. T. 6. Paris: Furne et Cie, 1839.
9th edition.
Contact address of the author:
Mgr. Michael Dudzik, Charles University, Faculty of Arts, nám. Jana Palacha 2, Praha 1, 116
38, Czech Republic.
DUDZIK, M., 2018. The Thermidorian Reaction and the Fate of Jacobins. Littera
Scripta [online]. České Budějovice: Institute of Technology and Business in
České Budějovice, 11(2), 116-126 [accessed: 2018-12-20]. ISSN 1805-9112.
Available at: http://journals.vstecb.cz/category/littera-scripta/11-rocnik-
2018/2_2018/.

127
Does a Label Have a Taste? Available Information and their
Effect on the Perceived Quality of Wine by Czech Students
Jan Závodný Pospíšil1, Lucie Sára Závodná1, Monika Václavíková 2
1 University of Economics, Prague
2 Palacky University Olomouc
Abstract
This paper discusses information input and its influence on the consumer decision
process. Authors conducted an experiment to determine, whether the information
available to consumers have the potential to influence how they perceive product
quality and as a result, influence the output of the consumer decision process as well.
The assumption was verified by conducting qualitative research – a wine tasting
experiment. The aim of this paper is to bring attention to the presence of irrational
consumer behavior in a situation, where the authors deliberately seek to influence
consumers’ sensory evaluation of product quality by providing them with certain
information.
Keywords: Consumer behavior, irrationality, quality perception, information, wine.
Introduction
Marketing experts are passing around a tale, a story, which actually happened (Mueller
2014). The events took place in New Jersey. Joe Lentini went out after work to have a steak
with his colleagues. The four men also wanted to have some wine with their meal, so Joe
asked a waitress to recommend him one of a good quality. She pointed to one bottle in the
wine list. Joe asked about the price of the wine, and the waitress answered that the wine
cost 37,50 $, an amount, which Joe was willing to pay for a bottle of good quality wine.
After tasting the wine, Joe nodded in approval and let the waitress serve it to others as
well. He said later that the wine tasted well. “It wasn’t great, and it wasn’t bad either, it
Littera Scripta, 2018, Volume 11, Issue 2
128
was OK,” he said. The problem arose upon delivery of a bill, which was for more than 4,000
$. The wine did cost 3,750 $. It was Screaming Eagle from California, an exclusive cult
wine, one of the most expensive wines in the world (Beverland 2004).
A consumer, who is aware of drinking expensive wine, can enjoy and appreciate it
adequately (Ashenfelter 2008), (Capehart 2015). But what about a consumer, who is
drinking expensive wine while thinking it is actually a common wine in the average price
range? How much would this consumer appreciate the wine? And what will consumer
behavior be like, if the consumer is strongly convinced that the cheap wine he or she is
drinking is actually an exclusive one?
Authors conducted a small experiment-based study, the aim of which was to bring
attention to the influence of marketing communication, or more precisely product
information on consumer preferences or changes these preferences may undergo.
Moreover, available product information is fundamental for a consumer (Lecocq and
Visser 2006). Provided that consumer is regarded as an economic entity, the information
is the basic foundation for rational behavior (Zavodný and Kozák 2013).
Rational behavior is then defined as personal opinions and behavior based on logical and
objective analysis of all information available (Durlauf and Blume 2008). A human being,
who behaves rationally is a presumption, which traditional economy is based upon
(Simon 1955). This rationality does not manifest itself in the form of correctly chosen
goals, but in the way, these goals are being reached (Koukolík 2010).
Herbert Simon (1982) disagreed with the traditional view on a rational individual.
Instead, he proposed the theory of bounded rationality. According to this theory, people
do not decide based on principles of rational choice theory, they rather seek a solution,
which is satisfactory in the particular given situation.
Coming across irrational behavior is common. The thought process is considered
irrational when it leads to conclusion or decision, which is not the best one according to
evidence and with regard to time available for the thought process (Koukolík and Drtilová
2008). Possible causes of irrationality are numerous and can be divided into several
groups: first-impression error, social reasons, stereotypes, organization reasons, traps,
wrong usage of rewards and punishments, emotions and flaws in the thought process.
Some of the causes mentioned above of irrationality can play a major part in the case of
poor judgment of a product. The factors, which can influence a consumer, are primarily as
follows: availability error, emotional and social issues and cognitive thinking errors in
thought process (Sutherland 1992). Authors conducted a small experiment-based study
with a small group of volunteers. This study aimed to demonstrate, whether product
information can influence the consumer’s sensory perception of the product. The results
of this study also refer to a possibility to influence consumer’s rationality.
Littera Scripta, 2018, Volume 11, Issue 2
129
Methods and Data
Irrationality in consumer behavior was observed during an experiment – conducted a
wine tasting. This experiment aimed to obtain data and based on the evaluation of these
data either prove or disprove research assumption as follows:
a) Primary research assumption: Consumer’s sensory evaluation of product quality is
influenced by information provided. b) Secondary research assumption: Consumers, who
prefer wine to other alcoholic beverages, are less likely to be influenced than those, who
favor other alcoholic beverages.
Four different bottles of the same wine type were chosen for the experiment. The type
was a dry white wine Chardonnay. The price range was the same for all bottles, from 100
CZK (4 €) to 130 CZK (5 €).
However, the information about wines given to research participants differed. All wines
were poured to identical unmarked bottles. Two of them were presented as a standard,
average wines and two of them were presented as exclusive wines.
Each wine was introduced and subsequently tasted. At the end, after having tasted the last
wine, research participants were asked to fill in a short questionnaire. The questionnaire
consisted of two parts. The first part focused on wines the participants tasted: overall
impression, flavor, and bouquet, whether they would purchase it or not, and how much
they would be willing to spend on it. The second part focused on the participants
themselves: whether they consider themselves wine experts, how often they drink wine,
what alcoholic beverage they prefer and additional questions about age and sex.
During the experiment, all wines were served in same unmarked generic wine bottles.
Nevertheless, two bottles were introduced as if they contained better wine than the other
two. The main aim was to observe, whether provided product information will influence
the final evaluation of products. All wines were poured from the same, unmarked bottle
in order for participants not to create an opinion based on the appearance of the bottle or
label and, above all, in order to prevent any participants from recognizing the presented
product and therefore reveal the truth about the falsity of provided information.
Then, the wine tasting was replicated with the same wines but different participants in
order to verify the results. The difference was that this time, the wines were not only
poured from unmarked bottles but also, none of them was introduced with any
information.
Results
The experiment was conducted in February 2016. The final number of participants was
23,11 of them were men and 12 were women. Their age ranged from 19 to 24 years. Only
university students were chosen in order to ensure the homogeneity of the group. Some
of them were invited personally to participate; some of them answered an invitation
posted on the social network website Facebook.
Littera Scripta, 2018, Volume 11, Issue 2
130
Questionnaires consisted of two parts. In the first part, respondents evaluated the wines
they tasted. The second part was more general and asked for information about the
participants themselves especially on their attitude towards wine and its consumption.
As the results showed, no one considered itself as a wine expert. On the other hand, 43,5%
of respondents reported consumption of a glass of wine more than once a week.
After having tasted the samples, the participants evaluated each wine individually. First,
they evaluated the overall impression and then separately flavor and bouquet. A scale of
1 to 5 was used for the evaluation, where rating 1 represented the best possible evaluation
and rating 5 represented the worst possible evaluation.
The following question inquired, whether the respondent would or would not purchase a
bottle of the wine they had just tasted, either for themselves or for someone else (this
addition was intended for those who normally do not drink wine and thus would not
probably purchase a whole bottle for themselves). The last question of the first part of the
questionnaire regarded the amount, which would the respondent be willing to pay for a
bottle of wine he or she had evaluated.
Wine n. 1
The wine tasting was initiated with a bottle of wine from Víno Valtice, a dry white 2014
Chardonnay with an alcohol content of 12,5 %. The wine was introduced as one of average
quality, made in the Czech Republic (while according to label, the wine was made in
Republic of South Africa). Further description of this wine matched the one on its original
label. This bottle was purchased in a chain store Albert and cost 129,90 CZK (5 €) on the
day of purchase. However during its introduction, the wine was introduced as being
cheaper, its price being 89 CZK (3,30 €).
This wine took third place in all categories (i.e. overall impression, flavor, and bouquet)
in the scale evaluation. On average, its bouquet received rating 3,04, and the flavor was
perceived more favorably with rating 2,61, while the overall impression received rating
2,74.
Out of 23 respondents, 17 would purchase the wine (all positive answers like “yes”,
“probably” and “definitely” were taken into account) and they would be willing to pay 97
CZK (3,60 €) on average for it. This price is higher by 8 CZK (0,30 €) than the one which
was stated during the introduction of the wine (one person of the aforementioned 17 did
not state any price; therefore the answer was not included in the average price). Nine
respondents stated that they would pay a higher price than the one stated during the
introduction, their answers ranged from 100 CZK (3,70 €) to 150 CZK (5,55 €). This wine
was the only case when respondents state they would be willing to pay more than the
actual price, or more precisely more, than the price stated during the introduction of the
wine.
Littera Scripta, 2018, Volume 11, Issue 2
131
Wine n. 2
The second dry white Chardonnay was a Czech wine from Velké Bílovice, the year 2015,
with an alcohol content of 11 %. This bottle was purchased in a chain store Billa and cost
119,90 CZK (4,40 €) on the day of purchase. During its introduction, the wine was
introduced as being slightly cheaper, its price being 105 CZK (3,90 €).
This Chardonnay was evaluated as the worst wine among those presented during the
experiment. It took the last place in all categories; however, it cannot be labeled as
complete “garbage”, since its overall impression received average rating 3, which is
exactly in the middle of the evaluation scale. Average rating of its flavor was 3,13 and
average rating of its bouquet was 3,26.
Out of 23 participants, 14 would buy a bottle of the wine n. 2, including those who
answered “yes” but also those who answered “maybe”. Only 13 respondents stated a
price, for which they would be willing to purchase the wine. On average, this price was 86
CZK (3,18 €). That is the lowest price participants were willing to pay for any of wines
they tasted, and it is 19 CZK (0,70 €) below the price, which was mentioned during the
introduction of this wine.
Wine n. 3
By introducing the third wine, an imaginary line of relatively cheap wines was crossed
towards the exclusive ones. In reality, wine n. 3 was a dry white 2014 Chardonnay from
Habánské sklepy in the Czech Republic. Its alcohol content was 11,5 % and the bottle cost
109,90 CZK (4 €) in a chain store Albert on the day of purchase. This bottle was presented
as a French wine from a wine-producing region Bourgogne under a sumptuous name
Mercurey „Clos Rochette“ Domaine Faiveley, the year 2013. The participants were told,
that a bottle of this wine (0,75 liters) cost 519 CZK (19,2 €). During the introduction, some
information was following the original label of the bottle (like color), but it was also
combined with information about Mercurey „Clos Rochette,“ to make the wine more
interesting and attractive.
The third wine sample took better place on the evaluation scale than the previous two,
and overall it took the second place out of all wines presented. Its flavor received average
rating 2,48, and its bouquet received slightly better rating 2,39 and an average rating of
the overall impression was 2,30.
This wine received a better rating than the previous two. Also, the price participants
would be willing to pay for it grew significantly. An average acceptable price for a bottle
of Mercurey „Clos Rochette“ was 185 CZK (6,85 €) and 20 participants would be willing
to buy it, including one response “probably” and one “maybe”. One respondent did not
state any price and therefore was not included in the calculation of the average price.
Despite the fact, that the acceptable price rose significantly with this wine, it was still
much lower than the price we claimed this wine to have during the introduction.
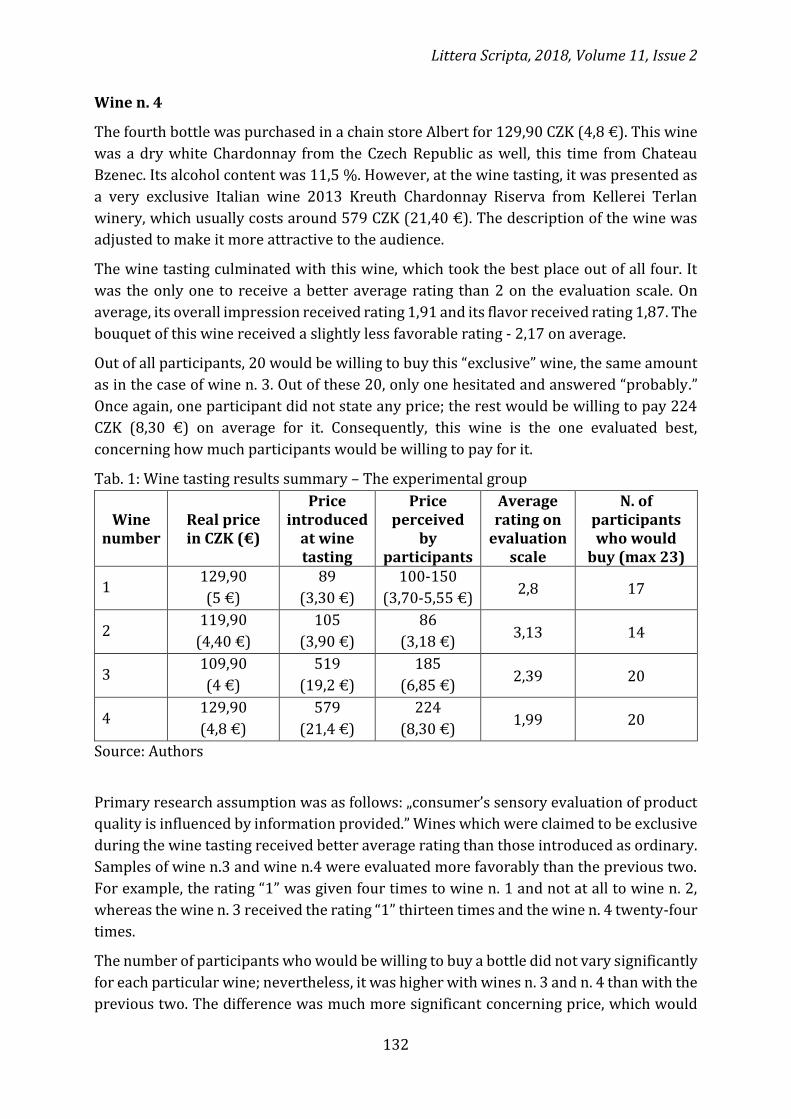
Littera Scripta, 2018, Volume 11, Issue 2
132
Wine n. 4
The fourth bottle was purchased in a chain store Albert for 129,90 CZK (4,8 €). This wine
was a dry white Chardonnay from the Czech Republic as well, this time from Chateau
Bzenec. Its alcohol content was 11,5 %. However, at the wine tasting, it was presented as
a very exclusive Italian wine 2013 Kreuth Chardonnay Riserva from Kellerei Terlan
winery, which usually costs around 579 CZK (21,40 €). The description of the wine was
adjusted to make it more attractive to the audience.
The wine tasting culminated with this wine, which took the best place out of all four. It
was the only one to receive a better average rating than 2 on the evaluation scale. On
average, its overall impression received rating 1,91 and its flavor received rating 1,87. The
bouquet of this wine received a slightly less favorable rating - 2,17 on average.
Out of all participants, 20 would be willing to buy this “exclusive” wine, the same amount
as in the case of wine n. 3. Out of these 20, only one hesitated and answered “probably.”
Once again, one participant did not state any price; the rest would be willing to pay 224
CZK (8,30 €) on average for it. Consequently, this wine is the one evaluated best,
concerning how much participants would be willing to pay for it.
Tab. 1: Wine tasting results summary – The experimental group
Wine number
Real price in CZK (€)
Price introduced
at wine tasting
Price perceived
by participants
Average rating on
evaluation scale
N. of participants who would
buy (max 23)
1 129,90
(5 €)
89
(3,30 €)
100-150
(3,70-5,55 €) 2,8 17
2 119,90
(4,40 €)
105
(3,90 €)
86
(3,18 €) 3,13 14
3 109,90
(4 €)
519
(19,2 €)
185
(6,85 €) 2,39 20
4 129,90
(4,8 €)
579
(21,4 €)
224
(8,30 €) 1,99 20
Source: Authors
Primary research assumption was as follows: „consumer’s sensory evaluation of product
quality is influenced by information provided.” Wines which were claimed to be exclusive
during the wine tasting received better average rating than those introduced as ordinary.
Samples of wine n.3 and wine n.4 were evaluated more favorably than the previous two.
For example, the rating “1” was given four times to wine n. 1 and not at all to wine n. 2,
whereas the wine n. 3 received the rating “1” thirteen times and the wine n. 4 twenty-four
times.
The number of participants who would be willing to buy a bottle did not vary significantly
for each particular wine; nevertheless, it was higher with wines n. 3 and n. 4 than with the
previous two. The difference was much more significant concerning price, which would
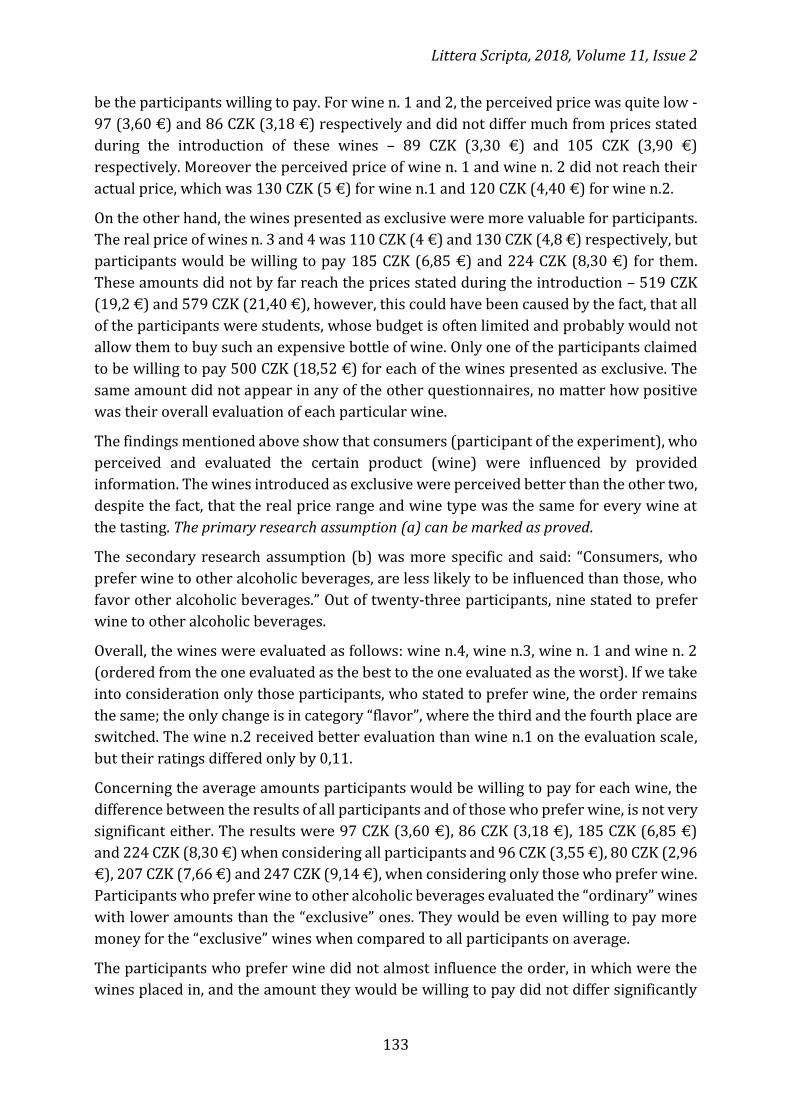
Littera Scripta, 2018, Volume 11, Issue 2
133
be the participants willing to pay. For wine n. 1 and 2, the perceived price was quite low -
97 (3,60 €) and 86 CZK (3,18 €) respectively and did not differ much from prices stated
during the introduction of these wines – 89 CZK (3,30 €) and 105 CZK (3,90 €)
respectively. Moreover the perceived price of wine n. 1 and wine n. 2 did not reach their
actual price, which was 130 CZK (5 €) for wine n.1 and 120 CZK (4,40 €) for wine n.2.
On the other hand, the wines presented as exclusive were more valuable for participants.
The real price of wines n. 3 and 4 was 110 CZK (4 €) and 130 CZK (4,8 €) respectively, but
participants would be willing to pay 185 CZK (6,85 €) and 224 CZK (8,30 €) for them.
These amounts did not by far reach the prices stated during the introduction – 519 CZK
(19,2 €) and 579 CZK (21,40 €), however, this could have been caused by the fact, that all
of the participants were students, whose budget is often limited and probably would not
allow them to buy such an expensive bottle of wine. Only one of the participants claimed
to be willing to pay 500 CZK (18,52 €) for each of the wines presented as exclusive. The
same amount did not appear in any of the other questionnaires, no matter how positive
was their overall evaluation of each particular wine.
The findings mentioned above show that consumers (participant of the experiment), who
perceived and evaluated the certain product (wine) were influenced by provided
information. The wines introduced as exclusive were perceived better than the other two,
despite the fact, that the real price range and wine type was the same for every wine at
the tasting. The primary research assumption (a) can be marked as proved.
The secondary research assumption (b) was more specific and said: “Consumers, who
prefer wine to other alcoholic beverages, are less likely to be influenced than those, who
favor other alcoholic beverages.” Out of twenty-three participants, nine stated to prefer
wine to other alcoholic beverages.
Overall, the wines were evaluated as follows: wine n.4, wine n.3, wine n. 1 and wine n. 2
(ordered from the one evaluated as the best to the one evaluated as the worst). If we take
into consideration only those participants, who stated to prefer wine, the order remains
the same; the only change is in category “flavor”, where the third and the fourth place are
switched. The wine n.2 received better evaluation than wine n.1 on the evaluation scale,
but their ratings differed only by 0,11.
Concerning the average amounts participants would be willing to pay for each wine, the
difference between the results of all participants and of those who prefer wine, is not very
significant either. The results were 97 CZK (3,60 €), 86 CZK (3,18 €), 185 CZK (6,85 €)
and 224 CZK (8,30 €) when considering all participants and 96 CZK (3,55 €), 80 CZK (2,96
€), 207 CZK (7,66 €) and 247 CZK (9,14 €), when considering only those who prefer wine.
Participants who prefer wine to other alcoholic beverages evaluated the “ordinary” wines
with lower amounts than the “exclusive” ones. They would be even willing to pay more
money for the “exclusive” wines when compared to all participants on average.
The participants who prefer wine did not almost influence the order, in which were the
wines placed in, and the amount they would be willing to pay did not differ significantly

Littera Scripta, 2018, Volume 11, Issue 2
134
with “ordinary” wines while being even higher with the “exclusive” ones. Therefore, the
secondary research assumption (b) must be marked as disproved.
Control group
As mentioned above, the wine tasting was replicated in order to verify its results. The
control group also consisted of 23 participants. Unlike the experimental group, these
participants were not provided with any information about the wines they tasted. The aim
was to find out, whether the control group would perceive and evaluate the wines
differently, then the experimental group.
Wine n. 1
Wine n.1 took the third place in all categories (overall impression, flavor and bouquet)
when evaluated by the experimental group. The control group evaluated it much better,
and it took the first place. However, unlike the winner of experimental wine tasting (wine
n. 4), the winner of the control wine tasting (wine n. 1) did not surpass rating 2 on the
evaluation scale. The average rating of its overall impression and flavor was 2 and its
bouquet received rating 2,29. The majority of participants (22 out of 23) would purchase
this wine, the amount they would be willing to pay for a bottle ranged from 70 CZK (2,59
€) to 200 CZK (7,40 €). The average amount was 105 CZK (3,89 €).
Wine n. 2
The wine n. 2 took the last place when evaluated by the experimental group, and it
remained in this position when evaluated by the control group. Moreover, its rating
worsened in categories of overall impression and flavor. The former received rating 3
with the experimental group and 3,73 with the control group, the latter received rating
3,13 with the experimental group and 3,67 with the control group. The bouquet received
better rating 2,43 with the control group and took second place in this category.
Only five participants would purchase a bottle of the wine n. 2 and would be willing to
spend 95 CZK (3,52 €) on it. This amount is similar to the other wines.
Wine n. 3
This wine was introduced as exclusive during the experimental wine tasting and took
second place in all categories. The control group, who did not receive any information
about it, evaluated it worse. The overall impression and flavor of this wine received
average rating 2,73 and 2,60 respectively and this wine took the third place in those
categories. Concerning a bouquet, it took the last place with average rating 2,87.
Wine n.3 did not; however, fare badly concerning the other part of the evaluation.
Fourteen out of twenty-three respondents would purchase it and would be willing to pay
94 CZK (3,48 €) on average for it.
Wine n. 4
This wine was also introduced as an exclusive during the experimental wine tasting and
took the first place, based on its rating on evaluation scale (it received ratings 1,91; 1,87

Littera Scripta, 2018, Volume 11, Issue 2
135
and 2,17). While evaluated by the control group, the ratings it received were much worse.
Its overall impression received rating 2,40 and its flavor received rating 2,47 and wine n.4
took the second place in those categories – only one place below the previous tasting, but
the ratings are significantly worse. Wine n. 4 received even worse rating 2,73 concerning
its bouquet and took the third place in this category.
Seventeen participants would purchase a bottle of this wine and on average would be
willing to spend 93 CZK (3,44 €) on it.
Tab. 2: Wine tasting results summary – control group
Wine number
Price perceived by participants
Place in evaluation
Average rating on evaluation scale
N. of participants who would buy
(max 23)
1 105
(389 €) 1 2,09 22
2 95
(3,52 €) 4 3,27 5
3 94
(3,48 €) 3 2,73 14
4 93
(3,44 €) 2 2,53 17
Source: Authors
Discussion
The wine n. 3 and the wine n. 4 were introduced as exclusive at the first wine tasting. As
mentioned above, the wine n. 4 received rating “1” the most with the experimental group.
It received this rating twenty-four times. This amount represents 34,78 % of all ratings
this wine received.
The participants of the second wine tasting were much more restrained when rating these
two wines. The wine n. 4 received rating “1” only three times, which is 4,44% of all ratings
this wine received.
There was almost no difference between the amounts participants would be willing to
spend on individual wines at the control wine tasting. It is important to note, that only five
participants would be willing to buy the wine n. 2. This does not, however, change the fact
that the participants would be willing to pay relatively similar amounts for individual
wines when having no information about them. The situation was completely different at
the first wine tasting. The experimental group was willing to pay larger amounts for wines
they believed to be exclusive and expensive.
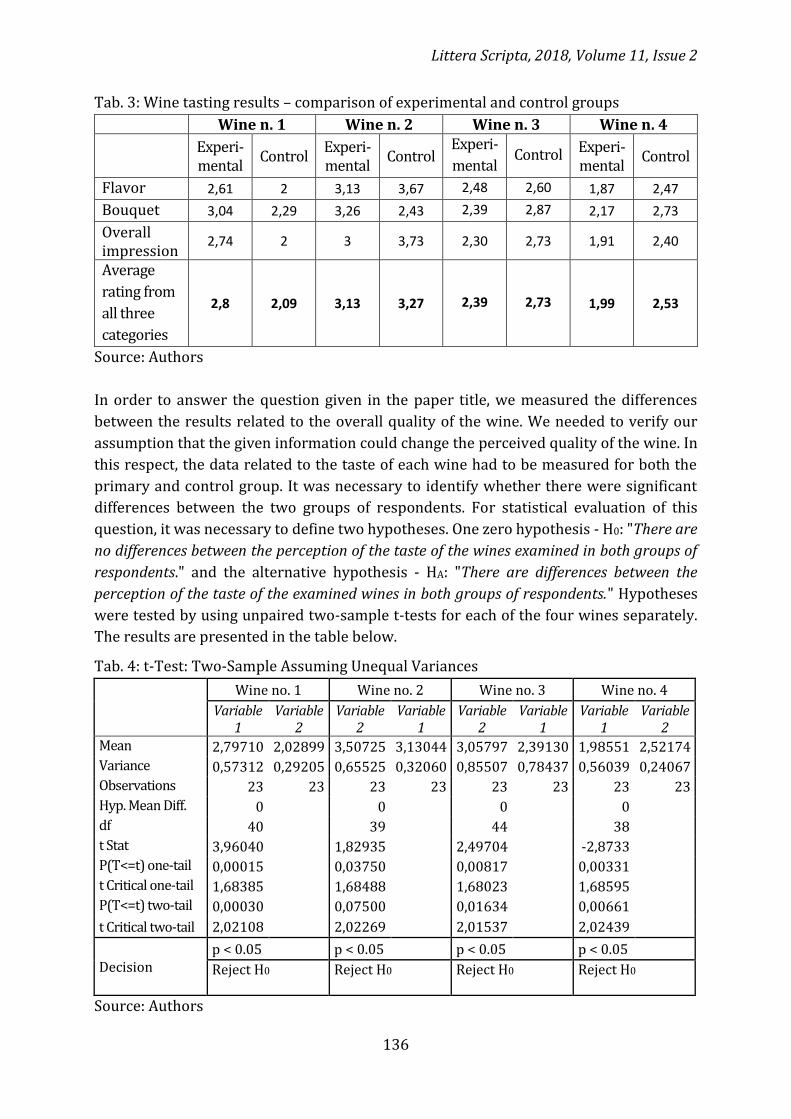
Littera Scripta, 2018, Volume 11, Issue 2
136
Tab. 3: Wine tasting results – comparison of experimental and control groups
Wine n. 1 Wine n. 2 Wine n. 3 Wine n. 4
Experi-mental
Control Experi-mental
Control Experi-
mental Control Experi-
mental Control
Flavor 2,61 2 3,13 3,67 2,48 2,60 1,87 2,47
Bouquet 3,04 2,29 3,26 2,43 2,39 2,87 2,17 2,73
Overall impression
2,74 2 3 3,73 2,30 2,73 1,91 2,40
Average
rating from
all three
categories
2,8 2,09 3,13 3,27 2,39 2,73 1,99 2,53
Source: Authors
In order to answer the question given in the paper title, we measured the differences
between the results related to the overall quality of the wine. We needed to verify our
assumption that the given information could change the perceived quality of the wine. In
this respect, the data related to the taste of each wine had to be measured for both the
primary and control group. It was necessary to identify whether there were significant
differences between the two groups of respondents. For statistical evaluation of this
question, it was necessary to define two hypotheses. One zero hypothesis - H0: "There are
no differences between the perception of the taste of the wines examined in both groups of
respondents." and the alternative hypothesis - HA: "There are differences between the
perception of the taste of the examined wines in both groups of respondents." Hypotheses
were tested by using unpaired two-sample t-tests for each of the four wines separately.
The results are presented in the table below.
Tab. 4: t-Test: Two-Sample Assuming Unequal Variances
Wine no. 1 Wine no. 2 Wine no. 3 Wine no. 4
Variable 1
Variable 2
Variable 2
Variable 1
Variable 2
Variable 1
Variable 1
Variable 2
Mean 2,79710 2,02899 3,50725 3,13044 3,05797 2,39130 1,98551 2,52174
Variance 0,57312 0,29205 0,65525 0,32060 0,85507 0,78437 0,56039 0,24067
Observations 23 23 23 23 23 23 23 23
Hyp. Mean Diff. 0 0 0 0
df 40 39 44 38
t Stat 3,96040 1,82935 2,49704 -2,8733
P(T<=t) one-tail 0,00015 0,03750 0,00817 0,00331
t Critical one-tail 1,68385 1,68488 1,68023 1,68595
P(T<=t) two-tail 0,00030 0,07500 0,01634 0,00661
t Critical two-tail 2,02108 2,02269 2,01537 2,02439
Decision p < 0.05 p < 0.05 p < 0.05 p < 0.05
Reject H0
Reject H0
Reject H0
Reject H0
Source: Authors
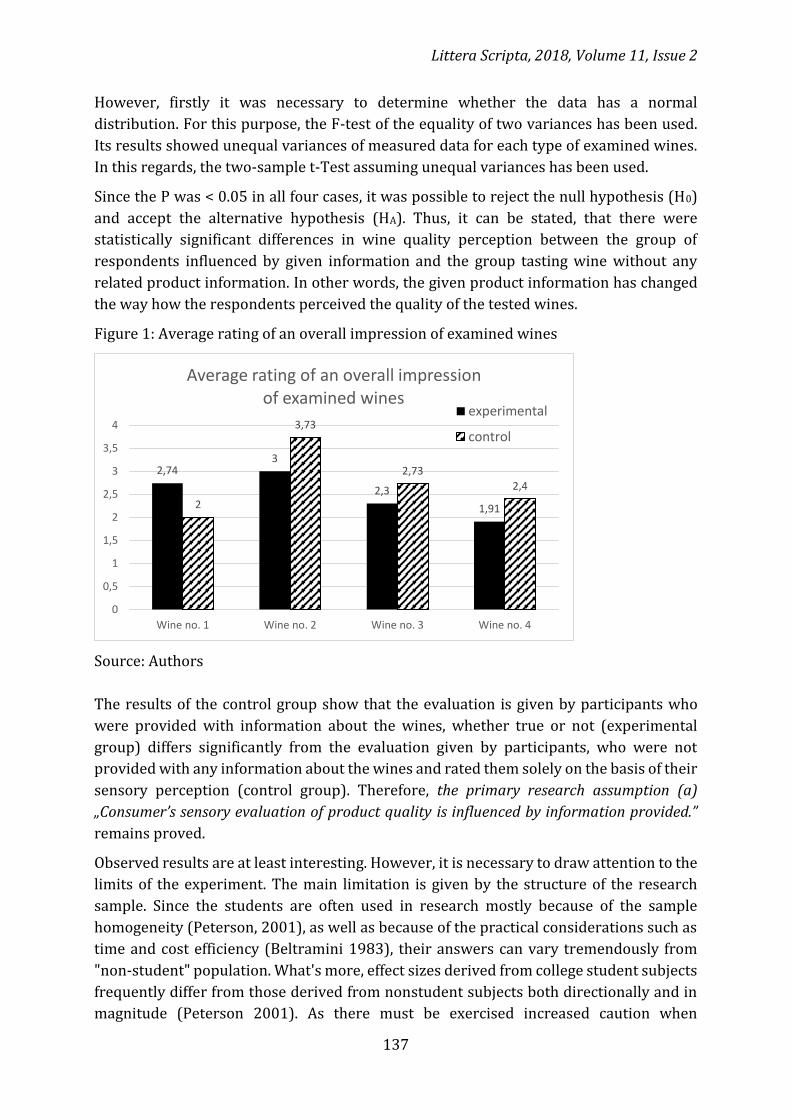
Littera Scripta, 2018, Volume 11, Issue 2
137
However, firstly it was necessary to determine whether the data has a normal
distribution. For this purpose, the F-test of the equality of two variances has been used.
Its results showed unequal variances of measured data for each type of examined wines.
In this regards, the two-sample t-Test assuming unequal variances has been used.
Since the P was < 0.05 in all four cases, it was possible to reject the null hypothesis (H0)
and accept the alternative hypothesis (HA). Thus, it can be stated, that there were
statistically significant differences in wine quality perception between the group of
respondents influenced by given information and the group tasting wine without any
related product information. In other words, the given product information has changed
the way how the respondents perceived the quality of the tested wines.
Figure 1: Average rating of an overall impression of examined wines
Source: Authors
The results of the control group show that the evaluation is given by participants who
were provided with information about the wines, whether true or not (experimental
group) differs significantly from the evaluation given by participants, who were not
provided with any information about the wines and rated them solely on the basis of their
sensory perception (control group). Therefore, the primary research assumption (a)
„Consumer’s sensory evaluation of product quality is influenced by information provided.”
remains proved.
Observed results are at least interesting. However, it is necessary to draw attention to the
limits of the experiment. The main limitation is given by the structure of the research
sample. Since the students are often used in research mostly because of the sample
homogeneity (Peterson, 2001), as well as because of the practical considerations such as
time and cost efficiency (Beltramini 1983), their answers can vary tremendously from
"non-student" population. What's more, effect sizes derived from college student subjects
frequently differ from those derived from nonstudent subjects both directionally and in
magnitude (Peterson 2001). As there must be exercised increased caution when
2,743
2,3
1,912
3,73
2,73
2,4
0
0,5
1
1,5
2
2,5
3
3,5
4
Wine no. 1 Wine no. 2 Wine no. 3 Wine no. 4
Average rating of an overall impression of examined wines
experimental
control
Littera Scripta, 2018, Volume 11, Issue 2
138
attempting to extend any relationship found using college student subjects to a "non-
student" population, a generalization of our results would be inappropriate.
Also, another limitation is given by the way how the product information were
distributed. The information about individual wines was presented verbally to the
participants. The personality of a presenter has a significant impact on the face-to-face
part of marketing communication, and this impact must be taken into consideration
concerning this experiment as well. Further research would show, whether a written text
would influence the participants in the same way. Furthermore, it would be desirable to
repeat the experiment on different types of respondent groups to be able to make reliable
general conclusions.
Conclusion
Despite the limitations as mentioned above, this research is an interesting insight into the
impact information has on the wine market. The extent of the impact of marketing
communication on consumer preferences is a topic, which has been discussed on a long-
term basis. The research results can help to form a better marketing communication mix
in relation to both integrated marketing communications (Reid et al. 2001) and wine
selling.
From the scientific point of view, the research results, regardless of the need of
replication, expand and specify the existing theoretical knowledge in the fields of
consumer behavior rationality and impact of information on consumer preferences. It can
be assumed, that to recognize a good wine could be difficult for an average consumer and
the research results would be thus applicable to a narrow group of product types.
However, parallels are easy to find, for example with common products like coffee or tea.
A parallel situation could also be a case, when a new product enters the market or when
consumers are just familiarizing with some product. It is safe to assume, that in this case,
the information input would have a significant impact on the consumer as well.
References
ASHENFELTER, O., 2008. Predicting the quality and prices of Bordeaux wine. The
Economic Journal. 118(529), F174-F184. ISSN 1468-0297.
BELTRAMINI, R. F., 1983. Student surrogates in consumer research. Journal of the
Academy of Marketing Science. 11(4), 438-443. ISSN 0092-0703.
BEVERLAND, M. B., 2004. An exploration of the luxury wine trade. International Journal
of Wine Marketing. 16(3), 14-28. ISSN 0954-7541.
CAPEHART, K. W., 2015. Fine water: A hedonic pricing approach. Journal of Wine
Economics. 10(02), 129-150. ISSN 1931-4361.
DURLAUF, S. N. and L. Blume (Eds.), 2008. "rationality" The new Palgrave dictionary of
economics (Vol. 6, 631-34). Basingstoke: Palgrave Macmillan. ISBN 978-0-333-78676-5.
Littera Scripta, 2018, Volume 11, Issue 2
139
KOUKOLÍK, F., 2010. Mocenská posedlost. Praha: Karolinum. ISBN 978-80-246-1825-8.
KOUKOLÍK, F. and J. DRTILOVÁ, 2008. Vzpoura deprivantů: Nestvůry, nástroje, obrana.
Praha: Galén. ISBN 978-80-7262-410-2.
LECOCQ, S. and M. VISSER, 2006. What determines wine prices: Objective vs. sensory
characteristics. Journal of Wine Economics. 1(01), 42-56. ISSN 1931-4361.
MUELLER, P. K., 2014. Bamboozled: What happens when a 'thirty-seven-fifty' bottle of
wine really costs $3,50 nj. com True Jersey. [online]. [accessed: 2017-01-04]. Available at:
http://www.nj.com/business/index.ssf/2014/11/bamboozled_what_happens_when_a_
3750_bottle_of_wine_really_costs_3750.html.
PETERSON, R. A., 2001. On the use of college students in social science research: Insights
from a second-order meta-analysis. Journal of Consumer Research. 28(3), 450-461. ISSN
0093-5301.
REID, M. et al. 2001. Integrated marketing communications in the Australian and New
Zealand wine industry. International Journal of Advertising. 20(2), 239-262. ISSN 0265-
0487.
SIMON, H. A., 1955. A behavioral model of rational choice. The Quarterly Journal of
Economics. 69(1), 99-118. ISSN 0033-5533.
SIMON, H. A., 1982. Models of bounded rationality: Empirically grounded economic reason
(Vol. 3). Cambridge: MIT Press. ISBN 978-0262519434.
SUTHERLAND, S., 1992. Irrationality: The enemy within. London: Constable. ISBN 978-
0094712201
ZÁVODNÝ P., J. and V. KOZÁK, 2013. Racionální spotřebitelské chování a vliv iracionality.
Zlín: VeRBuM. ISBN 978-80-875-0033-0.
Littera Scripta, 2018, Volume 11, Issue 2
140
Contact address of the authors:
PhDr. Jan Závodný Pospíšil, Ph.D., University of Economics, Prague, Department of
Management, Jarošovská 1117/II, Jindřichův Hradec, Czech Republic; e-mail:
Ing. et Ing. Lucie Sára Závodná, Ph.D., University of Economics, Prague, Department of
Management, Jarošovská 1117/II, Jindřichův Hradec, Czech Republic; e-mail:
Monika Václavíková, Palacky University Olomouc, Faculty of Arts, Křížkovského 511/8,
CZ-771 47 Olomouc, Czech Republic; e-mail: [email protected].
ZÁVODNÝ POSPÍŠIL, J., L. S. ZÁVODNÁ and M. VÁCLAVÍKOVÁ, 2018. Does a
Label Have a Taste? Available Information and their Effect on the Perceived
Quality of Wine by Czech Students. Littera Scripta [online]. České Budějovice:
Institute of Technology and Business in České Budějovice, 11(2), 127-140
[accessed: 2018-12-20]. ISSN 1805-9112. Available at:
http://journals.vstecb.cz/category/littera-scripta/11-rocnik-2018/2_2018/.

141
The Size of Government in Empirical Research: A Case Study
from the Czech Republic
Václav Rybáček
Jan Evangelista Purkyne University in Usti nad Labem
Abstract
The aim of this paper is to discuss the substance of macroeconomic aggregates that
are commonly used in empirical research to express the size of government. Although
public sector aggregates normally provide a basis for the assessment of the size of
government, there are broader aggregates that capture the scope of government more
realistically. This paper presents the relevant statistical concepts, the current state of
methodology, as well as discusses the degree of instability in existing methodology
and its effect on the robustness of empirical research findings and recommendations.
In addition, this paper, on the basis of currently available data, demonstrates the
extent of the differences between these statistical concepts in terms of monetary
values as well as numbers of employees. The results not only show that the size of
government is much larger than estimated, but that it can also have far-reaching
consequences for both economic policy and economic research.
Keywords: size of government, public sector, national accounts, total revenues, total
expenditures.

Littera Scripta, 2018, Volume 11, Issue 2
142
Introduction
Research into how to determine the optimal size of government through analyses of
macroeconomic aggregates has become one of the major topics of economic research and
political economy. Researchers focus, inter alia, on the impact of government on economic
growth, the economic cycle, unemployment and/or the rate of inflation1. The majority try
to provide answers to questions such as what is the optimal size of government
compatible with the highest possible rate of sustainable economic growth accompanied
by high utilisation of the labour force and a low rate of inflation. When investigating the
macroeconomic causal relations just mentioned, aggregates as provided by the national
accounting model are customarily exploited and analysed.
Although all macroeconomic aggregates could be critically examined, our primary focus
is on the ways in which the size of government is or can be expressed, as well as the
robustness of the relevant definitions underlying these measurements. This is of great
importance because the substance of aggregates, as well as the lack of a clear-cut
definition in the methodology, usually goes unnoticed by researchers who use
macroeconomic aggregates in their work. It therefore comes as no surprise that adjectives
such as “public”, “government” or even “state” are generally considered to have a similar
or even the same meaning. However, from the statistical point of view there are
substantial differences2 that imply differentiating explanatory power. Simply put, the
central issue is which (public) institutions should be counted as being part of government
and therefore contributing to its size, and which should not.
Macroeconomic models such as national accounts or Government Finance Statistics (GFS)
provide relevant data for all of these levels of aggregation (public/government/state). It
is subsequently up to a researcher to decide which data to use for empirical examination.
Currently, researchers customarily reach for government sector data (government) and
use it as a proxy for the size of government. One serious objection can be raised against
this approach. As will be shown later, the government sector constitutes only a part of the
entire public sector. As a result, data for this sector to a certain extent underestimates the
overall hold of government over an economy. This implies that using data for the public
sector as a whole can put the size of government in a very different perspective.
On the top of this, relevant definitions of the public or government sector are not deep-
seated; they are the subjects of continuous methodological changes bringing frequent
revisions. This is, of course, a serious matter, since instability and uncertainty regarding
the adequacy of the definitions naturally determines the reliability of quantifications
(Morgenstern, 1963) and hence the robustness of the conclusions of empirical analyses.
To demonstrate the differences quantitatively, we will use the national accounts data for
the Czech Republic to show uncertainties embedded in the macroeconomic aggregates.
1 An in-depth overview of scientific works on the topic can be found in, for example, Zimčík (2016), Chobanov and Mladenova (2009) or Bergh and Henrekson (2011). 2 Rybacek and Vebrova (2018)
Littera Scripta, 2018, Volume 11, Issue 2
143
Use of data in empirical research
It is informative to first take a brief look at the use of macroeconomic aggregates in
economic research and some of the conclusions drawn. Government size is often
estimated on the basis of the final consumption of government institutions, i.e. the
transactions in final products by government institutions. Using the ratio between the
final consumption of government institutions and GDP, Barro (1989) concluded that the
optimal government size is 25% of GDP. On the basis of the same approach, Günalp and
Dincer (2005) found the optimal size of government to be 17.3% of GDP, whereas
Chobanov and Mladenova (2008) found it to be 10.4%. Among the many others
expressing the size of government in the same way, we can refer to the works of Landau
(1983) and Cameron (1982).
An even wider range of empirical studies utilise total revenues or total expenditures to
express the size of a government, which – especially due to the inclusion of transfers –
represent a wider concept than that of final consumption. Gwartney, Lawson and
Holcombe (1998), who found a negative relationship between the size of government and
economic growth, used total government expenditure in terms of GDP as a proxy for the
size of government. Similarly, Garrett and Rhine (2006), Altunc and Aydin (2013), Alfonso
and Furceri (2010), Bergh and Karlsson (2010) and Marlow (1983) analysed data on total
expenditures or total revenues of governments. As the government sector is
predominantly financed by taxes or quasi-taxes, total tax revenues can only replace the
aggregate of total revenues in exceptional cases. This is the case in Fölster and Henreksson
(2001), Colombier (2009) and Agell-Ohlsson-Thoursie (2006).
Due to the scope of the research carried out in this area, we can provide only a partial
listing of the studies addressing these questions. Still, this brief overview tellingly
illustrates not only the intensity of the use of national accounts aggregates, but also the
heterogeneity of the expression of the size of government. For our further discussion, it is
however important to emphasise the fact that all of the aforementioned indicators are
built on the same population of institutions, which are identified by the national
accounting methodology under the adjective “government”.
Statistical concepts
Statistical systems work with several concepts that are meant to describe economic
behaviour and the size of the public sector. The narrowest concept, which any discussion
on the size of the public sector must take into account, is the notion of the State. On a
statistical level it covers entities known as organisational bodies of the state. Historically,
these are institutions with a monopolistic right to apply legitimate force (Weber, 1984),
which can obtain finances based on the taxation of their subordinated citizens. The
revenues and expenditures of these units go directly through the state budget, with their
final balance affecting the balance sheet of the State.

Littera Scripta, 2018, Volume 11, Issue 2
144
With the growth in the past few decades in the number of institutions derived from the
state, the population of state organisations became insufficient to capture the true size of
the public sector (Sennholz, 1987). A shift towards the network-based securing of public
services and property (Goldsmith and Eggers, 2004) via institutions derived from the
state necessitated a wider definition thereof to be translated into the concept of the
government sector; the government sector now therefore includes all so-called public
non-market producers3.
Under the current methodology, the creators of manuals make a step further by defining
the so-called public sector. This macroeconomic entity captures not only government
units, i.e. institutions grouped in the government sector, but also public institutions
supposedly operating on a market-oriented basis, as well as the central bank, which, by
definition, constitutes a separate subsector of the financial entity. The reason for the
methodological delineation of the public sector is that it supposedly better reflects the
actual impact of the government on the economy4.
The delineation of the public sector and its relation to the government institutions sector
is illustrated in the following diagram:
Figure 1: Structure of the public sector in national accounts
Non-financial
corporations
Financial
institutions
Government
institutions
Non-profit
institutions
serving
households
Households
Public Public Public Private Private
Private Private
Source: ESA2010
As the diagram shows, the public sector represents the widest level of aggregation of
public entities and covers both the government institutions sector, whose aggregates
primarily serve as the input for empirical studies, as well as public non-financial
companies and public financial institutions, which are controlled by government
institutions. One necessary, but inadequate, condition for including a public body outside
the government institutions sector is a sufficient level of decision-making autonomy that
would allow us to consider it an independent institutional unit5. For completeness, it
3 For a definition of the sector, see ESA2010 par. 20.05-20.07. The public institutions sector is furthermore divided into the subsector of central public institutions, local public institutions and social security funds, see par. 2.111-2.117 ESA2010. 4 SNA2008, par. 22.6 states that “it is hence useful to create a sector consisting of all units in the public institutions sector and all public corporations in order to analyse the total impact of the government on the economy.” 5 See par. 2.12 ESA2010.

Littera Scripta, 2018, Volume 11, Issue 2
145
needs to be added that by definition the public sector does not include non-profit
institutions serving households6, households, and, based on convention, also does not
include non-residential entities owned by residential public entities7.
As it has been made clear, the public sector is divided between two basic parts, the
government sector, including non-market public units, and the rest of the public sector,
including public units whose behaviour is akin to private market producers. As a result, a
public institution operating on a market-oriented basis, as it is treated in the
methodology, adds to the “size of government” only in terms of its transactions with
government institutions, or through its assets and liabilities where a government
institution is a counterparty.
With this, we are approaching one of the methodological sources for the underestimation
of the size of government in statistics, which is the treatment of market behaviour in the
statistical methodology. Evidently, the way the methodology assesses market behaviour
is of key importance, which is briefly discussed further on. At this point however, it is
important to keep in mind that the size of the economic sphere governed by political
forces might be presented on several levels of aggregation. This can be illustrated by the
differences between all the concepts in terms of the number of institutions.
Table 1: State, government institutions, public sector, Czech Republic, 2017
Source: Business register
It is worth adding that although the number of organisational units of the State is
comparatively low (278), they manage most of the revenues and expenditures of the
public sector.
Discussion of the boundaries of macroeconomic entities
As mentioned in the previous section, the scope of the government institutions sector is
fundamentally influenced by the methodical description of market behaviour in the
SNA2008 and ESA2010 national accounting manuals (including the follow-up manual
specifically covering government deficit and debt). The method used to delineate the non-
6 In case of public control of a non-profit institution for households, this is a public non-market producer which must, by definition, be included in the sector of public institutions. 7 A statistical image of the public sector as a whole is furthermore influenced by objective limits during the creation of macroeconomic statistics. These include first and foremost the convention of including an economic unit in only a single institutional sector, whereas the decision on which sector it is included in is predominantly based on majority ownership. As a result, this leads to the over- or undervaluation of the size of the public sector, the scope of which is de-facto unquantifiable due to not taking into account the ownership of shares by public institutions.
Number of
institutions
Organisational units of the State 278
Government institutions (government sector) 18,094
Public sector 19,269
Littera Scripta, 2018, Volume 11, Issue 2
146
market sphere has gone through significant changes since the first methodologies for
national accounts were released.
At present, the public sector itself is delineated via the application of the concept of
control8, which generally represents the ability of government institutions to affect or
directly determine the policies of the given producer. If the given producer is owned or
otherwise significantly influenced by a government institution, for example, via specific
regulatory actions, then it is included in the public sector. The next step then assesses the
economic behaviour of the given public entity, i.e. whether it is considered a market or
non-market public producer. The market or non-market nature of the public entity is
assessed using a range of quantitative as well as qualitative criteria9.
The first (quantitative) criterion compares revenues with selected costs in order to arrive
at the conclusion if prices charged by a producer are economically significant or not10.
This criterion therefore assesses behaviour on the basis of the statistical analysis of prices.
A number of objections can be raised against this approach. First, the rule requires at least
50% of production costs to be covered by own revenues, i.e. without any specific financial
assistance received from the government. So, if only 51% of total revenues comes from
households as customers, which are free to decide whether to buy or not, and the
remainder is, for example, covered by the government to avoid losses, it is still sufficient
- from the methodological point of view - to consider the given public producer as a
market producer. This approach is highly questionable. The provision of subsidies to a
public producer provides little market incentive. Furthermore, the existing prices do not
reveal whether they are a result of the operation of market forces. Prices as a criterion for
the assessment of market behaviour are therefore more misleading than useful.
While in the ESA1995 methodology the quantitative criterion plays a dominant role, the
revised ESA2010 standard places more emphasis on qualitative criteria that primarily
target the motivational environment surrounding the given producer. Which sector a
public producer is placed in therefore depends on the existence of private competitors,
free entry into the given branch, the structure of customers in terms of economic sectors
or the transfer of risks associated with the performance of the given activity. This second
group of criteria requires profound analysis of the institutional environment in which
public units operate11. Although this approach is highly relevant, it stands on the
application of “soft criteria” which are the subjects of subjective assessments.
Irrespective of the treatment of market behaviour, the question still remains: Is the
division of the public sector into a market and non-market part for measuring government
8 Par. 20.18 and 20.306 ESA2010 9 Par. 3.27-3.41 ESA2010, MGDD section 1.2.4. 10 The notion of economically significant prices is defined in the par. 20.19 ESA, as “prices which have a substantial influence on the amounts of products producers are willing to supply and on the amounts of products that purchasers wish to acquire.” 11 This recent trend has led not only to an expansion of the government sector, but also to instability in the delimitation of sectors and ambiguities in international comparability. Simply put, pushing quantitative criteria to the background created the opportunity for subjective assessments and heterogeneity in the application of the rules.
Littera Scripta, 2018, Volume 11, Issue 2
147
size economically and analytically justifiable? In par. 22.6 of the SNA, the authors
implicitly admit that data for the public sector provide a more complete picture on the
influence of the government on the economic system. The separation of public entities
based on whether their behaviour follows market principles or not is therefore the subject
of ongoing methodological discussions and disputes. Patherine and Blades (1982)
emphasise the fact that the subject of the activities of these institutions is not
redistribution; their decision-making on production and prices is chiefly guided by the
market mechanism rather than controlled by political forces.
On the other hand, some authors view this concept as a weak point of the methodology as
well as of macroeconomic aggregates12. Public institutions always benefit from at least an
implicit guarantee from the government. The risk of going bankrupt is therefore
mitigated, thereby shaping its decision-making process as well as its innovativeness.
Besides, the control from the side of government also allows the government to effectively
implement its economic and social policies through the publicly controlled institutions -
with examples including public banks, public transport companies and public
infrastructure companies.
To divide the public sector between the market and the non-market sphere is therefore
highly questionable. International statistical authorities like the International Monetary
Fund or Eurostat have recently begun to appreciate the importance of getting the full
picture on the public sector. It is with this in mind that they launched a data collection
process the aim of which is to collate data on those public institutions, which in the
national accounts methodology are left out of the government sector and the size of
government.
Quantitative analysis
Different levels of aggregation can naturally provide a significantly different image of
economic behaviour or the impact of public entities on the economic system. This is
demonstrated here through an examination of the differences in the national accounting
data published by the Czech Statistical Office (hereinafter CZSO). Key indicators are
compared for the central government institutions subsector, such as the best
approximation of a state entity, the government institutions sector and the public sector
as a whole, whereby the data are taken from the satellite account published by the CSZO.
In this definition, the public sector also covers public financial institutions and especially
the central bank as the implementing body of economic monetary policies. With respect
to the need to have data on the impact of fiscal authorities, modified data will also be used
for the public sector that does not cover the impacts of monetary policies, represented
notably by the central bank13. Nevertheless, the analysis will focus first and foremost on
12 For instance Bajo and Primorac (2015), Stiglitz (1989), Sennholz (1987), DiLorenzo and Bennett (1983). 13 Even though the central bank is considered, by the national accounting methodology, a non-market producer and its production is appraised on the basis of its costs (ESA2010, p. 63), by convention it is also the only public non-market producer which is currently left outside the government institutions sector.
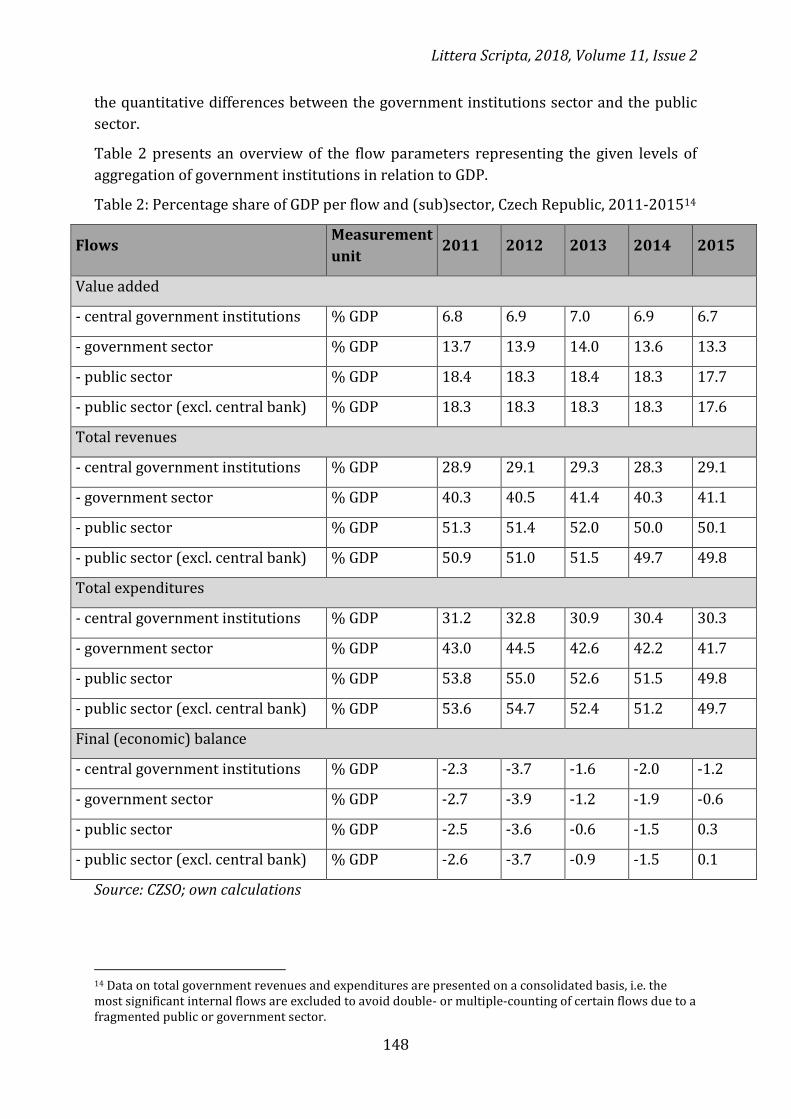
Littera Scripta, 2018, Volume 11, Issue 2
148
the quantitative differences between the government institutions sector and the public
sector.
Table 2 presents an overview of the flow parameters representing the given levels of
aggregation of government institutions in relation to GDP.
Table 2: Percentage share of GDP per flow and (sub)sector, Czech Republic, 2011-201514
Flows Measurement
unit 2011 2012 2013 2014 2015
Value added
- central government institutions % GDP 6.8 6.9 7.0 6.9 6.7
- government sector % GDP 13.7 13.9 14.0 13.6 13.3
- public sector % GDP 18.4 18.3 18.4 18.3 17.7
- public sector (excl. central bank) % GDP 18.3 18.3 18.3 18.3 17.6
Total revenues
- central government institutions % GDP 28.9 29.1 29.3 28.3 29.1
- government sector % GDP 40.3 40.5 41.4 40.3 41.1
- public sector % GDP 51.3 51.4 52.0 50.0 50.1
- public sector (excl. central bank) % GDP 50.9 51.0 51.5 49.7 49.8
Total expenditures
- central government institutions % GDP 31.2 32.8 30.9 30.4 30.3
- government sector % GDP 43.0 44.5 42.6 42.2 41.7
- public sector % GDP 53.8 55.0 52.6 51.5 49.8
- public sector (excl. central bank) % GDP 53.6 54.7 52.4 51.2 49.7
Final (economic) balance
- central government institutions % GDP -2.3 -3.7 -1.6 -2.0 -1.2
- government sector % GDP -2.7 -3.9 -1.2 -1.9 -0.6
- public sector % GDP -2.5 -3.6 -0.6 -1.5 0.3
- public sector (excl. central bank) % GDP -2.6 -3.7 -0.9 -1.5 0.1
Source: CZSO; own calculations
14 Data on total government revenues and expenditures are presented on a consolidated basis, i.e. the most significant internal flows are excluded to avoid double- or multiple-counting of certain flows due to a fragmented public or government sector.
Littera Scripta, 2018, Volume 11, Issue 2
149
With respect to production, i.e. based on the percentage share of GDP, available data show
less significant differences between the government institutions sector (13.3% in 2015)
and the public sector (17.7%). However, more significant differences can be seen in the
widely used analytical aggregates of total revenues and expenditures15. In 2015, total
public sector revenues represented 50.1 percentage points (hereinafter p.p.) of GDP, i.e.
10 p.p. more than the total revenues of the government institutions sector. With regards
to total expenditures, the public sector represented a share of 49.8 p.p. of GDP, which is
8.1 p.p. more than the government institutions sector.
Over the whole timeline, the share of public sector revenues in GDP was 10.3 p.p. higher
than the revenues of the government institutions sector. With respect to total
expenditures, the size of the public sector was on average 9.8 p.p. higher than that of the
government institutions sector. The concept of the public sector in national accounting
therefore identifies the size of the public sector as being an economically larger entity
than the government institutions sector, as described by the data used in empirical
research.
With respect to economic balance, used for instance to quantify fiscal impulses for the
purposes of implementing monetary policies, the data reveal differences both with
respect to the overall level and year-on-year changes. In 2015, a year-on-year comparison
showed a reduction in the definition of the government institutions sector by 1.3 p.p., and
in the case of the public sector, the scope of year-on-year improvement exceeded these
values by a further 0.5 p.p.
The change in the economic balance between the specified years also underwent
significant changes. While the balance in the government sector was 2.1 p.p. lower in 2015
than in 2011, in the public sector the economic balance underwent a change of +2.8 p.p.
Once the impact of the central bank policies is taken into account, this change can be
corrected to +2.7 p.p. The scope of the fiscal impulse therefore indicates significant
differences between the government institutions sector and the public sector.
Naturally, status parameters are also relevant for analysing the impact of the public sector
on the economy. Table 3 presents the percentage share of individual macroeconomic
entities in the ownership of assets, liabilities, including debts, and employment in the total
economy.
15 Total revenues and expenditures are quantified as per the definition listed in the ESA2010 manual, par. 20.76 and 20.92.
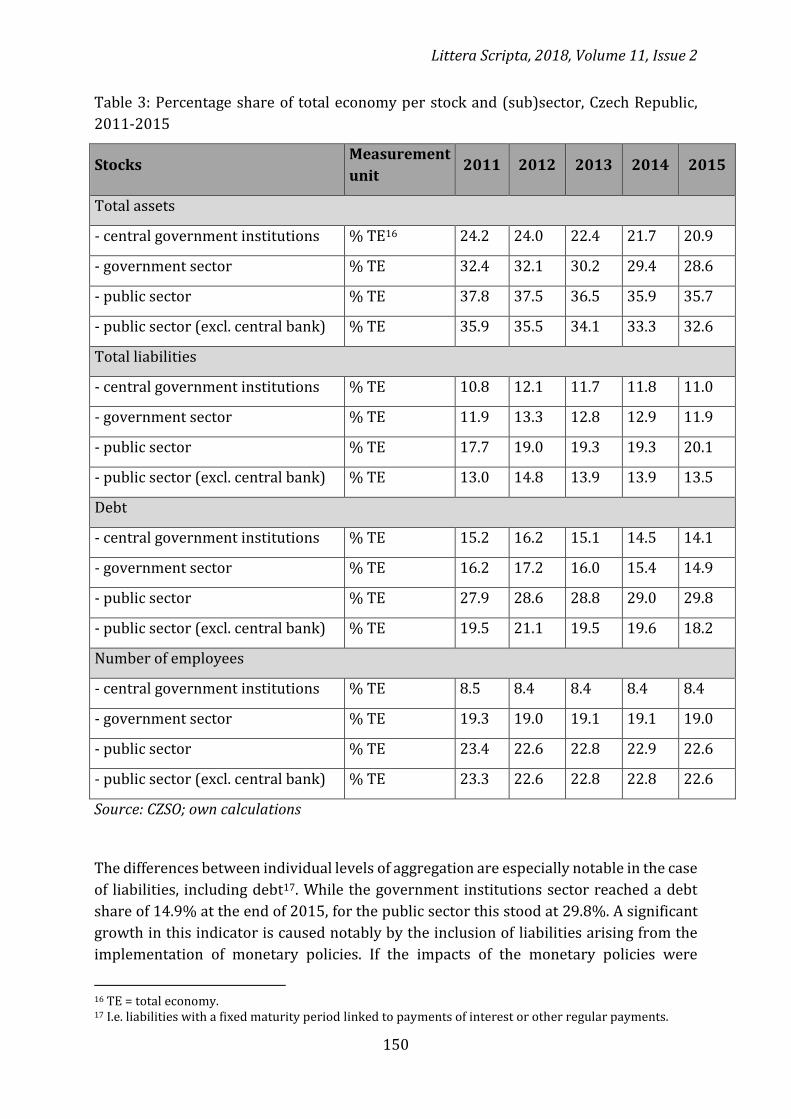
Littera Scripta, 2018, Volume 11, Issue 2
150
Table 3: Percentage share of total economy per stock and (sub)sector, Czech Republic,
2011-2015
Stocks Measurement
unit 2011 2012 2013 2014 2015
Total assets
- central government institutions % TE16 24.2 24.0 22.4 21.7 20.9
- government sector % TE 32.4 32.1 30.2 29.4 28.6
- public sector % TE 37.8 37.5 36.5 35.9 35.7
- public sector (excl. central bank) % TE 35.9 35.5 34.1 33.3 32.6
Total liabilities
- central government institutions % TE 10.8 12.1 11.7 11.8 11.0
- government sector % TE 11.9 13.3 12.8 12.9 11.9
- public sector % TE 17.7 19.0 19.3 19.3 20.1
- public sector (excl. central bank) % TE 13.0 14.8 13.9 13.9 13.5
Debt
- central government institutions % TE 15.2 16.2 15.1 14.5 14.1
- government sector % TE 16.2 17.2 16.0 15.4 14.9
- public sector % TE 27.9 28.6 28.8 29.0 29.8
- public sector (excl. central bank) % TE 19.5 21.1 19.5 19.6 18.2
Number of employees
- central government institutions % TE 8.5 8.4 8.4 8.4 8.4
- government sector % TE 19.3 19.0 19.1 19.1 19.0
- public sector % TE 23.4 22.6 22.8 22.9 22.6
- public sector (excl. central bank) % TE 23.3 22.6 22.8 22.8 22.6
Source: CZSO; own calculations
The differences between individual levels of aggregation are especially notable in the case
of liabilities, including debt17. While the government institutions sector reached a debt
share of 14.9% at the end of 2015, for the public sector this stood at 29.8%. A significant
growth in this indicator is caused notably by the inclusion of liabilities arising from the
implementation of monetary policies. If the impacts of the monetary policies were
16 TE = total economy. 17 I.e. liabilities with a fixed maturity period linked to payments of interest or other regular payments.
Littera Scripta, 2018, Volume 11, Issue 2
151
disregarded, the growth of the debt compared to the government institutions sector
would be 3.3 p.p. in the given year. With respect to ownership, the public sector´s
percentage share of total assets was 35.7% at the end of 2015, i.e. 7.1 p.p. more than the
percentage share of the government institutions sector.
As the level of aggregation increases, we see fluctuating increases of 5 to 8 p.p. in the
percentage share of total assets and liabilities. On the other hand, the data on percentage
shares in relation to total liabilities and debts show that the central government
institutions sector has a dominant position within the government institutions sector
when it comes to foreign sources of funding. The difference between both units amounts
to about 1 p.p. on average. However, the inclusion of public companies leads to a
significant increase in the percentage shares of the public sector, especially due to the
liabilities arising from the implementation of monetary policies. The data show that at the
end of 2015 the public sector´s share of the total volume of liabilities was 20.1%, and of
the volume of debt 29.8%.
Table 3 also illustrates the percentage shares of individual public sector units in the total
number of employees according to the national accounting concept. With respect to the
number of employees, differences that are more prominent are especially notable
between the central government institutions subsector and the government institutions
sector, on average by 10.7 p.p. This is predominantly caused by the fact that a range of key
activities undertaken by the government institutions sector, for example, individual
consumption services such as transportation, education or medical services, are provided
at a local level, which has an impact on the number of employees in local government
institutions. Extending the population of entities through the addition of public market
producers therefore further increases the percentage share of the public sector, but to a
lesser extent than is the case for flow- or state-based financial parameters.
The analysis of the data therefore illustrates significant differences between individual
macroeconomic units in terms of the percentage share of overall revenues and
expenditures in GDP, whereby the same also applies to total liabilities and debts. The data
describing the public sector according to the national accounting concept(s) provide(s) a
significantly different image of the scope of the flows passing through the public sector.
The same also goes for the financial position of the sector, as measured by the value of its
liabilities and debts. On the other hand, less profound differences can be found on the
basis of production indicators, indicators measuring the ownership of assets and the
number of employees. These show that the growing impact of the public sector need not
always be accompanied by an increase in the number of employees in the public sector.
Conclusion
The macroeconomic aggregates of national accounting utilised in empirical research to
express government size represent neither the sole nor the broadest means by which to
delineate the size of the public sector in an economic system. As shown, national
accounting works with several levels of public entity aggregation. The central government
Littera Scripta, 2018, Volume 11, Issue 2
152
institutions subsector is the narrowest and at the same time closest concept to the entity
referred to as the “State”. The wider group of government institutions then represents an
important subgroup of the public sector, but not the public sector as a whole, since the
methodology further divides the public sector into a market and non-market sphere. As a
result, the utilisation of data about the government institutions sector to estimate
government size in empirical research leads to an underestimation of the scope of
government influence on an economy. At the same time, it was shown that this statistical
underestimation is most prominent for the flow indicators of total revenues and
expenditures, which are predominantly used in empirical studies to estimate government
size.
References
AGELL, J., H. OHLSSON and P. THOURSIE, 2006. Growth Effects of Government
Expenditure and Taxation in Rich Countries: A Comment. European Economic Review,
50(1), 211–219. ISSN 0014-2921.
ALFONSO, A. and D. FURCERI, 2010. Government Size, Composition, Volatility and
EconomicGrowth. European Journal of Political Economy, 26(4), 517–532. DOI: 10.1016/j.
ejpoleco.2010.02.002. ALTUNC, F. and C. AYDIN, 2013. The Relation between Optimal Size of Government and Economic Growth: Empirical Evidence from Turkey, Romania and Bulgaria. Procedia - Social and Behavioral Sciences, 92(-), 6-75. ISSN 1877-0428. BAJO, A. and M. PRIMORAC, 2015. Should the Maastricht Fiscal Criteria be Redefined? Institute of Public Finance, Newsletter No. 99. BARRO, R. 1989. A Cross-Country Study of Growth, Saving and Government. NBER Working paper No. 2855. BERGH, A. and M. KARLSSON, 2010. Government Size and Growth: Accounting for Economic Freedom and Globalization. Public Choice, 142(1–2), 195–213. ISSN 0048-5829. CAMERON, D., 1982. On the Limits of the Public Economy. Annals of the Academy of Political and Social Science, 459(1), 46–62. ISSN 0002-7162. COLOMBIER, C., 2009. Growth Effects of Fiscal Policies: An Application of Robust Modified M-Estimator. Applied Economics, 41(7), 899–912. ISSN 0003-6846. DILORENZO, T. and J. BENNETT, 1983. Underground Government: The Off-Budget Public Sector. Cato Institute. ISBN 978-0932790378. EUROSTAT, 2013. European System of Accounts (ESA 2010). Luxembourg: Publication Office of the European Union. ISBN 978-92-79-31242-7.
Littera Scripta, 2018, Volume 11, Issue 2
153
EUROSTAT, 2016. Manual on Government Deficit and Debt. Luxembourg: Publication Office of the European Union. ISSN 2315-0815. FÖLSTER, S. and M. HENREKSON, 2001. Growth Effects of Government Expenditure and Taxation in Rich Countries. European Economic Review, 45(8), 1501–1520. ISSN 0014-2921. GARRETT, T. and R. RHINE, 2006. On the Size and Growth of Government. Federal Reserve Bank of St. Louis Review, 88(1), 13-30. ISSN 0014-9187. GOLDSMITH, S. and W. EGGERS, 2004. Governing by Network: The New Shape of the Public Sector. The Brooking Institute. ISBN 0-8157-3129-9. GÜNAPL, B. and O. Dincer, 2010. The Optimal Size of Government in Transition Countries. In: Progress in Economic Research, Vol. 15, New York. ISBN 978-1-60741-872-6. GWARTNEY, J., R. LAWSON and R. HOLCOMBE, 1998. The Size and Functions of Government and Economic Growth. Prepared for the Joint Economic Committee. CHLOBANOV, D. and A. MLADENOVA, 2009. What Is the Optimum Size of Government. Institute for Market Research [online]. http://ime.bg/uploads/335309_OptimalSizeOfGovernment.pdf LANDAU, D., 1983. Government Expenditure and Economic Growth: A Cross -Country Study. Southern Economic Journal, 49(3), 783 –792. ISSN 2325-8012. MARLOW, M., 1986. Private Sector Shrinkage and the Growth of Industrialized Economies. Public Choice, 49(2), 143-154. ISSN 0048-5829. PATHIRANE, L. and D., Blades. 1982. Defining and Measuring the Public Sector: Some International Comparisons. The Review of Income and Wealth. 28(3), pp. 261-289.
RYBACEK, V. and L. VEBROVA, 2018. Public Finance, the Public Sector and the General
Government Sector. Statistics and Economic Journal. 98(4), 2018. ISSN 0322-0788x.
SENNHOLZ, H. 1987. Debts and Deficits. Libertarian Press. ISBN 978091088141.
STIGLITZ, J. 1989. The Economic Role of the State. Basil Blackwerll Ltd. ISBN 978-
0631171355.
UNITED NATIONS, 2008. System of National Accounts 2008. European Commission, International Monetary Fund, Organisation for Economic Co-operation and Development, United Nations, World Bank. ISBN 978-92-1-161522-7. WEBER, M. 1984. Legitimacy, Politics and the State. In: Legitimacy and the State, New York University Press. ISBN 978-08-1471-3945.

Littera Scripta, 2018, Volume 11, Issue 2
154
ZIMČÍK, P. 2016. Velikost veřejného sektoru a ekonomický růst. Politická ekonomie, ročník
64, číslo 4. DOI: 10.18267/j.polek.1080
Contact address of the author:
Ing. Václav Rybáček, Ph.D., Department of Economics and Management, Faculty of Social
and Economic Studies, Jan Evangelista Purkyne University in Usti nad Labem, Pasteurova
3544/1, Czech Republic, e-mail: [email protected]
RYBÁČEK, V., 2018. The Size of Government in Empirical Research: A Case Study from the
Czech Republic. Littera Scripta [online]. České Budějovice: Institute of Technology and
Business in České Budějovice, 11(2), 141-154. [accessed: 2018-12-20]. ISSN 1805-9112.
Available at: http://journals.vstecb.cz/category/littera-scripta/11-rocnik-
2018/2_2018/.