litter - kab.orgkey findings: litter the 2009 national visible litter survey and litter cost study*...
TRANSCRIPT
Key Findings: LITTER
The 2009 National Visible Litter Survey and Litter Cost Study* is the first new national litter research from Keep America Beautiful since 1969. The survey documents The composition of litter across America, its quantity, and locations, and the
direct and indirect costs of litter to communities and businesses.
*The 2009 National Visible Litter Survey and Litter Cost Study was prepared by MidAtlantic Solid Waste Consultants for KeepAmerica Beautiful, Inc. Research reports and an executive summary can be downloaded at www.kab.org/research09. KeepAmerica Beautiful, Inc. 2009 national litter and littering behavior research were conducted through a grant from Philip Mor-ris USA, an Altria Company. Wm. Wrigley Jr. Company Foundation sponsored the creation of these fact sheets. All contentsCopyright 2010 Keep America Beautiful, Inc. – www.kab.org. January 2010
Litter remains a pervasive problem.
While litter and littering have decreased, they continue to have a significant impact on our communities and environment.
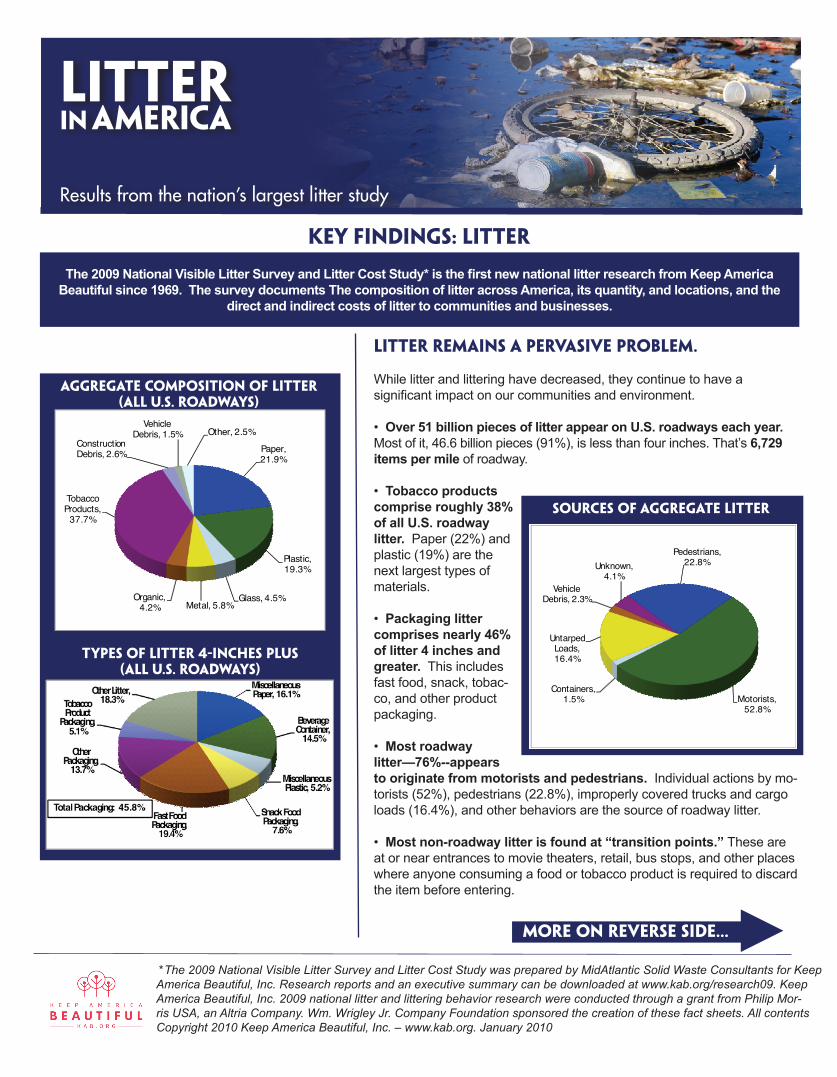
• Over 51 billion pieces of litter appear on U.S. roadways each year.Most of it, 46.6 billion pieces (91%), is less than four inches. That’s 6,729items per mile of roadway.
• Tobacco productscomprise roughly 38%of all U.S. roadwaylitter. Paper (22%) andplastic (19%) are thenext largest types ofmaterials.
• Packaging littercomprises nearly 46%of litter 4 inches andgreater. This includesfast food, snack, tobac-co, and other productpackaging.
• Most roadwaylitter—76%--appearsto originate from motorists and pedestrians. Individual actions by mo-torists (52%), pedestrians (22.8%), improperly covered trucks and cargoloads (16.4%), and other behaviors are the source of roadway litter.
• Most non-roadway litter is found at “transition points.” These areat or near entrances to movie theaters, retail, bus stops, and other placeswhere anyone consuming a food or tobacco product is required to discardthe item before entering.
More on reverse side...
Litterin America
Results from the nation’s largest litter study
aggregate composition of litter (all u.s. roadways)
types of litter 4-inches plus (all u.s. roadways)
Sources of aggregate litter

Litterin America Results from the nation’s largest litter study
Copyright 2010 Keep America Beautiful, Inc. – www.kab.org. January 2010
the cost of litter is substantial
Litter clean up costs the U.S. more than $11.5 billion each year, with businesses paying $9.1 billion. Local and state governments, schools, and other organizations pick up the remaining costs.
The indirect costs of litter are also considerable.
• The presence of litter in a community decreases propertyvalues by 7%.
• Of homeowners surveyed, 40% believe that litter reduces homevalues by 10% to 24%.
• 55% of realtors think that litter reduces propertyvalues by about 9%.
• 60% of property appraisers would reduce a home’s value if itwas littered.
Litter has environmental consequences. Wind and weather, traffic, and animals move litter into gutters, lawns and landscaped areas, alleyways, and parking structures. Litter near storm drains and beach debris are also likely to wash into local waterways, with potential for serious environmental contamination.
What’s changed in 40 years?
A comparative analysis of the 2009 research and KAB’s national litter study conducted in 1969 found that successful education, ongoing clean-up efforts, and changes in packaging are having an impact:
• Visible litter on our nation’s roadways has decreased approximately 61% in the past 40 years.• Paper, metal, glass, and beverage container litter has decreased by 74.4% since the 1969 national study.• The incidence of plastic items in the litter stream has increased over 165%. This reflects a 340% per capitaincrease in use of plastic packaging over the past 40 years
breakdown of direct litter costs in the u.s.