lithofacies analysis of au scientific drill cores 09-03
TRANSCRIPT

Lithofacies analysis of AU scientific drill cores 09-03 and 09-04,
Wetumpka impact structure, Elmore County, Alabama
by
James Kenneth Markin
A thesis submitted to the Graduate Faculty of
Auburn University
in partial fulfillment of the
requirements for the Degree of
Master of Science
Auburn, Alabama
December 12, 2015
Keywords: Wetumpka; Marine impact crater; Gulf Coastal Plain; Lithofacies; Resurge
Copyright 2015 by James K. Markin
Approved by
David T. King, Jr., Chair, Professor of Geosciences
Ashraf Uddin, Professor of Geosciences
Mark Steltenpohl, Professor of Geosciences

ii
Abstract
The Wetumpka impact structure is an approximately 5 km diameter crater that resulted
from a shallow marine cosmic impact in the northeastern Gulf of Mexico during Late Cretaceous
(latest Santonian to earliest Campanian). Presently, this impact structure is a surfically exposed
feature with a broad, arcuate crystalline rim, an interior sedimentary and polymict breccia unit,
and an extra-crater terrain consisting of horst and graben structures. Recent scientific core
drilling within the crater-filling breccias has shown that the uppermost impact stratigraphy is
well preserved. Two of those drill cores, 09-03 and 09-04, were studied by conventional
lithologic logging methods and in part by using X-ray computed tomography (CT) scans in order
to describe the sedimentological characteristics, specifically the Lithofacies belonging to
constituent resurge and rim-collapse sediments. Qualitative results from the resurge interval of
core 09-03 indicate a northerly directed debris flow occurred first, then the resurge arrived, and
finally a southerly or seaward-directed, more aqueous anti-resurge occurred. Proximal field and
drill core structural relationships were used to infer the preservation state of the resurge deposits,
which accumulated in downthrown blocks within the crater. Lithofacies patterns and grain-size
trends confirm that the core 09-04 penetrates a slumped remnant of the southern overturned flap.
Lithofacies and stratigraphic patterns below the overturned flap in core 09-04 suggest that
underlying impactite sands are also an interval of sheared and partially disaggregated
sedimentary flap material.

iii
Acknowledgments
Scientific drilling within the Wetumpka impact structure would not have been possible without
the NASA PGG grant #NNX09AD90G awarded to David King and Jens Ormö. Further financial aid was
provided by American Association of Petroleum Geologists Fred A. and Jean C. Dix Named Grant and
Gulf Coast Association of Geological Societies grants-in-aid.
This author would like to thank the guidance and insight from Dr. David King and committee
members Ashraf Uddin and Mark Steltenpohl. Jens Ormö and Scott Harris also provided informative
discussion and insight.
This author would like to thank the patience and inspiration provided by my wife, Debbie Wilson,
and my son, Nathaniel Markin. They were a guiding light through a long and dark tunnel. We made it
together.

iv
Table of Contents
Abstract ......................................................................................................................................... ii
Acknowledgments........................................................................................................................ iii
List of Tables .............................................................................................................................. vii
List of Figures ............................................................................................................................ viii
Introduction ................................................................................................................................... 1
Objectives ......................................................................................................................... 3
Geologic Setting and Crater Morphology ......................................................................... 4
Previous Work .................................................................................................................. 6
Target Stratigraphy ...................................................................................................................... 9
Crystalline Basement: Kowaliga-Zana and Emuckfaw Group ..................................... 11
Emuckfaw Group .............................................................................................. 11
Kowaliga-Zana Gneiss ...................................................................................... 12
Eastern Gulf Coastal Plain: Tuscaloosa Group and Eutaw Formation .......................... 13
Tuscaloosa Group ............................................................................................... 14
Eutaw Formation ................................................................................................. 17
Lowermost Mooreville Chalk (uppermost target sediment) ............................... 19
General Methodology ................................................................................................................. 28
Drill-core field extraction and processing ...................................................................... 28
Well-site descriptions and locations .............................................................................. 29

v
Drill-core orientation, preparation, cleaning, and photographic documentation ........... 32
Drill-core description and logging ................................................................................. 38
X-ray Computed Tomography Methodology ............................................................................ 43
Fundamentals of X-ray CT scanning ............................................................................. 44
Calculating attenuation values in X-ray CT ................................................................... 47
Attenuation of Constituent Minerals .............................................................................. 48
Limitations and artifacts in x-ray computed tomography ............................................... 52
Photon Starvation ............................................................................................................ 52
Beam Hardening ............................................................................................................. 53
Partial Volume Effects .................................................................................................... 57
Starbursts......................................................................................................................... 57
Ring Artifacts .................................................................................................................. 58
Artifacts due to non-cylindrical cross-section ................................................................ 59
Drill-core preparation and X-ray CT scanning procedures ............................................. 59
Utilization of X-ray CT data for core logging, observations, and strike and dip data .... 62
09-03 Drill-core Results .............................................................................................................. 65
Megablock and Impactite Sand Complex: General Stratigraphic and
Sedimentological Characteristics .................................................................................... 66
Lithofacies Characterization ........................................................................................... 69
Deformational and Structural Observations of the Megablock-Impactite
Sand Complex ................................................................................................................. 84
Apparent Eutaw Megablock Thickness .......................................................................... 87
Resurge General Visual Observations ............................................................................ 88
Lithofacies Characterization and Stratigraphic Patterns ................................................. 89

vi
Structural Features of the Resurge ................................................................................ 111
09-04 Drill-core Results ............................................................................................................ 113
Lithofacies Description and Characterization ............................................................... 116
General Stratigraphic, Sedimentological, and Structural Characteristics
of the Drill-core 09-04 ................................................................................................. 141
Discussion ................................................................................................................................. 147
Drill Core 09-03: Eutaw-Tuscaloosa megablock-impactite sand
complex: interpretations.................................................................................... 147
Drill Core 09-03: Emplacement of mega-slumps and entrapment of
resurge stratigraphy ........................................................................................... 151
Drill Core 09-04: Slumped overturned flap and underlying impactite sands ............... 156
Drill Core 09-03: Resurge Deposition .......................................................................... 162
Drill Core 09-03: mid-resurge, evidence for anti-resurge ............................................ 166
09-03: upper resurge, slumping and rapid suspension fallout ...................................... 167
09-03: uppermost resurge, slumping or tsunamiite? .................................................... 167
Enigmatic Composition of Wetumpka’s Resurge......................................................... 167
Chronostratigraphic timing of the Wetumpka event ..................................................... 168
Conclusions ............................................................................................................................... 168
References Cited ....................................................................................................................... 174
Appendix A ............................................................................................................................... 185

vii
List of Tables
Table 1. Thin-section samples of 09-03 and 09-04 .................................................................... 42

viii
List of Figures
Figure 1. Geologic map of the Wetumpka impact structure ...................................................... 5
Figure 2. Gravity model for Wetumpka impact structure .......................................................... 7
Figure 3. Stratigraphic column for target stratigraphy ............................................................. 10
Figure 4. Chronostratigraphy and lithostratigraphy of the Wetumpka impact event ............... 21
Figure 5. Paleogeographic map of the Wetumpka impact ....................................................... 27
Figure 6. Well-site geologic map for Balliff#1 (09-03). ........................................................ 30
Figure 7. Well-site geologic map for Wadsworth #1 (09-04). ................................................. 31
Figure 8. Top: diagram demonstrating drill-core fitting and orientation. ................................ 34
Figure 9. Example of core cleaning with brushes. ................................................................... 35
Figure 10. Example of photograph-corrected core box digital photograph
with labeled elements. .............................................................................................. 36
Figure 11. Schematics for detectors, source and subject utilized within X-ray CT
for the geosciences for 1st, 2
nd, 3
rd, and 4
th generation CT scanners ......................... 45
Figure 12. Linear Attenuation coefficient (µ) as a function of X-ray beam intensity (keV). .... 49
Figure 13. Attenuation of constituent minerals of the 09-03 resurge interval. .......................... 50
Figure 14. Beam hardening artifacts in X-ray CT. ..................................................................... 54
Figure 15. Examples of common artifacts within X-ray CT. ..................................................... 55
Figure 16. Preparation for X-ray CT. ......................................................................................... 61
Figure 17. Acquisition of strike and dip utilizing Osirix and X-ray CT data. ........................... 64
Figure 18. Sedimentological trends of the 09-03 drill-core. ...................................................... 67

ix
Figure 19. Stratigraphic column of the 09-03 megablock-impactite sand complex .................. 68
Figure 20. Thin-section petrography of T1 lithofacies ............................................................... 70
Figure 21. Selected core intervals and thin-section petrography of D1 lithofacies ................... 72
Figure 22. Bioturbated, Massive Sand (E1), Bioturbated, Interbedded Sands and
Muds (E2), and Bioturbated Muddy Sands (E3) selected core intervals. ................. 75
Figure 23. Brittle-Ductile-Fluidized Transition of 09-03 dz2 interval. ...................................... 77
Figure 24. Selected examples of E5 and E6 lithofacies. ............................................................ 80
Figure 25. Selected Intervals of D3 lithofacies. ......................................................................... 82
Figure 26. Inclination trends of the Tuscaloosa-Eutaw megablock-impactite sand complex. ... 86
Figure 27. Stratigraphic column of the whole resurge interval in core 09-03............................ 91
Figure 28. Basal mixing-shear zone (R1). .................................................................................. 93
Figure 29. Petrography of resurge matrix and transported Mooreville Chalk clast ................... 95
Figure 30. Inclined laminations of matrix-dominated breccia (R2). .......................................... 97
Figure 31. Conjugate slices of swirled, turbulent R2 fabric. ...................................................... 99
Figure 32. Wispy fabric of R2 lithofacies, uppermost lower-resurge. ..................................... 100
Figure 33. Lower-resurge and mid-resurge contact. ................................................................ 102
Figure 34. Imbricated clast-dominated breccia (R3) from the middle
part of the mid-resurge............................................................................................ 103
Figure 35. Bioturbated example of an R4 interval. .................................................................. 105
Figure 36. Brecciated top of R4 lithofacies. ............................................................................. 106
Figure 37. In-situ brecciation of Transported Mooreville Chalk megaclasts (R4). ................. 107
Figure 38. Polylithic-matrix (R5) .............................................................................................. 109
Figure 38a Conjugate slices of polylithic–laminated matrix (R5) ............................................ 110
Figure 39. Stratigraphic column for the overturned fold for 09-04. ......................................... 114

x
Figure 40. Stratigraphic column for lower impactite sands of 09-04. ...................................... 115
Figure 41. Selected 09-04 examples of Semi-intact Tuscaloosa lithofacies ............................ 118
Figure 42. Contourted and fluidized lithofacies T2 in core 09-04 ........................................... 120
Figure 43. Effervescence log for 09-04. ................................................................................... 121
Figure 44. Contourted and Fluidized lithofacies of 09-04 ....................................................... 123
Figure 45. Mica orientations and deformations of impactite sands within 09-04 .................... 124
Figure 46. Example of impactite glass within 04_481.8 in 09-04 ........................................... 127
Figure 47. Example of shattered, euhedral garnets with associated heavy minerals ................ 130
Figure 47a Post-impact alteration of minerals. ......................................................................... 131
Figure 48. Swirled fabric at overturned fold/lower megabreccia contact, 09-04 ..................... 132
Figure 49. Selected 09-04 examples of marginal marine facies of the Eutaw formation. ....... 138
Figure 50. Flow micro-structure of 04-470. ............................................................................. 139
Figure 51. Lignitic lithofacies of 09-04. ................................................................................... 140
Figure 52. Grain-size and maximum grain-size for overturned fold of 09-04 ......................... 144
Figure 53. Grain-size and maximum grain-size for lower megabreccia of 09-04 ................... 145
Figure 54. Inclinations of 09-04. .............................................................................................. 146
Figure 55. 09-03 well-site cross-section................................................................................... 152
Figure 56. Idealized slump model ............................................................................................ 153
Figure 57. Models demonstrating slump vergence. ................................................................. 153
Figure 58. Asymmetrical fold of the “cliffs” ........................................................................... 154
Figure 59. A possible analog for the slumped 09-04 overturned flap ...................................... 160
Figure 60. A stratigraphic analog for the lower resurge from deep basin plain setting ........... 165

1
Introduction
Impact cratering is among the most dominant geological processes within the solar
system. Although the evidence of impacts can be disguised on terrestrial bodies such as Venus,
Earth, Europa, Io, and Titan by various geological processes (i.e., volcanism, erosion, and
tectonics), in the instance of Earth in particular, impact cratering has emerged as an increasingly
important constituent of Earth’s geological history. Beginning with studies such as Shoemaker
(1960) at Barringer Crater, Arizona, terrestrial craters have experienced a near exponential rate
of discovery with a current rate of ~2-3 craters per year (Grieve, et al. 1995; Stewart, 2011).
Moreover, aside from 131 recognized, Phanerozoic craters greater than 1 km in diameter,
conservative statistical analysis by Stewart (2011) predicts that 714 impact craters >1km
diameter with a subset of 228 impact craters >2.5 km diameter remain to be found for the
Phanerozoic. However, although scientific techniques and procedures for discovering impact
craters have become increasingly refined (i.e., French, 1998; Stewart, 2003; French and Koeberl,
2009), the understanding of the specific impact processes that control crater morphology, shock
metamorphism and melting, and impact stratigraphy are aggressively evolving. Further,
although the basic stages of impact cratering processes are well understood (i.e.,
contact/compression, excavation, and modification stages in Melosh, 1989, and French, 1998),
there is a component that drastically complicates crater formation and, in particular, modification
stage evolution: water.

2
Marine impact craters involve an upper layer of water within the target stratigraphy, the
strata impacted, deformed, and disrupted by an impacting bolide. Even though marine impact
craters are currently recognized among the minority of known impact craters, listed as 20 craters
in Goto (2008), marine impact craters should be, if not a majority, a significant proportion of
impact craters on Earth. Because of the dominance of oceanic cover on the earth’s surface and
the greater preservation potential of active basins, marine impact craters should be the dominant
type of impact on earth. Thus, marine impact craters have become an area of increasing
academic interest and relevance within impact geology and the geosciences. Moreover, impact
craters such as Avak, Alaska; Ames, Oklahoma; and Redwing, North Dakota are proven
hydrocarbon reservoirs demonstrating a general commercial success rate of ~50% within
petroliferous basins (Kirshner and Grantz, 1992; Donofrio, 1998), and larger impact craters such
as Chicxulub can induce hydrocarbon maturation within depths typically too shallow for
conventional hydrocarbon generation (Grieve and Therriault, 2000). Therefore, there is a
fundamental academic and economic need for further scientific research of impact processes and
their resulting stratigraphy.
The Wetumpka marine impact structure of Wetumpka, Alabama, located in Elmore
County, is an exceptionally-preserved, ~ 6-km diameter, shallow-marine target impact crater,
which formed during Late Cretaceous (i.e., late Santonian to earliest Campanian). This impact
formed within a mixed target environment of unconsolidated to poorly consolidated Cretaceous
sediments and underlying schist and gneiss of pre-Mesozoic crystalline basement. Originally
recognized and studied as an astrobleme by Neathery et al. (1976), Wetumpka became the only
confirmed impact crater of the eastern Gulf Coastal Plain following the discovery of shocked
minerals and elevated siderophile elemental composition (i.e. iridium, nickel, and cobalt) as

3
reported by King et al. (2002). Unlike many other deeply-buried, marine impact craters (i.e.,
Chesapeake Bay, Mjølnir, Ames, and Avak, among others), the Wetumpka impact structure has
allowed direct observation through outcrop studies and mapping (i.e., Neathery, 1976; Nelson,
2000), and cost-effective shallow drilling, and limited geophysical investigation. Furthermore,
following the serendipitous exhumation of the Wetumpka impact structure from its post-Upper
Cretaceous impact cover, possibly during Quaternary (see Neathery et al., 1976), much of the
original impact stratigraphy remains including the uppermost resurge impact facies (Ormö et al.,
2010; King et al., 2010). Shallow drilling and preliminary analysis conducted by King et al.
(2010) and Ormo et al. (2010) along with sedimentological and stratigraphic data of this study
will assist investigation of how the shallow target marine depth affects the impact processes of
mostly unconsolidated mixed-siliclastic targets.
Objectives
During the summer of 2009, four shallow drill-cores were obtained to study the shallow
subsurface stratigraphy of the north-western crystalline rim (Gardner #1, 09-01), central
polymict breccia (Buck Ridge Road #1, 09-02), chalk meadows (Bailiff #1, 09-03), and
southeastern rim (Wadsworth #1, 09-04). Figure 1 shows the location of these four wells.
Following preliminary studies presented by King et al. (2010) and Ormö et al. (2010), wells 09-
03 and 09-04 were chosen for further detailed study of the catastrophic sedimentation of the
interior crater-filling breccias and sediments of rim collapse (mega-slumping facies) and violent
return of the impact-excavated sea (resurge facies). Using the principles of facies analysis
discussed by Miall (1999), these drill-cores along with the existing body of work at Wetumpka
are referenced to pursue the following objectives:

4
1. To provide a digital documentation of these drill cores for this project and for the benefit
of future workers on the Wetumpka impact structure;
2. To provide detailed, non-interpretive, descriptive data of sedimentological, stratigraphic,
and structural parameters for the purposes of this project and future studies;
3. To investigate the sedimentary and stratigraphic characteristics and lithostratigraphic
patterns of the resurge and mega-slumping facies;
4. To help elucidate the timing, mode of deposition, and sequence of events following the
impact, particularly the resurge and mega-slump facies of this impact structure;
5. To contribute to a growing scientific body of work on shallow marine impacts, as a
contribution toward future studies of other shallow marine-impact structures.
Geologic Setting and Crater Morphology
The Wetumpka impact structure is a five-kilometer diameter crater located in Elmore
County, central Alabama (Figure 1). Wetumpka has a deep inner crater, a broad horseshoe-
shaped, northern crystalline rim, and an extra-crater terrain of structural deformation to the south
(King et al., 2002). Because the Wetumpka structure is interpreted to be a shallow marine
impact, the extra-crater structural terrain (EST) to the south is interpreted to be an in situ collapse
feature of horsts and grabens (King et al., 2006). This extra-crater structure (EST in Figure 1)
was likely the consequence of gravity-driven movement in wet, unconsolidated, and unstable
target materials, and the violent resurge of sea water. Extra-crater deformation extends out 7.6
km from crater center towards the south. Within the shallow subsurface, the inner crater is filled
with an upper impact stratigraphy of reworked ejecta and slumped megablocks (King, et al.,
2006). The crystalline rim (CR) ranges from an intact, steeply-dipping schist-gneiss to
weathered crystalline ejecta within a sandy, impactite matrix.

5
Figure 1. Geologic map of the Wetumpka impact structure. Crater morphology is labeled. Scale bar =
1km. Striped yellow in crystalline rim is crystalline ejecta (D. T. King, Jr., personal communication,
2010). Wells, 09-03 and 09-04, are labeled. Transect (A-A’) for Figure 2. Insert: physiographic map of
Alabama, from King et al. (2002). Geologic map modified from Johnson (2007). Wells marked 1-98 and
2-98 are the same as 98-01 and 98-02, respectively.
A
A’

6
The Wetumpka impact crater lies in crystalline and Upper Cretaceous target stratigraphy,
in stratigraphic order, pre-Mesozoic metamorphic basement, poorly-consolidated sediments of
the Tuscaloosa Group, Eutaw Formation, and lower Mooreville Chalk of the eastern Gulf
Coastal Plain. Previously, water depth was estimated to be 35 to 100 meters. Following results
from Ormö et al. (2010), recently identified resurge deposits are interpreted to indicate very
shallow marine depth at time of impact. Based on the youngest target sediments, the Wetumpka
impact is thought to have occurred ~ 83.5 m.y. ago in the lower transgressive systems tract of the
lowermost Mooreville Chalk (King et al., 2007; King and Petruny, 2010). A recent absolute date
of 84.4 +/- 1.4 m.y. (Wartho et al., 2011) generally agrees with previous estimates of age, and
crater age and target strata are discussed in depth in the section Target Stratigraphy.
Previous Work
The Wetumpka impact crater has been recognized as an anomalous structure for well
over 100 years; however, the structure had not been proposed as impact in origin until work by
Thornton L. Neathery, Robert D. Bentley, and Gregory C. Lines (Neathery et al., 1976). Further
mapping and extensive outcrop studies by Nelson (2000) recognized crater-filling breccia and
rim structures consistent with impact craters. Utilizing two wells that penetrated the central
polymict breccia, subsequent work and confirmation of impact origin were achieved by King et
al. (2002; 2003). Confirmation was achieved with the discovery of shock-characteristic angles
within plane sets of planar deformation features (PDF), and elevated levels of some key
siderophile elements of iridium, cobalt, nickel and chromium, contained within a impactite
polymict breccia.
Currently, geophysical investigation at the Wetumpka impact structure has been limited.
Prior to the scientific drilling of 98-01, 98-02, 09-01, 09-02, 09-03, and 09-04 wells, Wolf et al.

7
(1997) interpreted a gravity survey transect as having residual gravity of a negative gravity
feature with a possible central peak. Relative negative gravity features are characteristic of
impact structures. Utilizing the gravity data of Wolf et al. (1997) adjusted for regional trends, a
subsequent gravity model by Robbins et al. (2011) shows a central peak and a thicker
sedimentary breccia to the east. This model is in best agreement with field gravity measurements
(Figure 2).
Subsequent of mapping and confirmation of Wetumpka’s impact origin, scientific
investigation has focused upon the genetic origin and subsurface character of the Wetumpka
impact stratigraphy. Following work by King et al. (2002; 2003) and Johnson (2007), shallow
subsurface drill-cores 98-01 and 98-02 show an intercalated stratigraphy of sedimentary
Figure 2. Gravity model for Wetumpka impact structure. Transect is west to east (see Figure 1
for approximate transect line). From Robbins et al. (2011).
NW SE

8
megabreccia (SB) and polymict megabreccia containing crystalline and Upper Cretaceous clasts.
Polymict megabreccia (PB) is a mixed, sedimentary and crystalline breccia within an impactite
sand matrix. King et al. (2006) interpreted a significant role for water with crater formation.
Because the veneer of coastal plain stratigraphy significantly thins to the north, King et al.
(2006) proposed that the resulting rim was heterolithic in composition. Thus, the saturated and
mostly unconsolidated southern rim would collapse almost immediately following collapse of
the transient crater whereas the northern crystalline rim remained stable and resistant to collapse.
Furthermore, King et al. (2006) interpreted that the return of excavated sea water (resurge) would
further exasperate the collapse of the southern rim. Due to a tentative, interpreted trajectory of
impact from the southwest, King et al. (2006) suggest a much stronger southern resurge; this is
based on computer simulations of marine impact craters that show increased resurge strength in
an up-range direction (Shuvalov et al., 2005). King and Petruny (2009) reported melted
dinoflagelates within “chalk meadows” in the interior which suggested that they were
remobilized post-contact stage sediments.
Finally, current work within the Wetumpka impact crater was made possible by a NASA
grant awarded to David King and Jens Ormö for the previously mentioned four new drill cores.
The wells, 09-01, 09-02, 09-03, and 09-04 were drilled to depths of 88, 23.5, 90, and 218 m,
respectively. Preliminary interpretations by King et al. (2010), propose that 09-01 contains an
overturned crystalline flap, 9-02 has an interval of polymict breccia with both sedimentary and
metamorphic blocks, 9-03 contains a resurge of distal ejecta and ripped-up sediments in the
upper portion of the well, and 9-04 contains a preserved slumped, overturned assemblage of
Upper Cretaceous units, which are interpreted to be an overturned flap due to reversed
stratigraphy. Furthermore, analysis of matrix material and utilization of a line-log technique for

9
granulometric analysis in the upper part of drill core 09-03 (Ormö et al., 2010) suggests that the
uppermost resurge deposit within this well is “sediment laden” and suggestive that the
Wetumpka impact structure is shallower than previously believed. Subsequent work, discussed
in detail in this text, used X-ray computed tomography (X-ray CT) to differentiate
sedimentological structures and lithostratigraphic units within the resurge of 09-03 that were
generally consistent with a mud-flow interpretation (Markin et al., 2010).
TARGET STRATIGRAPHY
Unlike many surficial, conventional geological processes, impact cratering does not
contribute significant, additional material to existing stratigraphy. Instead, impact cratering
superimposes unique processes of shock metamorphic, igneous (melting), sedimentary (i.e.,
resurge), and deformational processes upon pre-existing, target stratigraphy. Consequently, the
complex structural and stratigraphic result of impacting is challenging to understand. However,
with greater resolution of pre-existing, vertical and lateral stratigraphy, the seemingly random
result is increasingly easier to understand. For example, with proper identification of original
stratigraphic position, properly-identified constituents allow the identification of overturned flap,
ejecta patterns, timing of emplacement and other inherited stratigraphic patterns possibly hidden
within brecciated stratigraphy. Therefore, the following chapter discusses the target stratigraphy
in depth for proper identification of original stratigraphic source to help assist analysis of
sediment provenance and crater evolution.

10
Pre-K
Figure 3. Stratigraphic column for target stratigraphy. Pre-K = Emuckfaw group with
intrusive Kowaliga-Zana Gneiss. Maximum and minimum water depths are indicated by
different shades of blue (Modified from King, 1997).
m
11
Crystalline Basement: Kowaliga-Zana Gneiss and Emuckfaw Group
Within the confines of this study, with the exception of questionable, highly-saprolitized
crystalline breccia near the base of well 09-04 of King et al. (2010), occurrences of intact-
crystalline breccia were not encountered within field studies or drill-core. Nevertheless, within
impactite breccia matrix, a disaggregated, mineralogical admixture is noted from this study that
likely involves the crystalline basement. Therefore, it is important to acknowledge the general
lithological and mineralogical composition of the crystalline basement that could become present
within the finer-grained matrix of the slurry and fallback breccia facies of the Wetumpka impact
crater.
Emuckfaw Group. Generally, Emuckfaw Group is reported by Raymond et al. (1988) to
be a diverse, metasedimentary sequence of medium-grained muscovite-biotite-quartz-feldspar
gneiss, fine-grained graphite-garnet-muscovite schist, graphite-garnet-muscovite schist, and
quartzite along with locally occurring thin amphibolites and aluminous graphitic schists.
Raymond et al. (1988) also mention rare ultramafic pods; however, previous workers have not at
this time observed these within the Wetumpka area. From Emuckfaw Group exposures of the
crystalline rim, Neathery et al. (1976) observed a consistent lithology of biotite-garnet-
feldspathic schist throughout the crystalline rim, exposures of meta-orthoquartzites and
aluminous, graphitic schists in the western rim, and locally, a thin amphibolite in the eastern
portion of the crystalline rim (near well 09-04). Within predominate schists of the crystalline
rim, Nelson (2000) also observed significant muscovite and plagioclase content that ranging
from 0 to 15 percent of the total volume; these schists are observed to locally grade towards
quartzites. Furthermore, Nelson (2000) also observed reddish-purple, euhedral to subhedral
garnets (almadine?), which were up to 4 mm in diameter and associated with both micaceous and

12
quartzose schists with tourmaline present with graphitic schists and possibly decreasing garnet
content with increasing graphitic content.
Therefore, based upon previous work, mineralogical input from the Emuckfaw Group
into impactite breccia matrix beyond ubiquitous quartz would be muscovite, biotite, plagioclase,
graphite, euhedral-subhedral garnets, unknown amphibole species, and tourmaline. Due to the
meta-sedimentary (meta-greywacke) nature of the Emuckfaw Group, potassium feldspar and
zircons would be anticipated additions as well.
Kowaliga-Zana Gneiss. Intruded into the Emuckfaw Group, the Kowaliga and Zana
Gneiss are, respectively, a gray, coarse-grained feldspathic augen gneiss and gneissic quartz
monzonite-granite which are strongly lineated and have increasing foliation near margins
(Raymond et al. 1988; Drummond et al., 1997). Derived from I-type parent magma of felsic to
intermediate composition along with likely meta-sedimentary contamination, the Kowaliga-Zana
gneiss is thought to be emplaced during the 460-Ma Taconic Orogeny (Russell et al., 1987;
Drummond et al., 1997).
Specifically, for the Wetumpka crater, Nelson (2000) observed biotite-rich, muscovite-
poor outcrops of micaceous, K-Feldspar augen gneiss (Kowaliga Gneiss) which include quartz
and both potassium feldspar and myrmekitic plagioclase in the northeast portion of the rim. Also,
north and proximal to the Wetumpka crater rim, Nelson (2000) observed occurrences of
Emuckfaw Group and Kowaliga Gneiss within stream channels with Kowaliga Gneiss exhibiting
potassium feldspar augens, biotite and high quartz content. Other studies that have included the
Kowaliga Gneiss outside of the immediate area of Wetumpka have observed mineralogical
composition of quartz, potassium feldspar and plagioclase porphyroblast, biotite, muscovite,
chlorite and accessory minerals of sphene, apatite, zircon, and epidote, in the Lake Martin area,

13
northeast Elmore County (Sterling, 2006); In addition, within eastern Elmore County near
Tallahasse, Kowaliga Gneiss is observed, along with common, previously mentioned
mineralogical, constituents, epidote and microcline augens with tartan twinning and fine-grained
biotite, muscovite and quartz inclusions. Therefore, the anticipated, potential disaggregated
crystalline basement input within impact breccia matrix is primarily subhedral quartz, principally
potassium feldspar (microcline and orthoclase) and lesser amounts of plagioclase feldspar, micas
of principally biotite with subordinate muscovite and chlorite, and accessory minerals of epidote,
apatite, zircon, and sphene.
Eastern Gulf Coast Plain: Tuscaloosa Group and Eutaw Formation
Following the breakup of Pangaea and initial formation of the Gulf of Mexico during
Late Triassic to Early Jurassic, the volcanic rifted-margin on North America’s southeastern
margin transitioned to the passive margin wedge of the Eastern Gulf Coastal Plain (Salvador,
1987; Mancini et al., 2008). Although substantial sedimentary deposition of Upper Triassic
through Lower Cretaceous strata occurred deeper within the sub-surface of the Gulf of Mexico
(Mancini et al., 2008), within the arcuate post-Paleozoic outcrop belt of the Eastern Gulf Coastal
Plain, only Upper Cretaceous sediments of the Tuscaloosa Group and Eutaw Formation exist
within the target stratigraphy of the Wetumpka impact crater (Neathery et al., 1976; King et al.,
2006). Within the Alabama Upper Cretaceous outcrop belt, stratigraphic architecture of relevant
Upper Cretaceous formations transition from the eustatic-tectonic derived stratigraphy of the
eastern margin of the Mississippi Embayment to the largely eustatically derived Upper
Cretaceous sediments of eastern Alabama and western Georgia. Upper Cretaceous sediments of
Central Alabama lie within a zone of transition between these two fundamental areas that have
received lesser scientific scrutiny than neighboring eastern and western Alabama Cretaceous

14
stratigraphy. Upper Cretaceous stratigraphy of central Alabama could include stratigraphic and
sedimentological character similar to both western and eastern Alabama Upper Cretaceous
stratigraphy and intraformational facies (D. T. King, Jr., personal communication, 2010).
Following the formation of the Mississippi Embayment, limited tectonic influence upon post-
Tuscaloosa, Cretaceous stratigraphy is possible due to volcanism (Baksi, 1999), halokinesis, and
thermal subsidence (Cox and Van Arsdale, 2002; Mancini et al. 2008). However, global sea
level curves and eustacy are attributed to be the principal influence on transgressive and
regressive cycles of the Eastern Gulf Coastal Plain (King, 1994; Mancini et al. 2008).
Tuscaloosa Group. The Tuscaloosa Group ranges from a fluvial-deltaic and marginal
marine complex within western Alabama to a poorly-sorted, feldspathic, predominately fluvial
sedimentary deposit of the undifferentiated Tuscaloosa Formation of eastern Alabama (Mancini
et al. 1987). Consisting of the lower Coker Formation and the upper Gordo Formation within the
up-dip (outcrop) in Alabama, the Coker Formation is generally described as a fine to medium
grained, micaceous, cross-bedded sand and variegated, micaceous clays with subordinate, thin
gravel beds whereas the Gordo Formation consists of a lower, predominately gravelly sand and a
cross-bedded, locally gravelly sand in the upper part with interbedded, gray, moderate-red, red-
purple, and mottled clays (Raymond et al., 1988). Respectively, thicknesses for the Coker and
Gordo formations are estimated to be 70 to 152 and 35 to 91 meters in outcrop for a combined
105 to 243 meters (Raymond et al. 1988). However, in the vicinity of the Wetumpka impact
structure, thicknesses are estimated to be 60 meters for the Tuscaloosa Group (Neathery et al.,
1976; King et al., 2003). In addition, the Tuscaloosa is thought to be middle Cenomonian to
Turonian in age (Mancini et al. 2008). However, Johnson (2007) reports palynological data that

15
suggest an age in the range of late Albian to Cenomonian, which was obtained from Tuscaloosa
paleosols within a semi-intact sedimentary block drilled in well 98-01.
Although predominantly terrestrial in origin, the Tuscaloosa Group contains marginal
marine sediments in western Alabama within the basal Eoline Member of the Coker Formation,
which consist of very fine to medium grained, thinly laminated, and finely glauconitic sand and
silt, along with dark-grey, carbonaceous clays (Drennen, 1953; Raymond et al., 1988). Another
marine incursion can be found near the top of the Coker Formation corresponding with the
maximum flooding surface identified by Mancini et al. (2008) within subsurface logs and
outcrops within Western Alabama. This latest Tuscaloosa marine incursion likely transgressed
as far as western Middle Tennessee, where it is identified as intercalated upper shoreface sands
(Marcher and Stearns, 1962). Marcher and Sterans (1962) interpreted a “Tuscaloosa Sea,” which
was likely a narrow inlet that flanked the eroding, uplifted Paleozoic highlands of the Mississippi
Embayment (see Cox and Van Arsdale, 2002). Although glauconitic, marine sediments are
found with southeastern Elmore County (Szabo et al. 1988), Drennen (1952) states that there are
no known marine Tuscaloosa sediments east of the Coosa River nor has recent, substantial field
mapping or outcrop studies (e.g., Neathery et al., 1976; Nelson 2000; King and Ormö, 2007)
revealed any Tuscaloosa sediments of marine or marginal marine origin.
Fundamentally, the terrestrial facies of the Tuscaloosa Group include (1) floodplain
facies of overbank/paleosol deposits of oxidized, red-maroon-purple, heavily bioturbated, silty
clays interbedded locally with olive-gray crevasse splay sands and, in one locality, high
concentrations of biotite (Reinhardt et al., 1986), and (2) stacked or amalgamated 3- to 6-meter
thick, fining upward, mud or quartzite conglomerates overlain by trough cross-bedded channel
sands (Reinhardt et al., 1986; Savrda et al., 2000). In a few places, oxbow lacustrine deposits of

16
laminated, fossiliferous (leaf-rich), grey clays have been found (Smith, 1984; Savrda et al.,
2000). Within eastern Alabama, these Tuscaloosa alluvial facies are interpreted to be part of a
complex stratigraphic architecture derived from a hybrid form of tropical, high discharge,
anastomosing alluvial fans and braided-rivers of moderate slope (King, 1997), which locally
resemble more typical meandering fluvial systems (Reinhardt et al., 1986).
Sedimentologically, white, buff, red, and purple channel sands of fining-upward cross-
bedded sequences are well-defined planar to trough cross-bedded sands with basal, reworked
flood-plain clasts or quartzite granules, pebbles and cobble conglomerates that are coarser near
the base of the Gordo (Drennen, 1952; Reinhardt et al., 1986; Savrda et al., 2000). These
channel complexes fine upwards into oxidized overbank/paleosol facies that are pervasively
bioturbated with dense, interpenetrating Taenidium (Savrda et al., 2000), an ichnofossil of
meniscate-backfilled, and straight to sinuous burrows likely formed by insect activity.
Lithologically, discrete, pristine planar and trough cross-bedding of micaceous, immature arkosic
sands absent of any bioturbation along with heavily bioturbated (Taenidium-bearing), red and
purple, paleosol/overbank silts and clays are diagnostic of Tuscaloosa Group sediments. In
addition, overly gravelly sands and coarser conglomerates likely belong to the Gordo Formation.
In addition to lithological and stratigraphic composition, Tuscaloosa Group mineralogy
can be arkosic and quartzose (Nelson, 2000) and can contain some heavy minerals. Sayers and
Uddin (2010) have reported detrital heavy minerals of garnet, zircon, tourmaline, rutile and
opaques from a 0.19 to 0.85 percent fraction from localities of chemically-weathered Tuscaloosa
Formation in eastern Alabama and western Georgia in close proximity to piedmont sources. In
the previously mentioned marginal marine facies (specifically beach placer deposits) of the
Tuscaloosa in middle Tennessee (Marcher and Stearns, 1962), accessory minerals include

17
tourmaline, epidote, zircon, titanite, kyanite, staurolite, leucoxene, monazite, topaz, tremolite,
ilmenite, limonite and apatite. Therefore, within a disaggregated Tuscaloosa-derived impactite-
breccia matrix, Tuscaloosa could input minor amounts of these minerals along with rare biotites.
Obviously, sourced from an alluvial and oxidized environment, these accessory minerals are
likely to be heavily chemically and physically weathered.
Eutaw Formation. In contrast to the Tuscaloosa Group, the Santonian to early
Campanian Eutaw Formation is a heterolithic, marine to marginal marine formation consisting of
a lower, unnamed member of non-calcareous, glauconitic, cross-bedded to massive, locally
fossiliferous, fine to medium-grained sands with interbedded, laminated silts and clays
(Raymond et al., 1988), which are disconformably incised into underlying Tuscaloosa Group
sediments (King, 1990). However, the upper member of the Eutaw Formation, the Tombigbee
Sand Member is disconformable with the underlying member and is non-calcareous to calcite-
cemented, fossiliferous, glauconitic, fining-upward, fine sand to silty clay that is mostly
conformable and gradational with overlying Mooreville Chalk (Raymond et al., 1988; Mancini et
al., 1994). Both the lower unnamed member and Tombigbee Sand Member thin from western
Alabama to the east and thicken from offshore-subsurface to up-dip outcrop with a maximum
thickness of 170 meters to the west and thinning to 38 meters in the east (Raymond et al., 1988;
Liu, 2007). Within the Wetumpka area where the Eutaw Formation begins to thin substantially,
the thicknesses are estimated to be 30 meters (Neathery et al., 1976). Furthermore, the
Tombigbee Sand thicknesses can range from 1.5 to 6 meters, absent in eastern Alabama, and is
discontinuous within western to central Alabama (Raymond et al., 1988).
Although heterolithic, stratigraphic patterns have been recognized by Mancini et al.
(2008) among others that show fining-upward sequences with general back-stepping facies

18
associations as part of a transgressive systems tract and, possibly, the uppermost low-stand
systems tract (C. E. Savrda, personal communication, 2009). The lower, unnamed Eutaw
member is generally dominated by paralic marine sand facies comprising linear barrier-island,
inner shelf deposits of linear submarine sand bars, turbiditic sands, and tempestites, and back-
barrier deposits of lagoonal, carbonaceous silts and clays, and tidal deltas. A subordinate facies
assemblage of estuarine incised valley-fill is recognized and well-studied within the eastern
Alabama and western Georgia coincident with the modern Chattahoochee River valley. This
assemblage of facies resulting from tidally-influenced environments of deposition include bay-
head deltas, bay muds of fair-weather and storm conditions, and tidal channels and shoals
(Frazier and Taylor, 1980; Savrda and Nanson, 2003; Bingham et al., 2008). Where lower
shoreface and inner shelf environment of deposition transgressed to the position of the modern
outcrop belt, outcrops of the Tombigbee Sand Member are the result (Mancini and Soens, 1994).
For the Eutaw Formation within the Wetumpka region, Frazier and Taylor (1980)
describe a basal, bioturbated, gravelly-sand overlain with cross-bedded fine sand and mud drapes
along with rare intercalated fossiliferous muds that contain bivalve fragments and lignitized
wood fragments. Moreover, Nelson (2000) has identified predominant Ophiomorpha nodosa
within Eutaw outcrops, located both within and outside the impact crater. Likewise, in some
previous reports, Frazier and Taylor (1980) and Mancini and Soens (1994) reported
Ophiomorpha nodosa dominance in fully bioturbated to moderately bioturbated sands and muds
in the unnamed lower member of the Eutaw. However, within tidal inlet/tidal delta facies of the
upper lower Eutaw, Savrda et al. (1998) reported more diverse assemblages of ichnofossils
including Macaronichnus, Conichnus, Skolithos, Dactyloidites, and comparatively rare
Ophiomorpha with good preservation of herringbone cross-stratification. Furthermore, within
19
incised-valley-fill facies and the estuarine bay muds and sands, muds and sands have a
bioturbated, homogeneous fabric where discrete ichnofossils are identified such as Planolites,
Terebellina, and Teichichnus (also some Ophiomorpha, but only with tempestites). Also, within
these estuarine settings, large lignitized wood fragments and laminated or bedded lignite have
been observed (Frazier and Taylor, 1980; Savrda and Nanson, 2003).
Interpreted as offshore transition to lower shoreface, Mancini and Soens (1994) identify
three fundamental lithofacies within the Tombigbee Sand. However, the lowermost lithofacies is
essentially identical to the uppermost unnamed member, a cross-stratified, glauconitic, non-
calcareous, fine to medium sand, distinguishable only with an interceding transgressive lag. On
the other hand, Mancini and Soens (1994) state that the upper two members have varying calcite
cementation with bioturbated, massive fabrics in which cementation can encompass entire beds
(Savrda and King, 1993) or discontinuous concretions (Savrda and King, 1993; Mancini and
Soens, 1994; Liu, 2007). Moreover, the diachronous overlying Mooreville Chalk and underlying
Tombigbee contact can be gradational towards sandy-silty marl or sharp as a calcareous, bored
sandstone-hardground surface termed herein as the “Tombigbee caprock.” Liu (2007), in
contrast, picks the contact where calcerous clay (marl) exceeds the sand volume. Within the
Wetumpka area, Nelson (2000) observed few recognizable Tombigbee sand outcrops
occurrences. Within the Wetumpka area, Tombigbee Sand intervals are not known to exceed
one meter and resemble the “Tombigbee caprock” of Savrda and King (1993). Following this
precedent, only indurated, calcareous sandstones are interpreted as Tombigbee Sand Member.
Lowermost Mooreville Chalk (uppermost target sediment). Utilizing (U-Th)/He
geochronological methods on apatite and zircon samples, an absolute, a radiometric age of
84.4+1.4 Ma was obtained by Wartho et al. (2011) which is in general agreement with the

20
biostratigraphic estimate of ~83.5 million years by King et al. (2007). However, with the
biochronostratigraphic , lithochronostratigraphic, and sequence stratigraphic framework of Liu
(2007), the Wetumpka impact event likely has occurred during a later time than the absolute age
based on comparisons with semi-intact strata of lowermost Mooreville chalk at Jasmine Hill
Road in the extra-crater structural terrain, described by Nelson (2000). Within the resurge
interval of 09-03, semi-intact chalk clasts are entrained within the resurge, thus, at least one
chalky horizon must exist in target stratigraphy. Moreover, Ormö et al. (2010) suggested that
water depth was likely closer to the minimum value proposed. Thus, impact is interpreted to
have occurred during a regressive phase (marl or clayey deposition). With the Jasmine Hill
outcrops and drill-core data (detailed in results and discussion), a probable age of approximately
83.9 million years is estimated. Constrained by the radiometric age and its limits of uncertainty,
the Wetumpka impact must have occurred during the deposition of the lowermost Mooreville
Chalk. Interpreted chronostratigraphic and lithostratigrahic position along with absolute dates of
Wartho et al. (2011) are presented in Figure 4.

21
Fig
ure
4.
Chro
nost
rati
gra
phy a
nd l
ithost
rati
gra
ph
y o
f th
e W
etum
pka
impac
t ev
ent.
Chro
nost
rati
gra
phic
, li
thost
rati
gra
phic
and
bio
stra
tigra
phic
fra
mew
ork
is
from
Liu
(2007).
A
bso
lute
dat
es a
re f
rom
War
tho e
t al
. (2
011)
wit
h p
lott
ed r
adio
met
ric
dat
a
(inse
rt).

22
The lowermost Mooreville Chalk is gradational with the underlying Eutaw Formation
and is generally described as grey to green-grey, sandy-silty, glauconitic, fossiliferous marl and
chalk (Raymond et al., 1988; Mancini and Soen, 1994). The lower Mooreville Chalk is also
gradational with the stratigraphically adjacent calcareous, glauconitic, and fossiliferous, fine-
grained sand, clay and marl in eastern Alabama. From Liu (2007), the lowermost Mooreville
Chalk below the maximum flooding surface was noted to be sandy and gradational, and the
transition from calcareous Tombigbee Sand Member to Mooreville Chalk was picked where the
calcareous clay-marl content surpassed the sand fraction. However, not all Tombigbee Sand-
Mooreville Chalk contacts are judged to be transitional. Aside from sharp, erosive contacts in
eastern Mississippi (Mancini and Soen, 1994; Liu, 2007) and in contrast with gradational
contacts in Alabama, the closest, undisturbed, and published Mooreville Chalk locality at
Catoma Falls overlies sharply the Tombigbee Sand Member, demarcated by a calcareous
caprock. Located in northwestern Montgomery County, this locality is located nearly directly
down paleodip, approximately 29 km southwest from the center of the Wetumpka impact crater.
Resting atop of a bored, calcite-cemented, echinoid-bearing, and fine-grained sandy
hardground contact, the lowermost Mooreville Chalk of Catoma Falls is described by Savrda
and King (1993) to be sedimentary package of a calcareous, very fossiliferous, glauconitic sand
with an interbedded, sandy chalk. Direct physical evidence of the Wetumpka impact are not
currently known at Catoma Falls, but Mooreville Chalk has been a recognized stratigraphic
component of the impact beginning with the work of Neathery et al. (1976) where Mooreville
Chalk is preserved within topographic lows within the interior of the crater or as graben on the
exterior.

23
However, King and Petruny (2009) suggested that chalk deposits previously attributed to
the Mooreville Chalk by Neathery et al. (1976) could be post-impact deposition (i.e., resurge
deposits) because of the presence of melted dinoflagellates. Chalk deposits (drilled in well 09-
03) located within the interior of the crater were confirmed to be of resurge origin by King et al.
(2010), Ormo et al. (2010), and Markin et al. (2011). Furthermore, recent investigation of the
isolated chalk outlier to the east of the crater (D. T. King, Jr., personal communication, 2009) is
suspected to be of resurge origin; and investigations of mineralogical composition of clays
within Elmore county by Clarke (1965) found that this particular chalk outlier contained 15-20 %
quartz, 20% kaolinite, 10-15% illite, 20-25% calcite, 1% iron-oxides, and 1-2% heavy minerals.
Juxtaposed with basal Tuscaloosa clays in Elmore County with no measureable heavy minerals
(Clarke, 1965), and the <1% heavy minerals of Sayers and Uddin (2010) of Tuscaloosa
Formation in eastern Alabama, it is clear that this outlier is atypical. Heavy mineral content
higher than piedmont-proximal fluvial sediments is unlikely within mid-shelf marls and chalks.
Thus, chalk deposits on the exterior could be resurge sediments as well. However, recognition,
during this study of rotated, semi-intact blocks of Mooreville Chalk, some coeval Mooreville
Chalk was present within the target stratigraphy. Thus, previous assumptions of water depth,
coeval deposition, and paleogeographic setting (i.e., King et al., 2006; King et al. 2007) remain
valid.
During time of impact, the ancestral eastern Gulf of Mexico was in an active
transgressive phase with the main thrust of the transgression centered in the western part of
central Alabama and, subsequently, inundating towards the east and northwest (Liu, 2007;
Mancini et al., 2008). Evidence from the outcrop belt suggests that, the paleoshoreline
transitioned from an east-west trend within the lower Eutaw Formation to a northwest-southeast
24
trend within the lowermost Mooreville Chalk (King, 1994). However, because the Wetumpka
impact occurred within the Mooreville transgressive systems tract and before the maximum
flooding surface (e.g., maximum transgression) recognized by Mancini et al. (2008) and Liu
(2007), the shoreline was likely in a transitional, general retreating position at time of impact.
Moreover, according to Mancini et al. (2008) and Liu (2007), the maximum flooding surface
(mfs) of the lower Mooreville Chalk does not coincide with the maximum bathymetric (mfs II)
surface of the upper Selma Group identified by Liu (2007). Thus, in concert with observations
made Ormö et al. (2010), the depth and distance to shore could be less than previously believed
in prior work (i.e., King et al., 2002).
During deposition of the lower Mooreville Chalk, there were two principal siliclastic
places of input along the paleoshore line. One was centered near the Alabama-Georgia state line
to the east and the other near the northwest corner of Alabama and southern middle Tennessee to
the northwest (Mancini et al., 1993). These were roughly coincident, respectively, with where
the modern Chattahoochee and Tennessee River valleys intersect the arcuate, Upper Cretaceous
outcrop belt. Hypothetically, we can suppose that ancestral equivalents of the Tennessee and
rivers existed and these were their entry points into the ancestral Gulf of Mexico. The latter
river, the ancestral Chattahoochee River, had some possible depositional influence on the
Wetumpka area. Interpreted to be tidally-influenced bay-head delta by Savrda et al. (2003)
among many others, the sedimentary reach of the ancestral Chattahoochee River delta extends as
far west as Montgomery County within the realm of the Mooreville Chalk-Blufftown Formation
(Mancini et al. 1996). Therefore, the Wetumpka area was likely within reach of, at minimum,
distal fine-grained prodelta sediments during regressive periods.

25
Between the principal siliclastic inputs, western to central Alabama were hemi-pelagic
bays during deposition of Mooreville Chalk (Mancini et al,. 1996; Liu, 2007). Marine depths of
the hemi-pelagic shelf at Wetumpka have been previously thought by King et al. (2002) to be
between 30 to 100 meters with a hypothetical distance of 40 km to shore. These marine depths
are based on paleodepth estimates of Puckett (1991) for marl (35 m) and chalk (65-100 m)
inferred from the size of ostracode eyes within marls and chalks of the superjacent Demopolis
Chalk. Variance between marl and chalk deposition is thought by Liu (2007) to be a result of
Milankovitch-forced climatic cyclicity resulting in marl from increased siliclastic input
(regressive?) and chalk from siliclastic starvation (transgressive?). Within the Selma Group,
overall biogenic production (i.e., nannoplankton) is thought by Warren and Svarda (1998) and
Liu (2007) to be relatively constant.
Although the ancestral Chattahoochee River is likely the principal source for siliclastic
sediment within Upper Cretaceous sediments of eastern and central Alabama, other minor rivers
and streams likely existed along the paleocoast. Staheli (1976) observed that in a region parallel
and proximal to the fall-line stream patterns were dendritic within the piedmont. In particular,
river trunks to tributaries were dendritic in pattern and commonly cut across structural trends of
the Appalachian Piedmont. However, in the case of the Georgia Piedmont, streams assumed a
trellis pattern and were clearly structurally controlled by Appalachian Piedmont structural trends.
Staheli (1976) further interpreted that the line between trellis and dentritic pattern represents the
maximum extent of the Gulf Coastal plain. The modern dendritic rivers and streams were
interpreted by Staheli (1976) to have “etched” into the ancient coastal plain into the underlying
piedmont after which the coastal plain sediments eroded to their modern extent, terminating near
the fall line. Consequently, similar rivers may have followed southwest-northeast structural

26
trends of the Appalachian crystalline bedrock (piedmont) north of a narrow post-Tuscaloosa
Coastal Plain; however, obviously these rivers had drastically reduced drainage basins probably
at the cost of the ancestral Tennessee and Chattahooche drainage basins as evidenced by the
aforementioned, dominant depocenters. Also, this means local fine-grained siliclastic input (i.e.,
bay muds) was possible and would have been independent of ancestral Chattahoochee sediment.
Finally, the fall line is a prominent physiogeographic feature in the Wetumpka area where
stream gradients increase locally and are associated with a monoclinal point of flexure within the
Appalachian Piedmont (Staheli, 1976). The fall line has been interpreted to be a
contemporaneous physiogeographic feature with the post-Tuscaloosa sediments of the Eutaw
Formation based on similarity of ancient stream flow directions to modern ones, mapped along
the Tuscaloosa-Eutaw disconformity (Bingham and Frazier, 2004). Although an ancient
equivalent of the fall line would likely have some influence on the paleoslope of the sea floor
and, in turn, influence impact cratering processes, specific evidence of a contemporaneous fall
line at Wetumpka are not currently known. Thus, the possibility for a fall line feature at time of
impact remains an open and intriguing question.
In summary, the Wetumpka bolide should have struck shallow seas coeval with
deposition of the lower Mooreville Chalk, but before maximum transgression. Utilizing the
stratigraphic work of Liu (2007) along with the results and discussion presented within this
study, a temporal point of impact is interpreted by this author to occur where the lower
Mooreville Chalk and underlying Tombigbee Sand are gradational (e.g., the inner mid-shelf and
lower shoreface contact). This is presented in Figure 5 along with a synthesis of other
paleogeographic interpretations made by previous authors.

27
Fig
ure
5.
Pal
eogeo
gra
phic
map
of
the
Wet
um
pk
a im
pac
t.
Pal
eogeo
gra
phic
rec
onst
ruct
ion i
s bas
ed o
n
Man
cini
and S
oen
s
(1994),
Kin
g (
1994),
S
avrd
a an
d N
anso
n (
2003),
Kin
g e
t al
. (2
002),
and L
iu (
2007).
28
GENERAL METHODOLOGY
The purpose of this study is to examine and build upon the preliminary results and
interpretations of King et al. (2010) and Jens Ormö et al. (2010) by detailed drill-core analysis.
During the summer of 2009, four wells, including Baillif #1 (well #09-03) and Wadsworth #1
(#09-04), were drilled within the Wetumpka impact crater. These wells were drilled by Boart-
Longyear with funding from the NASA grant NNX09AD90G, awarded to David T. King, Jr. and
Jens Ormö. Field work of descriptions, logging, core-cleaning, petrography, and initial
interpretations were conducted by David T. King, Jr., Jens Ormö, Lucille Petruny, and R. Scott
Harris and presented at the Lunar and Planetary Science Conference of 2011 (King et al., 2010;
Jens Ormö et al. 2010).
Drill-Core Field Extraction and Processing
Both 09-03 and 09-04 drill-core were extracted with similar methods. Core segments of a
maximum five foot (1.52m) length, referred within this volume as “core sections” were cored
using water-based, rotary core-drilling. During core-section retrievals or active drilling, some
drill-core loss occurred; however, due to the experience of the drillers, loss of drill-core was very
low (D. T. King, Jr., personal communications, 2009). Following drill-core extraction, drill-core
was washed in the field; thus, most intervals of drill-core did not need further cleaning. Rarely,
drilling-mud was injected or compacted on the ends of core sections; however, drilling-mud is
easily discerned from original sediment due to high contrast of drilling-mud to original
sediments and broken or abraded ends of core sections. All drilling was conducted in English
units; thus, preliminary logging was measured in decimal feet.
29
Well-Site Descriptions and Locations
Drilling of the 09-03 well targeted the “chalk meadow” which was previously proposed
by King and Petruny (2009) to possibly be post-impact sediment. For this reason, the well of 09-
03 was located at latitude, 32.52595, and longitude, -86.18655 within the “chalk meadow.” A
ground-level elevation for the well of 86.3 m was obtained from a 10-m digital elevation model
obtained from within ArcGis 9.3.1™ (from http://www.alabamaview.org/10m_DEM.html;
accessed on 12 August, 2010; Alabamaview, 2010). This well location is situated within surface
exposures of chalky marl; however, surface exposures of the Eutaw Formation are twenty meters
to the northwest on the opposing side of a gravel driveway, termed “Baliff’s driveway.” The
“Cliffs,” a well-studied and described outcrop of folded-contorted sedimentary megablocks (for
example, see Nelson, 2000; King and Ormö, 2007), is located to the north-northwest with a
distance of 125 m. Total depth drilled was 296 ft (90.2 m). Well-site geologic map is presented
in Figure 6. This map is modified from existing geologic maps of Neathery et al. (1976) and
Johnson (2008) based on outcrop descriptions of the “Cliffs” of previously mentioned sources
and limited field mapping of marl, Eutaw Formation, and Tuscaloosa Group exposures proximal
to the 09-03 well site.

30
Drilling of the 09-04 core hole targeted the crater floor along the presumed shallow crater
edge (personal communication, D. King, 2009); however, the 09-04 well instead penetrated 715
ft (218 m) of predominately sedimentary impactite sands and overturned fold of sedimentary
target stratigraphy, interpreted as the overturned flap. The well-site is positioned near the edge of
the southeastern crystalline rim/ejecta at latitude, 32.5105, and longitude -86.16145. A ground
Figure 6. Well-site geologic map for Baillif #1 (09-03). Insert: drilling operations at
well-site. Dark green (Kt) is Tuscaloosa Group. Light green (Ke) is Eutaw Formation.
Blue is resurge deposits. Map created from limited well-site mapping that was used to
modify geologic map of Neathery et al. (1976).
Baillif #1 / well 09-03
31
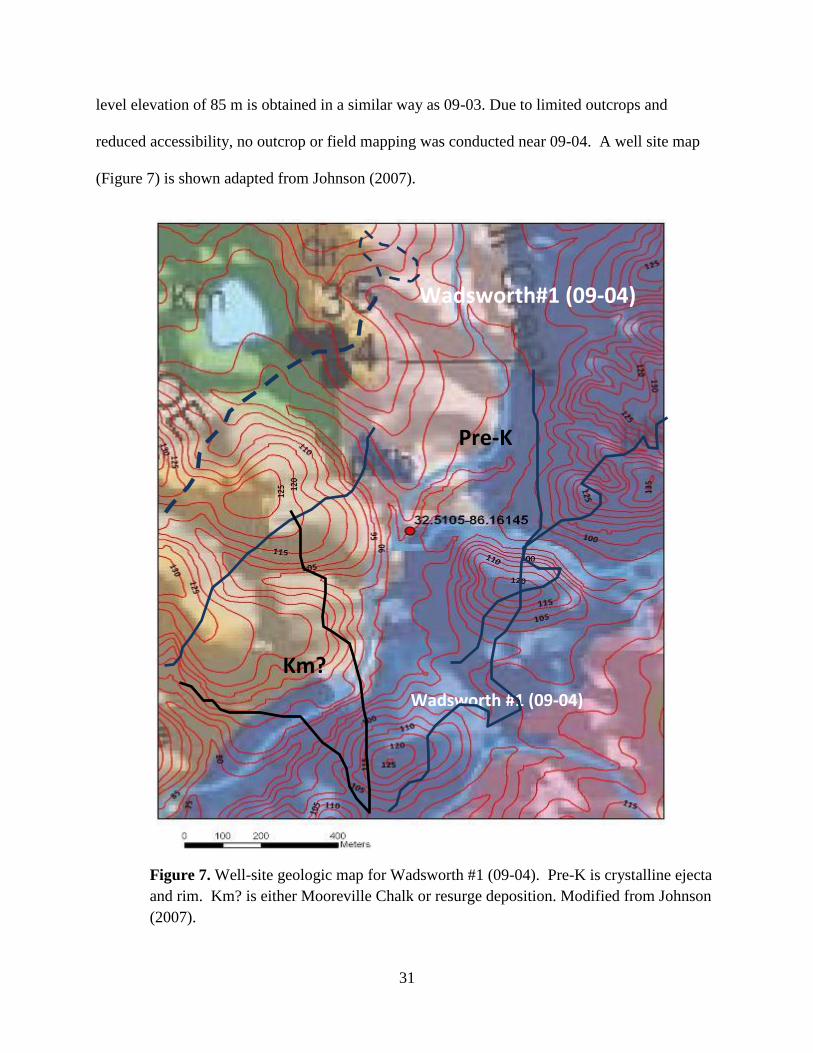
level elevation of 85 m is obtained in a similar way as 09-03. Due to limited outcrops and
reduced accessibility, no outcrop or field mapping was conducted near 09-04. A well site map
(Figure 7) is shown adapted from Johnson (2007).
Wadsworth #1 (09-04)
Pre-K
Wadsworth#1 (09-04)
Km?
Figure 7. Well-site geologic map for Wadsworth #1 (09-04). Pre-K is crystalline ejecta
and rim. Km? is either Mooreville Chalk or resurge deposition. Modified from Johnson
(2007).
32
Drill-core orientation, preparation, cleaning, and photographic documentation
One of the principal objectives of this study is detailed documentation of drill-core from
the 09-03 and 09-04 wells; however, before within some core sections, minor or rare high loss
could occur within each section. If no trending or relatable structures, strong textural affinity,
similar coloration, or broken, matching-core ends are observed across core section boundaries,
the partial core section is positioned in the middle of core section interval as per procedures of
Johnson (2007). However, if two core sections share unambiguous similarity versus the other
neighboring core section, the partial core section is moved towards the similar core section.
Because the core section would then be likely closer to its true position, this is reasoned to
provide more accurate core section placement than arbitrary placement in the center.
Following placement of core pieces, drill-core is ideally oriented relative to each other.
Typically, drill-core orientation is accomplished in the field by the use of a core orientation tool
that grooves the core during drilling (Nelson et al., 1987). However, even under ideal
conditions, due to a variety of factors involving the drilling process, orientation error is generally
+11° (Nelson et al., 1987), and core sections are sometimes significantly rotated before scribing
or grooving (Paulsen, et al., 2002). Therefore, with methodologies discussed by Paulsen et al.
(2000 and 2002), drill-core orientation is accomplished by post-drilling, relative re-orientation,
correlated with independent structural data. The drill-cores of 09-03 and 09-04 were not oriented
in field. However, the non-lithified, generally saturated sediments are poor candidates for
conventional orientation techniques such as onsite or tool grooving and scribing. Thus, the 09-
03 and 09-04 drill-cores are good candidates for post-drilling core section relative orientation
with procedures described below.

33
Similar to the method of Paulsen et al. personal communication), drill core pieces were
fitted along edges of broken core pieces (Figure 8) relative to an arbitrary starting point.
However, unlike Paulsen et al. (2002), orientation was not done with “scribe-lines” (two,
differentially colored sets of parallel and straight lines separated by 180° and parallel to the
longitudinal axis of the core). The “scribe-line” was avoided because most core pieces were
fragile and friable, limiting handling and making scribing long lines difficult and inconsistent.
Instead, oriented drill-core pieces were laid on a flat surface and fitted together. Then, a line was
drawn across the broken boundaries at the apex of the circular core (see Figure 8). Arbitrary
azimuth directions were assigned as follows: down is north, east is right, west is left and, thus,
the marked core apex is south; with the exception of X-ray CT Results, notation of dip directions
was generally kept to general compass directions (i.e., north, northwest, etc.). Successful
orientation was then noted for the core log.

34
Successful relative orientation was most successful within the moderately-lithified
resurge interval as described in CT methodology. Other unconsolidated to poorly
unconsolidated intervals were only oriented if the core pieces were safely capable of handling.
Although core pieces within particular core sections were commonly oriented, relative
orientation across core section boundaries was commonly problematic. Even if core loss was
minimal, unconsolidated core sections commonly had abrasion or disaggregation at the end of
Figure 8. Core fitting and orientation. Top: diagram demonstrating drill-core fitting and
orientation. Bottom: demonstration of core-fitting for two small resurge core pieces
across fractured ends. Illustration at top is modified from Paulsen et al. (2000).

35
core sections. In these instances, physical fitting was not possible. Although in many instances,
probable orientation was still accomplished due to trending oxidation patterns, structural
features, and bedding, notated as “probable.” Even with less certain and lengthwise-limited
orientation within unconsolidated intervals, orientation was still advantageous for study of
deformational features.
Following orientation, drill-core was measured and braced for logging and photographic
documentation. Within gaps between core pieces and core box wall, rectangular or cut pieces of
closed-cell polystyrene foam were fitted into gaps to brace core pieces from moving. The core
boxes are marked at 0.5 ft (15.2 cm) intervals in 09-04 and 0.1 ft (3 cm) intervals in 09-03
directly on top of the box to the right of the core, and depth is written within the interior for each
one foot (30.4 cm) increment. However, the resurge interval in 09-03 was measured previously
by writing depths directly on the core as part of the work for the abstract by Ormö et al. (2010).
Logging and measurements of depth were maintained in English units until data compilation and
writing of this volume when English units are converted to scientific units. Demarcation of
measurements was based on labeled spacers, field notation of core section bottom depth (i.e.,
drill run depths). The field depths of core sections are assumed to be correct.
Although drill-core from 09-03 and 09-04 did not generally need further cleaning such as
air-compressed abrasive treatment of Johnson (2007), drill-core needed local removal of drilling-
mud. With increasing consolidation, drilling-mud was removed correspondingly with brushes,
utility knives, and sandpaper. Although spraying water could not be used to elucidate features,
the friable nature of most drill-core allowed for the use of brushes to gently reveal internal
structures (Figured 9) which then stand out in relief. This additional cleaning helps accentuate
structural features.

36
Methodology for drill-core photographic documentation is similar to methodology of
Johnson (2007) except as follows. The header is reduced to a minimum to increase area
photographed thereby increasing resolution for drill-cores. The header includes a scale in cm and
0.1-ft increments, a color strip of yellow, red, and blue to calibrate photographic colors, box,
well and depth (Figure 10). A digital, 12 megabyte, Canon Powershot D10 is used for high
resolution photographic documentation. Within core boxes as depicted in Figure 10, stratigraphic
up is to the left and each subsequent row below the top is increasing in depth. Within
documentation and logging, each box is abbreviated “B” and each core row is abbreviated “R”
followed by designated numbers, one to five (top to bottom).
Figure 9. Example of method of core cleaning method with brushes. From box 19,
well 09-03, within an interval personal communication Formation.

37
Because the camera focus was located at the center of the core box, distortion due to
“lens bubble” and perspective-derived distortion, loss of focus occurred at the extremities of the
core box. “Perspective-derived” distortion is defined a distortion in which view-point appears
directly above in center and core ends appear angled towards a “vanishing point.” Core box
photographs were corrected for distortions, brightness, and color systematically utilizing the
“batch” function for Adobe®
Photoshop CS2©
as explained by Johnson (2007). Corrections were
conducted by the following parameters: filter, lens correction (distort amount = 4, distort
coefficient 1:-0.04, distort coefficient: 1.04); brightness (-6%); contrast (+24%); and saturation
(+10%). However, following systematic corrections, “perspective-derived” visual distortions still
Figure 10. Example of photograph-corrected core-box digital photograph with labeled
elements.

38
existed along outer extremities. Also, slight blurring existed at outer edges of photograph. After
corrections, for ease of logging, high-resolution digital photographs of core pieces were stitched
together into photo composites of 100 ft (30.48 m) in length. However, due to distortions in
length, pre-measured ticks were used with Adobe®
Photoshop CS2©
transform functions to adjust
each core piece to the proper length.
Generally, ethical guidelines of Cromey (2010) are followed for the treatment and
presentation of digital imagery. This entails the following summarized, relevant guidelines: (1)
correctional processing and image acquisition are identical and adjustments should be simple; (2)
image manipulations are conducted across an entire image; (3) cropping is acceptable if it does
not exclude contradictory data; (4) internal parts of images should not altered by cloning or
copying; (5) original, unaltered image should be kept; and (6) comparison of digital images
should be identically acquired. For some Figures within this text, Adobe®
Photoshop CS2©
brightness and contrast functions have been used slightly and sparingly in order accentuate
observed features and for the ease of the reader; however, further alterations are < f15% and do
not significantly alter the image from the subjects original appearance. Furthermore, due to
varying post-drilling saturation of low permeable and high porosity core sections, some core
pieces retained water which could make some core pieces relatively darker or lighter.
Drill core description and logging
The 09-03 and 09-04 drill cores were described and logged in nearly identical ways. Due
to the shorter length and the importance of the resurge interval, 09-03 was logged at 0.1ft (3cm)
intervals whereas 09-04 was logged at 0.2 ft (6.1 cm) intervals due to a doubled length.
Otherwise, the same characteristics and parameters were recorded for each drill-core with the
exception of grain-size which is explained below. For visual estimates of volume (%), visual

39
estimators of Terry and Chilingar, (1955) are used. Initially, descriptive parameters were
recorded on data sheets, and quantitative data were transferred to a Microsoft®
Excel®
sheet.
Additional notes for observations were recorded in notebooks for each core box that build upon
or were absent in original field notes. Some selected photographs were taken drill-core features;
however, due to the high-resolution core box photographs, features on drill core surfaces did not
require further photography in most instances. Internal features did require additional
photography.
The following explanations and nomenclature for each parameter for each logged interval
are listed below:
Color: Drill-core was compared to Munsell Color® Rock-color charts (Munsell Color
Company, 2009) for standardized names of colors along with appropriate descriptors
(i.e., mottled, banded, etc.).
Grain-size: Using pre-sieved sediment as suggested by Graham (1998), a grain-size
comparator was used to visually estimate the most common grain-size according to
the Udden-Wentworth scale. For particles larger than boulder-sized (> 4m),
descriptive classes of Blair and Macpherson (1999) were used for megaclasts. Grain-
sizes were recorded to the nearest 0.5 φ (phi) class. For example, medium sand
would be recorded as “1.5,” slightly coarse sand would be “1.0” and coarse sand
would be “0.5”. Finally, in addition to a visual estimate of common grain-size for 09-
04, maximum grain-size (in mm) was recorded because of the presence of
conglomerate as suggested by Graham (1998).
Sorting: Sorting of sediment was estimated from visual estimators (see Figure 5.7,
Harwood, 1998) and recorded in a numerical format for well-sorted (0.35),

40
moderately well-sorted (0.5), moderately-sorted (0.7), poorly-sorted (1.0), very
poorly-sorted (2.0) and extremely poorly-sorted (4.0).
Roundness: A range of common clast roundness was visually estimated and recorded
as a numerical value for angular (1), sub-angular (2), sub-round (3), rounded (4), and
well-rounded (5).
Intergranular and fabric: Fabric characteristics, i.e., matrix or grain-supported, were
recorded. Character of interstitial material was also recorded. Nomenclature for
stratification thicknesses and type follows McKee and Weir (1953) where laminae are
<1.0 cm in thickness.
Inclinations: planar features (i.e., faults, laminae, bedding plane) are measured with a
plastic protractor at core surface where viewpoint is parallel to strike.
Sedimentary Structures: Sedimentary structures are logged with nomenclature from
Collinson and Thompson (1989) and with additional visual aids from Ricci (1995).
Deformational Structures: These structures are recorded with nomenclature for
structural discontinuities (i.e. faults, fractures, etc.) from Schultz and Fossen (2008)
and for fold and ductile deformation from Twiss and Moores (2007). If sense and
amount of offset for faults could be seen, then they are recorded.
Effervescence: Using at least two HCl drops per 0.5ft (15.2 cm) and 0.4ft (12.2 cm)
intervals, respectively for 09-03 and 09-04, the intensity of the reaction is assessed
and is assumed to be a rough approximation for relative carbonate content. Each
droplet is observed, and using visual estimators of Terry and Chilingar (1953) a
percentage is estimated for the density of bubbles at the peak of the acid reaction.
This is then classified as follows: marginal, intermittent reaction, 0-2% (bubble

41
density); very weak, continuous reaction, 2%-5%; weak 5-10%, moderate 10-30%,
strong, 30-50%; very strong, 50%-90%, explosive, no visible fluid, fast reaction 90-
100%. Each effervescence recording is converted to the number at the high end of
the range. Variable reactions are averaged.
Mineralogy: Grain mineralogy as interpreted from hand lens, occasional smear slide,
and optical microscopy. Descriptors of accessory minerals include trace (0-2%),
sparse (2-5%), and moderate (5-10%).
In addition to smear slides and hand lens examination, 20 thin-section slides were created (see
personal communication able 1). Seven samples were chosen from 09-03 to elucidate resurge
matrix, the uppermost chalk of the resurge, structureless sands intercalated in semi-intact Eutaw
intervals and the lowermost sand, believed to be the uppermost interval of Tuscaloosa in 09-03.
Moving in stratigraphic order from the bottom of 09-04, thirteen samples were selected along
approximately 30 ft (9.1 m) or until the first structureless sand is encountered. Oriented samples
were cut out in a pie shape and sent to National Petrographic for epoxy impregnation and thin-
section production.

42
Table 1. List of thin-sectioned samples wells marked 09-03 and 09-04 (used in this study).
Thin-section # Well Lithology being investigated
03-0.6 09-03 uppermost chalk-resurge
03-57.55 09-03 chalk clast-resurge
03-74.9 09-03 resurge matrix
03-83.5 09-03 resurge matrix
03-87.64 09-03 semi-intact Eutaw sand
03-92.6 09-03 impactite sand
03-207.1 09-03 fluidized impactite sand
03-295.8 09-03 uppermost Tuscaloosa sand
04-339.7 09-04 structureless impactite sand
04-381.6 09-04 structureless impactite sand
04-420.6 09-04 fluidized impactite sand
04-469.6 09-04 Eutaw megaclast
04-481.8 09-04 weakly-laminated impactite sand
04-511.1 09-04 contorted Eutaw personal communication sand
04-577.2 09-04 structureless impactite sand
04-611.3 09-04 structureless impactite sand
04-619.3 09-04 weakly-laminated impactite sand
04-672.9 09-04 contorted Tuscaloosa Sand
04-674.1 09-04 saprolitic, metamorphic clast
04-699.4 09-04 structureless impactite sand
Utilizing 200-350 total point counts per slide was conducted using a 0.2-mm step grid
from the each quadrant and the center of the thin section. In addition, shocked minerals and
impactite glass were searched for using imagery and descriptions of French (1998) and French
and Koeberl (2010). All minerals observed along with general textural features were recorded.
Descriptions of thin-section petrography, petrologic terms and scheme of Carrozi (1993).
Results of thin-section petrography of drill core 09-04 are presented in the Appendix.
Upon finishing descriptions and notation of drill-core, lithofacies within 09-04 and 09-03
were characterized and logged using LogPlot®
3.4. Logged intervals of breccia and megabreccia
were also assigned to Tuscaloosa Group, Eutaw Formation, and Mooreville Chalk based on
defining characteristics as discussed in Target Stratigraphy. In summary, iron-oxide-stained,

43
red-orange terrestrial sands and mudstones are assigned to Tuscaloosa. Non-calcareous sands of
marine or marginal marine are assigned to the Eutaw Formation. Where primary calcium
carbonate (marl) is present and if sands exceed marl, then the unit is assigned to Eutaw
Formation (Tombigbee Member). If marl exceeds sand content, then it is assigned to the
Mooreville Chalk. Also, bedded or laminated lignite is, based on existing literature, likely
diagnostic of Eutaw Formation. Summaries of descriptions and notations of logging are also
compiled within the Logplot®
3.4 software. Digitial logs and photo-composites of 09-03 and 09-
04 are attached by CD-ROM.
X-RAY COMPUTED TOMOGRAPHY METHODOLOGY
X-ray computed tomography (CT) is a powerful technique that is relatively new to the
geosciences; however, within the past three decades in the fields of petrology, paleontology and
4d experimental studies, X-ray CT have made and are making substantial advances (Carlson et
al., 2003; Cnudde et al., 2006). The CT method has a number of crucial advantages. As opposed
to classical petrological techniques such as thin-section petrography and polished sections, X-ray
CT allows true 3d spatial understanding of a sample in a relatively short period of time with (if
properly calibrated and scanned) accurate, quantitative data to accompany excellent, qualitative
observations. Moreover, X-ray CT methods are non-destructive and non-invasive which are
ideal for valuable, rare specimens of meteorites and fossils such as the resurge interval of the 09-
03 drill-core.
In analysis of drill core, X-ray CT is a heavily used and proven technique for drill core
applications and study. Flisch and Becker (2003) utilized X-ray CT to identify features, within
unconsolidated lake sediment as paleoseismological evidence that traditional X-radiography or
purely visual observations would have missed or misinterpreted. Gagnoud et al. (2009) used X-
ray CT, in part, to identify and distinguish bioturbated lithofacies from turbidites in their study of

44
Late-sectlioned muds. Furthermore, within the application of drill core analysis, X-ray CT has
been used for general sedimentology (Orsi et al., 1994); porosity, permeability, and fluid phase
studies within petroleum engineering (Akin and Kovscek, 2003); sedimentological, quantitative
studies of mineralogical composition and porosity within sandstones (Long et al., 2009); and
comparisons with traditional microscopic techniques and X-ray CT for porosity studies (Van
Geet et al., 2003). With an established record of successful results of drill core analysis and for
its non-destructive advantage, X-ray CT was the chosen method for study of the fine-grained
sediments of the 09-03 resurge interval.
Fundamentals of X-ray CT scanning
Fundamentally, X-ray CT is composed of a source that emits an X-ray fan-shaped beam
at a known total energy, a subject of study, and a detector or array of detectors that measure the
average energy of the x-ray beam after passing through the subject. Upon passing though the
subject of study, a portion of the total energy of the x-ray beam is lost and becomes attenuated.
As the X-ray beam sweeps over the subject, measurements derived from attenuation allow
average density for a 3d slice of voxels to be calculated by a complex, internal set of algorithms.
A subsequent computation allows the 3d voxel slices to be back-projected into a 2-d slice in
which each pixel actually represents the average attenuation coefficient (derived from density) of
3d space of voxel (Duliu, 1999). Appropriately, Ketcham and Carlson (2001) analogously
compare this to slicing bread in which a series of slices are taken and then can be put together to
later recreate a 3-d reconstruction of the subject.
Within X-ray CT, the two basic types of scanners are medical CT and industrial
computed tomography. Although medical CT has been utilized for some time within geological
studies, medical CT are optimized for living subjects; therefore, medical CT is built to minimize

45
x-ray exposure to the subject, increased speed, and typically have lower resolution than their
industrial counterparts (Duliu, 1999). In contrast to medical CT, which typically has resolution
in large fractions of millimeters, industrial CT that includes high resolution, ultra-high
resolution, microtomography, and nano-CT typically has scales of observation (field of view) of
decimeter, centimeter, millimeter, and sub-millimeter and resolution of 100 micron, 10 micron, 1
micron, and nanometer, respectively (Carlson et al., 2003; Cnudde et al., 2006). Nevertheless,
medical CT was utilized in this study because of its accessibility at Auburn University, lower
financial cost as compared to industrial CT, and large field of view. Consequently, the entire 28
meters of the resurge interval could be scanned.
Whether the utilized CT machine is industrial or medical, a large variety of
configurations exist. However, as discussed by both Duliu (1999) and Ketcham and Carlson
(2001) and depicted in Figure 11, all modern X-ray CT machines can be classified according to
scan geometries referred to as first through fourth-generation: (I) first-generation is a linear
‘pencil beam’ to detector that translates across the object with subsequent scans at multiple
angles; (II) second-generation is similar to first generation but incorporates a fan beam with
corresponding arcuate detectors; and (III) third-generation in which the fan beam encompasses
the entire object and either the object is rotated or the source and detector are rotated around the
object. Referred to in the literature, occasionally, as spiral or helical CT (see description for
helical CT in Schreurs et al., 2003; Yazdi and Beaulieu, 2008), Medical CT is considered a
fourth-generation technique and consists of a fan beam with a opposite, fixed ring of detectors
that revolves around a subject which then translates through the scanning plane. The helical
configuration (4th
generation) is the configuration utilized in this study.

46
Figure 11. Schematics for detectors, source and subject utilized within X-ray CT for the
geosciences for 1st, 2
nd, 3
rd, and 4
th generation CT scanners. Typically, industrial scanners
use 1st, 2
nd, and 3
rd geometries, and medical (helical) scanners use 4
th generation
(Ketcham et al., 2001). 4th
generation is the configuration utilized in this study.
Schematics are from Robb (1982).

47
Calculating attenuation values in x-ray CT
Because matter, either though specific atomic species or density of a material, attenuates
focused X-ray beams, the average density of a particular voxel (the 3d equivalent of a pixel) can
be calculated. This attenuation occurs because of three main processes: photoelectric absorption
(total absorption of an X-ray photon), Compton scattering (partial absorption of an X-ray
photon), and pair production (conversion of an X-ray to a positron-electron pair). Photoelectric
absorption, compton scattering, and pair production are predominate at beam energies of up to
50-100 keV, 5-10 meV, and above 10 meV, respectively. Because photoelectric absorption is
more sensitive to the composition of specific atomic species, the best resolution is achieved
when lower energies are utilized. However, the use of lower energy beams, as will be discussed
later, have consequences for the generation of reconstructed slices (Ketcham, et al. 2001).
Each particular voxel has an intrinsic attenuation coefficient defined by the density of the
volume scanned and its constituent atomic species. Fundamentally, calculation of the attenuation
coefficient is made possible in a homogeneous material assuming a monochromatic beam by
Beer’s Law:
(1)
where I0 is the original X-ray intensity in keV, I is the measured x-ray intensity, x is the
thickness of the material scanned, and µ is the calculated attenuation coefficient expressed as
1/length. Of course, geological materials are not homogeneous, and thus must be calculated
utilizing this equation:
∑ (2)
where i is an increment of a single material along the linear extent of xi.
48
Furthermore, as mentioned, briefly, by Akin and Kovscek (2003) and Van Geet et al. (2003) with
more in depth discussion by Ketcham and Carlson (2001), X-ray beams are assumed to be
monochromatic from initial calculations (equation 2) to reconstructed 2-d slices by computer
algorithms. This assumption allows specific density values to be assigned per pixel and lessens
computational complexity but potentially introduces artifacts into the final image (again, see
Ketcham and Carlson (2001) on discussion of reconstruction 2-d techniques and problems).
Attenuation of Constituent Minerals
Scanning parameters that could be controlled in this study are the x-ray beam intensity in
keV, the amount of current in the x-ray tube in mAmps, field of view, resolution (field of
view/amount of pixels) and the scanning time per slice. Within X-ray CT as explained by Duliu
(1999) the output parameters are calculated in either CT numbers (industrial scanners) or
Hounsfield units (medical scanners). Computed tomography numbers roughly correspond to
increasing bulk density in a relative sense (g/cc2), and Hounsfield units (HU) are scaled so that
water and air have a value of 0 and -1000, respectively (for discussion on proper conversion of
HU and CT to true density, see Akin and Kovscek, 2003). Finally, pixel resolution is fixed on
many medical CT scanners and has limited variability on industrial scanners, but field of view
can be controlled (Ketcham and Carlson, 2001). Therefore, true resolution is variable depending
on the field of view chosen which can be manually calculated.
In addition, as evident in Beer’s law (equation 1 and 2), scanned thickness can be an
important parameter in the consequential, measured values of CT and Hounsfield units, degree of
noise, and amount of artifacts. However, in this study, in order to change scanned thickness,
drill-core would have to be cut to optimal lengths that may have increased resolution and
reduced noise but would have compromised one of the main advantages of X-ray CT (non-

49
destructive analysis). By increasing scan times, noise derived from insufficient beam penetration
can be minimized (Duliu, 1999).
In the case of X-ray energy (keV), there will be always some degree of compromise and
trial and error to achieve optimal conditions. Prior analysis of attenuation coefficients for
anticipated mineral composition allowed correct beam energy to be chosen for an optimal
resolution in conjunction with minimized noise of photon starvation. In this study, the targeted
x-ray beam energy was ultimately 120 keV. Principal mineralogical constituents were
determined from drill-core inspection and reported clay mineralogy from an extra-crater
Mooreville Chalk outlier (Clarke, 1965). As demonstrated by Figure 12, the expected, principal
mineral phases, quartz, calcite, kaolinite, illite, apatite (OH), and pyrite, show some small
separation in their corresponding attenuation coefficients. However, kaolinite and quartz show
marginal differences whereas illite has moderately-elevated attenuation values, and calcite,
apatite, and pyrite have contrasting values.

50
As depicted in Figure 13, attenuation of sample minerals shows that grayscale values of
quartz and calcite are similar in appearance within X-ray CT. With a keV setting of 100 keV,
calcite, quartz, and kaolin are measured with a mean value of 2390, 1590, and 760 HU,
respectively. With a keV setting of 120 keV, calcite, quartz, and kaolin are measured with a
mean value of 2060, 1640, and 890 HU, respectively. With a differential of 3.1 x and 2.09 x of
calcite and quartz to clay (kaolin) for a keV of 100 and 2.3x and 1.8x differential for a keV of
120, quartz and calcite are far closer in attenuation than to the sample clay. This can be
appreciated qualitatively in Figure 13, where clay contrasts with quartz and calcite with darker
gray scale values. Thus, based on prior parameters that affect attenuation (mineral phases,
0.200
2.000
80.00 90.00 100.00 110.00 120.00 130.00
μ
Energy (keV)
Attenuation (μ) vs. Source Energy
quartz
calcite
pyrite
apatite (OH)
koalinite
illite
Figure 12. Linear Attenuation coefficient (µ) as a function of X-ray beam intensity (keV). The
mineral phases shown are expected, principal mineralogical constituents within the scanned
interval of core in this study. Obtained from the University of Texas at Austin MuCalcTool at
www.ctlab.geo.utexas.edu/software/index.php.

51
density, and porosity) appreciable dark grayscale values likely indicate qualitatively higher clay
content or greater relative porosity.
calcite
quartz kaolinite
kaolinite quartz
Figure 13. Attenuation of constituent minerals of the 09-03 resurge interval. This Figure shows
3 samples of the most common mineral constituents of the resurge juxtaposed with the drill-core
at two different beam energies (see red arrows). Note similar attenuation values (grayscale
values) of quartz and calcite as compared to darker value for kaolinite and greater contrast at
lower keV.

52
The limitations and artifacts in X-ray computed tomography
Furthermore, concentrated glauconite grains impart a generally high attenuation value
similar to calcite in appearance. Likewise, pyrites have exceedingly high attenuation values
manifest as a near pure white grayscale value. Pyrites are easily differentiated from glauconite
and calcite due to starburst artifacts (described below) that involve dark, data-loss shadows and
white, false-high attenuation streaks. Starbursts are assumed to be diagnostic for pyritiferous
concretions.
For any scientific approach in observation, artifacts are an inescapable reality in both
direct and indirect methods. Within X-ray computed tomography, artifacts that emerge in
scanned primary cross-sections and 3d, interpolated reconstructions are the main limiting and
complicating factor for both quantitative and qualitative objectives. In quantitative and
qualitative analysis, proper identification and understanding of artifact generation allow the
proper remediation and minimization of artifacts through pre-scanning calibration, proper
scanning methodology, and post-computational image remediation. Common artifacts, which
are often encountered effects within this study, include the following: (1) beam hardening; (2)
partial-volume effects; (3) photon starvation; (4) starbursts; and (5) artifacts due to non-
cylindrical cross-section. Ring artifacts are common artifacts with industrial CT scanners and 3rd
generation configurations; however, they are not a problem with medical scanners.
Photon Starvation
This artifact manifests in CT images as a mesh of angled streaks (see Figure 14) that
degrade the image by increasing the amount of noise. Fundamentally, this artifact arises from an
insufficient number of photons due to a lack of penetrating power of the X-ray beam (Yazdi and
Beaulieu, 2008). In this study, these artifacts were excluded or minimized by simply increasing
calcite

53
the beam energy (100 keV to 120 keV, 300 mAmp) and increasing exposure time (two seconds
per slice), following consultation with the High Resolution X-ray CT Facility at the University of
Texas at Austin (M. Colbert, written communication, 2010). However, even with both
maximum current (mAmps) and scan-time values, photon starvation artifacts were reduced but
not excluded due to the thickness and density of drill cores, particularly within core sections that
exceed field of view. Yazdi and Beaulieu (2008) discuss, briefly, an optimal adaptive filtering
technique to reduce photon starvation-derived noise; however, the photon starvation technique
does not eliminate the artifact and was not utilized in this study.
Beam Hardening
Beam hardening is a ubiquitous artifact in X-ray CT and is particularly troublesome for
quantitative analysis. As previously explained by Ketcham and Carlson (2001) and Duliu
(1999), X-ray tomography computations are based on the assumption of a monochromatic X-ray
beam despite the fact that X-ray sources emit a polychromatic beam. The result is that the
scanned study material acts as a filter that removes weaker portions of the beams’s X-ray
spectrum and raises the average energy of the incident beam (Ketcham and Carlson, 2001; Van
Geet et al., 2003). When the effective attenuation coefficients are calculated using Beer’s Law,
the beam hardening effect manifests in the resulting images as proportionally, higher attenuation
values (lighter) near the outside of the object and false, lower attenuation values (darker) in the
center of the object as evidenced in Figure 15 (Ketcham and Carlson, 2001; Van Geet et al.,
2003). In the case of the longitudinal scans of the drill cores of this study and others, the beam
hardening effect manifests as a lightning near the opposing ends of the core in this study or
termed “cupping” by Akin and Kovscek (2003) in transverse drill core cross-sections and
cylindrical or spherical subjects.

54
Figure 14. Beam hardening artifacts in X-ray CT. Examples of beam hardening artifacts for 100
keV (top) and 120 keV (bottom). Note the parabolic trend within grayscale analysis for the
beam hardening artifact (obtained with National Institute of Health ImageJ 1.44; see Abramoff et
al., 2004 for description of ImageJ). Note the typical x-shaped beam hardening pattern within
the more homogenous core-section (top, red arrows). For grayscale, black=0; white=250.

55

56
Ideally, beam hardening remediation is accomplished during scanning by pre-attenuating
the X-ray beam through either a metal foil of aluminum and brass or a wedge of material that
surrounds the object with the same attenuation coefficient as the dominant mineral phase of the
scanned object (Ketcham and Carlson, 2001; Akin and Kovscek, 2003). However, in the case of
medical CT, application of filters in front of the source are not possible as in industrial CT;
therefore, in these cases, a carbon fiber or thin (1.0 mm) aluminum core tubing-container is
constructed to filter the x-rays (Akin and Kovscek, 2003). Because the pre-filtered X-rays are
more attenuated, they have higher average energy. Thus, image definition is reduced as
subsequent attenuation is dominated increasingly by compton scattering resulting in a decrease
of noise to signal ratios and less variability of attenuation coefficients. Furthermore, if photon
starvation is present in an unfiltered CT scan due to a lack of penetrating power, a CT scan of a
filtered object at the same level of energy will only exasperate the photon starvation artifact.
Due to the methodology of this study, beam hardening effects are substantial within CT
images. In contrast, to descriptions of “cupping” within previous literature (i.e., Akin and
Kovscek, 2003), the cylindrical shape of drill-core impart a general parabolic trend of false low
attenuation in the center to normal values at the extremities. Moreover, along the maximum
distance of transect, CT images show false low attenuation values from opposing corners. Thus,
beam hardening artifacts manifest as a x-shaped artifact anchored at the corners of the drill-core
as depicted in Figure 15. Beam hardening is lessened considerably for short core pieces and
substantial for core pieces that exceed field of view. Beam hardening are detrimental and
prohibitive for quantitative, grayscale analysis (i.e., density) and will likely require complex,
computational remediation for grayscale analysis due to variable core length. However, beam-

57
hardening effects are easy to identify and predictable in position; thus, they are not detrimental
for interpretation of qualitative observations.
Partial Volume Effects
As previously mentioned, each pixel of a cross-section is actually an averaged attenuation
of a voxel of a real scanned volume. Therefore, a feature of sufficiently contrasting density,
atomic species and size that exists beyond the resolution of the scanner can affect the calculated
attenuation coefficient (Ketcham and Carlson, 2001). Because geological materials are not truly
homogeneous at all scales, CT images always have some degree of blurring that can be attributed
to partial volume effects. On the other hand, because features within a scanned volume beyond
resolution can affect the final, calculated attenuation value, it is possible to know where those
feature exist if they are independently observed by another technique (Ketcham et al. 2001).
Other than a slight loss of definition from blurring, partial volume effects are not believed to
significantly compromise observations made in this study.
Starbursts
As discussed by Van Geet et al. (2000) and Ketcham and Carlson (2001), if a feature
within a scanned volume has high contrast in density to a surrounding matrix, a starburst artifacts
forms with dark streaks that do not allow any definition within the emanating shadow (as evident
in Figure 15). Typically, these artifacts are created by either sulfides or metal oxides, and the
dark streaks are actually secondary radiation emanating from the offending inclusion. If a
scanned sample has prolific metal oxides or sulfides (i.e., a pyritiferous mudstone), remediation
may include either an aluminum and brass foil filter in front of the detector to screen the
secondary radiation, or a drill core can be sheathed in an aluminum-brass foil (Van Geet et al.,
2003; Ketcham et al., 2001) for the use of medical computed tomography. However, such filters
58
can lower beam strength, and if this results in insufficient signal strength, photon starvation,
definition-loss can result (Van Geet et al., 2001).
In an attempt to remediate star burst and beam hardening artifacts, an aluminum sheath
for the drill-core was fabricated from aluminum containers to approximate an aluminum, core-
holder filter of one mm wall thickness (similar to filters described from Akin and Kovscek,
2003). However, following preliminary scans at targeted beam energies (100 and120 keV; 200
mAmps), photon starvation artifacts were greatly elevated to point where even qualitative
observations were not possible. Thus, the constructed filter was abandoned, and following
increases in 300 mAmp current and increased scanning time, photon starvation artifacts were
reduced to a point where consistent, qualitative observations were possible. Likewise, beam
hardening and starbursts appeared less problematic. In fact, starburst artifacts when compared
with corresponding areas of the actual drill-core were found to be produced by pyritiferous
concretions. Therefore, areas with exceedingly high attenuation values accompanying starburst
are assumed to be pyrite concretions.
Ring Artifacts
Ring artifacts are a significant problem within industrial CT scans that use third-
generation geometry. When detectors have variable output due to variable external conditions
such as temperature or inconsistent performance, an artifact is evident as complete or partial
concentric rings centered on the axis of rotation. Remediation of ring artifacts can be removed
by software by converting a reconstructed image into polar coordinates and the removal of linear
lines. However, there is a possibility that data can be lost if a linear feature is tangential to a
circle about the rotational axis (Ketcham, et al. 2001). However, for medical CT, ring artifacts
have not been encountered in the scientific literature nor observed by this author for scans of this

59
study. As medical CT is typically fourth generation configuration, ring artifacts were not a
problem for this study.
Artifacts due to non-cylindrical cross-section
The cross-sectional area of CT is circular and internal algorithms assume a roughly
circular cross-section; thus, objects that do not have a circular shape and have sharp angular
edges produce artifacts in cross-sectional two-dimensional (2d) slices that create a x-shaped
artifact that have apparent higher attenuation streaks that connect the longest axes of a 2d shape.
Remediation other than alteration of object shape is not known by this author. This is a
commonly encountered artifact in the longitudinal scanning of this study (see Figure 14 for
example).
Drill-core preparation and X-ray CT scanning procedures
Due to minimal core-loss in the 09-03 drill core, resurge interval, individual core-sections
could be carefully re-fitted and therefore oriented relative to each other as per procedures
described in drill-core preparation. This orientation was conducted twice to insure no errors in
orientation. Within the resurge interval, only at three points were there any uncertainties due to
insufficient fitting or changes in drilling methods. Orientations across these points were made
possible with trending, inclined-features in either or both visual and X-ray CT observations.
Although true (absolute) azimuth orientation of 09-03 drill core is not known, the entire resurge-
interval had a relative orientation and individual core sections were rotated clockwise in 90-
degree increments when necessary to insure that inclination of features was parallel with CT
slices.
For pre-scanning preparation and during scanning, core sections were prepped so that
subsequent measurements and observations would be free of unnecessary errors. Because core

60
sections could, in some instances, exceed the field of view, the volume of space that can be
scanned, core sections were centered at the midline of each core box, braced to prevent
movement, and depth-measured at the midline for a depth reference point. During scanning,
some loss occurred at the ends of a few sections but loss was minimal. Where loss uncommonly
occurred, loss was in low single-digit centimeters. This is not believed to have affected
observations or interpretations. Finally, each core box, as depicted in Figure 16, was oriented so
that the stratigraphic up-direction was always to the right. A thin metal wire was taped across
the mid-line to create a depth-reference line for overhead scans and a depth-reference dot for
longitudinal scans.

61
Figure 16. Preparation for X-ray CT. This image shows the orientation and order for longitudinal
slices. Entire core boxes were scanned along contiguous slices starting with deepest core row, in
this instance B10R5, and systematically progressing towards the most shallow core row (B10R1).
Core box is oriented with stratigraphic up to the right (white arrows). Thus, R=Up in longitudinally
sliced images. Red arrow shows reference line of core box midline. Blue arrow shows field of
view area (DFOV). Green arrow shows pixel resolution. Pink arrow shows beam parameters and
scanning time. Yellow arrow shows window (w) and level (l) which control brightness and
contrast. In all CT images, tick marks (bottom and left margins) are one cm.

62
At Auburn University College of Veterinary Medicine, a fourth-generation medical CT
scanner was used to take 20 longitudinal (stratigraphic) slices per core section with the following
scanning parameters: (1) x-ray beam energy at 100 keV in the upper 3.8 m and 120 keV
(kilovolts) below 3.8 m with 300 mA (milliamps) throughout, (2) scanning time at 2.0 sec per
longitudinal slice, and (3) 3-mm section intervals. Also, the field of view was a circular cross-
section with a diameter of 47.9 cm for a scanned area of 1800 cm2 within a resolution of 512 x
512 pixels. This creates an actual resolution of 0.69 mm per pixel. Because of the methodology
utilized in this study, prominent noise and beam hardening artifacts are present; however, the CT
images are still far superior to visual observation alone for both qualitative and limited
quantitative analysis.
Utilization of X-ray CT data for core logging, observations, and strike and dip data
Following acquisition of X-ray CT data, observations and descriptions were made in
tandem with descriptions and observations with the actual drill-core. Due to the fine-grained,
low-contrast characteristics of the resurge interval, X-ray CT longitudinal slices provided the
bulk of descriptions and observations that allowed deformational and sedimentary structures and
delineation of lithofacies. Longitudinal slices are a preferred method to investigate stratigraphic
and structural characteristics of drill-core (Ashi, 1997). However, as X-ray CT is an indirect
method that only images contrasts of density and mineralogical species, some observations and
descriptions could only be accomplished with conventional inspection with hand lens,
microscopy, and the “naked eye.” In the event, an observation was made with the “naked eye,”
the resulting description, elucidation, or observation is referred to as “visual inspection” or
“visually inspected.” Often, it was advantageous to use visual inspection, typically high-
resolution photographs, and X-ray CT data simultaneously to investigate the resurge interval.

63
In a similar fashion as the high-resolution photographs, X-ray CT images extracted with
SoundEklin eFilm, a DICOM (Digital Imaging and COmmunications in Medicine) viewer, views
were stitched together within Adobe Photoshop CS2 to create a photographic strip log. Within
this photographic log, a first track was created with consistent window and level parameters
(brightness and contrast controls). In a second track, window and level were adjusted to show
structures in the best way. Observations were recorded and sketched for each core section. In
addition, movies of contiguous slices of each core box were produced by the Osirix 3.9.4. Osirix
3.9.4 was also used to extract some images. Some Volume Rendering and Multi-planar
Reconstruction (MPR) were attempted with Osirix, but, in most instances, noise and artifacts
prevented unsatisfactory 3-d reconstructions. Volume rendering creates a volumetric 2-d
representation of 3-d data where surfaces defined by attenuation thresholds. MPR is a simpler
reconstruction in which the stacking slices are used to reconstruct a volume. Nevertheless, 3-d
reconstructions were sometimes good tools to understand spatial relationships of some
sedimentological features and structures.
Although noise and artifacts generally prevented quantitative estimates of attenuation and
thus density, resolution and definition were sufficient to measure the strike and dip of planar
structures and the inclination of linear structures (sectioned cylindrical burrows). Measurements
of strike and dip data were accomplished by first establishing an arbitrary north from which an
azimuth would be measured. Looking directly into the core box oriented stratigraphically
became “north or 000 bearing.” Thus, for purposes of X-ray CT images, east (090°) was defined
as right or “foot” for CT; south (180°) was defined as looking out of the core box or posterior for
CT, and west (270°) was defined as left or “head” for CT. Utilizing Osirix and its 2-d MPR
function, quantitative measure of strikes and dips were obtained (Figure 17). The 2-d MPR

64
function has three panels each of which has a crosshair. Each crosshair has an axis that controls
the slice or viewing plane of the other panels. By moving and rotating the crosshairs, the first
panel is used to image an overhead view of the corebox, the second panel is used for a down-
borehole view where up equals north and right equals east, and the third panel is used for a
conventional, longitudinal (stratigraphic) slice view. After checking orientations, the overhead
panel is used to target a planar structure by moving the crosshair to a feature of interest. Within
the second panel, the crosshair is rotated so the third panel axis is parallel to strike. Then, the
dipping feature in the third panel should be at maximum angle and the dipping direction is
recorded. The distance to reference point is recorded. All measurements are recorded in an
Excel® spreadsheet where they are adjusted if they have been rotated from orientation during the
CT prep phase. True depth is calculated of each feature, and an appropriate class (i.e.,
lamination, fracture) is assigned.

65
09-03 DRILL-CORE RESULTS
The 09-03 drill-core is comprised of three basic genetic facies. From the top to bottom,
they are: (1) resurge-deposited calcareous, glauconitic, sandy mudstone (marl) with sedimentary
structures of both gravity and aqueous flow; (2) a semi-intact, rotated and folded Eutaw-
Tuscaloosa mega-block formed by mega-slumping/avalanche deposition; and (3) impactite sand
injection and in-situ disaggregation situated within the Eutaw-Tuscaloosa megablock. The latter
two genetic facies comprise what is called herein the ‘megablock and impactite sand complex.’
The three fundamental genetic facies of the 09-03 and their constituent lithofacies are reported
below in stratigraphic order (i.e., oldest first) along with relevant observations of structural,
sedimentological, and stratigraphic characteristics.
Figure
Figure 17. Acquisition of strike and dip utilizing Osirix and X-ray CT data. Top screen capture
shows strike measurement. Bottom screen capture shows dip angle and direction measure. Top
left panel shows strike direction. Bottom left panel shows dip angle. Right panel shows
overhead view and helps determine dip direction. In this example, A = north; S = east; I = west;
P = south; and R = up.

66
Megablock and Impactite Sand Complex: General Stratigraphic and Sedimentological
Characteristics
The interval of interbedded semi-intact Eutaw-Tuscaloosa and impactite sands begins at 90.2
meters (at the end of the hole) and is continuous to a depth of 25 meters; however, based on criteria
presented elsewhere, only the lowermost 0.5 meter can be attributed specifically to the Tuscaloosa
Group. As shown in Figures 17a and 17b, the Eutaw mega-block is punctuated by three significant
zones of disturbance: (1) disrupted zone 3 (dz3) of interpreted disaggregation and brecciation
underlying the resurge interval, delineated from 25 m to 34.5 m depth; (2) disrupted zone 2 (dz2) of
injected impactite sands, fluidization, and brittle-deformation, delineated from 56 m to 66 m depth;
and (3) disrupted zone 1 (dz1) of possibly both injected impactite sands and brecciation of
indeterminate length at the base of drilled interval, delineated from 84 m to 90.2 m depth.
Again, as depicted within Figure 18, general sedimentological and stratigraphic trends
include a general fining-upward from gravelly, coarse sands at base to fine to very-fine-grained sands
near the top of the whole of the megablock-impactite interval along with a less well-defined
increasing of sorting upwards. Further, with increasing depth, the Eutaw-part of the mega-block is
increasingly more indurated owing to iron-oxide cementation and sparse-interstitial, authigenic silica
cementation. With increasing depth, decreasing levels of bioturbation were observed along with
marginally-greater feldspar content and increasing heavy mineral content (iron-oxide grains) and
general increasing of grain angularity. Furthermore, the general fining-upward interval is comprised
by sub-intervals of fining-upward sequences of approximately 1-6 meters in thickness (as depicted in
Figure 18). Figure 19 shows the stratigraphic column of the 09-03 megablock-impactite sand
complex.

67
Fining-upward
Linear Trend:
d= -0.0348φ + 4.6928
Disrupted Zone 2
Disrupted Zone 1
Decreased-sorting-upward
Linear Trend:
d= -0.0201φ + 1.4859
Resurge
Fining-upward
Linear Trend:
d= -0.0152φ+ 2.6899
Increasing-sorting-upward
Linear Trend:
d= 0.0033φ + 0.4287
Disrupted Zone 3
Grain-size moving average
Visual Estimate of Grain-size (φ)
Visual Estimate of Sorting & Grain-size (φ)
Visual estimate of grain-size
Typical fining-up sequences of
undisrupted Eutaw mega-block.
Figure 18. Sedimentological trends of the 09-03 drill-core. Light blue= visual estimation of
modal grain-size. Black line (left) = moving average of modal grain-size with a one meter
period. Sorting (right) = an error bar about blue line of modal grain-size. Depth is in meters
(left margin).

68
Figure 19. Stratigraphic column of the 09-03 megablock-impactite sand complex. Medium green
= semi-intact Eutaw megablock. Yellow-green = Eutaw megabreccia clast. Dark green =
Tuscaloosa megablock (near base of column at 90 meters). Orange = impactite sands. Orange-red
= clastic dikes. For lithofacies descriptions, see text. Depth is in meters.
Loss

69
Lithofacies Characterization
Within the drill-core interval, the Eutaw-Tuscaloosa megablock comprises nine
descriptive lithofacies: micaceous, massive Tuscaloosa sand (T1); trough cross-bedded sand
(E6); bioturbated, cross-laminated sand (E7); bioturbated, massive sand (E1); bioturbated,
interbedded sand and mud (E2); sheared, bioturbated sand (E8); and sheared, cross-laminated
sands; fluidized sand. The impactite sands comprises 3 fundamental lithofacies: structureless,
impactite sands (D1); fluidized impactite sands (D3) and clastic dikes (D2). These lithofacies
are presented below in stratigraphic order of appearance (see Figure 19).
Micaceous, Massive Tuscaloosa Sand (T1)
This lithofacies is only present at the base of the drilled interval and is 0.5 meters thick,
but the contact with the overlying lithofacies is indistinct and gradational, mixing with the
overlying brecciated, poorly-consolidated, Eutaw-derived sandstone. Sedimentologically, this
interval is a white-pink, poorly-sorted, very micaceous, subfeldspathic arenite. This lithofacies is
poorly consolidated owing to sparse silica-cementation in which interstitial interpreted-impact-
derived glasses have partially or wholly devitrified into secondary chalcedony, chert,
microcrystalline quartz, and fibrous chlorite (Figure 20). Moreover, layered muscovite grains
show anomalous alteration with frayed, splayed edges decorated with either chalcedony or low-
birefringence chlorite (Figure 20).
Although this lithofacies possesses similar textural characteristics for Tuscaloosa Group,
it could be Tuscaloosa-derived, disaggregated, impactite sand because no sedimentary structures
(e.g., cross-stratification) are observed.

70
Figure 20. Thin-section petrography of T1 lithofacies. a,b. Plane-light (ppl) and
Crossed-polars (xpl), respectively, of devitrified glass. Note floating contacts of
framework grains. c. Close-up of altered muscovite books and interstitial chalcedony.
Note ‘splayed’ ends of altered muscovite. d, e. Xpl and ppl, respectively, of glass?
devitrified to chlorite. Chl=Chlorite, Chy=Chalcedony, Cht=Chert, and m=muscovite.
m a
cht
chy
c
b
d
e
chl

71
Structureless, Impactite Sands (D1)
All intervals of this lithofacies are structureless sands without any evidence for primary
sedimentary structures or bioturbation, specifically intact burrows. Moreover, all intervals of
structureless impactite sands are constrained within the zones of disruption. Thin sections from
28.2 and 63.1 m were examined for petrography of this lithofacies. Framework grains are
moderately fractured and contain significant heavy minerals not observed within semi-intact
intervals of the Eutaw-Tuscaloosa mega-block. The D1 lithofacies are texturally-diverse
dependent upon which zone of disruption they are found, as discussed below.
The D1 lithofacies for the disrupted zone 1 are enigmatic as compared to other parts of
this core. This lithofacies is a greenish-gray-brown, very homogeneous, moderately-sorted, sub-
angular to sub-round, medium-grained sand intercalated with a yellow-tan bioturbated, Eutaw-
derived sand breccia (Figure 21). The breccia clasts of Eutaw sand are sparse, widely dispersed.
In one place, a large, 2.7 m boulder of fluidized and overturned basal Eutaw-derived sediment
occurs in this lithofacies Eutaw-derived sands are gradational and mixed with the D1 sediment of
the dz1 near the base. The matrix sands of dz1 do not have any sedimentological equivalents.
Eutaw sands with the aforementioned characteristics have not been observed in either drill-cores
of this study or existing literature.
The D1 lithofacies is mainly confined to the lowermost disturbed zone, dz1; however, a
short, isolated, and texturally identical interval is located at 66.14 to 66.39 meters occurring as
injected impactite sand within a network of sub-horizontal, dilational dikelets. These impactite
sands are distinct from surrounding impactite sands due to their good sorting and/or marginal
effervescence in HCl. Also, a gray, metamorphic rock fragment (<1cm) of indeterminate
specific lithology was found within this injected impactite sand.

72
Figure 21. Selected core intervals and thin-section petrography of D1 lithofacies. a. dz3
example of D1 lithofacies. b. dz2 example of D1 lithofacies with fluidized eutaw sands at
top. c. dz1 example of D1 lithofacies. Note E1 breccia (white-dotted line). d,e. Thin-section
(92.6’ depth) showing subhedral garnet (right, high relief) and biotite (left, olive green). f,
g. Thin-section (207.1’ depth) showing interstitial devitrified glass within D1/D2 lithofacies.
Note entrained quartz and glauconite (round, green) grains located within the devitrified
glass. Also, note fractures and injection of matrix/devitrified glass (top).
a b c d
e
f
g
= 0.1’ (3 cm)

73
In contrast to other intervals of 09-03 where interstitial finer-grained sediment is
common, interstitial volume of the D1 sands is exceptionally clean (lacks matrix) in the dz1. On
the other hand, the D1 of the disrupted zone 1 exhibits very low permeability and marginal acid
effervescence as determined from HCl drop tests. Thus, this impatite sand is weakly cemented
by calcium carbonate and, possibly, silica cement; however, these impactite sands remain
slightly friable.
The D1 intervals within disrupted zone 2 are tan poorly-sorted, sub-angular to sub-
rounded, bimodal to polymodal, massive subfeldspathic to quartzose, medium-grained to
gravelly coarse sands with sparse pebble-sized clay rip-ups to cobble-sized fine-grained
bioturbated eutaw breccia. The D1 intervals of DZ2 are interbedded and gradational with
fluidized sands in which boundaries are mostly indistinct. The coarse-grained sediment and
mottled, iron-oxide staining and cementation make this lithofacies difficult to distinguish from
the fluidized sand lithofacies. Furthermore, thin-section petrography reveals similar sparse
silica-cementation as the T1 interval with a greater amount of grain fracturing. Also, the
impactite sands of the DZ2 interval appear to be coarser than both overlying and underlying
Eutaw mega-block intervals; therefore, it is likely that this interval is sourced from below where
coarse-grained sediment is common.
The D1 intervals within disrupted zone 2 are light tan-gray, friable, bimodal, micaceous,
moderately-sorted, homogeneous, quartzose sands with sparse feldspar content and rare, weathered
biotite. Sparse, barely recognizable, fragmentary clay-lined burrows are observed, which contrast to
the typical well-preserved ichnofossils of the Eutaw sands. Although structureless, the D1 intervals
of the DZ3 are texturally and mineralogically similar in appearance to semi-intact underlying

74
bioturbated Eutaw sands and appear to form a matrix in between heavily folded breccia and mega-
breccia near the top of the Eutaw-Tuscaloosa megablock.
Bioturbated, Massive Sand (E1); Bioturbated, Interbedded Sands and Muds (E2); Bioturbated
Muddy Sands (E3)
Bioturbated, massive sand is the predominant lithofacies of the cored interval of 09-03.
Texturally, the E1 lithofacies is diverse, but all intervals of E1 contain intact, well-preserved
cylindrical, sub-vertical burrows (original orientation) composed of nodose clay-pelloids, which were
indentified as Callianassid burrows of Ophiomorpha nodosa (cf. Pollard, 1993 and Figure. 22).
Other simple clay-lined burrows that do not appear to be composed of nodose clay pellets are likely
to be Ophiomorpha sp. as well. Ophiomorpha can range from 1 to 3 cm in diameter, are commonly
oblique to the vertical axis of the drill-core, may be mantled by heavy minerals (iron-oxide grains),
and occasionally diverge into multiple bulbs or shafts. Furthermore, Macaronichnus are
considerably subordinate in number to Ophiomorpha and are concentrated directly above dz1 within
cross-stratified lithofacies and associated E1 facies.
Texturally, all intervals of E1 are massive, and occasionally contain bi-modal grain-size.
All intervals have sparse relict primary sedimentary structures (i.e., fragmentary mud-drapes, clay
laminae, and cross-stratification) and a dominant yellow-tan staining along with common purple-
pink color mottling (may be from manganese-oxides). Grain-size, grain-shape, and consolidation
appear to generally follow previously reported trends. Above dz2, E1 is generally a medium to
very fine-grained, sub-rounded to rounded, moderately well-sorted to well-sorted sand with
disseminated grains of lignite and iron-oxides in association with similarly comprised lamination in
stratigraphically-adjacent intervals (Figure 22). Below dz2, E1 is generally a variably tan to

75
Figure 22. Bioturbated, Massive Sand (E1), Bioturbated, Interbedded Sands and Muds (E2),
and Bioturbated Muddy Sands (E3) selected core intervals. a. E1 lithofacies (upper Eutaw).
Note typical longitudinal cross-sectioned Ophiomorpha nodosa (Op), “coffee ground” texture
of disseminated iron-oxide grains, and isolated limonite nodule. b. E3 lithofacies (upper
Eutaw). Note purplish-pink mottling typical of upper Eutaw sands and muds. c. E2 lithofacies
(upper Eutaw). This is a typical example of bioturbated relict lamination and heavily-
burrowed, light gray clay bed. Note that there is some pink-purple mottling near top. d.
E2(top)/E1(bottom) lithofacies (lower Eutaw-Tuscaloosa megablock).

76
orange-brown to reddish-brown, medium to coarse-grained, angular to sub-rounded, moderately
to poorly-sorted sands and is generally less common in the lower interval of 09-03 below dz2.
Bioturbated, Interbedded Sands and Muds (E2) are gradational with E1 and are
distinguished from E1 by semi-intact, burrowed, intercalated clay-laminae and beds as shown in
Figure 22. From just above dz1 upward to a depth of 35 m (upper part of megablock), clay
laminae, bedding, and Ophiomorpha pellets are a very light gray to nearly white, that are non-
expansive when wet; thusly, clay is likely mostly kaolinite in composition. Moreover, similarly
to E1, sands are stained a yellow-tan and are occasionally stained a mottled, purplish-pink.
Whereas upper E2 intervals have light gray to white clay content and occasional purple-pinkish
mottles, the E2 intervals form dz2 downward toward the base of the Eutaw interval appear to be
more variable in shade of gray, locally expansive, commonly have a fringing, red iron-oxide
stain, and are devoid of purple-pink mottles. Therefore, clay color along with iron-oxide staining
may be an approximate guide for position within the Eutaw Formation at Wetumpka.
Bioturbated, Muddy Sands (E3) are texturally identical to E2 along with E2 trends except
greater clay-content overall and mixing due to bioturbation. Original primary structures are
nearly destroyed or unrecognizable.
Fluidized Sands (E4) and Fluidized Impactite Sands (D2)
Fluidized sediments are found within dz1 and dz2. Within these disrupted zones,
intervals abutted with D1 show highly ductile deformation in which sediments have been
deformed into subtle, tight, disharmonic, polyclinal, and recumbent folds (Figure 23). Where
primary sedimentary structures and burrows can be resolved (i.e., cross-lamination), the intervals
are delineated as E4; however, if no primary structures can be resolved but folding can still be
resolved, the intervals are assigned D2. E4 and D2 are gradational with each other and thus

77
Figure 23. Brittle-Ductile-Fluidized Transition of 09-03 dz2 interval. This Figure illustrates the
gradual transition with increasing depth from a. brittle deformation (conjugate micro-faulting) of
E7, b. ductile deformation (convolute lamination, black arrow) of E8, c. fluidization of semi-
intact cross-lamination (black arrow), and d. subtle fluidization(black arrows) of impactite sands
of D2/D1. Within b, thin dilatational fractures can be seen cutting across deformed fabric of E7
and a brokensectioned s pink, feldspar crystal occurs in this interval (white arrow).
78
distinguishing between these lithofacies is problematic. Observations of these lithofacies do not
reveal conclusively whether D1 precede D2 or D1 is derived from fully-churned E4 and D2;
however, within one transitional interval of D2, thin-section petrography reveal possible
interstitial glasses (Figure 21 f. and g.), greater feldspathic content in sand and pebbles, and
greater heavy-mineral content. This suggests that some impactite sands, which may have been
injected, must have formed prior to this deformation.
Bioturbated, Cross-laminated Sands (E5)
E5 intervals appear to be transitional between E1 and E6 (trough cross-bedding, E6,
described below). Within E5 intervals, cross-lamination is usually subtly expressed, a result of
incomplete bioturbation or non-contrasting laminae. Cross-lamination are commonly comprised
of limonitic, lignitic, and clay-pelloidal laminae. In the case of heavy mineral laminae (iron-
oxides), laminae are either low-angle, cross-bedded, current-rippled, laminated by discrete heavy
mineral laminae, or slightly diffuse and convoluted laminae of heavy minerals. Moreover,
observations with hand lens show bimodal, alternating grain-size within sedimentary fabric,
possible reactivation surfaces, sparse mud-drapes, and concave cross-bed set boundaries;
possibly, this suggests that this facies is originally tidally-influenced, trough cross-bedded.
Textural character of this facies follows previously mentioned trends and is gradational
with neighboring E1 intervals.
Trough Cross-bedding (E6)
Due to pervasive bioturbation and low-contrast lamination, this lithofacies is relatively
uncommon and is gradational with E5. The E6 lithofacies is texturally different depending upon
stratigraphic position: above dz2 (upper part of megablock), this lithofacies is yellow-tan to
white, alternating well-sorted to moderately-sorted, medium to very fine-grained, herring-bone,

79
trough cross-stratified sand; below dz2 (lower part of megablock, this lithofacies is a variably
red-brown to yellow-tan to tan and brown, poorly-consolidated (iron-oxide cemented),
moderately to poorly sorted, medium to coarse-grained, herring-boned, trough cross-bedded
gravelly sand. E6 intervals are interpreted to trough cross-bedding for similar reasons as E5.
Within the upper intervals of E6, well-sorted, laminated and thin foresets exhibit a false
greenish-brownish coloration and very-weak acid effervescence (Figure 24a), which is
interpreted to be drilling-mud infiltration sourced from overlying resurge marl. Mud-infiltration
occurs only in alternating thin foresets of very-well sorted sands where as white, non-infiltrated
thin foresets are observed to show more moderate sorting and greater interstitial mud content.
These well-sorted to moderately-sorted couplets along with evidence for some current reversals
(herring-bone cross-stratification) are interpreted to indicate tidal-channel or tidal-delta
deposition.

80
Figure 24. Selected examples of E5 and E6 lithofacies. a. Herring-bone cross-bedding of
upper Eutaw interval of megablock. b. Bioturbated, cross-laminated interval of upper Eutaw
interval of megablock. c. Bioturbated, medium to coarse-grained interval of lower Eutaw
interval of megablock. d. Rotated, herring-bone E6 breccia clast., which is located within dz1.
Black arrow is transected Ophiomorpha burrow. This mega-clast is delineated in Figure 19.

81
Within the lower intervals of E6, trough cross-bedding texturally contrast considerably
with upper part of megablock intervals. The lower E6 intervals appear to be a basal unit which
fine-upward conspicuously, but due to the mottled iron-oxide staining and cementation and poor-
sorting, individual foresets are more difficult to distinguish within drill-core. This lower
expression of E6 lithofacies is gradational with E1 in bioturbated, coarser intervals and
gradational with E5 in finer, upward sub-intervals of the overarching fining-upward sequences.
At the top of the E6 interval, a rippled top is identified at 37.8- m depth with only 6 cm
thickness. This unit consists of cross-hummocky, well-sorted, fine-grained lamination overlain
with a rippled top and a 1 cm clay flaser thin bed. Thus, this thin bed is interpreted by this
author to be a thin tempestite. This unit caps a sequence of E5 and E6 lithofacies. However, this
unit provides an important, unambiguous bedding orientation and up/down indicator, which
reveals at 37.8 m depth, an upright orientation and rotation of 22 degrees.
Clastic Dike (D3)
Clastic Dikes (D3) are most common within dz2; outside of the dz2, clastic dikes only
exist as thin <1cm along planar, tabular features which could be interpreted alternatively as
compaction bands. Following examination of injected sands, the following interpretations (cf.
Figure 25) were made about these clastic dikes: (1) dilation of pre-existing strata in which
textural aspects, coloration, and structural features can be traced vertically across the clastic dike,
(2) within the dike, there is a subtle fining and better sorting towards dike walls, (3) an
occasional mud or sand laminae ‘liner’ lies along one or both dike walls, and (4) there is an
absence of primary sedimentary or deformational structures. Furthermore, D3 lithofacies
contrast texturally with and are typically finer-grained and better-sorted than host sediments
(Figure 25). Rarely, clastic dikes are massive versions of host sediments (Figure 25d.);

82
Within texturally-contrasting clastic dikes, increasing dike width correlates with
Figure 25. Selected Intervals of D3 lithofacies. a. Typical example of thin fine-
grained D3. D ashed lines show points of separation and dilation. Black arrow points
out a cross-cut ductile deformational fabric (convoluted lamination) by clastic dike.
Dashed arrow marks an interpreted flow b, c. Typical thick D3. Dashed lines
delineate fine-grained liner, sub-horizontal to dike walls (see also d.). White dashed
arrow marks an interpreted turbulent flow. Black dashed arrow marks an interpreted
main flow. d. Interpreted clastic dike resulting from local, strong folding suggested by
curvature of lamination (black arrows).

83
in these cases, neighboring structural trends indicate substantive, local folding. Therefore, these
are interpreted to be local dikes derived from folding and consequential over-pressuring and
liquefaction of sediments within the relatively tight fold increased, relative grain-size (coarse or
very coarse grain-size) and moderately to poorly sorting. The thin clastic dikes (<5 cm) are fine
to very-fined grained sand and are well to well sorted. Secondly, most D3 are <30 degrees to the
horizontal plane and sub-tabular in shape. Fine, thin clastic dikes are more irregular in their
shape and can, in some instances, appear to be branching. Thirdly, in one large D3 interval
(60.1-60.26 m), evidence of turbulence can be discerned. Namely, a fine-grained, dark-brown
‘eddy-like feature’ is apparent as a shadow behind the slightly-rotated, upper wall of this clastic
dike (Figure 25). Using these subtle, turbulently formed features a stratigraphically upward
direction of injection can be interpreted. Finally, all clastic dikes cross-cut pre-existing
deformational fabrics, with the exception of rare irregular dikes which may be merely a case of
preferential rupturing along pre-existing micro-fault sets. This strongly suggests that D3
lithofacies are derived from a secondary deformation/disruptional event, separated from the
primary deformation/disruption event by an unknown interval of time.
Sheared, Bioturbated sands (E7); Sheared, Cross-laminated Sands (E8)
Although local ductile deformation (convolute lamination) and brittle deformation
(micro-faulting and fracturing) occur throughout the 09-03 core, these facies are delineated based
on the presence of systematic and pervasive structural deformation. Both E7 and E8 are
superimposed upon previously-described lithofacies of the Eutaw megablock and are constrained
to dz1 and dz2. Where cross-stratification can be observed, the appropriate interval is delineated
as E8. Conversely, if relict lamination and burrows are observed to be structurally deformed, the
appropriate intervals are delineated as D4.

84
Brittle deformation demonstrated by interval 56.6 to 58 meters is characterized by
conjugate, micro-fault sets of both reverse thrust and normal faulting (Figure 23a). Brittle
deformation gradually transitions into increasingly ductile deformation (versus brittle
deformation) until deformation is wholly characterized by the disharmonic, tight, recumbent
folding of lithofacies of D2 (Figure 23). These aforementioned brittle to ductile transitions
overlie D1 intervals in dz1 and dz2, occupying the upper portion of disrupted zones.
Unrelated to structural deformation, the aforementioned faulted-interval from 56.6 to 58
meters is mineralogically distinct from other cross-lamination intervals. Along with red, well-
sorted, fine-grained cross-laminated sand, both clay laminae and thick laminae of inter-mixed
glauconite, green mica, and heavy minerals exist interlaminated with quartzose sands (Figure
23a).
A thin interval that provides an up-down indicator is identified only at 37.8 m depth with
only 6 cm thickness. This unit consists of cross-hummocky, well-sorted, fine-grained lamination
overlain with a rippled top and a 1 cm clay flaser thin bed. Thus, this unit is interpreted to be a
thin tempestite. This unit caps a sequence of E5 and E6 lithofacies. However, this unit provides
an important, unambiguous bedding orientation and up/down indicator. This unit reveals at 37.8
depth an upright orientation and rotation of 22 degrees.
Deformational and Structural Observations of the Megablock-Impactite Sand Complex
Precise orientation of the whole drill-core was generally not possible because the drilling
method did not allow it. Typically, drill-core segments lying in the core boxes could be oriented
relative to one another by looking at the breaks between ends of core pieces. By rotating the
core to conform to as many consistent end-breaks as possible, localized folds could be discerned
if lamination and bedding are present in the clastic intervals. However, direction of dip within

85
the sub-resurge sediments cannot be utilized consistently to discern structural geometry at
intervals greater than 3 meters. An exception occurs across the span from box 21 to 22 (55.5 to
59.7 m depth and Figure 23a) where drill core was oriented across core section boundaries within
a high density, conjugate set of faults. After orientation of drill core, measurements of these
micro-faults reveal systematic, sub-parallel dipping-direction of conjugate, systematic faults with
apparent normal and reverse offsets.
Across the entire megablock-impactite sand interval, measurements of inclinations reveal
some general trends, depicted in Figure 26. The following observations are made from density
of features, curve-fitting with a sixth order polynominal trend, and linear trends, and
juxtaposition with disrupted zones (for discussion on curvilinear regression see Davis, 2002).
The exceptional high order polynominal was used because it provided the best least-squared
mean (R2 value). The following observations were made regarding inclinations:
(1) a general sinusoidal trend within inclination of all lamination and bedding planes and
are moderately constrained between 10 and 50 degrees,
(2) two clusters of shallowing faults and fractures directly above dz1 and dz2,
(3) a general shallowing of clastic dike inclination with increasing depth,
(4) a peak to inflection point relationship of the fracture-fault polynomial trend with the
bedding-lamination polynomial trend.
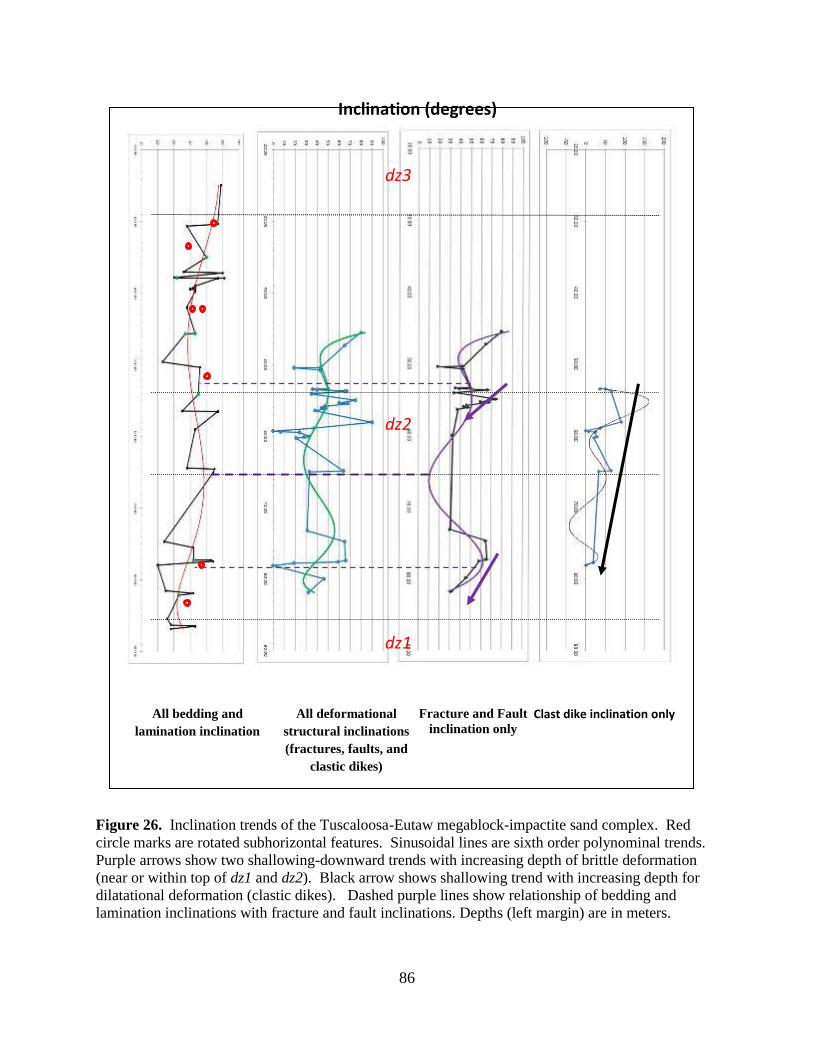
86
Figure 26. Inclination trends of the Tuscaloosa-Eutaw megablock-impactite sand complex. Red
circle marks are rotated subhorizontal features. Sinusoidal lines are sixth order polynominal trends.
Purple arrows show two shallowing-downward trends with increasing depth of brittle deformation
(near or within top of dz1 and dz2). Black arrow shows shallowing trend with increasing depth for
dilatational deformation (clastic dikes). Dashed purple lines show relationship of bedding and
lamination inclinations with fracture and fault inclinations. Depths (left margin) are in meters.
All bedding and
lamination inclination
All deformational
structural inclinations
(fractures, faults, and
clastic dikes)
Fracture and Fault
inclination only
Clast dike inclination only
dz1
dz2
dz3
Inclination (degrees)

87
Furthermore, observations within the core reveal a general, intercalated transition from brittle-
dominated deformation to ductile-dominated deformation and, finally, fluidization and
brecciation (Figure 23). This transition is most evident above dz2; however a similar transition
can be discerned above dz1. The brittle-ductile transition above dz1 is more difficult to observe
due to iron-oxide cementation and staining and brecciation of the ductile to fluidization interval
(Figure 23). Internally, breccia and mega-breccia within D1 and D2 show considerable rotation
as evidenced by upside-down Ophiomorpha nodosa (overturned basal bulb) and rotated cross-
bedding and a near vertical cross-bed set boundary (Figure 24).
Apparent Eutaw Megablock Thickness
The total thickness of the Eutaw-Tuscaloosa megablock–impactite complex is 64.9 m.
This total thickness is thicker than the general reported thickness of Eutaw Formation by more
than a factor of 2. Within disrupted zones, brecciation, severe folding and fluidization, and
injected impactite sands and clastic dikes have likely substantially increased the apparent
thickness. Therefore, removal of the disrupted zones (25.5 m) shows an apparent thickness of
39.4 m for the Eutaw megablock. Utilizing the mean inclination of rotated sub-horizontal
bedding (30.3 ), the following simple trigonometric function was used to estimate true thickness:
(3)
where ta=apparent thickness from core, β=angle of bedding inclination, and tt= to true thickness.
The minimum estimated thickness of the rotated Eutaw thickness of the mega-block becomes 34
meters.
Thickening or thinning of apparent thickness is an indicator of faulting. Reverse and
thrust faulting that intersect the cored interval would thicken the apparent thickness of the
megablock due to the repetition of strata. However, unambiguous repetition of lithofacies is not
88
apparent, and lower lithofacies are mostly distinctive from upper megablock sands by grain-size
and greater preservation of primary sedimentary structures. On the other hand, grain-size
coarsens briefly within heavily deformed intervals of the dz2 and then fines again below.
Therefore, a limited repetition is possible, but the Eutaw Formation is highly heterolithic and
therefore, this is not strong evidence for repetition. This is especially true considering that the
distinctive cross-laminated, glauconitic lithofacies of E8 sectioned 56 m to 58 m) is not repeated
below dz2.
Conversely, normal faulting that intersects the cored interval would result in reduced
thickness of the megablock. However, distinctive bedding or sequences of bedding do not reveal
an unambiguous omission from the cored interval. This is not evidence against normal faulting
because of the somewhat incomplete nature of the cored interval and the heterolithic nature of
the Eutaw Formation.
Resurge General Visual Observations
Qualitative observations of visual estimates of grain-size reveal a general fining-upward
along with local fining and coarsening upward subsets (Figure 18). Sorting trends show a slight
decreasing upward overall, but upward parts of the resurge interval show an apparent more well-
sorted calcareous silt and clay. The general observations of grain-size are believed to be
reasonably accurate as compared to thin-section petrography. Locally, the sand fraction shows
moderate grading.
Upon visual inspection and thin-section petrography, the principal mineralogy includes
biogenic and recrystallized calcite, detrital quartz, clay, detrital glauconite, and frambroidal
pyrite. Detrital feldspar of both plagioclase and potassium feldspar are subordinate (<10%) in
proportion, and heavy minerals appear to be elevated in thin section petrography as compared to

89
in-place Mooreville Chalk and Eutaw Formation. Glauconite is disseminated throughout the
resurge interval; however, detrital, resurge-matrix glauconite is concentrated only in the basal
lithofacies. Otherwise, within the drill-core, glauconite appears to be concentrated (>20%) only
within transported clasts of calcite-cemented, Mooreville Chalk-Eutaw Formation contact (i.e., at
the top of the Tombigbee Sand Member of the Eutaw) and Mooreville Chalk, or uncommonly as
detrital glauconite within cross-stratification.
Consequently, due to the mineralogy of the resurge interval, the marly interval is
predominately and in places bluish, green-gray color. Where chalky blocks and clasts are
encountered, coloration can be a light gray or near white. Above approximately 6.1 m depth, the
resurge interval is increasingly oxidized with red-orange staining presumably from the oxidation
of pyrites. Also, resurge-matrix transitions into a light tan-gray color within the oxidized zone
with prevalent white caliche nodules within the uppermost 2 meters.
Aside from grain-size, mineralogy, and coloration, sedimentary structures and fabrics are
the most distinctive features within the resurge interval. Principally with sedimentary structures
and fabrics, stratigraphic units can be delineated. With visual inspection alone, sedimentary
structures and fabrics are enigmatic and anomalous within the fine-grained sediment that
characterizes the resurge interval. In conjunction with X-ray CT, however, clear, unambiguous
structures are observed that enable stratigraphic patterns and mode of deposition to be
interpreted. Sedimentary structures and fabrics, stratigraphic patterns, and owing stratigraphic
units are reported below.
Lithofacies Characterization and Stratigraphic Patterns
Utilizing x-ray CT in conjunction with visual inspection of the drill core, Markin et al.
(2011) previously reported six lithofacies of the resurge interval. The resurge lithofacies are, in

90
relative stratigraphic order: basal shear-mixing zone (R1); matrix-dominated breccias (R2);
clast-dominated breccias (R3); transported Mooreville Chalk (R4); polylithic-laminated matrix
(R5); and enigmatic chalk (R6). In this study, letter designations in parentheses are used for
brevity. In contrast to Markin et al. (2001), R1 has been renamed herein as the basal shear-
mixing zone because this is more appropriate.
Differentiation of impact-derived marl-chalk breccia and disaggregated resurge matrix is
the main goal of CT studies in this project. As discussed by Markin et al. (2011), utilization of
conjugate CT slices (moving between slices), impact-derived mud-chalk breccia can be
distinguished from resurge matrix by the following criteria: (1) a general lower attenuation
coefficient for impact-derived matrix as compared to intact Mooreville Chalk-derived breccia
ranging from a differential of 100 Housnfield units (HU) to as high as 600 HU for chalky breccia
which result in subtle to abrupt breccia-matrix boundaries; (2) discernable intact burrows, which
commonly are interpreted as Planolites but likely include some Teichichnus and Thallasinoides
(along with some burrows of indeterminable genus); and (3) intact internal laminations, which
abruptly terminate at clast boundaries. Rarely, Chondrites are observed in intact blocks and
clasts but are too fine to be resolved within X-ray CT; thus, they are described by visual
inspection (naked eye), particularly within a large transported block at 24 to 23 meters.
Based on stratigraphic position and lithofacies associations, four resurge units can be
delineated within the 09-03 drill core (Figure 27): a lower resurge unit underlain by R1 and
dominated by R2 and R4; a mid-resurge unit underlain by R5, dominated by R3 and R2, and
gradational with the overlying upper resurge unit; an upper resurge unit dominated by a very
clast-poor, fine-grained R2 with high-angle, chaotic lamination; and an uppermost-resurge unit
of weathered, R2 and possible R5 overlain by a single occurrence of an enigmatic chalk R6. A
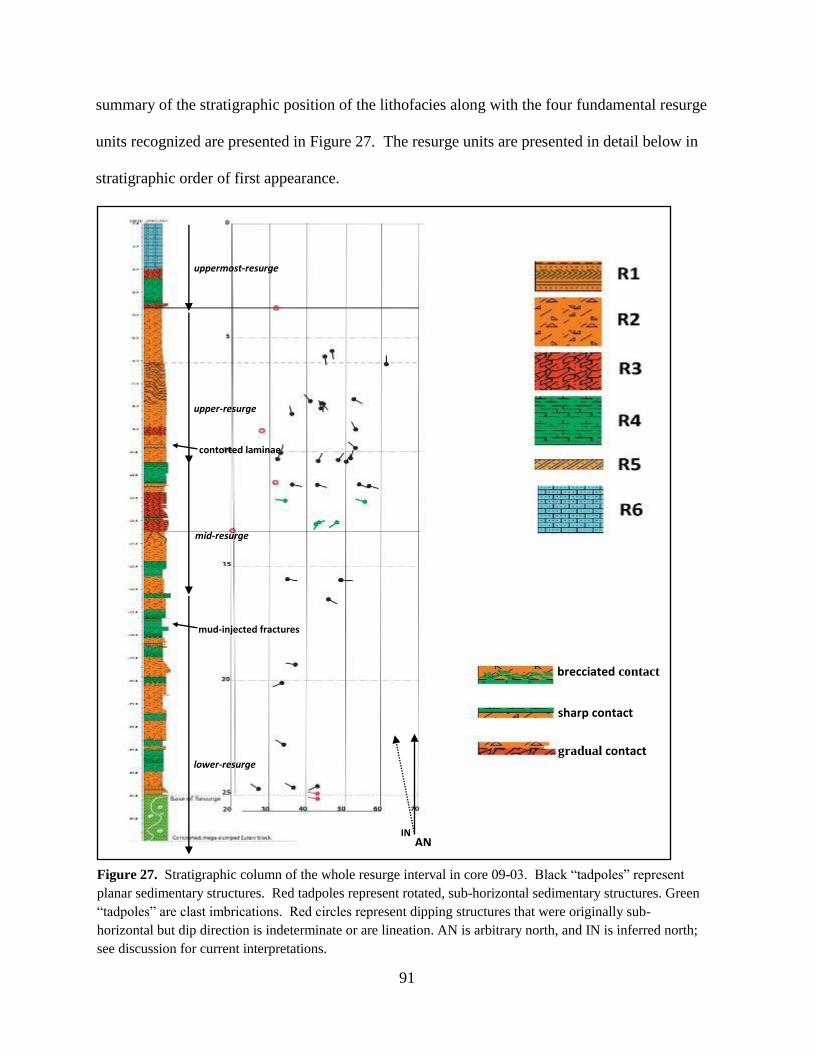
91
summary of the stratigraphic position of the lithofacies along with the four fundamental resurge
units recognized are presented in Figure 27. The resurge units are presented in detail below in
stratigraphic order of first appearance.
Figure 27. Stratigraphic column of the whole resurge interval in core 09-03. Black “tadpoles” represent
planar sedimentary structures. Red tadpoles represent rotated, sub-horizontal sedimentary structures. Green
“tadpoles” are clast imbrications. Red circles represent dipping structures that were originally sub-
horizontal but dip direction is indeterminate or are lineation. AN is arbitrary north, and IN is inferred north;
see discussion for current interpretations.
lower-resurge
mid-resurge
upper-resurge
uppermost-resurge
mud-injected fractures
contorted laminae
AN IN
brecciated contact
sharp contact
gradual contact

92
Basal shear-mixing zone (R1)
The lithofacies exhibit a lower interval of planar, well-sorted fine sands that are slightly
intercalated with a muddy, glauconitic, sandy flame structure (Figure 28). The lower sands
below the flame structure are sub-parallel with each other and appear to be sub-parallel with the
underlying, folded, burrowed, Eutaw clay interbedded with sands. Moreover, the laminated,
fine-grained sands that underlie the flame structure have alternating light and dark bands that
have not been observed in either the underlying Eutaw-Tuscaloosa megablock or in the outcrop
area within or near the Wetumpka impact structure. Finally, a subtle, erosional surface can be
observed directly beneath the flame structure (see Figure 28). This flame structure has mixed
overlying glauconitic sand and the texturally-identical quartz sand.
Above the mixing zone with the flame structure is the cross-laminated muddy, non-
calcareous, glauconitic fine sand. This interval contains a high concentration of detrital
glauconite (>50%) and fines upward into a non-calcareous, massive silt. Cross-stratification is
subtly visible. Within X-ray CT, cross-lamination is unambiguous and is principally
unidirectional; however a small interval of reversed direction was be observed in the upper part
of this unit (Figure 28). Direct measurements of dip within this lithofacies show a general
steepening of cross-lamination upwards. However, the base of the resurge has the highest
measured dip (~43 degrees), which exceeds all other sedimentary dips of the resurge.

93
Figure 28. Basal mixing-shear zone (R1). a. Original CT slice. b. Interpreted CT slice. Note
short reversal between blue lines. c. Photograph of same interval as in a and b. d. Closeup of
flame structure located in lower part of core segment in c. Note subtle erosional surface (upper
black arrow), and below that surface shearing and elongation in a limonite nodule (lower black
arrow). Also, in this instance, flame structure was not rotated for CT scan to have dipping
direction parallel with slices.

94
Matrix-dominated breccia (R2)
This is a glauconitic, calcareous, and fossiliferous shale or mudstone that is sandy in places
with weakly-expressed inclined laminations, “swirled” fabrics, sparse and pebble-sized breccia, and
possible boudinage-format thick laminae of contrasting densities; possible pinching of laminae is
apparent and interpreted to be evidence for boundinage. This is the dominant lithofacies of the resurge
unit, occurring between other lithofacies from the base of the resurge interval to the base of R6.
Entrained breccia clasts include marl and chalk rip-up clasts, diverse fossil detritus, and
small, thin lignitic fragments (<5cm). Fossil clasts include predominately angular, bivalve fragments
of typically thin-walled bivalves, Inoceramus prisms, rare vertebrate fossils of shark and other
vertebrate teeth, and coarse-sand-sized bone fragments. For the R2 lithofacies, the frequency of
clasts is greater within the lower resurge interval, and the upper resurge is considerably clast-poor.
Above a chaotically disturbed interval within the upper resurge, the R2 breccia is considerably clast-
poor and fine-grained (silt); therefore, this interval is best described as a marly shale rather than a true
breccia. On the other hand, within the marly interval, oxidation and greater calcite composition has
rendered less definition within CT despite lowering the input energy (keV). Thus, mineralogically
similar clasts could go unnoticed.
Petrologically, breccia matrix is either a silty-sandy calcareous mudstone or a marly, quartz
wacke. In either case, the sand fraction is moderately-sorted, angular to sub-round, fine-grained, and
dispersed within a calcareous matrix, within thin-section petrography (Figure 29). Possible very
weak-lamination owing to possible alignment of sand grains within thin-section petrography (Figure
29) also occurs. Frambroidial pyrite is common, observable within fig.m as round opaque grains.
Also a slighltly elevated feldspathic content of both plagioclase and potassium feldspar is visible,
assuming original Mooreville Chalk is exceptionally feldspar poor.
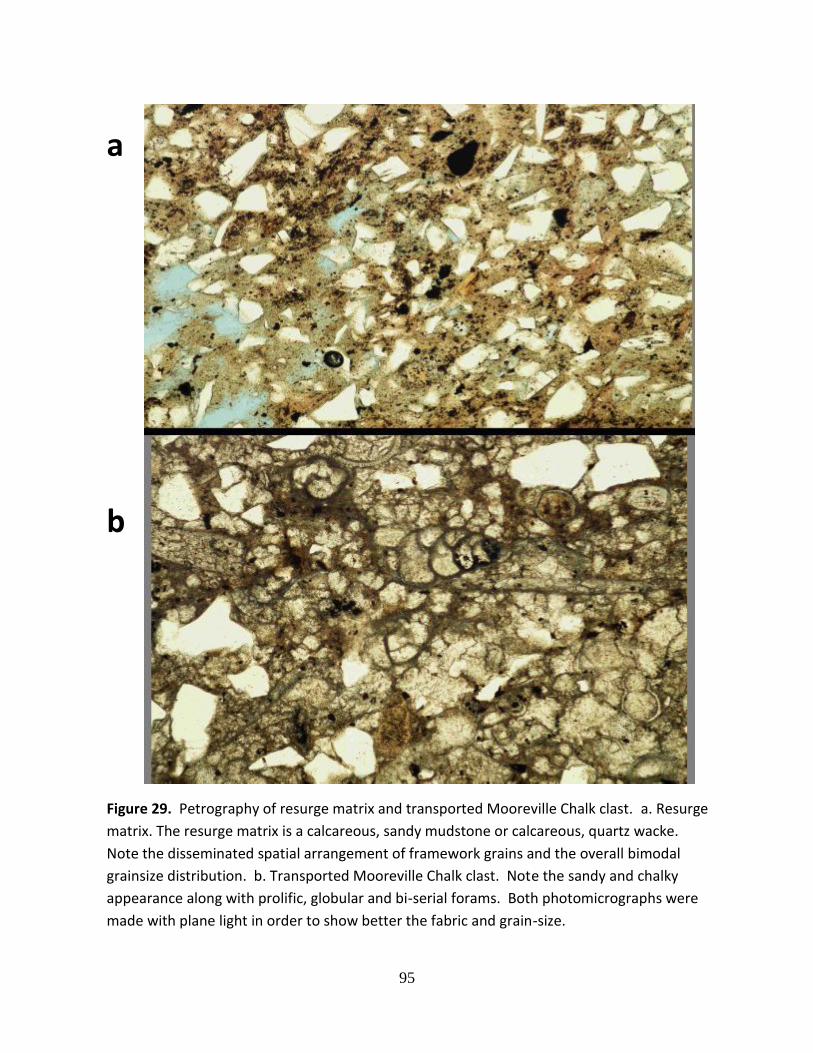
95
a
b
Figure 29. Petrography of resurge matrix and transported Mooreville Chalk clast. a. Resurge
matrix. The resurge matrix is a calcareous, sandy mudstone or calcareous, quartz wacke.
Note the disseminated spatial arrangement of framework grains and the overall bimodal
grainsize distribution. b. Transported Mooreville Chalk clast. Note the sandy and chalky
appearance along with prolific, globular and bi-serial forams. Both photomicrographs were
made with plane light in order to show better the fabric and grain-size.
96
The matrix fabrics of R2 contrast with transported Mooreville Chalk (R4). The
bioturbated fabric of intact Mooreville Chalk marls and chalks is weakly-bedded or massive to
“churned” bioturbated fabrics with intact burrows in some places, principally visible in x-ray CT
and in some places with conventional visual inspection. Resurge-derived matrix, on the other
hand, exhibits very-weakly laminated to “swirled” to “ wispy” subtle fabrics (see Figure 31 and
32, respectively), discernable within X-ray computed tomography.
Within x-ray CT, laminations of the laminated R2 matrixes are very subtle and grade into
homogeneity. With the greater X-ray CT definition of shorter core intervals, they become more
prominent and easily discerned (Figure 30). Matrix laminations can exhibit relatively darker or
lighter attenuation values as opposed to general matrix attenuations values. These dark and light
contrasts are assumed to reflect changes in matrix density or porosity. Typically, matrix
laminations are planar and parallel, but can exhibit slightly varying inclination and curvature to
point where laminations appear to converge or truncate (Figure 30).

97
Within static images, matrix lamination can be confused easily with common, post-
depositional fractures of indeterminate specific origin. Occasionally, these fractures are visible
as high attenuation laminae. However utilizing conjugate slices reveals both the irregular shape
and a cross-cutting of primary fabrics. Thus, moving through CT slices with each core, these
fractures are easily differentiated.
Figure 30. Inclined laminations of matrix-dominated breccia (R2). Subtle, inclined, planar
structures (white arrows) that are typical of resurge matrix-dominated breccia (R2). Dashed
arrow shows interpreted subtle turbulence or eddy-like structure. This Figure demonstrates
that shorter core intervals reduce noise and increase definition.
98
From 16.8 m to 14 m depth within the upper lower resurge, matrix fabrics-visible within
X-ray CT include both weak planar lamination and “swirled” fabrics which resemble turbulent
structures and contain faint, concentric laminations (Figure 31). Superficially, these eddy-like
structures resemble Planolites burrows; however, they can be distinguished from cylindrical
burrows based on the internal concentric lamination, more irregular, flattened ovoid-shape,
consistently darker grayscale values, and sub-parallel long axis of multiple eddies. In contrast,
Planolites tend to be more variable in long-axis direction, lack internal structure, smooth ovoid-
cross-sections, and can be either lighter or darker than surrounding marl and chalk due to varying
calcite content.
Intercalated with “swirled” fabrics, are irregular, “wispy” laminated fabrics of enigmatic
structure and origin (Figure 32). These fabrics can be found rarely in other parts of the 09-03
resurge interval, but are most prevalent from 14 m depth to the base of the mid-resurge unit and
the basal clast-dominated breccia unit (R3).

99
Figure 31. Conjugate slices of swirled, turbulent R2 fabric. Swirled fabrics are characterized
by flattened-ovoid swirls with internal, subtle concentric laminations and somewhat irregular
shapes as opposed to regularly shaped features like Planolites. Swirled fabric (white arrows,
center slice) can be followed thorough conjugate slices. Red arrow marks a slightly-
mineralized fracture, distinguished by cross-cutting of matrix fabric. Planar, subtle laminations
can be observed at base.

100
Clast-dominated breccia (R3)
Overall, this lithofacies is less common than R2, and although could be, in some
instances, be a fully disaggregated R4, this facies is prevalent within the middle of the resurge
unit. It is characterized as a normally graded unit of breccia that transitions from clast-supported
to matrix-supported. Maximum thickness is 0.8 to 1.0 m with apparent imbrications within one
interval and probable imbrications within another.
This lithofacies is most prevalent within the mid-resurge interval where clasts are
composed of chalk and marl. Within the mid-resurge, there are three principal intervals of this
lithofacies within the mid-resurge. The first interval of this lithofacies is a polylithic clast-
supported breccias of marl and chalk, which is moderately graded and transitions upward into
matrix-supported breccia. Moreover, the lowermost 10 cm R3, as seen in Figure 33, is more
Figure 32. Wispy fabric of R2 lithofacies, uppermost lower-resurge. Wispy fabrics are
undulating, irregular, sheet-like structures (white arrows). A few interpreted turbulent features
can be seen intercalated in middle of core sections (red arrow).

101
matrix-rich and contrasts with both the overlying clast-supported breccia and the underlying R2
and lower-resurge. At the lower-resurge and mid-resurge contact, there is a visible
density/attenuation contrast with presumably lower density and/or high clay-content directly
below this contact. Consequently, there is visible within X-ray CT a subtle irregular, undulatory
surface that is interpreted to be subtle load clasts (Figure 33). Finally, at this lower-mid resurge
contact, there is mud injection of overlying dark muds into underlying fractures of a main planar,
tabular dike along with arcuate, concave-up thin mud-injected fractures (Figure 33).
The basal unit of this lithofacies within the mid-resurge is somewhat variable in its
apparent imbrications and could be alternating or reversed; however, the second R3 interval,
shown in Figure 34 is less ambiguous in clast imbrication and is more graded than the underlying
similar lithofacies unit. Observations within X-ray CT show strong imbrications of well-defined
polylithic clasts that grade upward into a “popcorn” CT texture that is interpreted to be small
pebble-sized marl and chalky marl breccia-conglomerate (see interpretation in Figure 33). Also,
unlike the lowermost interval of R3, imbrications are more strongly uni-directional. The second
R3 interval is directly overlain by an R5 lithofacies.

102
Figure 33. Lower-resurge and mid-resurge contact. This Figure depicts the densely injected-
fractures at this contact (yellow arrow). Fractures are shown in left image and have been
enhanced with the contrast and “smart sharpen” functions of Adobe Photoshop for ease of
viewing. Curiously, fractures do no show well in CT scans. However, a subtle, irregular surface
can be observed at contact and, with horizontal slices in borehole-down view, this surface is
interpreted as being composed of load clasts (red line). Note how injected-clayey marl is similar
in grayscale shade to overlying muds.
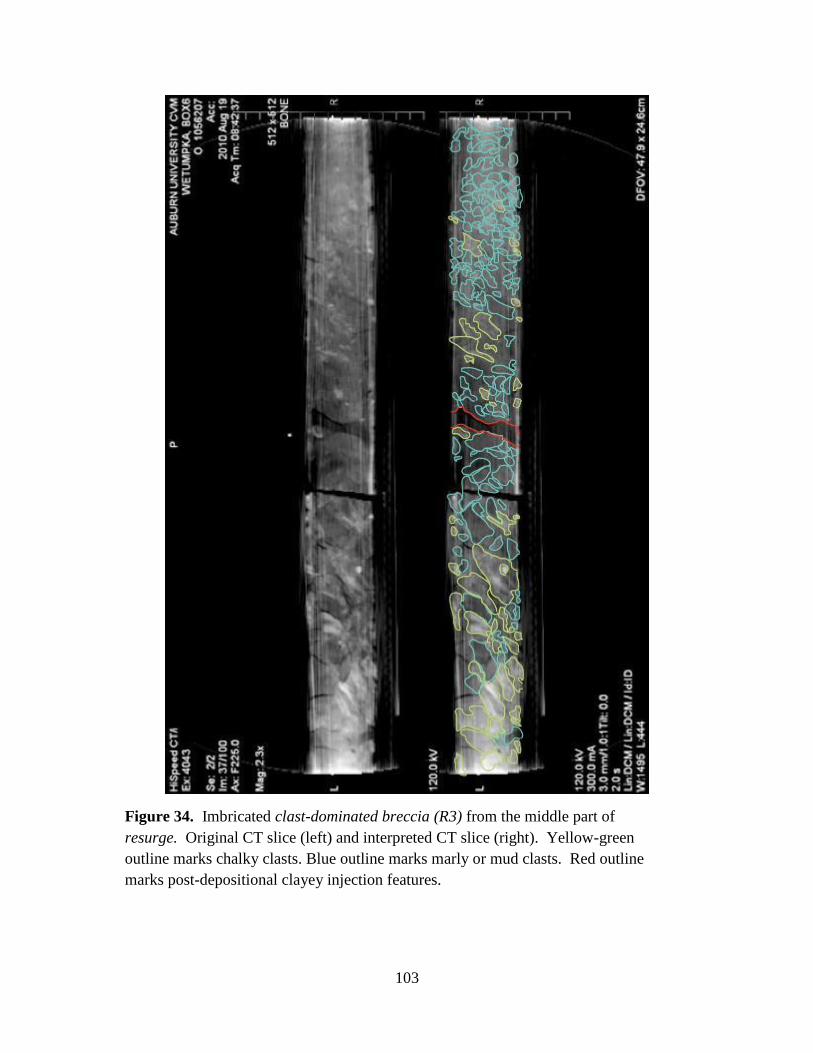
103
Figure 34. Imbricated clast-dominated breccia (R3) from the middle part of
resurge. Original CT slice (left) and interpreted CT slice (right). Yellow-green
outline marks chalky clasts. Blue outline marks marly or mud clasts. Red outline
marks post-depositional clayey injection features.

104
For both the first and second breccia interval, the breccia tend to be sub-angular in shape;
however, more clay-rich breccia (low attenuation values) tends to be rounded in shape. Some
internal lamination can also be observed within larger clasts. Clast sizes can occasionally exceed
the confines of the drill-core (lithofacies R4) and range from <1 cm to 4.25 cm.
The upper-most R3 interval of the mid-resurge lithofacies (9.0 to 9.1 m depth) is less-
defined within CT slices than underlying examples of this lithofacies. Contrasts between clasts
and matrix are subtle and could represent a more homogeneous clast composition without
apparent imbrications.
Finally, an example of this lithofacies is found within the uppermost-resurge at 3.8
meters depth. This particular interval has sub-rounded chalky clasts and grades upward into
possibly semi-intact R4 lithofacies and likely is, in part, brecciation of chalky R4. Rounded
chalky clasts at the base suggest transport. Although some features are reasonable defined,
oxidation and weathering near the surface formed this lithofacies, making uppermost-resurge
challenging to interpret. Nevertheless, from the better defined lowermost meter interval, this
stratigraphic section is believed to be lithofacies R3 and R4.
Transported Mooreville Chalk (R4)
Where clast size exceeds the confines of the drill-core in the horizontal dimension, clasts
are recognized as boulders. Such clasts are interpreted based on intact internal bedding, trace
fossils, and other primary sedimentary structures (Figure 35 and 36). Boulders range from a
minimum size of 0.065 m to a maximum stratigraphic size of 1.0 m. Predominately, most
intervals of R4 are found within the lower-resurge, which can be seen in Figure 27. Orientations
of boulders are similarly aligned with matrix inclination trends but can diverge locally.
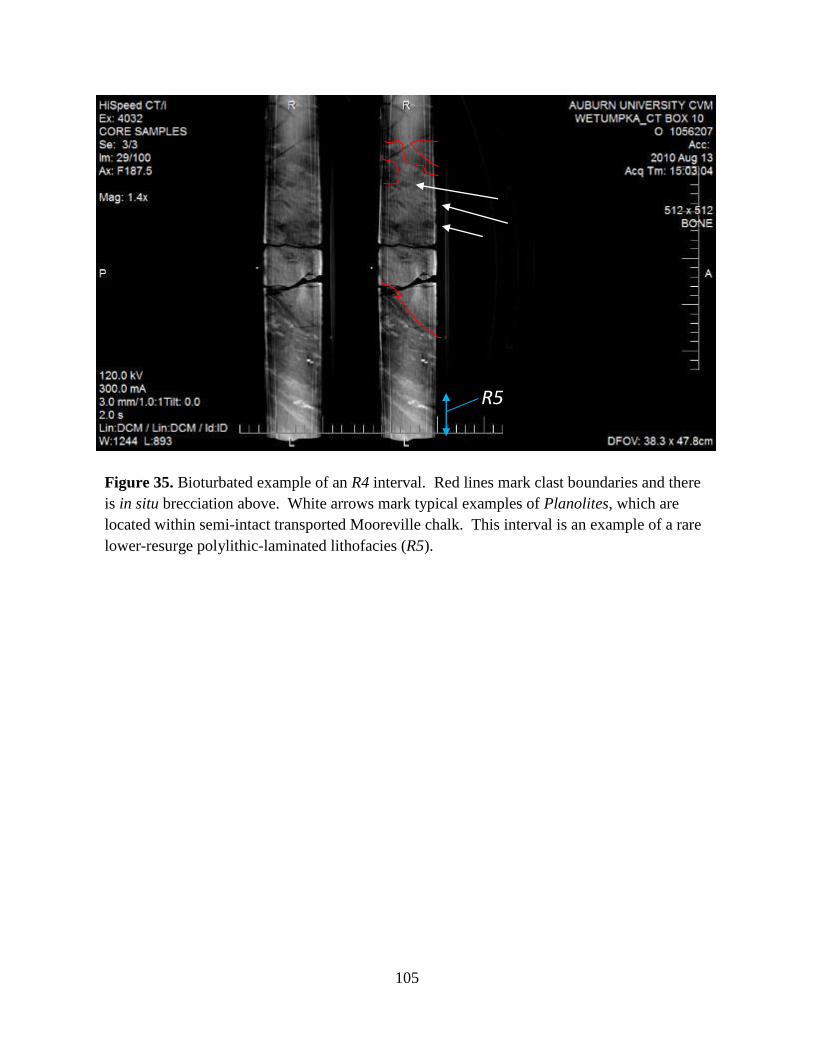
105
Figure 35. Bioturbated example of an R4 interval. Red lines mark clast boundaries and there
is in situ brecciation above. White arrows mark typical examples of Planolites, which are
located within semi-intact transported Mooreville chalk. This interval is an example of a rare
lower-resurge polylithic-laminated lithofacies (R5).
R5
R5
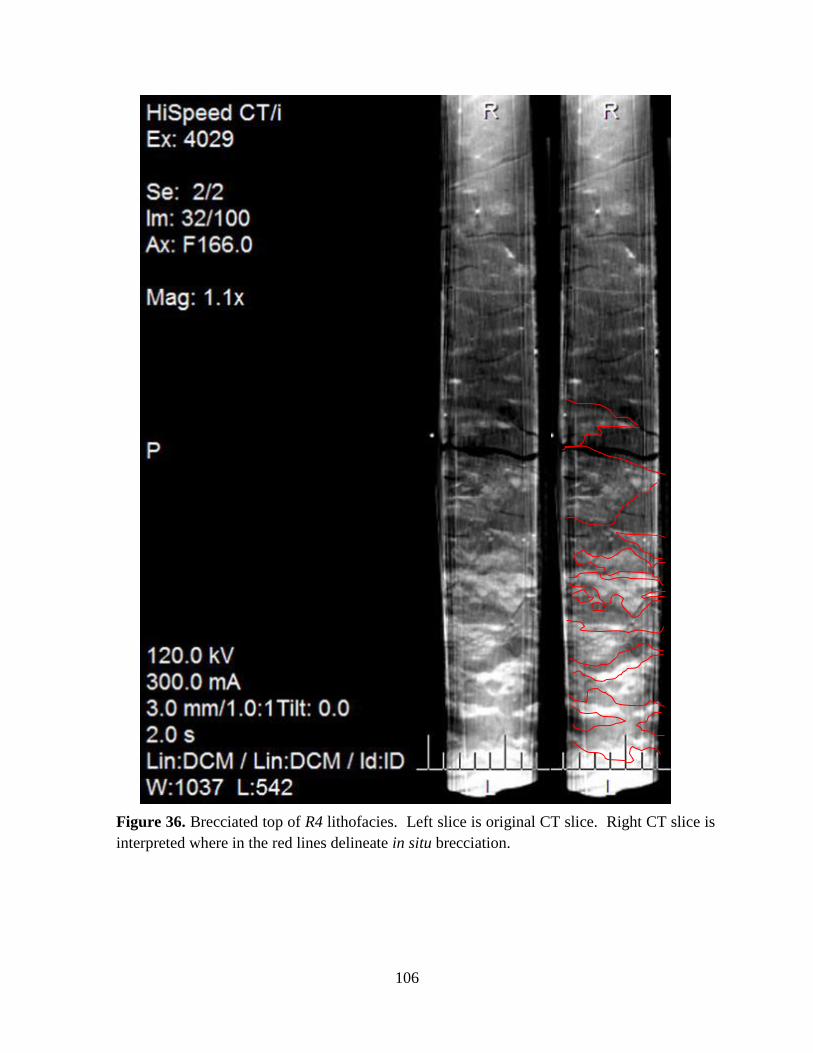
106
Figure 36. Brecciated top of R4 lithofacies. Left slice is original CT slice. Right CT slice is
interpreted where in the red lines delineate in situ brecciation.

107
Lithology ranges from chalk to marl, which are commonly caught frozen (arrested) in the
process of disaggregation and dismemberment and exhibit wide matrix-filled fractures (Figure
36). Specifically, transported boulders include fossiliferous, light-gray, sandy, phosphatic chalk
with interbedded marl; green-gray, bioturbated, fossiliferous, silty marl containing Planolites
(Figure 35), Teichichnus, and Chondrites; and heavily glauconitic, chalky sandstone-sandy chalk
(Figure 37). In-situ brecciation of R4 lithofacies within the lower-resurge typically fragment
along block top whereas block bases are angular or sub-parallel to bedding but lack breccia in
most cases (Figure 37). However, uncommon detachment of block bases can create local basal
brecciation that appears to be sinking into subjacent matrix.
Figure 37. In-situ brecciation of Transported Mooreville Chalk megaclasts (R4). Original
slice (left) and interpreted slice (right), which has red lines delineating mud-injected fractures.
Note sub-parallel fracturing with bedding trends and similarly aligned fractures/bedding with
general dipping trends (dip angle average = 32 degrees).
108
Polylithic-laminated matrix (R5)
This is an uncommon facies in which strongly-expressed laminations of contrasting and
alternating lithology resemble cross-beds and cross-lamination. Cross-bedding and cross-
lamination can be discerned in both X-ray CT and visual inspection. Lithofacies R5 are less than
10 cm in thickness and, above the partially-cross-laminated R1 lithofacies, R5 lithofacies have
been delineated at only three locations: a short interval (20.1 m depth) underlying a R4 block
within the lower resurge; two cross-bedded and cross-laminated intervals that cap graded R3
intervals (11.4 and 9.6 meters depth, respectively).
The lowermost example of the R5 lithofacies has clearly visible truncation surfaces and
internal lamination surfaces appear similar in inclination (Figure 35). Superjacent to this interval
is a very short interval of chaotic, churned matrix overlain with a bioturbated, interbedded chalk
and marl R4 lithofacies. However, this R5 lithofacies is penetrated by calcified tubes that in
three-dimensional models built with X-ray CT multi-planar reconstruction (MPR) reveal an
inclined, meandering path that cross-cut lamination.
The mid-resurge contains two R5 intervals. These first of these two intervals is a trough-
cross-bedded, calcareous, glauconitic sand of alternating lithology shown in Figure 37. This unit
is interpreted to be trough-cross-bedding due to the shallowing-upward lamination, trough-
shaped foresets, and incised trough cross-bed sets that are cut into underlying lithofacies. This
unit terminates the second R3 interval. Directly above the interval, large (4 cm) Inoceramus
fragments are resting directly upon the last foreset with accompanying compaction features.
The second R3 interval is finer-grained and, within both visual inspection and X-ray CT,
laminae appear to be alternating marl and chalk. Unlike the lower R5 interval, laminae are more
similarly inclined with subtle internal truncation surface and are finer-grained (very fine sand to

109
silt-sized). Ripple-like forms within the laminae suggest oscillatory currents. Similarly, this unit
has a large, interbedded chalk clast lying directly upon the last laminae. Compaction features
show interpenetration from above (Figure 38).
Figure 38. Polylithic-matrix (R5). This is an example of the R5 lithofacies that directly overlies
the lithofacies within the mid-resurge. Lying directly on top of this lithofacies are Inoceramus
prisms with accompanying compaction features. Within d is a photograph of trough cross-
bedding. In e, is a closeup of individual trough foresets, looking up trough long axis.
d

110
Enigmatic Chalk (R6)
The genetic origin of this lithofacies is enigmatic. Texturally, it is distinctive
sedimentologically from underlying units and has been proposed by Ormö et al. (2010) to be a
Figure 38a. Conjugate slices of polylithic–laminated matrix (R5). This is the uppermost
example of this lithofacies within mid-resurge. White solid arrows show clasts (marked in
b, f). There is a possible rippled surface shown with dashed arrow. Black arrow shows
compaction features, which are followed from left to right to the place where they
diminish with the absence of the clast. In upper part of core, there is a chalky clast with
some limited in situ brecciation.

111
secular deposits and suggested by Markin et al. (2011) to be an altered transported Mooreville
Chalk block. This uppermost unit is a phosphatic chalk with modern diagenetic overprinting of
caliche nodules. Within the X-ray CT images, the upper two meters exhibit subtle features such
as internal, inclined lamination, burrows, and wide fractures. Precipitation of caliche nodules
has inherited high-angle inclinations. With hand-specimen-level examination and regular-light
optical microscopy, coarse-sand sized grains of bivalve fragments, black phosphate, bone
fragments, and quartz clasts have been observed. Within thin-section petrography, roughly
laminated oxidized glauconite can be observed and with X-ray MPR caliche nodules follow
conspicuous inclination trends.
Structural Features of the Resurge
The resurge interval was examined for structural features and those were compared with
structural features of the underlying Eutaw-Tuscaloosa megablock-impactite sand complex.
Conjugate, systematic micro-faults were not observed within the resurge interval; however, local
normal faults have been observed, which are interpreted to be compaction features. Clastic dikes
and impactite sands with allochothonous textural characteristics were not observed within the
resurge interval. Specifically, no injected sediments within the resurge interval appear to have
been sourced from the Eutaw-Tuscaloosa megablock.
Fractures are common throughout the resurge interval and are likely either syn-
depositional or post-depositional. Fractures were previously logged and reported by Ormö et al.
(2010), and within that study, fracture density (e.g. fractures/meter) peaks twice at approximately
at 5.0 and 13.5 meters. The peak at 13.5 meters roughly corresponds to the lower-resurge and
mid-resurge boundary and many of these fractures are attributed by this author to be injected
muds originating at this surface. Near the peak of 5.0 meters, fractures are discernable using X-

112
ray CT in the upper and upper-most resurge intervals as wide matrix-filled fractures, which do
not have a clear point of origin. Furthermore, lesser occurrences of dark mud-filled fractures,
similar to the fractures of the 13.5 meter peak, are present below the second R5 occurrence.
Despite their visual similarity to underlying mud-injected fractures, a point of origin for the mud-
injection is uncertain.
Precise measurements of inclined laminations and clast imbrications are presented in as a
“tadpole plot,” a plot of azimuth-direction dips (Figure 27), and these directional patterns are
described below. These measurements were derived exclusively from X-ray CT according to
methods described within X-ray CT methodology. Within the lower-resurge, inclinations
directions are similarly directed towards the arbitrary northwest; however, there is a short
reversal in the upper portion of the lower-resurge as shown in Figure 28. Utilizing clast
imbrications and inclined laminations, there are variable clast imbrications in the lowermost part,
but in the strongly imbricated, second interval of R3, apparent current directions show a
complete reversal of lower-resurge inclination orientations. Likewise, trough cross-bedding
directly above show similar interpreted current directions as in the subjacent clast imbrications.
Above the aforementioned trough cross-bedding, there is a near 90-degree rotation towards the
arbitrary north. Above the rotated inclination directions (above eight meters depth), inclination
trends again rotate counter-clockwise but transition into a nearly random pattern (or “bag of
nails”) set of orientations.
Some degree of rotation for resurge interval is evident because angle of repose and
inclination of features that should be horizontal. Features that should have been sub-horizontal
are inclinations with indeterminate strikes or lineations that indicate rotation, for example
originally sub-vertical escape structures These features are identified in fig. a as red

113
circles(indeterminate strikes) and red dip-direction symbols for sub-horizontal planar features.
Unfortunately, deformation along these surfaces (i.e., load clasts) or strike-less features that do
no generally allow strikes to be measured within CT analysis. Features without strike include
rotated, relatively straight pyritized, calcified water-escape tubes and direction of clast
compaction and penetration into underlying sediments. The maximum rotation of 43 degrees
occurs at the erosional base of the resurge. Above this sub-horizontal indicators tend to be
shallower, for example, 20 to 32 degrees. This could indicate that rotation is syn-depositional.
However, rotation of underlying megablock is likewise variable; therefore, post-depositional
deformation such as faulting and/or folding could account for some of this variability.
Conversely, subtle topography along stratigraphic surfaces could account for variability of the
rotated resurge.
0904 Drill-core Results
Based on their preliminary results, King et al. (2010) proposed that the 09-04 well
penetrated the slumped, overturned flap (herein termed overturned fold) of the southeastern
portion of the crater rim. This was so interpreted because of a sequence of overturned
Tuscaloosa Group and Eutaw Formation, which were underlain by crater-filling sands of mixed
origin, and because of the well’s proximity to the crater rim. The two-part subdivision of King et
al. (2010) into overturned intact units (Figure 39) and underlying crater-filling sand (Figure 40),
established a natural stratigraphic division for logging and descriptive purposes.

114
Figure 39. Stratigraphic column for the overturned fold section of drill core 09-04.
hz=hinge zone.

115
Figure 40. Stratigraphic column for lower impactite sand section of drill core 09-04.
th = thin section (depth given).

116
The lithofacies, in non-stratigraphic order for semi-intact Tuscaloosa strata, are as
follows: Overbank/paleosol mud (T2); Overbank/paleosol sand/sandstone (T3); Contorted,
laminated sand/sandstone (T4); Fluidized sand/sandstone (T5); Cross-stratified Sand/Sandstone
(T6); Cross-stratified, Granular-pebbly sand (T7); and, Massive, Reverse-graded, Granular-
pebbly Sand (T8). The lithofacies, in non-stratigraphic order for semi-intact Eutaw Formation
strata, are the following: fluidized sand/sandstone(E4); contorted, laminated
sand/sandstone(E7);grayish-green to green-black, mud conglomerate (E8); disrupted Sand
(E9),interstratified, micaceous, lignitic mud and sand (E10); rhythmic laminated lignite and
sand (E11); cross-laminated sand (E12); olive-gray, fossiliferous, clayshale (E13);
carbonaceous shale (E14); and sandy lignite (E15).
The lithofacies, in non-stratigraphic order for disaggregated, impactite sands, are the
following: massive, structureless, impactite sand/sandstone (D1); fluidized impactite sand and
sandstone (D2); contorted, impactite sand/sandstone (D5); massive, structureless, granular-
pebbly impactite sand/sandstone (D6); and inclined, poorly-moderately stratified impactite
sands/sandstone (D7). Crystalline lithofacies are a rare occurrence within 09-04, present only
within the lowermost 30 meters. Only one crystalline lithofacies is confidently identified within
09-04: saprolitized Metamorphic Rock (C1). All preceding lithofacies are described and
characterized below for stratigraphic order of appearance for the first listed lithofacies.
09-04 Lithofacies Description and Characterization
Overbank/paleosol mud (T2), Overbank/paleosol sand/sandstone (T3)
The Overbank/paleosol mud (T2) and Overbank/paleosol sand lithofacies (T3) are
distinctive intervals of the Tuscaloosa Group. Although the designation of Overbank/paleosol is,
in part, a genetic one rather than descriptive, the sedimentary features of these delineated
intervals are unambiguous and unique to these lithofacies. Within the 09-04 core, both the T2
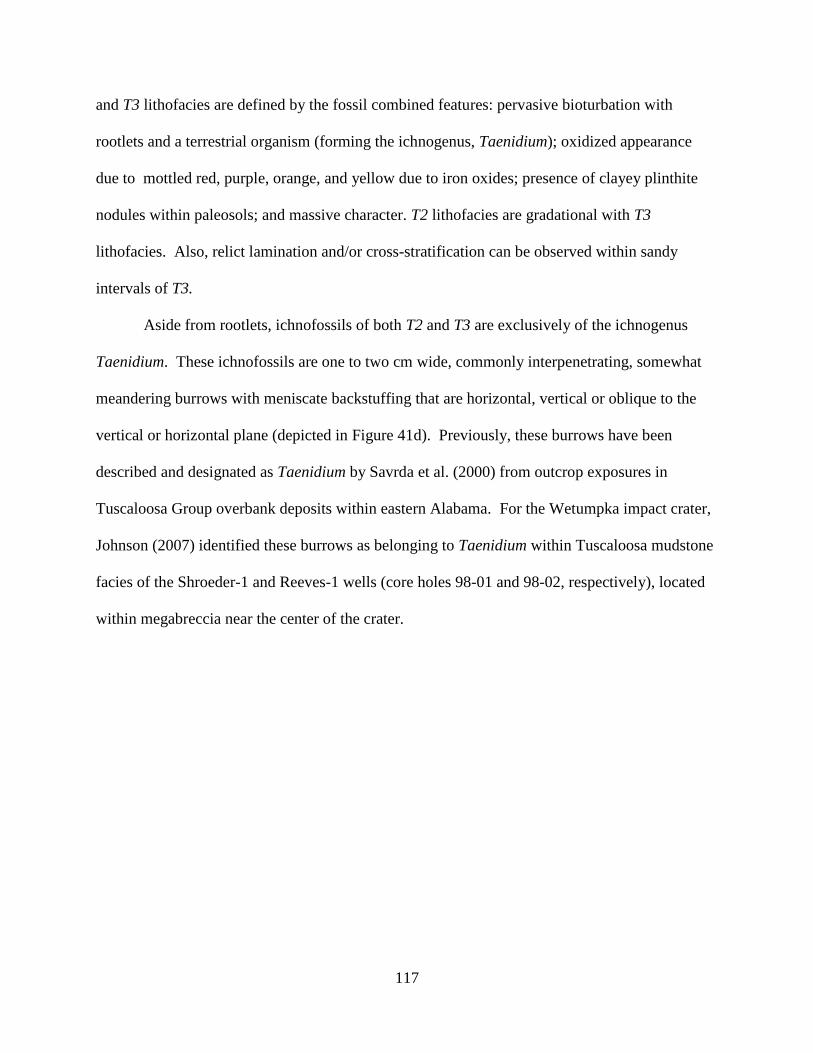
117
and T3 lithofacies are defined by the fossil combined features: pervasive bioturbation with
rootlets and a terrestrial organism (forming the ichnogenus, Taenidium); oxidized appearance
due to mottled red, purple, orange, and yellow due to iron oxides; presence of clayey plinthite
nodules within paleosols; and massive character. T2 lithofacies are gradational with T3
lithofacies. Also, relict lamination and/or cross-stratification can be observed within sandy
intervals of T3.
Aside from rootlets, ichnofossils of both T2 and T3 are exclusively of the ichnogenus
Taenidium. These ichnofossils are one to two cm wide, commonly interpenetrating, somewhat
meandering burrows with meniscate backstuffing that are horizontal, vertical or oblique to the
vertical or horizontal plane (depicted in Figure 41d). Previously, these burrows have been
described and designated as Taenidium by Savrda et al. (2000) from outcrop exposures in
Tuscaloosa Group overbank deposits within eastern Alabama. For the Wetumpka impact crater,
Johnson (2007) identified these burrows as belonging to Taenidium within Tuscaloosa mudstone
facies of the Shroeder-1 and Reeves-1 wells (core holes 98-01 and 98-02, respectively), located
within megabreccia near the center of the crater.
118
Figure 41. Selected 09-04 examples of Semi-intact Tuscaloosa lithofacies a. T2-D1 contact.
Note reduced gray clay near impactite structureless sands. Also, not T2 clasts within D1
volume. B, c. Undulose contact and parasitic folds along contrasting lithologic contact. d.
Example of Taenidium (insect burrows), diagnostic for Tuscaloosa. e. Cross-stratified Sand
and moderately-reduced T2 lithofacies. f. Brecciated T3 lithofacies. Breccia edges marked
lightly with pencil. Breccia matrix is light gray sand at base.
119
Mottled coloration of red, red-purple, orange, and yellow transition to light and medium
grays are interpreted to be reduction of iron-oxide staining of these facies. Within T2 lithofacies,
areas of reduction are adjacent to zones of permeable sand (Figure 38a). T2 and Tuscaloosa
semi-intact cross-stratified sand contacts are 0.5 to 43 cm in length whereas reduction areas
adjacent to impactite structureless sands beneath the overturned fold are up to 2 meters in length.
Reduction areas transition gradually from the original oxidized colors to grays. However, in
both semi-intact T2 intervals within the overturned fold and T2 boulders and blocks, irregular
injected-sands along with pre-existing fractures have abrupt transitions from the pre-existing red
to orange colors of oxidation to light gray colors of reduction. This can create mottled
appearance in both instances.
Within intervals of reduction, T2 lithofacies commonly exhibit marginal to strong
effervescence (as defined in the methodology section). Semi-quantitative estimates of calcium
carbonate content are presented in Figure 39. Typically, calcium carbonate content is interpreted
to be higher within the upper extent of T2 blocks and diminishes with depth which can be seen in
Figure 39. However, some intervals show either a parabolic trend (Figure 39b) or ambiguous,
irregular trends. The presence of carbonate within clayey T2 lithofacies is always associated
with areas of reduction (yellow-gray to gray clays) and is not associated with areas without
reduction (red, red-purple, or red-orange).
In contrast to T2, lithofacies are commonly substantially reduced, possibly due to greater
permeability. Within the lowermost 30 m of the 09-04 well, the thoroughly bioturbated, massive
intervals of T3 are difficult to distinguish from better-sorted structureless impactite sands.
Where some relict ichnofossils remain (i.e., rootlets or Taenidium), these intervals of mottled
oxidation are delineated as T3.

120
Finally, intensive bioturbation within T2 intervals removes planar features that may
indicate clast or bedding inclination. Along contrasting lithologies of clayey T2 intervals and
intervals of cross-stratified sands, graded, massive sands, and impactite sands, the contact is
strongly to moderately undulating showing small-scale parasitic folds across these interfaces
(Figure 41 b, c).
Figure 42. Contorted and fluidized lithofacies T2 in core 09-04. Blue highlights contorted parts.
Red tick at lower right is at 693 feet in well 09-04.

121
0
20
40
60
80
100
189 189 190 191
0
20
40
60
80
100
82 83 83 84 84 85 b a
Figure 43. Effervescence log for wells 09-04. This a bar graph showing observations for the
strength of effervescence (as described in methodology) for 0.4 ft (12 cm) intervals. Lower
panel a shows a typical, decreasing-effervescence subset trend with increasing depth. Lower
panel b shows a typical, subset parabolic-trend with increasing then decreasing trend. Two
overarching decreasing trends are show in top panel directly above a and b.
contorted, impactite sand/sandstone (D5); contorted, laminated sand/sandstone (T4, E7);
fluidized sand/sandstone (E4/T5); and fluidized impactite sand/sandstone (D2).
All well 09-04 lithofacies of contorted, impactite sand/sandstone (D5); contorted,
laminated sand/sandstone (E7/ T4); fluidized sand/sandstone (E4/T5); and fluidized impactite
sand/sandstone (D2) are delineated based upon ductile structural deformation in which primary
sedimentary structural features (i.e., cross-lamination, cross-bedding, and reactivation surfaces)
0
10
20
30
40
50
60
70
80
90
1000 6
12
18
24
31
37
43
49
55
61
67
73
79
85
92
98
10
41
10
11
61
22
12
81
34
14
01
46
15
21
59
16
51
71
17
71
83
18
91
95
20
12
07
21
3
Effe
rve
sce
nce
(%
)
Depth (meters)
b

122
did not previously exist (fully-disaggregated sediment) or have been obliterated or deformed to
the point of being too ambiguous to identify. All of these lithofacies are distinguished based on
the type of folding and whether original textural characteristics remain or sediment texture is
derived from complete disaggregation of target sediment (i.e., mega-breccia matrix).
Lithofacies D5 intervals and E7/T4 intervals, owing to Eutaw and Tuscaloosa
respectively, are a series of stacked recumbent to highly inclined folds in which inflection points
of opposing limbs appear to be 0.1 to 1.0 meter apart. Generally, fold aspect ratio is wide to
broad, and fold tightness is gentle within wide folds and grades to close with increasing tightness
of folds (see nomenclature definition in Twiss and Moores, 2007). An example of the structural
style of these lithofacies is shown in Figure 43. Although ductile deformation is similar for D5,
E7 and T4, textural characteristics are diverse dependent upon which of the three contorted
lithofacies are observed.

123
d
Figure 44. Contorted and Fluidized lithofacies of well 09-04.

124
Figure 45. Mica deformation structures and petrographic features of impactite sands
within drill core 09-04. Top panel (ppl) shows kinked micas. Lower panel (xpl) shows
devitrifed interstitial glass (black arrow) with cherty appearance and somewhat upward
oriented altered muscovites and chloritized biotite (low birefrin gence, anomalously blue
colors).

125
Within D5 intervals, folds are defined by subtle oxidized bands and/or subtle laminae
composed of alternating, contrasting grain-sizes as depicted in Figure 43. Thin-section
petrography at 699.4 ft (213.2 m) depth within an interval of D5 show contorted and kinked mica
books along with some random mica orientations and muscovite wrapped about quartz,
quartzite, and feldspar clasts. These mica deformations are depicted within Figure 44. Matrix
includes fine, altered, chloritized micas and possible devitrified glasses altered to interstitial
cherts and framework grains have diverse roundness from sub-round to very angular. Although
the D5 intervals are not assigned to specific Eutaw or Tuscaloosa origin, shear, disaggregation,
and remobilization of sediment could have altered the sediment of these intervals from an
original Tuscaloosa or Eutaw origin.
Where contorted intervals are interpreted as Eutaw, E7 lithofacies, thin <1 mm, lignitic
and micaceous laminae are associated with a gray, moderately to well-sorted, medium to fine-
grained texture. Fold geometries are defined by lignitic and/or micaceous laminae. This
lithofacies is mostly found within the Eutaw-dominated block/boulder interval.
Where contorted intervals are interpreted as Tuscaloosa, T4 lithofacies, micaceous,
oxidized, moderate red to pale yellowish orange or light gray, and gravelly cross-strata are
observed which are sufficiently deformed to make foreset geometry ambiguous. Therefore, with
these seemingly textural similarities with Tuscaloosa, these intervals are interpreted to be
contorted intervals of Tuscaloosa cross-stratified channel sands. Fold geometry resembles D5
and E7 intervals and is defined by the ductile-deformed cross-strata.
Fluidized sand and sandstone (E4/T5) and fluidized impactite sand and sandstone (D2)
are similar to contorted lithofacies and are likely transitional with the aforementioned lithofacies;
however, fluidized intervals are set apart due to their more severe ductile deformation. Where

126
contorted intervals have gentle to close fold tightness, fluidized intervals have obtuse fold
tightness of fan to involute, folding angles from 181 degrees to greater than 250 degrees,
respectively. The more involuted folding manifest as eddy-like structures defined by iron-oxide
stained bands. Other ductile structures include pinching of folds and undulose bulls-eye patterns
about rotated clasts (Figure 43). Lithofacies D2 intervals have better defined folds due to
distinctive, contrasting mineral staining of light grays, moderate reds, various oranges and
yellows. However, fluidized intervals attributed to Eutaw or Tuscaloosa have clear proximity
and textural affinity with adjacent, semi-intact intervals of Eutaw and Tuscaloosa strata. In
addition, folding and ductile deformation have much smaller scales with opposing limbs less
than 10 cm apart and are convoluted and are polyclinal with folding defined by subtle coloration
and textural variation. Structurally these intervals reveal fluidized intervals of drill core 09-03.
Finally, in contrast with overbank lithofacies, fluidized impactite sands which are calcareous are
commonly also heavily oxidized with iron-oxide staining of moderate to orange-reds.
Although interstitial, devitrified glasses are somewhat common, particularly with depth,
one thin section at 420.6 ft (128.2 m) depth has one instance of a framework, medium sand-sized
impactite glass (Figure 45). This particular grain is only slightly devitrified to quartz and
possibly had a more globular shape before compaction-derived deformation. As revealed by
thin-section petrography, accessory minerals of this location include hornblende, garnet, kyanite,
zircon, and euhedral to anhedral clinopyroxene. Framework grain mineralogy is predominately
quartz at 92.0% and a minor feldspar fraction at 7.5 % of mostly potassium feldspar. Within this
thin-section, fluidized impactite sands reveal a substantive clayey matrix fraction at 29.0%, but a
very low porosity at 0.3%. Thusly, the fluidized sands are a quartz wacke of low porosity.
Texturally, the fluidized impactite sand resembles structureless intervals (D1) detailed below.

127
Figure 46. Example of impactite glass within drill-core 09-04, specifically thin-section
sample 0904_481.8. Note deformation by compaction and intrusion by framework
grains. Plane light (top). Crossed polars (bottom).

128
Massive, structureless, granular-pebbly impactite sand/sandstone (D6); Massive, structureless,
impactite sand/sandstone (D1); Inclined, poorly-moderately stratified impactite sands/sandstone
(D7)
Based upon hand lens and thin-section petrographic observations, D6 and D1 lithofacies
are massive, structureless intervals of light to dark gray, poorly to very poorly-sorted,
unconsolidated to poorly-lithified, micaceous, generally angular to sub-angular, mostly matrix-
supported, medium to coarse-grained clayey sand or sandstone with a minor, diverse
mineralogical, accessory assemblage. Utilizing thin-section petrographic point counts of
framework grains (quartz, feldspar and lithic grains), quartz ranges from 71.2% to 93.6% with a
mean of 87.6%; feldspar ranges from 6.4% to 28.7% with a mean of 12.3 % and is dominantly
potassium feldspar; and lithic fragments are a rare, accessory component which, aside from
polycrystalline quartz clasts (i.e., quartzites), are composed of micaceous schists, and, gneissic
fragments. Matrix volumetric proportion ranges from 11.5% to 28.9% with a mean of 20.1%.
Thus, with the petrologic scheme of Carozzi, (1993), D1 and D6 are generally composed of
marginally-subfeldspathic wackes. All point count data for drill core 09-04 are presented in the
Appendix.
Using the standard point-counting method, heavy and accessory minerals are rarely
counted on point count grids, but all visible mineral phases are nevertheless noted. Typically,
only garnets or kyanite have been included in point counts. However, each thin-section reveal
diverse accessory minerals which could include shattered euhedral garnets, heavily-fractured
kyanite grains, common detrital and euhedral zircon, common anhedral, rounded epidote-zoisite,
clinozoisite, uncommon sphene fragments, uncommon green amphiboles, uncommon
clinopyroxene, and rare instances of partially-altered, oxidized olivine, orthopyroxene, and silt-

129
sized staurolite grains. Accessory minerals mentioned above appear to be more diverse within
thin-sections 0904-339.7 and 381.6, directly below the overturned fold. However, commonly
within D6 and D1 intervals, clusters and isolated, pink-red fragments of garnets may be observed
with a hands lens. A garnet cluster has been observed within thin-section 0904-470 that has
shattered, high-relief, isotropic, possible dodecahedron habit, and some quartz and mica
inclusions; however, one possible garnet that is associated with this cluster has light gray-yellow
birefringence (Figure 47).
Matrix composition is generally a finely-grained chlorite-micaceous mud, iron-stained
clayey mud, or sporadic, devitrified glassy-micaceous mud matrix. The matrix fabric was
revealed by either ubiquitous micas, which have an entirely random appearance, upward
lineations, or swirled, flowing fabric. Within this lithofacies, matrix and, uncommonly,
framework grain mineralogy have commonly-altered, chloritized biotite, clay-replaced
muscovite, and replaced chloritized plagioclases with relict twinning (Figure 47). Micas within
matrix commonly have gray birefringence to blue anomalous colors within crossed-polars.
Some muscovite book-like crystals show possible chloritization along some edges and alteration
to clays. Conversely, some mica book-like crystals are replaced by clay psuedomorphs that are,
in turn, appear to be partially chloritized, evident with green coloration in plane light and
anomalous birefringence colors. Matrix micas range from random orientations to upward,
vertical alignments with wrapping, kinking of micas about framework grains. In addition,
directly below the overturned fold, within thin-section 0904-339.7, muscovite grains show
swirling geometries from a green-gray, massive structureless interval (Figure 48).

130
Figure 47. Example of shattered, euhedral garnets with associated heavy minerals.
Top panel is in cross polars. Bottom panel is in plane light. Garnet (g), anomalous, low
birefringence garnet (ag), plagioclase (pl), and sphene (sp) are labeled.
g
g sp
pl
ag

131
Figure 47a. Post-impact alteration of minerals. a. Partially-altered muscovite to clay (xpl).
b. Chloritized feldspar with relict albite twinning (arrow) and some chloritized micas in
matrix (xpl). ©. Partially chloritized biotite book (ppl).

132
Fig
ure
48. S
wir
led f
abri
c at
over
turn
ed f
old
/low
er m
egab
recc
ia c
onta
ct,
dri
ll c
ore
09
-04. N
ote
sw
irle
d T
3.

133
Aside from the aforementioned sedimentological characteristics, massive, structureless
sands contain sporadic clasts including isolated lignite, cobble-sized medium gray overbank mud
clasts, admixed sub-rounded quartzite pebbles and coarse sands of probable Tuscaloosa origin.
Further, this sand is gradational with other sandy lithofacies. In the instance of T2 lithofacies
and impactite sand interactions, contacts are either sharp or possibly brecciated. Where
structureless impactite sand intervals are granular-pebbly, larger clasts appear to have random
orientations, appear to be graded, and are widely dispersed; D6 lithofacies resemble
sedimentological characteristics of Exmore breccia of the Chesapeake Bay impact crater (cf.
Figures 7 and 8 in Horton et al., 2008)
Finally, although mostly structureless, locally inclined laminations, swirled convoluted
laminations also occur. Where these poorly-moderately expressed inclinations occur, they are
delineated as Inclined, poorly-moderately stratified impactite sands/sandstone (D7). Upon
examination, these poorly-expressed laminae lack unambiguous primary sedimentary structures
of target sedimentary strata and do not exhibit unambiguous folding and contortions as observed
within ductile-deformed lithofacies. However, it is possible these are folding of impactite sands
beyond a scale discernable within this drill-core.
Saprolitized Metamorphic Rock (C1)
The C1 lithofacies is delineated only at one location. This interval is a strongly-
weathered, lithified, micaceous, quartzose schist in which muscovite and biotite has altered to
vermiculite; due to the high quartz and feldspar volumetric content, 76%, an alternate
interpretation could be a schistose quartzite. Petrographically, this lithofacies shows interstitial
glass that have devitrified to cherts. Also, devitrifed glasses show penetration by framework
grains, suggesting in situ melting. Moreover, devitrified glasses have been suggested to be

134
checkerboard feldspars (R. S. Harris, personal communication, 2010). It may be that the
pervasive weathering and alteration of this interval are, in fact, resulting from a pre-impact
interval of saprolite rather than crystalline ejecta fallback or avalanche-entrained crystalline
ejecta.
Cross-stratified Sand/Sandstone (T6); Cross-stratified, Granular-pebbly sand (T7); Massive,
Reverse-graded, Granular-pebbly Sand (T8)
T6 and T7 lithofacies are light gray to heavily oxidized orange-yellow, micaceous, sub-
angular to sub-round, clast to matrix-supported, cross-stratified medium to very coarse-grained
sands that are interpreted to be fluvial channel sands of the Tuscaloosa group. Similarly to
descriptions by Reinhardt et al. of equivalent Tuscaloosa channel sand complexes, these intervals
reliably fine towards lithofacies T3 where pedological development is overprinted upon cross-
stratified sands and ultimately grade into clayey T4 lithofacies paleosols. Foreset boundaries
and internal cross-lamination are defined by iron-oxide oxidation and/or grain-size changes.
Bioturbation is wholly absent except in areas that transition into T2 and T3 lithofacies where
Taenidium are common. T7 intervals differ from T6 intervals only due to laminae and dispersed
quartzite pebbles and granules along with a basal, thin conglomerate.
Massive, Reverse-graded, Granular-pebbly Sand (T8) intervals, restricted to the
uppermost 50 meters, are interpreted to be partly fluidized T7 and T6 intervals. Texturally, T8
intervals are identical to T7 and T6; however, individual foresets are indiscernible possibly due
to sediment remobilization. Along T2 and T8 lithofacies contacts in the uppermost 20 meters,
contrasting lithofacies have irregular, undulose surfaces. Generally, grain-size fines downward
as to be expected if channel sands are overturned. However, within one T8 interval, there is an

135
anomalous conglomerate at the base along a T2/T8 undulose contact that based on geometry of
this contact suggests third-order folding.
Grayish-green to Green-black, mud conglomerate (E8)
This block is a Grayish-green to Green-black, sub-rounded to well-rounded, very poorly
sorted mud conglomerate with a medium to dark gray, moderately to poorly-sorted,
carbonaceous, medium to coarse-grained sand matrix. Located near the center of the lower
breccia interval, this block interval is interpreted to be a basal channel deposit of the Eutaw
Formation due to the presence of texturally identical mud clasts present within the Eutaw
Formation at 54, 72, and 78 m depth. Moreover, similar mud clasts within the overturned fold
appear to be either constrained as a 0.3-m thick unit or a lag of some kind, whereas the E8
lithofacies has a 4-m stratigraphic thickness. Nonetheless, mud rip-ups and clasts similar to the
E8 lithofacies are restricted to the Eutaw Formation within the overturned fold. Where the E8
lithofacies comes in contact with D6 lithofacies, dispersed mud conglomerate exist along contact
zones and intermixed within stratigraphically adjacent structureless impactite sand intervals.
Disrupted Sand (E9); Interstratified, Micaceous, Lignitic-mud and Sand (E10); Rhythmic-
laminated lignite and sand (E11); Cross-laminated Sand (E12)
E10, E11 and E12 lithofacies are texturally-related Eutaw Formation lithofacies and E9
lithofacies is a structurally disrupted block of possibly E10 and E11 lithofacies. Rhythmic,
laminated lignite and sand (E11) lithofacies is an interval within the overturned fold of
rhythmites (see definition from Davis, 1983) composed of alternating lamination lignitic muds
and micaceous, fine to medium-grained, moderately to well-sorted, sub-rounded, quartzose sand.
E10 lithofacies is texturally identical to E10 but internal stratigraphic units of E10 are very thin
to thin beds rather than laminae. Moreover, E10 lithofacies are transitional with E11 lithofacies

136
where laminae grade to thin bedding and can include cross-lamination within sandy stratigraphic
units. E12 lithofacies are, in turn, gradational with E10 lithofacies. E10 lithofacies are light gray
to medium gray, cross-laminated or cross-bedded in parts, moderately-sorted, sub-rounded,
medium-grained to basally coarse-graded which lacks lignitic laminae.
Based upon observations from smear slides, ichnofossils, and hand lens, lithofacies E10,
E11 and E12 are interpreted to be marginal marine based on the following observations. Within
lithofacies E10 and E11, smear slides within lithofacies E10 and E11 show sparse glauconitic
grains and a feldspathic proportion <10% which, unlike petrography of lower impactite sands,
appear to have similar proportions of plagioclase and potassium feldspar. Within some laminae,
lignite fragments and lignitic, very thin bedding reveal Teredolites borings, a typically marine
ichnofacies of “sparse to profuse, club-shaped borings” within woodgrounds (Pemberton, et al.,
2004) or sediment-starved “log-grounds” of Savrda and King (1991). Although muscovite is the
dominant mica overall, some laminae are nearly exclusively biotite whereas Eutaw lithofacies of
09-03 are comparatively, exclusively muscovite or white micas. Rythmites within marginal
marine settings, evidenced by both the presence of both glauconite and lignite, suggest a tidal
setting, possibly tidal flats within a back-barrier setting (Davis, 1983).
Disrupted Sand (E9) is a disturbed, possibly sheared block of E10 or E11 lithofacies
within roughly the middle of the lower megabreccia at 142.8 to 145.8 m depth. Lignite laminae
range from convoluted lamination to discontinuous fragments that are possibly formed as
boundinage features. The lignite to sand ratio (visible in suggests that this disrupted interval was
originally an E10 interval. However, matrix sand between lignitic fragments and lamination is a
dark gray so lignite could be admixed into interstratified sands. This interval also contains
dispersed coarse-sized quart clasts and slight yellow-oxidation within this interval. An example

137
of this lithofacies is shown in Figure 49. Furthermore, sporadic, devitrified glass that resemble
flow structures are found within the upper part of this lithofacies (Figure 49). This could
indicate that glassy matrix has been entrained within this sheared megabreccia block.
Olive-gray, Fossiliferous, Clayshale (E13); Carbonaceous Shale (E14); and Sandy Lignite (E15)
E13, E14, and E15 lithofacies are observed within the overturned fold and only E15
lithofacies are found within the underlying megabreccia. At 58.2 and 59.6 m depth, lithofacies
couplets of E13 and E15 are delineated. E13 is a fossiliferous, Olive-gray, clayshale with some
scaly fabric possibly derived from shear of this clayshale along with lamination. Along laminated
planes, macerated plant carbon films are observed. In the higher 58.2 m interval, the E13
lithofacies abruptly transition to E14 lithofacies. E14 lithofacies is a fissile carbonaceous silt to
lignite interval with reported amber grains in the field. However, the underlying 59.6 m interval
is stratigraphically reversed as compared to the 58.2 meter interval with the E14 lithofacies
abruptly transitioning into E13 lithofacies. Sandy Lignite (E15) lithofacies are black lignite
intervals with intrusions of medium sands and inclusion of amber grains. Aside from isolated
ligntic clasts and laminae, logged lignitic intervals of E15 lithofacies are found within the lower
megabreccia interstratified intervals within two semi-intact deformed intervals (Figure 50).
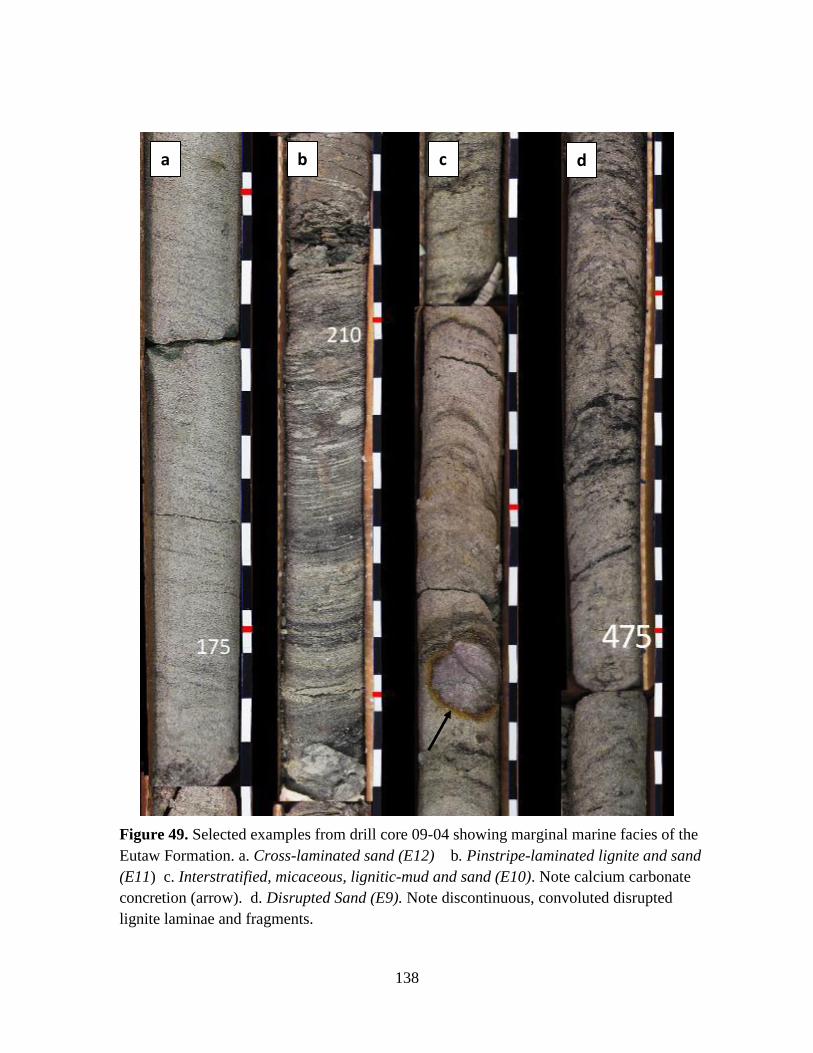
138
Figure 49. Selected examples from drill core 09-04 showing marginal marine facies of the
Eutaw Formation. a. Cross-laminated sand (E12) b. Pinstripe-laminated lignite and sand
(E11) c. Interstratified, micaceous, lignitic-mud and sand (E10). Note calcium carbonate
concretion (arrow). d. Disrupted Sand (E9). Note discontinuous, convoluted disrupted
lignite laminae and fragments.
a b c d
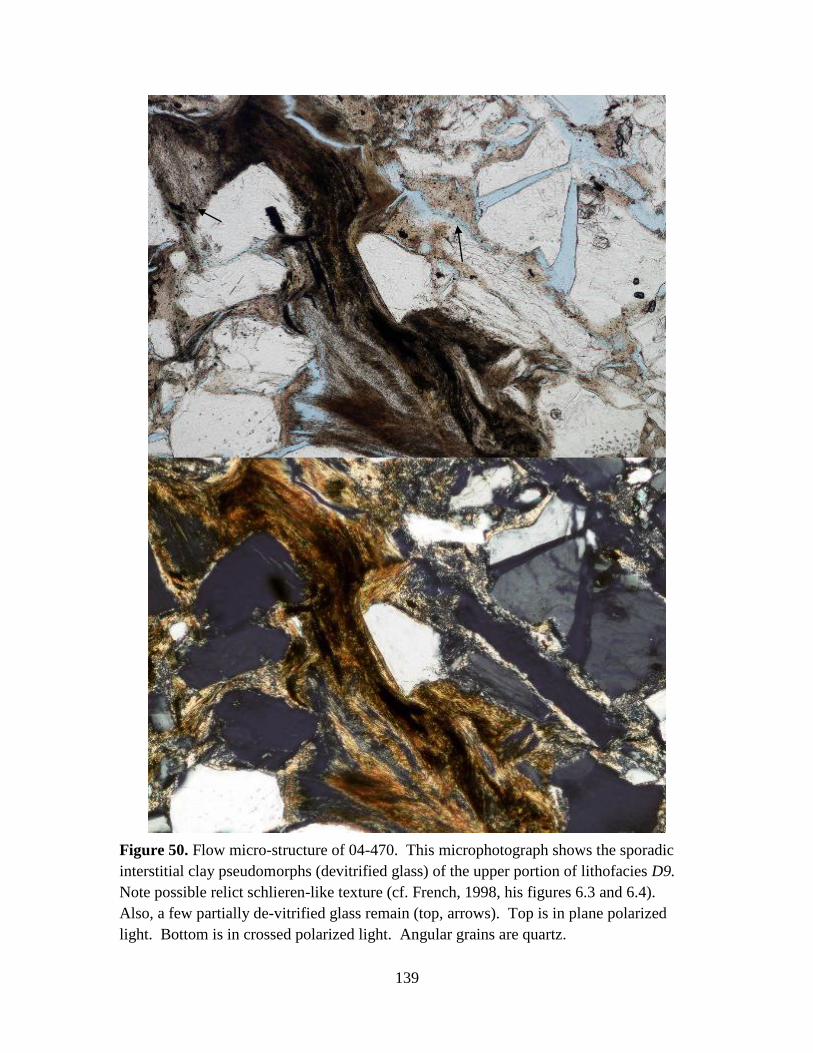
139
Figure 50. Flow micro-structure of 04-470. This microphotograph shows the sporadic
interstitial clay pseudomorphs (devitrified glass) of the upper portion of lithofacies D9.
Note possible relict schlieren-like texture (cf. French, 1998, his figures 6.3 and 6.4).
Also, a few partially de-vitrified glass remain (top, arrows). Top is in plane polarized
light. Bottom is in crossed polarized light. Angular grains are quartz.
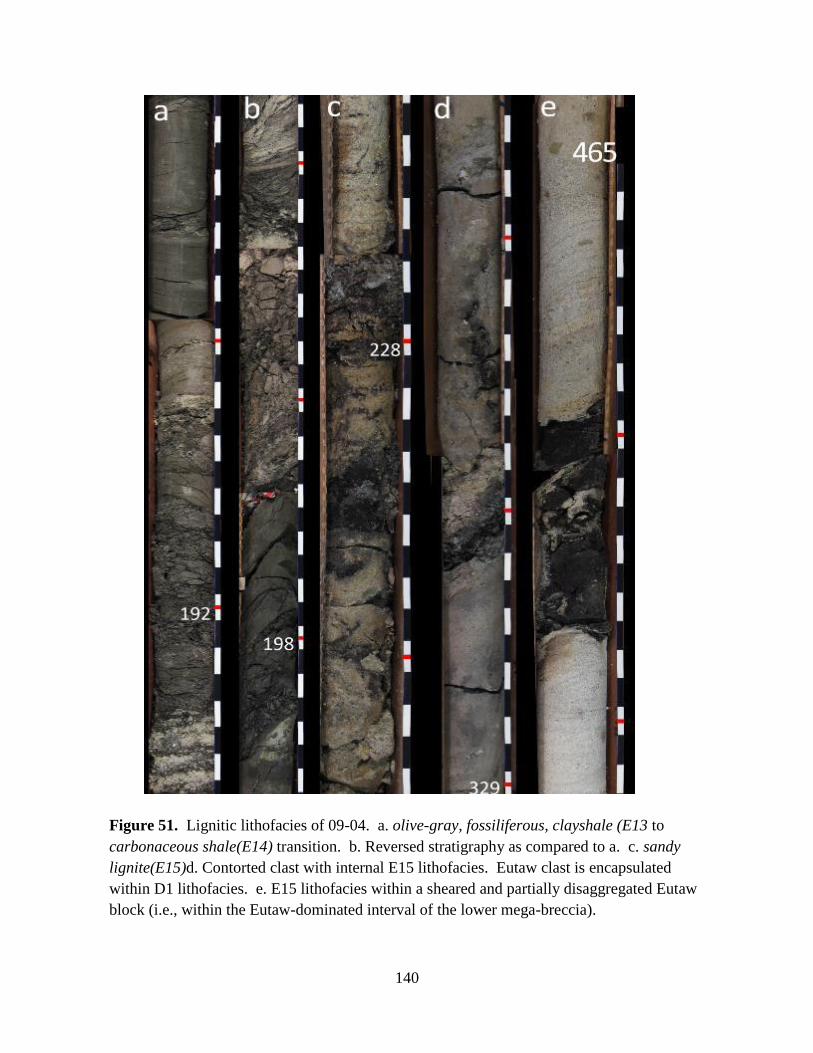
140
Figure 51. Lignitic lithofacies of 09-04. a. olive-gray, fossiliferous, clayshale (E13 to
carbonaceous shale(E14) transition. b. Reversed stratigraphy as compared to a. c. sandy
lignite(E15)d. Contorted clast with internal E15 lithofacies. Eutaw clast is encapsulated
within D1 lithofacies. e. E15 lithofacies within a sheared and partially disaggregated Eutaw
block (i.e., within the Eutaw-dominated interval of the lower mega-breccia).

141
General Stratigraphic, Sedimentological, and Structural Characteristics of the Drill-core
09-04
Visual estimates of modal grain-size and maximum grain-size for the overturned fold and
lower impactite sands, logged inclination of planar structures and faults, and logged lithofacies
for the overturned fold and lower impactite sands are presented in Figures 52, 53, and 54,
respectively. For reference, logged lithofacies for the overturned fold and lower impactite sands
were presented previously in Figures 39 and 40, respectively. Following detailed examination
and logging of the overturned fold, presented in Figure 39, thicknesses differ from preliminary
results of King et al. (2010). Within the present study, overturned Tuscaloosa is measured at
51.0 meters thickness. At the hinge zone, Eutaw formation is estimated at 30.5 meters thick.
The upright Tuscaloosa at the base of fold is estimated at 20.5 meters. Discrepancies with
previous preliminary reported thicknesses of upper Tuscaloosa, Eutaw, and lower Tuscaloosa,
38, 18, and 27 meters respectively, are due to ambiguities with the Tuscaloosa-Eutaw contact.
Unfortunately, Tuscaloosa sands within 09-04 are locally a poorly oxidized and/or reduced gray.
Because coloration is an important criterion of distinguishing Tuscaloosa and Eutaw of medium
to coarse sands in absence of diagnositic ichnofossils (i.e., Ophiomorpha and Taenidium), the
first instance of oxidation of sediments and/or overbank lithofacies (T1, T2) is picked as the
Eutaw/Tuscaloosa contact. Moreover, olive-gray to green-black, rounded mud rip-ups that are
texturally similar to E13 and E14 lithofacies are found within gray, fining upward, medium-
grained, moderately-sorted, cross-stratified sand complexes as a basal conglomeratic lag. These
basal cross-stratified sand complexes are located at 51.2 to 54.2 meters and 72 to 81.8 meters
(Figure 39).

142
In addition to stratigraphic position of formations, grain-size and lithofacies-stratigraphic
trends further elucidate the nature of the overturned fold. Within the upper Tuscaloosa interval,
channel sands fine downwards towards clayey T2 overbank deposits. This is consistent with an
overturned Tuscaloosa channel sequence. However, directly above the Eutaw interval at 34 to
46 meters, there are reversals in grain-size and lithofacies patterns as compared to overlying
Tuscaloosa channel and overbank complexes. Within the lower Tuscaloosa, a fining-upward
pattern is consistent with the overturned-fold hypothesis. Within the Eutaw Formation, grain-
size trends of aforementioned basal cross-stratified sand intervals appear to have reversed fining-
trends. However, as shown in Figure 52 and discussed within lithofacies descriptions of E13 and
E14, there are stratigraphic reversals in the E13-E14 couplets that likely indicate that they are
part of a folded shale lens-variable thickness of E13-E14 couplets suggest lens geometry.
Moreover, there is a repetition of E10 lithofacies intervals about a middle E11 lithofacies
interval, and the mud conglomeratic lag is observed within multiple locations upper and lower
portions of the Eutaw interval. Thus, although vertical lamination and opposing dip directions
are found about the vertical dipping, a discrete axial plane for the overturned fold cannot be
determined. Instead a hinge zone, hz, is delineated as shown in Figure 39. The variable dip
angles (Figure 54), complex lithostratigraphic patterns, and fining-trends suggest complex
folding which could include second, third order, and/or parasitic folds.
Near the base of the overturned fold, basal D6 lithofacies show fining-upward trends that
suggest that these structureless impactite sands could be fluidized or remobilized channel sands.
The overturned fold is interpreted to be intercalated with underlying megabreccia. Although the
lower breccia is intercalated with structureless impactite sands, breccia appear similar to overall
stratigraphic patterns of the overturned fold reveal a zone of dominant Tuscaloosa clasts and

143
blocks from 103 to 139 meter depth, a middle Eutaw-dominated breccia from 139 to 167 meter
depth and a lower Tuscaloosa-dominanted breccia 167 meters to the base of the core at 214
meters; thickness of these zones are 33 m, 28 m, and 47 m, respectively. However, lithic and
lignitic clasts of Eutaw, smaller than blocks, do occur locally enveloped by impactite
structureless sands outside of the Eutaw-dominated breccia zone. Sedimentological
characteristics of megabreccia clasts are similar to lithofacies within the overturned fold.
Finally, bioturbated, Ophiomorpha sands which are common within the 09-03 drill-core and
based on outcrop descriptions of past workers (i.e., Nelson, 2000 and King and Ormö, 2007),
bioturbated, Ophiomorpha sands are ubiquitous within outcrop as well; however, Ophiomorpha
sands are completely absent within the overturned fold and lower impactite sands.
Finally, general sedimentological observations and grain-size and inclination logging
show significant variability within previously reported stratigraphic intervals (see Figure 53) and
decreasing friability with depth. Grain-size and maximum clast size show that maximum clast
size generally follows grain-sizes. Further, the upper Tuscaloosa-dominated breccias within the
lower impactite sands are generally coarser than lower Tuscaloosa-dominated breccia.
Inclinations, as compared to 09-03, are highly variable and less constrained even within the
overturned fold. With increasing depth, sandy, conglomeratic, and silty sediments transition
gradually from unconsolidated sediments to poorly-lithified sandstone. There should be
increasing compaction with depth; however, based on thin-section petrography, sporadic,
interstitial, devitrified-glass are contributing silica-cements, particularly within the lowermost 30
meters. At depth, T2 lithofacies do not show significantly greater lithification than T2 intervals
in the uppermost reaches.
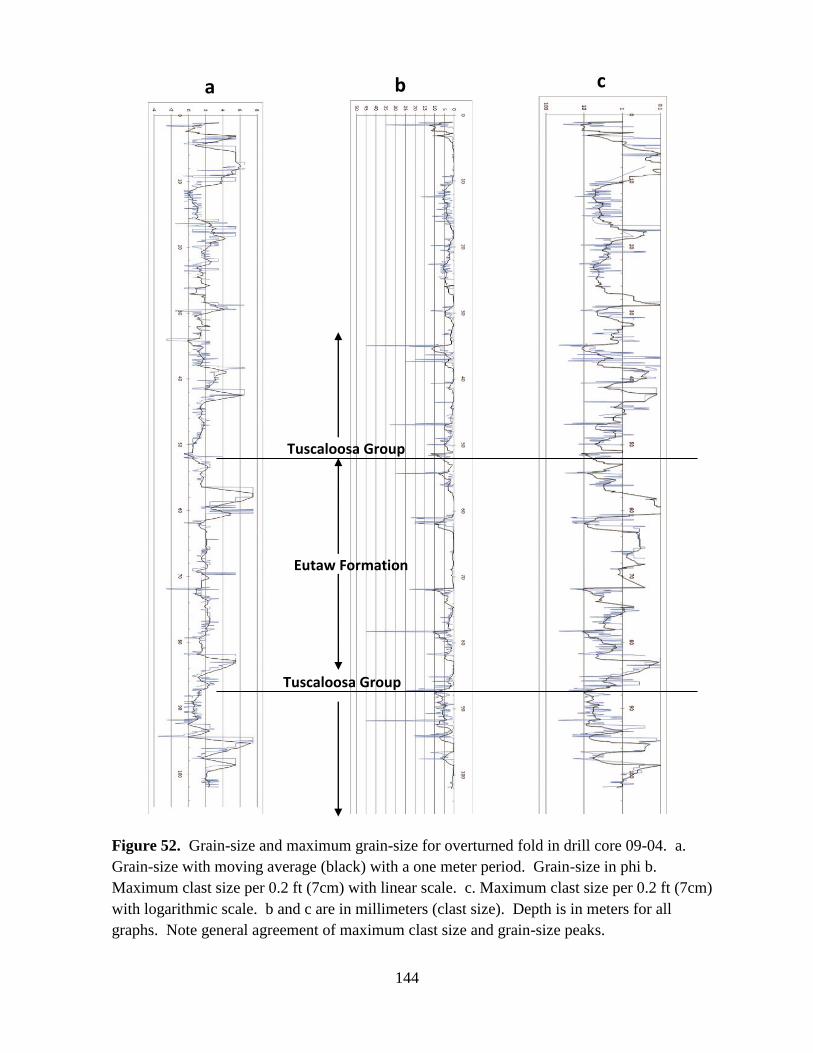
144
Figure 52. Grain-size and maximum grain-size for overturned fold in drill core 09-04. a.
Grain-size with moving average (black) with a one meter period. Grain-size in phi b.
Maximum clast size per 0.2 ft (7cm) with linear scale. c. Maximum clast size per 0.2 ft (7cm)
with logarithmic scale. b and c are in millimeters (clast size). Depth is in meters for all
graphs. Note general agreement of maximum clast size and grain-size peaks.
a b c
Eutaw Formation
Tuscaloosa Group
Tuscaloosa Group

145
Figure 53. Grain-size and maximum grain-size for lower megabreccia of drill core 09-04.
a. Modal Grain-size with moving average (black) with a one meter period. grain-size in
phi. b. Maximum clast size per 0.2 ft (7cm) with linear scale. c. Maximum clast size per
0.2 ft (7cm) with logarithmic scale. b and c are in millimeters (clast size). Depth is in
meters for all graphs.
a b c
Eutaw-dominated
megaclasts
Tuscaloosa-dominated
megaclasts
Tuscaloosa-dominated
megaclasts

146
Figure 54. Inclinations in drill core 09-04. a. Lamination and bedding plane
inclinations of overturned fold. b. Lamination and bedding plane inclinations for lower
impactite sands. c. Inclinations for normal and reverse thrust faults.
a b c

147
DISCUSSION
Following investigation of the 09-03 and 09-04 drill cores, preliminary interpretations,
and literature review of previous work, two fundamental genetic facies of the uppermost impact
stratigraphy are identified. The 09-03 drill-core is interpreted to record a long-transport
megaslump within its internal extensional/compressional boundary. Late syn-depositional to
post-depositional with an underlying megaslump, the resurge facies of 09-03 drill-core is
currently the only confirmed record of a Wetumpka resurge. The 09-04 drill-core records the
rotational slump of the southeastern, overturned flap. Underlying megabreccia could be an
avalanche facies of the rim collapse; however, this author prefers an interpretation of basal shear
of a megaslump. The following chapter discusses the deposition of megaslump-formed
megabreccias and resurge deposits separately.
Drill Core 09-03, Eutaw-Tuscaloosa megablock-impactite sand complex: interpretations
The basal shear-mixing zone (R1) at the base of the resurge marks the underlying
megaslump-formed Eutaw-Tuscaloosa megablocks and penetrating, disaggregated impactite
sands from the overlying resurge sediments (see Figure 28). Stratigraphic horizons with high
concentrations of glauconite have been generally attributed to transgressive ravinement surfaces
at the Mooreville Chalk-Tombigbee contact (Savrda and King, 1993; Mancini and Soens, 1994)
or condensed sections in general sequence stratigraphy (i.e., Loutit et al., 1998). However, the
combination of flame structures, a basal erosive surface, shear-derived deformation immediately
below, and superjacent cross-lamination indicate unambiguously rapid burial, hence resurge.
These characteristics are inappropriate for a time-intensive surface. Therefore, the base of the
R1 lithofacies marks the resurge and underlying, slumped megablock.

148
The underlying Eutaw-Tuscaloosa megablock is a semi-intact, rotated, mostly complete
interval of Eutaw Formation strata intercalated with fluidized and injected impactite sands.
Figure (38) shows a series of fining-upward sequences. Within 09-03, a basal, pebbly, partially
iron-oxidized, sand is similar to reported basal pebbly, Eutaw sands of Frazier and Taylor
(1980). The basal facies is interpreted to be marginal marine and overlying Ophiomorpha-
bearing sands are interpreted to be shoreface sands (similar to descriptions by Mancini and
Soens, 1996). Generally, roundness increases, grain-size decreases, and sorting increases
stratigraphically upward. Moreover, a pink mottling is found in upward intervals. Nelson (2000)
reported pink sands directly beneath the Mooreville Chalk-Eutaw Formation contact. Although a
calcite-cemented, Mooreville-Eutaw contact is not found in 09-03 (as per observations of Savrda
and King, 1993; Nelson, 2000), the Eutaw interval in 09-03 is interpreted to be nearly intact due
to previously mentioned characteristics and reported thickness. Furthermore, with relatively
well-constrained inclinations, the underlying 09-03 megablock is either a rotated or tilted
megablock or part of a ramp structure within a duplex structure.
As previously discussed, the Eutaw megablock is intercalated with three zones of
disruption which could include stratigraphic intervals of fluidization, brittle and ductile
deformation, and clastic injections. Textural equivalents of the enigmatic matrix sand of dz1
have not been observed in the field, existing literature, and is better-sorted than most clastic
dikes. However, the enigmatic sand of dz1 is found within one short interval beneath dz2,
contains rotated breccia of lithofacies D2 exists below the basal gravelly facies of E6, and
appears to be above the probable Tuscaloosa interval of lithofacies T1. Furthermore, breccia
clasts are derived from the overlying Eutaw interval and are more common in the upper portion
of the dz1. Hurst et al. (2011) state that clastic sills characteristically have erosional sediments
149
derived from the upward wall rather than the lower one. Therefore, because dz1 is likely present
at the Eutaw and Tuscaloosa contact and contains brecciation characteristic of clastic sills, dz1 is
interpreted to be a probable clastic sill of unknown sedimentary source.
Disrupted zone 1 (dz1) clearly has at least two stages of deformation. An initial stage
includes brittle (meso-scale reverse and normal faulting), ductile deformation (convolute
lamination), and fluidization followed by clastic dikes that have cross-cutting relationships with
pre-existing deformational fabrics. Typically, clastic dikes show weak laminae sub-parallel to
dike walls in conventional settings (Petersen, 1968; Hurst et al., 2011). In impact settings, clastic
dikes have some wall-parallel lamination along with a substantial amount of entrained breccia
(i.e., Sturkell and Ormö, 1997). As shown in Figure 25, clastic dikes of dz2, dikes show some
sub-parallel laminae; however, as shown in Figure 25, some turbulent features exist within these
dikes. Furthermore, unlike observations of Sturkell and Ormö (1997), drill cores of dz2 show
dilation of existing sediments but do not show substantial brecciation of dike walls nor injection
of allogenic breccia as compared to examples of Lockne impact structure. Fining-upward sands
of the clastic dike network are interpreted as evidence for upward injected sediments. Thus, the
secondary sand injections are attributed to impact-derived over-pressuring of underlying
sediments rather than impact-derived compression-rarefaction dilations (described by Sturkell
and Ormö, 1997; Horton et al., 2008) that inject sediments downward from upward strata or
surficial deposits.
On the other hand, dz2 primary structureless and fluidized fabrics contain coarser, more
angular and more feldspathic sediments than surrounding Eutaw sands. Moreover, fluidized and
structureless sands (D1, D2 lithofacies) within dz2 have sporadic occurrences of devitrified glass
along with exotic components of heavy minerals and a large shattered feldspar crystal. This is

150
evidence for underlying source of injected material probably along a zone of shear (i.e., fault) as
evidenced by gradational and associated conjugate faults and tight, convolute and recumbent
folding.
Further evidence for macro-scale faulting at dz2 include the secondary dikes and a tight,
underlying fold (e.g., drag fold) with accompanied, internal, and locally-derived clastic dike-
similar to fold-dike associations by Strachan (2008). Unless evidence shows prior existence for
clastic dikes, i.e., cross-cutting relationships, clastic injections follow areas of extension and
lower pressure, normal faulting, or follow pre-existing faults due to mechanical anisotropy
(Hurst et al., 2003). Thus, dz2 is likely the site of a significant fault with a possible, secondary
reactivation.
Disrupted zone 3 (dz3) does not have associated faulting and clastic injections such as
dz1 and dz2. Instead, dz3 has moderately-sorted, homogeneous impactite structureless sands
with sporadic breccia of locally derived E1 intervals and an admixture of rare, exotic
components such as biotite. Genetic origin of this zone is enigmatic. Superjacent resurge
sediments have an erosive relationship with dz2 but do not appear to inject into dz3 nor do dz3
sediments inject into overlying resurge intervals. Speculatively, this interval could be a thin
veneer of back-slumped Eutaw sediments from adjacent folded-tilted megablocks to the north
(i.e., the “cliffs”). Another possibility is that these sands are sub-aerial, extrusive bodies of
injected sands, deposited shortly before the arrival of the resurge proper. Less likely, this
interval could be a cataclasis zone for a shear zone immediately beneath the resurge interval;
however, substantial drill-core loss and massive character of the sands do not allow for
interpretation for their genetic origin.

151
Drill Core 09-03: emplacement of mega-slumps and entrapment of resurge stratigraphy
The overlying marly resurge sediment contains inclinations in excess of angle of repose.
For example, a study by Kenter (1990) demonstrates that granular carbonate sediments can have
a maximum slope of 35°, but carbonate mud settings in the modern Bahamas have inclinations
less than 4 degrees. Thus, taking its fine-grained, marl compositions into account, the
inclinations of the resurge interval are clearly beyond the angle of repose. Furthermore, there is
no intercalation of avalanched, slumped, or significant admixture of crystalline basement,
Tuscaloosa Group, Eutaw Formation sediments and clasts. Because the resurge interval should
be emplaced after most slumping and avalanching of the southern rim (i.e., King et al., 2006), the
resurge interval of the “chalk meadow” is interpreted to be a half-graben-like structure that has
structurally-preserved a mostly complete interval of resurge facies. Thus, the listric fault that
likely tilted or rotated the resurge interval intersects the Tuscaloosa-Eutaw megablock as
depicted in Figure 55. From observations of 09-03 drill-core, the dz2 interval is interpreted to be
the faulted location of greatest likelihood. Conversely, Poag et al. (2004) describe post-impact
compact-driven, basement-derived extensional faulting in seismic studies which could account
for the down-thrown block (J. Ormö, personal communication, 2011). However, post-impact
graben and half-graben structures of the Chesapeake Bay impact structure have radial geometries
on plan view and relatively high angles in seismic section (cf. Figure 7.11 and 7.12 in Poag et al.,
2004). Thusly, basement-driven faulting seems unlikely as “chalk meadow” exposures do not
have radial geometries as seen in Figure 1 of this report. Instead, “chalk meadows” are
seemingly about a roughly linear west-east axis.

152
General structural models for slumping could explain the preservation of the resurge facies
as a downthrown and/or tilted block with associated, compressional folding in the “cliffs” to the
north. As discussed by Bradley and Hanson (1998), an idealized slump is composed of an
extensional regime and compressional regime delineated about a line of lateral detachment which is
manifest as a slip face. The forward-moving “toe” is characterized by a general transition, in order,
from symmetrical folds, asymmetrical folds, to sheath folds with a corresponding transition from
pure-shear (symmetrical folds) to simple shear (sheath folds). Bradley and Hanson (1998) used
stereographic methods to determine vergence; direction of vergence is inferred to be paleo-slump
direction. However, without a fully oriented drill-core and a well that intersects the axial plane, this
kind of analysis is likely not possible. Nonetheless, as seen in Figure 55, a general sense of vergence
can be appreciated by simply observing fold geometries within asymmetrical folds. A similar,
asymmetrical geometry has been observed within the “cliffs” (cf. Figure 40 in Nelson, 2000). This
Figure 55. Proposed cross-section of an area near core hole 09-03. Inferred structure based on the
field observations, existing literature (Nelson, 2000), inclinations, and disrupted zones within 09-03
drill-core. Dashed lines are possible normal faults. Solid line is probable normal fault that
intersects dz2.

153
fold within the western megablock is interpreted by the current author to indicate a northerly sense of
vergence and hence, a northernly sense of paleoslump direction (Figure 56).
Figure 56. Idealized slump model. Note forward compressional regime that transitions
from symmetrical folds to sheath folds in the “toe.” Extensional zone is behind
compressional zone. From Bradley and Hanson (1998).
Figure 57. Models demonstrating slump vergence. (Left) models demonstrating slump
geometry for vergence (paleoslump direction) in an asymmetrical fold. (Right) General
transition from symmetrical (pure shear) to sheath folds (simple shear). Stereographic plots
are to the right. Stereographic methods were not utilized within this study. From Bradley
and Cooper (1998).

154
Fig
ure
58.
Asymmetrical fold of the “cliffs”. Blue line is an interpre
ted,
corr
elat
ed o
ver
ban
k b
ed.
Bla
ck l
ine
is t
he
axia
l pla
ne
of
fold
. R
ed li
ne
is ap
pro
xim
ate
hin
ge
of
asym
met
rica
l fo
ld.
N
ort
h is
to
th
e ri
ght.
V
ergen
ce is
to
th
e ri
ght,
hen
ce
nort
her
nly
,pla
eosl
um
p d
irec
tion.

155
Similar to the idealized slump model of Bradley and Hanson (1998), analog modeling of
over-pressured slumps by Vendeville and Gaullier (2003) produced a “toe” of compression, and
across a passive boundary, deformation was characterized by extensional shear (e.g., normal
faulting). Their experiment involved underlying sand over-pressured by either compressed air or
water, an intermediate layer of sealing clay or silicone and an overlying cover of water and sand.
With tests that involved either compressed air or rapid slumping in water, a buckle folded and
thrust-faulted “toe” resulted, and a normal faulted extensional region resulted beyond a passive
boundary. Where normal faults breached the impermeable mid-layer, they became foci for
“fluid escape” (clastic dikes). Interestingly, the layer that experienced the most shear was the
lower basal sand, not the cover or impermeable layer.
The Vendeville and Gaullier (2003) model is thought by this author to be analogous for
both entrapment of the resurge and sub-surface mobilization. If the “chalk meadows” are in fact
within an extensional region of a mega-slump, the resulting graben or half-graben may have
provided a structural trap that preserved them to present day. Moreover, if the resurge was
partially syn-depositional with slumping, the fine-grained marl of the resurge would act as an
excellent seal for overpressured fluids within the megablocks. With active evolution of the
mega-slump or early settlement of the crater-fill breccias, normal faulting and the downthrown
resurge stratigraphy would breach the resurge seal and injected sediments and fluids along
normal faults and upon surface.
However, at this time, the modern, surficial contact between the “chalk meadow” and
neighboring Eutaw megablock is poorly exposed and partially obscured by a road. Thus,
trenching may be necessary to find evidence of expulsed fluids and sands. Furthermore,
intercalated slumped blocks have not been observed within the field nor in the drill core and

156
neither have currents and sediments of the resurge interval appear to have been affected by a
significant topographic low. Therefore, if an extensional regime within a mega-slump is
responsible for preservation of the resurge, then the resurge front must be immediately behind
the active front of the mega-slump. Alternatively, post-slumping compaction-derived subsidence
could preferentially appear along pre-existing, slump-derived faults. However, the presence of
secondary clastic dikes suggest a sudden outlet of escape before significant over-pressuring
dissipated; therefore, if subsidence is the cause of resurge preservation, then subsidence must
have occurred shortly after deposition of the resurge.
Drill Core 09-04: Slumped overturned flap and underlying impactite sands
The overturned fold sequence is interpreted as proposed by King et al. (2010) to be a
slumped portion of the southeastern overturned flap. As evidenced by fining-downward trends
(Figure 39), the upper Tuscaloosa interval is overturned whereas underlying Tuscaloosa is
fining-upward. Thus, with the interceding Eutaw stratigraphy between two Tuscaloosa
stratigraphic intervals and proximity to likely crystalline ejecta along the southeastern rim, this is
strong evidence that this is part of the preserved overturned flap. However, as evidenced by
variable, inclination trends and multiple repetitions of lithofacies within the Eutaw stratigraphy,
the resulting geometry of the slumped overturned flap is highly complex. Based on inclinations,
the overturned flap currently has secondary to tertiary folds. Also, undulating, deformed
contacts observed on overbank/cross-stratified contacts could be indications of self-similar
behavior (i.e., parasitic folds) of larger scale folding.
Furthermore, the 09-04 well likely penetrated the nose of the overturned fold, but the
drilling was off-center. As can be seen the “hinge zone” is off-center which could be explained
if the well penetrated the “nose” of the overturned flap and possibly if the overturned flap is

157
rotated. Also, although Eutaw Formation is definitely present, the sedimentological
characteristics are interpreted for a lower Eutaw unit of incised valley fill.
As discussed in target stratigraphy, biotite is a common constituent within regional
exposures of Emuckfaw Group. Also, biotite along with plagioclase is a comparatively common
constituent of the 09-04 Eutaw intervals as compared to 09-03 mineralogical composition where
muscovite is the predominant mica. However, biotite is considerably less chemically stable than
muscovite with laboratory results showing muscovite with two orders of magnitude greater
resistance to weathering than biotite (Leonard and Weed, 1970). In the Eutaw in this area, the
biotite grains had short transit time, are locally derived, had low subaerial exposure, and are
unlikely to have been significantly reworked (i.e., within shoreface and beach settings).
The fossiliferous clayshale (E10) lithofacies is possibly analogous to the “Ingersoll shale”
(described by Bingham et al, 2008), a tidal-channel fill of a lower Eutaw incised-valley fill that is
part of the lowermost transgressive systems tract. The E10 lithofacies is clearly lens-shaped due
to highly variable thicknesses of a double occurrence of a structurally repeated bed (see Figure
39); likewise, the Ingersoll shale is similarly lens shaped. Also, the E10 lithofacies is
fossiliferous with macerated plant material along laminae. However, the E10 lithofacies is finer-
grained, less fossiliferous (but no vertebrate fossils), and does not appear to have substantial
amber content as compared to the Ingersoll shale. Nonetheless, this is interpreted to be
equivalent in environment of deposition due to sedimentological characteristics, and tidal setting.
Also, the E10 lithofacies along with the silty lignite of E14 are likely the source for various
green, uncommonly carbonaceous, rounded mud clasts that reoccur as either a lag deposit within
Eutaw intervals, a conglomeratic lens, or an admixture within Eutaw-derived, disaggregated
impactite sands.

158
Sedimentological and stratigraphic characteristics taken as a whole, indicate that the
Eutaw intervals of 09-03 are a basal package of incised valley fill within original (undeformed;
pre-impact) stratigraphy. Within literature for extra-crater outcrops of Eutaw Formation
(Mancini and Soens, 1994; Savrda et al., 1996; Savrda and Nanson, 2003), locally for the
Wetumpka impact structure (Nelson, 2000; King and Ormö, 2007) and the 09-03 core
demonstrate that Ophiomorpha-dominated sands are ubiquitous within the Eutaw Formation.
Yet, not a single occurrence of Ophiomorpha sand is observed in either the overturned flap or the
underlying megabreccia. This could mean that the geometry of the fold and relationship to
drilling is such that the upper Eutaw stratigraphy is adjacent to the 09-03 core hole (at the cliffs).
Alternatively, the upper Eutaw could have been part of the original, target stratigraphy at
09-04 but is no longer present. In Ormö et al. (2002), excavation flow during the formation of
Lockne crater is thought to have removed part of the sedimentary cover along a low-angle
discontinuity surface. This surface would have formed before the overturned flap was
completely formed. Likewise, a similar phenomenon could have occurred at the Wetumpka
impact crater which removed the Mooreville Chalk and a significant, upper interval of the Eutaw
Formation.
As reported in results, semi-intact megablocks within the lower impactite sands mirror
the stratigraphic pattern of the semi-intact overturned flap. Also, impactite sands appear to be
mostly disaggregated intervals of Eutaw, within the Eutaw-dominated section and could be
Tuscaloosa-derived in Tuscaloosa dominated sections. There are a number of possibilities for
the relict stratigraphic order.
Although the stratigraphic similarities of the overturned flap and apparent relict
stratigraphy of the lower impactite sands could be happenstance, it is thought by this author to

159
give us some insight into the mode of emplacement within the crater. First, during the collapse
of the southeastern rim, the overturned flap may have “avalanched” into the southeastern
quadrant with a systematic shedding of material that reflected the stratigraphic order of the
overturned flap. In this scenario, the Eutaw Formation must be partially excavated as previously
discussed. Collapse of the rim (once the transient crater ceases to expand) results in crater-filling
breccia from slumping, landslides, and the formation of rim terraces (Melosh and Ivanov, 1999).
In crater-filling breccias of the Chesapeake Bay impact structure, Gohn et al. (2009) interpreted
crater-filling “diamicton” as consequence of avalanching of the collapsing rim in which sliding
masses of the rim break up by dilational processes into discrete blocks with a resulting evolution
to debris flow. A similar process could have occurred with the southeastern rim. In this scenario,
the overturned flap could not be part of the hinge. Instead, the overturned flap would be a
secondary fragment that would slump onto a forward avalanche. This is possibly supported by
swirled fabrics that indicate some form of shear between the overturned flap and lower impactite
sands.
A second possibility is that the 09-04 shows a severely rotated, rotational slump. In this
scenario, the large amount of accommodation space is interpreted in gravity modeling (Figure 3)
and evident in the considerable depth of the true crater floor at the edge of the crater (> 251 m
depth). This may create more rotation in the slumping rim which due to soft-sediment
deformation and overturned stratigraphy would create a highly, complex fold and stratigraphic
architecture (cf. examples of slumping in Ricci, 1995). Furthermore, in non-impact settings,
Bradley and Hanson (1998) observed basal shear zones with disaggregated sediment and internal
clasts that resemble the common contorted mega-clasts of the impactite sand interval of 09-04
(see Figure 59). Also, Strachan (2008), again in non-impact settings, observed and described

160
“flow transformations” in which cohesive sub-aqueous slumps progress with increasing folding
until brittle deformation and clastic injections result near hinges of folds. Consequently, with
increasing deformation, slumps brecciate into debris flows. Following the work of Strachan
(2008), folding and consequential overpressure are the true cause of a transition from slump to
debris flow. Thus, it is possible despite the relative short distance of transport for slump to
debris flow rather than avalanche to debris flow if sufficient folding and over-pressuring are
present.
Although the stratigraphy of 09-04 could have resulted from avalanching, slumping, or a
combination of mass-wasting mechanisms, the stratigraphy is not the result of fallback ejecta.
Fallback ejecta should incorporate a considerable amount of crystalline ejecta. Instead, semi-
Figure 59. A possible analog for the slumped, overturned flap of drill core 09-04. Note the
shear and contorted and dismemberment of bedding along a basal shear. This was originally a
study of sub-aqueous deep basin Devonian slumps within Maine. From Bradley and Hanson
(1998).

161
intact boulders and blocks of the impactite sand are of sedimentary strata but very little
crystalline clasts are encountered except at the base of the well. Furthermore, heavy mineral
percentages fall under 1%, which is consistent with normal Tuscaloosa Group heavy mineral
content (see Target Stratigraphy). However, the presence of euhedral, shattered garnets, epidote,
and sporadic interstitial glasses suggests that some ejecta admixture is present. Possibly, suevite
or ejecta breccia constituents were upwardly injected into the sediments of the collapsed rim.
Finally, although post-impact hydrothermal effects are not an objective of this study,
observations for hydrothermal conditions and substantial alteration of minerals are observed.
overbank deposits of Tuscaloosa Group (T2, T3) should not be calcareous based on existing
literature of the Tuscaloosa. However, upward boundaries of T2-T3 blocks have evidence of
reduction with associated calcium carbonate precipitation that diminishes with depth. Therefore,
this could indicate a downward directed calcium bicarbonate enriched groundwater (derived
from seawater?) that has precipitated calcite within the less permeable intervals, suggesting
evidence for a post-impact convectional hydrothermal system. Also, common chloritization of
micas and plagioclase are present. Chloritization of biotite is commonly associated with
hydrothermal systems (i.e., Parneix et al., 1985; Ezzaim et al., 1999). However, chloritization of
biotite has been demonstrated to occur in low temperature, near surface settings. Within the
Tuscaloosa of sub-surface Louisiana of the central Gulf of Mexico, reservoir sands have chlorite
linings along with chloritized biotite micas. Ryan and Reynolds (1999) demonstrated that near
surface weathering and alteration of ultramafic clasts within the Tuscaloosa sediment facilitated
the chloritization of biotite and precipitation of chlorite clays. As reported by Neathery et al.
(1976), an amphibolite bed exists in the eastern rim which could have similarily facilitated the
chloritization of biotite as geochemical processes described by Ryan and Reynolds (1999).

162
Drill Core 09-03: Resurge Deposition
Granulometric, statistical approaches, such as those conducted by Ormö et al. (2007) or
Ormö et al. (2009), were not attempted because marl clasts could not be distinguished with the
unaided eye nor could clasts be delineated consistently enough by X-ray CT. Nevertheless, in
concert with paleocurrent directions (Figure 27), sedimentary structures and lithofacies
characterizations could be used in conjunction with established resurge characteristics to
interpret some aspects of the Wetumpka resurge.
First, paleocurrents do not have true azimuth directions. However, based on previous
discussions about structural features of the “chalk meadow,” a listric fault is assumed to exist
along the surficial trace of the Eutaw-Mooreville Chalk contact. Assuming any resulting
deformation (i.e., drag folding), tilting, or rotation would have produced strikes sub-parallel to
this trace, an inferred north can be determined (Figure 27). However, with paleocurrent data,
tectonic adjustments are unnecessary for tilting under 25°; beneath 25°, azimuth parameters are
altered less than three degrees (Potter and Pettijohn, 1977). Dipping of sub-horizontal features
within the resurge exceed 25 degrees. However, without a true understanding of the structural
configuration of the “chalk meadow,” any tectonic adjustment is somewhat speculative. On the
other hand, almost all paleocurrent and fracture inclinations, with the exception of basal
inclinations, exceed the associated sub-horizontal dip. Thus, the tectonic adjustment would not
reverse the dipping direction. Therefore, the data is still reliable to determine broadly defined
direction, (i.e., approximately north or south).
Although resurge is mostly determined by debris-flow characteristics, the base of the
resurge has both flame structures and overlying cross-laminations with increasing inclination
upward. Moreover, unlike overlying intervals, the mineralogical composition is exceptionally

163
glauconitic. In fact, other than intact Mooreville Chalk-Tombigbee Sand clasts (e.g., R4
lithofacies), glauconite is dispersed within resurge matrix; the high glauconitic content has been
interpreted by King et al. (2010) to indicate the resurge sediments are sourced distally from
deeper Mooreville Chalk. Therefore, based on the presence of the cross-lamination set, the front
of the inrushing resurge was aqueous in character, and based on paleocurrent directions, the
initial resurge deposition was northward directed from a deeper, distal source.
On the other hand, as seen in Figure 27 the resurge-megablock contact inclination
supersedes the superjacent inclinations. Therefore, this could indicate a southerly directed
current. However, by rotating the basal contact to 0° and subtracting the rotated angle from the
superjacent series of angles, the overlying series of inclinations reverse from increasingly
inclined to decreasingly-inclined upward; a stratigraphically higher interval of trough cross-
stratification is increasingly-inclined upward. Also, inclinations of originally sub-horizontal
features are variable and the basal contact supersedes overlying originally sub-horizontal
indicators. Because the basal inclination exceeds subsequent, originally sub-horizontal
inclinations and combined with previous points; the rotation of the resurge-megablock contact is
interpreted to be syn-deformational with early resurge deposition. Consequently, the amount of
rotation of underlying units at onset of resurge deposition was likely 14° rather than 43°; thus
northward directed currents.
For possible mode of deposition of these impact deposits, there are a some rare, reversed
laminae (herringbone cross-stratification) within the basal R1 interval and a flame structure at the
base; these are known non-exclusive sedimentary structures of tsunamiites (Matsumoto et al.,
2008; Fujiwara, 2008). Lithofacies R1 relative thinness (0.2 m) is also supporting evidence of
tsunami origin. However, the overlying units within the resurge are substantially thick and are

164
evidence against R1 lithofacies as part of the oscillatory resurge (i.e., tsunami wave train).
Therefore, the R1 lithofacies is part of the resurge proper, the initial deposition of the true
resurge. However, how this unit relates hydrodynamically to the rest of the resurge remains a
mystery.
The overlying unit above the basal R1 lithofacies is a matrix-dominated breccia interval
(R2). Based on the sedimentological characteristics reported in results, the overlying R2 interval
is a matrix-dominated debris flow as defined by Tripsanas et al. (2003) as having less than 5%
clasts. Poorly-defined stratification is interpreted by Tripsanas et al. (2003) to indicate
“successive surges” and hydroplaning of the overall flow. However, stratified matrix-dominated
flows are also reported to have inverse grading. Matrix of the lower resurge appears to have
weak normal grading.
In non-impact settings, studies of “debrites” within deep ocean basin plains resemble
sedimentological characteristics of the lower resurge. Overall, the basal R1 and R2 lithofacies
resemble stratigraphic descriptions of a “debrite” sequence by which they have a basal laminated
and massive, relatively better-sorted sand overlain by a matrix-dominated breccia. Within the
“debrite,” breccia clasts are boulders that have long axis aligned parallel to bed base. Similarily,
although the lower resurge is much thicker, R5 lithofacies of chalk and marl boulders are tabular
in shape and have apparent alignment with matrix laminations. However, unlike descriptions by
Talling et al. (2010), tops of R5 lithofacies have frozen, dilational brecciation (Figure 60).
Although, the specific cause is unknown, this brecciation could be caused by a passing
solidification front within the debris flow during deposition (for discussion of solidification front
within fluidized flow, see Sassa et al., 2003). As the solidification front passes though an R5

165
clast, there could be a differential shear that may have created the upward suction. However,
further study may be required to fully explain this brecciation.
The contact of the lower resurge and mid-resurge is somewhat irregular, but a probable
inclination was derived for an originally sub-horizontal contact. Downward injection of resurge
matrix, subtle load casts, and contrasting attenuation values within X-ray CT suggest different
densities between mid-resurge and lower resurge. Possibly, fracturing and downward injection
reflects an upward suction.
Drill Core 09-03: mid-resurge, evidence for anti-resurge
The mid-resurge as a whole is interpreted to be the anti-resurge equivalent of Wetumpka
resurge. As discussed by King et al. (2006), resurge would have been disproportionally strong
from the south due to the southern collapsed rim and the resistant barrier of the northern
Figure 60. A stratigraphic analog for the lower resurge from deep basin plain setting.
According to Talling et al. (2010), this “debrite” traveled 45 km above a hydroplaning base.
Modified from a figure in Talling et al. (2010).
R1 equivalent
R2 equivalent

166
crystalline rim. Therefore, returning water would not likely converge on a central location and
create a well-defined central plume. However, the resurge may have progressed towards the
northern rim where resurge proper crashed against that barrier and created an “outer-wall” which
would then behave similarly to a central plume along the interior of the northern crystalline rim.
Consequently, after piling up against the northern rim, the resurge would reverse back to sea, and
thus create an anti-resurge. This concept is supported by the mid-resurge of the 09-03 drill-core.
The 09-03 mid-resurge is a clast-supported marl and chalk breccia as revealed by X-ray
CT. According to Ormö et al. (2007), anti-resurge deposits are characterized sedimentologically
by the following: gradual reverse grading in clast size; better washing but less sorting in clasts;
and reworking of resurge proper sediments. Based on imbrications of marl and chalk clasts,
initial currents are variable but progress into well-defined south directed currents. Qualitative
assessment of clast size reveals both reverse grading and normal grading; however, if two
“pulses” are present, then each pulse is likely normally graded. This is in contradiction with
observations by Ormö et al. (2007) for reversely graded anti-resurge units. On the other hand,
matrix grain-size trends show reverse grading. Mid-resurge matrix is relatively sandier than
underlying matrix within the lower resurge, and reworked clasts are comparatively well-rounded,
indicating traction transport. Waning flow led to a transition from a conglomeratic deposit to
trough cross-bedded glauconitic sand which is also southward directed. Subsequently, thin
variably directed, clast-supported breccias suggest variable current directions. However, using
the wall-plume concept, anti-resurge flow should be quite variable and likely interweaving.
09-03: upper resurge: slumping and rapid suspension fallout
Clast-dominated breccias grade upward into contorted, sub-vertically laminated, mud-
dominated breccias. This deformed interval is interpreted as slumping due to either adjustments

167
following anti-resurge deposition or further subsidence of the proposed half-graben structure.
Exceptionally fine-grained and normally graded calcareous silts above the slumped interval are
likely rapid suspension fall out of suspended fine sediment within the oscillatory phase of the
resurge.
09-03: uppermost resurge: slumping or tsunamiite?
The exceptionally fine-grained upper interval of the upper resurge is truncated by a clast-
dominated breccia and transported boulders of Mooreville Chalk. Due to reduction in data
quality in the uppermost three meters and an incomplete record, interpreting this interval is
problematic. Although chalky clasts and a one rare schist clast are located at the base,
sedimentary structures are absent. Due to the size of the overlying block at the top of the drill-
core, the uppermost resurge is interpreted to be a post-impact, resurge-deposit slump as
sedimentary structures for tsunamiites are absent (i.e., basal flame structures, herring-bone cross-
stratification, winnowed tops, etc.).
Enigmatic Composition of Wetumpka’s Resurge
The most important characteristic of the Wetumpka resurge is the exceptionally
homogeneous lithology of transported clasts. Despite having a diverse target stratigraphy, the
resurge of Wetumpka is almost exclusively sourced from Mooreville Chalk, the uppermost and
thinnest stratigraphic target unit. Other well-studied impact craters such as Chesapeake Bay and
Lockne craters have diverse, mixed target but have a full, lithologic range of constituent clasts
even if a particular lithology is predominant. Where preserved, extra-crater resurge deposition
has similar diversity (see the Alamo impact structure discussed by Pinto and Warme, 2008).
However, although interpretations can be made on the local mode of emplacement with the 09-
03 and 09-04 drill-cores, with a lack of evidence rather than actual evidence, any explanation is

168
widely speculative. Therefore, this will likely remain an open question for further research at
Wetumpka.
Chronostratigraphic timing of the Wetumpka Impact Event
Wartho et al. (2011) established a radiometric date of 84.4 +/- 1.4 Ma for the Wetumpka
impact structure. However, within the resurge sediment and in outcrops of semi-intact
Mooreville Chalk (see Nelson, 2000), chalky clasts and an interbedded chalk bed are observed,
respectively. Consequently, using the stratigraphic framework of Liu (2007) in Figure 4, the
Wetumpka impact event is further chronostratigraphically and lithostatigraphically constrained
to a range of between 83 and 84 million years. This range is delineated based on the first chalky
interbedding and the upper limit of error on the 84.4 +/- 1.4 m.y. radiometric date. This chalky
interbed is located in the lower CC17 biostratigraphic zone. Currently, only one chalky interbed
is observed within semi-intact Mooreville megablocks of Nelson (2000). Moreover, resurge
sediments are predominately marl versus chalk. Also, because a lower target water thickness is
suggested by Ormö (2010), the present author suggests that the Wetumpka impact occurred in a
regressive phase within the deposition of lower Mooreville Chalk. Thus, as marked by Figure 4,
the Wetumpka event occurred in the lower CC17 during a brief regression of an approximate age
of 83.9 million years ago.
CONCLUSIONS
Based upon observations of the 09-03 and 09-04 drill-cores, the following bulleted
conclusions have been determined towards the objectives stated in the Introduction.
● Lithofacies and general stratigraphy of drill cores 09-03 and 09-04: The lower
part of 09-03 contains a tilted-rotated Eutaw-Tuscaloosa megablock with three
intercalated, deformational, and disrupted zones. The original stratigraphy of the
169
megablock is characterized by the lithofacies in stratigraphic order of appearance:
micaceous, massive Tuscaloosa sand (T1); trough cross-bedded sand (E6);
bioturbated, cross-laminated sand (E7); bioturbated, massive sand (E1); bioturbated,
interbedded sand and mud (E2);sheared, bioturbated sand (E8); and sheared, cross-
laminated sands; fluidized sand that are intercalated by structureless, impactite sands
(D1); fluidized impactite sands (D3); and clastic dikes (D2). The Eutaw-Tuscaloosa
megablock is overlain by resurge lithofacies, specifically: basal shear-mixing zone
(R1); matrix-dominated breccias (R2); clast-dominated breccias (R3); transported
Mooreville Chalk(R4); polylithic-laminated matrix (R5); and enigmatic chalk (R6),
which are constituents of stratigraphic informal units of lower-resurge, mid-resurge,
upper-resurge, and uppermost resurge. The lower part of 09-04 is an impactite sand
with entrained blocks of Tuscaloosa and Eutaw, namely these lithofacies:
overbank/paleosol mud (T2); overbank/paleosol sand/sandstone (T3); contorted,
laminated sand/sandstone (T4); fluidized sand/sandstone (T5); cross-stratified
sand/sandstone (T6); sandy lignite (E15); contorted, laminated sand/sandstone(E7);
grayish-green to green-black; mud conglomerate (E8) in an impactite sand matrix of
Massive, structureless, impactite sand/sandstone (D1); fluidized impactite sand and
sandstone (D2); contorted, impactite sand/sandstone (D5); massive, structureless,
granular-pebbly impactite sand/sandstone (D6); and inclined, poorly-moderately
stratified impactite sands/sandstone (D7). The impactite sands and entrained semi-
intact blocks are overlain by a slumped, overturned flap of semi-intact, heavily
folded, Tuscaloosa and Eutaw lithofacies, namely: overbank/paleosol mud (T2);
overbank/paleosol sand/sandstone (T3; contorted, laminated sand/sandstone (T4);

170
fluidized sand/sandstone (T5); cross-stratified sand/sandstone (T6); sandy lignite
(E15); and contorted, laminated sand/sandstone (E7)
● Mode of emplacement of the Wetumpka resurge: The resurge interval of drill core
09-03 is divided into four stratigraphic divisions: lower resurge, mid-resurge, upper
resurge and uppermost resurge. Stratigraphic and sedimentological observations
along with azimuth directions inferred from oriented drill core with an inferred
extensional structure allow interpretations of mode of emplacement and general
direction of resurge flow. The following characterizations and interpretations are
given by Ormӧ et al. (2007) and King et al. (2006). (1) The lower resurge is a
matrix-dominated debris flow with a general northerly flow that has poor
stratification, entrained Mooreville Chalk clasts up to 1 meter in stratigraphic
thickness, and a basal, mixing zone with cross-laminated, heavily glauconitic sand.
This is interpreted to be the “resurge proper” and hydrodynamic mode of
emplacement could be similar to stratigraphically analogous, hydro-planing, debris
flows (see Talling et al., 2010). (2) The mid-resurge is a clast-supported breccia or
conglomerate that is generally southerly directed, has moderately imbricated and
normal grading clasts, reverse grading of sandy-marl matrix, and is capped by trough
cross- stratification or possible oscillatory ripples. This interval is interpreted to be an
“anti-resurge” equivalent derived from seaward flow from a “wall-plume” rather than
a central plume (see King et al., 2006). (3) The upper resurge follows clast-
supported breccias and generally fines upward into silty and clayey marl above a
contourted and chaotic lamination of interpreted slumping of resurge depostits. This
is interpreted to be part of the “oscillatory resurge” and involved rapid deposition of
171
suspended particles. (4) The uppermost resurge represents either post-impact
slumping of resurge sediments or a late arriving tsunamiite. However, because of an
incomplete record, heavy weathering, and some limited loss of core, interpretation of
the uppermost resurge is problematic.
Structural entrapment and preservation of resurge deposits: The uppermost
impact stratigraphy of the resurge facies is preserved at Wetumpka because of
structural traps. The Eutaw-Tuscaloosa megablock beneath the resurge strata has
moderately constrained inclinations with a mean dip and rotation-tilting of ~30
degrees. Comparisons with the well-studied “cliffs” locality, location of the “chalk
meadow,” and resurge inclinations that exceed the angle of repose suggest that the
“chalk meadow” is part of a local extensional zone within a megaslump. Therefore,
the “chalk meadows” of resurge deposition are at least partially preserved by local
graben or half-graben structures. Alternatively, resurge deposits are preserved due to
post-impact subsidence-derived graben or half-graben structures analogous to similar
structures at Chesapeake Bay (see Poag et al., 2004).
Disrupted zones of the Eutaw-Tuscaloosa megablock (09-03): From observations
within the 09-03 drill core, three zones of disrupted strata are observed within the
megablock. The lowermost zone (dz1) is interpreted to be a clastic sill between the
Eutaw Formation and Tuscaloosa Group from an enigmatic source. The middle zone
(dz2) is a brittle to ductile to fluidized zone that is interpreted to be a fault zone within
the mega-slump complex. The dz2 also shows evidence for a secondary
deformational event. Clastic dikes that have cross-cutting relationships with pre-
existing deformational fabrics are interpreted to indicate that a resurge seal was

172
breached by extensional faulting. The dz3 zone is likely pre-resurge deposition back-
slumped sands from neighboring megablocks.
Original Eutaw Stratigraphy of the Wetumpka Area: Sedimentological and
stratigraphic observations of the semi-intact Eutaw intervals within drill cores 09-03
and 09-04 allow increased understanding of original, general Eutaw stratigraphy for
the Wetumpka area. The target Eutaw Formation consists almost entirely of the
lower unnamed member of the Eutaw Formation. From 09-03, the Eutaw Formation
is divided into two stratigraphic parts. A “lower” unit within the Eutaw Formation is
poorly lithified, moderately bioturbated cross-stratified, marginally subfeldspathic to
quartzose sands with sparse gray, bioturbated, and interbedded clays. The lower unit
contains a basal pebbly, coarse sand that is weakly to moderately cemented by iron-
oxides. In contrast, the “upper” unit of Eutaw Formation is a heavily bioturbated,
medium to fine-grained, rounded, and moderately to well-sorted quartzose sand. The
upper unit is exceptionally friable and has both interbedded bioturbated white clays
and cross-stratified sand lenses. A pink mottling is diagnostic for the upper Eutaw.
Locally, incised valley-fill facies of tidal flats and channels exists in the basal Eutaw
Formation. The true, stratigraphic thickness of the Eutaw Formation is a minimum of
34 m within 09-03.
Mega-slump of Overturned Flap: King et al. (2010) proposed that the 09-04 well
penetrated the overturned flap based upon reversed stratigraphy of Tuscaloosa,
Eutaw, and then Tuscaloosa and sub-vertical bedding near a “hinge” within the
penetrated Eutaw Sand. King et al. (2010) also described the lower interval of 09-04
as “impactite sands.” Following detailed analysis of the 09-04 drill-core, grain-size

173
trends show fining-downward trends in the upper Tuscaloosa interval and fining-
upward in the lower trend. Grain-size trends confirm that the uppermost 100 m
belong to a slumped overturned flap. However, variable inclinations and repetitions
of beds before the sub-vertical bedding suggest complex secondary and tertiary
folding following slumping of the overturned flap. In the lower impactite sands,
original stratigraphy of megaclasts resembles the overlying stratigraphic pattern
within the overturned flap. Thus, the lower impactite sands are interpreted to be
disaggregated intervals of the overturned flap as well. Petrography of impactite sands
show accessory minerals <1% which are well within range for Tuscaloosa Group.
However, shattered euhedral garnets, intact epidote-zoisite crystals, and sporadic
glass demonstrate some disaggregated crystalline basement has been entrained or
injected upward into the slumped or sheared lower part of the overturned flap (lower
impactite sands).
Stratigraphic timing of the Wetumpka impact event: The radiometric date of 84.4
+/- 1.4 m.y. (Wartho et al. (2011) is further stratigraphically constrained by sparse
chalky clasts within resurge sediments and a chalky interbed within semi-intact
Mooreville Chalk megablocks described by Nelson (2000). Using the upper
boundary of the radiometric date and the first chalky bed within the stratigraphic
framework of Liu (2000), the age of the Wetumpka impact is constrained to a range
of 83 to 84.4. Assuming that Wetumpka occurred within a regressive phase and only
one chalky bed is present within Wetumpka target stratigraphy, an approximate age
of 83.9 million years ago is suggested.

174
References Cited
Abramoff, M.D., Magalhaes, P.J., and Ram, S.J., 2004, Image Processing with ImageJ:
Biophotonics International, v. 11, p. 36–42.
Akin, S. and Kovscek A., 2003, Computed Tomography in Petroleum Engineering Research, in
Mees, F., Swennen, R., Van Geet, M., and Jacobs, P., eds., Applications of X-ray
Computed Tomography in the Geosciences: Geological Society, London, Special
Publications, v. 215, p. 23–38.
Alabamaview, 2010, 10m digitial elevation model, Elmore County
< http://www.alabamaview.org/10m_DEM.html> (Accessed August 12, 2010).
Ashi, J., 1997, Computed tomography scan image analysis of sediments. In Shipley, T.H.,
Ogawa, Y., Blum, P., and Bahr, J.M., eds., Proceedings of the Ocean Drilling Program,
Scientific Results, v. 156, p. 151–159.
Baksi, A.K., 1999, The Timing of Late Cretaceous Alkalic Igneous Activity in the Northern Gulf
of Mexico Basin, Southeastern USA, Geology, v. 105, p. 629–644.
Blair, T.C., and McPherson, J.G., 1999, Grain-size and textural classification of coarse
sedimentary particles: Journal of Sedimentary Research, v. 69, p. 6–19.
Bingham, P.S. and Frazier, W.J., 2004, Paleogeographic Reconstruction of Upper Cretaceous
southwest Georgia and east central Alabama using the GIS method (DIGGH) to analyze
the disconformity separating Tuscaloosa sediments from the Eutaw Formation:
Geological Society of America, Abstracts with Programs, v. 36, n. 2, p.137.
Bingham, P.S., Savrda, C.E., Knight, T.K., and Lewis, R.D., 2008, Character and genesis of the
Ingersoll shale, a compact continental fossil-lagerstätte, Upper Cretaceous Eutaw
Formation, Eastern Alabama: Palaios, v. 28, p. 391–401.
Bradley, D. and Hanson, L, 1998, Paleoslope analysis of slump folds in the Devonian flysch of
Maine: Journal of Geology, v. 106, p. 305–318.
Brooks, R.A., and Di Chiro, G., 1976, Beam Hardening in X-ray reconstructive tomography:
Physics in Medicine and Biology, v. 21, p. 390.
Carlson, W., Rowe, T., Ketcham R., and Colbert, M., 2003. Applications of high-resolution X-
ray computed tomography in petrology, meteoritics, and paleontology. In Mees, F.,
175
Swennen, R., Van Geet, M., and Jacobs, P., eds., Applications of X-ray Computed
Tomography in the Geosciences. Geological Society, London, Special Publications, 215,
p. 7–22.
Carrozi, A., 1993, Sedimentary Petrography: New Jersey, Simon and Schuster Company, 263 p.
Clark, Jr., O.M., 1965, Clay Deposits of the Tuscaloosa Group in Alabama: Twelfth National
Conference on Clay and Clay Minerals, p. 495–507.
Cnudde, V., Massachaele, B., Dierick, M. and Vlassenbroeck, B., 2006, Recent progress in X-
ray CT as a geosciences tool: Applied Geochemistry, v. 21, p. 826–832.
Cox, R. T. and Van Arsdale, R.B., 2002, The Mississippi Embayment, North America: A first
order continental structure generated by the Cretaceous superplume mantle event:
Journal of Geodynamics, v. 34, p. 163–176.
Cromey, D.W., 2010, Avoiding twisted pixels: Ethical guidelines for the appropriate use and
manipulation of scientific digital images: Science and Engineering Ethics, v. 16, p. 639–
667.
David, J.C., 2002, Statistics and data analysis in geology (3rd
edition): New York, John Wiley
and Sons, 638 p.
Davis, R., Jr., 1983, Depositional systems: A genetic approach to sedimentary geology: New
Jersey, Prentice-Hall, 660 p.
Donofrio, R.R., 1998, North American impact structures hold giant field potential: Oil and Gas
Journal, May issue, p. 69–83.
Drennen, C.W., 1953, Reclassification of Outcropping Tuscaloosa Group in Alabama: Bulletin
of the American Association of Petroleum Geologists, v. 37, p. 522–538.
Drummond, M.S., Nielson, M. J., Allison, D.T., and Tull, J.F., 1997, Igneous petrogenesis and
tectonic setting of granitic rocks from the eastern Blue Ridge and Inner Piedmont,
Alabama Appalachians, in Sinha, A.K., Whalen, J.B., and Hogan, J.P., eds., The nature of
magmatism in the Appalachian orogen: Geological Society of America, p. 147–164.
Duliu, O.G., 1999. Computer axial tomography in Geosciences: an overview: Earth-Science
Reviews, v. 48, p. 265–280.
Ezzaim, A, Turpault, M.P., and Ranger, J., 1999, Quantification of weathering processes in an
acid brown soil developed from tuff (Beaujolais, France): Part 1. Formation of weathered
rind: Geoderma, v. 87, p. 137–154.
Flisch, A., and Becker, A, 2003. Industrial computed tomography studies of lake sediment drill
cores. In Mees, F., Swennen, R., Van Geet, M., and Jacobs, P., eds., Applications of X-

176
ray Computed Tomography in the Geosciences: London, Geological Society Special
Publications, v. 215, p. 205–213.
Frazier, W.J., and Taylor, R.S., 1980, Facies changes and paleogeographic interpretation of the
Eutaw Formation (Upper Cretaceous) from western Georgia to central Alabama, in Tull,
J.F., ed., Field Trips for the Southeastern Section of Geological Society of America,
Birmingham, Alabama, p. 1–27.
French, B.M., 1998, Traces of Catastrophe: A Handbook of Shock-Metamorphic Effects in
Terrestrial Meteorite Impact Structures: Houston, Lunar and Planetary Institute, LPI
Contribution no.954, 120 p.
French, B.M., and Koeberl, C., 2010, The convincing identification of terrestrial meteorite
impact structures: What works, what doesn’t, and why: Earth-Science Reviews, v. 98,
p. 123–170.
Fujiwara, O., 2008, Bedforms and sedimentary structures characterizing tsunami deposits, in
Shiki, T., Tsuji, Y., Yamazaki, T., and Minoura, K., eds., Tsunamiites: features and
implications, p. 51–59.
Gohn, G.S., Powars, D.S., Dypvik, H., and Edwards, L.E., 2009, Rock-avalanche and ocean-
resurge deposits in the late Eocene Chesapeake Bay impact structure: Evidence from the
ICDP-USGS Eyreville cores, Virgina, USA, in Gohn, G., Koeberl, C., Miller, K., and
Reimold, W., eds., The ICDP-USGS deep drilling project in the Chesapeake Bay impact
structure: Results from the Eyreville core holes: Boulder, Colorado, Geological Society
of America Special Paper 458, p. 587–616.
Goto, K., 2008, The genesis of oceanic impact craters and Impact-generated tsunami deposits, in
Shiki, T., Tsuji, Y., Yamazaki, T., and Minoura, K., eds., Tsunamiites: Features and
implications, p. 277–297.
Graham, J., 1998, Collection and analysis of field data, in Tucker, M., ed., Techniques in
Sedimentology: New York, Blackwell Scientific Publications, p. 5–62.
Grieve, R. and Therriault, A., 2000, Vredefort, Sudbury, Chicxulub: Three of a Kind?: Annual
Review of Earth and Planetary Sciences, v. 28, p. 305–338.
Greive, R., Rupert, J., Smith, J., and Therriault, A., 1995, The record of terrestrial impact
cratering: GSA Today, v. 5, p. 189–196.
Harwood, G., 1988, Microscopic techniques: II. Principles of Sedimentary petrography, in
Tucker, M., ed., Techniques in Sedimentology: New York, Blackwell Scientific
Publications, p. 108–173.

177
Hopkins, F., Diu, Y., Lasiuk, B., Abraham, A., Basu, S., 2004, Analytical corrections for beam-
hardening and object scatter in volumetric computed tomography systems: Montreal,
Canada, 16th
World Conference of Nondestructive Testing, 107 p.
Horton, Jr., J.W., Gohn, G.S., Powars, D.S., and Edwards, L.E., 2008, Origin and emplacement
of impactites in the Chesapeake Bay impact structure, Virginia, USA, in Evans, K.R.,
Horton, J.W., Jr., King, D.T., Jr. and Morrow, J.R., eds., The sedimentary record of
meteorite impacts: Boulder, Colorado, Geological Society of America Special Paper 437,
p. 73-79.
Hurst, A., Cartwright, J., and Duranti, D., 2003, Fluidization structures produced by upward
injection of sand through a sealing lithology, in Van Rensbergen, P., Hillis., P., Maltman,
A.J., and Morley, C.K., eds., Subsurface sediment moblization: London, Geological
Society, Special Publications, v. 216, p. 123–137.
Hurst, A., Scott, A., and Vigorito, M., 2011, Physical characteristics of sand injectites: Earth-
Science Reviews, v. 106, p. 215–245.
Johnson, R.C., 2007, Wetumpka impact structure modeled as the exposed remains of a large,
shallow-water, marine-target crater for analysis and interpretation of two drill cores taken
from the structure’s geographic center: unpublished Masters Thesis, Auburn, Alabama,
Auburn University, 345 p.
Kenter, J.A., 2006, Carbonate platform flanks: slope angle and sediment fabric: Sedimentology,
v. 37, p. 777–794.
Ketcham, R., and Carlson, W., 2001, Acquisition, optimization and interpretation of X-ray
computed tomographic imagery: applications to the geosciences: Computers and
Geosciences, v. 27, p. 381–400.
King, Jr., D.T., 1990, Facies stratigraphy and relative sea-level history—Upper
Cretaceous Eutaw Formation, central and eastern Alabama: Transactions of the Gulf
Coast Association of Geological Societies, v. 40, p. 222–229.
King, Jr., D.T., 1994, Upper Cretaceous Depositional Sequences in the Alabama Gulf Coast
Plain: Their Characteristics, Origin, and Constituent Clastic Aquifers: Journal of
Sedimentary Research, v. 64, p. 258–265.
King, Jr., D.T., 1997, Sequence Stratigraphy of Upper Cretaceous Alluvial Plain Facies
Tuscaloosa Formation, Eastern Alabama: Transactions of the Gulf Coast Association of
Geological Societies, v. 47, p. 469–470.
King, Jr., D.T., Neathery, T.L., Petruny, L.W., Koeberl, C., and W.E. Hames, 2002, Shallow
marine-impact origin for the Wetumpka structure (Alabama, USA): Earth and Planetary
Science Letters, v. 202, p. 541–549.

178
King, Jr., D.T., Neathery, T.L. and Petruny, L.W., 2003, Crater-filling sediments of the
Wetumpka marine-target impact crater (Alabama, USA), in Dypvik, H., Burchell, M.J.,
and Clays, P., eds., Cratering in marine environments and on ice: Berlin, Springer-
Verlag, p. 97–113.
King, Jr., D.T., Ormö, J., Petruny, L.W., and Neathery, T.L., 2006, Role of water in the
formation of the Late Cretaceous Wetumpka impact structure, inner Gulf Coastal Plain
on Alabama, USA: Meteoritics and Planetary Science, v. 41, p. 1625–1631.
King, Jr., D.T., and Ormö, J., 2007, Marine impact craters on Earth: field investigations of the
Wetumpka impact crater, a well-preserved marine impact crater, and the K-T boundary in
the Alabama Gulf Coastal Plain: Wetumpka, Alabama, Wetumpka Field Forum 2007
Guidebook and Abstracts, 119 p.
King, Jr., D.T., and Petruny, L.W., 2009, Upper Cretaceous chalk at Wetumpka impact structure,
Alabama: post-impact sediment?: Lunar and Planetary Science [Lunar and Planetary
Science Conference abstracts], v. 40, abstract no. 2381, 2 p.
King, Jr., D.T., and Petruny, L.W., 2010, Wetumpka impact structure, Alabama, and its impact
ejecta: Gulf Coast Association of Geological Societies Transactions, v. 60, p. 369–377.
King, Jr., D.T., Ormö, J., Harris, R.S., Petruny, L.W., and Markin, J.K., 2010, New core-hole
drilling at Wetumpka impact structure, Alabama-preliminary results: Lunar and Planetary
Science [Lunar and Planetary Science Conference abstracts], v. 41, abstract no.1424, 2 p.
Kirschner, C.E., and Grantz, A., 1992, Impact origin of the Avak Structure, Arctic Alaska, and
Genesis of the Barrow gas fields: American Association of Petroleum Geologists
Bulletin, v. 76, p. 651–679.
Kring, D.A., 2007, Guidebook to the geology of Barringer Meteroite Crater, Arizona: Houston,
Lunar Planetary Institute, Contribution no. 1355, 150 p.
Leonard, R.A., and Weed, S.B., 1969, Mica weathering rates as related to mica type and
composition: Clay and Clay minerals, v. 18, p. 187–195.
Liu, K., 2007, Sequence stratigraphy and orbital cyclostratigraphy of the Mooreville Chalk
(Santonian-Campanian), northeastern Gulf of Mexico area, USA: Cretaceous Research,
v. 107, p. 399–435.
Long. H., Rudy S., Anneleen F., Manuel D., and Patric, J., 2009, 3D quantification of mineral
components and porosity distribution in Westphalian sandstone by microfocus X-ray
computed tomography: Sedimentary Geology, v. 220, p. 116–125.
Loutit, T., Hardenbol, J., Vail, R., and Baum, G., 1988, Condensed sections; the key to age
determination and correlation of continental margin sequences: Tulsa, Oklahoma, Society

179
of Economic Paleontologists and Mineralogists, SEPM Special Publication 42, p. 183–
213.
Mancini, E.A, and Soens, D.A., 1994, Paleoenvironments of the Tombigbee Sand Member of the
Eutaw Formation (Upper Cretaceous) of Eastern Mississippi and Western Alabama: Gulf
Coast Association of Geological Societies Transactions, v. 44, pp. 421–430.
Mancini, E.A., Puckett, T.M., and Berry, T.H., 1996, Integrated biostratigraphic and sequence
stratigraphic framework for Upper Cretaceous strata of the eastern Gulf Coastal Plain,
USA: Cretaceous Research, v. 17, p. 645–669.
Mancini, E.A., Obid, J., Badali, M., Liu, K., and Parcell, W.C., 2008, Sequence-stratigraphic
analysis of Jurassic and Cretaceous strata and petroleum exploration in the central and
eastern Gulf coastal plain, United States: American Association of Petroleum Geologists
Bulletin, v. 92, p. 1655–1686.
Marcher, M.V., and Stearns, R.G., 1962, Tuscaloosa Formation in Tennessee: Geological
Society of America Bulletin, v. 73, p. 1365–1386.
Marie G., Patrick, L., Gaston, D., Bernard, L., Suzanne, D., Jacques, L., Florian, M., and
Georges, S., 2008, Litho and biofacies analysis of postglacial marine mud using CT-
Scanning: Engineering Geology, v. 103, p. 106–111.
Markin, J.K., King, Jr., D.T., and Ormö, J., 2011, Wetumpka resurge chalk deposits-insight from
x-ray computed tomography: Lunar and Planetary Science [Lunar and Planetary Science
Conference abstracts], v. 42, abstract no. 2579, 2 p.
Matsumoto, D., Naruse, H., Fujino, S., Surphawajruksakul, A., Jarupongsakul, T., Sakakura, N.,
and Murayama, M., 2008, Truncated flame structures within a deposit of the Indian
Ocean Tsunami: Evidence of syn-sedimentary deformation: Sedimentology, v. 55, p.
1559–1570.
McKee, E.D., and Weir, G.W., 1953, Terminology for stratification and cross-stratification in
sedimentary rocks: Geological Society of America Bulletin, v. 64, p. 383.
Miall, A.D., 1999, Principles of Sedimentary Basin Analysis: New York, Springer, 628 p.
Melosh, H.J., 1989, Impact cratering: A geologic process: New York, Oxford University Press,
245 p.
Melosh, H.J., and Ivanov, B.A., 1999, Impact crater collapse: Annual Review of Earth-Planetary
Sciences, v. 27, p. 385–415.
Munsell Color Company, 2009, Geological Rock-Color Chart with genuine Munsell®
color
chips, Grand Rapids, MI.

180
Nelson, A.I., 2000, Geological mapping of Wetumpka impact crater area, Elmore County,
Alabama: unpublished Masters thesis, Auburn, Alabama, Auburn University, 200 p.
Nelson, R.A., Lenox, L.C., and Ward, Jr., B.J., 1987, Oriented core: its use, error, and
uncertainty: American Association of Petroleum Geologists Bulletin, v. 71, p. 357–376.
Ormö , J., Shuvalov, V., Lindström, M., 2002, Numerical modeling for target water depth
estimation of marine-target impact craters: Journal of Geophysical Research, v.107, p.
31–39.
Ormö, J, Sturkell, E., and Lindström, M., 2007, Sedimentological analysis of resurge deposits at
the Lockne and Tvaren craters: Clues to flow dynamics: Meteoritics and Planetary
Science, v. 42, p. 1929–1943.
Ormö, J., King, Jr., D. T., Harris, R.S., Petruny, L.W., and Markin, J.K., 2010, Sediment-laden
flow of Mooreville Chalk within the interior of Wetumpka marine target impact structure,
Alabama: evidence for a shallow water resurge: Lunar and Planetary Science [Lunar and
Planetary Science Conference abstracts], v. 41, abstract no. 1430, 2 p.
Osri, T., Edwards, C., and Anderson, A., 1994, X-ray computed tomography: a non-destructive
method for quantitative analysis of sediment cores: Journal of Sedimentary Research, v.
64, p. 690–693.
Parneix, J.C., Beaufort, D., Dudoignon, P, and Meunier, A., 1985, Biotite chloritization process
in hydrothermally altered granites: Chemical Geology, v. 51, p. 89–101.
Paulsen, T.S., Wilson, T.J., Moos, D., Jarrard, R.D., and Wilson, G.S., 2000, Orientation of
CRP-2A Core, Victoria Land Basin, Antarctica: Terra Antartica, v. 7, n. 3, p. 271–278.
Paulsen, T.S., Jarrard, R.D., and Wilson, T.J., 2002, A simple method of for orienting drill core
by correlating features in whole-core scans and oriented borehole-wall imagery: Journal
of Structural Geology, v. 24, p. 1233–1238.
Pemberton, G.S., MacEachern, J.A., and Saunders, T., 2004, Stratigraphic applications of
substrate-specific ichnofacies: Delineating discontinuities in the rock record, in McIlroy,
D., ed., The application of ichnology to paleoenvironmental and stratigraphic analysis:
London, Geological Society, Special Publications 228, p. 29–62.
Peterson, G.L., 1968, Flow structures in sandstone dikes: Sedimentary Geology, v. 2, p. 177–
190.
Pinto, J.A., and Warme, J.E., 2008, Alamo event, Nevada: Crater stratigraphy and impact breccia
realms: Boulder, Colorado, Geological Society of America Special Paper 437, p. 99–138.
Poag, C.W., Koeberl, C., and Reimold, W.U., 2004, The Chesapeake Bay Crater: geology and
geophysics of a Late Eocene submarine impact structure: Berlin, Springer-Verlag, 522 p.

181
Pollard, J.E., Goldring, R., and Buck, S.G., 1993, Ichnofacies containing Ophiomorpha:
Significance in shallow-water facies interpretation: Journal of the Geological Society of
London, v. 150, p. 149–164.
Puckett, M.T., 1991, Absolute paleobathymetry of Upper Cretaceous Chalks based on
ostracodes: Evidence from the Demopolis Chalk (Campanian and Maastrichtian) of the
northern Gulf Coastal Plain: Geology, v. 19, p. 449–452.
Raymond, D.E., Osborne, W.E., Copeland, C.W., and Neathery, T.L., 1988, Alabama
Stratigraphy: Geological Survey of Alabama Circular 140, 97 p.
Ricci, F., 1995, Sedimentographica: Photographic atlas of sedimentary structures: New York,
Columbia University Press, 255 p.
Robb, R.A., 1987. X-ray CT: An engineering synthesis of multiscientific principles: CRC
Critical Review Biomedical Engineering, v. 7, p. 697–718.
Robbins, E.A., Wolf, L.W., and King, Jr., D.T., 2011, Wetumpka impact structure (Alabama): a
gravity model: Lunar and Planetary Science [Lunar and Planetary Science Conference
abstracts], v. 42, abstract no. 2732, 2 p.
Russell, G.S., Odom, A.L, and Russell, C.W., 1987, Uranium-lead and rubidium-strontium
isotopic evidence for the age and origin of granitic rocks in the Northern Alabama
Piedmont, in Drummond, M.S, and Green, N.L., eds., Granites of Alabama: Tuscaloosa,
Geological Survey of Alabama, Special Publication, p. 239–249.
Ryan, P.C., and Reynolds, Jr., R.C., 1999, The chemical composition of serpentine/chlorite in the
Tuscaloosa Formation, United States Gulf Coast; EDX vs. XRD determinations,
implications for mineralogic reactions and the origin of anatase, Clays and Clay Minerals,
v. 45, n. 3, p. 339–352.
Salvador, A., 1987, Late Triassic-Jurassic Paleogeography and the Origin of the Gulf of Mexico:
American Association of Petroleum Geologists Bulletin, v. 71, p. 419–451.
Sassa, S, Miyamoto, J., and Sekiguchi, H., 2003, The dynamics of liquefied sediment flow
undergoing progressive solidification, in Locat, J., and Mienert, J., eds., Submarine mass
movements and their consequences: Dordrecht, Netherlands, Kluwer Academic
Publishers, p. 95–102.
Savrda, C.E., and King, Jr., D.T., 1993, Log-ground and Teredolites lagerstätte in a transgressive
sequence, Upper Cretaceous (Lower Campanian) Mooreville Chalk, central Alabama:
Ichnos, v. 3, p. 69–77.
Savrda, C.E., and Nanson, L.L., 2003, Ichnology of fair-weather and storm deposits in an Upper
Cretaceous estuary (Eutaw Formation, western Georgia, USA): Palaeogeogaphy,
Palaeoclimatology, Palaeoecology, v. 202, p. 67–83.

182
Savrda, C.E., Locklair, R.E., Hall, J.K., Sadler, M.T., Smith, M.W., and Warren, J.D.,1996,
Ichnofabrics, ichnocoenoses, and ichnofacies implications of an Upper Cretaceous tidal-
inlet sequence (Eutaw Formation, Central Alabama): Ichnos, v. 6, p. 53–73.
Savrda, C.E., Hooks-Blanton, A.D., Collier, J.W., Drake, R.A., Graves, R.L., Hall, A.G., Nelson,
A.I., Slone, J.C., Williams, D.D. and Wood, H.A., 2000, Taenidium and associated
ichnofossils in fluvial deposits, Cretaceous Tuscaloosa Formation, eastern Alabama,
Southeastern U.S.A: Ichnos, v. 7, p. 227–242.
Sayers, J.E., and Uddin, A., 2010, Provenance of the Cretaceous Tuscaloosa Formation in
Eastern Alabama and Western Georgia: Boulder, Colorado, Geological Society of
America Abstracts with Programs, v. 42, no. 1, p. 72.
Schreurs, G., Hanni, R., Panien, M. and Vock, P., 2003, Analysis of analogue models by helical
X-ray computed tomography, in Mees, F., Swennen, R., Van Geet, M., and Jacobs, P.,
eds., Applications of X-ray computed tomography in the geosciences: London,
Geological Society, Publications 215, p. 213–225.
Shoemaker, E.M., 1960, Penetration mechanics of High Velocity Meteorites, illustrated by
Meteor Crater, Arizona, in Report of the International Geolological Congress, XXI
Session, part XVIII, Copenhagen, p. 418–434.
Schultz, R.A., and Fossen, H., 2008, Terminology for structural discontinuities: American
Association of Petroleum Geologists, v. 92, p. 1002–1015.
Shuvalov, V., Ormö, J., and Lindstrom, M., 2005, Hydrocode simulation of the Lockne marine
target impact event: Impact tectonics, Berlin, Springer-Verlag, p. 405–422.
Smith, L.W., 1984, Depositional setting and stratigraphy of the Tuscaloosa Formation, central
Alabama to west-central Georgia: unpublished Masters thesis, Auburn, Alabama, Auburn
University, 125 p.
Staheli, A.C., 1976, Topographic expression of superimposed drainage on the Georgia Piedmont:
Geological Society of America Bulletin, v. 87, p. 450–452.
Stearns, R.G., 1957, Cretaceous, Paleocene, and lower Eocene Geologic History of the Northern
Mississippi Embayment, Geological Society of America Bulletin, v. 68, p. 1077–1100.
Sterling, J.H., 2006, Geology of the southernmost exposures of the Brevard Zone in the Red Hill
Quandrangle, Alabama: unpublished Masters thesis, Auburn, Alabama, Auburn University,
118 p.
Stewart, S.A., 2003, How will we recognize buried impact craters in terrestrial sedimentary
basins?: Geology, v. 31, p. 929–932.

183
Stewart, S.A., 2011, Estimates of yet-to-find impact crater population on Earth: Journal of the
Geological Society, v. 168, p. 1–14.
Strachan, L.J., 2008, Flow transformations in slumps: a case study from the Waitermata Basin,
New Zealand: v. 55, p. 1311–1332.
Sturkell, E.F.F., and Ormö, J., 1997, Impact-related clastic injections in the marine Ordovician
Lockne impact structure, Central Sweden: Sedimentology, v. 44, p. 451–477.
Szabo, M.W., Osborne, W.E. Copeland, C.W., Jr., and Neathery, T.L., compilers, 1988,
Geologic map of Alabama, Geological Survey of Alabama Special Map 220, scale
1:250000, 5 sheets.
Talling, P.J., Wynn, R.B., Schmiddt, D.N., Rixon, R., Sumner, E., and Lawrence, A., 2010, How
did thin submarine debris flows carry boulder-sized intraclasts for remarkable distances
across low gradient to the far reaches of the Mississippi Fan?: Journal of Sedimentology
Research, v. 80, p. 829–851.
Terry, R.D., and Chilingar, G.V., 1955, Summary of “Concerning some additional aids in
studying sedimentary formations”: Journal of Sedimentary Petrology, v. 25, p. 229–234.
Tripsanas, E.K., Bryant, W.R., and Prior, D.B., 2003, Structural characteristics of cohesive
gravity-flow deposits, and a sedimentological approach on their flow mechanisms, in
Locat, J., and Mienert, J., eds., Submarine mass movements and their consequences:
Dordrecht, Netherlands, Kluwer Academic Publishers, p. 122–129.
Twiss, R.J., and Moores, E.M., 2007, Structural Geology: New York, W.H. Freeman and
Company, 736 p.
Van Geet, M., Lagrou, D., and Swennen, R., 2003. Porosity measurements of sedimentary rocks
by means of microfocus X-ray computed tomography (µCT), in Mees, F., Swennen, R.,
Van Geet, M., and Jacobs, P., eds., Applications of X-ray computed tomography in the
geosciences: London, Geological Society, Special Publications 215, p. 199–220.
Vendeville, B.C., and Gaullier, V., 2003, Role of pore-fluid pressure and slope angle in
triggering submarine mass movements: natural examples and pilot experimental models,
in Locat, J. and Mienert, J., eds., Submarine mass movements and their consequences:
Dordrecht, Netherlands, Kluwer Academic Publishers, p. 137–144.
Warren, J.D., and Savrda, C.E., 1998, Carbonate cycles in Upper Cretaceous (Campanian)
Demopolis Chalk, west-central Alabama: Gulf Coast Association of Geological Societies,
Transactions, v. 48, pp 487–497.
Wartho, J.A., Van Soest, M.C., King, Jr., D.T., Petruny, L.W., and Hodges, K.V., 2011, An (U-
Th)/He geochronological age for the shallow-marine Wetumpka Impact Structure,

184
Alabama, USA: Lunar and Planetary Science [Lunar and Planetary Science Conference
abstracts], v. 42, abstract no. 1524, 2 p.
Wentworth, C.K., 1922, A scale of grade and class terms of clastic sediments: Journal of
Geology, v. 30, p. 377–392.
Wolf, L.W., Plescia, J., and Steltenpohl, M.G., 1997, Geophysical investigation of a “suspect”
impact crater in Wetumpka, Alabama, in Neathery, T.L., King, Jr., D.T., and Wolf, L.W.,
eds., The Wetumpka impact structure and related features: Alabama Geological Society
Guidebook 34c, p. 57–69.
Yazdi, M., and Beaulieu, L., 2008, Artifacts in spiral X-ray CT Scanners: Problems and
solutions: International Journal of Biological and Life Sciences, v. 4, p. 135–138.

185
APPENDIX
Point Count Data from thin-section petrography of drill core 09-04 samples.
N is total point counts. Mx is matrix, Q is Quartz, F is feldspar,
L is lithic fragments, and Por is porosity.
Well_Depth
N Q% F% L% Por % Mx% Porosity
0904_339.7 340.00 81.63 18.37 0.00 7.94 27.06 27.00
0904_381.6 228.00 85.62 14.38 0.00 6.58 27.63 15.00
0904_381.6 263.00 91.95 7.47 0.00 0.38 28.90 1.00
0904_470 238.00 89.47 8.55 0.01 11.76 20.59 28.00
0904_481 220.00 71.26 28.74 0.00 13.64 18.64 30.00
0904_511.1 231.00 94.44 5.56 0.00 19.05 24.24 44.00
0904_577.2 261.00 93.63 6.37 0.00 16.48 0.00 43.00
0904_611.3 252.00 91.82 8.18 0.00 4.76 27.78 12.00
0904_619.8 234.00 92.73 7.27 0.00 8.55 11.54 20.00
0904_672.9 228.00 88.81 11.19 0.00 6.14 25.88 14.00
0904_674 323.00 96.17 3.83 0.00 4.02 33.13 13.00
0904_699 224.00 91.90 8.00 0.00 12.50 19.20 28.00
mean 253.50 89.12 10.66 0.00 9.32 22.05 22.92
Well_Depth
N Mono Q Poly Q Chloritized-mica Mx Clay Mx Cherty Cement/Mx Muscovite Biotite
0904_339.7 340.00 163.00 77.00 92.00 0.00 0.00 69.00 21.00
0904_381.6 228.00 102.00 23.00 1.00 62.00 0.00 3.00
0904_381.6 263.00 126.00 34.00 0.00 76.00 0.00 0.00
0904_470 238.00 103.00 33.00 0.00 49.00 0.00 4.00
0904_481 220.00 81.00 38.00 41.00 0.00 0.00 6.00 1.00
0904_511.1 231.00 106.00 13.00 45.00 11.00 0.00 58.00
0904_577.2 261.00 138.00 9.00 0.00 0.00 0.00 2.00 1.00
0904_611.3 252.00 119.00 27.00 2.00 68.00 0.00 9.00 1.00
0904_619.8 234.00 65.00 37.00 27.00 0.00 0.00 18.00 1.00
0904_672.9 228.00 71.00 56.00 25.00 34.00 6.00 4.00 2.00
0904_674 323.00 127.00 49.00 0.00 107.00 3.00 1.00 0.00
0904_699 224.00 100.00 25.00 35.00 8.00 0.00 5.00 9.00
mean 253.50 108.42 35.08 22.33 34.58 0.75 14.92 4.50

186
Well_Depth
N Plagioclase Lithic Frag K-spar Chlorite Calcite Cement Kyanite Opaque Glass Garnet
0904_339.7 340.00 17.00 0.00 37.00 19.00
0904_381.6 228.00 21.00 1.00
0904_381.6 263.00 1.00 13.00 1.00
0904_470 238.00 4.00 3.00 9.00 3.00 2.00
0904_481 220.00 8.00 0.00 40.00 0.00 1.00
0904_511.1 231.00 1.00 6.00 3.00 1.00
0904_577.2 261.00 10.00 55.00 1.00 1.00
0904_611.3 252.00 13.00 1.00
0904_619.8 234.00 8.00 1.00
0904_672.9 228.00 16.00
0904_674 323.00 2.00 0.00 5.00 0.00 3.00
0904_699 224.00 3.00 0.00 8.00 0.00 0.00
mean 253.50 5.83 0.67 15.50 4.00 55.00 1.00 2.00 2.00 1.17