lithium ion battery recycling technology...
TRANSCRIPT
Lithium Ion Battery Recycling Technology 2015
Current State and Future Prospects
Duncan Kushnir, [email protected] Systems AnalysisChalmers University of TechnologyDec, 2015
ESA REPORT # 2015:18
Kushnir, D. (2015) Lithium Ion Battery Recycling Technology 2015: Current State and Future Prospects. Environmental Systems Analysis. Chalmers University, Göteborg, Sweden. ESA REPORT # 2015:18
This document may be cited as follows:

Document Purpose and Use
This document assembles key results from work during the Realize project, and references to state-of-the-art literature and data on lithium battery recycling processes. The document itself is not peer reviewed, but most of the primary sources are.
The intent is to function as a quick reference suitable for use by researchers and engineers. An overview of many topics relevant to lithium battery recycling is presented, along with links to primary sources.
- Duncan Kushnir, curator
Realize is an interdisciplinary project aimed at finding viable paths to resource-efficient recycling of vehicles.
Realize was funded by MISTRA, and ran from 2012-2015 with a consortium of industrial partners

LIST OF ACRONYMS
ADP Abiotic Depletion Potential
AP Acidification Potential
BMS Battery Management System
DMC Dimethyl Carbonate
EBRA the European Battery Recycling Association
EC Ethylene Carbonate
EEC European Economic Community
EES Electric Energy Storage
ELIBAMA European Li-Ion Battery Advanced Manufacturing
EOL End of Life
EP Eutrophication Potential
ESS Energy Storage System
EU European Union
EV Electric Vehicle
GHG Green House Gases
GREET GReenhouse Emissions and Energy in Transport (Argonne Lab Model)
GWP Global Warming Potential
HTP Human Toxicity Potential
LCA Life Cycle Analysis
LIB Lithium ion Batteries
NMP N-Methyl-2-pyrrolidone (common solvent)
PHEV Plug-in Hybrid Electric Vehicle
POCP Photochemical Ozone Creation Potential
PVDF Polyvinylidene fluoride
RECHARGE the International Association for Advanced Rechargeable Batteries
UN United Nations
WEEE Waste Electrical and Electronic Equipment

Introduction
Recycling process descriptions and evaluations
Technology status and prospects
Conclusions
References and Appendixes
Contents

Introduction
i. Brief introduction to lithium batteries
ii. Contents of a lithium battery
iii. Lithium chemistries and scarce materials
iv. Battery trends and projections
v. Legislation regarding lithium batteries
This section contains a concise introduction to lithium battery technology with a focus on the material contents of various components and battery chemistries. Cells are the focus because other components in a battery pack have well established recycling chains.
Estimates of future battery production are included, along with links to relevant legislation regarding recycling them.
Processes Status/Prospects Conclusions Ref/AppendicesIntroduction

Introductioni. Brief introduction to lithium batteries
On recycling lithium ion batteries
Lithium batteries are at present the dominant potential solution for ending the dependence of transport systems on fossil fuels. Vehicles containing lithium batteries account for only a tiny fraction of vehicles put on market today, but their share seems set to grow rapidly. In time, lithium batteries may represent fairly large material flows in the ELV system, and, as they may contain a number of strategic metals, the question of how to recycle them and ensure circular flows of materials deserves some foresight. Alongside this reason, batteries also contain a number of potentially hazardous materials, making recycling an imperative for other reasons as well.
There are some ‘off the shelf’ solutions for recycling at present, but the actors involved charge gate fees of approximately 4€/kg of battery, and the processes used can not reclaim all of the metals in batteries. What are the prospects of reclaiming these metals? Of achieving cost effective recycling?
Processes Status/Prospects Conclusions Ref/AppendicesIntroduction
Introduction
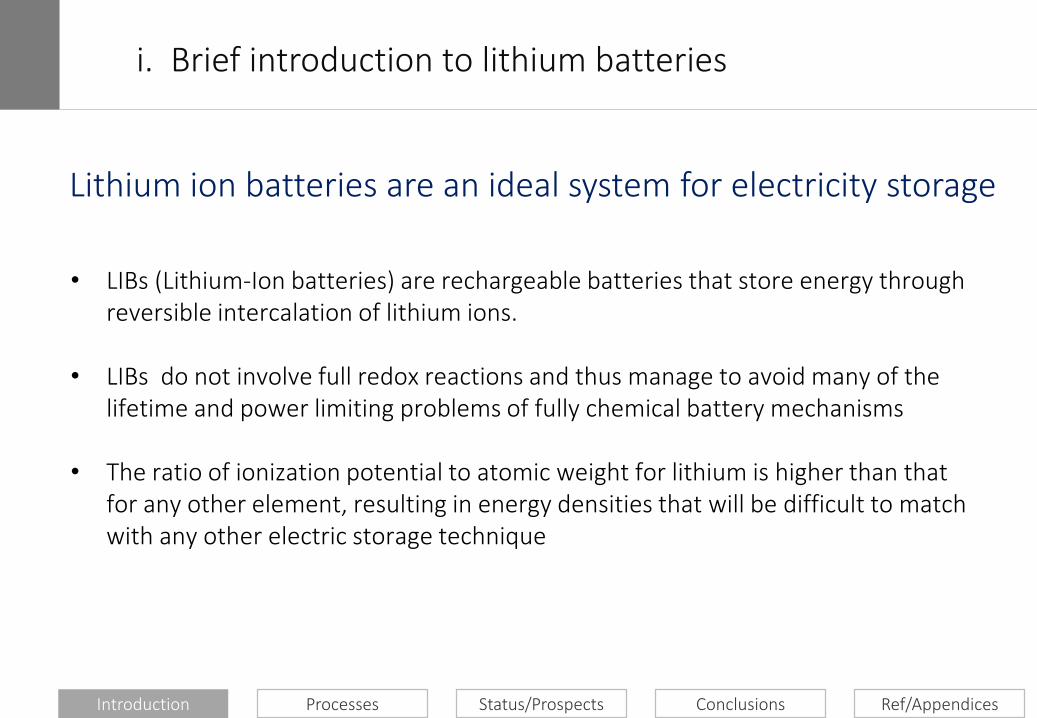
• LIBs (Lithium-Ion batteries) are rechargeable batteries that store energy throughreversible intercalation of lithium ions.
• LIBs do not involve full redox reactions and thus manage to avoid many of the lifetime and power limiting problems of fully chemical battery mechanisms
• The ratio of ionization potential to atomic weight for lithium is higher than that for any other element, resulting in energy densities that will be difficult to match with any other electric storage technique
i. Brief introduction to lithium batteries
Lithium ion batteries are an ideal system for electricity storage
Processes Status/Prospects Conclusions Ref/AppendicesIntroduction

Cathode/Anode: ’Active materials’ intercalating Li+ ions(various)
Electrolyte: solid or liquid allowing movement of Li+ ions(DMC/EMC or solid polymer)
Separator: restricts movement of other species(Polymer e.g. Nafion)
Current collectors: conduct electrons to and from cathode, anode(Cu, Al)
Casing: holds other items together(Steel, Al, Plastic)
The main elements of a lithium cell are:
Most cells share common components in terms of the electrolyte, separator, foils and casing. What ultimately differentiates cell technologies is the material chosen for the ‘active materials’, e.g. the cathode and anode.
Processes Status/Prospects Conclusions Ref/Appendices
ii. Contents of lithium batteries
Introduction
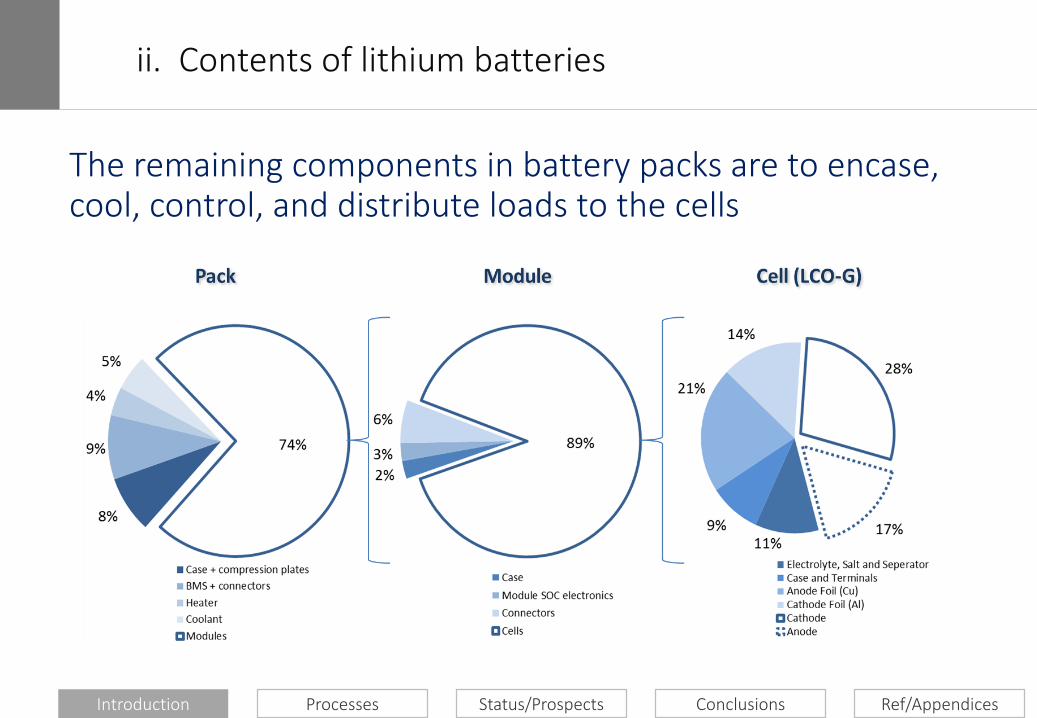
The remaining components in battery packs are to encase, cool, control, and distribute loads to the cells
Processes Status/Prospects Conclusions Ref/Appendices
ii. Contents of lithium batteries
Introduction

Cathode materials are typically chosen to match the application
Material Abbrev. Voltage
vs Li/Li+
Specific Capacity (mAh/g)
Advantages Disadvantages
LiCoO2 LCO 3.9 140 Performance, well understood
Safety, uses nickel and cobalt
LiNi0.33Mn0.33Co0.33O2NMC(333) 3.8 160-170 Better safety and
performance than LCO Cost, nickel and cobalt
LiFePO4LFP 3.4 170 Excellent power,
lifetime and safety, abundant materials
Low energy density
LiMn2O4LMO 4.1 100-120 Cheap, abundant, high
powerLifetime, low capacity means low energy density
- future possibilities -
LiNi0.8Co0.15Al0.05O2NCA 3.8 180-200 High capacity and
voltage, high powerSafety, cost, uses nickel and cobalt
Processes Status/Prospects Conclusions Ref/Appendices
ii. Contents of lithium batteries
Introduction

A carbon is nearly always chosen for the anode. Materials such as LTO offer lifetime and power at the expense of energy density and cost.
Material Abbrev. Voltage
vs Li/Li+
Specific Capacity (mAh/g)
Advantages Disadvantages
Graphite G 0.1 370 Decent lifetime, well understood, abundant
Inefficiency due to SEI formation
Li4Ti5O12 LTO 1.5 170 Excellent power and cycle life
Lower voltage means less energy, cost
- future possibilities -
LiFeSiO4 LFS 0.3 up to 2000+ Vastly better energy density than traditional anodes
Very short lifetime at present
Processes Status/Prospects Conclusions Ref/Appendices
ii. Contents of lithium batteries
Introduction

Material value in several cell chemistries
Calculated by taking the market price of the pure material (Dec 2014) multiplied by the mass percentage in the cell.
The majority of value in cells comes from Cobalt or Nickel. Copper represents about half of the remainder.
(Source: can be reconstructed from appendix B)
Processes Status/Prospects Conclusions Ref/Appendices
ii. Contents of lithium batteries
Introduction

Table Sources: *USGS 2013 Resource Handbooks: stock and rate calculated with data from this document
Material Availability
(Mt, resource
base)*
Production
(2012, kt)*
Supply
Constrained Stock
(kWh)
Production Constrained
Rate (kWh/y)
Cobalt 13 110 13 x 109 (LCO)
28 x 109 (NMC)
110 x 106 (LCO)
260 x 106 (NMC)
Nickel 150 2100 375 x 109 5 250 x 106
Lithium 30 26 60 x 109 152 x 106
Manganese 5200 16 000 5 777 x 109 (LMO)
14 900 x 109 (NMC)
13 900 x 106 (LMO)
42 000 x 106 (NMC)
Cobalt and Lithium are the most constrained materials. Nickel is important to recycle for environmental reasons.
Calculated by taking the USGS estimates for resource base and annual production, and comparing it to the material contents in the cells for NMC batteries which are estimated to be the most produced variant in 2025.
Can be reconstructed from appendix B. Table links to USGS.
These estimates should not be taken as immutable; as demand and price rise, more production will occur and more resources will become available.
Processes Status/Prospects Conclusions Ref/Appendices
iii. Lithium batteries and scarce materials
Introduction
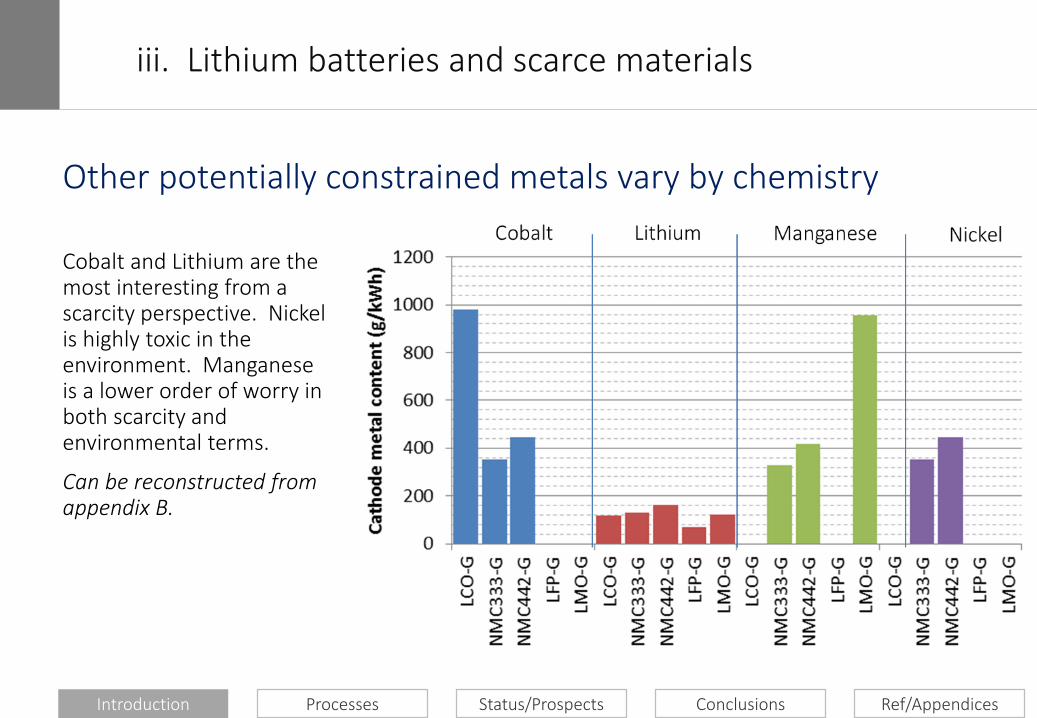
Other potentially constrained metals vary by chemistry
Cobalt and Lithium are the most interesting from a scarcity perspective. Nickel is highly toxic in the environment. Manganese is a lower order of worry in both scarcity and environmental terms.
Can be reconstructed from appendix B.
Processes Status/Prospects Conclusions Ref/Appendices
iii. Lithium batteries and scarce materials
Introduction
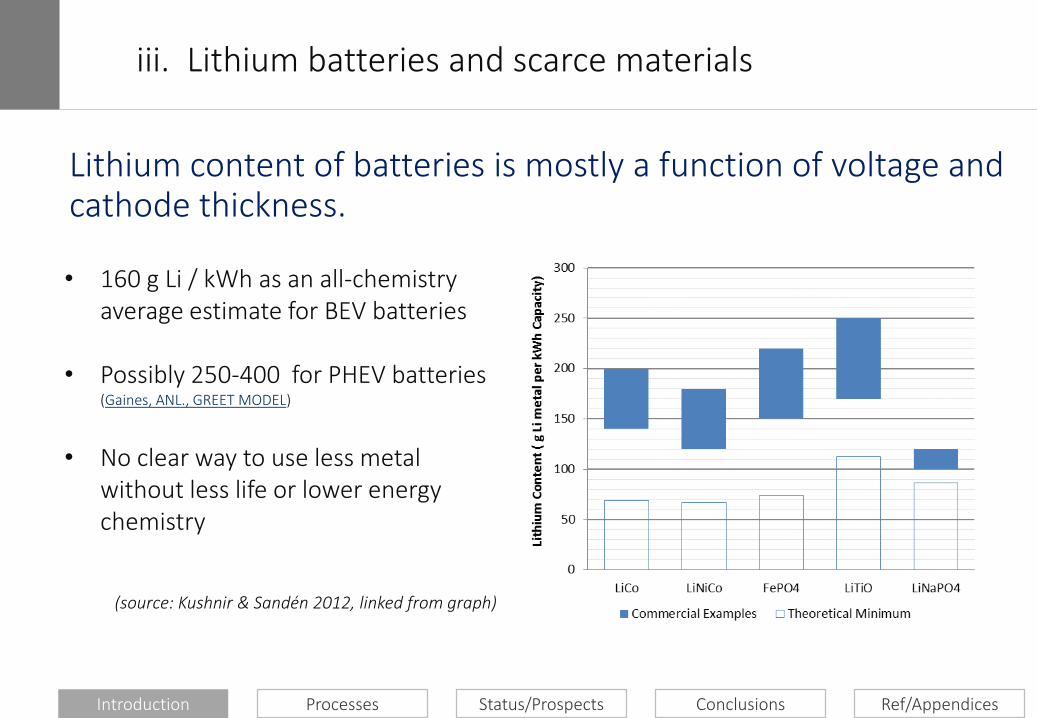
• 160 g Li / kWh as an all-chemistry average estimate for BEV batteries
• Possibly 250-400 for PHEV batteries (Gaines, ANL., GREET MODEL)
• No clear way to use less metal without less life or lower energy chemistry
(source: Kushnir & Sandén 2012, linked from graph)
Lithium content of batteries is mostly a function of voltage and cathode thickness.
Processes Status/Prospects Conclusions Ref/Appendices
iii. Lithium batteries and scarce materials
Introduction

Anticipated sales by chemistry, in tons
Nickel and Cobalt containing chemistries seem likely to remain dominant for at least another decade.
This has more to do with mobile devices than vehicles. LFP batteries are used in EVs and power tools and are anticipated to have the fastest growth rate.
(graph contains link to latest source)
Virtually all projections indicate similar results: fast growth and a mix of technologies
Very low material value in batteries
Processes Status/Prospects Conclusions Ref/Appendices
iv. Trends and projections
Introduction

The EU has much more stringent laws than the US regarding battery recycling. However batteries can not be landfilled in either region, and advanced recycling companies and voluntary recycling networks exist in North America .
In addition, all OECD nations have regulations considering the transport of batteries by road, rail, or sea transport.
EU Battery Directive (2006/66) (Link)- 45% batteries recovered by 2016- 50% of mass recovered by recycling- Energy recovery does not count
North America- Patchwork of state level laws in US- Mandatory recycling in BC,QUE,SAS in
Canada
Common- Hazardous waste cannot be landfilled
Processes Status/Prospects Conclusions Ref/Appendices
v. Legislation regarding lithium battery recycling
Introduction

i. Pyrolysis
ii. Hydrothermal recycling
iii. Direct physical recycling
iv. Process comparisons
This section describes the physical process and theoretical potential of each recycling process for cells. Recycling for other components of a battery pack, such as electronics is excluded. Such components have well defined recycling pathways (e.g. WEEE), and are easy to separate.
Recycling Processes
Introduction Status/Prospects Conclusions Ref/AppendicesProcesses

The process used by Umicore is a good illustration of pyrolysis approaches in general, both because Umicore is one of the largest battery recyclers at present, and because they have been transparent releasing process data (Tytgat 2011, Umicore 2013).
Pyrolysis means melting and reducing the battery materials to obtain metals
Introduction Status/Prospects Conclusions Ref/Appendices
i. Pyrolysis
Processes

Batteries are shredded and smelted in a furnace where limestone is added as a slag-forming agent. The furnace has three heating zones. First, by slowly heating the battery waste, the risk of explosion reduces and the electrolyte evaporates. In the next zone with a higher temperature, all the plastic and solvents in the battery are burned.
Source: Adapted from Umicore/Tytgat (2013).
Original linked from diagram.
The energy released greatly lowers the input energy needed to smelt the battery. Umicore considers the plastic mass recycled as a reducing agent in the process (Dunn and Gaines 2012). However, the European Union (EU) battery directive explicitly states that energy recovery is not considered recycling (EU 2006). If the EU rules that the plastic is indeed a reducing agent rather than merely burned for energy, it will place the pyrolysis method closer to achieving the 50% mass recovery target for batteries (European Union, 2006).
Introduction Status/Prospects Conclusions Ref/Appendices
i. Pyrolysis
Processes

Advantages
Introduction Status/Prospects Conclusions Ref/Appendices
Disadvantages
Pyrolysis is highly effective at recovering Nickel, Cobalt, and Copper in a concentrated and relatively clean alloy, with high efficiency. Other toxic solvents are burned, providing much of the process energy and removing their toxicity.
Pyrolysis processes can take more than one battery chemistry at the same time, leading to economies of scale, and simplified logistics.
Pyrolysis already exists at industrial scale, and is a mature metallurgical technique. It is an ‘off-the-shelf’, proven option.
The inherent chemistry of the smelter traps other elements in the slag. Lithium and Manganese are the most relevant of these. The slag itself is a fairly complex material and recovering lithium from the slag is only a theoretical possibility, and even then, would be expensive and inefficient.
Many other chemicals in the battery are lost. From a lifecycle perspective, this is sub-optimal, and for batteries without Ni or Co, the economics are not nearly as good, leaving an open question as to suitability for future batteries. Because energy recovery does not count, the recovered mass is right on the boundary of the EU Battery Directive target (50%).
i. Pyrolysis
Processes
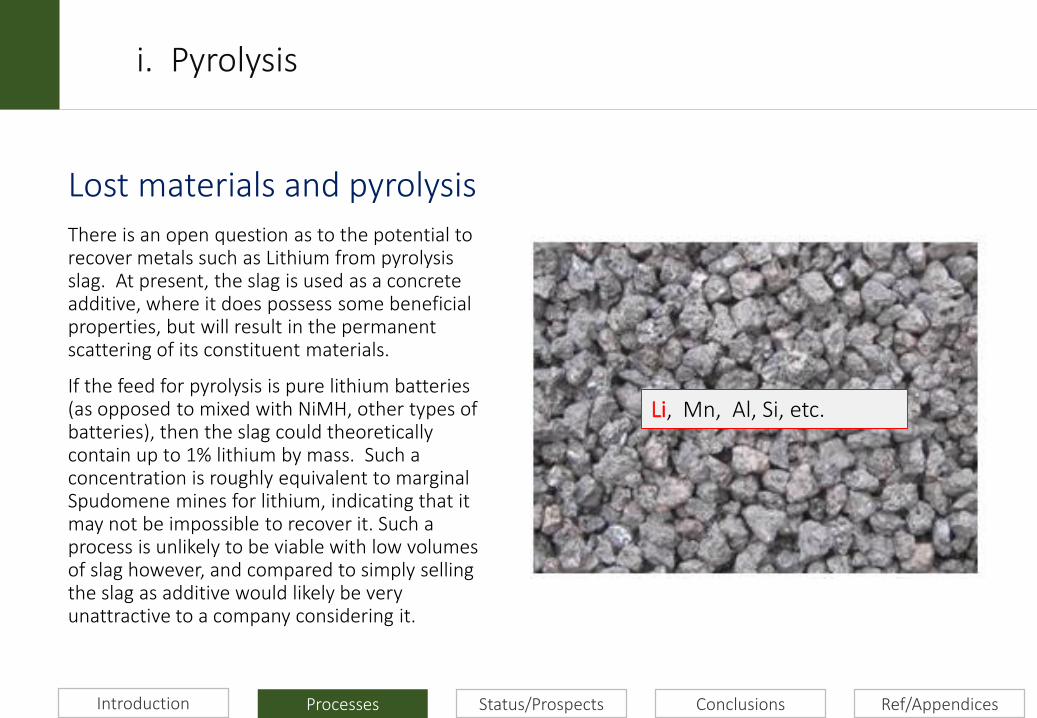
Lost materials and pyrolysis
Introduction Status/Prospects Conclusions Ref/Appendices
There is an open question as to the potential to recover metals such as Lithium from pyrolysis slag. At present, the slag is used as a concrete additive, where it does possess some beneficial properties, but will result in the permanent scattering of its constituent materials.
If the feed for pyrolysis is pure lithium batteries (as opposed to mixed with NiMH, other types of batteries), then the slag could theoretically contain up to 1% lithium by mass. Such a concentration is roughly equivalent to marginal Spudomene mines for lithium, indicating that it may not be impossible to recover it. Such a process is unlikely to be viable with low volumes of slag however, and compared to simply selling the slag as additive would likely be very unattractive to a company considering it.
i. Pyrolysis
Processes
Li, Mn, Al, Si, etc.
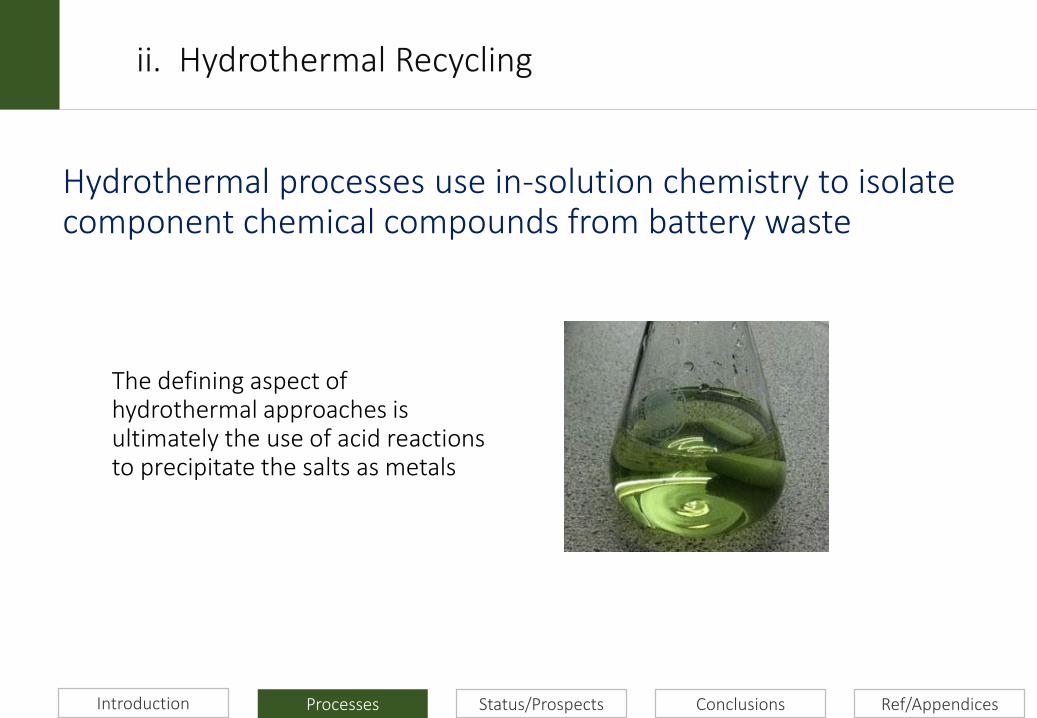
The defining aspect of hydrothermal approaches is ultimately the use of acid reactions to precipitate the salts as metals
Hydrothermal processes use in-solution chemistry to isolate component chemical compounds from battery waste
Introduction Status/Prospects Conclusions Ref/Appendices
ii. Hydrothermal Recycling
Processes

For hydrothermal processes, batteries are typically mechanically separated and the cathode materials are crushed and added to some form of solvent, such as NMP, which dissolves the binder from the cathode, and leaves the aluminium foil to be recovered with the metal oxide suspended in solution.
The NMP/water liquid is then filtered and the NMP can be recovered and reused at approximately 80% efficiency if the process is done at large enough scale to afford a recovery unit.
After isolating and drying the cathode powder residue, the metals in it can be leached out with an acid, often a strong one such as Nitric acid, but this can also be done with more ‘eco-friendly’ acids such as citric acid (Li, Dunn et al 2013). The metal can then be precipitated as a pure salt.
Introduction Status/Prospects Conclusions Ref/Appendices
Source: Adapted from Li, Dunn et al (2013)
Original linked from diagram.
ii. Hydrothermal Recycling
Processes
Introduction Status/Prospects Conclusions Ref/Appendices
Advantages Disadvantages
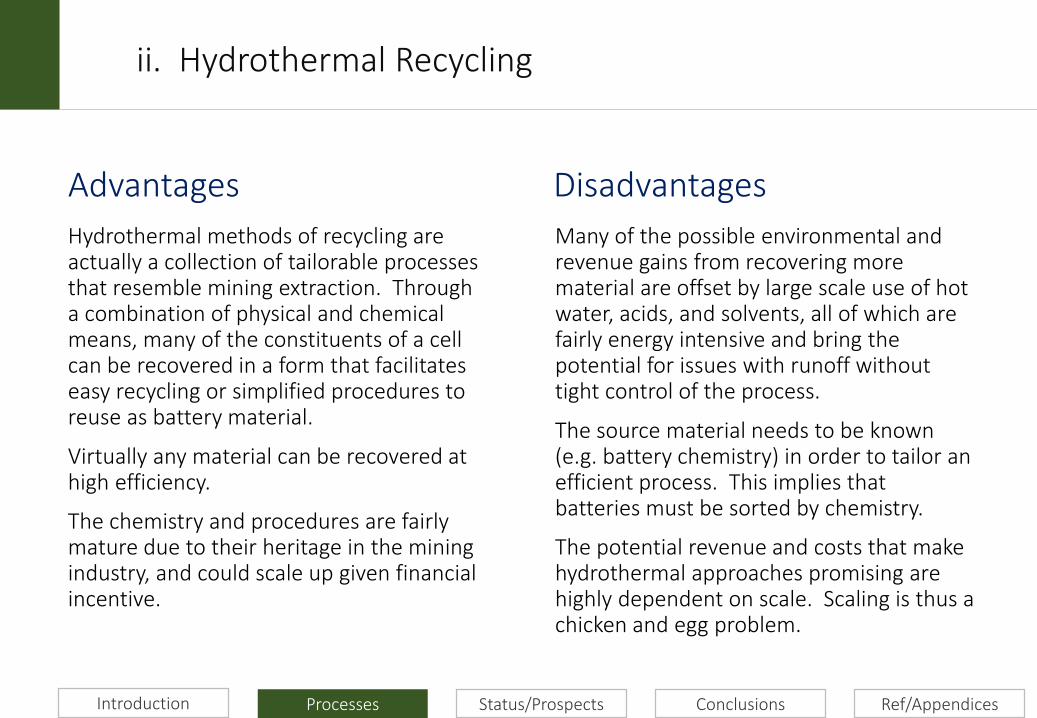
Hydrothermal methods of recycling are actually a collection of tailorable processes that resemble mining extraction. Through a combination of physical and chemical means, many of the constituents of a cell can be recovered in a form that facilitates easy recycling or simplified procedures to reuse as battery material.
Virtually any material can be recovered at high efficiency.
The chemistry and procedures are fairly mature due to their heritage in the mining industry, and could scale up given financial incentive.
Many of the possible environmental and revenue gains from recovering more material are offset by large scale use of hot water, acids, and solvents, all of which are fairly energy intensive and bring the potential for issues with runoff without tight control of the process.
The source material needs to be known (e.g. battery chemistry) in order to tailor an efficient process. This implies that batteries must be sorted by chemistry.
The potential revenue and costs that make hydrothermal approaches promising are highly dependent on scale. Scaling is thus a chicken and egg problem.
ii. Hydrothermal Recycling
Processes

iii. Direct Physical Recycling
Direct recycling of battery materials means removing and refurbishing them, allowing reuse without changing their chemical form. Only demonstrated recently, has the potential to be environmentally and economically superior.
Introduction Status/Prospects Conclusions Ref/Appendices
iii. Direct Physical Recycling
Processes

In the envisioned direct physical recycling process, the cells are separated from each other, breached (punctured), passivated and have the material separated. The passivation is required to make chemistries such as LCO-G safe from fire risk, and can be carried out through methods such as a controlled injection of oxidizer in solution.
Separation of the cathode material can occur physically or through transport with a solvent such as supercritical CO2.
The recovered cathode material can then be re-baked or re-sintered with a lithium compound to restore the original properties. 100% recovery of original performance has been demonstrated as of 2015 (Sloop, 2015 : Link).
Source: US PATENT 8,846,225 (2015).Original linked from diagram.
Introduction Status/Prospects Conclusions Ref/Appendices
iii. Direct Physical Recycling
Processes

Introduction Status/Prospects Conclusions Ref/Appendices
Advantages Disadvantages
Direct physical recycling potentially recovers battery materials in a reusable form: this means higher revenues and lower environmental impacts.
The worst case scenario is more or less equivalent to hydrothermal recycling.
The process is not as dependent on scale as pyrolysis or hydrothermal approaches, which could have radical implications for end of life logistics; recycling may be possible in large cities, rather than having a few large sites for the whole EU.
Direct physical recycling has only recently been demonstrated at a workable scale and quality.
The process depends on knowing the battery composition, meaning that battery chemistry must be known and cells sorted appropriately.
The ‘manual’ approach to breaching the cell and extracting its contents may be difficult to scale.
The process itself has no theoretical downsides, providing that the previous points can be addressed.
iii. Direct Physical Recycling
Processes

There are some steps that recycling processes have in common
Discharging – modules and battery packs can carry dangerous voltages, and the potential for adverse chemical reactions is higher with charged batteries
Passivation – not needed for pyrolysis, passivation is removing the chemical activity of the battery contents. Can be done in many ways, e.g. cryogenic freezing or controlled oxidation
Disassembly – once passivated and opened, the contents can be removed through disassembling the cell, or through shredding it
Introduction Status/Prospects Conclusions Ref/Appendices
iv. Process Comparisons
Processes

In theory, skipping more life cycle stages should result in superior environmental performance
Cathode Material
Production
Metal Salt Production
Primary Metal Production
Battery Assembly
Direct Recycling
Hydrothermal
Pyrolysis
Introduction Status/Prospects Conclusions Ref/Appendices
iv. Process Comparisons
Processes

All recycling methods will result in considerable environmental improvement of battery lifecycles
The results for hydrothermal recycling indicate a superior recovery of materials, tempered by the use of large quantities of hot water and solvents and acids that are energy intensive to produce.
Direct recycling is anticipated to be a fairly major improvement over existing methods.
Source: Realize modelling, previous industrial project. Can be compared with the GREET model
Introduction Status/Prospects Conclusions Ref/Appendices
iv. Process Comparisons
Processes

Ni, Co fate Li fate Other notes
Recoverable from molten alloy, 90%+
Lost in slagMax recovery approx. 50-60%(expensive)
Cu in alloy,All else lost to slag or burned for energy
Recoverable as salts, 95%+
Can be precipitated,90%+ recovery
Most things recoverable to 80%+
Recoverable as battery materials
Partially reused, partially recovered
Other materials recoverable as fractions, similar to hydro
‘Pyro-’
‘Hydro-’
‘Direct ’
Comparison of material fates for the most constrained metals
Introduction Status/Prospects Conclusions Ref/Appendices
iv. Process Comparisons
Processes

Technology status and prospects
i. Current actors and facilities
ii. Technological status and assessment of prospects
This section describes the current development status of recycling technology, including actors involved in the system, and an analysis of the economic prospects of recycling lithium ion batteries.
Introduction Processes Conclusions Ref/AppendicesStatus/Prospects

Company Location Recycling process Materials recovered
Accurec Germany Pyrolysis and hydrometallurgy.Aluminium, copper, iron scrap, iron/magnesium, nickel/cobalt, future: LiCO3.
Recupyl FranceMechanical separation, hydrometallurgical leaching and refining.
Aluminium, cobalt, stainless steel, lithium products.
SNAM France Crushing, pyrolysis, distillation, pyro-metallurgy. Ca, ferro nickel alloys, ferro cobalt alloys
Umicore Belgium (Sweden)Pyrometallurgical smelting followed by hydrometallurgical refining.
Cobalt, nickel
Batrec Switzerland Pyrolysis, pyrometallurgy. Ferromanganese, Zn, mercury.
G & P Batteries UK Pyrometallurgical or hydrometallurgical.
Pilagest Spain Mechanical separation, chemical treatment.Plastic, paper, ferro compounds, ferric components, metals, zinc sulphate, manganese salts/dioxide/graphite.
Eurodieuze France Hydrometallurgy Nickel, cadmium, steel
GRS Batterien Germany Pyrometallurgy Cobalt, nickel, copper
Companies with some capacity to recycle LIBs in Europe, 2015
Introduction Processes Conclusions Ref/Appendices
i. Current Actors and Facilities
Status/Prospects

Pyro approaches exist at industrial scale – enough capacity for 2020 already in EU.
Hydro approaches at pilot scale, some companies developing in EU and industrially in N.A. (e.g. Toxco)
Direct approach proven at proof of concept, developed by two companies in N.A. (OnTo, Retreiv)
Source: previous table, company websites
Location of facilities in EU
Introduction Processes Conclusions Ref/Appendices
i. Current Actors and Facilities
Status/Prospects
Introduction Processes Conclusions Ref/Appendices
Technology status, end of 2015
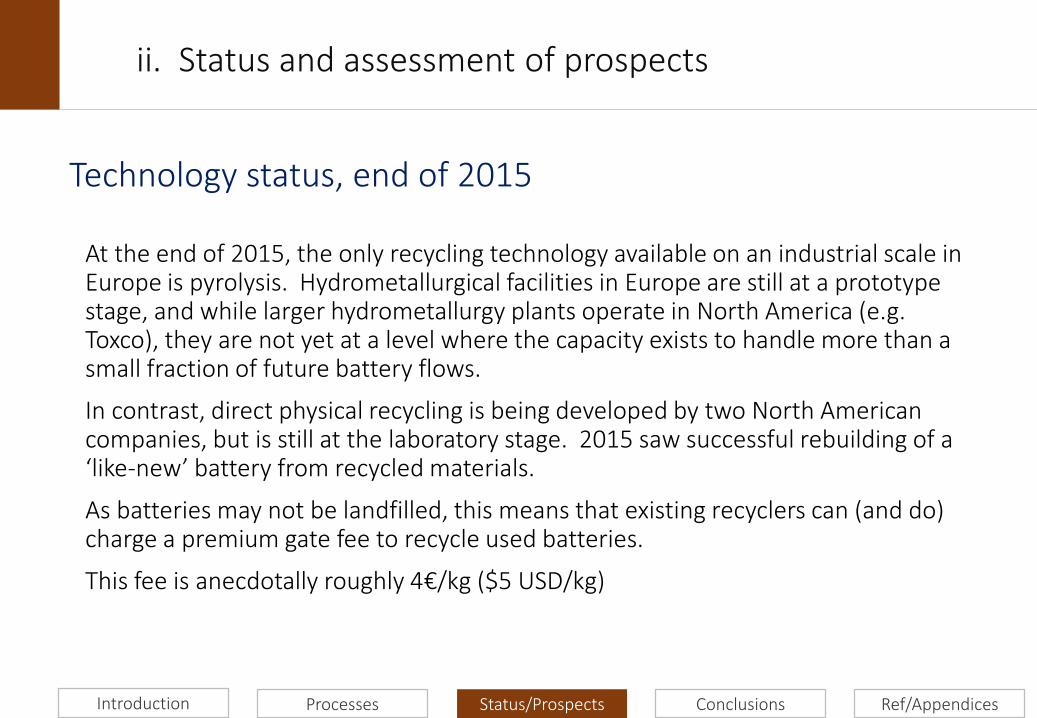
At the end of 2015, the only recycling technology available on an industrial scale in Europe is pyrolysis. Hydrometallurgical facilities in Europe are still at a prototype stage, and while larger hydrometallurgy plants operate in North America (e.g. Toxco), they are not yet at a level where the capacity exists to handle more than a small fraction of future battery flows.
In contrast, direct physical recycling is being developed by two North American companies, but is still at the laboratory stage. 2015 saw successful rebuilding of a ‘like-new’ battery from recycled materials.
As batteries may not be landfilled, this means that existing recyclers can (and do) charge a premium gate fee to recycle used batteries.
This fee is anecdotally roughly 4€/kg ($5 USD/kg)
ii. Status and assessment of prospects
Status/Prospects

Introduction Processes Conclusions Ref/Appendices
Estimated gross process margins (€/kg)
ii. Status and assessment of prospects
LCO-G NMC333-G NMC (umicore) LFP-G LMO-G0
0.2
0.4
0.6
0.8
1
1.2
1.4
1.6
1.8
2
Revenue [
€/k
g o
f batt
ery
waste
]
Net Revenue for hydrometallurgical recycling, Citric acid
Min
Max
LCO-G NMC333-G NMC (umicore) LFP-G LMO-G0
0.2
0.4
0.6
0.8
1
1.2
1.4
Revenue [
€/k
g o
f batt
ery
waste
]
Net Revenue for pyrolysis recycling
Min
Max
Pyrolysis Hydrometallurgical, Citric Acid
Source: models from process section, using current pricing for all inputs and outputs. Reflects an optimistic vision of large scale purchases, and all outputs being saleable at market prices. Capital, Labour, IP, Rent, Disassembly not included.
Hydrometallurgy has better economic prospects at scale, but both processes may struggle with LFP batteries. Current gate fees are by far a larger source of revenue than the materials.
Status/Prospects

“profits from selling recovered metals are not major driver of [our] recycling
operation”
Maarten Quix, Head of Battery Recycling, Umicore as quoted in: Nature 526, (29 October 2015) doi:10.1038/526S100a (linked)
• Existing industrial scale recyclers understand that the main factor for the decision to recycle is currently legislation.
• Gate fees are integral to their business model.
• Developers of direct recycling (and new hydrothermal) approaches also understand this.
Introduction Processes Conclusions Ref/Appendices
ii. Status and assessment of prospects
Status/Prospects

Introduction Processes Conclusions Ref/Appendices
A shift to direct physical recycling could provide a large revenue boost for Ni/Co materials, and represents a radical improvement for other cathode materials
ii. Status and assessment of prospects
Status/Prospects
Source: Adapted from Gaines et al, 2013 (linked)

Introduction Processes Conclusions Ref/Appendices
Can hydrothermal methods or direct physical recycling scale to compete with existing pyrolysis facilities?
ii. Status and assessment of prospects
Status/Prospects
This is the 64 000€ question. Gate fees at present represent a market inefficiency, but are also a massive incentive for new entrants to the market as they make all processes very profitable. It is easy to note that they are often referenced in pitch decks for new technologies and companies. As new facilities come on line, gate fees should drop and will eventually result in selection pressure.

Conclusions and Discussion
i. The need for recycling
ii. Prospects for recycling and outlook for recovery of scarce metals
iii. Implications for battery producers/users
Introduction Processes Status/Prospects Ref/AppendicesConclusions

Introduction Processes Status/Prospects Ref/Appendices
1. Comply with legislation (most important for producers, owners)
2. Economic Reasons (most important for recyclers)
3. Minimize environmental harm potential from battery lifecycles
4. Circular flows of strategic metals
5. Make electromobility possible!
i. The need for recycling
Conclusions
Many reasons to recycle batteries are cited
Direct motivations for actors:
Societal motivations:

Introduction Processes Status/Prospects Ref/Appendices
i. The need for recycling
Conclusions
Are circular flows of battery materials necessary?
It is fairly certain that large scale adoption of lithium batteries will stress cobalt supplies (Gaines et al 2013), but not all batteries need cobalt. Lithium is a longer term concern (Kushnir and Sandén 2013), and some argue that it may not be a concern at all (Yaksic and Tilton 2009, Gaines et al. 2014). Given that available pyrolysis recycling can recover cobalt, is there are pressing need for change?
Access to materials may be an important policy driver.The EU is 100% import dependent on all potentially scarce battery materials, a fact which is recognized in the initiatives for a circular economy (EU COM 2011/21), and commission directives on strategic materials. Even without an immediate need to recycle for scarcity reasons, the very concentrated supply chains in cobalt and lithium may represent a risk for European industry. This risk is considered sufficient at the EU level to justify research and development of recycling capacity (EU COM 2014).

Introduction Processes Status/Prospects Ref/Appendices
i. The need for recycling
Conclusions
Current gate fees will hinder reaching EV competitiveness targets
Various long run targets for battery prices have been proposed in order to ensure the cost competitiveness of electrified transport. These range from $150-200/kWh for the Advanced Battery Consortium to <$250/kWh from the International Energy Agency.
In either case, $5/kg translates to some $35-50/kWh, which could push out achieving the cost targets by a decade, or prevent it entirely. On a purely life cycle cost basis, higher competitiveness in the recycling market will be a critical part of achieving cost effective and sustainable electrified transport.

Gate fees are a potent incentive for new firms to enter market
Gate fees are much higher than the potential revenue from materials, and all of the processes for recycling should be able to operate at a profit (very slim for LFP type chemistries). Competition for gate fees should be the result, hopefully reducing them significantly in the future.
i. Conclusions 1
Introduction Processes Status/Prospects Ref/Appendices
Legislation coupled with lack of choice produces gate fees
Although end of life batteries are still a fairly small waste flow in mass terms, there are not very many options for recycling them. The choice is essentially to pay whatever it takes to recycle the battery or ‘remove it from the system’ via export or even simple warehousing. Gate fees will likely be a fact of life for the near and medium term.
Conclusions
ii. Prospects for recycling

i. Conclusions 1
Introduction Processes Status/Prospects Ref/Appendices
There will be no issue with recycling cobalt or nickel, but recycling lithium will require new processes
Recovery of lithium from pyrolysis slag is not likely to be cost effective, and thus circular flows of lithium will require alternative recycling processes. Both hydrothermal and direct physical recycling can achieve this goal.
The good news is that innovation is occurring, and that new processes can be cost effective at scale, indicating every technical possibility for circular flows of battery materials in the future.
Conclusions
ii. Prospects for recycling

Batteries all need to be disassembled. Bolts are preferred over glue, and electronic modules and copper connectors should be simple to separate.
Direct and Hydrothermal approaches require chemistry-specific handling. This means that capability to sort batteries by content is a prerequisite for future recycling.
Direct physical recycling may require further adaptations, such as the ability to unroll/unpack cell interior, to enable efficient removal of materials for processing.
Introduction Processes Status/Prospects Ref/AppendicesConclusions
iii. Implications for battery producers / users
Design for recycling is simple for batteries, but should be considered now.

References and Appendices
i. References
ii. Appendices
Kushnir, D. (2015) Lithium Ion Battery Recycling Technology 2015: Current State and Future Prospects. Environmental Systems Analysis. Chalmers University, Göteborg, Sweden. ESA REPORT # 2015:18
This document may be cited as follows:
Introduction Processes Status/Prospects Conclusions Ref/Appendices
Ref/Appendices
i. References
Introduction Processes Status/Prospects Conclusions
Accurec GMBH (2010). "Li-Ion Battery Recycling "EcoBatRec"." Accurec recycling GMBH. Retrieved May 15, 2013, from http://www.accurec.de/treatment-and-recycling/technologies/vox.
Alonso, E., et al. (2007). "Material Availability and the Supply Chain: Risks, Effects, and Responses." Environmental Science & Technology 41(19): 6649-6656.
Al-Thyabat, S., et al. (2013). "Adaptation of minerals processing operations for lithium-ion (LiBs) and nickel metal hydride (NiMH) batteries recycling: Critical review." Minerals Engineering 45(0): 4-17.
Andersson, B. A. and I. Råde (2001). "Metal resource constraints for electric-vehicle batteries." Transportation Research Part D: Transport and Environment 6(5): 297-324.
Batrec. "An idea becomes accepted." Batrec. Retrieved May 15, 2013, from http://www.batrec.ch/en-us/ihre_fragen/film.html.
Committee of Experts on the Transport of Dangerous Goods and on the Globally Harmonized System of Classification and Labelling of Chemicals (2012). UN/SCETDG/42/INF.64/REV.1 Special Provision and Packing Instructions for the transport of waste lithium batteries. Geneva, United Nations.
Dunn, B., et al. (2011). "Electrical Energy Storage for the Grid: A Battery of Choices." Science 334(6058): 928-935.
Dunn, J. B. and L. Gaines (2012). Material and Energy Flows in the Materials Production, Assembly, and End-of-Life Stages of theAutomotive Lithium-Ion Battery Life Cycle. Argonne, Argonne National Laboratory.
i. References

Ref/AppendicesIntroduction Processes Status/Prospects Conclusions
EBRA (2010-2013). "EBRA Members." EBRA. Retrieved May 15, 2013, from http://www.ebra-recycling.org/members.
Edwards, R., et al. (2007). Well-to-Wheels Analysis of Future Automotive Fuels and Powertrains in the European Context. IES, European Comission Joint Research Centre / Institute for Environmental Sustainability. Version 2c, March 2007.
European Commission (2014) Annexes to the report on critical raw materials for the EU, Report of the ad hoc working group on defining critical raw materials, European Commission, DG Enterprise, 25/05/2014.
European Union (2006). "DIRECTIVE 2006/66/EC OF THE EUROPEAN PARLIAMENT AND OF THE COUNCIL of 6 September 2006 on batteries and accumulators and waste batteries and accumulators and repealing Directive." Official Journal of the European Union.
G&P Batteries. "GP The complete waste battery service - Recycle." Retrieved May 15, 2013, from http://www.g-pbatt.co.uk/recycle.html
Gaines, L. and R. Cuenca (2000). Costs of Lithium Ion Batteries for Vehicles. A. N. L. Center for Transportation Research, U.S. Department of Energy.
Gaines, L. and P. Nelson (2009). Lithium Ion Batteries: Possible Materials Issues, Argonne National Laboratory.
GREET (2008). Greenhouse Gases, Regulated Emissions and Energy Use in Transportation Model (GREET), Argonne National Laboratory.
GRS Batterien. "Wertvolle Rohstoffe Zurückgewinnen." GRS Batterien. Retrieved May 15, 2013, from http://www.grs-batterien.de/verbraucher/ueber-batterierecycling.html.
i. References

Ref/AppendicesIntroduction Processes Status/Prospects Conclusions
Hoyer, C., et al. (2011). A Strategic Framework for the Design of Recycling Networks for Lithium-Ion Batteries from Electric Vehicles. Glocalized Solutions for Sustainability in Manufacturing. J. Hesselbach and C. Herrmann, Springer Berlin Heidelberg: 79-84.
Kirby, B. (2005). Frequency Regulation Basics and Trends: Medium: ED.
Kushnir, D. and B. A. Sandén (2011). "Multi-level energy analysis of emerging technologies: a case study in new materials for lithium ion batteries." Journal of Cleaner Production 19(13): 1405-1416.
Kushnir, D. and B. A. Sandén (2012). "The time dimension and lithium resource constraints for electric vehicles." Resources Policy.MSB (2013) ADR-S. MSB
Naturvårdsverket Lagar och regler. EE & Batteriregistret
Nelson, P. A., et al. (2009). Factors Determining the Manufacturing Costs of Lithium-Ion Batteries for PHEVs. Stavanger, Norway.
Neubauer, J. and A. Pesaran (2010). PHEV/EV Li-Ion Battery Second-Use Project (Presentation).
Neubauer, J. and A. Pesaran (2011). "The ability of battery second use strategies to impact plug-in electric vehicle prices and serve utility energy storage applications." Journal of Power Sources 196(23): 10351-10358.
Notter, D. A., et al. (2010). "Contribution of Li-Ion Batteries to the Environmental Impact of Electric Vehicles." Environmental Science & Technology 44(17): 6550-6556.
Olofsson, Y. and M. Romare (2013). Life Cycle Assessment of Lithium-ion Batteries for Plug-in Hybrid Buses. Göteborg, Sweden, Chalmers University of Technology. M.Sc.
i. References

Ref/AppendicesIntroduction Processes Status/Prospects Conclusions
Pilagest. "El Reciclatge." Pilagest. Retrieved May 15, 2013, from http://www.pilagest.cat/reciclatge.php?sel_lang=cat&sel_esquema=1.
RECHARGE. "Association - list of members." RECHARGE. Retrieved May 15, 2013, from http://www.rechargebatteries.org/html/recharge-list_of_members.html.
Recupyl. "Process." Recupyl. Retrieved May 15, 2013, from http://www.recupyl.com/157-process.html.
Rydh, C. J. and B. A. Sandén (2005b). "Energy analysis of batteries in photovoltaic systems. Part II: Energy return factors and overall battery efficiencies." Energy Conversion and Management 46(11-12): 1980-2000.
Sandia National Laboratories (2012). "DOE International Energy Storage Database." Retrieved September 2, 2013, from http://www.energystorageexchange.org/application/glossary.
SNAM. "Unités pyrométallurgiques." SNAM. Retrieved May 15, 2013, from http://www.snam.com/traitement/unite-pyrometallurgique.php.
Tytgat, J. (2011). Recycling of Li-ion and NiMH batteries from electric vehicles: technology and impact on life cycle. Belgium, Umicore.
Umicore (2013). "Umicore Battery Recycling." Umicore. from http://batteryrecycling.umicore.com/UBR/.
Xu, J. e. a. (2008). "A review of processes and technologies for the recycling of lithium-ion secondary batteries." Elsevier: 512-527.
i. References

Ref/AppendicesIntroduction Processes Status/Prospects Conclusions
Yaksic, A. and J. E. Tilton (2009). "Using the cumulative availability curve to assess the threat of mineral depletion: The case oflithium." Resources Policy 34(4): 185-194.
Zackrisson, M., et al. (2010). "Life cycle assessment of lithium-ion batteries for plug-in hybrid electric vehicles - Critical issues." Journal of Cleaner Production 18(15): 1519-1529.
i. References

ii. Appendix A – Mass fraction and hotspots of cell production
Asp
ect
LC
O-G
N
MC
33
3-G
N
MC
44
2-G
L
FP
-G
LM
O-G
Fin
al C
ell
Cap
acit
y (W
h/k
g)
135
140
140
90
13
5
Ma
ss
LC
O-G
N
MC
33
3-G
N
MC
44
2-G
L
FP
-G
LM
O-G
Cat
ho
de
25
%
27
%
34
%
24
%
25
%
Al
Fo
il
14
%
15
%
13
%
16
%
14
%
Ano
de
16
%
16
%
14
%
14
%
10
%
Cu F
oil
2
1%
1
8%
1
6%
2
2%
2
7%
Bin
der
s 4
%
4%
4
%
4%
4
%
Ele
ctro
lyte
, S
alt
and
sep
arat
or
11
%
11
%
10
%
11
%
11
%
Cas
e an
d
term
inal
s
9%
9
%
8%
9
%
9%
En
vir
on
men
tal
Imp
act
/k
g
En
erg
y
(CE
D/k
g)
ReC
iPE
Eco
syst
em
(Po
ints
/kg
)
Rec
ipe
To
tal
(Po
ints
/kg
)
EP
S A
bio
tic
(EL
U/k
g)
EP
S T
ota
l
(EL
U/k
g)
Al
Fo
il
194.
00
0.24
1.
14
3.82
11
.87
Co
pp
er F
oil
60
.30
0.13
6.
90
308.
37
320.
01
Ste
el (
Cas
e)
22.0
0 0.
00
0.00
0.
00
0.00
LiP
F6
34
0.00
0.
61
3.13
45
.50
50.6
0
EC
/DM
C
39.0
0 0.
03
0.19
1.
16
1.37
PV
DF
36
6.00
0.
43
2.07
10
.20
13.5
0
Sep
arat
or
112.
00
0.11
0.
60
10.2
0 13
.50
Car
bo
n B
lack
89
.00
0.05
0.
38
1.01
1.
10
Gra
phit
e 67
.00
0.06
1.
31
93.2
0 96
.58
LiC
oO
2
170.
00
0.20
2.
45
226.
88
232.
49
LiN
MC
42
4
123.
00
0.15
2.
10
182.
00
190.
00
LiN
MC
33
3
123.
00
0.15
2.
10
186.
00
195.
00
LiF
ePO
4
50.0
0 0.
06
0.19
43
.00
50.0
0
LiM
n2
O4
40
.00
0.06
0.
19
65.0
0 71
.00
Ref/AppendicesIntroduction Processes Status/Prospects Conclusions

ii. Appendix B – Material breakdown and value of cells by chemistry
Ma
teri
als
LC
O-G
N
MC
333
-G
LF
P-G
L
MO
-G
P
rice
[€/k
g]
Ma
ss
[kg
/to
nn
e]
Va
lue
[€]
Ma
ss
[kg
/to
nn
e]
Va
lue
[€]
Ma
ss
[kg
/to
nn
e]
Va
lue
[€]
Ma
ss
[kg
/to
nn
e]
Va
lue
[€]
Ref
eren
ce
Alu
min
ium
0,
7 12
2,2
86,7
12
2,2
86,7
12
2,2
86,7
12
2,2
86,7
(S
ubit
o)
Alu
min
ium
- Fo
il 0,
7 92
,2
65,5
98
,8
70,1
10
5,4
74,8
92
,2
65,5
(S
ubit
o)
Carb
on -
Act
ivat
ed
0,3
11,2
0,
33
12,0
0,
36
10,8
0,
32
11,3
0,
34
Alib
aba
Carb
on -
Gra
phit
e 1,
0 10
3,0
103,
0 10
3,4
103,
4 93
,2
93,2
64
,8
64,8
A
libab
a
Coba
lt
20,0
99
,9
1998
36
,0
720,
0 0,
0 0,
0 0,
0 0,
0 (L
ondo
n M
etal
Ex
chan
ge)
Copp
er
2,3
40,0
90
,8
40,0
90
,8
40,0
90
,8
40,0
90
,8
(Lon
don
Met
al
Exc
han
ge)
Copp
er -
Foil
2,3
140,
6 31
9,1
119,
3 27
0,9
144,
4 32
7,7
176,
5 40
0,8
(Lon
don
Met
al
Exc
han
ge)
EC
1,2
29,6
34
,7
29,6
34
,7
29,6
34
,7
29,6
34
,7
(She
nzhe
n H
ongy
e Ti
anch
eng
Tech
nolo
gy C
o.
Ltd.
)
DM
C 1,
2 29
,6
34,7
29
,6
34,7
29
,6
34,7
29
,6
34,7
(She
nzhe
n H
ongy
e Ti
anch
eng
Tech
nolo
gy C
o.
Ltd.
)
Elec
tron
ics
- 90
,0
- 90
,0
- 90
,0
- 90
,0
- -
Iron
0,
3 0,
0 0,
0 0,
0 0,
0 58
,6
17,6
0,
0 0,
0 (E
urof
er t
he
Euro
pean
Ste
el
Ass
ocia
tion
201
3)
Lith
ium
- ca
thod
e 7,
9 11
,8
92,9
12
,9
101,
5 6,
9 54
,5
12,4
97
,5
(Hub
ei B
aijie
rui
Adv
ance
d M
ater
ials
Co.
)
Lith
ium
- sa
lt
7,9
0,3
2,4
0,3
2,4
0,3
2,4
0,3
2,4
(Hub
ei B
aijie
rui
Adv
ance
d M
ater
ials
Co.
)
Man
gane
se
0,6
0,0
0,0
33,6
18
,8
0,0
0,0
97,8
54
,8
(Hun
an C
entr
e M
achi
nery
Co.
)
Nic
kel
10,0
0,
0 0,
0 35
,9
329,
0 0,
0 0,
0 0,
0 0,
0 Lo
ndon
Met
al
Exch
ange
Plas
tic
- Bi
nder
8,
4 14
,7
124,
5 15
,4
130,
2 13
,9
117,
3 12
,8
108,
1 (M
oore
Rec
yclin
g A
ssoc
iate
s 20
09)
Plas
tic
- Se
para
tor
8,4
6,6
55,6
6,
6 55
,6
6,6
55,6
6,
6 55
,6
(Moo
re R
ecyc
ling
Ass
ocia
tes
2009
)
Stee
l 0,
3 80
,0
24,0
80
,0
24,0
80
,0
24,0
80
,0
24,0
(E
urof
er t
he
Euro
pean
Ste
el
Ass
ocia
tion
201
3)
Tota
l scr
ap v
alue
[€
/ton
ne c
ells
]
3905
2003
921
10
56
Ref/AppendicesIntroduction Processes Status/Prospects Conclusions