literature research and academic writing
TRANSCRIPT

Georgios Siviloglou
Literature Research and Academic Writing
Southern University of Science and Technology (SUSTech),Shenzhen Institute for Quantum Science and Engineering (SIQSE)
14 November 2019
1
How to make a good figure
2
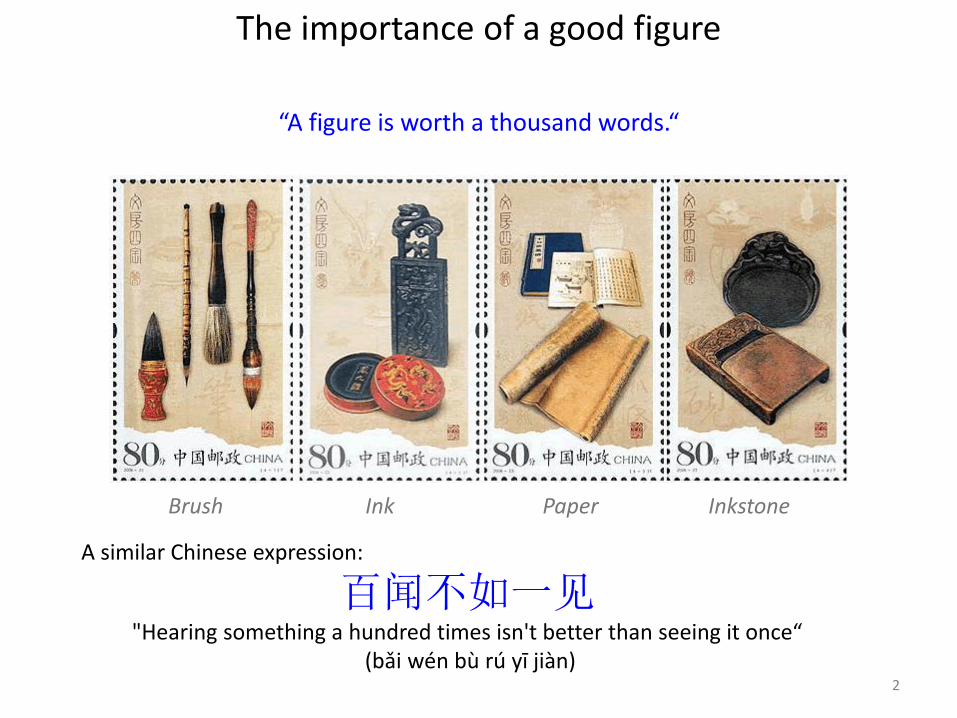
The importance of a good figure
“A figure is worth a thousand words.“
A similar Chinese expression:
百闻不如一见"Hearing something a hundred times isn't better than seeing it once“
(bǎi wén bù rú yī jiàn)
Brush Ink Paper Inkstone
What we will not discuss today
3
• What data to present
• How to do curve fitting
• How to make tables
• How to make videos
• How to use the various software packages
• How to photoshop your figures

4
What we will discuss today
http://cellbio.emory.edu/bnanes/figures/Word cloud based on
What we will discuss today
• Static figures
• Guidelines from journals
• What is a good figure
• Real life examples of great and not so great figures
• Image creation technology
• Image preparation and workflow
• Python examples
• A game5
6
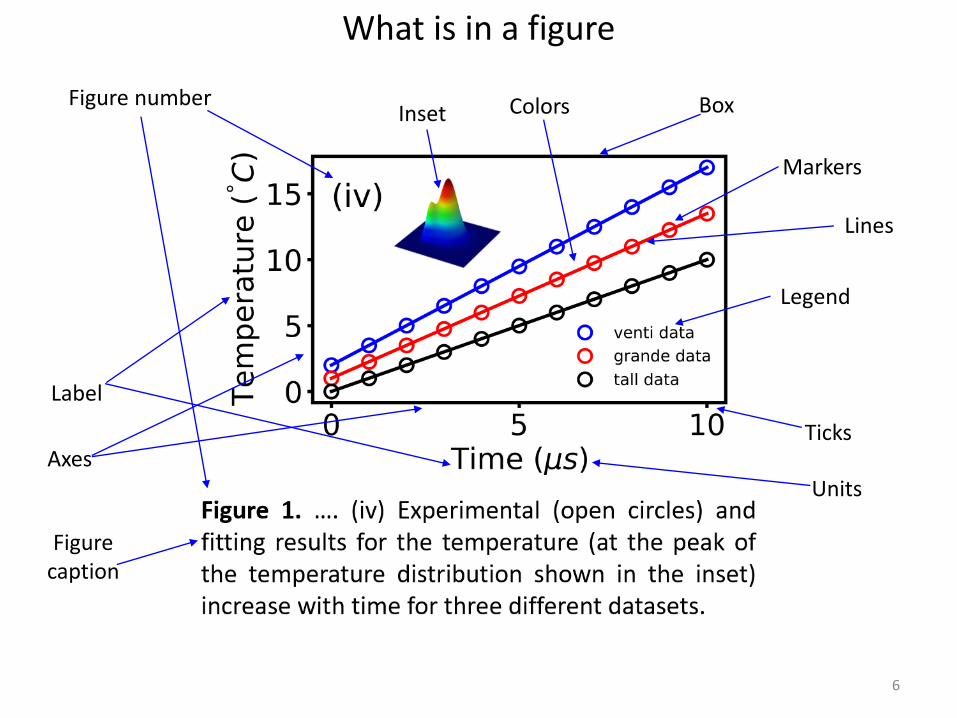
What is in a figure
Markers
Lines
Legend
Units
Label
Figure caption
Figure numberInset Box
AxesTicks
Colors

7
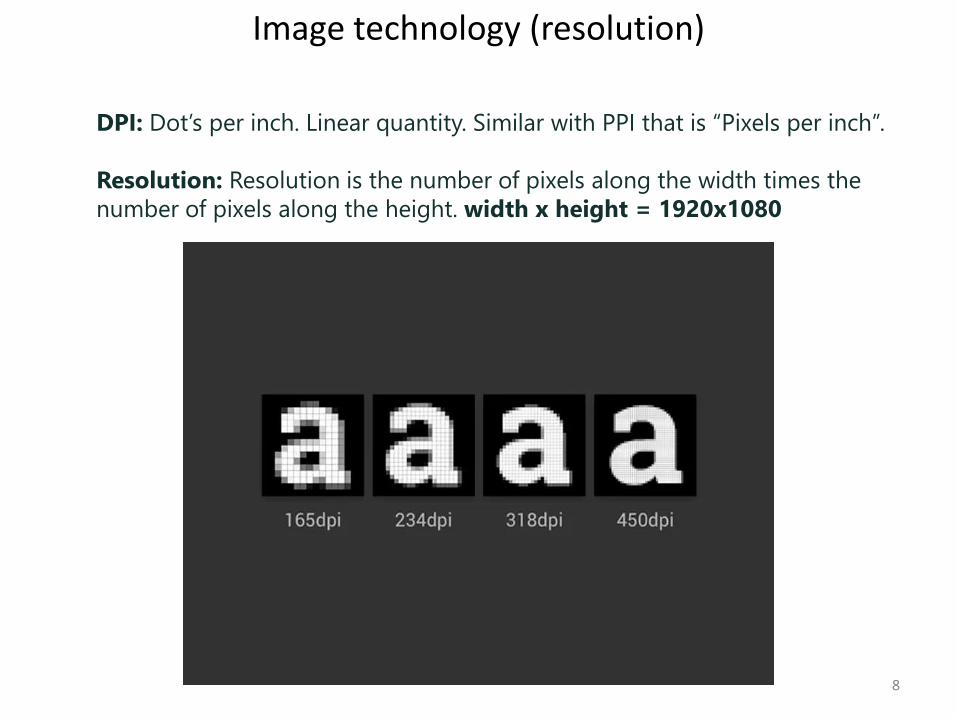
Image technology (resolution)
DPI: Dot’s per inch. Linear quantity. Similar with PPI that is “Pixels per inch”.
Resolution: Resolution is the number of pixels along the width times the
number of pixels along the height. width x height = 1920x1080
8
Image technology (resolution)
DPI: Dot’s per inch. Linear quantity. Similar with PPI that is “Pixels per inch”.
Resolution: Resolution is the number of pixels along the width times the
number of pixels along the height. width x height = 1920x1080

9
Image technology (vector and raster graphics)
https://www.printcnx.com/resources-and-support/addiational-resources/raster-images-vs-vector-graphics/

10
The most common raster file types include JPG, GIF, PNG, TIF, BMP, and PSD.
The most common vector file types are AI, CDR, and SVG.
Both rasters and vectors can be rendered in EPS and PDF format, where the software that created the file dictates whether it's a raster or vector file.
Unlike raster graphics, which are comprised of colored pixels arranged to display an image, vector graphics are made up of paths, each with a mathematical formula (vector).
Vector images retain their appearance regardless of size. They can be scaled infinitely.
Image technology (vector and raster graphics)
https://www.psprint.com/resources/difference-between-raster-vector/

11
Image technology (Compression)
https://guides.lib.umich.edu/c.php?g=282942&p=1885348
TIFF (.tif, .tiff)Compression: Lossless - no compression. Very high-quality images.Best For: High quality prints, professional publications, archival copiesSpecial Attributes: Can save transparencies
Bitmap (.bmp)Compression: NoneBest For: High quality scans, archival copies
JPEG (.jpg, .jpeg)Compression: Lossy - some file information is compressed or lostBest For: Web Images, Non-Professional Printing, E-Mail, PowerpointSpecial Attributes: Can choose amount of compression.
PNG (.png)Compression: Lossless - compression without loss of qualityBest For: Web ImagesSpecial Attributes: Save Transparency
EPS (.eps)Compression: None - uses vector informationBest For: Vector artwork, illustrationsSpecial Attributes: Saves vector information
12
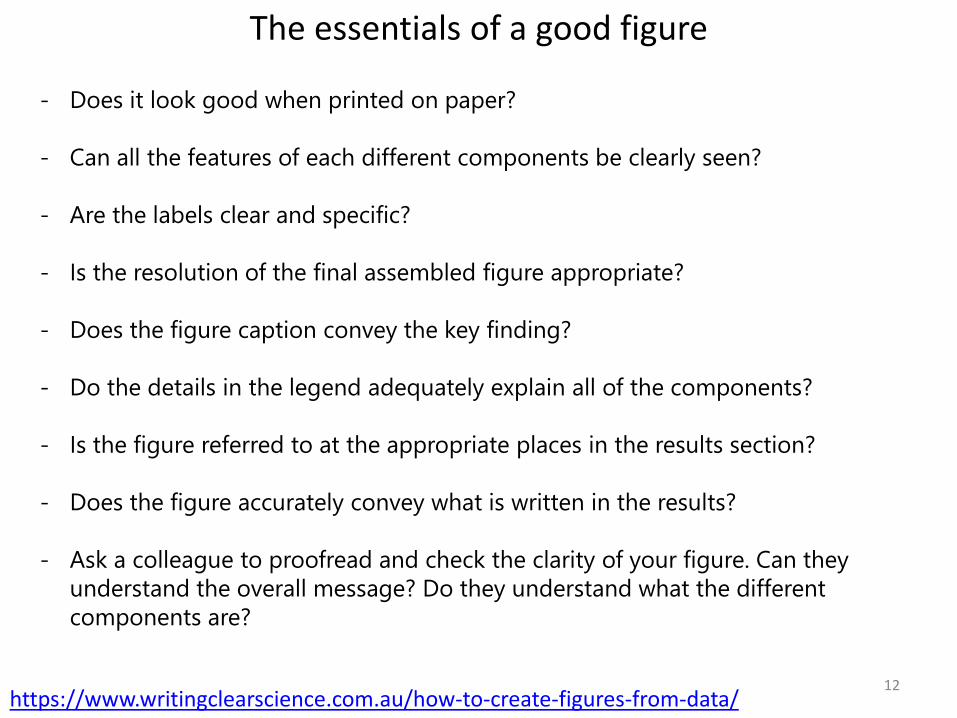
- Does it look good when printed on paper?
- Can all the features of each different components be clearly seen?
- Are the labels clear and specific?
- Is the resolution of the final assembled figure appropriate?
- Does the figure caption convey the key finding?
- Do the details in the legend adequately explain all of the components?
- Is the figure referred to at the appropriate places in the results section?
- Does the figure accurately convey what is written in the results?
- Ask a colleague to proofread and check the clarity of your figure. Can they
understand the overall message? Do they understand what the different
components are?
The essentials of a good figure
https://www.writingclearscience.com.au/how-to-create-figures-from-data/

Journal guidelines for figures
13
Single column figures should have a width of a 8.6 cm.
Preferred formats are .ps, .eps, .pdf, .jpg, and .png. Photographs as .jpg or .png files.
For color-online-only figures, a .ps or .eps file is required for production.
Define figure symbols and curves either in a legend in the figure itself or in the caption.
Label subfigures (a), (b), etc.,
Format figures such that their content and details are readable at 100%.
Capital letters and numeral height > 2 mm. Diameter of each data point at least 1 mm.
Make a curve’s linewidth at least 0.18 mm (0.5 point).
Avoid small open symbols, shading, and cross-hatching in figures.
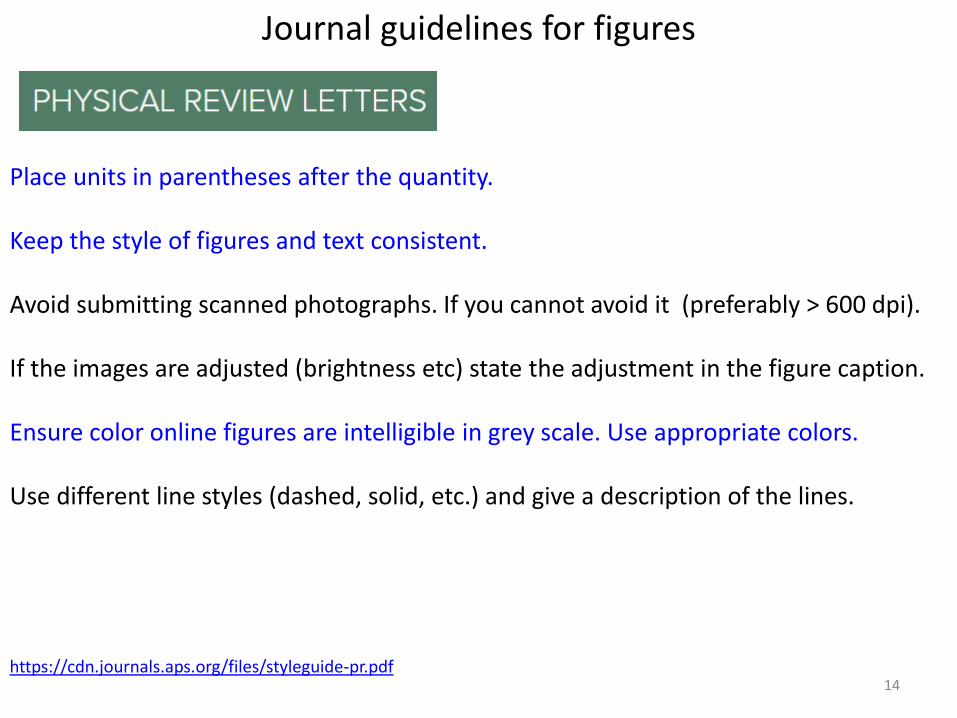
Journal guidelines for figures
14
Place units in parentheses after the quantity.
Keep the style of figures and text consistent.
Avoid submitting scanned photographs. If you cannot avoid it (preferably > 600 dpi).
If the images are adjusted (brightness etc) state the adjustment in the figure caption.
Ensure color online figures are intelligible in grey scale. Use appropriate colors.
Use different line styles (dashed, solid, etc.) and give a description of the lines.
https://cdn.journals.aps.org/files/styleguide-pr.pdf
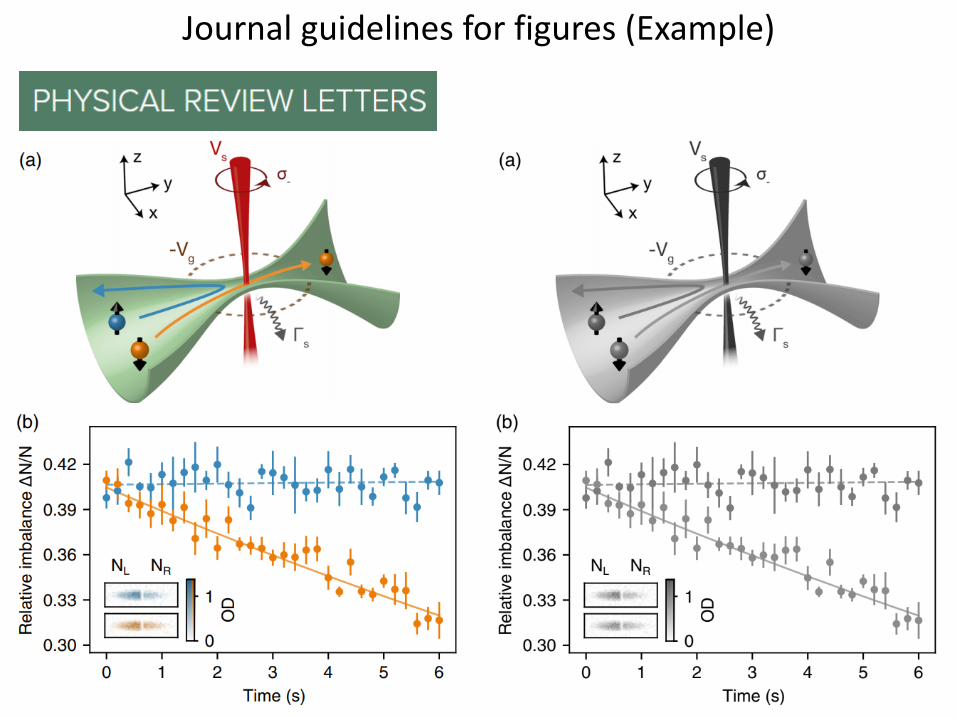
Journal guidelines for figures (Example)
15
Journal guidelines for figures
16https://www.nature.com/articles/d41586-019-01431-z
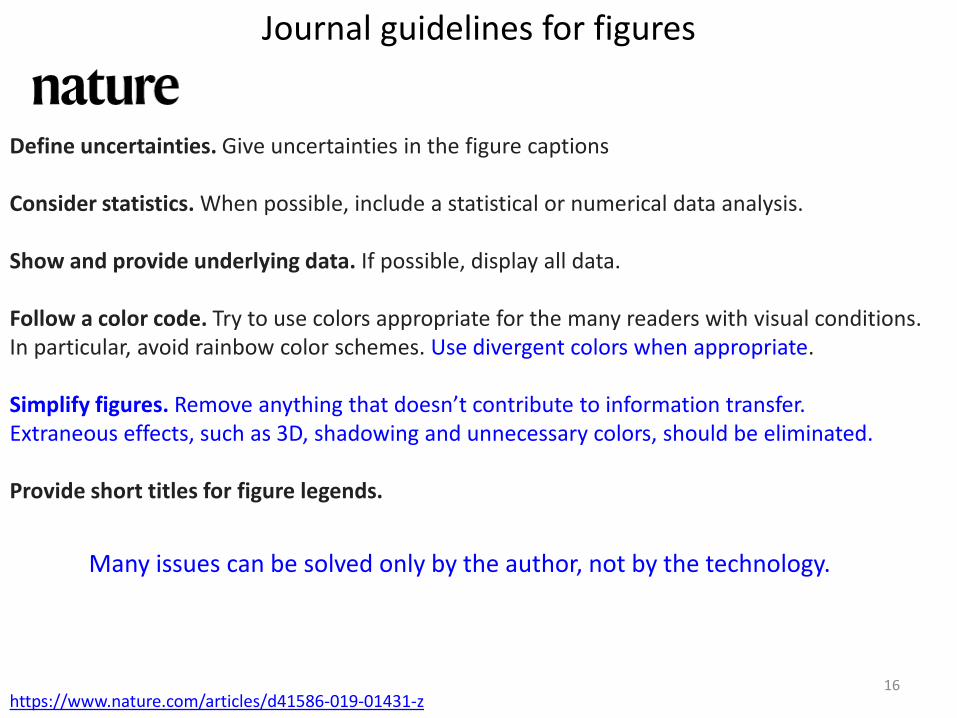
Define uncertainties. Give uncertainties in the figure captions
Consider statistics. When possible, include a statistical or numerical data analysis.
Show and provide underlying data. If possible, display all data.
Follow a color code. Try to use colors appropriate for the many readers with visual conditions. In particular, avoid rainbow color schemes. Use divergent colors when appropriate.
Simplify figures. Remove anything that doesn’t contribute to information transfer. Extraneous effects, such as 3D, shadowing and unnecessary colors, should be eliminated.
Provide short titles for figure legends.
Many issues can be solved only by the author, not by the technology.
Journal guidelines for figures
17
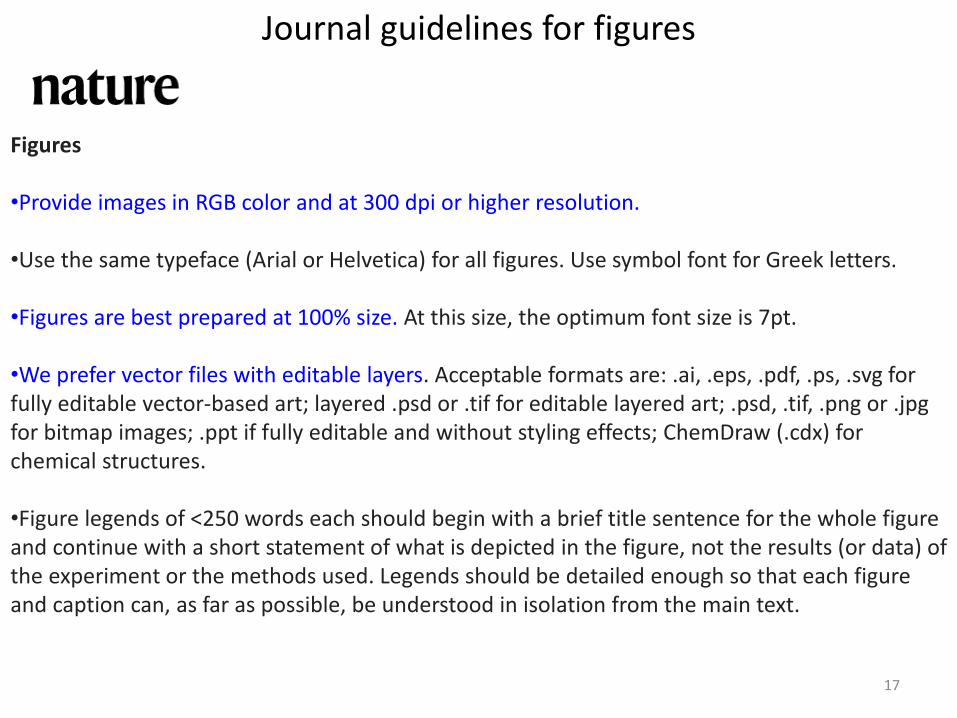
Figures
•Provide images in RGB color and at 300 dpi or higher resolution.
•Use the same typeface (Arial or Helvetica) for all figures. Use symbol font for Greek letters.
•Figures are best prepared at 100% size. At this size, the optimum font size is 7pt.
•We prefer vector files with editable layers. Acceptable formats are: .ai, .eps, .pdf, .ps, .svg for fully editable vector-based art; layered .psd or .tif for editable layered art; .psd, .tif, .png or .jpg for bitmap images; .ppt if fully editable and without styling effects; ChemDraw (.cdx) for chemical structures.
•Figure legends of <250 words each should begin with a brief title sentence for the whole figure and continue with a short statement of what is depicted in the figure, not the results (or data) of the experiment or the methods used. Legends should be detailed enough so that each figure and caption can, as far as possible, be understood in isolation from the main text.

Journal guidelines for figures (Example)
18

Journal guidelines for figures (Example)
19

Journal guidelines for figures
20
Preparation of Figures
Creating your figures It is best to create your figures as vector-based
files. We cannot accept PPT files or files that are not readable by Adobe Photoshop.
Digital color art should be submitted as CMYK (Cyan, Magenta, Yellow, Black) rather
than RGB (Red, Green, Blue).
The figure’s title should be at the beginning of the figure legend, not in the figure itself.
•Include the figure’s number (e.g., “Fig. 1”) on the same page that includes the figure.
•Use solid symbols for plotting data if possible (unless data overlap or there are multiple
symbols). Size symbols (6 pt minimum). Line widths (minimum of 0.5 pt.
•Panels close to each other, and common axis labels should not be repeated.
•Scales or axes should not extend beyond the range of the data plotted.
•Use scale bars in place of, or in addition to, magnifications. Do not use minor tick marks
in scales or grid lines. Avoid using y-axis labels on the right that repeat those on the left.
Journal guidelines for figures
21
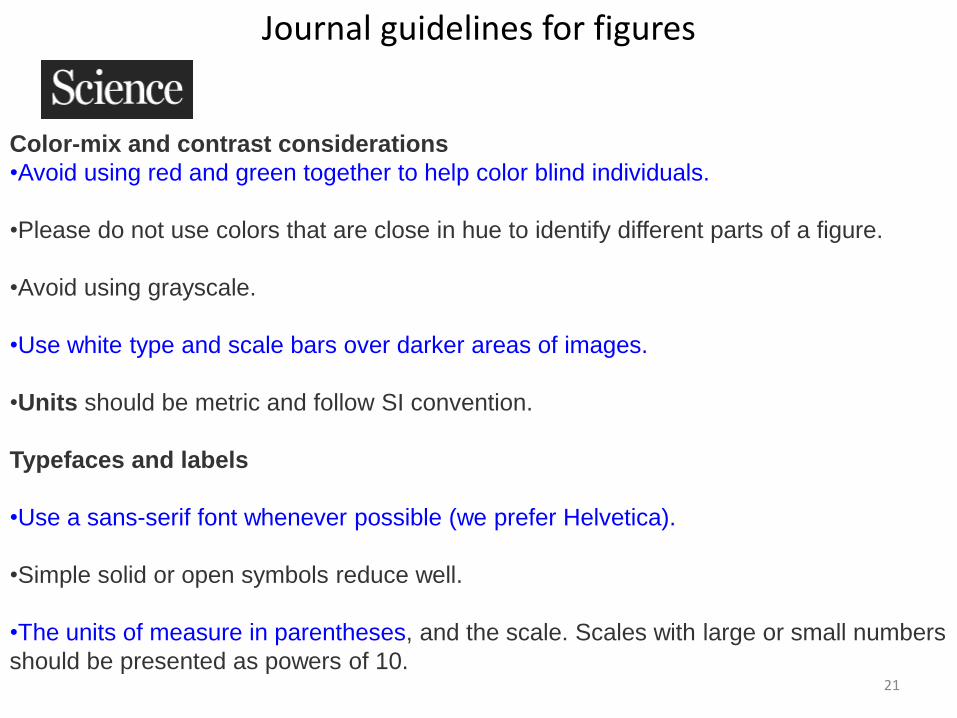
Color-mix and contrast considerations
•Avoid using red and green together to help color blind individuals.
•Please do not use colors that are close in hue to identify different parts of a figure.
•Avoid using grayscale.
•Use white type and scale bars over darker areas of images.
•Units should be metric and follow SI convention.
Typefaces and labels
•Use a sans-serif font whenever possible (we prefer Helvetica).
•Simple solid or open symbols reduce well.
•The units of measure in parentheses, and the scale. Scales with large or small numbers
should be presented as powers of 10.

Journal guidelines for figures
22
•Avoid the use of light lines and screen shading. Instead, use black-and-white, hatched,
and cross-hatched designs for emphasis.
•Capitalize the first letter in a label only, not every word (and proper nouns, of course).
•Type on top of color in a color figure should be in bold face. Avoid using color type.
•When figures are assembled from multiple gels or micrographs, a line or space should
indicate the border between two original images.
•Use capital letters for part labels in multipart figures – A, B, C, etc. These should be 9 pt
and bold in the final figure. Place part labels at the upper left-hand corner of each figure
Modification of figures
• Linear adjustment of contrast, brightness, or color must be applied to an entire image
• Nonlinear adjustments must be specified in the figure legend.
• Selective enhancement or alteration of one part of an image is not acceptable.
Journal guidelines for figures (Example)
23
24
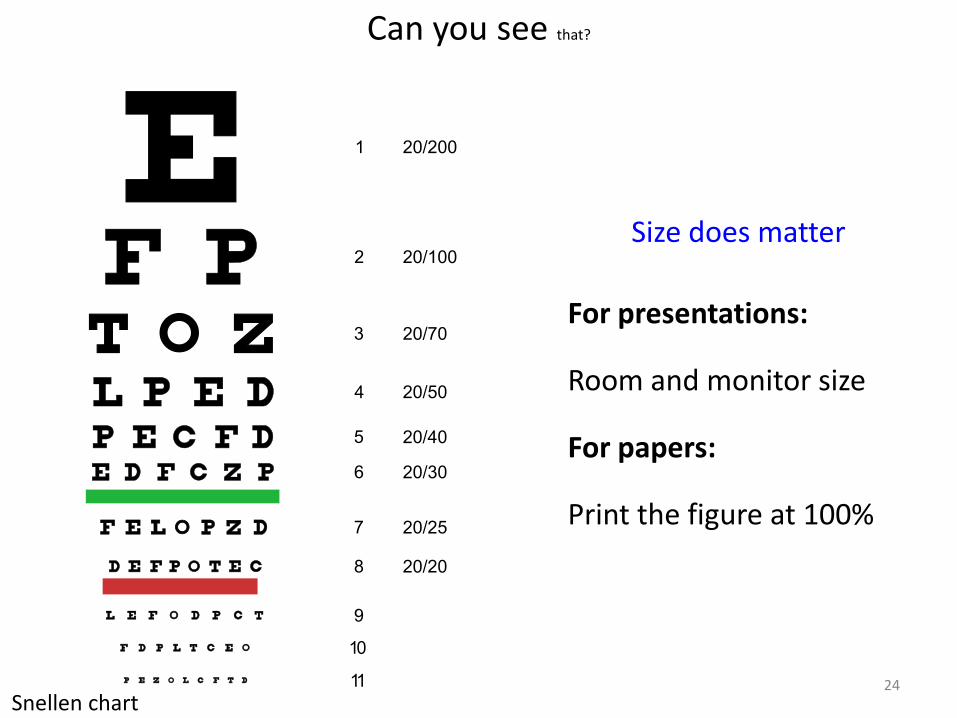
Can you see that?
Snellen chart
For presentations:
Room and monitor size
For papers:
Print the figure at 100%
Size does matter

25
Create images at least 300 DPI

26
Create images at least 300 DPI
60 DPI 600 DPI

27
Create images at least 300 DPI

Figures for Nobel
28
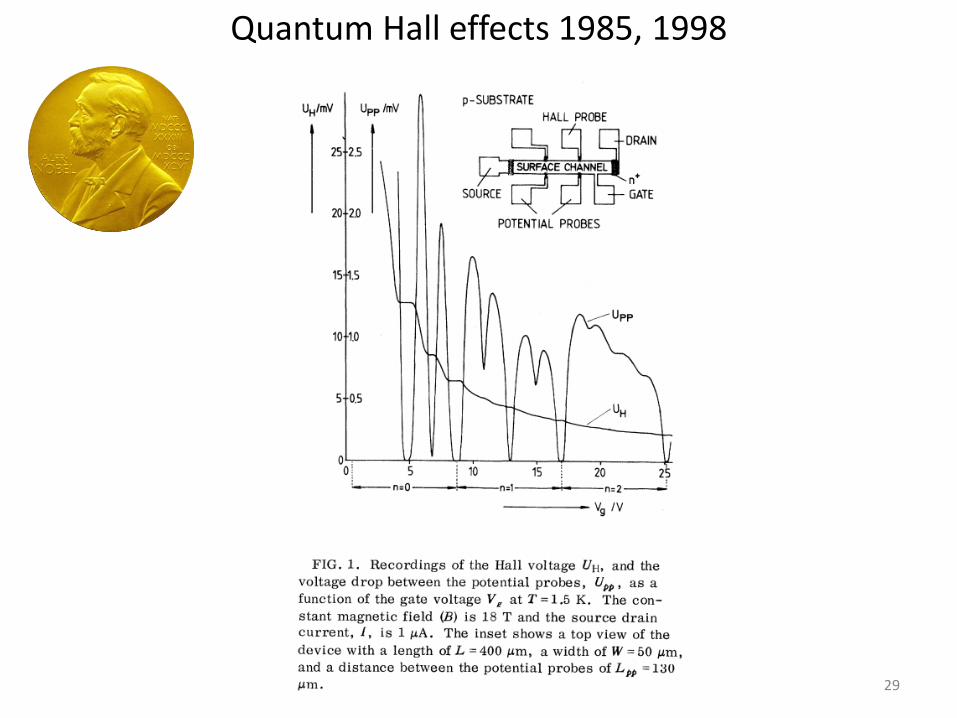
Quantum Hall effects 1985, 1998
29
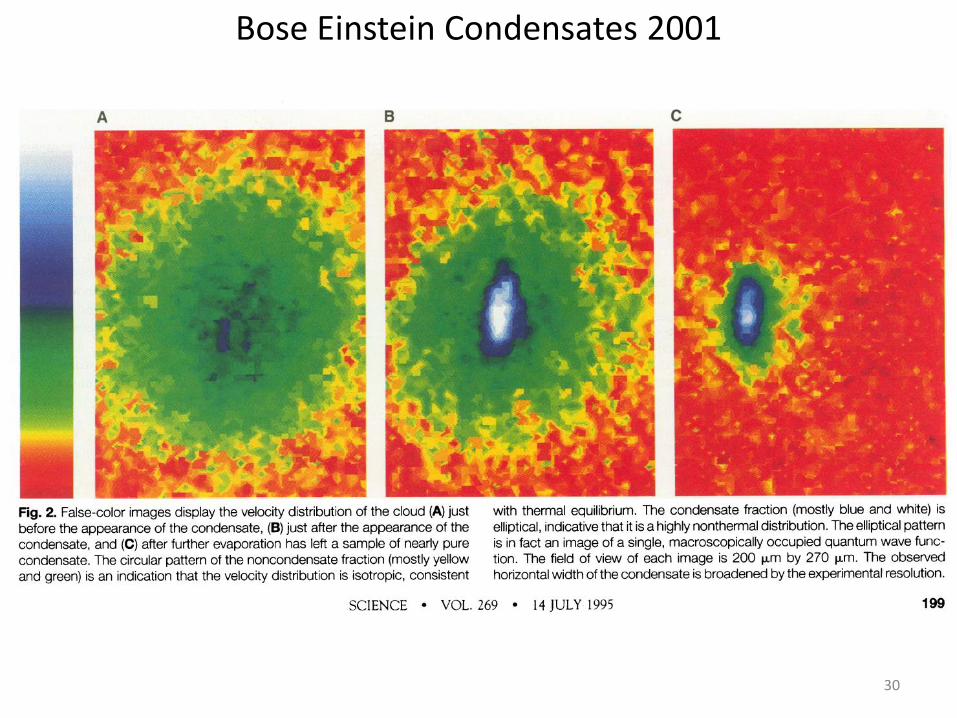
Bose Einstein Condensates 2001
30
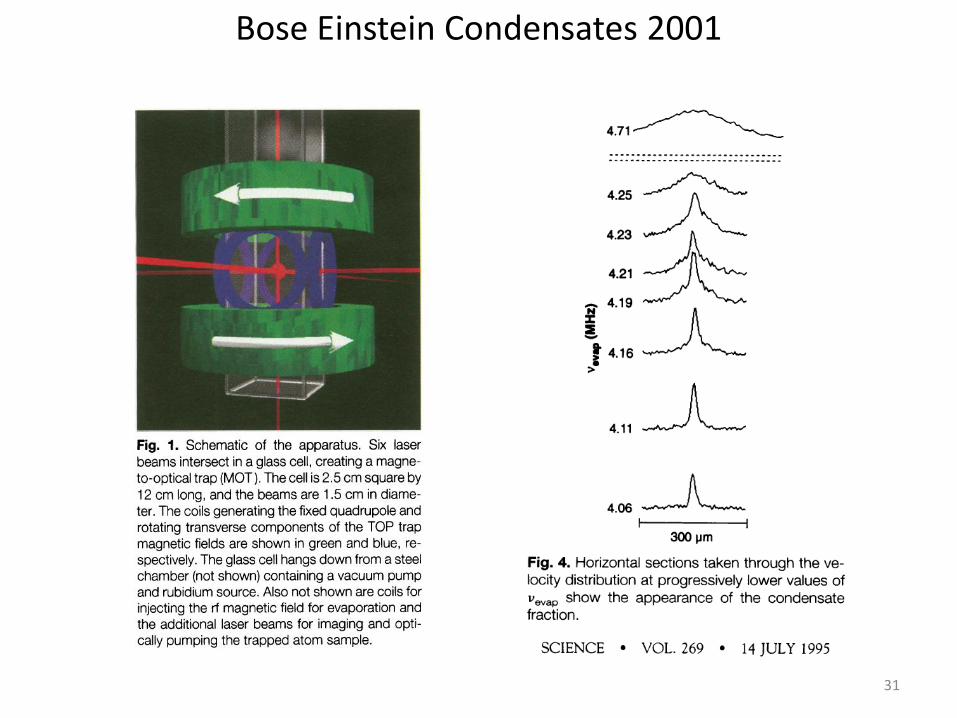
Bose Einstein Condensates 2001
31

Graphene 2010
32

33
Graphene 2010

Higgs boson 2013
34
35
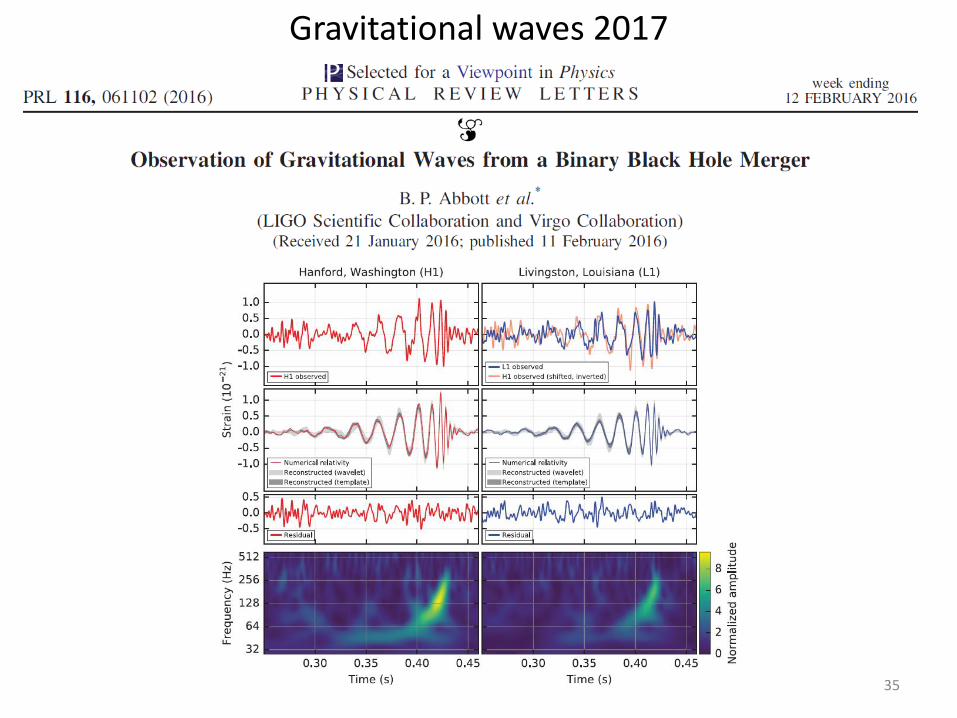
Gravitational waves 2017

36
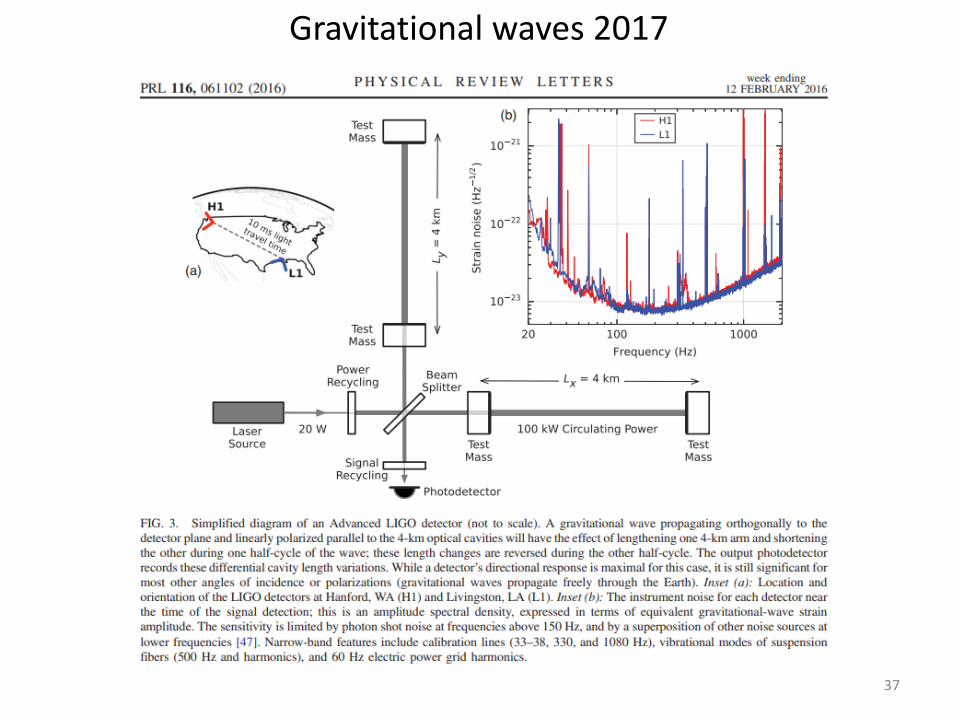
Gravitational waves 2017
37
Gravitational waves 2017

38
Ultrafast lasers 2018

39
Ultrafast lasers 2018

40
Ultrafast lasers 2018
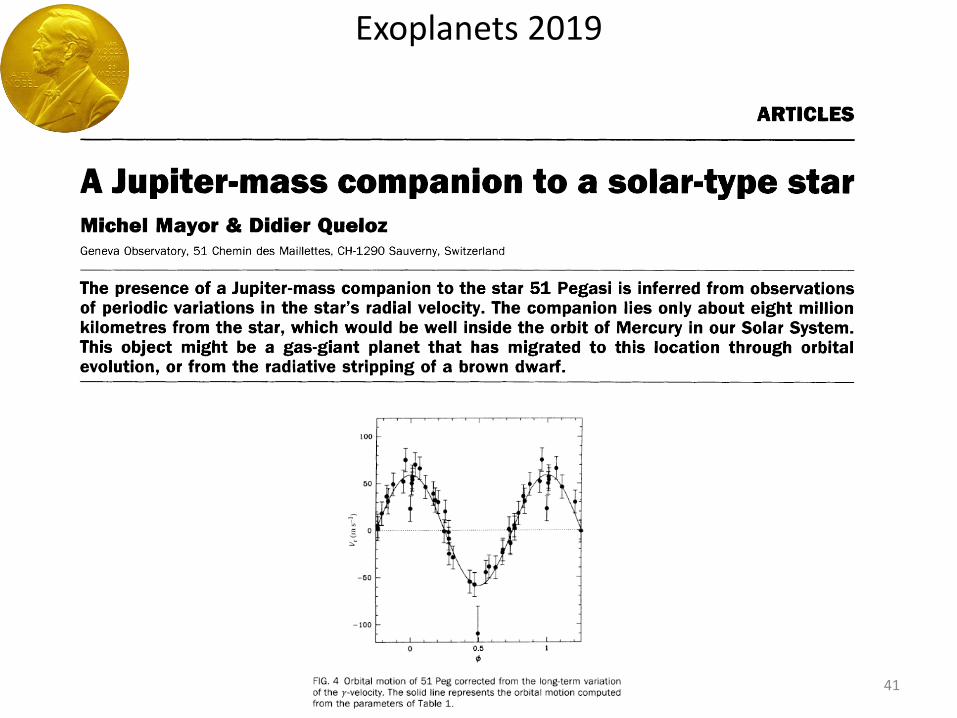
Exoplanets 2019
41

Exoplanets 2019
42

Workflow (Create the figure)
43

Workflow (Import to art software)
44

Post-processing with specialized software
45

46

What is wrong with this figure
47
What is wrong with this figure
48
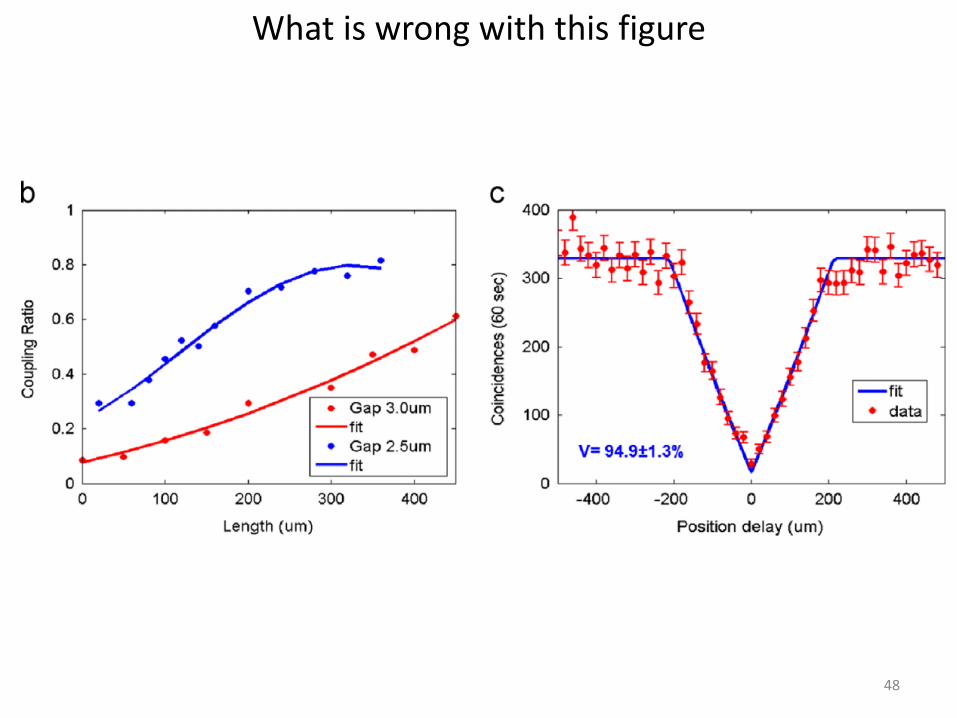
What is wrong with this figure
49

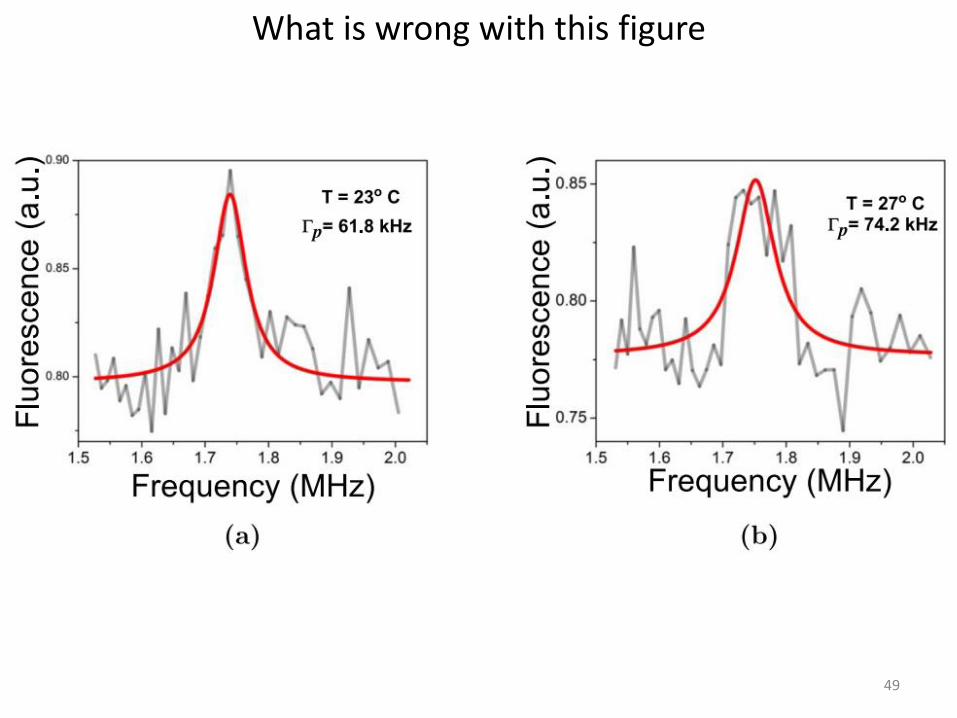
What is wrong with this figure
50

What is wrong with this figure
51
52
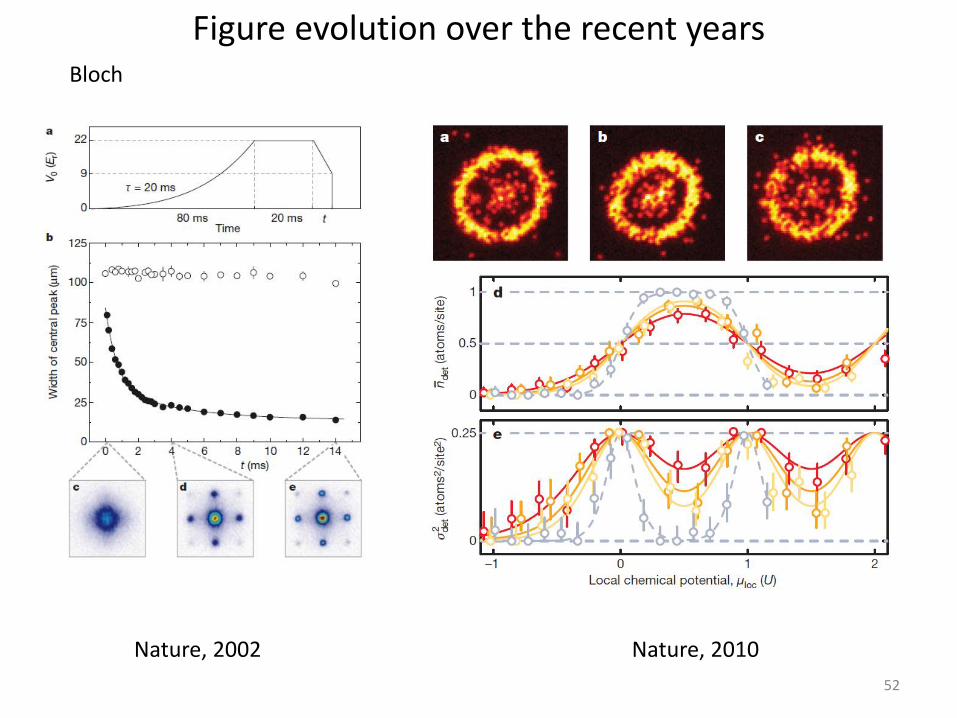
Figure evolution over the recent yearsBloch
Nature, 2002 Nature, 2010

53
Figure evolution over the recent yearsZeilinger/Jian Wei Pan
Nature, 1997 Nature, 2017

54
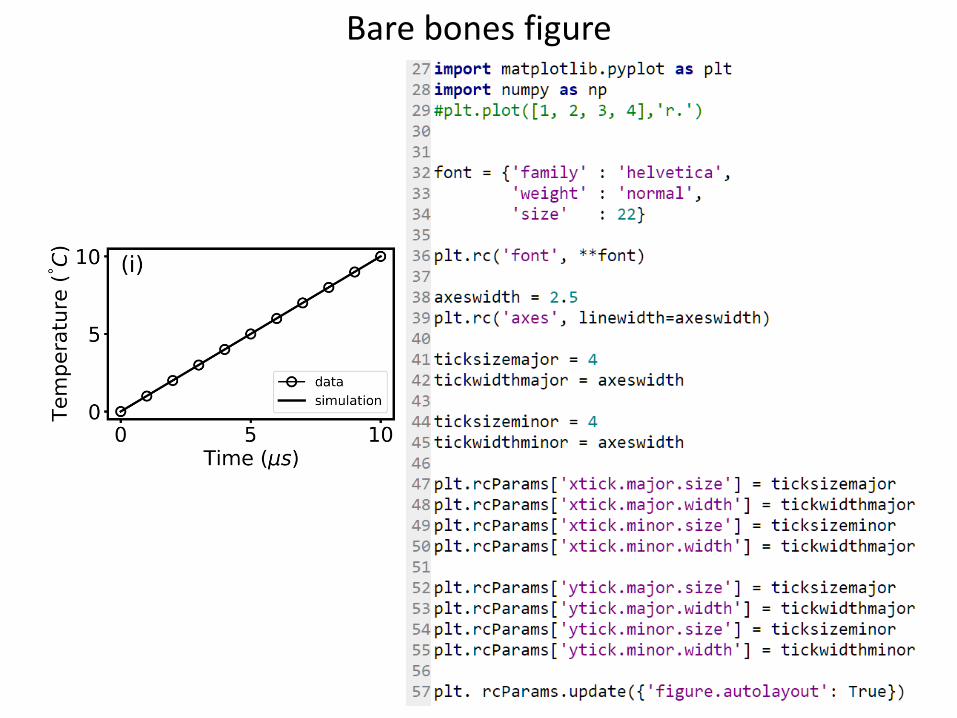
Bare bones figure
55
Bare bones figure

56
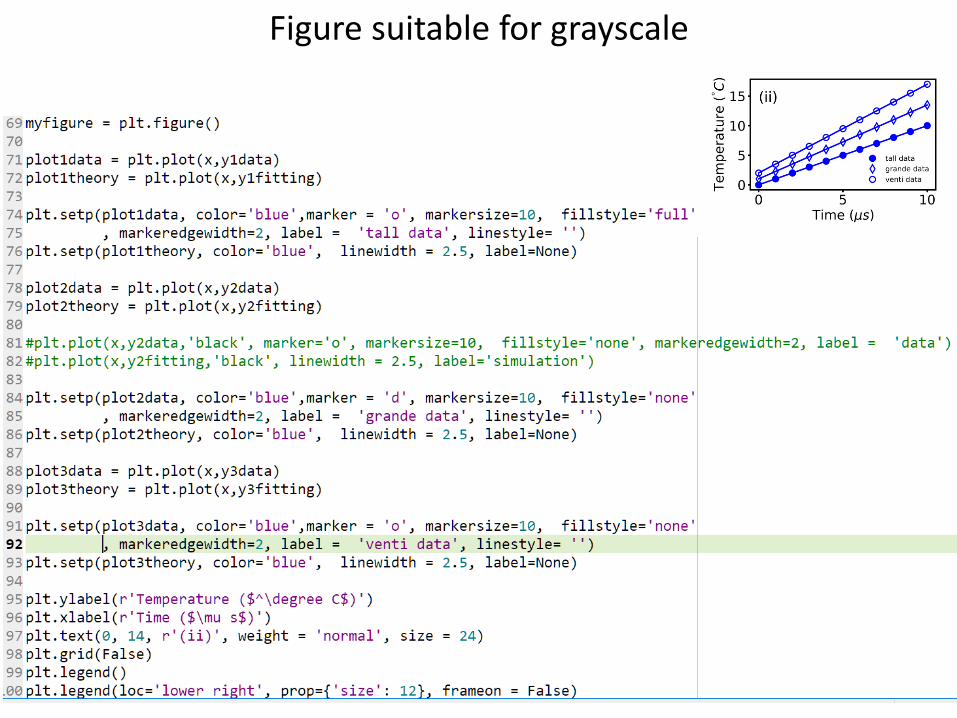
Figure suitable for grayscale
57
Figure suitable for grayscale
58
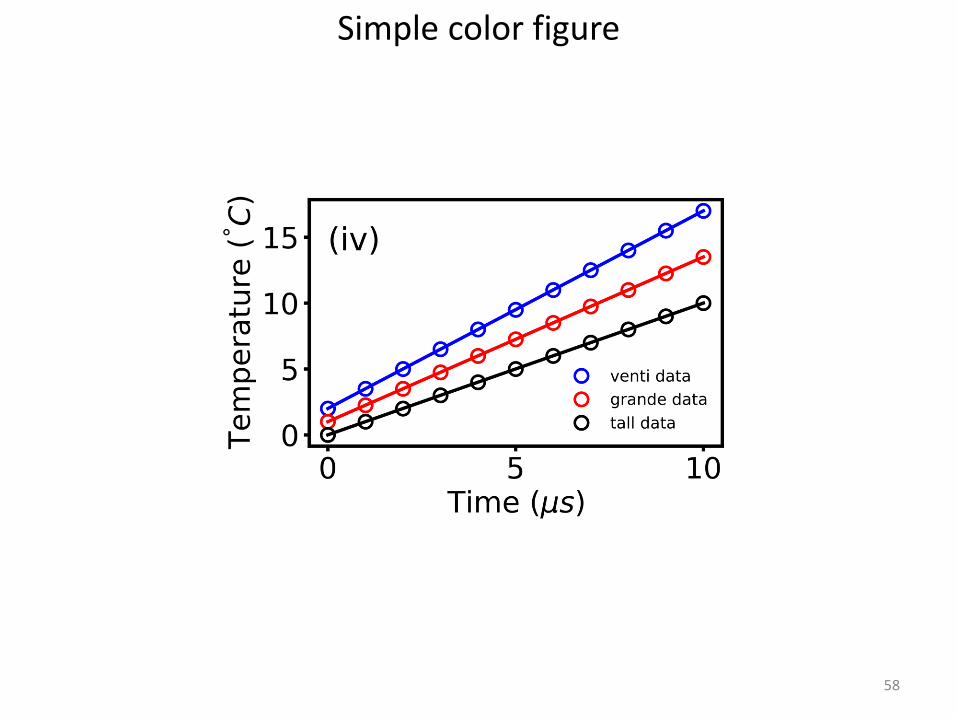
Simple color figure

59
Simple color figure

60
Density surface plots

61
Density surface plots

62
Density surface plots

63
3D surface plot
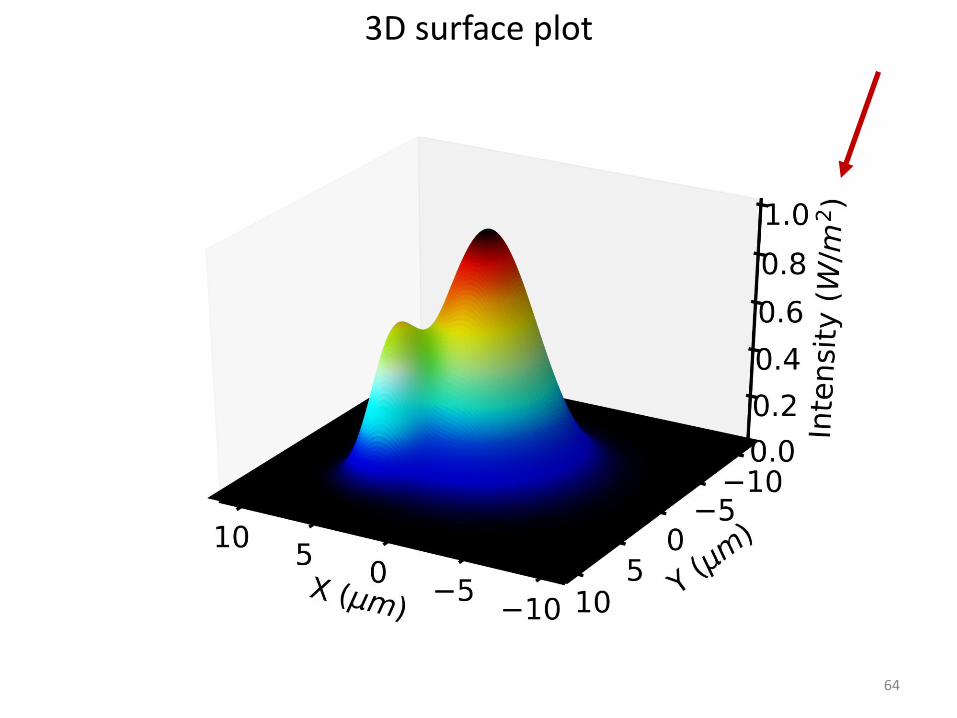
64
3D surface plot

65
3D surface plot

66
3D surface plot

67
3D surface plot

68
3D surface plot

69
3D surface plot
https://coldatoms-lab.com
You can find all the Python scripts used to make all the previous figures in my website
70
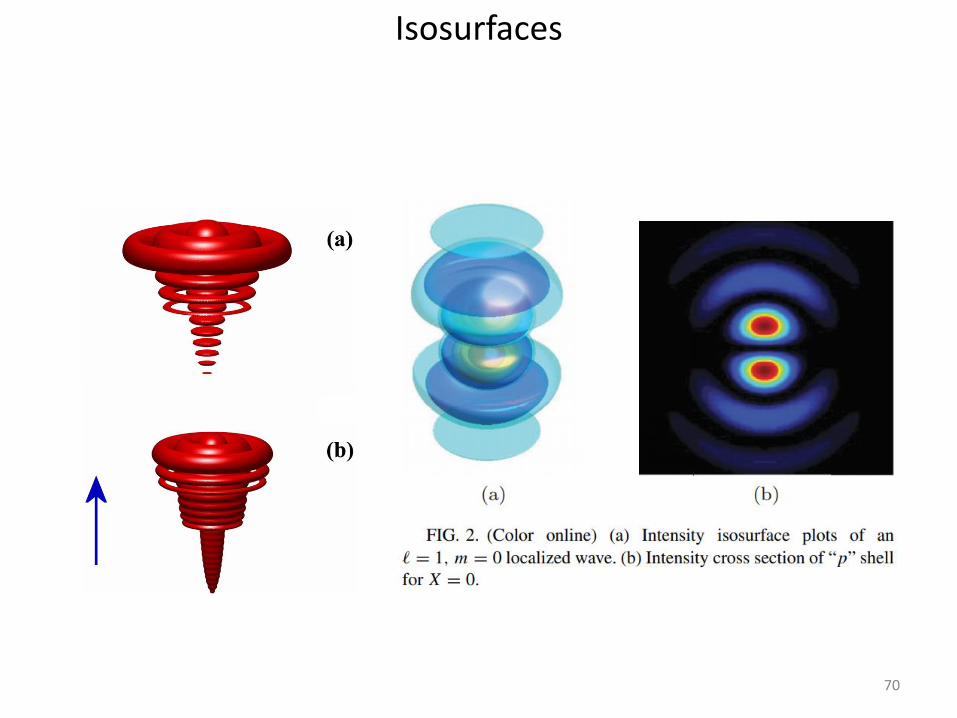
Isosurfaces

71
Isosurfaces
césar tomé
72
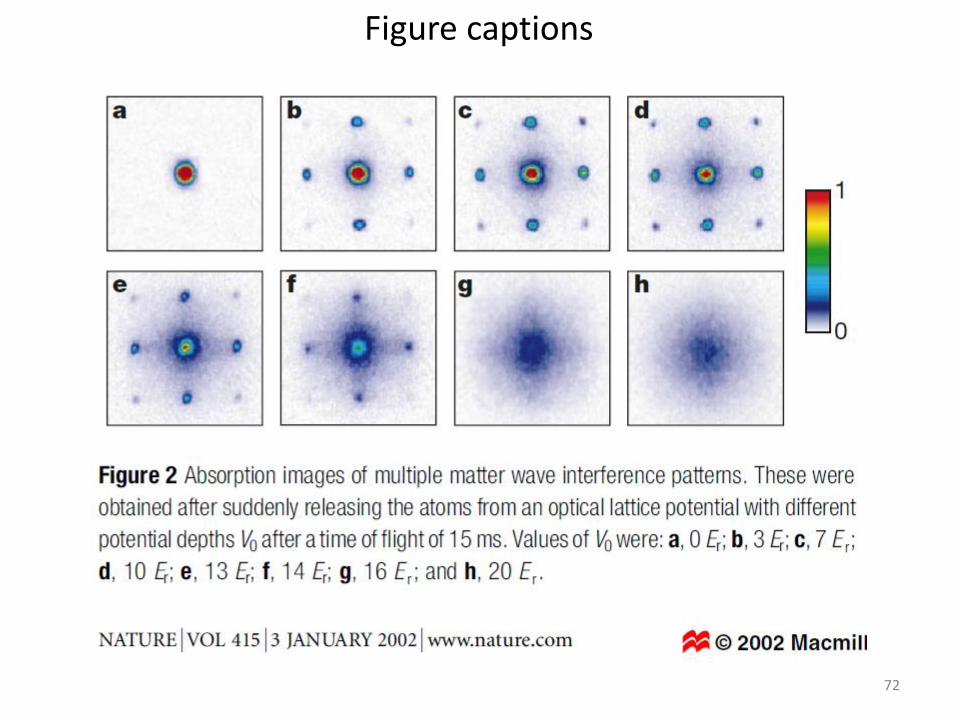
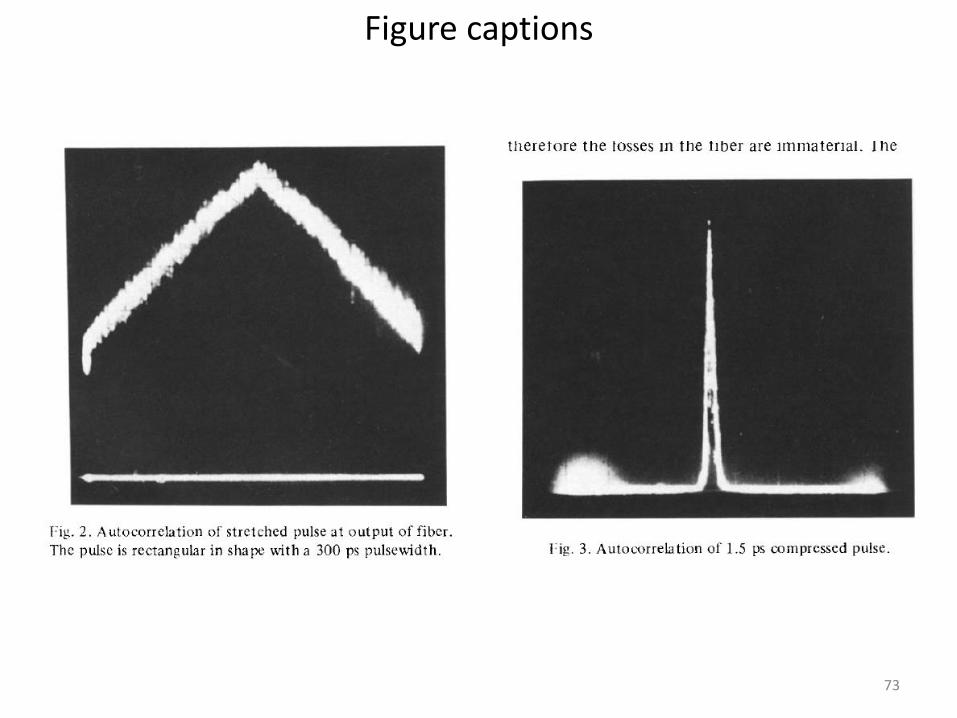
Figure captions
73
Figure captions

74
Figure captions

75
Avoid that
I prefer using white background for all my presentations
• The figure boxes should not be identical • The font colors to not need to be adjusted• It is familiar color scheme from the publications• The colors of the background will not fade out in unpredictable ways• Making graphs transparent creates a number of serious color problems

Georgios Siviloglou
Literature Research and Academic Writing
Southern University of Science and Technology (SUSTech),Shenzhen Institute for Quantum Science and Engineering (SIQSE)
14 November 2019
76
How to make a good figure