literacy and numeracy in the caribbean · part 2 literacy and numeracy in the caribbean ... we have...
TRANSCRIPT

Inter-American Development Bank Regional Policy Dialogue on
Education Caribbean Development Bank
Literacy and Numeracy in the Caribbean
Report of the Caribbean Subregional Meeting
December 2–3, 2008
Bridgetown, Barbados

Cataloging in Publication data provided by the Inter American Development Bank Felipe Herrera Library Literacy and numeracy in the Caribbean : report of the Caribbean subregional meeting. p. cm. This book is the product of a symposium held in Bridgetown, Barbados on December 2-3, 2008. 1. Literacy—Caribbean Area—Congresses. 2. Numeracy—Caribbean Area—Congresses. 3. Education—Social Aspects—Caribbean Area—Congresses. I. Inter-American Development Bank. II. Caribbean Development Bank. II. Regional Policy Dialogue (Bridgetown : 2008). LC155.C3 L58 2008 Copyright © IDB 2009 Inter-American Development Bank 1300 New York Avenue, N.W. Washington, DC 20577 The views and interpretations in this document are those of the authors and should not be attributed to the Inter-American Development Bank (IADB), or Caribbean Development Bank (CDB). This report may be freely reproduced provided credit is given to the Education Division - SCL, Inter-American Development Bank.

v
Contents
Foreword vii
Preface x
Acknowledgments xiv
Introduction 1
Part 1 The Importance of Basic Skills in Literacy and Numeracy
1 Hot Issues and New Research in the Teaching of Reading and Writing 7
Enid Martinez, Teachers College, Columbia University
2 Impacts of Literacy and Numeracy: The Australian Experience 18
John Ainley, Australian Council for Education Research
Part 2 Literacy and Numeracy in the Caribbean
3 Literacy and Numeracy in Select Countries of the Caribbean 44
Ana Cristina Accioly de Amorim, Consultant IDB/CDB
4 Explaining Gender Differences in School Performance throughout the Caribbean 95
Barbara Bailey, University of the West Indies
5 The Role of Language and Dialect in the Development of Literacy and Basic Skills in the Caribbean 116
Hazel Simmons McDonald, University of the West Indies
6 The Accomplishments of the Caribbean Center of Excellence for Teacher Training Project 143
Stafford Griffith, University of the West Indies
Part 3 International Assessment of Literacy and Numeracy
7 IEA’s International Assessments in Reading, Mathematics and Science: Specifications, Benefits, and Resource Requirements 163
Hans Wagemaker, International Association for the Evaluation of Educational Achievement
8 Progress in International Reading Literacy: The Trinidad and Tobago Experience 191
Harrilal Seecharan, Ministry of Education, Trinidad and Tobago

vi
9 Implications, Conclusions, and the Way Forward 205
Results of the closing session, facilitated by Jennifer Obidah, University of the West Indies
Appendixes
1 Agenda 214
2 Participants 217

vii
Foreword
The presence of the Inter-American Development Bank and the Caribbean Development Bank in Barbados is not new; both have worked collaboratively in Barbados over the past eight years or so in our Education Sector Enhancement Program. Therefore we are pleased that IDB and CDB chose our country to host a Regional Policy Dialogue on education. Both banks must be highly commended for having the foresight to commission this joint regional study of the current situation pertaining to literacy and numeracy in the Caribbean, issues critical to economic growth in the region.
UNESCO defines literacy as the ability to identify, understand, interpret, create, communicate, compute, and use printed and written materials associated with varying contexts. The Australian Association of Mathematics Teachers suggests that to be numerate is to use mathematics effectively to meet the demands of life at home, in paid work, and for participation in community and civic life. Numeracy is to mathematics as literacy is to language.
From these definitions emerge a picture of literacy and numeracy as the fundamentals of education and a means for social and human development. Such definitions are contextual and influenced by the practical necessities of life. In the area of literacy, for example, terms such as functional literacy, cultural literacy, quantitative literacy, and computer literacy, among others, have emerged in recent years, a direct result of attempts to articulate the higher demands of literacy imposed by contemporary society. Similarly, what sufficed for numeracy 20 years ago cannot be adequate today. The common calculator now includes keys for functions that were previously only understood by scientists and engineers.
The government of Barbados is convinced that the two basic skills of literacy and numeracy are the bedrock on which individuals’ intellectual development is based—the building blocks for structuring the vast architecture of knowledge. The Ministry of Education and Human Resource Development has recognized challenges among our students in both areas. These include the need for greater confidence in oral expression and the promotion of critical thinking skills in order to improve

viii
comprehension and problem solving. We have developed a national literacy policy, with activities aimed at improving the skills of our students in this area, and are aware of the need to engage in a similar approach to numeracy.
Now more than ever before in history, scientific and technologically driven societies are placing demands on their citizens to interpret and use mathematics in everyday life and in the workplace. Citizens of the 21st century use computers and cell phones. They budget, interpret information that is presented statistically, design plans, and so on. They must have basic quantitative skills if they are to participate effectively and equitably in their societies.
The findings of the regional study of which this volume is a part will identify best practices for the Caribbean and help regional governments and ministries of education chart paths and implement policies for the improvement of literacy and numeracy in our respective countries. It is imperative that educational theory and policy go hand in hand with relevant empirical findings as we assess the results of our developmental efforts so that we may make more effective use of our limited resources.
My government, including the ministry that I am honored to lead, is very cognizant of the critical role of education in the development of our country and our most precious resource—our people. We therefore welcome the opportunity to measure and compare the performance of our students with that of their regional and international counterparts. We look forward to participating in further research into literacy and numeracy in the Caribbean.
—The Honorable Ronald Jones, Minister of Education and Human Resource Development, Barbados, December 2, 2008

ix
At the podium, Deidre Clarendon, portfolio manager in the Social Sector Division, CDB, opens the conference by welcoming Ronald Jones (center), Minister of Education and Human Resource Development of Barbabos. Sharing the dais with them are Carlson Gough, director of the Projects Department at CDB; Marcelo Cabrol, chief of the education division at IDB; and Leyda Fajardo, coordinator of the Regional Policy Dialogue at the IDB.

x
Preface
Education is a primary social good and one of the top three areas of public expenditure in most countries. It is also one of the best pathways out of poverty. Students in the countries of the Caribbean no longer operate solely in the context of their local economies; the question, then, is how well the educational systems of the region are preparing these students to meet the demands of a global community. What are we getting in return for the significant public investments being made in education? How do we compare internationally? The sad fact is that too many Caribbean students finish primary school without acquiring levels of literacy and numeracy sufficient to equip them to succeed in secondary school or in an employment market that is increasingly complex and competitive.
No country—not even one rich in natural resources—can flourish without an educated populace. This is recognized by the countries of the region, and many have taken steps to improve literacy and numeracy. To build on their momentum, a collaborative effort must be made to marshal the intellectual, technical, and financial resources needed to overcome the obstacles to literacy and numeracy.
The education crisis is not limited to the Caribbean. In many other countries student performance is declining rather than improving. The silver lining to this dark cloud is the worldwide wave of talent that has been called forth to address the issue. Every country can benefit from the worldwide search for solutions to a common problem—and solutions do abound. The dilemma facing every country is finding those solutions that best fit its specific context.
The resources that have been brought to bear on the challenges of improving literacy and numeracy were on display in Barbados on December 2–3, 2008, as representatives of 19 ministries of education in the Caribbean joined the Caribbean Development Bank (CDB) and the Inter-American Development Bank (IDB) for the Caribbean Subregional Meeting of the Regional Policy Dialogue on Education, a mechanism of the IDB. The Barbados meeting and a regional study, of which this volume is one product, were cosponsored by the CDB and IDB.

xi
The conference was a productive exercise highlighting several initiatives and best practices from both developed and developing countries, with particular emphasis on the Caribbean experience. A significant number of the lessons we learned came from within the Caribbean region—a reason for optimism. What are some of these lessons?
We learned something of the creative ferment that characterizes literacy and numeracy education today, as educators in the industrialized world have risen to the challenges of improving literacy in real-life situations, integrating technology use in the classroom to inculcate so-called digital literacy, and designing schools where boys do as well as girls. Those challenges are being met through innovations such as ongoing professional development for teachers, often delivered by traveling mentors.
We learned from the Australian experience that literate students are more likely to complete secondary school and university; are less likely to be unemployed; and are likely to earn more, regardless of their background and credentials. We learned that Australia has integrated its literacy and numeracy plan into a national productivity agenda, clear evidence of that nation’s convictions about the centrality of education to national well-being.
We learned about the Center of Excellence in Teacher Training, a Caribbean regional initiative that offers training, instructional materials, and assessments while fostering collaboration among practitioners. Early results suggest that students in participating schools in eight countries have attained grade-level literacy. We eagerly await more detailed results from the initiative.
We learned about the path-breaking participation of Trinidad and Tobago in the 40-country PIRLS program of assessment of educational achievement. This accomplishment suggests that other countries of the region may be able to participate in PIRLS or other international assessments; however, substantial capacity building will be necessary.
We learned that socioeconomic status, more than gender, is a critical factor in determining differences in school performance. This suggests the need for a strategic and long-term approach to educational effectiveness that is integrated with other measures

xii
to address the structural and systemic problems confronting our youth, such as unemployment and the lure of crime.
We learned of the power of integrating the vernacular into the teaching of reading and writing, a practice that, by energizing children and unlocking their accumulated cognitive resources, improves literacy both in the vernacular and in the language of instruction.
We learned that the IDB has created a new Caribbean department and recast its education mission for the 26 countries of the subregion, a mission based on three vectors: early childhood development, greater teacher effectiveness, and preparation of students to thrive in the job market. This attests to the IDB’s desire to learn from experts on the ground how it can best contribute, through bettering education, to the achievement of the common goals of inclusive and equitable economic growth.
But the way forward is not simple.
Literacy and numeracy are not isolated challenges but are affected by a range of cultural and socioeconomic forces that if not addressed will continue to erode educational progress. The structural forces shaping trends in literacy and numeracy seem to suggest the need for a strategic approach—multiyear, multicomponent, and customized to regional needs. This may well have to be part of a larger initiative that addresses other forces that are shaping trends in educational performance. In order to gauge the progress of any strategic initiative, baseline data standardized to international norms are needed.
The collection and harmonization of such data pose a formidable challenge, as revealed in the preparation of the CDB/IDB regional study on literacy and numeracy. Good policy depends on accurate, timely information. If the statistical services of the region are to rise to the data-quality challenge, a program of capacity building may be needed.
Other challenges arise from the diversity and geographic dispersion of the region. Any regional approach—to data collection, assessment, or intervention—must contend with the variety of educational systems, as well as the social and linguistic differences, found within the region. Costly investments in books and software are of little use if their content is irrelevant to the people of the region.

xiii
A final challenge lies in the financing of education at current levels. Software, books, training, equipment, and facilities are costly to acquire. Curricular materials must be adapted to local circumstances—another substantial cost. But because education already accounts for such a large share of public budgets, it is perhaps not too much to hope that economies derived from harmonization and regionalization may provide some of the funding for the new initiatives that are so urgently needed.
—Marcelo Cabrol, chief, Education Division, Inter-American Development Bank
and Carlson Gough, director, Projects Department, Caribbean Development Bank
A fish-eye view from the back of the conference room in the Barbados Hilton, looking toward the dais.

xiv
Acknowledgments
The Caribbean Development Bank (CDB) and the Inter-American Development Bank (IDB) express their appreciation to the individuals who so ably prepared and delivered presentations to the conference: Enid Martinez, John Ainley, Cristina Accioly de Amorim, Barbara Bailey, Hazel Simmons McDonald, Stafford Griffith, Hans Wagemaker, and Harrilal Seecharan. Sincere thanks go, too, to the moderators who deftly guided the discussions: Idamay Denny, Glenroy Cumberbatch, Joan Cuffie, Marcellus Albertin, Martin Baptiste, Didacus Jules, and Jasper Lawrence. Jennifer Obidah facilitated the discussion session at the end of the two-day conference. We also wish to express our gratitude to the participants for giving of their time and participating so energetically in the dialogue. The success of the conference is, in no small measure, a result of their enthusiastic participation.
The Social Sector Division of CDB and the Education Division of IDB were the main agencies responsible for conceiving and managing the policy dialogue. The respective heads of those units, Yvonne Moses Grant and Marcelo Cabrol, provided support throughout the process. IDB’s Policy Dialogue initiative, managed by Leyda Fajardo and her assistant, Pabla Ayala, provided valuable support for the conference.
A special acknowledgment goes to Marcellus Albertin and Deidre Clarendon of CDB and to Sabine Rieble-Aubourg and Soledad Bos of IDB for conceiving, planning, and managing the conference. The assistance of the administrative staff of CDB and IDB is gratefully acknowledged. Thanks are due to other staff of CDB and IDB who contributed in one way or another to the conference.
Special thanks to Mr. Steven Kennedy who created the structure of this volume and prepared the contributed papers for publication.
Introduction
On December 2–3, 2008, the Caribbean Development Bank (CDB) and the Inter-American Development Bank (IDB) convened a symposium entitled “Literacy and Numeracy in the Caribbean” at the Hilton Hotel in Bridgetown, Barbados. About 55 senior education policy makers in the Caribbean region, including representatives from organizations such as the Caribbean Examination Council (CXC), the University of the West Indies (UWI) (all three campuses), and the Caribbean Community (CARICOM), attended. Other development agencies based in Barbados also participated.
The symposium was conceived against the background of a changing global environment that has brought major shifts in business and industry, in the organization of work, in the nature and content of jobs, and in the new occupational and skill requirements of the labor market. Recognizing these changes, Caribbean governments have come to the realization that workers must be more than functionally literate and numerate.
However, national assessment tests reveal that, in most Caribbean countries, a troubling share of students do not acquire basic competencies in literacy and numeracy in primary school and hence are not well prepared for the transition to secondary education. As most Caribbean countries have moved ahead with universal secondary education, students who do not perform well on the secondary education entry examinations are nevertheless placed in schools, most of which do not have appropriate programs in place to provide the additional attention and instruction that underperforming students require. As a result, many secondary school graduates fail to attain age-specific literacy and numeracy levels and are
The conference banner

LITERACY AND NUMERACY IN THE CARIBBEAN
2
often not well prepared for work. Drop-out rates at the secondary school level are therefore high.
Further, employers throughout the region complain that many young people do not possess the qualifications required for entry-level jobs, lacking basic skills in reading, writing, and mathematics. Cognizant of this challenge, a number of countries (if not all), have initiated and implemented projects that aim to improve literacy and numeracy. However because of the absence of verifiable data, information about their content and success is neither widely known nor easily accessible.
To get a better understanding of the current situation pertaining to literacy and numeracy in the Caribbean and to provide a basis for comparison regionally and internationally, CDB and IDB commissioned a joint regional study to inventory interventions targeting literacy and numeracy in the region and to assess the current status of literacy and numeracy among its primary and secondary students. CDB and IDB hosted a policy dialogue to discuss the findings of the study, to deliberate on the experience of other regions, and to define an appropriate framework for improving literacy and numeracy in the Latin American and Caribbean region.
This book emanates from that policy dialogue. It is structured in three parts, comprising nine chapters. The first part discusses the importance of literacy and numeracy and offers some basic concepts. It also provides an analysis of the relationships between literacy and numeracy and labor force participation rates and productivity. Part 2 focuses on literacy and numeracy in the Caribbean. The review presents a diagnostic of the current status of literacy and numeracy in nine Caribbean countries. It describes recent initiatives to improve literacy and numeracy skills and outlines the challenges specific to the Caribbean region in raising standards. Those challenges are:
• Low teaching quality
• Insufficient monitoring and evaluation of student performance
• Irrelevant curricula
• Unequal access to high-quality education
• Insufficient and inappropriate instructional material.

LITERACY AND NUMERACY IN THE CARIBBEAN
3
Part 3 discusses international assessments of literacy and numeracy. It describes the assessments provided by the International Association for the Evaluation of Educational Achievement (IEA) and the experience of Trinidad and Tobago in the PIRLS 2006 study, which measured progress in international reading literacy in primary schools in 40 countries. This part provides invaluable insights and lessons about the development of test instruments, the impact of participation on local capacity to conduct assessments, and the technical support needed for effective participation. The last chapter of part 3 summarizes the proceedings of the policy dialogue and suggests a way forward.
The recommendations developed during the symposium are expected to allow both CDB and IDB to continue the dialogue with their partners and the collaborative approach that made this symposium on literacy and numeracy so productive. We also anticipate an opportunity to continue to work with the member states of both organizations in formulating and implementing policies and programs in education and, more specifically, to find new ways to improve the teaching/learning dynamic and so address the contentious issue of deficits in literacy and numeracy among our students.
Both organizations will continue to play an important role in improving educational outcomes in the region. Over the past two decades CDB has spent more than US$300 million in the education sector. A substantial share of that sum has been allocated to enhancing quality through better teacher education and training, early diagnosis of problems, and more and better instructional materials. Because the CDB’s focus has been to improve outcomes
IDB education chief Marcelo Cabrol welcomes the participants in the Caribbean Subregional Meeting of the Regional Policy Dialogue. To his left, Leyda Fajardo and the Honorable Ronald Jones.

LITERACY AND NUMERACY IN THE CARIBBEAN
4
in the sector, its interventions have balanced development of the physical learning environment (school buildings, labs, and so on) with the teaching and learning dynamic (that is, what takes place in the classroom). CDB has renewed its emphasis on interventions such as remedial and accelerated learning and the infusion of technology in the education process.
— Leyda Fajardo, coordinator, Regional Policy Dialogue, Inter-American Development Bank
and Yvonne Moses Grant, chief, Education Division, Caribbean Development Bank

Part I
The Importance of Basic Skills in Literacy and
Numeracy


Chapter 1 Hot Issues and New Research in the Teaching of Reading
and Writing
Enid Martinez
Enid Martinez works in the Reading and Writing Project at Teachers College, Columbia University. The project has been a premier provider of professional development for schools in New York City and elsewhere for more than two decades. Its mission is to support expert literacy instruction in schools through research, collaboration, and professional development.
Ms. Martinez brings years of work as a coach with the Literacy Collaborative and as a bilingual primary teacher to her role at the Reading and Writing Project. She has facilitated the project’s close collaboration with Words Their Way and other approaches to phonics. She leads an assistant principal study group and a specialty course on word study.
Ms. Martinez holds a master’s degree from Teachers College and is working on a book on word study.
The Reading and Writing Project (RWP) of Teachers College, Columbia University, is a center for the accumulation, analysis, and dissemination of worldwide research and practice in the teaching and learning of reading and writing. The project exists to make teachers more effective by equipping them with tools adapted to the circumstances in which they teach. The tools may not always be new (although part of the job of the RWP is to keep up with the latest research), but they are often new to the teachers we visit, who may not have the time or the means to stay abreast of the latest innovations in pedagogy, or of assessments of current practice.
We ensure that our advice is well-adapted to our audience of practitioners by visiting our clients. We observe them in their

LITERACY AND NUMERACY IN THE CARIBBEAN
8
classrooms, assessing the challenges they face and shaping our recommendations and assistance accordingly. The RWP, headquartered at one of the world’s great universities, operates at the hub of dynamic networks of knowledge. But I, and other members of the RWP staff, spend most of our time far from the hub, in locations that, but for our presence, might be largely disconnected from vital new developments in the teaching of reading and writing. As itinerant coaches, circuit riders, we draw on a vast pool of knowledge to serve individual clients with very specific and very different circumstances. Our constituents are far-flung—divided, if not by water, as in the Caribbean, then by distance, tradition, or other circumstances.
The research base for the assistance we provide
Our Units of Study programs for primary and intermediate grades emerged from RWP’s in-school research and practice in New York City schools over a period of more than 10 years. Schools that work with RWP join with professional Teachers College educators in a study of the art of teaching writing. Together they study the techniques of master writers. Together they study the individual students in a teacher’s classroom. And together they create a curriculum to raise the level of students’ writing. The RWP writing workshop model that evolved from that process is the foundation of Units of Study. Its theory of teaching is based on fostering independent writers and lifelong learners. What it offers to schools is somewhat different from what more traditional writing programs may offer.
No single string of sequenced lessons can suit the needs and circumstances of every classroom. The lessons must be responsive to the individual needs of the writers in each class. On the other hand, the people of the RWP do believe in strong models of excellent instruction for teachers. The sample curricula offered in Units of Study for Primary Writing: A Yearlong Curriculum (Calkins 2003), and Units of Study for Teaching Writing, Grades 3-5 (Calkins and others 2006) provide just such a model. Detailed descriptions of each unit, supporting lessons, and various other supports for grades K-8 are available on the RWP Web site at www.readingandwritingproject.com.
Both the sample curriculum in Units of Study and the supplements on the project Web site are grounded in student work

LITERACY AND NUMERACY IN THE CARIBBEAN
9
and intended to be tailored and adapted to specific children and classrooms. Both forms of curricular support offer several methods of assessment and recommendations for bends that teachers may take in the units based on what they learn about their students through assessments—thus assuring a student-centered curriculum.
Units of Study—in fact all the pursuits of the RWP—are based on a handful of fundamental, research-based principles.
Research principle 1: There are fundamental traits of all good writing, and students write well when they learn to use these traits.
The foundation of Units of Study lies in the understanding that writing is a lifelong process during which we continually lift the level of our writing skills and outgrow ourselves as writers. Students learn that all writing has essential traits to which they must attend when developing a composition (Spandel 2001). Writers learn multiple ways to find topics they wish to write about. They learn to make purposeful decisions about the structure and organization of a piece. They learn a repertoire of methods for elaborating. They learn to craft their pieces using literary language and devices, and to employ the conventions of written language (Anderson 2005; Calkins 1994; Elbow 1989; Graves 1994; Wood Ray 1999).

LITERACY AND NUMERACY IN THE CARIBBEAN
10
Units of Study is organized into a system of monthly units that move students through both narrative and expository writing each year. In the primary grades, students begin acquiring a repertoire of writing skills to write in many genres. The upper and middle grades revisit and reconstruct these in more formal and purposeful ways (Bruner 1960).
Trait-based writing instruction has been shown to raise student performance on standardized writing tests (Jarner and others 2000). Most states have adopted some form of writing assessment on their annual tests (Spandel 2001). By teaching students ways to clearly reveal their meaning, to structure their writing in accordance with the genre and in ways that affect their reader, to elaborate using a wide repertoire of techniques, to use literary language and devices to make artful pieces of writing, and to use the conventions of written language, Units of Study strengthens the skills of young, apprentice writers and prepares them for academic success. As writers build their knowledge of each trait of writing, they become critical readers of their writing and to set an agenda for themselves and in conjunction with their teacher (Anderson 2005; Graves 1994).
The conventions of written language thread throughout each of the units. Writers learn conventions that they can practice in the pieces they are writing and learn how using those conventions can help them better convey their meaning (Atwell 1998; Calkins 1994; Graves 1983; Weaver 1997). Research has shown that to be effective, the conventions of writing must be taught within the context of a writer’s own writing (Anderson 2005; Ehrenworth and Vinton 2005; Hillocks 1986; Weaver 1997; Wilde 2007).
Enid Martinez of the Reading and Writing Project at Teachers College, Columbia University

LITERACY AND NUMERACY IN THE CARIBBEAN
11
Research principle 2: Using a writing process to teach the complex task of writing increases student achievement.
Just as professional writers have a process for developing their work, young apprentice writers also benefit from a clear process through which to develop their writing (Atwell 1998; Calkins 1994; Elbow 1981; Fletcher 1993; Graves 1994; Murray 1984). Each unit in Units of Study begins with generating ideas for writing. When writers have collected a number of possibilities, they learn ways to choose one idea and begin developing and rehearsing that idea to prepare for the specific genre in which they will be writing. They learn to draft, using techniques of structure and elaboration appropriate to that genre. Writers then learn ways to revise their writing using structure, elaboration, and literary craft to further reveal their meaning. Next, writers learn to edit their pieces. Finally, writers publish their work to share with a community—either their class, their school community, or a community outside their school. Research shows that using a writing process for instruction in the complex task of writing increases student achievement (Hillocks 1986; Holdzkom and others 1982; Keech & Thomas 1979).
One of the fundamental components of the RWP writing process is offering choice to students. Students learn strategies for finding their own topics or ideas for their writing. They learn to set a clear and purposeful meaning they want to convey and multiple ways to structure and craft their piece to reveal that meaning.
Research principle 3: Students benefit from teaching that offers direct instruction, guided practice, and independent practice.
In years past, it was thought that teaching creative writing came from having creative lesson plans. Many of us thought that to be creative we needed ever-changing, complex, and stimulating environments. Each day the structure was different, the work was different. The classroom was a whirlwind, a kaleidoscope, and teachers felt very creative. The days were filled with teachers planning, experimenting, revising their plans, and experimenting more. Meanwhile, the students waited on the changing agenda. They were not able to plan their own writing, set their own agenda, or take charge of their own learning. Instead they drifted in the wind of kaleidoscopic complexity (Calkins 1994). We now know that

LITERACY AND NUMERACY IN THE CARIBBEAN
12
for writers to develop their own agenda and make their own plans for writing, they benefit most from predictable and simple structures in the writing workshop (Calkins 1994; Graves 1994; Short, Harste, and Burke 1996).
The Units of Study writing workshop has three basic structures—the mini-lesson, independent writing time with conferences and small-group work, and sharing sessions at the end of the writing time. These structures support the basis of the writing instruction—providing direct instruction, guided practice as students begin trying their hand at the new learning, and finally independent implementation of the strategies (Vygotsky 1978).
The mini-lesson offers students direct instruction on an explicit strategy for writing. The strategies for each day are selected by teachers based upon what their assessments have revealed that writers need. During the mini-lesson, students are asked first to observe a demonstration of the strategy, and then to try a bit of that strategy right there during the lesson. This is a quick, guided practice for students in which they can receive immediate feedback from both their classmates and their teacher. The mini-lesson is short, usually around ten minutes long (Calkins 1994; Fletcher 1993; Graves 1994).
Students then move into their independent writing time, which constitutes the bulk of time in the writing workshop. Students independently practice the strategies for writing they have learned in their writing workshop. During this time, the teacher confers individually with students or meets with a small group of three to six students. Conferences and small-group work provide students with individualized instruction based on each student’s need. They receive both direct instruction and guided practice time during these sessions (Atwell 1989; Anderson 2000, 2005; Calkins 1994; Graves 1994).
The sharing session at the end of class provides students with an opportunity to share and support work in progress. Students may share their writing with a partner or small group and get feedback on a question they pose to them. The teacher may use the sharing time to teach an additional lesson that builds on or further develops the strategy introduced during the mini-lesson. The class may come together to look at a piece of professional writing and read it together to gather ideas for what they themselves might try in their own pieces. Ultimately, the sharing

LITERACY AND NUMERACY IN THE CARIBBEAN
13
session is a time for writers to come together to share their writing, explore possibilities, and make plans for what they will do next with their writing (Calkins 1994).
Research principle 4: To write well, writers need ample time to write every day.
Writers need to write frequently and in many different genres to gain independent control of what they are learning about writing well. The National Reading Panel (2000) reiterated this point. Writers need frequent opportunities to practice their craft, learning how to think and write in many genres for many purposes (Atwell 1989; Calkins 1994; Fletcher 1993; Graves 1983, 1994). RWP’s Units of Study provides for extended daily practice of writing. During this time, students work independently on their writing, putting into practice all that they are learning about how to stretch themselves as writers. Students also receive additional instruction during this time, either in one-on-one conferences or in small groups, to specifically tailor the teaching to the individual needs of each writer (Anderson 2005; Calkins 1994).
Research principle 5: A well-rounded curriculum provides supports for struggling writers and those learning English.
In years past, one approach to supporting struggling writers was to slow down instruction, remove parts of the curriculum, or teach an alternate curriculum. Allington and Walmsey (1995) found that these practices resulted in compounding the delays—as the curriculum was slowed or less was taught, students fell even further behind.
Because Units of Study is centered on teaching to the individual needs of student writers, each unit offers bends and turns to support the multiple needs of the many writers in each classroom, including strugglers. The curriculum suggests multiple ways to teach each skill, as well as multiple ways to offer repetition, if needed (Calkins 1994; Graves 1994; Wood Ray 1999).
Teachers may opt to begin the year using the K–8 Continuum for Assessing Narrative Writing, available to all schools on the RWP Web site. This assessment tool helps teachers identify the particular strengths of a student writer and to place her on a scaled level of writing development. By looking ahead to the

LITERACY AND NUMERACY IN THE CARIBBEAN
14
qualities of writing expected at the next level, teachers can make an individual learning plan for that student. Teachers can teach qualities of writing in whole-group lessons, small group lessons, or individual conferences. The teacher can tailor teaching to the specific, individual needs of all the students in the class (Anderson 2000; Calkins 1994; Graves 1994).
Research principle 6: Writing and reading are joined processes, and students learn best when writing and reading instruction are coordinated.
Throughout most of the units in Units of Study, the reading and writing work is directly correlated. Ongoing, built-in book study provides exemplary texts on which students model their own writing. In reading, students learn to make meaning from published authors’ writing; in writing, students learn to write so as to convey meaning to their readers. For example, if students are learning in reading to stop after dialogue and notice what that dialogue reveals about the characters who are speaking, then in writing students will learn to reveal their characters’ traits by crafting dialogue that reveals those traits. In short, students learn to implement in their own writing the same things that they are learning to interpret in their reading.
Students also learn to mentor themselves by studying the writing of others. They look closely at the writing of published authors they admire in order to learn ways to develop meaning, to structure their piece, to find devices that they can try in their own writing, and to study the ways other authors use conventions of written language that they, too, can try (Anderson 2000, 2005; Calkins 1994; Murray 1990).
When and where: How the Reading and Writing Project works
During the school year. We usually support a school by returning at intervals across the school year. For example, we may work with a school in mid-September, early October, early December, mid-February, and early June. If the school is far from New York City, those visits tend to be two days at a time, in which case we offer to stay late on the first day, giving after-school

LITERACY AND NUMERACY IN THE CARIBBEAN
15
workshops or working with administrators. The schedule is organized at the start of the school year, and we try to coordinate the work so that the K–2 consultant and the 3–8 consultant alternate their visiting times to provide support across as much of the year as possible. Of course, there are contacts between visits, and if members of a client school community come to New York during the year, we try to support and participate in those visits.
Always our goal is to support a culture of professionalism and teamwork at the school, in recognition that our presence will inevitably be limited. Our job is to put ourselves out of a job.
Over the summer… Teachers and leaders from schools with which we work closely usually come in large numbers to the institutes that we lead every summer in NYC. At those institutes, people reconnect with their staff developers and gain access to a larger community and many new ideas. We strongly recommend that school districts send teacher-leaders and literacy coaches, especially, to these “mother institutes.”
Every summer we also lead “home-grown institutes.” These are held on-site in clients’ schools. Usually a home-grown institute will be 4–5 days long and focused on either reading or writing. These institutes are not unlike the institutes that we provide at Teachers College, without the keynote speakers. Usually they are part of a larger package of staff development, with the summer workshops allowing for intellectual study that propels much of the yearlong work. Some summer institutes serve as few as 25 teachers; others, 800 teachers. Our availability for on-site institutes is limited, because they are very popular.
Year-round participation in the community. We provide ongoing, updated resources that we hope will be helpful to a particular school. These materials are often in draft form, undergoing continual revision. We find it helpful for teachers and leaders at a school to work with tools that are in pilot form. Doing so means, first of all, that the school has early access to ideas, long before they are published (and expensive). The fact that the tools and resources are open to revision also allows those who work with them to add their own imprint and to contribute to the state of knowledge. Teachers in one part of the world may well benefit from what teachers in another part of the world are doing. To facilitate the sharing of knowledge and to help schools forge links, we provide access to the full RWP Web site.

LITERACY AND NUMERACY IN THE CARIBBEAN
16
The RWP provides an especially large amount of support to schools in the suburbs of New York City and to schools in major cities. We also work with schools in most of the states of the United States. Our international work has taken us to Austria, the Caribbean, China (Beijing, Hong Kong), Ethiopia, France, Israel, Jordan, Mexico, the Netherlands, Sweden, Syria, and the United Kingdom, among other places.
RWP charges a per-day rate, plus expenses. The rate varies based on several factors. For example, we charge more for free-standing days than for ongoing work. We work with clients to hold expenses to a minimum.
RWP always has a waiting list—but we are able to provide support for many, many schools on that wait list. For example, we are almost always able to provide a day or two of service to support the use of our Units of Study curriculum (published by Heinemann.) Mostly, however, our work involves a deeper commitment to a school or district. Decisions to take on new work are usually made in the spring.
The schools with which we work become affiliated schools and are given access to all of our resources. Affiliated schools are guaranteed seats at RWP summer institutes. Most years, we hold an affiliate conference and invite leaders from participating schools. At the annual conference, principals, board members, and superintendents from 60+ schools gather in New York City to visit schools and to learn from one another. The cost is modest, apart from travel and lodging.
Three modes of practice
In our visits, we are usually asked to help across all grades in both reading and writing. Ideally our work is shared between two traveling consultants, one with expertise in grades K–2 and one with grades 3–8. Occasionally a client school may ask for help with either reading or writing, and sometimes may spotlight K–2, 3–5, or 6–8. Our preference is to work in systemic, whole-school ways, but sometimes it makes sense to begin with a focus.
Most schools ask us to support teaching and learning through a combination of three modes of practice: in-classroom lab sites, on-site workshops, and administration support.

LITERACY AND NUMERACY IN THE CARIBBEAN
17
In-classroom “lab sites.” In this mode, we work in classrooms with many teachers present, doing our own version of demonstration teaching, combined with coaching. A staff developer might work from 9:00 to 10:00 am in a fourth-grade classroom, helping 4–8 teachers from grades 3–5 learn to conduct assessment-based conferences and do small-group work. The staff developer takes time to talk with the participating teachers before or after the lab-site. Then he or she may lead similar work with another group of teachers, but this time at a different grade level or emphasizing different teaching skills.
On-site workshops. We often lead on-site workshop sessions. If the RWP staff developer worked in the morning in two lab-site classrooms (as described above), he or she may spend the afternoon leading a workshop on upcoming units of study in reading and in writing. Alternatively, the afternoon workshop may address teaching methods, perhaps spotlighting guided reading and small-group strategy lessons, or the use of mentor texts to lift the level of student writing.
Administration support. During any visit, the RWP staff developer will want access to on-site literacy coaches, school leaders, and teacher-leaders. Staff developers who are able to spend some time in classrooms will get a sense of what is working for the school and of what might be done to improve things. It is helpful if the staff developer can pass insights and suggestions along to someone in a position to support change in the school. For example, during one visit the staff developer’s focus may be on reading and writing historical fiction, but in the course of the visit he or she may have thoughts about the nonfiction reading being done in social studies. The staff developer might then suggest some next steps and resources that could be helpful. Leaders in different schools often face similar challenges, and when there is time in person or on the telephone to talk about those challenges, staff developers can usually help a school’s leaders know how others have responded to similar challenges, and suggest contacts and resources that might be helpful.

Chapter 2 Impacts of Literacy and
Numeracy: The Australian Experience
John Ainley
Dr. John Ainley is deputy CEO for research at the Australian Council for Educational Research and research director of ACER’s National and International Surveys Program. His research areas include post–compulsory education and training, information and communication technology in education, and longitudinal research methods to study the development of literacy over the first five years of school.
Australia has a population of 21 million in an area of 7.7 million square kilometers. Although the overall population density is low, it is a highly urbanized society. Outside the cities, the country is sparsely populated; 30 percent of primary schools have fewer than 100 students and 30 percent of secondary schools have fewer than 500 students. Australia is classified as a high-income country, literacy among adults is nearly universal, nearly half of the population has completed secondary school, and 32 percent hold a university qualification. Although the Australian population is mainly of European background, immigration has produced considerable ethnic and cultural diversity. One-fifth of the population (22 percent) was born overseas, and a similar percentage (21 percent) speaks a language other than English at home. About 4 percent of Australian school students are indigenous and some of them live in geographically remote communities.
Australia does not have a single national education system. Each state and territory is responsible for its own educational administration—although the overall structures are similar. Ministers of education meet in a council to collaborate on policy

LITERACY AND NUMERACY IN THE CARIBBEAN
19
matters. State education departments recruit and appoint teachers to government schools; supply buildings, equipment, and materials; and provide limited discretionary funding for use by schools. Commentators note that centralized administrative structures emerged historically to promote the uniformity of educational provisions across a dispersed population. But in most jurisdictions, some responsibility for administration, staffing, and curriculum has devolved to regional offices and schools. The extent of devolution varies among jurisdictions. It is important to remember that nongovernment schools enrolled 33 percent of students in 2007 (29 percent of primary school students and 38 percent of secondary school students), a proportion that has risen steadily since 1970.
Although there is no national school curriculum, there is wide agreement about the content that should be covered in schooling. In 2008 a National Curriculum Board (NCB) was appointed to develop national frameworks, initially in English, mathematics, science, and history. The central authorities within states and territories specify curriculum and standards frameworks; but schools have autonomy in deciding curriculum details, textbooks, and teaching methodologies. Curricula for grades 11 and 12 are specified by the state authorities responsible for examining and certifying student achievement (for both government and nongovernment schools).
Dr. John Ainley (right), deputy CEO for research at the Australian Council for Educational Research, listens as he is introduced to participants by Glenroy Cumberbatch of the Caribbean Examinations Council.

LITERACY AND NUMERACY IN THE CARIBBEAN
20
Education is compulsory from 6 to 16 years of age, with several states having now extended the age of compulsory schooling. Most children start primary school at 5 years of age and continue to grade 6 or 7 (depending on the state), completing primary school at the age of 11 or 12. Students in Australian primary schools usually have one teacher for most subjects and are promoted to the next grade each year. Secondary education is provided for either five or six years, depending on the length of primary education in the state. The first two years of secondary school typically consist of a general program followed by all students. In subsequent years, a basic core curriculum is supplemented with optional subjects. Students in secondary schools generally have different teachers for separate subject areas. In the final two years of secondary school, students have more scope to specialize, typically choosing five or six subjects from a range of elective studies. One of the most marked changes during the 1980s was an increase in the percentage of students who completed secondary school. The percentage of secondary school starters remaining through the final year rose from 35 percent in 1980 to 77 percent in 1993. It has since declined to 74 percent in 2007 (Australian Bureau of Statistics, ABS, 2008).
Impacts of literacy and numeracy
Longitudinal surveys of Australian youth
During the 1970s, two of the major education policy issues concerned standards of literacy and numeracy and the transition that young people made from school to work or further study. As a consequence of the first of these concerns, in 1975 the Australian government introduced a national sample-based assessment of literacy and numeracy among 10- and 14-year-old students (Keeves and Bourke 1976). The national assessment was then repeated in 1980. Subsequently, samples of 6,000 students in each cohort provided the basis of the LSAY as they moved through secondary school, into further education or training, and into the labor market and adult life. These surveys were first called Youth in Transition (YIT); during the 1990s they became known as the Longitudinal Surveys of Australian Youth (LSAY).
The LSAY focus on the progress of young Australians as they move from their mid-teens to their mid-twenties, from their initial education to their independent working life. These

LITERACY AND NUMERACY IN THE CARIBBEAN
21
surveys involve large, nationally representative samples of young people from whom data are collected each year about education and training, work, and social development. Longitudinal studies such as the LSAY give a clear picture of what young people are doing at any point of time, the pathways they took to get there, and the factors that influence their progress. The capacity to follow the same young people over time means that factors influencing their pathways and outcomes can be identified, and changes in the educational and employment experiences of the successive groups can be tracked. The LSAY provide descriptions of what young Australians are doing as they negotiate the transition from school, document changes as they grow older, and enable comparisons with other groups. Issues investigated in the LSAY project include school completion, participation in vocational and university education, employment, and well-being. The program encompasses three main areas of interest:
• Education and training outcomes, including participation in various types of institutions, non-completion of studies, attitudes toward school and learning, subject choice, student performance, on-the-job training, and lifelong learning
• Labor-market outcomes, focusing on areas such as labor-force participation, unemployment, income, occupational segregation, and career pathways
• Social outcomes, including well-being, leaving home, relationships and marriage, housing, and family formation
Survey design
Longitudinal data facilitate causal interpretations of research on transitions and growth. The accrual of data over time on the same group of young people enables progressively more comprehensive analyses to be conducted to identify influences on outcomes. Most important, it is possible through the various forms of regression analysis to determine the net effects of a variety of factors on outcomes. In addition, multiple longitudinal surveys such as the LSAY contribute to an understanding of changes over time and how these changes affect young people as they age. This is especially important for understanding how policy initiatives influence the longer-term outcomes of further education and training on the labor market.

LITERACY AND NUMERACY IN THE CARIBBEAN
22
Certain design features in the LSAY distinguish it from longitudinal studies in Australia and other countries.
Initial contact is made during compulsory schooling, when information about students’ performance in literacy and numeracy is collected. In addition, extensive background information and school-related data are collected. After that initial contact, data are collected annually (in the early surveys this was performed by questionnaire, but in later surveys this was done by computer-assisted telephone interviewing).
Information about the period and age ranges covered by the various surveys is displayed in figure 2.1. The four YIT cohorts are young people born in 1961 (“C61”), in 1965 (“C65”), in 1970 (“C70”), and in 1975 (“C75”). The LSAY cohorts are designated by the year in which they were first contacted: 1995 (Y95), 1998 (Y98), 2003 (Y03), and 2006 (Y06). The Y95 and Y98 cohorts were sampled as students from grade 9, but the Y03 and Y05 were sampled as 15-year-olds from the Program for International Student Assessment (PISA) in those years (most 15-year-olds are in grade 10).
Figure 1 Longitudinal youth cohorts 1975–2008, and projected 2009*
Program Cohorts 1975
19
76
1977
19
78
1979
19
80
1981
19
82
1983
19
84
1985
19
86
1987
19
88
1989
19
90
1991
19
92
1993
19
94
1995
19
96
1997
19
98
1999
20
00
2001
20
02
2003
20
04
2005
20
06
2007
20
08
2009
Youth In transition
C61 14 17 18 19 20 21 22 23 24 25 26 27 28 29 30 31 32 33
C65 10 16 17 18 19 20 21 22 23 24 25 26 27 28 29 30
C70 10 15 16 17 18 19 20 21 22 23 24 25
C75 14 15 16 17 18 19 20 21 22 23 24 25 26 27
Longitudinal surveys of Australian
youth
Y95 14 15 16 17 18 19 20 21 22 23 24 25
Y98 14 15 16 17 18 19 20 21 22 23 24
Y03 15 16 17 18 19 20 21
Y06 15 16 17 18
Y09* 15
Note: Each bar shows the ages at the beginning and the end of each cohort. For the first two YIT cohorts (C61 and C65), school achievement data were collected in 1975 at ages 14 and 10, respectively. For the C70 YIT cohort, school achievement data were collected in 1980 at age 10. Information from 2009 onward is indicative.
The focus of data collection differs according to the levels of education and employment participation at different ages. At age 17, for example, more than 70 percent of young Australians are in year 12, and the survey requires a strong emphasis on school-related activities. By age 19, when around 50 percent are undergoing post-school education and training, the survey needs

LITERACY AND NUMERACY IN THE CARIBBEAN
23
to reflect the variety of courses in which students are enrolled. By age 25, when fewer than 10 percent are enrolled in education and training and about 65 percent are in full-time employment, questions about job mobility, job-based training, and social transitions become more important.
Major findings
Changes in literacy and numeracy over time
The tests from 1975 to 1998 were similar enough that scores could be directly compared by using Item Response Theory to equate the tests around the linked items. Strikingly, there was no overall change in the literacy scores over this 23-year period. The percentage of students who achieved mastery in literacy—a level that would enable them to function in adult society—remained constant, at 70 percent. The reading comprehension and mathematics scores of 14-year-olds, as a group, also remained constant (Rothman 2002). Changes occurred in the relative performance of males and females on the literacy test. While the 14-year-olds’ performance remained constant as a group, the males’ scores decreased while the females’ scores increased (Rothman 2002).
Factors related to literacy and numeracy achievement
The strongest individual correlates of achievement are socioeconomic background, indigenous status, educational aspirations, and gender (Rothman and McMillan 2003).
Students with parents in professional or managerial occupations scored higher than those whose parents were in clerical, sales, or service jobs. These students, in turn, scored higher than those with parents in trade occupations or whose parents were production workers or laborers (Rothman 2002).
Indigenous students performed significantly lower than non-indigenous students on literacy and numeracy tests in both 1995 and 1998, and the average literacy level for indigenous students in the remote areas was substantially below that of indigenous students in other areas (Jones 2002). In addition, the percentage of indigenous students attaining mastery in numeracy improved greatly over the long term, from 22 percent in 1975 to 65 percent in 1995 (Marks and Ainley 1997).

LITERACY AND NUMERACY IN THE CARIBBEAN
24
Students with plans to attend university scored significantly higher on both the reading comprehension tests and the mathematics tests.
Students had lower literacy and numeracy scores if they or their parents were born in a predominantly non-English-speaking country, but the achievement gap between them and other students substantially narrowed (especially in numeracy) over the period from 1975 to 1998 (Rothman and McMillan 2003).
Gender was shown to influence both the literacy and numeracy achievement levels: males scored higher than females in numeracy, and females scored higher than males in literacy.
Data from the Y95 and Y98 cohorts showed that about one-sixth of the variation in the literacy scores could be attributed to differences among schools. Students with higher literacy and numeracy scores came from schools with higher socioeconomic status, fewer students from non-English-speaking backgrounds, and a positive school climate (Rothman and McMillan 2003).
Influences of literacy and numeracy on later participation in education
The level of literacy and numeracy achieved in early secondary school is a major factor contributing to later patterns of participation in education over and above the influence of associated background factors such as socioeconomic status.
Completing high school
Achievement levels in literacy and numeracy among the 1995 grade 9 cohort showed a strong relationship with high school completion (Fullarton and others 2003; McMillan and Marks 2003; Le and Miller 2002). Those with lower literacy and numeracy levels were substantially more likely to leave school before grade 12; this was especially true among boys. In the Y98 cohort, 93 percent of the top quartile of achievers in literacy and numeracy completed grade 12, compared with 62 percent of the bottom quartile. Even though this association weakened over the period 1980–2001 (for the cohort reaching grade 12 in 1980, the difference was 67 percent compared with 10 percent), literacy and numeracy levels remain a major influence on school completion.
Multivariate analysis confirms this influence. The logistic regression analysis expresses the effect on participation (other things equal) in terms of the difference that a one-standard-

LITERACY AND NUMERACY IN THE CARIBBEAN
25
deviation change from the mean makes in achievement. For example, in 1980 the effect of being one standard deviation from the mean yields a coefficient of 1.05, which translates to an odds ratio of 2.9. By 2001 the odds ratio of this effect had dropped to 2.0. This demonstrates that, while the influence of achievement on grade 12 participation is still quite large, it has decreased over time as the grade 12 population becomes increasingly diverse in terms of achievement.
Subjects studied in grade 12
Those with high levels of literacy and numeracy were more likely to be enrolled in advanced mathematics, physical sciences, and other related subjects (Fullarton and others 2003). Studying physics or chemistry in grade 12 was strongly related to earlier numeracy proficiency. Grade 12 students in the highest numeracy quartile were more likely to participate in chemistry and physics than were students in the remaining three groups; students in the lowest numeracy group were the least likely to study chemistry and physics. In 2001 students from the top achievement group were eight times as likely to study chemistry or physics as students from the bottom achievement group. In 2004–06 the corresponding ratios had increased to 11 times more likely for chemistry and 15 times more likely for physics (Ainley and others 2008).
End of school achievement
In grade 12, Australian students choose from a range of subjects. They are assessed in each of those subjects by a syllabus-based examination and moderated school assessments of performance. The scores that they attain in each of their subjects are combined to give an aggregate score that is used as a basis for selection into university. The combined score is expressed as a percentile rank called the ENTER. There is a strong relationship between grade 9 literacy and numeracy achievement and ENTER scores. Among the Y95 cohort, 75 percent of students in the highest grade 9 achievement quartile had ENTER scores above 75 percent, compared with 50 percent of those from the second quartile, 25 percent of those in the third quartile, and 15 percent of those in the bottom quartile. When literacy and numeracy performances were analyzed separately, numeracy was found to have a consistently stronger relationship with ENTER than with literacy (Marks, McMillan, and Hillman 2001).

LITERACY AND NUMERACY IN THE CARIBBEAN
26
University participation
Student achievement is strongly related to participation in higher education (Marks and others 2000). Very few students in the lowest achievement quartile (less than 10 percent) participated in higher education. In contrast, half or more of the students in the top achievement quartile did. In the Y95 cohort, 55 percent of the top quartile participated in higher education, versus 9 percent of the bottom. In sum, students’ achievement in school had a significant influence on whether or not they would participate in higher education. Over the period studied, an increase of one standard deviation in achievement meant an increase in the likelihood of participating in higher education of between 2.6 and 4.8 times. Therefore, in 1999 students whose achievement in grade 9 was one standard deviation above the mean were seven times as likely to participate in higher education as those whose achievement was one standard deviation below the mean, net of other factors. The effects of achievement were large and very strong in the 1970 and 1975 cohorts, other factors being equal. While its effect was weaker in the 1995 grade 9 cohort, achievement remained a very important influence on higher education participation.
Influences of literacy and numeracy on labor market outcomes
Unemployment
Achievement levels in literacy and numeracy have a strong relationship with the incidence of unemployment, after controlling for other factors. An analysis of the experiences of the four cohort groups (born in 1961, 1965, 1970, and 1975) found that those with low achievement levels had a much higher unemployment rate (Marks and Fleming 1998a). The report showed that higher achievement in literacy and numeracy and completion of grade 12 were important in reducing the likelihood of unemployment, after allowing for the state of the labor market indicated by the national unemployment rate. Completing post-school qualifications had small net effects on the chances of becoming unemployed, after taking into account completion of grade 12 and labor market conditions. Family background factors such as parental occupation, location, and ethnicity had little or no direct effects on unemployment.
The same pattern between low achievement and unemployment was identified in the Y95 cohort data (McMillan and Marks 2003).

LITERACY AND NUMERACY IN THE CARIBBEAN
27
Marks, Hillman, and Beavis (2003) also showed that those with top-quartile literacy and numeracy scores showed more desirable outcomes—in terms of spending less time in marginal employment activities—than those who had lower scores. Not only were those with low levels of literacy and numeracy more likely to be unemployed, they were also more likely to have longer periods of unemployment and to experience long-term unemployment (Lamb 1997).
Occupations and earnings
Analyses of the LSAY data have shown that those with higher levels of literacy and numeracy were more likely to go into higher-status jobs and have higher earnings (Marks and Fleming 1998b; McMillan and Marks 2003) than their less proficient counterparts. Marks and Fleming (1998b) showed that there was a moderate effect of literacy and numeracy achievement on hourly earnings net of the effect of qualifications and background. Furthermore, this effect appeared to increase with age and over time. They estimated that a one-standard-deviation difference in achievement was associated with a 3 percent increase in hourly earnings net of any effect of qualifications. Most of the benefit was for earnings acquired beyond the age of 23.
McMillan and Marks (2003) focused on those who did not proceed to post-school study in the Y95 cohort. They showed that achievement in literacy and numeracy was positively related to both occupational status and hourly earnings in this cohort of recent school leavers. Higher literacy and numeracy levels were associated with the attainment of jobs with higher occupational status and higher hourly earnings. Furthermore, the influence of literacy and numeracy on each of these outcomes remained significant after controlling for sociodemographic and other factors, suggesting that even among those who left school and did not proceed to higher education, higher achievers experienced greater occupational opportunities.
Other literature
The findings from the LSAY regarding the impact of literacy and numeracy and educational attainment on labor market outcomes are consistent with other literature. There is substantial evidence that education is important in reducing the likelihood of unemployment. Athanasou, Pithers, and Petoumenos (1995) argue that a low level of education is a risk factor for long-term unemployment. Chapman and Smith (1992) found that, on average, those who had completed high school experienced six weeks less

LITERACY AND NUMERACY IN THE CARIBBEAN
28
time unemployed in a year than those who had not completed high school. Literacy and numeracy have also been cited as important factors in youth unemployment. The 1997 House of Representatives report on youth unemployment devotes several pages to increasing the levels of literacy and numeracy as a means of improving the employment prospects for Australian youth (House of Representatives Standing Committee on Employment, Education and Training 1997). Analyzing the data from the 1996 Adult Literacy Survey, Miller and Chiswick (1996) conclude that “literacy and numeracy skills are inexorably linked to labor market outcomes.” They found that labor market participation rates decline substantially from the highest literacy skill level group (around 90 percent) to the lowest literacy skill group (around 61 percent). There is also a strong relationship between literacy skills and unemployment. For the highest literacy skill level, unemployment rates were around 3 percent, rising to 20 percent for the lowest literacy skill group. These differences in unemployment incidence appear larger than those for educational qualifications (Borland 1997).
Other research into income disparities has found that skill levels, as measured during adolescence, have a substantial impact on adult incomes (Bedard and Ferrall 1996). Analyses that do not include measures of ability overestimate the returns of educational qualifications by as much as 40 percent (Blackburn and Nuemark 1995). For Australian data, Karmel (1995) estimates that the benefits of a degree decline by about 30 percent once achievement is taken into account. In the United States, the impact of cognitive skill on income appears to be increasing (Murnane and others, 2000). Hanushek and Wössmann (2007) cite studies from the United States that suggest that among individuals “a one standard deviation increase in mathematics performance at the end of high school translates into 12 percent higher annual earnings.” Hanushek and Wössmann (2007) linked the results from a series of international achievement surveys going back to the 1960s to measures of economic growth. They concluded that measured performance on these tests of achievement had a moderately strong relationship to economic growth even though measures of educational participation or education expenditure were not related to economic growth.

LITERACY AND NUMERACY IN THE CARIBBEAN
29
Australian national policy on literacy and numeracy
Origins
Although the first national literacy and numeracy survey was conducted in 1975 and repeated in 1980, there was little large-scale monitoring of performance until the advent of the state-based monitoring studies from the late 1980s onward. In the middle and late 1990s, greater attention was given to intervention through the support and encouragement of effective processes in schools. Similar emphases were also then emerging in other countries. Indeed, some elements of the policies and programs adopted in Australia at this time were similar to those of the National Literacy Strategy in England and Wales (Barber 1997).
In 1991 the Australian Language and Literacy Policy (Department of Education, Employment and Training, DEET, 1991) called for greater proficiency in English and effective literacy for all Australians. The policy identified a wide array of goals and funding provisions supported by a range of programs for Australians of all ages and cultural backgrounds. Some of the funding went to children’s literacy, but the amount allocated to early literacy development was relatively small (De Lemos and Harvey-Beavis 1995). In 1993 the Literacy Challenge (House of Representatives Standing Committee on Employment 1993) recognized the importance of early literacy intervention for the estimated 10 to 20 percent of primary school children who were thought to experience literacy problems (although there was no concrete evidence to support this figure).
In 1996 the National Schools English Literacy Survey (NSELS) was conducted, assessing the literacy skills of children in grades 3 and 5 in the areas of reading, writing, speaking, listening, and viewing (Masters and Forster 1997). Its results provided an empirical basis for paradigmatic profiles and indicated the percentages of students operating at each profile level. A subsequent report (Masters 1997) suggested that at both grade 3 and grade 5, substantial numbers of students (around one-quarter) had not achieved a satisfactory standard in reading and writing.
The publication “Literacy for All: The Challenge for Australian Schools” (Department of Employment, Education, Training and Youth Affairs, DEETYA, 1998) outlined the national

LITERACY AND NUMERACY IN THE CARIBBEAN
30
literacy and numeracy plan agreed to by all Commonwealth, state, and territory education ministers. The goal of that plan was that “every child leaving primary school should be numerate and read, write, and spell at an appropriate level.” The ministers also asserted that “every child commencing school from 1998 will achieve a minimum acceptable literacy and numeracy standard within four years.”
Key elements of the national literacy and numeracy plan
The plan outlined literacy policies for Australian schools, noting that:
The government believes that schools should equip all children who enter education with basic literacy and numeracy skills. It is in the first years of school that all children can be helped to acquire the foundation skills which will set them on the path of success in reading and writing. . . . If children have not achieved appropriate literacy and numeracy skills by the end of primary school, they are unlikely to make up the gap through the rest of their schooling. (p. 8)
The national literacy and numeracy plan focused on the early years of school and incorporated the following elements (DEETYA, 1998):
• Assessment of all students by their teachers as early as possible in the first years of schooling
• Early intervention strategies for those students identified as having learning difficulties. Development of benchmarks for years 3, 5, 7, and 9 against which all children’s achievement in those years can be measured. Measurement of students’ progress against those benchmarks using rigorous state-based assessment procedures, with all year 3 students being assessed against the benchmarks from 1998 onward and against the year 5 benchmark as soon as possible after that evaluation
• Progress toward national reporting on student achievement against the benchmarks, with reporting commencing in 1999 within the framework of the annual national report on schooling in Australia
• Professional development for teachers to support key elements of the plan

LITERACY AND NUMERACY IN THE CARIBBEAN
31
Funding of the national literacy and numeracy plan
The Commonwealth Literacy and Numeracy Program subsumed funding previously provided by the National Equity Program for Schools (under the disadvantaged schools and English as a second language programs). Although these funds represent a small proportion of funding for schools, they can have a significant role in supporting initiatives. This program was intended to provide funding to schools with a high proportion of students with low literacy and numeracy levels.
Existing indicators of educational disadvantage were initially used for allocating funds to states and sectors. Education authorities were required to formulate a plan to ensure that students reach the “minimum acceptable literacy standards” (p. 9). There was to be a particular focus on improving outcomes for students who are indigenous, have a low socioeconomic status, or come from a language background other than English. These data were to be used by school authorities to improve outcomes for the most disadvantaged students. Following the adoption of the plan, many state education authorities directed more resources toward the first three years of school. This focus on the early years also involved a consideration of home literacy practices, with the intention of fostering the involvement of parents in the school, increasing attendance at school, and devoting adequate school time to teaching literacy. Encouragement was given to teaching literacy through explicit methods that built word recognition and approaches that were considered to be effective for indigenous students or those who learning English as a second language (including programs for new arrivals).
Significant funds were made available to support professional development for teachers. Initiatives in professional development focused on identifying students at risk of not making adequate progress in literacy and numeracy, providing intervention strategies, and using assessment data to inform teaching strategies. There was also support for giving greater attention to methods for teaching literacy and numeracy in initial teacher education programs.
The role of assessment in the plan
A major feature of the national policy on literacy and numeracy since 1998 has been its reliance on assessment. As part of the national assessment program, the states operated statewide

LITERACY AND NUMERACY IN THE CARIBBEAN
32
assessment and monitoring of students in grades 3, 5, 7, and 9. These assessments were equated so that the percentages of students in each state reaching a minimum acceptable level (called a benchmark level) could be reported. In addition, states were required to report what percentage of students from vulnerable groups (indigenous students, those learning English as a second language, and those from low socioeconomic backgrounds) reached the benchmark level.
From 2008 these assessments became national, enabling the comparison of data across the range of performance rather than merely at the benchmark level. The purpose of these assessments was to report information about student achievement (based on a common test) to parents, teachers, and schools, and to monitor the overall performance of the education system and schools. Most of the assessment instruments used in these testing programs incorporated a range of items (including multiple-choice and open-ended response items) and made use of modern measurement techniques that enabled forms of standards-referenced reporting to be implemented.
Recent developments: The productivity agenda
Since 2008 improving literacy and numeracy, especially among disadvantaged groups, has become a key part of the national productivity agenda. In a federal government document titled Quality Education: The Case for an Education Revolution in Our Schools (Australia 2008), it was asserted:
Quality education is good for our economy, good for our community and good for individuals. It will help create more jobs and higher wages, and will create better opportunities for all Australians.
This publication argues that early childhood development provides a foundation for future skills formation, and that school attainment is positively linked to higher levels of employment and labor-force participation, to lower unemployment, and to higher levels of productivity. The framework focuses on setting targets for improving the outcomes for disadvantaged groups.
The document asserts that the systematic assessment of literacy and numeracy outcomes is an essential element of a program to improve outcomes and to ensure that those improvements are equitably distributed. It envisages the reporting of

LITERACY AND NUMERACY IN THE CARIBBEAN
33
comparative information about literacy and numeracy performance “to build a substantive evidence base to show what works and to support future improvements.” It proposes an assessment framework “to encompass nationally available data, school by school, which shows the socioeconomic status and numbers of Indigenous children, children with disabilities and children from non-English-speaking backgrounds (especially recently arrived migrants and refugees), together with data from the Australian Early Development Index (AEDI), which captures information about physical and emotional development of children, so we can ascertain the mix of capacities and needs that children bring to school.”
Longitudinal research on the development of literacy
Literacy advance
In Australia, several longitudinal studies on the development of literacy during elementary school have been conducted. These have variously investigated influences on the development and developmental progressions of literacy.
One such study evaluates systemic intervention in the Catholic schools of Victoria (Ainley and Fleming 2000; Ainley, Fleming, and McGregor 2002; Ainley and Fleming 2003). It tracks the development of literacy among more than 2,600 students from the beginning of grade 1, in 1998, through the end of grade 5. A particular focus of the study is the effect of an intervention—the Children’s Literacy Success Strategy, or CLaSS—that involved the use of clearly designated literacy blocks each day, strong coordination of literacy approaches in the school, and extensive use of assessment data to guide decisions about approaches in the school and on individual students.
In general, progress in literacy followed a continuing pattern of slower growth over time. During grade 1, student reading ability grew rapidly, whereas slower growth was observed between the end of grade 1 and the end of grade 3. Growth slowed further over the following two years. Initial achievement in literacy in grade 1 was identified as a strong influence on student literacy development in later years, reinforcing the importance of the preparatory year and earlier work. After allowing for differences

LITERACY AND NUMERACY IN THE CARIBBEAN
34
in initial achievement, the CLaSS approach continued to benefit those students who had done well in grade 1. The effect of the CLaSS approach, however, was smaller at grade 5 than at grade 3. No overall lasting effect of an individual intervention known as Reading Recovery on student development persisted through to grade 5, although this program had been of benefit during grade 1.
The pattern of development in reading proficiency also revealed a widening gap between the least and most able students. As in previous years, student engagement in literacy activities was a significant factor influencing progress in literacy. For grade 5 students, activities such as choosing books for reading and solitary reading at home were more popular than those involving the discussion of texts in class and being read to in class. Higher achieving students were more likely to enjoy reading by themselves and discussing texts in class than lower achieving students. All students were similar in their enjoyment of writing in class and being read to in class.
The addition of a second cohort of students entering grade 1 in 2000, after the intervention had been established, enabled a comparison of the growth in literacy in two cohorts. The study found that students who were in grade 1 in 2000 began the equivalent of one-quarter of a year ahead of their 1998 counterparts—and maintained this advantage through the end of grade 3. It appears that these students had benefited from Literacy Advance in the preparatory year, in contrast to the 1998 cohort of students who had already been in grade 1 when the strategy commenced.
Multilevel analyses point to a number of factors influencing the growth of these students’ literacy. In both groups, student literacy achievement at the end of grade 3 was strongly influenced by student reading proficiency at the beginning of grade 1, reinforcing the conclusion that a good start in literacy is crucial to development in later years. Differences in the main approach used to teach literacy at grade 1 remained in the 1998 cohort, with the CLaSS approach providing some benefit over the other approaches evaluated. Other factors identified as influencing reading development included student attentiveness in grade 1 and student engagement in grade 3. Those students who were more attentive and engaged in reading and other literacy activities progressed more than their peers. The positive effect of participation in Reading Recovery in grade 1 did not appear to

LITERACY AND NUMERACY IN THE CARIBBEAN
35
last through the end of grade 3, although students who experienced this intervention did enjoy rapid growth in reading in grade 1.
Longitudinal literacy and numeracy study
Design
This seven-year longitudinal study of literacy and numeracy development followed a cohort of Australian students from the beginning of primary school (Meiers and others 2006). Measurement scales for literacy and numeracy across the first three years of school were based on the calibrations and linking of assessment tasks. Descriptions of the skills measured were developed to place students’ achievement and development in context. These descriptions capture the shape of literacy and numeracy development and provide a means of measuring change and tracking student development over time.
Development of reading literacy
A wide distribution of literacy and numeracy achievement we found at school entry and through the first three years at school. At the beginning of the first year at school, students whose achievement lay around the middle of the distribution were likely to be able to correctly identify a capital letter. Students whose achievement was high in the distribution were likely to be able to retell a narrative in a picture storybook; this included the ability to relay some key events. Students whose achievement was in the lower range of the distribution were likely to be able to locate the front of a picture storybook and to understand the directional sequence of the text.
At the end of the first year at school, students whose achievement lay in the middle of the distribution were likely to be able to read simple common words presented on labels on a chart and to write one or more generally legible sentences. Students whose achievement was high in the distribution were likely to be able to read all of a simple reading book with word-for-word accuracy, to read would as a sight word, and to write a recognizable sentence. Students whose achievement was in the lower range of the distribution were likely to be able to correctly identify the letters of a given word from a simple reading book and to identify words with the same initial sound from a list of three words.

LITERACY AND NUMERACY IN THE CARIBBEAN
36
By the middle of the students’ third year at school, students whose achievement lay in the middle of the distribution were likely to be able to explain a character’s actions in a simple reading book independently. Those students whose achievement was high in the distribution were likely to be able to use and control a variety of common punctuation marks in their own writing and to write simple sentences joined by simple conjunctions. Students whose achievement was in the lower range of the distribution were likely to be able to read two to three pages of a simple reading book with a limited sustained grasp of meaning.
Development of numeracy
Early in the students’ first year at school, students whose achievement lay in the middle of the distribution were likely to be able to add data from several different sources to a bar graph and count back from ten by one. Students whose achievement was high in the distribution were likely to be able to read cent-and-dollar combinations and identify their highest values. Students whose achievement was in the lower range of the distribution were likely to be able to identify a difference of one attribute between two objects, correctly identify numbers under ten, and identify a square.
By the end of the first year of school, students whose achievement lay in the middle of the distribution were able to count a collection of items arranged in groups of five and to subtract numbers under ten without being given materials. Students whose achievement was high in the distribution were likely to be able to read prices involving dollars and cents. Students whose achievement was in the lower range of the distribution were likely to be able to identify numbers under 75 and to add, using materials, a collection of items arranged in a group of less than 10.
By the middle of the students’ third year at school, students whose achievement lay in the middle of the distribution were able to complete a number sentence by subtracting a one-digit number from a two-digit number. Students whose achievement was high in the distribution were likely to be able to add two two-digit numbers, then subtract a one-digit number to calculate a total and to estimate the number of blocks needed to fill a box. Students whose achievement was in the lower range of the

LITERACY AND NUMERACY IN THE CARIBBEAN
37
distribution were likely to be able to add two one-digit numbers in their heads.
Trajectories
Evaluation of the data found significant variation in the students’ developmental literacy and numeracy trajectories. Significant individual variation in performance at school entry and significant individual variation in both the literacy and numeracy growth rates were also revealed. Students, the survey suggested, started at different points and developed at different rates. Girls performed better at school entry in literacy but not in numeracy. However, no significant gender differences in the literacy growth rates over the first three years of school were found that would result in girls achieving slightly better, on average, than boys in literacy development during those years. Though roughly the same at entry, boys progressed slightly faster than girls in numeracy, with the result that boys achieved higher performance than girls, on average, at the end of the three years.
Conclusion
Over a period of 30 years, Australia has produced a series of studies concerned with assessing the impact of literacy and numeracy on outcomes for its population after school. These studies have highlighted the importance of developing proficiency in those foundational literacy and numeracy skills needed for participation in further education and training and for labor market outcomes. During the 1990s a national literacy and numeracy plan emerged that was designed to raise levels of literacy and numeracy and ensure a more equitable distribution of outcomes. The plan encompassed, among other matters, a focus on the early years of school and a targeting of resources to disadvantaged groups and to those whose literacy and numeracy proficiency was weak. The plan was also accompanied by a national assessment plan designed to monitor progress in literacy and numeracy and to guide decisions about interventions at the system, school, and individual level. A number of studies concerned with the development of literacy and numeracy during the primary school years, including longitudinal research, have also been produced.

LITERACY AND NUMERACY IN THE CARIBBEAN
38
References
ABS (Australian Bureau of Statistics). 2008. Schools Australia, 2007. Canberra: Australian Government Publishing Service.
Ainley, J., and M. Fleming. 2000. Learning to Read in the Early Years of School. Melbourne: Catholic Education Commission of Victoria.
———. 2003. Five Years On: Literacy Advance in the Primary Years. Melbourne: Catholic Education Commission of Victoria.
Ainley, J., M. Fleming, and M. McGregor. 2002. Three Years On: Literacy Advance in the Early and Middle Primary Years. Melbourne: Catholic Education Commission of Victoria.
Ainley, J., J. Kos, and M. Nicholas. 2008. Participation in Science, Mathematics and Technology in Australian Education. ACER Research Monograph 63. Melbourne: Australian Council for Educational Research.
Athanasou, J. A., R. T. Pithers, and K. Petoumenos. 1995. “Characteristics of Long-Term Unemployed and Very Long-Term Unemployed Clients: A Study of Employment Service Registrants in Australia.” Australian Bulletin of Labour 21 (3): 198–207.
Australia. 2008. Quality Education: The Case for an Education Revolution in our Schools. Canberra: Department of Prime Minister and Cabinet.
Barber, M. (Chair, Literacy Task Force). 1997. The Implementation of the National Literacy Strategy. London: Department for Education and Employment.
Bedard, K., and C. Ferrall. 1996. Test Scores and Wage Inequality: Some International Evidence. Ontario: Department of Economics, Queen’s University, Kingston.
Blackburn, M. L., and D. Nuemark. 1995. “Are OLS Estimates of the Return to Schooling Biased Downward? Another Look.” Review of Economics and Statistics 77 (2), 217–30.
Borland, J. 1997. “Unemployment in Australia—Prospects and Policies—An Overview.” Australian Economic Review 30 (4): 391–404.

LITERACY AND NUMERACY IN THE CARIBBEAN
39
Chapman, B. J., and P. N. Smith. 1992. “Predicting the Long-Term Unemployed: A Primer for the Commonwealth Employment Service.” In R. G. Gregory and T. Karmel, ed., Youth in the Eighties. Papers from the Australian Longitudinal Survey Research Project,1–27. Canberra: Centre for Economic Policy Research, Australian National University.
De Lemos, M., and A. Harvey-Beavis. 1995. “The Development and Assessment of Literacy. Background Papers for the National School Literacy Survey.” Unpublished Paper, Australian Council for Educational Research, Melbourne.
DEET (Department of Employment, Education and Training). 1991. Australia’s Language: The Australian Language and Literacy Policy. Canberra: Australian Government Publishing Service.
DEETYA (Department of Employment, Education, Training and Youth Affairs). 1998. Literacy for All: The Challenge for Australian Schools. Canberra: DEETYA.
Fullarton, S., M. Walker, J. Ainley, and K. Hillman. 2003. Patterns of Participation in Year 12. LSAY Research Report 33, Australian Council for Educational Research, Melbourne.
Hanushek, E., and L. Wössmann. 2007. Education Quality and Economic Growth. Washington, DC: World Bank.
House of Representatives Standing Committee on Employment. 1993. The Literacy Challenge: A Report on Strategies for Early Intervention for Literacy and Learning for Australian Children. Canberra: Australian Government Publishing Service.
House of Representatives Standing Committee on Employment, Education and Training. 1997. Youth Employment: A Working Solution. Canberra: The Parliament of the Commonwealth of Australia.
Jones, R. G. 2002. Education Participation and Outcomes by Geographic Location. LSAY Research Report. Australian Council for Educational Research, Melbourne.
Karmel, T. S. 1995. “The Impact of Increasing Education Levels on the Australian Workforce.” Ph.D. Thesis, Australian National University, Canberra.
Keeves, J. and S. Bourke. 1976. Literacy and Numeracy in Australian Schools: A First Report. Australian Studies in

LITERACY AND NUMERACY IN THE CARIBBEAN
40
School Performance Volume I. ERDC Report no. 8. Canberra: Australian Government Publishing Service.
Lamb, S. 1997. School Achievement and Initial Education and Labor Market Outcomes. LSAY Research Report 4. Australian Council for Educational Research, Melbourne.
Le, A. T., and P. W. Miller. 2002. Educational Attainment in Australia: A Cohort Analysis. LSAY Research Report 25. Australian Council for Educational Research, Melbourne.
Marks, G. N., and J. Ainley. 1997. Reading Comprehension among Junior Secondary School Students in Australia. LSAY Research Report 3. Australian Council for Educational Research, Melbourne.
Marks, G. N., and N. Fleming. 1998a. Factors Influencing Youth Unemployment in Australia: 1980–1994. LSAY Research Report 7. Australian Council for Educational Research, Melbourne.
———. 1998b. Youth Earnings in Australia 1980–1994: A Comparison of Three Youth Cohorts. LSAY Research Report 8. Australian Council for Educational Research, Melbourne.
Marks, G. N., J. McMillan, and K. Hillman. 2001. Tertiary Entrance Performance: The Role of Student Background and School Factors. LSAY Research Report 22. Australian Council for Educational Research, Melbourne.
Marks, G. N., K. Hillman, and A. Beavis. 2003. Dynamics of the Australian Youth Labor Market: The 1975 Cohort, 1996–2000. LSAY Research Report 34. Australian Council for Educational Research, Melbourne.
Marks, G. N., N. Fleming, M. Long, and J. McMillan. 2000. Patterns of Participation in Year 12 and Higher Education in Australia: Trends and Issues. LSAY Research Report 17. Australian Council for Educational Research, Melbourne.
Masters. G. 1997. Literacy Standards in Australia. Canberra: Australian Government Publishing Service.
Masters, G., and M. Forster. 1997. Mapping Literacy Achievement: Results of the 1996 National School English Literacy Survey. Canberra: DEETYA.
McMillan, J., and G. N. Marks. 2003. School Leavers in Australia: Profile and Pathways. LSAY Research Report 31. Australian Council for Educational Research, Melbourne.
LITERACY AND NUMERACY IN THE CARIBBEAN
41
Meiers, M., S. T. Khoo, K. Rowe, A. Stephanou, P. Anderson, and K. Nolan. 2006. Growth in Literacy and Numeracy in the First Three Years. Research Monograph 61. Australian Council for Educational Research, Melbourne.
Miller, P., and B. R. Chiswick. 1996. Literacy, Numeracy and the Labour Market, Aspects of Literacy: Assessed Skill Levels. Canberra: Australian Government Publishing Service.
Murnane, R., J. Willett, Y. Duhaldeborde, and J. Tyler. 2000. How important are the cognitive skills of teenagers in predicting subsequent earnings. Journal of Policy Analysis and Management, 19 (4), 547–68.
Rothman, S. 2002. Achievement in Literacy and Numeracy by Australian 14-year-olds, 1975–1998. LSAY Research Report 29. Australian Council for Educational Research, Melbourne.
Rothman, S., and J. McMillan. 2003. Influences on Achievement in Literacy and Numeracy. LSAY Research Report 36. Australian Council for Educational Research, Melbourne.
Part II
Literacy and Numeracy in the Caribbean


Chapter 3 Literacy and Numeracy
in Select Countries of the Caribbean
Ana Cristina Accioly de Amorim
An education specialist and consultant, Cristina Accioly de Amorim has worked at the Inter-American Development Bank coordinating the Regional Policy Dialogue on Education and at the World Bank, where she focused on Latin America and the Caribbean. She has 15 years of experience designing, monitoring, and evaluating educational programs in Latin American and the Caribbean. Mrs. Accioly de Amorim holds a master’s degree in education from Harvard University’s Graduate School of Education.
Most countries of the Caribbean have put education at the center of their strategy to diversify their economy, to ensure sustainable growth, and to improve the cohesion of their societies. At the same time they have made significant public investment in education in recent decades, averaging around 6 percent of gross domestic product (GDP). As a result, the region now provides universal access to primary education and access to secondary education for more than 70 percent of its student population. But this net enrollment, which compares favorably to Latin American countries, conceals a profound deficit in quality and equity. Student achievement is very low, and a majority of youth leaves the education system without the basic skills necessary to play a productive role in society. Less than 70 percent of students complete secondary education, and less than 60 percent succeed in the regional Caribbean Examinations Council (CXC) exams (Di Gropello 2003).
Recognizing the central importance of literacy and numeracy as key skills that enable students to successfully participate in schooling until the completion of the entire education cycle and

LITERACY AND NUMERACY IN THE CARIBBEAN
45
to then continue to training and work, this study analyzes the current status of primary and secondary education in the region and contrasts it to countries that have faced similar challenges in the past but that today enjoy equitable and high-performing educational systems. Our goal is to shed light on diverse national literacy and numeracy policies that might inspire new ways to improve the quality of literacy and numeracy in the region.
The findings in this report are presented under five sections. Section 1 provides a review of the literature on literacy and numeracy; section 2 provides an overview of literacy and numeracy in the region and examines the challenges of building these skills; section 3 features best practices in the literacy and numeracy programs; section 4 provides the case studies of St. Lucia and Jamaica; and section 5 contains a summary of findings and recommendations.
A few caveats are required when interpreting the results of the current diagnostic of the nine countries analyzed: (a) this review was not an exercise in primary data collection; (b) the data presented of the individual countries should be regarded as illustrative rather than exhaustive; and (c) despite our efforts to collect information directly from participating countries through questionnaires, not all countries responded. (Questionnaires were answered by Trinidad and Tobago, Jamaica, St. Lucia, Grenada, and Guyana)
Current trends in literacy and numeracy
literacy and numeracy skills are not static notions; they have evolved over time. Moreover, there are multiple perspectives about their development and use.
Some educational research and practice in the global context have, in recent decades, taken on a sociocultural perspective. As Ward and Fulton (2002) point out in their report on literacy and numeracy in St. Lucia, “learning is no longer understood simply as an individual cognitive or psychological process. A Vygotskian or constructivist perspective, which currently informs much educational thought, accounts for the learners’ social worlds and cultural backgrounds, as well as their intellectual and psychological predispositions. literacy and numeracy are not considered skills separate from the social contexts in which they occur; rather, they are affected by the values and norms of the

LITERACY AND NUMERACY IN THE CARIBBEAN
46
society in which they are used. From this perspective, students learn literacy and numeracy both formally and informally, at home and at school. The role of the teacher is to support informal learning through multiple exposures to many kinds of literacy and numeracy experiences, as well as to provide explicit instruction when required. The constructivist approach to teaching and learning requires that teachers no longer simply transmit information but design activities to meet the intellectual, social, and psychological needs of their students. In this interactive role, teachers know their students well and are able to create programs and activities based on students’ prior knowledge, skills, and sociocultural background. Periodic, informal assessments would encourage teachers to become habitually more diagnostic and better able to match their instruction with students’ intellectual needs and background knowledge.”
In contrast, a more economic and practical approach to literacy development would deemphasize the sociocultural context and concentrate instead on the development of essential skills that are applicable to the rigors of working life. This approach highlights governments’ and employers’ renewed interest in developing literacy and numeracy skills as a means for all people to enhance their employability and for countries to advance their economies. Employers expect that prospective employees will possess not only basic literacy and numeracy skills but also multiple literacies, from basic computer and information technologies and language and communication skills to critical and cognitive thinking skills. To that end, sound literacy and numeracy skills must be taught in primary school and reinforced in secondary school and beyond.
A report produced by the Confederation of British Industry (CBI 2006), Working on the Three Rs: Employers’ Priorities for Functional Skills in Math and English, identifies key areas of literacy and numeracy (reading and understanding information texts, reading and writing, spelling and grammar, legible handwriting and oral communication) that are considered essential to employers. Mastering these key areas provides a gateway to future learning and better labor market outcomes.
Evidence suggests that literacy and numeracy have large economic effects on individual earnings and on national growth (Hanushek and Wössmann 2007) and that workers’ productivity depends both on years of education and what is learned at school (Murnane, Willett, and Levy 1995). Even in the informal economy

LITERACY AND NUMERACY IN THE CARIBBEAN
47
lack of basic literacy and numeracy can hinder the success of an individual in the labor market. Haan and Serriere (2002) identify these skills as one of the basic training needs in the informal economy; in its absence, trainability and consequent skill achievements are limited.
The best-performing and rapidly improving education systems in the world (Finland, Singapore, South Korea, Japan, Canada) have focused on literacy and numeracy in the early years in part because substantial evidence shows that early ability in core skills is strongly correlated with future success. A major longitudinal study in the United Kingdom, for instance, found that test scores in literacy and numeracy at age 7 were significant determinants of earnings at age 37, even after controlling for socioeconomic backgrounds (Currie, Thomas 1999).
Some education systems even go beyond the current needs of the economy to try and match current teaching to the country’s future requirements. For instance, to further grow its economy, Singapore has invested heavily in trying to anticipate the required range and mix of skills that its students will need when they graduate, and to match its curriculum to those needs.
The Australian Blueprint for Improving Education and Training (ACCI 2007) presents a valuable interpretation of literacy and numeracy in modern society. It maintains that in today’s world it is necessary, but not enough, for students to achieve basic competence in the areas of reading, writing, and numeracy. Beyond the achievement of basic competence, students also need to develop the critical literacy and numeracy skills required for effective functioning in everyday life. Skills of this kind are now widely advocated by school systems and are adopted as a starting point in most international assessment programs.
Basic reading proficiency involves an ability to decode text, to interpret vocabulary and grammatical structures, and to understand main ideas at least at a superficial level. But reading literacy for effective functioning in modern society requires much more than this; it also depends on the ability to read between the lines and to reflect on the purposes and intended audiences of texts, to recognize devices used by writers to convey messages and to influence readers, to interpret a wide variety of text types, and to make sense of the texts by relating them to the situations in which they appear.

LITERACY AND NUMERACY IN THE CARIBBEAN
48
Similarly, numeracy depends on a familiarity with a body of mathematical knowledge and skills. Basic number facts and operations, working with money, and fundamental ideas about space and shape, including working with measurements, form part of this essential body of knowledge and skills. But numeracy for effective functioning in modern society requires much more than this; it also depends on an ability to think and work mathematically, including modeling and problem solving. These competencies include knowing the extent and limits of mathematical concepts, following and evaluating mathematical arguments, posing mathematical problems, choosing ways of representing mathematical situations, and expressing oneself on matters with a mathematical content. Numeracy depends on an ability to apply these skills, knowledge, and understanding in a variety of personal and social contexts.
The Caribbean ministries of education face multiple challenges in ensuring that all students gain acceptable literacy and numeracy levels for effective functioning in modern society. Most of the countries have launched national literacy and numeracy campaigns to tackle this challenge, but they have had regrettably modest impact on learning outcomes. The methodologies employed within the Caribbean education sector must be shifted to ensure that young people are adequately equipped with the essential skills to participate effectively within the workforce and that the population’s standards of living and well-being continue to increase.
Literacy and numeracy outcomes in the region: Overview and challenges
Recent education reforms in the region
In general, education policy reform efforts in the region have been undertaken with encouraging results, as described below:
OECS Education Reform Strategy: Pillars for Partnership and Progress, In 2001, ministers of education in the Organization of Eastern Caribbean States (OECS) adopted the OECS Education Reform Strategy: Pillars for Partnership and Progress, a framework for reform with a horizon of 2010. Within the reform framework, the OECS Secretariat (through the OECS Education Reform Unit—OERU)

LITERACY AND NUMERACY IN THE CARIBBEAN
49
has been in charge of harmonizing the regional curricula and the CXC has continued working on its evaluation and standards.
Caribbean Education Statistics Capacity-Building Project (United Nations Educational, Scientific, and Cultural Organization, UNESCO). In 2007 the UNESCO Kingston office launched a two-year project to build capacity at the Caribbean ministries of education by using statistics for evidence-based policy making and higher-quality education. The project was supported by Japanese funds and targeted UNESCO’s Caribbean member states and associate-member states. It was aimed at providing beneficiary countries with technical support to improve capacities for data collection, processing, and analysis; these capacities, in turn, would promote evidence-informed policy making at both the national and regional levels to achieve the international and regional goals of Education for All and the Millennium Declaration. The project’s chief results were the training of 250 educational officers across the region and the production of an Education for All monitoring report for the Caribbean.
Affirmative action program for the 15 lowest-ranked schools. The Ministry of Education and Human Resource Development of Barbados has already put in place the program, and they are now considering expanding it from four to thirteen schools. Action in this direction might involve internal audits of the schools to establish socioeconomic status profiles, as well as to investigate management and classroom practices, access to learning resources, and use of grant money. Action would also involve the design of on-site staff-development programs, including coaching of teachers.
National policy on reading. Barbados has developed a national policy on reading to address the general perception that reading standards at the primary level have deteriorated. The policy is expected to target areas of weakness observed in the English papers that students write as part of the Barbados Secondary Schools’ Entrance Examination (BSSEE). This policy advocates action in areas such as teacher retraining, placement of reading resources, teacher diagnoses, and remediation of student reading difficulties.
In addition to these national and regional initiatives, several donors have joined the Caribbean education ministries’

LITERACY AND NUMERACY IN THE CARIBBEAN
50
efforts for improving literacy and numeracy performance through the education projects described below.
Support for development of the literacy and numeracy strategy. In 2003 Britain’s Department for International Development and the World Bank elaborated a project, the OECS Educational Development Project (OEDP), to support the four OECS ministries of education (Dominica, Grenada, St. Vincent and the Grenadines, St. Lucia) in developing a more comprehensive strategy to improve literacy in the primary and lower secondary schools. This program was designed to take into account the needs of the OECS curriculum, especially the Language Arts and the Literacy Block/Hour being used as part of the Caribbean Centre for Excellence in Teacher Training (CETT) and other programs. The purpose of the project was to assist the Windward Island education systems to better meet the education needs of all young persons; improving literacy and numeracy was one of the expected outcomes of the project.
Edu Tech 2000. Primary and secondary education reforms with information and communication technology (ICT) support. This program represents a substantial commitment from the government of Barbados and the Ministry of Education and Human Resource Development to broadly reform teaching and learning in support of the white paper. Fifty-five percent of the program’s budget is covered by loans from the Caribbean Development Bank (CDB, 40 percent) and the Inter-American Development Bank (IDB, 15 percent), with the remainder provided by the government of Barbados. The program is mainly focused on enhancing teaching and learning by redesigning the national curriculum at all primary and secondary levels. ICT is used primarily to support teaching and learning activities in relation to the new curricula.
Ed Tech 20/20 (IDB-WB). This is a cluster-based approach to ICT in primary schools in Jamaica. The project pilot tested computer and Internet installations in roughly 20 primary schools. Clusters of four to five primary schools were linked to a single secondary school or teacher college that would provide professional development and technical support.
New Horizons for Primary Schools Project (NHP-United States Agency for International Development (USAID)). In the school year 1998–99, the USAID fully rolled out the NHP for approximately 10 percent of the lowest-performing schools in Jamaica. The program was designed to improve the quality of teaching in these primary
LITERACY AND NUMERACY IN THE CARIBBEAN
51
schools, to raise literacy and numeracy levels, to increase school attendance, and to strengthen school management. The first cohort of students to attend NHP schools for all or most of grades 1–6 completed grade 6 in 2004.
A network of professional development clusters (Caribbean CETT-USAID). The Caribbean CETT is a program that is used in 86 schools in 6 Caribbean countries. Since its inception in 2002, the program has developed intervention strategies that have proved to be highly effective in improving reading achievement in poorly performing schools serving disadvantaged urban and rural populations. The Caribbean CETT focuses on literacy in grades 1–3, operates through the network of teacher colleges, uses information technology (IT) to teach and assess, and sets targets for improvements for schools and individual students. The program currently operates in five fully USAID-funded countries in the region—Jamaica, Guyana, St. Lucia, St. Vincent and the Grenadines, and Belize—as well as in Grenada and Trinidad and Tobago, where it is financed by the respective governments.
Basic Education, Access, and Management Support in Guyana (BEAMS-IDB). In 2002 Guyana’s government, with funding from the IDB, created a basic strategy to improve the literacy and numeracy attainment of students through the basic education cycle, particularly those in underserved and poverty-stricken areas, all the while strengthening the ministry of education’s ability to sustain such improvements. These efforts were contrived to support Guyana’s movement toward universal secondary education. The strategy includes relevant and feasible reforms to curriculum and pedagogy aimed at achieving early literacy and numeracy among Guyana’s school-aged population. It also relies on research-based standards created by the CETT and the University of Guyana, Cyril Potter College of Education (Solomon 2006).
Primary Education Support Project in Jamaica (PESP-IDB). In 2004 Jamaica created a literacy program, Literacy 1-2-3, that encompasses teacher training; a literacy model was integrated into the national assessment program. This program is curriculum based and is intended to provide a holistic approach to the teaching of literacy using the language arts window in grades 1–3 of the revised primary curriculum. The development of Literacy 1-2-3 was informed by the strategies used by the CETT, the NHP, and the Jamaican All-Age School Project, among others. It is based on the language experience and awareness approach and is also informed by a study of the language situation in Jamaica. The
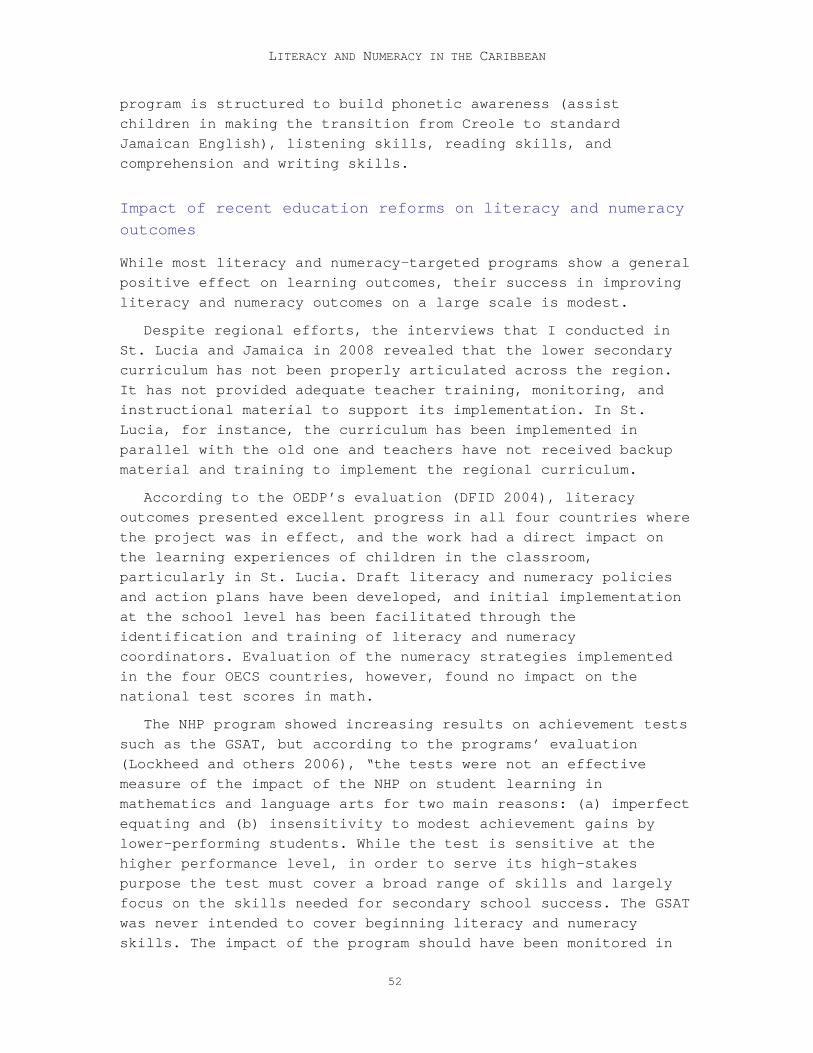
LITERACY AND NUMERACY IN THE CARIBBEAN
52
program is structured to build phonetic awareness (assist children in making the transition from Creole to standard Jamaican English), listening skills, reading skills, and comprehension and writing skills.
Impact of recent education reforms on literacy and numeracy outcomes
While most literacy and numeracy-targeted programs show a general positive effect on learning outcomes, their success in improving literacy and numeracy outcomes on a large scale is modest.
Despite regional efforts, the interviews that I conducted in St. Lucia and Jamaica in 2008 revealed that the lower secondary curriculum has not been properly articulated across the region. It has not provided adequate teacher training, monitoring, and instructional material to support its implementation. In St. Lucia, for instance, the curriculum has been implemented in parallel with the old one and teachers have not received backup material and training to implement the regional curriculum.
According to the OEDP’s evaluation (DFID 2004), literacy outcomes presented excellent progress in all four countries where the project was in effect, and the work had a direct impact on the learning experiences of children in the classroom, particularly in St. Lucia. Draft literacy and numeracy policies and action plans have been developed, and initial implementation at the school level has been facilitated through the identification and training of literacy and numeracy coordinators. Evaluation of the numeracy strategies implemented in the four OECS countries, however, found no impact on the national test scores in math.
The NHP program showed increasing results on achievement tests such as the GSAT, but according to the programs’ evaluation (Lockheed and others 2006), “the tests were not an effective measure of the impact of the NHP on student learning in mathematics and language arts for two main reasons: (a) imperfect equating and (b) insensitivity to modest achievement gains by lower-performing students. While the test is sensitive at the higher performance level, in order to serve its high-stakes purpose the test must cover a broad range of skills and largely focus on the skills needed for secondary school success. The GSAT was never intended to cover beginning literacy and numeracy skills. The impact of the program should have been monitored in

LITERACY AND NUMERACY IN THE CARIBBEAN
53
the earlier grades through tests that were not ‘high stakes.’” Collection of grade 3 diagnostic test results from all schools in Jamaica would have enabled a more robust analysis of the effects of the program.
Edu Tech 2000’s evaluation (Pirog and Kioko 2006) found that educational impact (as reflected in BSSEE scores) was large and negative for math in the first two years of the program intervention, while these effects decline in magnitude over time. Impact in English studies was positive, with the magnitudes of the effects also declining over time. In a number of comparisons, student performance post-Edu Tech is noticeably lower.
National literacy and numeracy strategies in Trinidad and Tobago, Jamaica, Guyana, and Barbados were implemented too recently to be evaluated.
It is worth noting that test results in the region indicate that students’ achievement in mathematics is consistently lower than in English at the primary and secondary levels. In part, it may be because far more funding for program provision, student support, and teacher development has gone into literacy than into numeracy in recent years. While poor reading skills may make solving word problems difficult, it is not usually the main factor causing problems in math. Children with numeracy difficulties need to be identified and helped, and more funding needs to be earmarked for this area.
Access and equity
Access
The Caribbean countries selected for this study have made remarkable progress on expanding access to primary education. As shown in table 3.1, coverage is no longer a concern, and with the exception of a few countries, completion is not generally a problem either.
Table 3.1 Access and completion at the primary level (%), 2005
Barb
ados
Domi
nica
Gren
ada
Guya
na
Jama
ica
St. K
itts an
d Ne
vis
St. L
ucia
St. V
incen
t an
d the
Gr
enad
ines
Trini
dad a
nd
Toba
go
Gross enrollment rate 99.8 92.1 93.7 124.3 94.9 99.1 117.7 (2006)
111.2 94.7
Net enrollment 93.6 84.0 84.6 89.0 90.3 93.4 97.9 90.4 84.6

LITERACY AND NUMERACY IN THE CARIBBEAN
54
rate (1991) (2006) Completion rate 92.8 109.4 94.7 122.9 82.3 109.2 114.4
(2006) 92.0 88.0*
Source: World Bank Education Statistics Database (Edstat) 2005; UNESCO Institute for Statistics (UIS) 2006. * National estimation.
Coverage and completion are areas of concern at the secondary level for most of the analyzed Caribbean countries. On average, secondary school net enrollment rates are around 77 percent. As shown in table 3.2, while some countries have similar gross enrollment rates (this is notably the case in Dominica and Grenada), they have very different completion rates.
Table 3.2 Access and completion at the secondary level (%), 2005
Barb
ados
Domi
nica
Gren
ada
Guya
na
Jama
ica
St. K
itts an
d Ne
vis
St. L
ucia
St. V
incen
t an
d the
Gr
enad
ines
Trini
dad a
nd
Toba
go
Gross enrollment rate 103.1 106.0 100.1 104.1 94.3* (2007)
93.7 87.2 74.9 76.3
Net enrollment rate 87.6 81.0 78.8 – 78.3 86.1 69.4 (2006)
63.9 65.1
Completion rate 100.0** 72.8** 94.3** – – 100.0** 81.8** 75.7** 81.1** Source: Edstat 2005; UIS 2006. Note: * Planning Institute of Jamaica (PIOJ 2007). ** UIS estimation.
Equity
In general, not all students at primary and secondary levels are given an equal opportunity to learn. The major factors that are usually seen as placing educational outcomes at risk include socioeconomic disadvantage, poverty, low parental expectations, disability, language background other than English, geographic isolation, and gender.
Students from low-income families have a lower participation rate in quality secondary education (Hobbs 2002b). In Jamaica, all children have access to public primary schools, but the better-quality publicly funded secondary schools—the “traditional schools”—accept only students who have passed the Common Entrance Examination (CEE). Many middle- and upper-income families send their children to private primary schools to improve their chances of getting into the traditional high schools. The poor, however, cannot afford private primary schools, so their children are less prepared for the CEE. Children who fail the CEE attend inferior “all age” or new secondary schools. In St. Lucia, low-income students are more likely to be enrolled at the all-age

LITERACY AND NUMERACY IN THE CARIBBEAN
55
schools or not enrolled in the formal school system. While only 46 percent of the students from the first quintile (bottom income bracket) are enrolled in secondary schools, 79 percent of the students of the fifth quintile (top income bracket) are enrolled. Secondary school entrance is difficult, due to the high selectivity of the CEE. A similar system exists in Trinidad and Tobago, where few students graduating from the public primary schools get high enough grades on the secondary entrance assessment (SEA) to be accepted into the secondary schools with a strong academic curriculum (World Bank 1999).
A traditional concentration of secondary schools in the urban areas limits the access of many poor, rural families. There are no explicit compensatory and targeting mechanisms (transport subsidies, education grants, feeding programs, and so on) to facilitate the access of disadvantaged students to secondary schools (Hobbs 2002b).
The regional curriculum, along with most Caribbean national curricula (with the exception of Jamaica’s), does not address the status and needs of Creole-influenced vernacular speakers (Blom and Hobbs 2008). Even though Creole is the language spoken by a large proportion of Caribbean students on entry to primary schools, especially in rural settings, the vernacular does not have a major role in structuring the learners’ thinking processes and aiding their cognitive development. Consequently, the English language and literacy deficiencies from which the students suffer during the primary phase of schooling are carried over into the secondary phase, where failure continues to mount (Craig 1999).
Internal efficiency
The internal efficiency of most educational systems analyzed is low. This can be explained by the low percentage of students who stay through the last grade of secondary school and the relatively high repetition of that grade. The level of internal efficiency varies across countries, with a few countries having very low retention rates through the last grade of secondary school (as in Guyana, and St. Vincent and the Grenadines). On average, less than half of children entering first grade today are expected to make it through the last grade of secondary school (Blom and Hobbs 2008).

LITERACY AND NUMERACY IN THE CARIBBEAN
56
Table 3.3 Internal efficiency, 2005
Barb
ados
Domi
nica
Gren
ada
Guya
na
Jama
ica
St. K
itts an
d Ne
vis
St. L
ucia
St. V
incen
t an
d the
Gr
enad
ines
Trini
dad a
nd
Toba
go
Repetition rate – 9.1 4.5 7.2 (2001)
1.5 3.1 – 8.2 0.8
Dropout rate – – 2.0 (2002/3)
12 (2003/4)
12.8 (2005)
– – – –
Survival rate to form 1 – 68 73 82 91 90 68 52 82 Survival rate to form 5 – 57 66 34 62 61 62 42 56
Source: Edstat 2005; World Bank 2003; UIS 2008; and the Digest of Education Statistics of Guyana 2003–04.
Relevance and quality
Primary level
Even though the region has almost universal coverage, the quality of primary education remains a concern. While exam outcomes at the primary level are not comparable across countries, student performance on national examinations and in the areas of literacy and numeracy are below expectations.
Table 3.4 Pass rate of primary exams*
Barb
ados
Domi
nica
Gren
ada
Guya
na
Jama
ica
St. K
itts an
d Ne
vis
St. L
ucia
St. V
incen
t an
d the
Gr
enad
ines
Trini
dad a
nd
Toba
go
Math – 25 21 43 49 29 46.1 (2008)
75 68
English – 40 25.5 36.4 58 62.3 52.6 (2008)
75.9 63
Source: World Bank (2003); St. Lucia Education Statistical Digest (2008). Note: * Test of standards at grade 6. Common Entrance Examination (CEE) for most Caribbean countries and Secondary Entrance Assessment (SEA) for Trinidad and Tobago.
An assessment of Barbados’s public primary and secondary schools over the period 1999–2005 showed the shortcomings of the educational system. Of the 71 schools observed, only 4 had the highest percentage of their students scoring in the 71–100 range on the BSSEE in both mathematics and English. The highest percent (45 percent) of students in 32 of the schools scored in the 51–70 range in English. The situation in math is even more worrisome since the majority of schools (58 percent) had the highest percentage of their students scoring 30 marks or less.

LITERACY AND NUMERACY IN THE CARIBBEAN
57
Currently, there are no directly comparable regional exams at the primary level that allow meaningful comparison of literacy and numeracy outcomes at that level across countries.
Secondary level
Inequitable access to the secondary level is directly linked to the inequitable quality of education. According to an assessment of some of the OECS education systems (Hobbs 2002b), a significant number of students get a second-tier education. Studying in less popular schools, unable to chose their curriculum due to limited subject choices, required to attend lower streams, limited to non-secondary education, and unable to obtain general CXC passes, many students are isolated in these lower tiers of the education system. A minority of students reinsert themselves into the system by repeating classes.
Weak literacy and numeracy skills lead to weak performance at the secondary level. As observed in table 3.5, CXC exams show an average pass rate of only 46 percent in general proficiency in English and mathematics for those Caribbean students who took the CXCs in 2003. Performance on the CXC varies significantly across countries, with passing rates consistently lower in mathematics than in English. In her data analysis, Di Gropello (2003) found that the results would be even worse if passing at least five CXC subjects, including mathematics and English, was considered the minimum requirement for access to tertiary education. Regrettably, relevant data are available only for Grenada, St. Kitts and Nevis, and St. Lucia, all of which show unsatisfactory performance.
Table 3.5 Pass rate of secondary exams (%), CXC, 2003
Barb
ados
Domi
nica
Gren
ada
Guya
na
Jama
ica
Carib
bean
Av
erag
e
St. K
itts an
d Ne
vis
St. L
ucia
St. V
incen
t an
d the
Gr
enad
ines
Trini
dad a
nd
Toba
go
Math – 45 35 24 30 53 46 37 (2006)*
37 46.3 (2004)*
English – 66 46 37 41 39 53 59 (2006)*
61 62.9 (2004)*
Students passing at least 5 CXC
– – 13 – – – 26 (2000)
27 (2000)
– –
Source: Di Gropello (2003) .
Although secondary enrollment is increasing, secondary completion continues to be an issue in many countries. In Jamaica

LITERACY AND NUMERACY IN THE CARIBBEAN
58
20 percent of students leave school following completion of grade 9, while one in three students completing grade 11 does not take CXC exams. Viewed in terms of the CXC Caribbean Secondary Education Certificate (CSEC) exams—the yardstick acknowledged at least implicitly by both schools and students—the effectiveness of instruction across the region is moderate at best. In 2004, 69.5 percent of returned exams achieved grades I through III (passing), while in 2005 49 percent of returned exams achieved these grades. With equivalent numbers of exams returned (29,119 in 2005; 30,069 in 2004), student performance declined significantly in subjects such as biology, chemistry, English, and to a lesser degree mathematics. Student performance in the CSEC IT exam, however, improved from 42 to 62 percent in the same period (Gaible 2008).
Gender disparity
Gender differences in academic achievement are a common challenge in the region. In most Caribbean countries, males demonstrate lower academic achievement levels and have lower participation in secondary education than females. Females outperform males at various levels of schooling in a broad range of curriculum subjects, a pattern that is substantiated by in-class and national examinations.
Teachers
In general, teachers’ academic qualifications are deficient. According to Lochan (2005), Caribbean countries require only minimal academic qualifications of teachers. “Teachers’ recruitment and selection in the Caribbean suggest that perceptions of teaching as a worthwhile and ‘real’ profession have always been challenged by the use of teaching as a stepping stone to other professions,” Lochan writes. “The utilitarian approach to teaching as a career has been influenced by the policies governing recruitment and selection into the teaching service.” In St. Lucia, only about half of the secondary teachers had tertiary degrees in 1997–98, and only 58 percent had received some sort of teacher training. In St. Kitts and Nevis, only 30 percent of the secondary teachers had tertiary degrees in 1999–2000, and only 30 percent of the teachers had received some training (Hobbs 2002b).
Many beginning teachers with weak personal literacy and numeracy skills and insufficient practice working with children

LITERACY AND NUMERACY IN THE CARIBBEAN
59
with insufficient literacy and numeracy are assigned to teach primary school students. More experienced and skilled teachers are usually assigned to the secondary school level.
Large numbers of secondary school teachers in the region have degrees in the subject area in which they teach but no pedagogical training. Indications (Darling-Hammond 1999) suggest that subject matter is not enough for effective teaching and that knowledge of teaching and learning (pedagogical knowledge) is also essential.
The UNESCO Institute of Statistics (UIS) special survey on teachers suggests that Latin America and the Caribbean should focus almost exclusively on improving the qualifications of the current teaching force and raising the standards for new recruits. As shown in figure 3.1, in Guyana only a small proportion of the existing teachers meet the relatively low standards of upper secondary education. This could partly be the result of recent upgrades in standards that were meant to improve the professional status of teachers.
Figure 3.1 Teachers with and without minimum qualifications and the number of additional teachers needed to reach universal primary education by 2015 (%)
Source: UNESCO, 2006. Note: International Standard Classification of Education (ISCED). Lower secondary (ISCED 2): Typically about nine years of schooling. Upper secondary (ISCED 3): Typically between 12 and 13 years of schooling, requiring completion of lower secondary education for entry. Postsecondary, nontertiary (ISCED 4): These programs straddle the boundary between upper secondary and postsecondary. Tertiary (ISCED 5): These programs are largely theoretically based and intended to provide sufficient qualifications for entry into advanced research programs.

LITERACY AND NUMERACY IN THE CARIBBEAN
60
The practice of hiring so-called pre-trained teachers (that is, teachers who do not have teachers’ college preparation or certification) has compromised educational quality and equity. For instance, in Jamaica, pre-trained teachers are significantly less expensive to hire than trained teachers and do not require the same level of incentives. Consequently, they are generally concentrated in all-age schools, which are located in the most geographically remote and economically disadvantaged areas. The percentage of untrained teachers in remote rural areas and in the poorest urban neighborhoods is large. The placement of untrained teachers with disadvantaged children generates a strong inequity bias in the delivery of education and contributes significantly to the reduced standards of literacy and numeracy in these populations. Although existing regulations stipulate that pre-trained teachers must exit the system if they have not achieved certification within six years of being hired, compliance is low (Fryer 2000).
Deployment of teachers to other schools to accommodate enrollment fluctuations is deficient. Usually, the staffing pattern at schools is determined by ministries of education, based on enrollment capacity. Once allocated, the positions come under the jurisdiction of the school board. When teachers are employed under a permanent contract with the school board, they are exempt from the ministries’ redeployment. Consequently, many small rural schools are overstaffed and have low student/teacher ratios, while large urban schools are understaffed, with unacceptably high ratios. Most understaffed schools and most schools with a higher-than-average representation of uncertified teachers are located in the poorest communities.
There is a clear dissociation between formal teacher professional development (TPD), which is heavily theoretical, and the teaching practices in the classrooms (Di Gropello 2003). TPD programs have not been effective in preparing future teachers to apply their coursework and other pre-service experiences to their teaching practice.
The induction period for new teachers in the region is insufficient. While the induction period in the countries of the Organisation of Economic Co-operation and Development (OECD) averages around 24 weeks a year, the time allowed for new teachers in the Caribbean to become familiar with teaching practices in the region is much lower than that. In Barbados, for instance, a four-week induction program is provided during the

LITERACY AND NUMERACY IN THE CARIBBEAN
61
summer holiday. This course is generally taken by people who have recently entered the teaching service and have no training, or by those who expect to start teaching in the new academic year. In Guyana, new teachers apprentice with a senior teacher for about one week, according to information provided by ministry of education officials in response to a questionnaire developed for this study.
Figure 3.2 shows the proportion of trained teachers or those who have received the minimum organized teacher training (pre-service or in-service) required. In Latin America and the Caribbean, there are few countries where less than one-half of teachers complete the standard training.
Figure 3.2 Minimum standards for teaching at the primary level and the proportion of teachers meeting those standards
Source: UNESCO, 2006. Note: International Standard Classification of Education (ISCED). Lower secondary (ISCED 2): Typically about nine years of schooling. Upper secondary (ISCED 3): Typically between 12 and 13 years of schooling, requiring completion of lower secondary education for entry. Postsecondary, nontertiary (ISCED 4): These programs straddle the boundary between upper secondary and postsecondary. Tertiary (ISCED 5): These programs are largely theoretically based and intended to provide sufficient qualifications for entry into advanced research programs.
In general, the TPD programs with the support of ICT targeted to both primary and secondary levels have had a limited impact on teachers’ performance. According to a recent review of ICT in education in the Caribbean (Gaible 2008), some countries—such as Barbados, Jamaica, and Trinidad and Tobago—have launched ambitious TPD programs with the support of ICT, but challenges still remain. For instance, in Jamaica, at the primary level

LITERACY AND NUMERACY IN THE CARIBBEAN
62
(NHP, Ed Tech 20/20, PESP), training and ICT installation are both taking place on an extremely small scale, leading to the conclusion that ICT interventions in primary schools have not achieved widespread impact. At the secondary level, both Jamaica 2000 and eLearning Jamaica, Ltd., appear more focused on hardware procurement and installation than on the TPD.
In Barbados, MOEYC personnel informed us that teachers (particularly secondary teachers) are embracing ICT as a teaching instrument. In primary schools, where fewer resources are available, school leadership is able to manage access and distribution of the ICT resources to take advantage of the skills, creativity, or enthusiasm of the individual teachers. Although coverage in the in-service training is approaching 100 percent of Barbadian teachers, challenges remain. The two-week summer format is both brief and abstracted from the classroom, and teachers currently do not receive credit for participating. There is also a need to develop training to help teachers increase their mastery of teaching with technology and of supporting innovation among both teachers and students.
Instructional material
Primary and secondary schools are not supplied with sufficient basic educational materials and equipment to support student-centered classroom teaching and learning. Science laboratories are poorly equipped, and computer labs (where they exist) are underused due to insufficient access to educational software and poor maintenance of the hardware. School libraries are normally under-stocked and underused, and library computers are not systematically connected to the Internet. The lack of resources and poor conditions make it extremely difficult to implement student-centered approaches, such as group work or teamwork, independent research projects, science experiments, and other hands-on learning methods. Finally, teachers and educational support staff require more appropriate training to use both the existing equipment and the proposed new equipment (Hobbs 2003).
Management of education
Information systems to support informed and effective decision making in the region are weak. The countries analyzed have the Education Management Information System (EMIS), but systematized data collection, effective reporting mechanisms, and established quality standards are not in place, and there are not many

LITERACY AND NUMERACY IN THE CARIBBEAN
63
supervision systems that use the EMIS data to monitor school and staff performance (Fryer 2000).
Early evaluation to identify students lagging behind is insufficiently available in the region. Most countries have a policy of automatically promoting students from one grade to the next, with a selection being made at the end of the two main cycles, primary (CEE) and secondary (CXC) (in St. Kitts, only at the end of the secondary cycle). But some countries, such as Jamaica, Guyana, and St. Lucia, have introduced a minimum standards examination (MST) after grades 3 and 5 that tests the knowledge and skills of all students at those grade levels and measures them against standards and benchmarks as a means of quality control. St. Kitts and Nevis have designed national certificates of education for the same purpose. But little is known about the impact of the MST as a diagnostic tool to determine types of interventions necessary to improve literacy and numeracy performance.
National literacy and numeracy strategies already established in a few countries are still in the embryonic stage. From all the Caribbean countries analyzed, only Guyana, Jamaica, and Trinidad and Tobago have developed literacy and numeracy plans. Barbados created a national reading policy after discovering that reading standards and comprehension at the primary level had deteriorated. While these literacy and numeracy plans are brand-new, it is already clear that some basic components of the plans—such as clear goals, benchmarks, assessment methods, and leadership and teacher training tailored to literacy and numeracy—need to be strengthened. For instance, the Trinidad and Tobago national test report for 2005 found that the development of the national literacy and numeracy strategy lacked defined goals, standards for each level of primary schools, and open communication with parents and the community about literacy and numeracy goals and standards. In addition, it argued that guidance in the appropriate use of instructional strategies needed to be included as part of the national strategy.
Financing of education
Caribbean countries have traditionally valued education, committing 6.4 percent or more of GDP to public education, compared with the Latin American and OECD averages of 4.1 and 4.8 percent, respectively (Nuamah 2005). A significant investment in

LITERACY AND NUMERACY IN THE CARIBBEAN
64
education can help the region reach the standards of the world’s leading economies. But the investment needs to be efficiently managed.
In spite of the high expenditure on education, regional education outcomes are deficient. The inefficiency in the educational systems is evident when we consider (a) low student achievement, (b) low pupil-teacher ratios that do not yield high academic performance (low pupil-teacher ratios are also closely associated with higher unit cost); (c) scant in-service training; and (d) inefficient teacher deployment (Di Gropello 2003). Pupil-teacher ratios, while a highly aggregated measure, help to indicate the capacity of an education system and to assess whether teachers are potentially overburdened or underutilized.
While the average pupil-teacher ratio of the countries analyzed can be favorably compared with the pupil-teacher ratio of the best education systems in the world, teachers are underutilized, and deployment to address unbalanced distribution (rural and urban areas) is a major challenge.
Table 3.6 Pupil-teacher ratios, analyzed Caribbean countries, 2006
Pupil-teacher ratios Barb
ados
Domi
nica
Gren
ada
Guya
na
Jama
ica
St. K
itts an
d Ne
vis
St. L
ucia
St. V
incen
t an
d the
Gr
enad
ines
Trini
dad a
nd
Toba
go
Primary level 15.1 17.2 17.7 28.0 27.7 17.6 23.5 17.5 16.5 Secondary level 14.6 16.4 15.4 18.0 18.5 9.9 17.0 17.9 16.5 Source: Edstat 2006.
Expenditure on inputs other than salaries is very limited. Inefficient and low pupil-teacher ratios, generous study leave provisions, and cumbersome teacher training/hiring programs have combined to raise personnel costs. With the countries’ spending on salaries as high as 94 percent (St. Lucia, Dominica, St. Vincent and the Grenadines) of the education budget, far too little is left for other critical inputs into learning outcomes, such as instructional materials and school maintenance (Di Gropello 2003).
Caribbean countries tend to spend more on the top-performing schools than on the schools whose needs are the highest—that is, on lower-income schools with students who are less likely to pass the CXC (Di Gropello 2003). There are, for example, periodic national celebrations of top students who have achieved regional successes in the CXC examinations, while little attention is

LITERACY AND NUMERACY IN THE CARIBBEAN
65
given to average performance of the country as a whole. Not only does this public financing policy reinforce unequal opportunities, it also reduces global competitiveness that depends on the average level and quality of the education of the workforce.
Table 3.7 Expenditure on and financing of education, 2005
Expenditure and financing Ba
rbad
os
Domi
nica
Gren
ada
Guya
na
Jama
ica
St. K
itts an
d Ne
vis
St. L
ucia
St. V
incen
t an
d the
Gr
enad
ines
Trini
dad a
nd
Toba
go
Total public expenditure on education, % of GDP
6.9 5.0 (1999)
5.3 (2003)
8.5 5.3 9.3 6.6 (2006)
8.1 4.2 (2002)
Total public expenditure on education, % of total government expenditure
16.4 – 12.9 (2003)
14.5 8.8 12.7 (2003)
19.1 (2006)
16.1 13.4 (2001)
Public expenditure per student as % of GDP per capita Primary level 23.4 – 11.8
(2003) 17.0 14.6 7.8 13.1
(2006) 22.6 15.8
(2002) Secondary level 27.6 – 13.0
(2003) 16.2 21.5 13.2 23.4
(2006) 29.5 17.2
(2001) Source: Edstat; Di Gropello; and UIS. Data are for the most recent year available in the period 1999–2006.
Di Gropello (2003) analyzed the relationship between public expenditure and educational outcomes in the Caribbean and found that public expenditure as a proportion of GDP, while generally positive, is by no means unquestionable. Wide variations exist in the spending efficiency across countries, as shown by the fact that similar levels of spending are associated with a wide range of educational outcomes. The relationship is somewhat closer between spending per student (as a percentage of GDP per capita) in secondary education and academic achievement as exemplified by the CXC results. But the relationship between spending and outcomes disappears completely with the completion rate. In St. Lucia only 27 percent passed five subject exams (including math and English in 2000), while in St. Kitts and Nevis, the pass rate was 26 percent.
Good policies and practices
This section presents successful interventions in literacy and numeracy. The countries selected are Australia, England, New Zealand, Singapore, Japan, the Republic of Korea, and Finland. While Australia was chosen for its successful education reform on literacy and numeracy—particularly in the issues relevant to the

LITERACY AND NUMERACY IN THE CARIBBEAN
66
Caribbean educational context, such as (a) the national literacy and numeracy plan, (b) parental involvement at school, and (c) the use of assessment data for decision making, the other countries were selected as showcases of successful interventions on teacher development. By analyzing these countries’ successful reforms, we hope to shed light on diverse national literacy and numeracy policies that can help Caribbean countries find new ways to improve the quality of literacy and numeracy in the region.
Australia
Australian national literacy and numeracy plan
In 1997 the Australian government created the national literacy and numeracy plan after identifying the factors that place educational outcomes at risk, such as socioeconomic disadvantage, poverty, low parental expectations, disability, language background other than English, geographic isolation, indigenous background, and gender. The national plan encompassed comprehensive reforms that fully addressed these issues and implemented an equitable policy of literacy for all. The main policies in the national plan are listed in box 3.1.
Box 3.1 Main policies designed for the national plan
• • Assessment of all the students by their teachers as early as possible in the first years of schooling
• • Early-intervention strategies for those students identified as having difficulties
• • Development of national benchmarks for grades 3, 5, and 7, against which all children’s achievement in these years can be measured. (Details of the benchmarks for literacy are at http://cms.curriculum.edu.au/litbench/intro.asp. Those for numeracy are at http://cms.curriculum.edu.au/numbench.
• • Professional development for teachers to support the key elements of the plan
Source: Meiers 1998.
Student assessment
Assessment in the early years of schooling encompasses both the assessment of students on entry to school and the ongoing assessment that continues through the early years until Year 3 when student achievement is measured against national benchmarks. The results of early assessment provide information to parents, teachers, schools, systems, and sectors to support the alignment of teaching programs with the national literacy and numeracy plan.

LITERACY AND NUMERACY IN THE CARIBBEAN
67
Professional development
Professional development plays a key role in supporting teachers in implementing the literacy and numeracy assessment in the early years of schooling in Australia. The emphasis of professional development is moved away from training administrators in the use of assessment tools toward providing teachers with opportunities to analyze data, moderate results, and plan programs to meet the identified needs of the students. Strategies to support teachers include the use of action/inquiry models, the establishment of collegiate networks, and the availability of mentors, including those accessible electronically. An increase in the use of ICT to support professional development is also evident.
A variety of intervention programs have been implemented to support students identified as requiring additional support. Program designs reflect the needs of jurisdictions, schools, and local communities and include one-on-one and small group tutoring, structured teaching programs, and professional development to increase the repertoire of strategies that teachers utilize. In some instances, government and non-government sectors have jointly developed these initiatives.
Using assessment data to decide policy
One of the strongest components of the Australian policy formulation is the vigorous use of data for decision making and for facilitating effective intervention in literacy and numeracy programs in the early years of schooling. In 1998 the Department of Education, Science and Training (DEST) provided funding for a project called Assessment of literacy and numeracy in the Early Years of Schooling. The project involved providing information to assist schools, teachers, and education authorities to meet key elements of the national literacy and numeracy plan and publishing a report with the same name in 1999. A second project organized further discussions about assessment in the early years of schooling and has developed three papers about issues that arose from these discussions.
The role of parents in improving literacy and numeracy outcomes
Research has shown overwhelmingly that when parents are involved in the education of their children, student motivation and achievement improves (Australian Council of Educational Research, ACER 1999). The Australian Ministry of Education created a website (http://www.austparents.edu.au) to raise parents’

LITERACY AND NUMERACY IN THE CARIBBEAN
68
awareness of their role and to help them recognize that the best start a child can have in literacy and numeracy is at home. Among other resources, the site includes a list of simple, everyday things parents can do to encourage literacy and numeracy learning at home. Policy makers recognize that parents and teachers working together promote success.
Singapore, New Zealand, Finland, Republic of Korea, England, United States, Japan, and Canada
A comparative study conducted by McKinsey & Company (Barber and Mourshed 2007) found that top-performing school systems such as Singapore, Finland, Republic of Korea, England, Canada, and others came out on top due to their strong focus on improving instruction. To improve instruction, these school systems consistently do three things well: (a) they recruit the right people to become teachers, (b) they develop these people into effective instructors, and (c) they put in place systems and targeted support to ensure that every child is able to benefit from excellent instruction.
Recruiting the right people to become teachers
The same study found that top-performing educational systems depend ultimately on the quality of their teachers. To that end, these education systems have developed policies that focus on selecting and training teachers, offering good starting compensation, and carefully managing the status of the teaching profession.
In England, for instance, after nearly a half century of little or no improvement in student outcomes in literacy and numeracy, the government rolled out a new national training program that employed best-practice training techniques. In just three years, it increased the number of students meeting the target standards in literacy from 63 percent to 75 percent.
Table 3.8 lists successful strategies used by some of the top-performing educational systems to recruit highly skilled candidates to become teachers.

LITERACY AND NUMERACY IN THE CARIBBEAN
69
Table 3.8 Strategies for recruiting and training candidates
England
Made teaching the most popular profession among undergraduates and graduates in just five years Strategy: Used marketing and recruitment techniques taken from business to increase and attract quality applicants for teacher training Incentive: Good starting salary
Finland
Increased the quality of primary teachers Strategy: Increased primary teachers’ salary by as little as €100 a month and raised the status of teachers by requiring master’s degrees to qualify Incentives: Set a good starting salary and improved the status of its primary school teachers relative to those in secondary schools Requirement for training: Assessment of (a) literacy, numeracy, and problem-solving skills; and (b) communication skills, willingness to learn, academic ability, and motives for teaching
Singapore Improved selection of teachers Strategy: Statewide selection process (coordinated by ministry of education) in partnership with the National Institute for Education Incentive: Good starting salary Requirements for training: Applicants’ academic achievement, communication skills, and motivation for teaching
Republic of Korea
Increased the quality of primary and secondary teachers Requirements for training: Primary school teachers must complete four years of undergraduate study at a selective national school of education and be in the top 5 percent of their academic cohort; secondary school teachers must complete training at one of 350 competing providers and apply for teaching jobs.
Source: Barber and Mourshed 2007.
A common characteristic of these systems is control of the teacher supply. Failing to control entry into teacher training leads to an oversupply of candidates, which has a negative effect on overall teacher quality. In the primary education systems of Hong Kong, England, and the Republic of Korea, the government uses its control of funding to limit the number of teacher candidates (and the supply of teacher training places).
Developing teachers into effective instructors
High-performing school systems use three main approaches to help teachers improve instruction: (a) create awareness of weaknesses in their practice, (b) provide them with a precise knowledge of best practices, and (c) motivate them to make the necessary improvements. These approaches promote fundamental changes in what happens at the classrooms. At the level of individual teachers, this implies getting three things to happen: (a) self-evaluation—individual teachers need to become aware of specific weaknesses in their own practice; (b) exposure to best practices—individual teachers need to gain understanding of specific best practices (in general, this can be achieved only through demonstration of such practices in an authentic setting like a study tour); and (c) motivation—individual teachers need to be motivated to make the necessary improvements. This motivation goes beyond material incentives; it comes about when teachers have high expectations, a shared sense of purpose, and above all,

LITERACY AND NUMERACY IN THE CARIBBEAN
70
a collective belief in their ability to make a difference in the lives of the children they serve.
It is important to note that in order to improve instruction, these three components need to work simultaneously. If all three are not in place, change will be limited.
Several education systems provide in-service training through on-the-job coaching. Expert teachers (trained to coach other teachers) give feedback, model instruction, and share in planning. Coaching interventions can lead to a substantial improvement in outcomes in a short time. Table 3.9 sheds light on how some of the top-performing systems make in-service training part of the school routine.
Table 3.9 Making in-service training part of school routine
Country Teacher self-evaluation, exposure to best practices, and motivation England One-on-one coaching in the classroom conducted by experienced colleagues. Teachers with a track record of
excellent instruction are given reduced teaching loads to allow them to spend more time coaching their colleagues. Coaches provide feedback, model better instruction, and help teachers reflect upon their own practice. A 24 week program over the course of a year to practice and create awareness of trainee teachers’ weaknesses. Training programs using best-practice techniques with successful outcome.
Finland Most faculties of education manage their own training school; these are fully operational schools in which students carry out their initial teaching practice. This structure helps to ensure that the content of teacher training is tightly linked to the actual practice within schools, and it provides additional opportunities for the faculty to incorporate observation and best practices gained in the classroom into their teacher training courses. Teachers work together, plan their lessons jointly, observe each other’s lessons, and help each other improve.
Singapore Senior teachers and master teachers lead the coaching and development of teachers. Japan Teacher trainees work full time in schools, and coaching is provided one-on-one, twice a week, by guidance
teachers to create awareness of weaknesses during student-teachers’ first year of practice. Teachers work together to refine individual lessons, plan their lessons jointly, observe each other’s lessons, and help each other improve. Groups of teachers observe each other’s practices in the classroom, and best practices are shared throughout the school.
Boston, United States
Teachers of the same subject in the same grade jointly plan and analyze teaching practices based on assessment data. The sessions are facilitated by the principal or one of the literacy coaches, and use data as the basis for structured discussion. The aim is to uncover differences among the instructional practices and to understand how these differences affect results. Peer observation and common planning of teaching strategies follow the sessions. Participants in the one-year teacher residency program spend four days each week in a school.
Source: Barber and Mourshed 2007.
Delivering for every child
Ensuring that every child benefits from high-quality instruction is not only an important end in itself but will define a system’s level of strength. For example, the Program for International Student Assessment (PISA) of the top-performing systems shows a weak correlation between outcomes and students’ home background. The best systems, in other words, ensure that the school can compensate for the disadvantages resulting from students’ home environment. They start by setting clear and high expectations of

LITERACY AND NUMERACY IN THE CARIBBEAN
71
what students should understand and be able to do, and they make sure that resources and funding are aimed at those students who need them most. They then closely monitor the performance of schools against these expectations and develop effective mechanisms to intervene when these expectations are not met.
All these top-performing and rapidly improving systems have curriculum standards that set clear and high expectations for what student should achieve.
New Zealand, Alberta, England, and Chicago have introduced funding models that divert additional resources to those schools that are most in need of improvement. The funding formula provides increased funding to schools that enroll students from disadvantaged backgrounds.
Monitoring and intervention at the school level
A combination of monitoring and effective intervention is essential in ensuring that good instruction is delivered consistently across the system. High-performing school systems monitor their performance through examinations and inspections; the intensity of monitoring is inversely proportional to the capacity of individual schools to improve by themselves.
Table 3.10 Monitoring and intervening at the school level
England School review: Independent inspectorate (with 35 inspectors) is directly accountable to parliament. Self-evaluation with external review every 3–4 years. Outcome of monitoring: Publication of performance results.
New Zealand School review reports to its own ministry of education. Self-evaluation with external review every 3–4 years. Outcome of monitoring: Publication of performance results.
Singapore Self-review with occasional external review. Hong Kong School review carried out by the school branch offices to which the school reports, under the guidance of the
ministry of education. New York, United States
Annual external review: All the schools are to be reviewed by an external inspectorate once every year. Outcome of monitoring: Publication of performance results.
Source: Barber and Mourshed 2007.
School monitoring evolves toward less intensive review models as schools improve. Top-performing systems, as well as rapidly improving ones, create mechanisms to allow central or local governments to replace the school’s leadership in cases where normal governance arrangements do not allow this to happen. In the United States (for example, in Chicago), England, and New Zealand, the district, local authorities, or central government, respectively, have the right to replace the school leadership

LITERACY AND NUMERACY IN THE CARIBBEAN
72
when a school fails to improve. In the United States, Boston removed the bottom 5 percent of principals during the first year of its reform and then several of the lowest-performing principals each year thereafter.
These education systems use the results of monitoring and intervention to identify best practices, which can then spread through the system. For instance, Singapore studies the practices in its best schools and ensures that the lessons from these schools are transferred to other schools. Singaporean researchers have built classroom-laboratories at the National Institute for Education where they carefully monitor student reactions to new instructional approaches and strategies being tested there. They then apply their findings to future education reform.
Selecting and developing effective instructional leaders
Recent research on school leadership suggests that “school leadership is second only to classroom teaching as an influence in learning” (National College for School Leadership, NCSL 2006). Some 97 percent of schools in England rated good or excellent overall by the independent inspectorate are led by management teams that are also rated good or excellent overall; only 8 percent of schools with leadership teams rated satisfactory or below are rated good or excellent overall (Office for Standards in Education, OFSTED 2005–6). Research shows that without an effective principal, a school is unlikely to have a culture of high expectations or strive for continuous improvement.
Best-performing school systems implement a coherent and aligned development model (frequently based on an apprenticeship model), which helps aspiring and existing school leaders to develop these practices. After identifying the right people to become principals, it then needs to structure the roles, expectations, and incentives to ensure that principals focus on instructional leadership, not just on school administration.
In Singapore, new principals are required to take a 6-month program that includes: (a) management and leadership courses modeled after leading executive training programs; (b) weekly practice sessions in schools where candidates are assigned to develop innovative approaches to the toughest problems; (c) group projects where candidates work in teams; (d) two-week overseas placement with a major corporation (for example, IBM, HP, Ritz Carlton), where they shadow top private sector executives; and

LITERACY AND NUMERACY IN THE CARIBBEAN
73
(e) rigorous evaluation—only candidates who demonstrate the required competencies succeed (McKinsey 2007).
Case studies: St. Lucia and Jamaica
In this section the focus will be on two programs with the most potential for impacting the literacy and numeracy outcomes in St. Lucia and Jamaica. In the case of St. Lucia, the program to be analyzed is the School-Based Assessment–Minimum Standard Test (SBA-MST), and in Jamaica, the program Literacy 1-2-3.
St. Lucia
St. Lucia and other OECS country members have recently engaged in the preparation of a long-range education sector plan. In its plan, the St. Lucian government has articulated a strong pledge to education. Over the past 30 years this continuous commitment has led to almost universal coverage of primary education. Nevertheless, the government recognizes that there are still quality issues to be addressed at all education levels. In response, the government has implemented a variety of initiatives, such as: (a) designing remedial programs to improve literacy and numeracy skills for underachieving students in primary schools, (b) improving teacher qualification, (c) reforming the secondary school curriculum, and (d) increasing the use of diagnostic assessment mechanisms.
Table 3.11 Programs and outcomes
Programs Outcomes OEDP 2002 1. Support for development of an literacy and numeracy strategy. 2. School improvement projects (SIPs) Goal: Management of education at the school level. The initiative encourages schools to focus on projects that seek to improve the teaching and learning process, and increase student participation in cocurricular activities.
1. Drafting of literacy and numeracy policies and action plans, and initial implementation at the school level, facilitated by the identification and training of literacy and numeracy coordinators. 2. Many schools have embarked on a variety of school projects. In-service training for principals and senior teachers are examples of these projects. There is increased parent and community participation in the development of SIPs, which are a direct spin-off of the increased local ownership of school management.
3. CETT 2002 A network of professional development clusters.
The pilot intervention was successfully completed, but up till now the government has decided not to scale up the program.
4. SBA-MST program (2008) First trial run in April 2008. Source: DFID 2002; Griffith 2007; St. Lucia Ministry of Education 2008a.

LITERACY AND NUMERACY IN THE CARIBBEAN
74
Although these initiatives have brought invaluable inputs to the system, impact on national literacy and numeracy continues to be modest.
Student achievement
Students’ achievement on national and regional assessments demonstrates low achievement in the areas of literacy and numeracy. Many students, mostly from poorer families, complete the primary level unable to read and write, while some of those who move on to the secondary are unable to properly participate at that level (Hobbs 2002b).
While both CEE subject areas recorded an increase in performance in this year’s examination, performance is still poor.
Table 3.12 St. Lucia, CEE results, 2008
Subject area Year 2008 Year 2007 Year 2006 Mathematics 46.1 41.7 37.1 English 53.0 43.3 45.1 Source: St. Lucia Ministry of Education 2008c.
An evaluation (DFID 2005) of the literacy and numeracy problems in St. Lucia found that improving the standards of literacy and numeracy is a major challenge. The evaluation highlights that in the case of mathematics, improving the efficacy of instruction is only a start. Strengthened instruction must then be followed by continued monitoring and support. In the case of St. Lucia, the fluidity of staffing in schools makes systematic progress difficult.
Creole-English transition
Creole-English transition at school remains a challenge, especially in rural areas, where more monolingual Creole speakers are found (Simmons-McDonald 1993). Schools do not use Creole to support literacy in the first years of schooling. In a diagnosis of children of different language backgrounds in a rural school in St. Lucia, Simmons-McDonald (2002) found that at least 60 percent of the students tested (from grades K–6) were reading one to four grade levels below their actual grade.
Curriculum
Inconsistent supervision of curriculum implementation is a challenge. An evaluation of the MST performance in St. Lucia

LITERACY AND NUMERACY IN THE CARIBBEAN
75
(Ward and Fulton 2002) found poor implementation of the English language curriculum. Among other problems, there was an absence of a teachers’ guide to demonstrate classroom implementation of the integrated language arts program and instructional material.
Teachers
Assessment of literacy and numeracy (World Bank and DFID 2002) pointed to the low quality of teaching and urged a series of teacher training activities to address deficiencies in classroom practices across schools in St. Lucia. The main difficulties experienced by teachers are lack of training on attending students with different levels of proficiency in math and literacy and lack of assessment skills.
In addition, a literacy and numeracy survey conducted by Ward and Fulton (2002: 5) found that “teachers are teaching skills in isolation (phonics, vocabulary work, and punctuation) and using repetition instead of strategic teaching.” The report called for “an increased emphasis on literacy and numeracy over several years” (p.7). One of the areas that requires close investigation is the methodology used to teach literacy and the extent to which this methodology fosters the acquisition of literacy among primary school students.
The student-based assessment (SBA) program
In 2007 the St. Lucian Ministry of Education, with World Bank funding, introduced the SBA into the country’s primary schools. The idea was to introduce the SBA in the minimum standards testing program in grades 2 and 4 to foster a culture of alternative assessment throughout the school system. The SBA represents a set of strategies that promote assessment through the performance of meaningful and genuine tasks. It is also geared toward assessing learners’ multiple intelligences. An assessment guide for the SBA program was published in 2007 (St. Lucia Ministry of Education and Culture, MEC, 2007). This resource offers an array of alternative methods for early assessment, scoring, and grading.
Obstacles to strengthening the SBA program
The national EMIS is not strong enough to provide support to the SBA and has not been effective at the system or school level. According to the St. Lucians interviewed for this study in July 2008, reporting of data is still a mechanical process with little

LITERACY AND NUMERACY IN THE CARIBBEAN
76
analysis of test results, and data are not assimilated as part of the schools’ daily practice. There is no monitoring system in place to support teachers and supervise whether they are doing a good job. Nor is their a monitoring mechanism to follow up students’ progress, to project students’ performance by the end of the primary cycle, or to tell principals that consistent poor student performance can be signaling the need for teacher training.
Strategies to address students’ learning difficulties are not easily available. While a commendable number of alternative methods for early assessment, scoring, and grading are currently available through the teacher guidance formulated for the SBA program, strategies to address students’ learning difficulties after assessment are not readily available. The program would highly benefit from a variety of best practices to be used for this purpose.
According to feedback on the MST-SBA trial run (MEC 2008a), teachers were not part of the test formulation. Participation of teachers is an important opportunity to build on an assessment culture within the schools, and to stimulate teachers’ contribution to the process of change.
Standards (benchmarks) to contrast students’ performance are lacking. Based on the same feedback, teachers did not know whether the results were matching the skills students should be mastering in their grade level. Some of them complained that the tasks were too difficult for grade 2 students while others felt they were not challenging enough. To mitigate these and other problems, broad-based discussions among principals, teachers, and parents on the new assessment systems should be encouraged.
Suggestions for strengthening the SBA program
Research on assessment practices, such as the SBA, for use in the early years of schooling found that collecting data, as such, does not lead to improved instructional practice but that it can provide indisputable evidence for the need to review practices and initiate changes (Davis 2005). “The results of data collection and analysis can motivate a course of action toward school improvement and student success. At a class and individual level the collection and analysis of data about student achievement enables teachers to make adjustments to teaching and learning activities to gain measurable improvement for individual students.”
In order to achieve the full impact on learning, programs such as the SBA assessment need to be accompanied by: (a) early intervention strategies for those students who are identified as lagging behind; (b) in-service training at school; (c) exposure to best practices; and (d) school leaders’ training to provide effective monitoring and support to teachers.

LITERACY AND NUMERACY IN THE CARIBBEAN
77
Among these components, in-service training merits significant attention since teachers need to learn how to interpret test results in order to identify students’ needs and plan instruction accordingly.
In-service training
The success and sustainability of the new assessment program is highly dependent on the continuous teacher upgrading in the area of assessment. The emphasis of in-service training needs to change from training in administration of assessment instruments toward providing teachers with opportunities to analyze data, moderate results, and plan programs to meet the identified needs of students.
Reflecting on practice as a learning community
While learning how to interpret test results is critical, the opportunity to reflect on assessment practices and the creation of a learning community fosters improving the quality of instruction. Box 3.2 presents an example of the positive effect of building a learning community. It shows how the use of assessment data can increase confidence among teachers and influence the preparation of programs for individual students. All the staff involved in the community feel they have contributed to the process and gained useful strategies they could use in their classrooms.

LITERACY AND NUMERACY IN THE CARIBBEAN
78
Box 3.2 Reflecting on practice as a learning community
The value of teachers working together as a learning community is well recognized. In the Australian Capital Territory, a project called Integrating System and Classroom-based Assessment (ISCA)—funded under the Quality Outcomes Program and the National Literacy and Numeracy Strategies and Projects Program through the Commonwealth Department of Education, Science and Training—involved two primary schools with a total of 30 teachers.
The two school groups, in some cases working together and at other times working as individual schools, engaged in establishing a professional learning community. Teachers focused on improving student literacy outcomes through the integration of system and classroom assessment practices. The project was also concerned with teacher judgments, particularly in classroom-based assessment. Through participation in a professional learning community, teachers were able to establish norms and values, focus on student learning, and collaborate and engage in reflective dialogue. It was anticipated that through participating in the project teachers would be able to:
• Integrate system and classroom assessment data to inform pedagogy;
• Develop skills in mapping student literacy progress;
• Develop appropriate responses to identified needs of students; and
• Develop appropriate reporting mechanisms. The Literacy and Numeracy Team in the Australian Capital Territory Department of Education and Community Services was given the responsibility of supporting the schools to use results generated by system data to improve student learning outcomes. Strong leadership and a clearly articulated vision were the key factors in the success of such a process.
Source: ISCA 2001.
Jamaica
Over the past few years the Ministry of Education of Jamaica has been experiencing a significant process of modernization that has focused mainly on three areas: (a) redirecting the central ministry toward policy and strategy and away from operational matters; (b) creating regional educational agencies with greater autonomy and a much stronger focus on school improvements; and (c) creating three new operating agencies that would be the main drivers of transformation by improving quality, curriculum, and assessment, and transforming the teaching profession. The new agencies were: (a) the National Education Inspectorate, (b) the Curriculum and Assessment Agency, and (c) the National Teaching Council.
By recognizing that improving literacy and numeracy performance is a government priority, the Jamaican Ministry of

LITERACY AND NUMERACY IN THE CARIBBEAN
79
Education created a comprehensive national literacy plan. In 2007 the Jamaican government developed a strategic framework, Literacy 1-2-3, to ensure that reforms are sustained, that resources are targeted effectively, and that improvements are achieved in all schools. Literacy 1-2-3 was planed to be rolled out to 800 primary schools under the PESP-IDB project. The development of Literacy 1-2-3 was informed by the strategies used by the CETT, the NHP, the Jamaican All-Age School Project, and the Language Experience and Awareness approach, and a study of the language situation in Jamaica. The program was curriculum based and was intended to provide a holistic approach to the teaching of literacy using the language arts window in grades 1–3 of the revised primary curriculum.
Early assessment by teachers
Revamping the grade 1 inventory. The grade 1 inventory is restructured to assess family and community support for the child’s learning. The profile intends to assist teachers in planning lessons and structuring delivery of knowledge to optimize the learning of each child. Specific key indicators to be assessed include the social and emotional development of the child, as well as teacher/school readiness.
Remedial intervention strategies to support students who experience difficulties in reading
A complete review of the literacy provision at the primary and secondary levels is undertaken and the lessons learnt from this are incorporated in practice.
National benchmarks
A team is responsible for developing better data on school and student performance (including trends, benchmarking, and value-added data) and the development of school profiles.
Teacher professional development (TPD)
This includes teacher professional development through (a) revolving loan fund to teachers who are permanently employed in public educational institutions and are pursuing a bachelor’s degree or a diploma in teacher education, and (b) mandatory teacher registration for teachers in public educational institutions.

LITERACY AND NUMERACY IN THE CARIBBEAN
80
Delivering quality education for every child in schools where achievement is lowest
A proposal to introduce CETT into the 100 lowest-achieving schools, based on a three-year contract, is under consideration. In addition, a team of 50 literacy specialists is being recruited to support targeted schools on a regional basis that are not part of CETT.
Transition from Creole to standard Jamaican English
Literacy 1-2-3 is structured to build phonetic awareness (assisting children in the transition from Creole to standard Jamaican English), listening skills, reading skills, comprehension, and writing skills.
Monitoring of performance
For teachers and principals. New appraisal instruments for principals and guidance counselors are being piloted and the teacher evaluation instruments and system is being reviewed.
School review. School review is a priority of the transformed education system. The regional educational agencies now have a stronger focus on school improvement, and the new inspectorate will take on a more rigorous approach to school review and inspection and to following up on inspection findings.
Program supervision. The national coordinator provides strategic oversight and drives the program to achieve its targets. Shorter-term targets for improvement are being developed for regions and then for schools. School-based literacy coordinators ensure that improvements are implemented in all schools and undertake the diagnostic, monitoring, and evaluation functions relating to learning and teaching.
Assessment. A prominent feature of the program is self-evaluation by schools. This requires new and improved data mechanisms, the development of better-quality data, and training of officers and school managers.
National assessment program. The literacy model is integrated into the national assessment program (grade 1 readiness; grade 3 diagnostic; and grade 4 literacy tests) and uses a range of literacy curriculum materials that are written, designed, and illustrated by Jamaicans.

LITERACY AND NUMERACY IN THE CARIBBEAN
81
A national literacy coordinator and a team of regional coordinators are appointed to provide sustainable approaches to reading and ensure that there are improvements in literacy levels.
Developing effective instructional leaders
Ninety-one percent of the 800 primary school principals have received certification through a program with Mount St. Vincent University in Canada. This has now been taken over by St. Joseph’s College. Corporate training for secondary school principals is being delivered by the University of the West Indies.
Parental and community involvement
Home-school agreements. These agreements aim to strengthen partnerships between home and school and consequently improve the behavior, attendance, and academic performance of students. They define the roles and responsibilities of each partner and seek to hold each accountable for their actions. They draw on successful practices in Jamaican schools. Discussions have been held with stakeholder groups and schools.
School improvement plan. Based on an approved school improvement plan, selected schools are provided with a lump sum of money to implement the plan. The program is monitored by regional territorial education officers, who are expected to ensure that the correct procurement guidelines are followed and that funds are spent as indicated by the school improvement plans.
Technology and literacy and numeracy
In general, the use of technology as a tool to support literacy and numeracy in the region has been modest. In contrast, Jamaica has been one of the most proactive countries in using ICT as a tool to improve learning outcomes. As box 3.3 illustrates, Jamaica has used technology to improve literacy and numeracy in low-performing schools across the country.

LITERACY AND NUMERACY IN THE CARIBBEAN
82
Box 3.3 Expanding education horizons project helping to improve literacy and numeracy Kingston (JIS): Thursday, May 29, 2008
The Expanding Educational Horizons (EEH) project in the Ministry of Education has been reaping rewards through the use of technological tools to improve literacy and numeracy in low-performing schools island-wide.
Since the inception of the program in 2005, 17 schools have graduated with between 60 and 90 percent improvement in literacy and numeracy skills.
The program is a joint initiative of the Ministry of Education and the United States Agency for International Development (USAID) and is aimed at enhancing curriculum delivery and improving literacy and numeracy in 71 primary schools and six nongovernmental organizations (NGOs).
Speaking with JIS News, the project director of the EEH project, Dr. Jean Beaumont, explained that these institutions were targeted because of their very low performance in all areas of the school’s curriculum, and especially in literacy and numeracy. “The project had to go about identifying why they (the schools) were performing at that level and placed the emphasis on teacher training with a view to impacting students’ performance,” Dr. Beaumont pointed out.
She added that the aim was to identify and implement best practices, strategies, and methodologies to enhance literacy and numeracy.
As a result, several activities were implemented, including equipping schools with technology tools, conducting workshops, producing teachers’ guides, and increasing access to resource materials. She noted that the integration of technology has improved the overall teaching and learning environment and students’ performance. A technique that she described as a tremendous success is digital storytelling, a method which involves the production of narrated short films using still photos, music, and voice.
Teachers have been creating electronic portfolios, which involve documenting students’ readings of a given passage over time, their reflections on the readings, and the teachers’ comments and interventions between readings. Televisions, VCRs, portable radios, CD players, and tape recorders are also used by teachers and students to play or record stories. The listening and comprehension skills are developed when teachers play these audio stories frequently and ask the students questions about characters and events in the story.
Another device that has aided teachers is the Jamaica Administrative System (JAS). This is a database in which teachers input data on children’s performance in the classroom. With the implementation of this database, Dr. Beaumont noted that “the teachers can generate a school report, the principals can generate transcripts and the entire school can use that performance data to determine where the children’s needs are, where their strengths are and how to plan for school improvement.”
In terms of support, Dr. Beaumont said that two literacy specialists, eleven literacy resource specialists, and one literacy consultant work closely with the schools to offer guided practice to both classroom teachers and students. Dr. Beaumont noted that a number of factors have led to the poor performance of these schools, including poor leadership, the school environment, the students’ perception of education, and the attendance level. Interventions, she said, have included working with the parent teacher associations and giving tips on how parents can help the

LITERACY AND NUMERACY IN THE CARIBBEAN
83
students at home.
Source: http://www.jamaicalabourparty.com/home/content/expanding-education-horizons-project-helping-improve-literacy-and-numeracy.
Conclusions and challenges
The scope of Jamaica’s literacy plan seems to be very comprehensive. It embraces the most significant strategies for improving the quality of literacy. Nevertheless, in order to achieve the proposed objectives Jamaica needs to overcome some of the most critical problems hindering effective literacy and numeracy outcomes, such as:
• Inadequate teachers’ training, deployment, assessment, and qualification
• Lack of assessment standards
• Weak inspection and supervision
• Inadequate information management and tracking systems
• Highly centralized institutional structures
In addition to overcoming these challenges, some additional strategic issues should also be considered, such as:
• Mechanisms to attract highly skillful candidates into the teaching profession
• Innovative pre-service and in-service approaches
• literacy and numeracy performance standards (benchmarks) and incentives for the best performance
• Use of information on test results to improve the quality and equity of education
While the relevance of data is clearly contemplated in Literacy 1-2-3, their use is fairly explicit. Traditionally, the information yielded by the national assessment in Jamaica has not been fully exploited. Information obtained from assessment has often been of poor quality and even when it has not, it has not been systematically factored into decision making. Some countries such as Chile have successfully introduced the use of data in nationwide policy dialogue, and as a consequence it has increased ownership and accountability in the process of decision making. Box 3.4 illustrates how test results can be transformed into

LITERACY AND NUMERACY IN THE CARIBBEAN
84
policy decisions and at the same time can contribute to improving the quality and equity of education.
Box 3.4 Use of assessment results in SIMCE Chile’s national system for educational quality measurement
SIMCE results are used extensively in policy discussions. SIMCE reports classroom data on the average percentage of correct answers for each objective assessed, as well as the average number of correct answers over the entire test. At the beginning of the school year, SIMCE reports results nationally and also by school, location, and region. SIMCE manuals explain the results and how teachers and schools might use them to enhance student achievement. The P-900 program is a Chilean program to improve learning of children who attend free elementary schools located in rural and extreme-urban-poverty areas in the country’s 13 regions. Schools receive support in the form of improved infrastructure; textbooks and classroom libraries; teaching materials; and in-service, school-based workshops. Schools are removed from the P-900 program when their SIMCE scores exceed the 10 percent cut-off limit.
The SNED program—the acronym stands for the national system to evaluate school performance—uses SIMCE scores along with four other measures of school quality. Teachers in the best-performing schools within a region receive a cash award roughly equivalent to a monthly salary. In an effort to ensure equity, the Ministry of Education selects schools catering to similar socioeconomic groups that are classified in terms of urban or rural locations and elementary or secondary school level. Although a range of factors is taken into account in calculating the index, school achievement accounts for almost two-thirds of the index score. The weighting system is regularly modified to reflect policy priorities.
Interesting points. SIMCE uses an intensive public-relations campaign that includes brochures for parents and schools, posters for schools, videos for workshops, television programs, and press releases. Reports are distributed to the principals, municipal leaders, school supervisors, and ministry officials. Parents also receive an individualized report for their school. Newspapers publish school-by-school results. Because municipalities receive funding from the central government on a per-student basis, they have a vested interest in the outcome; good SIMCE results tend to attract more students and hence more revenue. Schools that have a large number of absentees on the date of testing do not receive results.
Source: Arregui and McLauchlan 2005; Himmel 1996, 1997; McMeekin 2000; Olivares 1996; Wolff 1998.
Conclusions and recommendations
This review presents a diagnostic of the current status of literacy and numeracy in the nine Caribbean countries analyzed. It describes recent education programs targeted to improve literacy and numeracy skills and outlines challenges specific to the Caribbean region in raising literacy and numeracy standards, such as: (a) inadequate teacher qualifications, (b) low teaching quality, (c) insufficient monitoring and evaluation of students’

LITERACY AND NUMERACY IN THE CARIBBEAN
85
performance on literacy and numeracy, (d) irrelevant literacy and numeracy curriculum, (e) unequal opportunities to quality education, and (f) insufficient instructional materials.
While improving these factors would substantially improve literacy and numeracy outcomes, it would not be enough to ensure a sustainable and long-term impact on the quality of literacy and numeracy in the region. To make it feasible, several policies (currently absent in the region) have been identified, such as: (a) a regional literacy and numeracy plan, (b) literacy and numeracy benchmarks, (d) regional assessment of literacy and numeracy in grade 4, (e) a national Creole-English literacy and numeracy strategy, and (f) greater parental and community involvement in learning outcomes.
Finally, by providing successful example of countries that have implemented successful literacy and numeracy strategies, the review intends to enable the Caribbean countries to reflect upon adopting and tailoring some of the best practices to their own contexts. Below, we summarize some specific recommendations on how to improve the literacy and numeracy outcomes.
In order to ensure that all school graduates have the literacy and numeracy levels necessary to effectively function in modern society, the region and the individual countries need to implement a number of initiatives to improve the quality of literacy and numeracy performance at the regional, national, and school levels.
Recommendations at the regional level
Create a regional literacy and numeracy plan as a regional initiative. A regional plan would provide a coherent framework for improvement in literacy and numeracy standards, and a clear commitment to the achievement of regional literacy and numeracy goals. It would help in defining and establishing strong foundational literacy and numeracy skills required for students in the early years, which constitute the basis for progress in all future schooling.
Furthermore, while reducing administration costs through closer cooperation at the regional level, this would reduce duplication and lead to more innovative education policies in literacy and numeracy. Possibilities for cooperation abound with the most obvious being: (a) sharing best practices in literacy and numeracy, (b) creating a regional literacy and numeracy

LITERACY AND NUMERACY IN THE CARIBBEAN
86
curriculum, (c) setting regional performance standards, (d) monitoring regional progress of literacy and numeracy outcomes, (e) assessing grade 4 students at the regional level, and (f) strengthening the role of research in order to support literacy and numeracy strategies.
Develop a set of regional literacy and numeracy performance standards (regional benchmarks). The primary objective of benchmarks is to provide a regionally agreed standard to measure systems’ success in improving literacy and numeracy performance. All countries should agree to report students’ achievements against these standards. The measuring of results and distinguishing success from failure would allow both the possibility of correcting failure and learning from success.
Create a regional grade 4 student assessment test in order to measure student achievement in different aspects of the regional curriculum for literacy and numeracy. Regional assessment should report student achievement against learning outcomes—as described in the regional curriculum frameworks—and monitor changes in performance levels over time. The current nonexistence of directly comparable exams at the primary level makes it difficult to make any meaningful comparison of literacy and numeracy outcomes at that level across countries and to objectively benchmark the quality of primary education of each country.
Establish synchronized processes for recording information and managing data across the region for monitoring progress. These processes would utilize sets of indicators that provide consistency across individual countries and a common terminology to describe student achievements. They would also inform individual countries about the development of students’ literacy and numeracy skills over time, provide direction in planning teaching programs, and provide schools and systems with an insight into emerging trends in students’ learning.
Draft a regional policy on vernacular-English to give guidance on how the vernacular could be managed and exploited to its potential while easing learners into competence in the official language, English. Attention to the vernacular is necessary because it plays a major role in structuring the learners’ thinking processes and aids their cognitive development. This process comes to a stop or is reversed when students are immersed in standard English to the neglect of their home language.

LITERACY AND NUMERACY IN THE CARIBBEAN
87
Increase research at the national and regional levels to support the literacy and numeracy policy by: (a) identifying effective teaching practices, including those targeted to disadvantaged students (English as a second language, special needs, low income); (b) evaluating different literacy approaches, and the development of assessment processes for the early identification of students at risk; (c) placing literacy and numeracy in the primary school curriculum; (d) developing literacy programs customized for students with special needs; and (e) creating a community awareness program to promote the importance of parents’ involvement in their children’s literacy and numeracy development.
Encourage reforms at the regional level, such as certification systems and economies of scale (textbooks, literacy and numeracy software) to help conserve limited resources and facilitate teacher mobility/deployment across the region.
Assess Caribbean students’ learning against international standards. As part of regional efforts, the Caribbean countries would benefit from participating in international exams such as the Progress in International Reading Literacy Study (PIRLS), the PISA, the Latin American Laboratory for Assessment of the Quality of Education (LLECE), and the Trends in Mathematics and Science Study (TIMSS). At the primary level, benefits in participating in an international test such as PIRLS, conducted at the fourth grade, can be twofold: (a) to assess students’ performance in literacy in the region and (b) to access relevant information about the policy and practices related to reading instruction. At the secondary level, even if the existence of the CXC provides regional comparisons of learning outcomes, participating in other international exams would still provide some international benchmarking of the regional performance. Also, it would help increase accountability of the education providers for educational outcomes and deepen involvement of the public in achieving education goals. As Caribbean countries strive to compete in the global economy, they need to understand how well their students and education systems perform comparatively on a global scale.
Recommendations at the national level
Implement continuous assessment of early grades at the national level. Continuous assessment measures students’ literacy and

LITERACY AND NUMERACY IN THE CARIBBEAN
88
numeracy achievement in the first years of schooling. Early diagnostic information that includes hard data on actual reading and mathematics levels and the types of miscues that children make is vital to the implementation of appropriate strategies for effective teaching and the facilitation of learning. Some countries such as Guyana, Jamaica, and Trinidad and Tobago have been implementing continuous assessment for several years.
Provide early interventions to address the needs of students at risk. A wide range of intervention strategies may be used successfully to assist students who might be experiencing learning difficulties, especially in the first three or four years of primary education, which constitute a crucial phase in the acquisition of literacy.
Thus, it is through the early diagnosis and the immediate introduction of appropriate measures of remediation that learning difficulties can be addressed efficiently and the cycle of constant remediation in the higher grades and secondary school stopped.
Measure student progress against national/regional literacy and numeracy benchmarks. Clearly stated and agreed-to standards to inform teaching and learning provide a lever to improve the overall quality of literacy and numeracy education.
Teacher education programs need to emphasize the fundamental relationship between literacy achievement and success in all learning areas. Graduates should develop a varied repertoire of literacy teaching approaches and intervention strategies that enable them to meet the diverse needs of the students.
Expose teachers to techniques of differentiated instruction. Such exposure can help teachers manage classrooms that cater to students with diverse cognitive abilities. It is worth noting that training teachers in differentiate instruction (DI) would be of benefit not only to the weaker students but also to the more able ones. The goal of DI is to help students of all abilities to achieve at their highest potential. Trinidad and Tobago is already using this approach.
Provide schools with support in the process of monitoring and use of assessment data. It is important to set up district teams to monitor, support, and guide schools in the use of both external (national tests) and internal assessment (continuous assessment) data for identifying students at risk and planning intervention programs.

LITERACY AND NUMERACY IN THE CARIBBEAN
89
Establish an independent body with the capacity for investigating, monitoring, and reporting on system performance in literacy and numeracy.
Recommendations at the school level
Establish in-service training as a routine practice through on-the-job coaching. This is a practice in which expert teachers, trained in how to coach other teachers, give feedback, model instruction, and share in planning. Coaching interventions can lead to a substantial improvement in outcomes in a short time.
Support the ongoing use of practical skills exercised during the initial teacher training through (a) one-on-one coaching of sessions in which teachers have the opportunity to assess their own weaknesses and (b) sharing best practices among teachers, which enables them to learn from each other and shape a common aspiration to improve the quality of instruction. Effective induction programs could, if properly structured, help new teachers see the potential connections between the problems they face and the knowledge they have acquired thus far in their development.
Promote an environment conducive to improving teaching performance. Examples of such practice include cooperative teaching practices, where teachers jointly plan and analyze teaching practices based on assessment data. The practices are facilitated by the principal or one of the literacy coaches, who use data as the basis for structured discussion.
Develop leadership in schools in order to provide effective literacy and numeracy teaching support. Growing consensus on the attributes of effective school principals shows that successful school leaders influence student achievement through two important pathways—the support and development of effective teachers and the implementation of effective organizational processes (Di Gropello 2003). Without an effective principal, a school is unlikely to have a culture of high expectations or strive for continuous improvement.
Engage meaningful parental involvement in the schools by offering parents a variety of roles in the context of a well-organized program that entails: (a) keeping parents informed about their children’s school performance; (b) communicating to parents that their involvement and support makes a great deal of difference in their children’s school performance; (c)

LITERACY AND NUMERACY IN THE CARIBBEAN
90
encouraging parental involvement from the time children first enter school; (d) teaching parents that activities such as modeling reading behavior and reading to their children increases children’s interest in learning; (e) developing programs that include a focus on parent involvement in instruction, including conducting learning activities with children at home, assisting with homework, and monitoring and encouraging the learning activities of older students; and (f) continuing to emphasize that parents are partners of the school and that their involvement is needed and valued (Cotton and Reed Wikelund 1989).
References
ACCI (Australian Chamber of Commerce and Industry). April 2007. Skills for a Nation: A Blueprint for Improving Education and Training 2007–2017. Leading Australian Business.
ACER (Australian Council of Educational Research). 1999.
Arregui, P. and McLauchlan, C. (2005). Utilization of large-scale assessment results in Latin America. Unpublished manuscript, 2005. PREAL and the World Bank Institute.
Barber, Michael, and Mona Mourshed. 2007. How the World’s Best-Performing School Systems Come Out on Top. Social Sector Office, McKinsey & Company. September.
Blom, Andreas, and Cynthia Hobbs. February 2008. School and Work in the Eastern Caribbean. Washington, DC: World Bank.
Caribbean Examinations Council. 2005. Annual Report. Barbados.
———. 2006. Annual Report. Barbados.
CBI (Confederation of British Industry). August 2006. Working on the Three Rs; Employers’ Priorities for Functional Skills in Math and English, pp 5–6. Department for Education and Skills, UK.
Cotton, Kathleen, and Karen Reed Wikelund. May 1989. Parent Involvement in Education.
Craig, D. R. 1999. Teaching Language and Literacy: Policies and Procedures for Vernacular Situations. Georgetown, Guyana: Education and Development Services, Inc.
Currie, Janet, and Duncan Thomas. 1999. “Early Test Scores, Socioeconomic Status and Future Outcomes.” NBER Working

LITERACY AND NUMERACY IN THE CARIBBEAN
91
Papers 6943, National Bureau of Economic Research, Cambridge, MA.
Darling-Hammond, L. 1999. Teacher Quality and Student Achievement: A Review of State Policy Evidence. Seattle, WA: Center for the Study of Teaching and Policy.
Davis, Stephen. 2005. School Leadership Study: Developing Successful Principals. Review of Research. Stanford Educational Leadership Institute.
DFID (U.K. Department for International Development). November 2004. Output to Purpose Review of the OECS Education Development Project—Final Report. U.K
Di Gropello, Emanuela. June 2003. Monitoring Educational Performance in the Caribbean. Washington, DC: World Bank.
Fryer, Michelle. August 2000. “Loan Proposal: Jamaica Primary Education Support Project (PESP).” Inter-American Development Bank. Washington, DC.
Gaible, Edmond. 2008. Review of ICT in Education in the Caribbean. Washington, DC: InfoDev.
Griffith, Stafford. November 2007. The Caribbean Center of Excellence for Teacher Training (C-CETT) Annual Performance Report 2006–2007. USAID Cooperative Agreement 532-A-00-06-00076-00, Kingston.
Guyana Ministry of Education. 2004. “Digest of Education Statistics of Guyana 2003–2004”.
Haan, Hans Christiaan, and Nicholas Serriere. 2002. “Training for Work in the Informal Sector: Fresh Evidence from West and Central Africa.” International Training Center of the ILO, Turin, Italy.
Hanushek, Eric A. and Ludger Wössmann. 2007. "The role of education quality for economic growth." Policy Research Working Paper Series 4122, World Bank, Washington, DC.
Himmel. E. 1996. “National Assessment in Chile.” In National Assessments: Testing the System, ed. P. Murphy, V. Greaney, M. E. Lockheed, and C. Rojas, 111-28. Washington, DC: World Bank.
Hobbs, Cynthia. May 2002a. Implementation Completion Report (SCL-39690; IDA-28030 for a Basic Education Reform Project for Dominica. World Bank, Washington, DC.

LITERACY AND NUMERACY IN THE CARIBBEAN
92
———. May 2002b. Project Appraisal Document for the First Phase of the Multi-Country Organization of Eastern Caribbean States (OECS) Education Development Program for the Governments of the OECS. World Bank, Washington, DC.
———. June 2003c. Project Appraisal Document for the OECS Education Development Project in Support of the Second Phase of the OECS Education Development Program. World Bank, Washington, DC.
ISCA (Institute for Standards, Curricula and Assessments of the United Teachers Educational Foundation). 2001. Los Angeles, CA. http://www.iscaonline.org/ISCA/iscasitepublic/index.php
Leithwood, Kenneth, Christopher Day, Pam Sammons, Alma Harris, and David Hopkins. 2006. Seven Strong Claims about Successful School Leadership. United Kingdom: National College for School Leadership.
Lochan, Samuel. June 2005. A Harmonized Policy Framework for Teacher Education, Recruitment and Selection. Policy Brief, Organization of American States, Washington, DC.
Lockheed, Marlaine, Abigail Harris, Paul Gammill, and Karima Barrow. 2006. “Impact of New Horizons for Primary Schools on Literacy and Numeracy in Jamaica 1999–2004.” Journal of Education for International Development 2:1.
McMeekin, R.W. 2000. Implementing School-Based Merit Awards: Chile’s Experiences. Washington, DC. World Bank.
Meiers, Marion. 1998. Literacy for All: The Challenge for Australian Schools. Document Number DEETYA Number 5954.STEQ97A, Australian Department of Education.
Ministry of Education of the Republic of Trinidad and Tobago. 2005. National Test Report 2005. Jhullian Graphics Communications Limited, Port of Spain.
Murnane, Richard J., John B. Willett, and Frank Levy. 1995. "The Growing Importance of Cognitive Skills in Wage Determination," The Review of Economics and Statistics, MIT Press, vol. 77(2), pages 251-66, May
Nuamah, Camille. 2005. “Towards a New Agenda for Growth,
Organization of Eastern Caribbean States.” Report 31863-LAC, World Bank, Washington, DC. April
Olivares, J. 1996. “Sistema de Medición de la Calidad de la Educación de Chile: SIMCE, Algunos Problemas de la

LITERACY AND NUMERACY IN THE CARIBBEAN
93
Medición.” Revista Iberoamericana de Educación 10. http://www.ricoci.org/ocivirt/rie10a07.htm.
PIOJ (Planning Institute of Jamaica). 2007. Economic and Social Survey Jamaica 2007.
Pirog, M. and Kioko, S. 2006. Evaluation of the Education Sector Enhancement Project in Barbados. Paper presented at the annual conference of the Association for Public Policy Analysis and Management (APPAM), Madison, WI.
Simmons-McDonald, H. 1993. “Language and Education Policy: The Case for Creole in Formal Education.” Paper presented at the symposium on Creole Into The 21st Century, Castries, St Lucia, 26–27 October.
Solomon, Victorine, and William Kellman. 2006. Basic Education, Access, and Management Support (BEAMS) Program, Loan Number 1107/SF-GY, Final Report on Component 1: School Performance. IDB. Washington, DC. December.
St. Lucia Ministry of Education and Culture. January 2007. Assessment Guide for Teachers in Saint Lucia. Castries.
———. 2008a. MST-SBA 2008, Trial Run Report. Castries. April.
———. 2008b. MST-SBA 2008, District Student Performance Report. Castries. April.
______. 2008c. Common Entrance Examination (CEE) 2008: Report on Candidates Performance. Castries.
______. 2008d. Education Statistical Digest. Castries.
UNESCO (United Nations Educational, Scientific and Cultural Organization). 2005. EFA Global Monitoring Report. Paris, 2005.
———. UNESCO Institute for Statistics. Teachers and Educational Quality: Monitoring Global Needs for 2015, UNESCO, 2006
______ UNESCO Institute for Statistics (UIS), Data Center. January 2008. http://stats.uis.unesco.org/unesco/ReportFolders/ReportFolders.aspx.
Ward, Angela, and Michael Fulton. April 2002. Literacy and Numeracy in Primary and Secondary Schools in Saint Lucia. Castries.
World Bank. 1999. The Public Sector in the Caribbean: Issues and Reform Options. Policy Research Working Paper 1609. World Bank, Washington, DC.

LITERACY AND NUMERACY IN THE CARIBBEAN
94
Wolff, L., 1998. “Educational Assessment in Latin-America: Current Progress and Future Challenges”. Working Paper 11, Programa de Promoción de la Reforma Educativa en America Latina y el Caribe, Partnership for Educational Revitalization in the Americas, Washington, DC.

Chapter 4 Explaining Gender Differences
in School Performance throughout the Caribbean
Barbara Bailey
Barbara Bailey is professor and regional coordinator of the Centre for Gender and Development Studies, University of the West Indies. She was formerly specialist lecturer in curriculum studies in the School of Education, UWI, Mona, Jamaica. Her recent teaching and research has focused on gender and education, with particular emphasis on the relationship of educational outputs to outcomes in the economic, social, and political spheres for both genders.
Professor Bailey’s original research has filled an important niche in the literature and had important implications for public educational policy. Over the years, she has improved our understanding of the complexity of gender and human resource development and highlighted the importance of equal opportunity through education. In 2008 she won the Ninth CARICOM Triennial Award for Women, which honors women of distinction in the Caribbean whose work had made a significant contribution to socioeconomic development at the national and regional levels.
Professor Bailey served as chair of the National Gender Advisory Committee appointed by the Government of Jamaica to develop a strategic and comprehensive policy for achieving gender equality and social justice and provide direction, coordination, integration, and monitoring of gender mainstreaming activities of the government. In 2006, she headed Jamaica’s delegation to the 36th Session of the UN Committee on the Elimination of Discrimination against Women. At the regional level, Professor Bailey has served as advisor to CARICOM on several occasions.

LITERACY AND NUMERACY IN THE CARIBBEAN
96
This paper draws on data from a broader research initiative. The project on Gender Differentials at the Secondary Level of the Education System in the Anglophone Caribbean is funded by multiple sources, mainly the Caribbean Development Bank.
The objectives of the study presented here were:
• To identify gender differentials in enrollment, curriculum choices, and performance of boys and girls at the fourth form (grade 10) level of secondary schools in four Caribbean countries
• To examine sociocultural, economic, and political factors accounting for boy/girl differentials in this regard in an effort to provide an explanation of gender-based advantages and disadvantages in education systems of the Caribbean
A major intention underpinning the design of the study was to test the male underachievement thesis undergirded, as it is, by the cultural or sex-role socialization theory. That theory claims that gender differences in subject enrollment and performance are due mainly to differential socialization of the sexes imposed by the home and school, whether wittingly or unwittingly.
The discourse around this phenomenon has, for the most part, focused on an uncritical comparison of males with females. Based on that comparison, the general conclusion is drawn that males are underperforming. Little attention has been given to the impact of culture and belief systems, however—or to the range of personal, social, and economic factors that both independently and in combination could account for differences not only between but also within the two sexes. Further, little attention has been given to broader socioeconomic and social outcomes for males and females beyond school, where labor-market participation and other social, economic, and political indicators are not congruent with the male-marginalization thesis. These concerns prompted the Centre for Gender Development Studies (CGDS) to undertake a major research project in an effort to determine points of advantage or disadvantage for either gender, as well as factors that account for observed patterns.
In the study, several factors related to the students and to the schools were measured with a view to determining their contribution to observed patterns of performance. These were grouped into two broad categories: personal (or micro-level) factors and school-related (or macro-level) factors.

LITERACY AND NUMERACY IN THE CARIBBEAN
97
In this paper, we explore the following themes:
• Demographic profile of the school and student samples
• Student enrollment in classes in English language and mathematics
• Differences in enrollment by country, sex, and school type (single sex/coeducational)
• Performance in mathematics and English language by country and a range of personal and school-related factors
• Factors associated with performance in mathematics and English language
The school sample: Macro-level factors
The data for the larger study that generated the data for this paper were derived from fourth form (grade 10) students attending 39 schools in Belize, Guyana, Jamaica, and Trinidad and Tobago. The schools were selected to represent a demographically diverse population. Schools were selected based on the following criteria:
• Location (urban/rural)
• Type of school administration (church/state)
• Curriculum of the school (traditional/technical-vocational)
• Sex distribution of the school population (single-sex/coeducational)
Student sample distribution: Micro-level factors
The student sample was divided among the countries under investigation based on the school population in each country. Thus, the largest groups of students were drawn from Jamaica (34.17 percent) and Trinidad and Tobago (34.80 percent). They were sampled to produce a group that represented the diversity of the Caribbean population. Students from Belize made up 13.3 percent of the sample; those from Guyana the remaining 17.72 percent.
Students were selected to represent variations on a number of personal factors, in addition to sex. Of the 1,586 students who

LITERACY AND NUMERACY IN THE CARIBBEAN
98
participated in the research exercise, 680 were male (43 percent) and 906 female (57 percent). Detailed distributions on the basis of country and sex are set out in a longer version of the paper available from the author. The figures below represent the distribution based on these factors for the overall sample.
• Ethnicity. Afro-Caribbean, 40 percent; Indo-Caribbean, 30 percent; indigenous groups, 7 percent; other 30 percent
• Religion. Christian, 76.8 percent; Hindu, 13.4 percent; Muslim, 3.1 percent; other, 6.8 percent
• Household size. 0–3 persons. 54.5 percent; 4–6 persons, 36.7 percent; 7–9 persons, 6.8 percent; more than 9 persons, 2.1 percent.
• Parents’ education. primary, 12.3 percent; secondary, 39.5 percent; tertiary, 36.9 percent; “don’t know,” 11.4 percent.
• Previous school attended. pre-school, 9.9 percent; government (public) primary, 60.6 percent; church primary, 17.1 percent; preparatory (private), 12.4 percent.
Data on enrollment and performance in the two subject areas were disaggregated on the basis of these factors to determine the extent to which each factor influenced observed patterns. In relation to performance, these factors were also entered into statistical analyses aimed at determining the extent to which the theorized variables contributed to observed variance and therefore had predictive power.
Patterns of enrollment in classes in English language and mathematics
In most secondary schools across the region, students are encouraged—if not mandated—to complete courses of study in English language and mathematics. Students were provided with a list of 39 subjects offered at their level and asked to indicate those in which they were participating at the time of data collection.
Students were not required to offer reasons for not doing these particular subjects. In the instance of English language, 15 students (M = 9, F = 6) did not respond to the item, whereas

LITERACY AND NUMERACY IN THE CARIBBEAN
99
in the case of mathematics, 14 (M = 8, F = 6) students did not respond. The accompanying figures detail the percentage of students indicating enrollment (Taking) as a proportion of those completing the item on the instrument (Eligible)
English language and mathematics both enjoyed enrollment rates in excess of 90 percent. However, a higher rate was recorded for English language (97.26 percent) than for mathematics (91.73 percent).
When disaggregated on the basis of sex, female students recorded higher enrollment rates than their male colleagues in English language (F: 97.26 percent / M: 96.72 percent) but male/female enrollment rates for mathematics were the same (F: 91.73 percent / M: 91.67 percent) (figure 4.1).
When the data were disaggregated on the basis of country and
sex, the following was observed (figure 4.2):
• In all countries both sexes showed higher enrollment in English language than in mathematics.
• In the case of English language, female students in Belize (94.44 percent) and Trinidad and Tobago (98.82 percent) indicated higher rates of enrollment than male students, whose rates of enrollment were 91.6 percent and 96.6 percent respectively. The reverse was true in Guyana and Jamaica, where male students (96.7 and 99.19 percent respectively) showed higher rates of enrollment in English
Figure 4.1 enrollment in classes in English language and mathematics by sex
88
89
90
91
92
93
94
95
96
97
98
Eng Lang Maths
Male
Female
Male Female Source: Author.

LITERACY AND NUMERACY IN THE CARIBBEAN
100
language than their female counterparts (95.58 and 98.62 percent).
• In mathematics, female students in Belize (91.11 percent), Guyana (87.85 percent), and Trinidad and Tobago (92.92 percent) all indicated higher rates of enrollment in mathematics than male students.
• Male students in Jamaica had the highest rates of enrollment in both English language (99.19 percent) and mathematics (95.98 percent).
Figure 4.2 Enrollment in classes in English language and mathematics by country and sex
70.00%
75.00%
80.00%
85.00%
90.00%
95.00%
100.00%
English 91.60% 94.44% 96.97% 95.58% 99.19% 98.62% 96.60% 98.82%
Mathematics 89.92% 91.11% 83.00% 87.85% 95.98% 93.10% 91.67% 92.92%
Male Female Male Female Male Female Male Female
Belize Guyana Jamaica Trinidad
Source: Author.
Comparisons by school type, country, and sex yielded the following findings.
English language
Coeducational schools. In Belize and Trinidad and Tobago, the rate of enrollment of female students in coeducational schools (96.1 and 99.6 percent) was higher than that of males (87.7 and 95.8 percent). In Guyana and Jamaica, the reverse was true, with

LITERACY AND NUMERACY IN THE CARIBBEAN
101
males (97 percent and 99.4 percent) having higher enrollment rates than females (95.6 percent and 98 percent).
Single-sex schools. In Belize and Trinidad and Tobago, opposite trends to those seen in coeducational schools were observed. In single-sex institutions, there was higher rate of enrollment in English language by male students than female students. In Jamaica however, there was a higher rate of female enrollment. Guyana has no single-sex schools.
Mathematics
Coeducational schools. In coeducational schools in every country under investigation, save Jamaica, rates of enrollment in mathematics were higher for female students than for male students.
Single-sex schools. In single-sex schools however, higher rates of enrollment were recorded by male students than by female students in Belize and Trinidad and Tobago. Jamaica showed equal rates for both sexes. There are no single-sex schools in Guyana.
Mean performance on English language and mathematics
Teachers were asked to supply the marks obtained by students on all subjects for the school-based examinations taken prior to the time of data collection. Information was not supplied for all students, but except in Trinidad and Tobago the response rate was high. Means were calculated based on the information received.
Overall—that is, for all subjects for all countries—mean performance was generally poor, with lower mean performance on mathematics (54.64 percent) than on English language (59.39 percent).
Performance in both subject areas was disaggregated on the basis of the range of personal factors to determine the extent to which these factors were determinants of performance. The following patterns emerged:
Mean performance by sex and country of residence
When overall data were disaggregated on the basis of sex, on average, male students performed better than female students in

LITERACY AND NUMERACY IN THE CARIBBEAN
102
both English language (M: 59.61 percent / F: 59.19 percent) and mathematics (M: 55.76 percent / F:53.52 percent).
When examined on the basis of country, as with school type, average performance in English language continued to be superior to that in mathematics, in all countries.
The average performance of students in Belize in both English language and mathematics was superior to that of their colleagues in Guyana, Jamaica, and Trinidad and Tobago. The mean performance of students from Jamaica was consistently lower in both English language (52.75 percent) and mathematics (44.61 percent) than the other three countries under investigation.
These patterns reflect trends observed in results collected by the Caribbean Examinations Council (CXC), where performance in English language tends to be better than that in mathematics. Results from CXC’s 2003 General Proficiency examinations bear witness to this, as seen in figure 4.3.
Mean performance by country and sex
Another method of comparing the performance of boys and girls is by generating so-called gender parity indices. A GPI of 1 indicates parity between the sexes; a GPI below 1 indicates a disparity in favor of boys; and a GPI greater than 1 indicates a disparity in favor of girls (EFA Global Monitoring Report 2002, p. 305). When indices were calculated for English language and mathematics by country, we found that, in Belize, male students were the better performers in both subject areas, whereas in Guyana, Jamaica, and Trinidad and Tobago female students showed better performance in both areas.
In relation to the ethnic groups included in the sample, those who described themselves as “indigenous” had the highest mean performance. Conversely, it was the Afro-Caribbean group that showed lowest mean performance on both English and mathematics (figure 4.4).

LITERACY AND NUMERACY IN THE CARIBBEAN
103
With further disaggregation on the basis of ethnicity and
country, Belize maintained the top ranking, with all ethnic groups in that country doing better than those in the other countries. In Jamaica, Indo-Caribbeans (males and females) were the lowest performing group in both subject areas, whereas in Trinidad and Tobago they did slightly better than the Afro-Caribbean group (figure 4.5).
Figure 4.3 Pattern of performance in English language and mathematics by country
Source: Author.
Figure 4.4 Performance in English language and mathematics by ethnicity
0.00
10.00
20.00
30.00
40.00
50.00
60.00
70.00
80.00
English language 55.30 59.94 70.46 62.85
Mathematics 47.54 59.23 70.61 58.41
Afro-Caribbean Indo-Caribbean Indigenous Groups Others
Source: Author.

LITERACY AND NUMERACY IN THE CARIBBEAN
104
As expected, when parents’ level of education was considered,
students who reported parents with tertiary level education were the better performers in both English language and mathematics—except in Trinidad and Tobago, where better performance was associated with parents having a secondary education (figure 4.6).
Figure 4.5 Performance in English language and mathematics by ethnicity and country
0.00
10.00
20.00
30.00
40.00
50.00
60.00
70.00
80.00
English language 70.30 72.78 75.94 75.71 57.89 58.14 58.81 61.48 52.42 48.15 54.75 59.58 61.47 60.59Mathematics 64.59 74.56 75.73 76.13 50.60 57.73 61.00 52.32 44.07 38.31 47.13 54.06 62.02 58.61
Afro Indo IndigenousOthers Afro Indo IndigenousOthers Afro Indo Others Afro Indo OthersBelize Guyana Jamaica Trinidad &Tobago
Source: Author.
Figure 4.6 Performance in English language and mathematics by parents’ level of education
0.00
10.00
20.00
30.00
40.00
50.00
60.00
70.00
80.00
English language 74.54 73.31 74.97 58.73 57.27 61.27 45.70 51.98 56.68 60.08 62.56 60.70
Mathematics 74.38 72.45 74.95 52.35 52.46 56.58 38.37 45.50 46.09 55.55 60.02 59.64
Primary Secondary Tertiary Primary Secondary Tertiary Primary Secondary Tertiary Primary Secondary Tertiary
Belize Guyana Jamaica Trinidad &Tobago
Source: Author.

LITERACY AND NUMERACY IN THE CARIBBEAN
105
Disaggregation of results on the basis of school-related factors revealed the following expected overall trends.
School-type. There are no single sex schools in Guyana, but in all other countries students in single-sex schools showed better performance in both subject areas than their counterparts in coeducational schools (figure 4.7).
School location. Students attending schools in urban areas performed better than those in rural areas in both English language (U: 61.95 percent / R: 56.51 percent) and mathematics (U: 57.52 percent / R: 50.94 percent) (figure 4.8).
Figure 4.7 Performance in English language and mathematics by school type
46
48
50
52
54
56
58
60
62
64
Co-edu Single Sex
Co-edu 58.3 53.2
Single Sex 63.7 59.8
Eng Lang Maths
Source: Author.

LITERACY AND NUMERACY IN THE CARIBBEAN
106
School administration. Students attending church-run schools
had superior performance in both English language (66.86 percent) and mathematics (64.365) when compared to students attending state-run schools, whose average performance for English and mathematics was 56.98 percent and 51.44 percent respectively (figure 4.9).
Orientation of school curriculum. Students from traditional high schools (academic schools) performed, on average, better in both English language (60.69 percent) and mathematics (56.06 percent) than those from technical schools (English: 56.72 percent / mathematics: 51.19 percent) (figure 4.10).
Figure 4.8 Performance in English language and mathematics by school location
0.00
10.00
20.00
30.00
40.00
50.00
60.00
70.00
English language 61.95 56.51
Mathematics 57.52 50.94
Urban Rural
Source: Author.

LITERACY AND NUMERACY IN THE CARIBBEAN
107
Figure 4.9 Performance in English language and mathematics by school administration (church/state)
Socioeconomic status of school community. Students from
schools in locations with high and middle socioeconomic status performed best in English language (65.70 percent) and mathematics (68.06 percent). Students from locations with low socioeconomic backgrounds were consistently the worst performers in English language (55.57 percent) and mathematics (49.26 percent) (figure 4.11).
0.00
10.00
20.00
30.00
40.00
50.00
60.00
70.00
English language 56.98 66.86Mathematics 51.44 64.36
State Church
Source: Author.
Figure 4.10 Performance in English language and mathematics by curriculum orientation
46.00
48.00
50.00
52.00
54.00
56.00
58.00
60.00
62.00
English language 60.69 56.72
Mathematics 56.06 51.19
Academic Technical
Source: Author.

LITERACY AND NUMERACY IN THE CARIBBEAN
108
Value of selected factors for predicting performance
As indicated earlier, to fully understand the factors accounting for patterns of performance in English language and mathematics we made a deliberate decision to move away from a univariate analysis based only on between sex differences in favor of a more robust multivariate research framework that incorporated a range of theorized variables affecting performance. We expected that this would allow for a more nuanced analysis and would allow us to test the entrenched notion that difference in performance is primarily associated with gender, as reflected in the popular and entrenched view of male underachievement.
To determine the relationships between the selected demographic factors and performance in English language and mathematics, we completed an analysis of variance (ANOVA). This statistical model enables us to make inferences by analyzing the variance in the means of all variables under consideration. All demographic variables discussed earlier were included in the analysis except for household size. Similar to measurements used in the T-test, a significance value of 0.05 was chosen to determine statistically significant difference.
Figure 4.11 Performance in English language and mathematics by socioeconomic status of school location
0.00
10.00
20.00
30.00
40.00
50.00
60.00
70.00
English language 65.70 63.16 57.05 55.57
Mathematics 63.77 68.06 50.34 49.26
High SES Middle SES Middle to Low SES Low SES
Source: Author.

LITERACY AND NUMERACY IN THE CARIBBEAN
109
In addition, in order to determine the strength and direction of the relationship between performance and demographic factors, we calculated parameter estimates. When one examines the outcome of this analysis, based on the strength of the association, some factors emerge as being more powerful predictors of performance than others, with variations among countries. Further in most instances, but not in all, the direction of the association was in keeping with theorized expectations. Details of the results are provided in a longer version of this paper available upon request.
Significant relationships observed by country and subject area are itemized in table 4.1. Our results indicate that one cannot draw inferences solely on the basis of a factor’s significance. One must also determine the direction of the association, which sometimes runs counter to expected norms.
Table 4.1 Significant factors explaining variance in performance
Country English language Mathematics Belize Sex of the student—in this case the direction of the association was
with male students; ethnicity—Afro-Caribbean students being the worst performers in both subjects; previous school attended (church-run preparatory school), socioeconomic status of school location (middle to lower status), geographic location (urban), curriculum orientation (technical schools).
Sex of student, ethnicity, geographic location, school administration, curriculum orientation.
Guyana No significant factors. Sex of student, socioeconomic status of school location, geographic location.
Jamaica Sex of student, school type, previous school attended, socioeconomic status of school location, parents’ education.
Previous school attended.
Trinidad and Tobago
School administration. Socioeconomic status of school location, curriculum orientation.
Source: Author.
The results of the analysis of variance indicate that the selected factors are significant in explaining performance in these two subject areas with variations from one country to another. In most instances the direction of the difference coincided with the expected association of these factors with performance. It must be noted that the sex of the student is not always a significant determinant of performance. The selected factors were most useful for predicting performance in both subject areas for Belize and for predicting performance in English language in Jamaica, but not as useful in the other instances, indicating that there are other factors, not included in this study, operating in those cases.

LITERACY AND NUMERACY IN THE CARIBBEAN
110
Although there were exceptions, the general trends are as follows.
• Performance in single-sex schools was better than in coeducational schools.
• Students of ethnicities other than Afro-Caribbean exhibited better performance.
• Students in schools in locations of high and middle socioeconomic status performed better than those from locations with lower socioeconomic status.
• Better performance was observed in church-run than state-run schools.
• Students in schools in urban areas performed better than those in rural areas.
• Students from schools with a traditional academic curriculum did better than those in technical schools.
• Students who attended preparatory schools before going to a secondary school did better than those who attended government primary schools.
No reference is made to performance based on sex, because in all instances this is mediated by each of the factors investigated, so that one sex is favored in one instance but not in another. It is that mediation that underlies the need for a multivariate research design that enables us to analyze the interaction of students’ sex with a range of other theorized contributory variables. Details of the interaction between sex, country, and each of the independent factors are included in the full paper, available from the author upon request.
The political-economy perspective
Many of the factors isolated for incorporation in this study have either a direct or indirect link with socioeconomic status. Studies carried out by UNESCO and UNECLAC point to the fact that in Latin America and the Caribbean survival rates to grade 5 are significantly lower than school access rates and that three factors were associated with the likelihood of dropping out of school: socioeconomic level, residence in a rural or urban area,

LITERACY AND NUMERACY IN THE CARIBBEAN
111
and ethnic origin—with the sharpest disparity related to household income.
The data presented in this paper pertain to students who are still in school. No account is taken of those who drop out, or are forced out, of the formal educational system and who ought to be the focus of a policy dialogue on literacy and numeracy. A consideration of this group and the factors accounting for its underparticipation in the educational system leads us to adopt a political-economy perspective and to inquire into the macro-level structures and processes that contribute to the dropout problem. Here, social class assignment is of paramount importance. Although class status affects both boys and girls, it appears to have more obvious and disastrous effects on boys. Its effects have repercussions for social cohesion and national development.
We turn now to some of the ways in which the structure of opportunity in Caribbean economies sends a clear message to male students, particularly those from lower socioeconomic groups, that certification and, by extension, skills in literacy and numeracy, are not necessary to earn an income. Data for the English-speaking Caribbean countries clearly indicate that the economic system (both formal and informal) privileges men—whether or not they hold school credentials. As long as these structures of opportunity remain intact there is little motivation for boys to succeed in school.
In Caribbean labor markets men with low levels of certification are able to earn more than women with higher levels of certification. Data for 2000 show that the rate of unemployment for women age 15 and over exceeded that of men in nine Caribbean countries for which data were available (figure 4.12). Across the region, women are subjected to longer periods of unemployment than are men. Studies show that the demand for low-skilled male labor is much greater than demand for low-skilled female labor. That higher level of demand is a disincentive for boys to remain in school and results in their premature harvesting into the paid labor force.

LITERACY AND NUMERACY IN THE CARIBBEAN
112
Figure 4.12 Unemployment rates among population 15 years and older, by sex
0 5 10 15 20 25
Antigua & Barbuda
Bahamas
Barbados
Belize
Dominica
Grenada
Guyana
Jamaica
Montserrat
St. Kitts & Nevis
St. Lucia
St. Vincent & Grenadines
Suriname
Trinidad & Tobago
Male Female
Source: Author.
These patterns are also partly driven by socialization and ideology. When financial resources are scarce, boys are withdrawn from school to augment the family income, whereas girls are kept in school in an effort to delay early pregnancy.
A further disincentive to male students—one particularly relevant to the phenomenon of the alienation of working class boys from formal education—is the possibility of finding economic gain in the informal economy.
Opportunities for engagement in the music and sport industries draw many boys away from school. When interviewed in a study of dropouts, many of the boys identified music and sport personalities as their role models—little wonder, given the level of income that, with limited educational attainment, performers can generate through these activities. Further opportunity to engage in these endeavors is also being supported by arrangements under the Caribbean Single Market and Economy, which allows for the free movement of musicians and athletes.

LITERACY AND NUMERACY IN THE CARIBBEAN
113
Engagement in the drug and gun trades is another (dangerous) route to quick and lucrative returns. Although some women participate in these activities, opportunities appeal mainly to young men. Although risky, these opportunities offer immediate gratification and cannot be ignored in the search for explanations for male underparticipation in the formal education system. In fact, reports coming out of Jamaica indicate that schools are favored recruiting grounds for criminals. Schoolboys are actively recruited as middlemen in the movement of drugs and guns inside and outside of schools.
The dynamic interplay between the cultural and political-economy perspectives
To fully understand the range of factors explaining school outcomes—not only in literacy and numeracy, but across the curriculum—a more holistic and nuanced approach needs to be taken to the problem. Often these issues are treated somewhat superficially, and interventions are therefore not appropriate to address the complexities of the situation.
Linden Lewis (2004), a noted Caribbean scholar, articulates the problem succinctly and eloquently:
In many (academic) discourses … [r]ather than contextualize the nature of the problem … in terms of structural determinants, many reduce the problematic to the level of the individual or the collectivity, so that the issue becomes conceptualized as pathology to be corrected without reference to wider social (economic, political) considerations.
Lewis’s comment reinforces our own conviction that the problem of differences in performance is more structural than it is individual or collective. We have attempted to bring these two major dimensions into a dynamic relationship in the analytical framework shown in figure 4.13.
Such a conceptual model allows us to take both the cultural and the political-economy perspectives into account, to address micro- and macro-level factors and to better understand differences between and within the sexes, mediated as they are by a range of personal and structural factors that impinge on performance.
Consistent with this approach, a World Bank report on youth and social development in Trinidad and Tobago, published in 2000,

LITERACY AND NUMERACY IN THE CARIBBEAN
114
points to the need for a paradigm shift in research and policy formulation to address youth issues. The report recommended that instead of focusing on negative outcomes related to single, univariate issues and interventions to treat symptoms and to avoid repetition of undesired events, we should take into account the broader social, institutional, and structural context of youth development. The report suggests that such an approach would allow for an analysis of risk antecedents and behaviors that underlie negative outcomes, enabling us to address causes rather than symptoms and to take a more integrated approach to the interrelated factors behind the problems we face.
Williams (2002) suggests that if governments want a more socially cohesive society characterized by less violence and a greater rate of human and social capital accumulation, they are advised to go further upstream and deal with the underlying structural problems that create the 20 percent of young people who account for 80 percent of youth problems. By moving upstream and examining structural issues we can build a region in which future generations, on whom prosperity and peace depend, can develop into rounded and productive citizens.
Figure 4.13 Theoretical/explanatory framework
Theoretical / Explanatory Framework
31
MACRO LEVEL
MICRO LEVELGIRLS
STUDENTSBetween group
Differences
BOYS
BOYSWithin Group
Differences
HOME
WIDER SOCIETY
GIRLSWithin Group
Differences
Access & Participation & TreatmentSCHOOLOutcome
Socio-economic statusEthnicity/ReligionFamily Structure
EnrolmentCurriculum Choice
Resources to support curriculum
Sexual politicsGender justice
Transition to world of work
Cultural Norms The economyGovernance &
decision-making
Source: Author.

LITERACY AND NUMERACY IN THE CARIBBEAN
115
References
EFA Global Monitoring Report. 2002. Education for All: Is the World on Track? Paris: UNESCO.
Lewis, Linden. 2004. “Caribbean Masculinity at the Fin de Siècle.” In R. Reddock (ed.), Interrogating Caribbean Masculinities, Theoretical and Empirical Analyses. Mona, Jamaica: UWI Press.
World Bank. 2000. “Trinidad and Tobago Youth and Social Development: An Integrated Approach for Social Inclusion.” World Bank Report 20088. June.
Williams, Lincoln. 2002. “A Review of the Issues Arising from Selected Quantitative and Qualitative Literature on Youth in the Caribbean.” Unpublished paper, Social Policy Group, Latin America and Caribbean Region, World Bank, Washington, DC.
Chapter 5 The Role of Language and
Dialect in the Development of
Literacy and Basic Skills in the
Caribbean
Hazel Simmons McDonald
Dr. Hazel Simmons-McDonald is a professor of applied linguistics at the Department of Language, Linguistics and Literature of the University of West Indies in Cave Hill, Barbados. She received a master’s degree in international development education and linguistics and a doctorate in linguistics from Stanford University. Her research interests include applied linguistics, language acquisition and learning, teaching of English in Creole contexts, and literacy in French Creole. Since August 2007 she has been pro-vice chancellor of the UWI Open Campus at Cave Hill. Before that she served as head of the Department of Language, Linguistics, and Literature, deputy dean for planning, and dean of the Faculty of Humanities and Education at the Cave Hill campus. She travels widely throughout the Caribbean on behalf of the Open Campus, primarily in the 12 countries of the University of the West Indies. Professor Simmons-McDonald taught in the applied linguistics graduate program until May of this year, and she continues to supervise graduate and higher studies programs in the field.
In her book Children’s Minds, Margaret Donaldson cites a brief episode from the novel Cider with Rosie, by Laurie Lee, to illustrate that children do not always understand what teachers

LITERACY AND NUMERACY IN THE CARIBBEAN
117
think they understand or expect them to understand, and that teachers sometimes fail to consider the child’s perspective. This can create a gap between teaching and learning, with unfortunate consequences for the learner in particular. The following is the episode:
I spent that first day picking holes in paper, then went home in a smoldering temper.
“What’s the matter, Love? Didn’t he like it at school, then?”
“They never gave me the present.”
“Present? What present?”
“They said they’d give me a present.”
“Well, now, I’m sure they didn’t.”
“They did! They said: ‘You’re Laurie Lee, aren’t you? Well just you sit there for the present.’ I sat there all day but I never got it. I ain’t going back there again.” (Laurie Lee; cited in Donaldson 1978: 9)
Donaldson also notes in her discussion that adults, like children, can be egocentric, and the teacher in the episode displayed this by not taking the child’s perspective or potential lack of understanding into consideration. She further discusses several of Jean Piaget’s findings about child development, noting, for example, that some may have been derived because the children may not have understood what was expected of them. Donaldson presents evidence from several studies to support this view and to show that children are probably capable of more at an earlier age than Piaget imagined. One example she provides is related to the concept of object permanence, which, in simple terms, means that when an object is hidden from the sight of a very young infant, the object ceases to exist for the child—“out of sight, out of mind.” Piaget proposed that the infant does not begin to have concepts in the same way that adults do until the second year of life, when the child begins to talk. Until that time, the child “only knows objects primarily through his actions on them. The young infant does not have abstract concepts but sensorimotor schemata, which are the action patterns associated with objects.... The infant’s knowledge is restricted to the ways his senses have responded to objects or to his own manipulations of them ... the infant will not begin to have concepts as adults do until the second year of life, around the time language begins” (Ingram 1989: 116).

LITERACY AND NUMERACY IN THE CARIBBEAN
118
Donaldson argues that the way in which Piaget’s experiments were conducted—including how the object at hand is made to disappear—influenced specific outcomes. She refers to experiments1 that replicated Piaget’s object permanent experiment and found that when a room is darkened and the object is made to disappear by removing light from it rather than by being taken away—as was done in Piaget’s experiment—children are observed to reach out to where the object had been before the room was darkened. This provides evidence that the child does, in fact, have some memory of the object.
From other experiments that have been conducted, it was concluded that there was “little indication of the existence of egocentrism as a serious barrier to communication” in the infant (1978: 25). Donaldson claims that “we are all egocentric through the whole of our lives in some situations and very well able to ‘decenter’ in others” (1978: 18). She suggests that Piaget would agree with the assertion that egocentrism “is never wholly overcome,” but notes that the “dispute” with Piaget resides in the extent and the developmental significance of egocentrism in early childhood. She proposes that the differences lie elsewhere, and one infers that these differences relate to whether care is taken to ascertain that children understand what is communicated to them and what is expected of them. A child may find a task “bewildering and senseless” if a teacher fails to “decenter,” that is, to see what the specific needs of the child are. A task—or language—may be perfectly clear to a teacher, but not so to a child.
Apart from highlighting the ambiguity of the phrase “for the present” in the excerpt, and the obvious observations that might be made about the child’s misinterpretation of it and the teacher’s lack of awareness that this particular idiom is too sophisticated for the child, the example is useful because it serves to highlight a fundamental problem that affects learning. First, children do not always understand what is expected of them when they are asked to perform an action or a task. This may be because the language used to describe the action or provide the instruction may not be clear to the child for a number of reasons, including those evident in the excerpt. It may also be because the required action or the task structure itself is not clear. In order for the child to respond appropriately and learn,
1 T. G. R. Bower and J. G. Wishart, “The Effects of Motor Skill on Object Permanence,” published in Cognition and cited in Margaret Donaldson (1978: 20–21).

LITERACY AND NUMERACY IN THE CARIBBEAN
119
she must understand what is being asked of her and she must also be allowed to ask questions to seek clarification. Too often in our classrooms, we do not allow children enough latitude to ask appropriate questions, nor do we interact with them sufficiently—or allow them to interact with each other—to work through their misunderstandings. In many instances, teachers make judgments about a child’s abilities based on whether he or she can perform a given task, but without taking time to explain it in a language the child can easily grasp or even finding out whether the child has understood. This requires communicative exchanges in which the teacher is willing to allow the child to initiate and to probe by asking a series of questions that enable the child to reflect not only on the language that is used, but also on his or her understanding of the language in relation to the task that must be done.
Based on the series of experiments that she reviews, Donaldson (1978) makes some suggestions regarding the capabilities of a normal child, what is required for the child to function and to be successful in school, and what the school can do to better facilitate the child’s learning. I summarize these points in three categories, expanding each category based on my own understanding of the requirements.
The child’s capabilities when he or she enters school include having
• “well-established skills as a thinker”—but thinking that is directed outward to the world and the meaningful events in it (p. 90)
• language, used to communicate orally. This is the language the child has acquired as his or her first language (L1)
What is required of children is to:
• “learn to turn language and thought in upon themselves”
• “direct . . . thought processes in a thoughtful manner”
• be able to talk and choose what to say to “interpret (and) weigh possible interpretations”
• have a conceptual system that “must expand in the direction of increasing ability to represent itself”
• become “capable of manipulating symbols” (p. 90).

LITERACY AND NUMERACY IN THE CARIBBEAN
120
• be able to use the language of the school to communicate so that learning will be facilitated.
There are several ways that the school can help, including to:
• provide opportunities for the child to become “aware of language in its own right” in ways that “earlier encounters with the spoken word” might not have done, and enable this through encounters with books (p. 92)
• foster early mastery of reading
• prepare children for encounters with books and reading by making them more aware of the spoken tongue . . . and to help them to notice what they are doing, that is, using words
• make certain that “they understand that the marks on the paper are a written version of speech” (p. 99)
• close the gap early between those who are “best prepared” and those who are “least prepared” for school learning; otherwise the gap will widen (p. 98).
What we deduce from these points is that while young children use their L1 fluently by the age of three—as Noam Chomsky and the literature on language acquisition indicate—they do so unconsciously without being aware of the components of language and the words that they are using; that is, they may not know the concept of a word as a bounded entity in the flow of the speech that they utter, although they do use words to speak about the events and objects in the world around them. Similarly, they do not have a concept of grammar in the abstract sense although, as Chomsky (1965) would suggest, they generate sentences based on the grammar and rules of the language that they have acquired. What Donaldson proposes is that “in the early stages, before the child has developed a full awareness of language, it is embedded for him in the flow of the events which accompany it ... the child does not interpret words in isolation, he interprets situations” (1978: 89). Conceptual development requires (a) awareness of the spoken language, and (b) awareness that the marks they see on the page of the book correspond to the spoken language. This is essential to the process of becoming literate—and for conceptual development—as Donaldson indicates in the following comment:

LITERACY AND NUMERACY IN THE CARIBBEAN
121
Those very features of the written word which encourage awareness of language may also encourage awareness of one’s own thinking and be relevant to the development of intellectual self-control, with incalculable consequences for the development of the kinds of thinking which are characteristic of logic, mathematics, and the sciences. (1978: 97)
The main point one might extract from the foregoing discussion is the importance of language in the cognitive and academic development of the child. What we do with language in school, how we use it as teachers, and how children use it will influence the development of concepts in other subject areas across the curriculum, particularly in mathematics and the sciences, in a most significant way. Ovando and Collier (1998) cited a study by Ramirez (1992) who found that “primary language support through bilingual instruction enhanced mathematical achievement,” and another by Tikunoff and others (1991), who found that use of the first language (L1) was one of the important factors for conceptual development in subject areas such as mathematics and science (p. 282). Most important, therefore, is the need for teachers to have an awareness of the role that language plays in the development of concepts in subjects across the curriculum and the need to help the child to use his or her L1 to build and understand these concepts.
I want to make one further observation about the excerpt from the Laurie Lee novel—namely, that the language used by both the teacher and the child is a standard variety of the child’s L1, yet the child has difficulty understanding the idiomatic expression “for the present” because the child’s understanding of present is limited to its denotation of “gift.” The question that must be asked is this: if children who acquire English as their first language have some difficulty with the idiomatic and the abstract nature of the language used by adults and in books, how much more difficult is it for a child who enters school speaking a language that is different, or for a second-language learner to develop the concepts and skills that are necessary for academic success? I turn to this discussion in the following section.

LITERACY AND NUMERACY IN THE CARIBBEAN
122
Implications for success when the first language of a child is different from the language used for
education in school
Primary schools in the region have traditionally used a discrete skills approach that separates not only the components of language into areas such as reading, comprehension, grammar, spelling, punctuation, and word study into discrete blocks, but also separates the other content areas of the curriculum. An inspection of the timetables of many primary schools across grade levels will reveal this separation of components according to time slots; when the time is up for teaching one component, the teacher stops the activity of the previous 30- or 45-minute time slot and asks the children to turn their attention to the next subject. I was asked to speak to a group of teachers about an integrated approach to the language arts, and at the end of the discussion, a teacher said that the primary school should move to specialization as is done in the secondary school by allowing specialist teachers to teach discrete subjects at the primary level.
This would be a significant act of educational folly and would represent a move away from practices that integrate subjects in recognition of the fact that children learn better when they have a sense of (a) the relatedness of the components that make up a language and (b) the relatedness of language to the understanding of content across the curriculum. This is not to suggest that collaborative approaches in which teachers work together to prepare thematic units or to teach in teams are not beneficial—they certainly are. What it does suggest is that the compartmentalization of information into discrete blocks makes learning more complicated than it needs to be. The shift to the language arts block in some schools represents an effort to teach language in a more holistic way.
The emphasis has to be on the development of the child’s abilities and competencies that are the necessary building blocks for understanding. These are listening, speaking, reading, writing, and—I would add—taught through an integrated approach that will (a) allow students to develop their oral and written language simultaneously, and (b) allow for the construction of meaning and understanding of all the subject areas across the curriculum through their reading, writing, representation, and
LITERACY AND NUMERACY IN THE CARIBBEAN
123
engagement with technological aids that show the centrality of language to the development of concepts and skills in these various areas and to life.
The implications for success in schools are significant not only for the child who has acquired English as a first language, but also for those children who have acquired another language or a dialect, such as Creole, as a first language and who are required to use English for learning when they enter school. The child who speaks English as his mother tongue has the task of learning to use English not just for casual communication but for purposes of developing literacy, and that requires a learning process that is quite different from the ways in which language is naturally acquired. Theoretically, it is a difference between competency, the natural acquisition of language and its proficiency, and the development of literacy (Simmons-McDonald 2001: 38). I will return briefly to this distinction in a discussion of student performance.
Some studies have indicated that students who have acquired a language other than English as their first language and are learning English in school can take from five to ten years or more “to reach the necessary levels of academic language proficiency to compete—on par—with native English speakers in content areas such as math and science” (Collier 1989, cited in Ovando and Collier 1998: 182). Craig (1999) presents figures that indicate that Creole speakers and Creole-influenced-vernacular (CIV) speakers in the West Indies need a longer time than native speakers of English to become proficient in the academic aspects of English. Craig presents test scores that suggest that Creole and CIV speakers learning English as a second language in school had inadequate development of cognitive academic language proficiency (CALP) in English. The term CALP was first made popular by Cummins to refer to the “context-reduced” nature of language that is required for school. Collier and Thomas (1989, cited in Ovando and Collier 1989: 93) use the shorter term academic language to refer to the same concept, which they describe as “a complex network of language and cognitive skills and knowledge required across all content areas for eventual successful academic performance at secondary and university levels of instruction.” They cite Swain (1981: 93), who explains that the development of academic language is using language “to explain, to classify, to generalise ... to manipulate ideas, to

LITERACY AND NUMERACY IN THE CARIBBEAN
124
gain knowledge, and to apply that knowledge (across all academic subjects).”
The foundations for the development of academic language are laid down in primary school. Craig (1999) conducted a survey of results across selected countries in the region of student
performance in the Caribbean Examinations Council (CXC) examinations and found:
• Literacy levels of school dropouts and out-of-school youth in West Indian countries remain alarmingly below the level that would be expected in high-income countries (p. 23).
• Even six years of schooling cannot be taken as an indication of the achievement of functional literacy (p. 23), which is four years elsewhere.
• The literacy performance of an alarming proportion of West Indian youth is accompanied by deficiencies in the use of English, which would be most unusual in English-speaking youth with the same literacy scores (p. 26).
• In Guyana, there is a significant relationship between race and achievement in functional literacy. The trend shows that Indo-Guyanese and minority races (such as the Portuguese and Chinese) achieve at the high level of functional literacy when compared with other races (p. 24).
• In Jamaica, girls performed much better than boys; and city children much better than children in rural and remote area (p. 23).
He compared the performance of students in several countries on the CXC English “A” examination for the periods 1988–90 and 1994–96, and showed the change in performance over the nine years. Only Antigua and Barbuda (+3.89), Belize (+0.57), Dominica (+1.53), Grenada (+3.15), Guyana (+2.52), and Trinidad and Tobago (+1.46) had positive changes in performance as indicated over the period. St. Lucia, for example, had a decline in performance (-7.64) over the same period. Craig (1999: 27) concludes that these findings indicate a “West Indian language-education problem related to the primary-school level.”
Simmons-McDonald (1996: 125) reviews studies that report on the effects of learners’ development when the native language is ignored. She comments that a study by West on the situation in Bengal conducted as early as 1926 had reported that “children who

LITERACY AND NUMERACY IN THE CARIBBEAN
125
had been instructed through a foreign language suffered an academic handicap.” A later study (1952) by Eichorn and Jones pointed out that children who grew up in communities in which the language of the school differed from that of the home were likely to be adversely affected in terms of their cognitive development. A study done a year later by Anastasi and Cordova (1953) found that Puerto Rican children who were exposed to a bilingual education program in which the home language was severely restricted tended to experience a cognitive handicap. Simmons-McDonald (1994) also found that exclusive French-Creole-speaking children, whose first language was ignored from the stage I class (kindergarten) when they entered school, had not made any significant gains in their learning of English after two-and-a-half years of monolingual English instruction; and the gap between the Creole speakers and those who spoke English grew increasingly wider with each successive year. In that same study, Simmons-McDonald reported that the Creole speakers did not advance to a stage where they learned to use the English required by the school; instead, the language that they had acquired became fossilized, and they could only use the English lexicon vernacular—a creolized form of English widely spoken—to communicate productively.
Scholars have also commented on the difficulties that Creole and CIV speakers in the Caribbean experience as a result of having their first language ignored. Craig (1977: 319) remarked that one of the results could be that the “child’s normal development in his/her home language, Creole, becomes stifled, while at the same time the child failed to acquire native fluency in the language of the school.” Carrington and Borely, writing about the situation in Trinidad and Tobago in the 1970s, observe that five-year-olds who speak a language other than English as a first language are “placed in a situation that is psychologically hostile [to their] self-development and self-identification” (1977: 56). Carrington (1984) notes that in the case of St. Lucia, 64 percent of students could be labeled “functional illiterates,” that is, students having only very limited ability in reading and writing English at the end of primary school.
Simmons-McDonald (1994: 125–7) refers to some studies that did not find negative effects through the use of a language other than the child’s first language, but she notes that the factors of success in the cases cited appeared to be the “(i) approach used to introduce the new language, (ii) nature of the

LITERACY AND NUMERACY IN THE CARIBBEAN
126
interactions between the teachers and learners, and (iii) linguistic and communicative competence of the teachers.” Baker (2006) surveys several studies whose results indicate that in situations in which students are not negatively affected by the use of a monolingual policy, the teaching is very careful and well organized and there is scaffolding to support students’ learning. Baker examines the various approaches used, and I will summarize his reports of the early total immersion programs (in a bilingual context), which show that most students in these programs “approach native-like performance in the second language around 11 years old in receptive language skills (listening and reading).” Baker also reports the finding of Swain and Johnson (1997) that such levels “are not so well attained in the productive skills of speaking and writing” Baker, p. 272). The important point to be noted in these studies is that the first language of the child is not ignored completely.
Programs vary with regard to whether a partial immersion or full immersion is used in the early years, with variable results, but they all recognize that using the first language in the learning process benefits a child’s cognitive development. Ovando and Collier (2001: 182) cite the studies of Thomas and Collier (1997) and Collier (1989), who indicate that “in order for English language learners to do well academically through instruction in a second language, their first language oral and literacy skills ideally must be developed at least to threshold levels that commensurate to a sixth-grade education.” These authors also refer to a series of studies that show that “when immigrants in the United States and Canada are schooled only in L2, it takes a minimum of 5 to 10 years to attain grade-level norms in academic L2, and it takes even longer when students do not have a literacy base in L1.” They also cite a series of studies which report that “when students are schooled in L1 and L2 at least through grade 5 or 6, they are able to maintain grade-level norms in L1 and reach grade-level norms in academic L2 in four to seven years” (Ovando and Collier 2001: 94). Craig’s (1999) finding with regard to the West Indies—namely, that six years of schooling are not enough to ensure that students become functionally literate—strongly suggests the need for experimentation with approaches that show a difference; for example, approaches such as the careful programs developed by the Caribbean Centre for Excellence in Teacher Training (CCETT), the experimental programs with English-based Creole such as those being conducted in Jamaica by Devonish, or the programs with

LITERACY AND NUMERACY IN THE CARIBBEAN
127
French-Creole speakers such as those being conducted on an experimental basis in St. Lucia by Simmons-McDonald. The following section discusses some of the findings on the use of L1 in instruction.
Language and literacy: Where does the first language fit in? What is its contribution to the
development of overall literacy?
Despite reports of the difficulties that students face when their first language is completely ignored in their learning in school, recommendations for the inclusion of Creole or CIVs in education have been tentative. The perception that they are “inferior” to English and therefore inappropriate for purposes of education is still believed in many circles. The use of varieties such as the French Creole (FC) and (until very recently)2 Jamaican Creole in instruction has been resisted because of a fear that their use for purposes of instruction might simply reinforce the Creole and retard the development of literacy in English (Simmons-McDonald 2006: 119). Over the years, several approaches have been recommended for implementing vernaculars in education. Devonish (1983, 1986) proposes standardizing Creole languages and using them to teach English in schools. His discussion focuses on general policy and on the benefit to Creole speakers. Craig (1999: 274) presents approaches for developing literacy through the incorporation of a vernacular program for “maintaining the home language and culture and strengthening the language awareness of pupils.” Simmons-McDonald (1996: 18) presents a proposal for the three groups of first language speakers in the St. Lucian context and subsequently outlines models for the incorporation of the vernacular in instruction. She also cites studies conducted in other contexts that reported positively on the use of the child’s first language in learning (2006). For example, Bialystok (1991) reports that the metalinguistic development of learners is enhanced by the acquisition of two or more languages. Cummins (1994) reports that studies he reviewed in 1991 showed that if the conceptual foundation of a child’s first language was well developed, he or she would be more likely
2 The government of Jamaica has given permission for an experiment to use the Jamaican Creole in instruction. The Jamaican Language Unit (JLU) under the direction of Professor Hubert Devonish has implemented a program in selected schools. Results are yet to be published.

LITERACY AND NUMERACY IN THE CARIBBEAN
128
to develop “similarly high levels of conceptual abilities in [the] L2.” Swain and Lapkin (1991) report that comparisons of children who had acquired literacy in two languages with monolingual or bilingual children who had not acquired literacy in their home language showed better performance when they attempted to acquire a third language. Also included in that review of studies is a paper by Swain, cited in Walker (1984: 165), which pointed out that skills basic to academic progress are most easily learned in the first language. Reference was made to Walker’s comment that it is “easier to learn to read in L1 and then to apply this skill to L2 rather than learn to read and learn L2 simultaneously.” He points out that “once the reading skill is automated through L1, more attention can be paid to the acquisition of L2.” Siegel (1999), who reviewed research in which stigmatized varieties were used in the classroom, concludes that “appropriate teaching methodology incorporating students’ vernaculars may actually help them acquire the standard.” In an earlier study (1997), Siegel had examined a program that used Tok Pisin to develop literacy in preschool children who were native speakers of Tok Pisin. He reports that the use of Pidgin resulted in greater gains for them than for children who had not been exposed to programs in which Tok Pisin had been used. He concludes that the use of Pidgin was not a hindrance to the children’s acquisition of literacy (studies cited in Simmons-McDonald 2006: 121).
When Creole or a dialect is the first language: Implications for basic skills and literacy
These findings prompted investigations through two studies that were conducted to determine the status of literacy development in selected countries in the Eastern Caribbean. A summary of the study done in Dominica is presented, and the results of a pilot study using FC in instruction is also briefly reported.

LITERACY AND NUMERACY IN THE CARIBBEAN
129
Study I. Reading diagnostic project and literacy survey—Dominica3
The sample
The sample for the study consisted of six schools representing a range of very good, average, and weak. Schools had been rated by officials in the ministry of education according to these categories. In designing the study, a determination had been made to select one, two, or three schools from the good, average, and weak categories, respectively. A larger number of schools were selected from the weak category because students in schools in these categories had been identified as having difficulties with reading. It was reasoned that since the students in schools in the “good” category had fewer difficulties, it was not as urgent to select a large sample from that category for the survey. A 20 percent random sample was selected from kindergarten through grade 6 for testing. The language backgrounds of the students were checked primarily through observations of their language use during testing. The original study presented reports on the schools, but subsequently an analysis was done to determine whether there were any differences in performance among children of different language backgrounds.
Table 5.1 Student sample from schools in survey
School K Grade I Grade 2 Grade 3 Grade 4 Grade 5 Grade 6 Total N M F M F M F M F M F M F M F Total 16 17 18 14 15 16 17 17 16 16 19 16 15 13 225 945 Source: Simmons-McDonald et al. Literacy Survey and Reading Diagnostic Project, Dominica Schools Report, 2003. Note: Sample = 24 percent of the total population of these six schools.
The testing instruments
Three tests batteries were used in the survey, namely, (a) the test of phonological awareness (TOPA), (b) the Woodcock-Johnson Achievement III Tests, and (c) the Wisconsin version of the reading records for fluency developed by Depree and Iversen (1994). Appendix 5.1 shows the areas tested for achievement.
3 The version of the study reported on here analyzed the data according to the language backgrounds of the students. This paper was presented at the 16th Biennial Conference of the Society of Caribbean Linguistics (SCL), Dominica, 2006, under the title Language Instruction and Planning for Creole-Influenced Vernacular Speakers— A Study of Dominica. Published in conference proceedings. The original study can be found in the University of West Indies (UWI) libraries and in the ministry of education in Dominica under the title Literacy survey/Reading Diagnostic Project—Dominica.

LITERACY AND NUMERACY IN THE CARIBBEAN
130
TOPA–kindergarten results
The TOPA–kindergarten consisted of 20 items, each worth one point. The maximum score possible on the test was 20, with each subtest worth 10 points. A student’s total raw score was the number of items scored correct. These were converted to a standard score and percentile, using the normative tables provided for this purpose in the testing package. The percentiles or percentile ranks “represent values that indicate the percentage of the distribution that is equal to or below a particular score” (Torgesen and Bryant 1994: 14). This simply means that the percentile figure indicated for a student represents the percentage of students in the standardized sample who scored at or below that student’s score. If a student has a percentile rank of 65, it means that 65 percent of the students in the standardized sample had the same score or lower. Standard scores were used because they give a better indication of a student’s performance on a test and allow for comparisons across groups. The quotient is the TOPA standard score used to report the results in this study. The set mean for the TOPA–kindergarten is 100. Scores (on the TOPA–kindergarten) falling below the 25th percentile are below average and “indicate a significant delay in development of awareness that may have an impact on the development of word reading skills in young children” (Torgesen and Bryant 1994: 15).
Table 5.2 Performance on the TOPA–kindergarten
Primary language background Mean Standard deviation
Number falling below the 25th percentile
Number tested
1 CIV/Kwéyòl 90.17 6.70 3 6 2 Kwéyòl/CIV 81.83 8.59 4 6 3 English 102.00 12.40 1 7
Note: TOPA–kindergarten mean = 100.
Only the group with first-language English speakers in the
sample had a grouped mean score higher than the TOPA mean.
In the case of L1 CIV/L2 FC and L1 FC/L2 CIV, the number of students falling below the 25th percentile was high for the sample size.
Girls gained higher scores than boys in all the language group categories, as table 5.3 shows.

LITERACY AND NUMERACY IN THE CARIBBEAN
131
Table 5.3 Mean scores for boys and girls.
School Mean scores Males Females 1. CIV/Creole 89.66 90.66 2. Creole/CIV 79.00 87.50 3. English 97.33 105.50 Source: Simmons-McDonald, 2006 (a).
The TOPA–early elementary test was administered to grade 1 students. The difference between the two tests is that while the TOPA–kindergarten focuses on the same and different beginning sounds in words, the TOPA–early elementary focuses on the same and different ending sounds in words. A score on the TOPA–early elementary below the 15th percentile indicates the “likelihood that the child’s reading problems are the result of difficulties in processing the phonological features of words or, more specifically, in becoming aware of the phonological structure of words” (Torgesen and Bryant 1994: 15).
Table 5.4 Performance on the TOPA–elementary
Groups Mean Standard deviation Number falling below the 15th percentile
Number tested
1. CIV/Kwéyòl 75.00 10.80 5 6 2. Kwéyòl/CIV 68.00 4.50 3 5*4 3. English 80.50 7.31 3 6 Source: Simmons-McDonald 2006(a) .
The more challenging nature of the TOPA–early elementary test is reflected in the results:
• No students scored above the TOPA mean, and more fell below the 15th percentile proportionate to the corresponding (25 percentile) in the TOPA–kindergarten group.
• Performance below the 15th percentile means that the students are likely to have some reading difficulties that stem from their inability to process the phonological features of words effectively. The CIV/FC group had more students falling below this percentile than the English group.
4 In the case of Group 2, two children in the sample were unable to do the test. Their scores were not included in the analysis.

LITERACY AND NUMERACY IN THE CARIBBEAN
132
Scores: Basic and broad reading skills and academic language (Cognitive Academic Language Proficiency, CALP)
The list of tests that were administered is presented in the chart in appendix 5.1. The levels and interpretation of levels for academic language, presented in table 5.5 indicate whether students find the learning tasks difficult to manage from their perspective of understanding the language used. If students score between 1 and 3, it means that they have difficulty understanding (and producing) the language required for the task.
Table 5.5 CALP levels and subject perception of English-language demands at grade level
CALP level Subject’s perception of English-language demands 5 Advanced Very easy
4–5 (4.5) Fluent to advanced Easy
4 Fluent Manageable
3–4 (3.5) Limited to fluent Difficult
3 Limited Very difficult
2–3 (2.5) Very limited to limited Very difficult to extremely difficult
2 Very limited Extremely difficult
1–2 (1.5) Negligible to very limited Extremely difficult to impossible
1 Negligible Impossible Source: Woodcock-Johnson III Tests of Achievement, Examiner’s Manual p.75.
Note: An interpretive statement based on Level 2 of the chart might read as follows: This student has very limited cognitive academic language proficiency (CALP) in comparison with other students at the same grade level. If given English instruction at the corresponding grade level, a student at level 2 will find the language demands of the learning task extremely difficult.
Table 5.5 presents a summary of the scores for the three language groups across grades 5 and 6 only. It is clear from the scores obtained that there is variability with regard to students’ management of the tasks for the domains listed and with their ability to understand the language of the materials used across content areas at the grade level. The FC/CIV group again did not perform as well as the other two groups, but, except for three students in the CIV/FC group who got scores of 4, the overall performance indicates that students are having a problem with the language used for tasks at the grade level. The CALP scores suggest that most of the CIV speakers have difficulty coping with the language at the grade level.

LITERACY AND NUMERACY IN THE CARIBBEAN
133
A comparison of scores from grade 2 (not shown) to grade 6 show an improvement in performance over time; that is, children do better as they progress through the grades. This corresponds with the observation made by Craig (1999) that it takes at least seven years for the Creole and CIV speakers to attain proficiency in the L2. But the performance shows that they still have difficulty with the language expected at the grade level, and even those children who speak English appeared to have difficulty managing tasks at the grade level. Craig (1999: 38) acknowledges (and these data support his view) that “the problem is likely to be more serious in earlier than in later schooling, but the reality is that for CIV children, it is precisely the problems that accumulate from early schooling, namely, failure to acquire reading, lack of experience in a wide range of purposes of language use, etc. that minimize later educational achievement.”
Study II. Vernacular instruction and biliteracy development among French Creole speakers
This second study was undertaken to determine whether an approach that included the child’s first language, FC, would facilitate the development of literacy in the L2. The FC/Creole component of the tripartite model developed for the St. Lucian context (Simmons-McDonald 2000) was used in this experiment. The model addresses the needs of the speakers of the three language varieties used in St. Lucia in a direct way. The components are designed for simultaneous implementation with groups of speakers
Table 5.6 CALP scores
Group Grade Sex CALP score
Number attaining score
CIV/Creole V M 4 1 V F 4 2 V M 2 1 VI M 3–4 1 VI M 3 1 VI F 4 1 VI F 2 1
Creole/CIV V M 3–4 0 V F 3 1 V M 1 2 VI M 3 1 VI F 3–4 1 VI F 3 1
English V F 4–5 1 V M 3 2 V F 3 1 V M 2–3 1 V F 2–3 1 VI M 3–4 1 VI M 2–3 1 VI F 3 1 VI F 2–3 1 VI F 2 1
Note: N = 26 – grade 5/6.

LITERACY AND NUMERACY IN THE CARIBBEAN
134
from the three different language backgrounds in either a heterogeneous classroom setting or separately as homogeneous groups. The FC component is designed to develop the learner’s ability to read in the home language and in English. The FC component of the model is presented in appendix 5.2. The expected outcomes from the implementation of this model are:
• The development of proficiency in the L2 (English)
• Development of proficiency in the child’s first language
• Promotion of the use of the first language for a wider range of purposes and, in this case, for doing academic work
• The development of CALP in both FC and English as a means of fostering bilingualism and bi-literacy in FC and English
The version of the original model provides learners with one-and-a-half hours of instruction in FC and three-and-a-half hours in English daily. The underlying thesis is that it will promote the development of early literacy in L1 even as the learners acquire communicative competence in the L2.5 In the time devoted to FC instruction, learners would be exposed to a program (in the early grades) that focuses on emergent literacy in FC and as the children’s communicative abilities in English develop focus would shift increasingly to the development of literacy in English.
A modified version of the FC model was used because of time limitations and the fact that permission had been granted to perform the preliminary pilot study with only a small group of learners in the higher grades (5 and 6) who could not read. A single-subject research design was used for this experiment (Neuman and McCormick 1995). The study was conducted in a school in a rural community in the northeast of the island.
The sample was drawn from a group of 69 children who had been identified by teachers as having severe reading problems. The result of the initial survey revealed that approximately 60 percent of the children were reading between two and four grade levels below their actual reading level. Because of the limitations of time and resources, a decision was made to conduct the experiment with three of the older children in the group. The sample profile is presented in appendix 5.3. The results of the initial survey showed that Ado was reading at a beginning grade 1
5 Recall the points made under section I, part 2.

LITERACY AND NUMERACY IN THE CARIBBEAN
135
level with considerable difficulty. Neither Uka nor Dovi could read a complete sentence.
Performance levels were established for each learner and a baseline of performance was determined before the actual instruction began. A typical teaching day began with the FC session which lasted for 45 minutes to an hour; this was followed by the English session which lasted 60 to 75 minutes with the whole group. During the afternoon, sessions with individuals were scheduled for purposes of working with them on areas with which they needed help, and to provide opportunities for additional guided practice for reading in both languages.6
A rich selection of literature in both languages appropriate to the students’ reading ability was used. Reading records of individual performance were taken to determine individual gains over the period of the study. The findings for English showed that all the learners made progress over the course of the study. Figures 5.1, 5.2, and 5.3 show the English results for Ado, Uka, and Dovi, respectively. A score of 95 to 100 percent indicates that a learner can read the given selection and other texts at the same level of difficulty independently and with ease. But a score of 89 percent or less on a given selection suggests that the text is too difficult for the learner and guided instruction is required. The intervention sessions indicated in the graphics represent performance on increasingly difficult texts. The results in the case of all three learners are encouraging.
6 See a full description of the study in Simmons-McDonald (2006).

LITERACY AND NUMERACY IN THE CARIBBEAN
136
Figure 5.1 Accuracy percentages: English, Ado
Baseline data Intervention Data
85.580
87.5 91 95 98 95 96 97
0102030405060708090
100
S.1 S.2 S.3 Int.S. S.4 S.5 S.6 S.7 S.8 S.9Sessions
% A
ccur
acy
Source: Simmons-McDonald, 2006130 Figure 5.2 Accuracy percentages: English, Uka
Baseline 1 Intervention 1 Baseline 2 Int.2
50
85.594 98
91 9385.5 87.5 83 87.5 90
75
0102030405060708090
100
S.1 S.2 S.3
Instr.S S.4 S.5 S.6 S.7
Instr.2
S.8 S.9S.10
Instr.3
S.11 S.12
Sessions
%
Source: Simmons-McDonald 2006:131.

LITERACY AND NUMERACY IN THE CARIBBEAN
137
Figure 5.3 Accuracy percentages: English, Dovi
Baseline 1 Intervention Baseline 2 Int .2
5066
89 90 91 93 93
66
87.5 83 89
0102030405060708090
100
S.1 S.2 S.3Int.S
.S.4 S.5 S.6 S.7
Instr. S.8 S.9In
str S.10S.11
Sessions
% A
ccur
acy
Source: Simmons-McDonald 2006:132.
The FC chart is presented here for Ado only,7 and the data points at the intervention show a high level of competence in reading in FC.
Figure 5.4 Accuracy percentages: Creole, Ado
Baseline Intervention
93 91 9183
91 9197 94
0102030405060708090
100
S.1 S.2 S.3 S.4 Instr S.5 S.6 S.7 S.8
Sessions
%
Source: Simmons-McDonald 2006:135.
To demonstrate the parallel course of development for Ado in both languages, the performance date was plotted on one chart and this shows progress in both languages. Similar results were
7 All charts can be found in the published version of the study (see Simmons-McDonald 2006).

LITERACY AND NUMERACY IN THE CARIBBEAN
138
obtained for all three children but Ado and Uka made more significant progress than Dovi.
Figure 5.5 Accuracy percentages: Creole and English, Ado
85.580
87.59195 98 95 96 97
93 91 91 91 9197 94
83
0
20
40
60
80
100
120
S.1 S.2 S.3 S4 S.5 S.6 S.7 S.8 S.9
Sessions
% A
ccur
aty
rate
s in
L1
& L
2
English
Kw eyol
Source: Simmons-McDonald 2006:139.
Conclusion
Considering that the experiment was conducted over a relatively short period of six weeks, the results which show developing proficiency in both languages are promising. At the end of the experiment, Ado was able to take the continuing education (CE) examination, and he is now in secondary school. Both studies point to the need for a focused discussion on the policies that are used to teach CIV speakers.
First, there must be a policy that is supported by effective practice. If the decision is for total immersion in the L2 without support for the L1, then appropriate teaching methods must be used and teachers must be trained so that they can use the methods efficiently. If the decision is to include the vernacular, then this has to involve careful development plans

LITERACY AND NUMERACY IN THE CARIBBEAN
139
for implementation including the preparation of materials for teaching.8
Training of teachers must include some exposure to the study of language acquisition so that teachers will have an understanding of how children acquire and use language. Curriculum reform that takes into consideration the approaches used, the materials that are available, and other elements of classroom practice should be conducted periodically. Training should also include programs and activities that raise the awareness of teachers about issues related to how learners use language and particularly those who are CIV speakers and are required to learn the school language as L2. Several suggestions are made by Simmons-McDonald (1996) with regard to the economic cost. The models themselves have been designed to minimize costs. The waste to developing countries because of the unharnessed cognitive potential of the young people who fail to be educated by our systems must be considered seriously and addressed.
References
Anastasi, A. and Cordova, F. 1953. Some effects of bilingualism upon the intelligence test performance f Puerto Rican children in New York City. Journal of Educational Psychology, 44 No.1, 1-19.
Baker, Colin. 2006. Foundations of Bilingual Education and Bilingualism (4th edition). Cleveland, Buffalo, Toronto, Sydney: Multilingual Matters Ltd.
Bialystok, E. (ed.) (1991). Language Processing in Bilingual Children. Cambridge: Cambridge University Press.
Carrington, Lawrence. 1984. St. Lucian Creole: A Descriptive Analysis of its Phonology and Morpho-Syntax. Helmut Buske Verlag Hamburg.
Carrington, Lawrence, and C. Borely. 1977. The Language Arts Syllabus 1975: Comment and Counter-Comment. St. Augustine, Trinidad: University of the West Indies Multi Media Production Centre.
8 Several books were being written as part of the second phase of the FC experiment. But lack of funding has brought the program to a premature end until funding can be identified to continue the work and implement the program on a wider scale.

LITERACY AND NUMERACY IN THE CARIBBEAN
140
Chomsky, Noam. 1965. Aspects of the Theory of Syntax. Cambridge, MA: MIT Press.
Craig, Dennis. 1977. “Creole Languages and Primary Education.” In A. Valdman, ed., Pidgin and Creole Linguistics, 314–32. Indiana: Indiana University Press.
———. 1999. Teaching Language and Literacy: Policies and Procedures for Vernacular Situations. Georgetown, Guyana: Education and Development Services Inc.
Cummins, J. 1994. “Knowledge, Power, and Identity in Teaching English as a Second Language.” In F. Genesee, ed., Educating Second Language Children: The Whole Chile, the Whole Curriculum, the Whole Community, 33–58. Cambridge: Cambridge University Press.
Depree, H., and S. Iversen. 1994. Early Literacy in the Classroom: A New Standard for Young Readers. Auckland: Lands End Publishing.
Devonish, Hubert. 1983. “Towards the Establishment of an Institute for Creole Language Standardisation and Development in the Caribbean.” In L. Carrington, D. Craig, and R.T. Dandare, eds., Studies in Caribbean Language. Augustine, Trinidad: Society for Caribbean Linguistics.
———. 1986. Language and Liberation: Creole Language Politics in the Caribbean. London: Karia Press.
Donaldson, Margaret. 1978. Children’s Minds. New York: W. W. Norton and Company.
Ingram, David. 1989. First Language Acquisition: Method, Description and Explanation. Cambridge: Cambridge University Press.
Neuman, S., and S. McCormick. Single-Subject Experimental Research: Applications for Literacy. Newark, Del.: International Reading Association.
Ovando, Carlos J., and Virginia P. Collier. 1998. Bilingual and ESL Classrooms: Teaching in Multicultural Contexts (2nd edition). Hightstown, NJ: McGraw Hill Education.
Siegel, Jeff. 1997. “Using a Pidgin Language in Formal Education: Help or Hindrance?” Applied Linguistics 18 (1): 86–100.
———. 1999. “Stigmatised and Standardized Varieties in the Classroom: Interference or Separation?” TESOL Quarterly 33 (4): 701–28.

LITERACY AND NUMERACY IN THE CARIBBEAN
141
Simmons-McDonald, Hazel. 1994. “Comparative patterns in the Acquisition of English Negation by Native Speakers of French Creole and Creole English.” Language Learning 44 (March) 1: 29–74.
———. 1996. Language Education Policy: The Case for Creole in Formal Education in St. Lucia. In P. Christie, ed., Caribbean Language Issues Old and New. Jamaica: University of the West Indies Press.
———. 2000. Language Education and the Vernacular Speaker: A Model for Multilingual Competence. Paper presented at the thirteenth Biennial Conference of the Society for Caribbean Linguistics, University of the West Indies, Mona, Jamaica. August, 2000.
———. 2001. “Competence, Proficiency and Language Acquisition in Caribbean contexts.” In P. Christie, ed., Due Respect: Papers on English and English-Related Creoles in the Caribbean, 37–60. Jamaica: University of the West Indies Press.
———. 2006. “Vernacular Instruction and Bi-Literacy Development in French Creole Speakers.” In H. Simmons-McDonald and I. Robertson, ed., Exploring the Boundaries of Caribbean Creole Languages, 118–43. Jamaica: University of the West Indies Press.
______. 2006a. Language instruction and planning for Creole-influenced vernacular speakers – A study of Dominica. Paper presented at the 16th Biennial conference of the Society for Caribbean Linguistics. Dominica, August 2–6, 2006.
———. Forthcoming. “Instructional Models for Creole-Influenced Vernacular Settings.” Journal of Pidgin and Creole Linguistics, John Benjamins.
Simmons-McDonald, Hazel, C. Fong-Kong-Mungal, M. Edwards, and S. Jack. Literacy Survey/Diagnostic Reading Project: Dominica Schools’ Report. School for Graduate Studies and Research, University of the West Indies, Cave Hill, Barbados.
Torgesen, J. K., and Bryant. 1994. Test of Phonological Awareness: Examiner’s Manual. Austin, TX: Pro-Ed.
Walker. 1984. Applied Sociology of Language: Vernacular Languages and Education. In Applied Sociolinguistics, Peter Trudgill (ed.). London: Academic Press, 40–60.
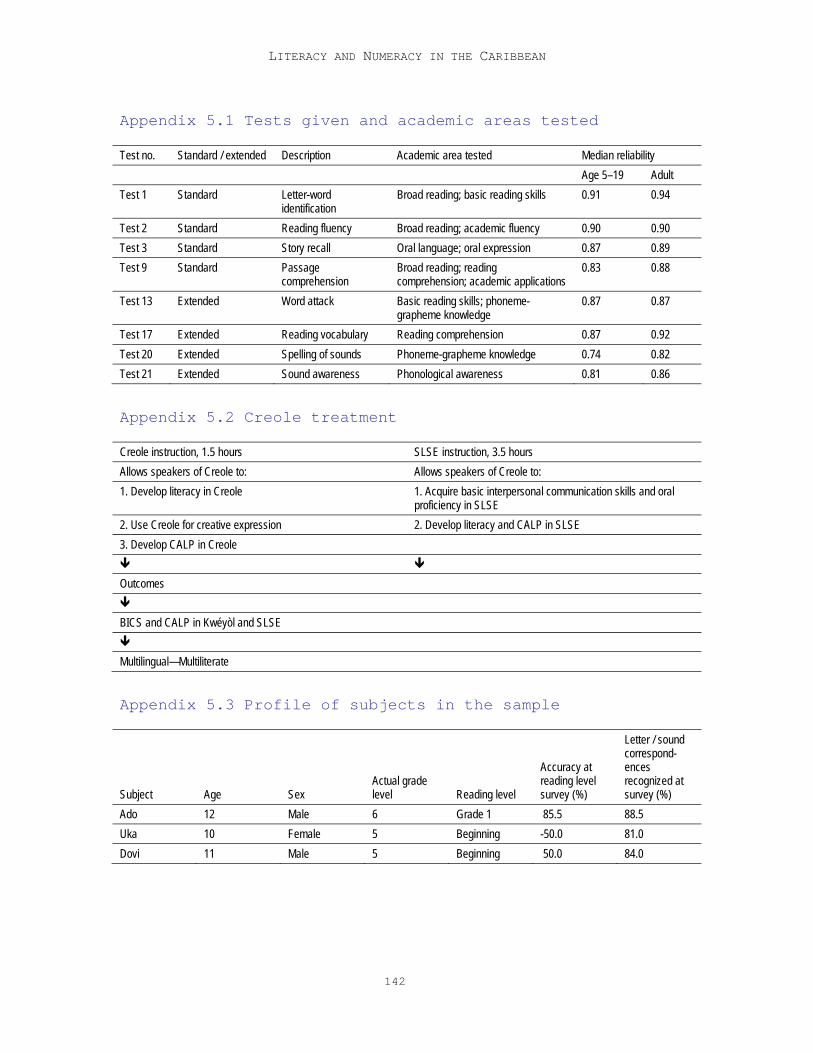
LITERACY AND NUMERACY IN THE CARIBBEAN
142
Appendix 5.1 Tests given and academic areas tested
Test no. Standard / extended Description Academic area tested Median reliability Age 5–19 Adult Test 1 Standard Letter-word
identification Broad reading; basic reading skills 0.91 0.94
Test 2 Standard Reading fluency Broad reading; academic fluency 0.90 0.90 Test 3 Standard Story recall Oral language; oral expression 0.87 0.89 Test 9 Standard Passage
comprehension Broad reading; reading comprehension; academic applications
0.83 0.88
Test 13 Extended Word attack Basic reading skills; phoneme-grapheme knowledge
0.87 0.87
Test 17 Extended Reading vocabulary Reading comprehension 0.87 0.92 Test 20 Extended Spelling of sounds Phoneme-grapheme knowledge 0.74 0.82 Test 21 Extended Sound awareness Phonological awareness 0.81 0.86
Appendix 5.2 Creole treatment
Creole instruction, 1.5 hours SLSE instruction, 3.5 hours Allows speakers of Creole to: Allows speakers of Creole to: 1. Develop literacy in Creole 1. Acquire basic interpersonal communication skills and oral
proficiency in SLSE 2. Use Creole for creative expression 2. Develop literacy and CALP in SLSE 3. Develop CALP in Creole
Outcomes
BICS and CALP in Kwéyòl and SLSE
Multilingual—Multiliterate
Appendix 5.3 Profile of subjects in the sample
Subject Age Sex Actual grade level Reading level
Accuracy at reading level survey (%)
Letter / sound correspond-ences recognized at survey (%)
Ado 12 Male 6 Grade 1 85.5 88.5 Uka 10 Female 5 Beginning -50.0 81.0 Dovi 11 Male 5 Beginning 50.0 84.0

Chapter 6 The Accomplishments of the
Caribbean Center of Excellence
for Teacher Training Project
Stafford A. Griffith
Dr. Stafford A. Griffith is professor of research, measurement, and evaluation in the Institute of Education at the Mona Campus (Jamaica) of the University of the West Indies. He holds graduate degrees in education, with specialized study in research, measurement and evaluation, and curriculum development. He also holds an LL.B. degree. Professor Griffith has more than 40 years of combined work experience in teaching, curriculum development, measurement and evaluation, and program planning and management. He previously served as pro-registrar of the Caribbean Examinations Council. His research interests include public examinations, large-scale testing programs, formative assessment, and assessment in a constructivist learning environment.
The Caribbean Center of Excellence for Teacher Training (CETT) is part of a Presidential Initiative of President George W. Bush of the United States which was announced at the 2001 Summit of the Americas to improve childhood learning through the improvement of the teaching of reading in the Western Hemisphere. Activities under this initiative target the first three grades of primary school and are implemented through centers in the following three regions:
• The Caribbean region with headquarters in Jamaica.
• The Central American region with headquarters in Honduras.
• The Andean region with headquarters in Peru.

LITERACY AND NUMERACY IN THE CARIBBEAN
144
The Caribbean region qualified for inclusion because of the unsatisfactory grade-level performance in reading in a number of countries, including Jamaica. In a situation analysis conducted as a prelude to that country’s involvement in the Caribbean CETT project, it was reported that in 1998, 1999, and 2000, only 31.52 percent, 30.34 percent, and 30.48 percent, respectively, of the national grade 3 cohort had mastered literacy skills at the grade 3 level (unsolicited proposal 2002:124).
Particularly in marginalized communities, the challenges of the discontinuity between the Creole spoken by most students entering the formal education system and the teaching in standard English was a major constraint that most teachers and students faced in the early grades in developing and improving literacy skills. Therefore, the aforementioned situation analysis concluded that there was “the need for an approach to teaching Reading that ensures that these students, despite their linguistic backgrounds, attain the desired levels of proficiency” (unsolicited proposal 2002:7).
While teacher training institutions offered opportunities for specializations in literacy education and ministries of education (MOEs) included reading on the school curriculum, the approach to reading did not seem to be responding sufficiently to the needs of the most vulnerable students, schools, and communities and this, in turn, contributed to the depression of the percentage of students, nationally, who were able to read, satisfactorily, at their respective grade levels.
It was evident, also, that grade-level standards were based largely on individual school or country definitions of expected grade-level outcomes and no Caribbean regional standards were evident. The Caribbean CETT provided an opportunity to address these and other related issues.
The Caribbean CETT was established in 2002 under an Agreement between the University of the West Indies, Mona Campus, Jamaica, and the U.S. Agency for International Development (USAID), Washington, with the Joint Board of Teacher Education (JBTE), Mona Campus, as the executing agency. The focus of the program was the improvement of teaching with the expectation that this will improve student achievement. This focus on teacher improvement was clearly emphasized in the goals of the project (Cooperative Agreement 2006), five of which spoke directly of teacher improvement. These are:

LITERACY AND NUMERACY IN THE CARIBBEAN
145
• To provide innovative leadership in inspiring, empowering, and equipping teachers at grades 1–3 of primary schools in their endeavor to teach reading.
• To train teachers in the use of best practices in reading instruction.
• To develop diagnostic tools to provide teachers with data for use in the development of reading intervention programs to meet the needs of their students and assess reading achievement.
• To provide in-service professional development in the teaching of reading to teachers, thus allowing them to keep abreast of the latest developments and best practices in reading instruction.
• To ensure that all graduates from the teacher education programs acquire the skills and knowledge to enable them to become competent teachers of reading.
The other three goals of the Caribbean CETT are supportive of these five critical goals that relate to improvement in the teaching of reading. These are:
• To produce and/or purchase, for project schools, teaching and learning materials that are appropriate and culturally sensitive.
• To design, develop, implement, and evaluate special interventions to improve reading in project schools and disseminate strategies of proven success to wider school systems.
• To use information and communication technology (ICT) to enhance and support all aspects of the operation.
The project is managed through a project implementation unit (PIU) within the JBTE, Mona Campus, Jamaica, with a smaller office at the Cave Hill Campus, Barbados. Project implementation is undertaken in partnership with teacher training institutions and the MOEs in the respective countries. In the typical delivery model used in the Caribbean CETT, a small cluster implementation unit (CIU) comprising a reading specialist, an ICT specialist, and an administrative support staff is responsible for project implementation in a cluster of six to nine schools. These schools were selected from among those with the poorest performance and generally from marginalized communities. In this model, the CIU is located in a teacher training institution. The model was put
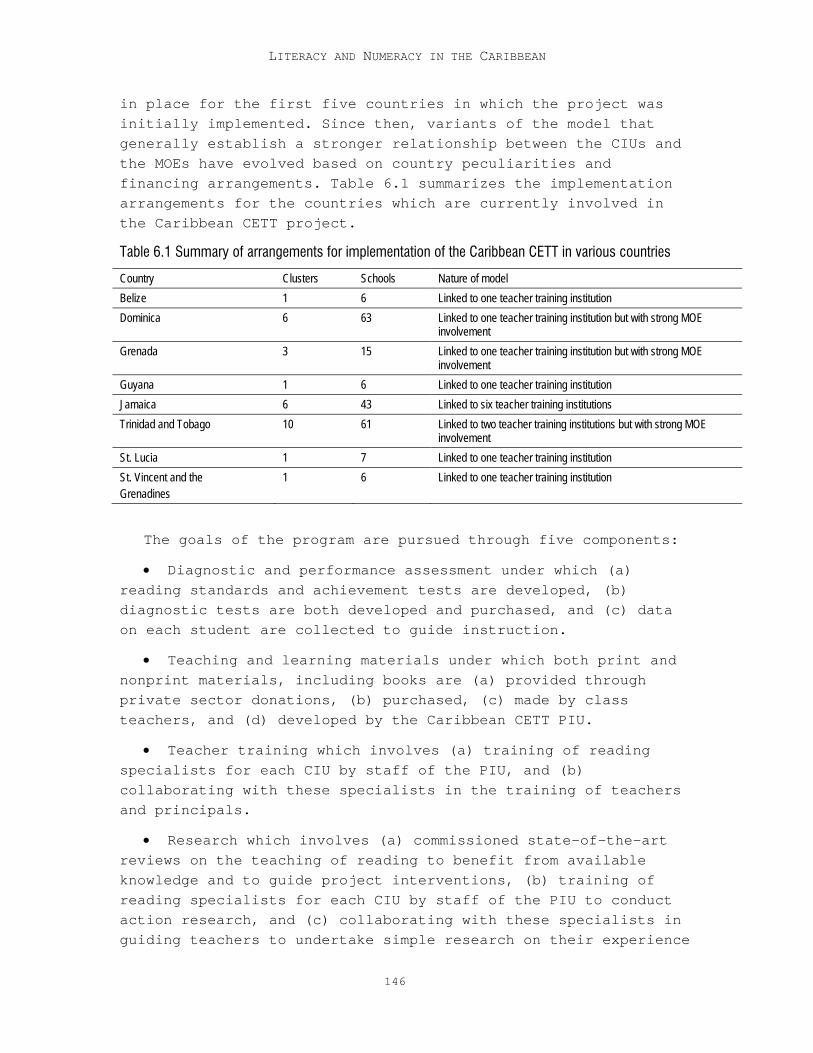
LITERACY AND NUMERACY IN THE CARIBBEAN
146
in place for the first five countries in which the project was initially implemented. Since then, variants of the model that generally establish a stronger relationship between the CIUs and the MOEs have evolved based on country peculiarities and financing arrangements. Table 6.1 summarizes the implementation arrangements for the countries which are currently involved in the Caribbean CETT project.
Table 6.1 Summary of arrangements for implementation of the Caribbean CETT in various countries
Country Clusters Schools Nature of model Belize 1 6 Linked to one teacher training institution Dominica 6 63 Linked to one teacher training institution but with strong MOE
involvement Grenada 3 15 Linked to one teacher training institution but with strong MOE
involvement Guyana 1 6 Linked to one teacher training institution Jamaica 6 43 Linked to six teacher training institutions Trinidad and Tobago 10 61 Linked to two teacher training institutions but with strong MOE
involvement St. Lucia 1 7 Linked to one teacher training institution St. Vincent and the Grenadines
1 6 Linked to one teacher training institution
The goals of the program are pursued through five components:
• Diagnostic and performance assessment under which (a) reading standards and achievement tests are developed, (b) diagnostic tests are both developed and purchased, and (c) data on each student are collected to guide instruction.
• Teaching and learning materials under which both print and nonprint materials, including books are (a) provided through private sector donations, (b) purchased, (c) made by class teachers, and (d) developed by the Caribbean CETT PIU.
• Teacher training which involves (a) training of reading specialists for each CIU by staff of the PIU, and (b) collaborating with these specialists in the training of teachers and principals.
• Research which involves (a) commissioned state-of-the-art reviews on the teaching of reading to benefit from available knowledge and to guide project interventions, (b) training of reading specialists for each CIU by staff of the PIU to conduct action research, and (c) collaborating with these specialists in guiding teachers to undertake simple research on their experience

LITERACY AND NUMERACY IN THE CARIBBEAN
147
in responding to challenges in the classroom and to share these with other teachers during workshops.
• Information and communication technology (ICT) which involves (a) the provision of computer hardware and a School Manager software to each school to assist in tracking and monitoring student progress and in accessing and sharing information to enhance teacher instruction, (b) the establishment of a video conferencing network linking the PIU and CIUs, and (c) the training of ICT technicians in each CIU to provide user-support services for reading specialists, principals, and teachers.
Up to October of 2007, there were five countries benefiting from full USAID funding: Belize, Guyana, Jamaica, St. Lucia, and St. Vincent and the Grenadines. Dominica was added to these countries through a special grant by the U.S. government in November 2007 for a two-year program. The project is currently being implemented in two other countries: Grenada and Trinidad and Tobago. Following limited initial USAID assistance to those two countries, they are now implementing the Caribbean CETT reading program by meeting the cost from their own national budget. Thus, the Caribbean CETT program is now being implemented in eight Caribbean countries.
Project accomplishments
Table 6.2 provides a summary of the principal beneficiaries of the project. It shows that 208 schools, 978 teachers, and an average of 22,053 students benefit annually from the Caribbean CETT project.
Table 6.2 Countries, schools, and students benefiting annually from the Caribbean CETT project
Countries No. of schools No. of teachers No. of students Belize 6 31 900 Dominica 61 218 3,753 Grenada 18 90 1,800 Guyana 6 39 1,100 Jamaica 43 241 8,500 Trinidad and Tobago 61 295 4,500 St. Lucia 7 32 800 St. Vincent and the Grenadines 6 32 700 Total 208 978 22,053

LITERACY AND NUMERACY IN THE CARIBBEAN
148
The Caribbean CETT reading program has impacted significantly on the skills of teachers and students and this is reflected in the significant improvement in the reading proficiency of students in project schools from grades 1 to 3 and beyond.
The progress made by students may be gleaned from an examination of data summarized in figure 6.1 for the regional cohort of students who entered the program in 2005. The data are obtained from schools, in countries where the program benefits from full USAID funding, except Dominica which entered the program in 2007. The figure summarizes the progress of these students between the time they first entered the program in grade 1 in 2005 and the time they completed it in grade 3 in 2007. The annual average number of students in this cohort over the three-year period was 3,148. The number fluctuated during this period primarily due to transfers into, or out of, project schools.
All students entering the project are pretested on the Caribbean Reading Standards Achievement Test (CRSAT) developed by the project. At the end of each grade they are post-tested. For grades 2 and 3, the test measures students on six dimensions of literacy: language structure, listening comprehension, phonemic awareness, phonics, reading comprehension, and picture-word
Figure 6.1 Overall performance of cohort entering project in 2005

LITERACY AND NUMERACY IN THE CARIBBEAN
149
recognition. For grade 1, the test measures students on the same dimensions with the exception of phonics since it is believed that students should be allowed an additional year to develop and demonstrate these skills.
The grade 1 pretest scores for students entering the program in September 2005 indicated that 80 percent of those students were in the “at risk” category, while 15 percent were reading just below grade level and 5 percent were reading at or above grade level. By the end of the first year in the program, the “at risk” category were reduced from 80 percent to 41 percent while 26 percent of the students were reading just below grade level and those reading at or above grade level had jumped from 5 percent to 33 percent. Clearly, the overall pre- and posttest results for grade 1 showed that involvement in the program was associated with significant improvements in reading accomplishment.
The figure shows that the grade-level improvements continued across the second and third years that these students were involved in the program. At the end of their second year in the program when measured against the grade 2 standards, the proportion of students “at risk” was further reduced to 33 percent while those reading at or above grade level had increased to 39 percent. By the time student had gone through the three-year cycle of the Caribbean CETT program, 65 percent of those students were reading at or above grade level and only 15 percent were “at risk.”
The target of the Caribbean CETT program is to have, in each school involved in the project (i) at least 60 percent of students reading at or above grade level and (ii) 80 percent of students no longer at risk. This target was considered reasonable for project schools which were drawn from among those that were the poorest performers and located in marginalized communities. A 2004 report by the Southern Regional Education Board (SREB) of the United States reported that among its 16 member states, the median percentage of grade 4 students mastering or exceeding State Standards in reading was 70 in 2001 and 71 in 2003, and this was for all schools. On the National Assessment of Educational Progress (NAEP), which transcends the limitations of independent within-state standards and serves as a common measure for comparing achievement across states, the median percentage of grade 4 students achieving at or above the basic achievement level, denoting partial mastery of prerequisite knowledge and

LITERACY AND NUMERACY IN THE CARIBBEAN
150
skills, was 60 in 2003 for the SREB member states compared with the national U.S. median of 62 percent. In the case of the proficient achievement level, which requires demonstration of competency over more challenging subject matter, the median percentage of grade 4 students achieving at or above that level for the SREB member states in 2003 was 28 compared with 30 for the nation as a whole (SREB 2004).
Most, if not all countries are likely to have the ambitious goal of having all children read at or above grade level. Experience to date suggests that this may be overly ambitious as a short- or medium-term goal for most countries and certainly for the subset of schools that rank at the bottom of the overall performance ladder. The targets set by the Caribbean CETT for the poorest performing schools which comprise the project schools seem to be a good way of benchmarking success.
The dual target of at least 60 percent of students reading at or above grade level and 80 percent of no-longer-at-risk students was evidently achieved, and in fact exceeded, for the cohort who entered the program in 2005 and completed the three-year cycle in 2007. Sixty-five percent of the cohort were reading at or above grade level by the end of that period while 85 percent were no longer at risk (those reading at or above grade level added to those reading just below grade level). We expect that the results will be even better for the cohort completing the program in 2008 and 2009, given that teachers in the program tend to improve their proficiency over time and the performance of students for the particular grade level that they teach tend to improve in successive years. This is well illustrated in figure 6.2, which shows the performance of grade 1 classes taught in three consecutive years by the same teacher. The data are presented for three schools drawn from three different clusters in the project—Belize, Sam Sharpe (Jamaica), and St. Vincent and the Grenadines.

LITERACY AND NUMERACY IN THE CARIBBEAN
151
The figure shows, for the school from the Belize cluster, the
progressive improvement in the achievement of the grade 1 class from a mean of 60 percent in 2005 to 68 percent in 2006 and 73 percent in 2007. The classes were taught by the same grade 1 teacher over the three years. Similarly, the achievement of the grade 1 class for the school from the Sam Sharpe cluster improved progressively from a mean of 61 percent in 2005 to 63 percent in 2006 and 70 percent in 2007 and in the case of the school from the St. Vincent and the Grenadines cluster the achievement improved from a mean of 53 percent in 2005 to 63 percent in 2006 and 70 percent in 2007. At times, the difference in performance from one year to the next is small but there is a clear trend of improvement across years in the same grade taught by the same teacher. It is, therefore, reasonable to expect the performance of students to improve in 2008 and 2009.
Despite the deliberate targeting of schools that have—historically—performed poorly and are in marginal communities, the Caribbean CETT has been able to improve performance of students in those schools to the point where they are beginning to outperform students at other mainstream schools in a number of independent
Figure 6.2 Improvements associated with grade 1 teacher over time in three schools selected from three different clusters

LITERACY AND NUMERACY IN THE CARIBBEAN
152
national measures of student literacy and achievement. These include the grade 6 achievement tests (GSATs), called by various names, which are administered in most Caribbean countries.
Data reviewed from the eight schools in the Bethlehem cluster in Jamaica readily illustrate the point. As table 6.3 shows, in 2003, only one of the eight schools in that cluster performed above the national mean score in the GSAT. But by 2008, the obverse of that position was obtained: only one school performed below the national GSAT mean score.
Table 6.3 Mean scores of schools in the Bethlehem cluster in relation to the national mean score in the grade 6 achievement test (GSAT) in Jamaica
School
Performance compared with 2003 national mean of 52
Performance compared with 2008 national mean of 51
Mean Score Classification Mean Score Classification
Ballards Valley 51 Below mean 55 Above mean Barbary Hall 47 Below mean 58 Above mean Bethlehem 48 Below mean 48 Below mean Brinkley 43 Below mean 69 Above mean Mount Osborn 41 Below mean 51 At mean Red Bank 48 Below mean 62 Above mean Sea View 53 Above mean 61 Above mean St. Mary’s 44 Below mean 56 Above mean
The anecdotal information about performance in a number of other clusters suggests a similar experience. The first set of students to have experienced three full years of the CETT program will take the national grade 6 examinations some time in 2009. The PIU will collect and analyze the performance data for these students and will share the results with countries in the region.
Accounting for the success
The success of the Caribbean CETT reading project may be attributed to a number of factors. These include:
• The project staff comprised highly competent persons who were passionate about achieving success. They believed in the project and worked tirelessly in the field to make sure that issues were quickly addressed and that progress was made in implementing the scheduled activities in a timely manner.

LITERACY AND NUMERACY IN THE CARIBBEAN
153
• The location of the CIUs in the institutions training primary school teachers and the close working relationship with the local MOE. This enhanced the legitimacy of the project as an integral part of the mission of the teacher training institutions to improve the quality of teaching in the schools that they served. Especially in the early phase of the project, the heads of the teacher training institutions played a critical role in the planning and overall management of the implementation process.
• The nature and intensity of the teacher training program. Project teachers were provided with continuing professional development in the teaching of reading and were provided with assistance to develop the most effective strategies as reading instructors and in generating innovative responses to particular difficulties experienced by Caribbean children.
• The training of principals to be an integral part of the reading program by serving as instructional leaders in project schools in keeping with the well-established research evidence that strong instructional leadership impacts significantly on teaching and learning (Leithwood and others 2004; Leithwood and Riehl 2003; Waters, Marzano, and McNulty 2003). This involved training of principals in several technical aspects of the Caribbean CETT reading program and the provision of advice and encouragement by staff of the PIU and CIUs to principals to provide school leadership to the reading program.
I believe, however, that the most critical factor contributing to the success of the project is the extensive use of feedback. Indeed, a distinctive feature of the Caribbean CETT project is its use of data to bring about improvements in various aspects of the work it undertakes and to guide decision making. This is, particularly, so in the use of assessment data to improve the proficiency of teachers and the achievement of students. In this regard, the emphasis is on formative assessment rather than summative assessment, on assessment for learning rather than assessment of learning (see Assessment Reform Group 2002; Assessment Systems for the Future 2005; and Griffith 2008 for a discussion of these concepts).
The Caribbean CETT project focuses on the improvement of teacher proficiency in the teaching of reading as the vehicle for student improvement in reading. It pursues a number of teacher training interventions aimed at helping teachers to improve. Central to these interventions is the use of feedback.

LITERACY AND NUMERACY IN THE CARIBBEAN
154
A critical intervention is training workshops conducted by the reading specialists in collaboration with the PIU staff and, in particular, the teacher trainer and the test and measurement specialist. All workshops are systematically evaluated. A prototype evaluation instrument, The Caribbean CETT Workshop Evaluation Instrument, was developed to evaluate and provide feedback on workshops conducted by members of the PIU and reading specialists.
This instrument collects data, inter alia, on participants’ rating of the content of the workshop, the clarity and organization of presentations, the presenters’ knowledge of the subject, the training materials used, and the effectiveness of the use of time. Although these evaluations serve a summative purpose by providing an assessment of how well the workshops have achieved their intended outcomes, it is the formative use of the data that is emphasized. The feedback provided from the evaluation instrument is carefully analyzed and used to guide improvements in the delivery of other workshops so that teachers can benefit optimally from the interventions to improve their skills in the teaching of reading.
Formative use of feedback is also evident in site visits made to teachers by reading specialists and staff of the PIU. These visits provide opportunities for extensive feedback to teachers to help them improve their instructional practices. A Caribbean CETT quarterly report summarizes the process as follows:
After a Reading Specialist has observed a teacher, she then sits with the teacher and discusses issues specific to that teacher’s practice. The teacher is also given the opportunity to express his/her feelings, views and opinions, or to ask for specific guidance in a setting where he/she has the undivided attention of the Reading Specialist. (Caribbean CETT 2007:20)
Both workshops and site visits are intended to improve the proficiency of teachers. The extent to which this has been accomplished is a matter of summative assessment. A Rating Scale for Teachers of Language and Literacy has been specially developed for this purpose. It assesses the practice of teachers on four dimensions: planning, execution, classroom environment, and reflection. The instrument is used to locate a teacher on a continuum to indicate the level of proficiency accomplished and so provide information to the project on the proportion of teachers who have reached the desired level of proficiency. Such feedback is clearly summative in nature.

LITERACY AND NUMERACY IN THE CARIBBEAN
155
But this very feedback is also used by the CETT teacher trainers and the reading specialists to identify areas in which teachers need further assistance to improve their proficiency. Teachers, too, are encouraged to make their own assessment of their areas of strength and weakness and to take action, independently, to improve in areas where they are weak. In a recent update on the Caribbean CETT project, the director noted that the Rating Scale for Teachers of Language & Literacy has been adopted by a number of principals to undertake teacher observation and to provide feedback in a more structured way for teacher improvement (Caribbean CETT 2008). The value of the formative use of feedback in improving teacher proficiency is clearly an important lesson that is being learned.
The ultimate expected outcome of the Caribbean CETT project is the improvement of student proficiency in reading. In order to achieve this outcome, emphasis is placed on the use of feedback to improve learning, that is, on assessment for learning. The process of using feedback on student achievement to improve learning involves the collection of baseline data from all students entering the program to provide feedback to teachers about the proficiency of the students on the various dimensions of reading. The performance of the individual student is given careful consideration. This feedback helps the teacher to plan instruction in response to the profile of performance of students. Because the individual data are shared with students, they too, are able to make their own assessment of the areas in which they need to improve and to participate with the teacher in working out how they can do so. The student is thus an important player in the learning enterprise. Feedback from the achievement tests is vitally important to the development of differentiated instruction which is central to the project, including gender-sensitive approaches which are better suited to boys in particular who tend to trail behind girls in performance in most grades.
In order to assist students who are not achieving satisfactorily, the CETT project has developed Caribbean CETT diagnostic tests of essential reading and writing skills, which are administered to those students, to provide more detailed and specific information about the nature of the difficulties they experience in a particular dimension of literacy. This provides specific feedback to the teacher and student that allows for a more focused treatment of the specific learning difficulty experienced by the student. The teacher is encouraged to use a

LITERACY AND NUMERACY IN THE CARIBBEAN
156
variety of approaches that have already been tried successfully in treating with similar difficulties or to experiment with new approaches to helping the student over the learning hurdle.
Progress toward achieving the expected outcomes at the end of the school year is assessed by comparing end-of-year performance data with the initial or baseline data. But these end-of-year data are also used as part of the assessment for the learning process to determine areas that require attention in the next grade level to which students proceed and to plan the next year’s intervention.
In a recent study, assessing the relative importance of the use of feedback, compared with other strategies used by the Caribbean CETT, Griffith (in press) found that the use of feedback was endorsed as the most important strategy for the improvement of teaching and learning in the Caribbean CETT program. Although use of ICT, provision and availability of print and nonprint materials, expertise of the teacher, and the encouragement provided to students by the teacher were viewed as important to the success of the Caribbean CETT reading program, the use of feedback was assessed to be paramount to the success of the program. The findings of the study validates the importance of feedback as, perhaps, the most critical factor in the success of the Caribbean CETT reading program.
The future: Issues of sustainability
The USAID-funded project comes to an end in September 2009. The efforts of the project are now directed at ensuring that countries and institutions involved in the project are well prepared to sustain critical aspects of the CETT reading program without the need for any significant ongoing external technical support.
The project will intensify its work with the MOEs and the teacher training institutions to ensure the sustainability of a structure to continue and expand the Caribbean CETT reading program. This involves the retention of the trained reading specialists as part of the staff of the teacher training institutions and the incorporation of the CETT methodology into the regular preservice teacher training programs. It involves, as well, the retention of the ICT technicians to provide user-

LITERACY AND NUMERACY IN THE CARIBBEAN
157
support services to assure the proper and efficient functioning of the ICT component of the program.
The project will work with the MOEs to see how the CETT program can be integrated into the existing education system as part of the educational reform programs that many of the ministries are currently undertaking. This will involve continued policy dialogue with ministers of education of the Organization of Eastern Caribbean States (OECS) and the Caribbean Community (CARICOM), as well as permanent secretaries and other senior officers of the MOEs. It will involve, as well, collaborating with governments in soliciting financial assistance from development agencies and the private sector for the roll out of the reading program to additional schools and countries. It is estimated that an annual $1 million, over a five-year period—for a total of $5 million—will meet the cost of a small technical staff and the provision of the materials and services required for a phased rolling out of the program in the region.
Additionally, the project will intensify the effort to apply the Caribbean CETT methodology to other subjects, beginning with mathematics. A small team of persons, with experience in the CETT approach and in the teaching of mathematics, has already been identified to develop a concept paper for a mathematics project. The project will collaborate with governments in the region in seeking funding from development agencies and the private sector for a pilot of the CETT mathematics project. It is estimated that an additional $1 million will be needed to pilot the transfer of the Caribbean CETT methodology to the teaching of mathematics in selected countries and schools.
A phased reduction of the Caribbean CETT staff will be undertaken and a small self-financing unit will be retained to undertake the following:
Coordinate and deliver technical assistance to countries and schools in implementing or extending the Caribbean CETT reading program. The Caribbean CETT has established a network of specialists in the region whose services can be utilized in an expansion of the CETT reading program. The unit will serve as a clearinghouse for such services. Additionally, the unit will provide training, support, and consultancy services for the MOE personnel, reading specialists, teachers, and principals on an “as needed” basis for those countries starting the Caribbean CETT reading program or expanding it to additional schools.

LITERACY AND NUMERACY IN THE CARIBBEAN
158
Continue the provision of assessment services to the region, including the analysis of data to provide useful feedback for learning and to assess student and teacher progress. The Caribbean CETT has developed both grade-level achievement tests (CRSAT) based on the reading standards developed and a diagnostic testing kit based on the experience with Caribbean children. The CETT unit will develop and maintain an item-and-test bank for achievement and diagnostic testing that responds to the needs of the region. Additionally, the Caribbean CETT has developed a valid and reliable Rating Scale for Teachers of Language and Literacy which will be made available for assessing the proficiency of teachers as they are trained to improve reading instruction. The provision of centralized assessment services will assure greater economy of scale in the delivery of these services and will also assure a common measure of reading achievement and teacher proficiency across countries in the region.
Continue to provide the texts and other print and nonprint materials developed by the project to support the reading program. This will assure continued and expanded availability of materials that respond to the particular difficulties experienced by Caribbean children. The print materials include (i) The Great Caribbean Works of Art for Reading Series for students with guidance for teachers, (ii) My Sight Words Workbook Series for students with guidance for teachers, (iii) Effective Training for Caribbean Teachers: Guidelines for Reading Specialists, a manual for teachers of reading, (iv) Strategies for the Teaching of Reading and Writing: A Practical Guide for Teachers of Caribbean Children, a comprehensive text for teachers, college lecturers, and other persons interested in the teaching of reading, and (v) a collection of teachers’ action research reports on innovations implemented to address reading problems of students previously shared among teachers in CETT training workshops. The project will seek assistance for the commercial publication of print materials. The nonprint materials include DVDs/videos with demonstration lessons and other guidance for teachers of reading. These are currently being finalized for dissemination to countries in the region.
Continue the collaboration with countries in the region in seeking the support of development assistance agencies and the private sector to roll out the Caribbean CETT reading program. This will involve assistance to countries that are currently implementing the CETT program in a limited number of schools as

LITERACY AND NUMERACY IN THE CARIBBEAN
159
well as to those wishing to start the CETT reading program. It will also involve soliciting assistance to pilot the extension of the CETT methodology to other subjects, beginning with mathematics.
References
Assessment Reform Group (ARG). 2002. Assessment for Learning: 10 Principles. ARG. http://www.qca.org.uk/libraryAssets/media/4031_afl_principles.pdf.
Assessment Systems for the Future. 2005. “Aims and Outcomes of the First Year’s Work of the Project.” http://arg.educ.cam.ac.uk/images/ASF Working Paper Draft 10.pdf.
Caribbean Center of Excellence for Teacher Training (CETT). 2007. Caribbean CETT Quarterly Performance Report January–March 2007. Kingston, Jamaica: CETT.
Caribbean CETT. 2008. “Project Update.” Presented at the Meeting of the Project Consultative Committee, Le Meridien Pegasus, Guyana, October 29, 2008.
Cooperative Agreement. 2006. Agreement No. 532-A-00-06-00076-00 for the Caribbean CETT signed between the Joint Board of Teacher Education (JBTE) and the U.S. Agency for International Development (USAID), September 29, 2006.
Griffith, S. A. 2008. “A Proposed Model for Assessing Quality of Education.” International Review of Education 54, 99–112.
Griffith, S. A. In press. Assessing the Importance of Feedback to Teacher and Student Improvement in an Innovative Caribbean Reading Project. Nova Publishers.
Leithwood, K. A., and C. Riehl. 2003. What We Know About Successful School Leadership. Philadelphia, PA: Laboratory for Student Success, Temple University.
Leithwood, K., K. S. Louis, S. Andersen, and K. Wahlstrom. 2004. How Leadership Influences Student Learning: Review of Research. Minneapolis, MN: Center for Applied Research, University of Minnesota.
Southern Regional Education Board (SREB). 2004. “Mastering Reading and Mathematics in the Early Grades.”

LITERACY AND NUMERACY IN THE CARIBBEAN
160
http://www.sreb.org/main/Goals/Publications/04E10Early_Grades_Math_Reading.pdf.
Waters, J. T., R. J. Marzano, and B. A. McNulty. 2003. Balanced Leadership: What 30 Years of Research Tells Us About the Effect Of Leadership on Student Achievement. Aurora, CO: Mid-continent Research for Education and Learning. http://www.ccsso.org/content/pdfs/BalancedLeadership.pdf.
Unsolicited proposal. 2002. Proposal presented to the USAID by the JBTE, University of the West Indies, Mona, June 2002.

Part III
International Assessment of Literacy and Numeracy


163
Chapter 7 IEA’s International
Assessments in Reading, Mathematics and Science:
Specifications, Benefits, and Resource Requirements
Hans Wagemaker
Dr. Hans Wagemaker is executive director of the International Association for the Evaluation of Educational Achievement (IEA), a position he has held since 1996/7. He specializes in large-scale assessment studies, policy studies, and research methods. Dr. Wagemaker worked in the education sector in New Zealand as senior research officer and later manager of the Research and International Division of the Ministry of Education. He has extensive experience in managing and conducting research projects using a wide variety of research methods and has worked extensively in a variety of national and international settings. He holds a BA and MA (Hons) from Otago University and a PhD from the University of Illinois.
This paper provides a rationale for the evaluation of quality educational outcomes, particularly in the areas of literacy and numeracy and in the context of international comparative research studies. In addition to outlining the benefits of participation in international large-scale assessments, the paper discusses the resources required to carry out such studies.
The International Association for the Evaluation of Educational Achievement (IEA, http://www.iea.nl) is a nongovernmental organization (NGO) with a secretariat based in Amsterdam, the Netherlands, and a research and data processing center in Hamburg, Germany. Involved in the assessment of student

164
achievement for more than 50 years, IEA includes among its membership some 66 countries. It works with more than 90 educational systems around the world.
IEA was initially conceived as a collaborative of research organizations interested in comparing student achievement across a small number of educational systems. Over the past 50 years it has evolved to focus on the following objectives:
• To provide international benchmarks to assist policy makers in identifying the comparative strengths and weaknesses of their educational systems
• To provide high-quality data to increase policy makers’ understanding of factors that influence teaching and learning
• To provide high-quality data to help policy makers prepare, implement, and evaluate educational reforms
• To develop and improve the capacity of educational systems to engage in national strategies for educational monitoring and improvement
• To contribute to the development of the worldwide community of researchers in educational evaluation
As can be seen from the objectives outlined above, IEA focuses fundamentally on supporting educational policy reform and improvement by providing policy makers and researchers with information to enhance their understanding of the teaching and learning processes.
These aims drive the way IEA develops and conducts its studies. Studies such as the Progress in International Reading Study (PIRLS) and the Trends in Mathematics and Science Study (TIMSS) are designed to assess the learning outcomes of students after a fixed period of schooling; they focus on grade rather than age as the basis for sample selection and analysis because students learn through teaching, not by growing older. These studies are fundamentally concerned with opportunities to learn—that is, with understanding the linkages among the intended curriculum (dictated by policy), the implemented curriculum (taught in schools), and the achieved curriculum (what students learn).

165
Why participate in international comparative studies
of educational achievement?
Writing in the early 1970s, one of the architects of the early IEA studies outlined the dilemma facing both practitioners and policy makers in education:
At all levels in an educational system, from the teacher in the classroom, through the administrator to the policymaker, decisions have continually to be made, most of the time on the basis of very little factual information. (Postlethwaite 1974)
Even when they face system-level constraints (such as a centralized curriculum), schools and teachers exercise some discretion as to what they teach and how they teach it. International comparative studies of education such as IEA’s PIRLS and TIMSS seek to determine how and on what basis policy makers, administrators, and teachers make those decisions.
The demand for evidence-based policy making has spurred a demand for reliable information on educational achievement and the processes related to teaching and learning. The risks associated with not focusing on educational achievement are clearly expressed in A Nation at Risk, which in 1983 identified the decline in U.S. educational standards as the cause of the U.S. economic decline in the face of intensified global competition. The authors wrote:
If an unfriendly foreign power had attempted to impose on America the mediocre educational performance that exists today, we might well have viewed it as an act of war. As it stands, we have allowed this to happen ourselves . . . [W]e have, in effect, been committing an act of unthinking, unilateral, educational disarmament. (United States National Commission on Excellence in Education 1983, 5)
Although the purported link between economic decline and a decline in educational standards is likely to be of limited value in understanding or addressing either educational or economic policy concerns, A Nation at Risk drew attention to real concerns about educational performance, not only in the United States but also in many countries of the Organisation for Economic Co-operation and Development (OECD). Since its publication, educational policy makers have focused more intensely on excellence, equity, and efficiency.

166
But while education has become a higher priority for many countries, the fact is that, as in many other areas, a limited amount of funding is available for educational development. Furthermore, that funding is accompanied by increasing demands for accountability. In Reinventing Government (Osborne and Gaebler 1993), for example, the authors argue for an educational marketplace shaped by the twin imperatives of efficiency and effectiveness. The implicit argument is that increased funding and improved instructional quality are likely to produce greater numbers of better-prepared students, which in turn will result in a more internationally competitive workforce. The TIMSS and PIRLS studies respond to this argument by assessing reading, mathematics, and science achievement and, in turn, countries’ ability to produce well-educated scientists, mathematicians, engineers, and citizens capable of fully participating in modern democratic societies.
In general, the concerns expressed above signal a shift in focus from expanding to improving educational systems. That change in emphasis is noted by Tuijnman and Postlethwaite (1994), who argue that, although the history of large-scale assessment dates back to the early 1960s, there has been a clear move toward a more systematic focus on national monitoring since the release of A Nation at Risk, the results of IEA’s Second International Science Study (SISS), and the report from the 1989 educational summit in Charlottesville, Virginia, which brought together the governors of the 50 states of the United States to frame national goals for education with a strong emphasis on quality.
As interest in global competitiveness and local accountability has increased, so too has interest in international comparisons of educational performance. What, then, are the benefits of participating in such comparisons?
The characteristics of PIRLS and TIMSS
PIRLS and TIMSS are IEA’s primary assessments of the basic skills of literacy and numeracy. They are intended to provide policy makers with a wide range of information related to student performance in the primary and lower secondary (TIMSS grade 8) areas. In addition to giving educators and policy makers several measures of student achievement, they also offer comprehensive information on the antecedents of student achievement. The

167
purpose of these assessments is to aid in the strategic process of educational policy improvement and reform.
Progress in Reading Literacy Study (PIRLS)
Target population: Grade 4 students
PIRLS is designed as a trend study with a five-year cycle. It is targeted at grade 4, the point at which, in many countries, students are making the transition from learning to read to reading to learn. After four years of schooling, students should have acquired sufficient basic skills in reading to allow them to make satisfactory progress in other subject areas.
Operationally, the target population for grade 4 is defined as follows:
The target grade (4) should be the grade that represents four years of schooling, counting from the first year of ISCED Level 1. So that students will not be too young for the assessment, the minimum average age at the target grade should not fall below 9.5 years.
For PIRLS, from a stratified random sample of approximately 150 schools, one class per school is selected. In countries that have fewer than 150 schools (for example, Malta, Qatar, Kuwait, and Belize), a census of schools (and possibly students) is taken.
The construct of reading for this study is defined as “the ability to understand and use those written language forms required by society and/or valued by the individual”:
Young readers can construct meaning from a variety of texts. They read to learn, to participate in communities of readers, and for enjoyment. (Mullis and others 2004)
Test design
To provide educators, teachers, and policy makers with a comprehensive picture of the skills that students in grade 4 possess, the assessment examines the content and cognitive domains described in table 7.1.
The literary texts used in the content domain are complete short stories or episodes accompanied by supportive illustrations. The five stories covered a variety of settings, each having essentially two main characters and a plot with one or two central events.

168
The five informational texts cover a variety of content, including scientific, geographical, biographical, and procedural material. The texts are structured sequentially or by topic and include organizational and presentational features such as diagrams, maps, illustrations, photographs, text boxes, lists, or tables in addition to prose.
Table 7.1 Relative weighting given to the respective content and cognitive domains in the assessment
Domain Weight (percent) Content domains: Purposes for reading Literary experience (stories and poems, for example) 50 Acquire and use information (for example, instructions, directions, and maps) 50 Cognitive domains: Process of comprehension Focus on and retrieve explicitly stated information 20 Make straightforward inferences 30 Interpret and integrate ideas and information 30 Examine and evaluate content, language, and textual elements 20
Source: Mullis and others 2004.
As students progress through the process of learning to read, they are expected to develop increasingly sophisticated cognitive skills. The grade 4 reading assessment measures the following grade-appropriate cognitive skills. This information can be used to guide instructional practice.
Students are tested for their ability to focus on and retrieve explicitly stated information; make straightforward inferences; interpret and integrate ideas and information; and examine and evaluate content, language, and textual elements.
Background questionnaires
While the above measures help us understand what students know and can do, PIRLS captures significant amounts of background information from the following sources:
• National context questionnaire
• Curriculum questionnaire (for the encyclopedia defined below)
• Principals (school contexts)
• Teachers (instructional context)
• Students (student background, attitudes)
• Parents (home context)

169
The results of these questionnaires provide important insights into school resources related to reading, instructional practices, and student attitudes as well as home resources related to reading, including the significant role that parents play worldwide in children’s reading development.
Furthermore, for both PIRLS and TIMSS, the background questionnaire data allow countries to explore how national policy relates to what happens in the classroom and what students achieve. These data can be used to understand how school resource allotment, teacher preparation and training, and home background all affect student achievement.
Finally, the encyclopedia, which provides an overview of national policies and practices related to the relevant subject matter for each country, enables policy makers to compare their national curriculum goals and expectations with those of other countries and to examine how high-achieving countries approach curriculum and instruction in the areas of mathematics, science, and reading.
Time requirements
To achieve the broad coverage of the test domains of interest and the extensive reporting goals, PIRLS rotates test passages and their items through 12 booklets plus a reader. Students are expected to complete one reading block for each of the purposes of reading—that is, one block related to reading for literary experience and one related to reading for the acquisition of information. Although the test design provides for more than six hours of testing (if a given student were to take all items), the rotated booklet design requires only two 40-minute testing blocks, plus 10 minutes to answer a questionnaire.
Innovations for 2011
In addition to encouraging countries to augment the questionnaire and collecting data that are more relevant at the national level, IEA has planned two major innovations for 2011.
Pre-PIRLS. A modified version of PIRLS has been developed for countries whose grade 4 students are earlier in the process of learning to read than those who participate in PIRLS. For those countries, the pre-PIRLS would be administered at grade 4 and PIRLS at grade 5 or 6.

170
Web-based reading. Students in many countries are exposed to increasing amounts of electronic text. As part of the process of providing students with authentic reading tasks, PIRLS will provide an option to include a computer-based reading assessment in 2011. This represents an attempt not only to anticipate the increased use of technology in assessment but also to acknowledge the increasing diversity of reading environments that students face.
Trends in Mathematics and Science Study (TIMSS)
Target populations
Like PIRLS, TIMSS is designed as a trend study on a four-year cycle. In addition to measuring the achievement of students at the grade 4 level, TIMSS also offers countries the opportunity to study grade 8 students. The four-year cycle not only allows for the examination of trends in the same cohorts over time but also permits the examination of changes in the performance of the grade-4 cohorts four years later. TIMSS, which began in 1995, will complete its fifth cycle in 2011.
Like PIRLS, TIMSS is positioned at key transition points in students’ learning process.
Assessment of mathematics and science
The TIMSS 2007 Assessment Frameworks (Mullis and others 2005) provide the template for IEA’s assessment of mathematics and science at the fourth- and eighth-grade levels. In addition to measuring overall achievement, the frameworks specify the content and cognitive domains that guide the development of the
assessment. Details of the content and cognitive domains can be found in TIMSS Assessment Frameworks (Mullis and others, 2005).
As with PIRLS, the various components of each domain are weighted. The weights for the mathematics assessment are shown in tables 7.2 and 7.3; those for the science assessment appear in table 7.4.
Table 7.2 Target percentages of the TIMSS 2007 mathematics assessment devoted to content domains
Fourth-grade Weight (percent) Eighth-grade Weight (percent) Number 50 Number 30 Geometric shapes and measures 35 Algebra 30 Data display 15 Geometry 20 Data and chance 20 Source: TIMSS 2007.

171
In addition to being familiar with the content of mathematics and science, students must draw on a range of cognitive skills to correctly answer the TIMSS test items and to develop the basic skills necessary to progress in these subject areas.
“Knowing,” the first cognitive domain listed in table 7.3, covers facts, procedures, and concepts students are expected to know. “Applying” focuses on the students’ ability to use knowledge and conceptual understanding to solve problems and answer questions. The final cognitive domain, “reasoning,” requires students to go beyond the solution of routine problems and encompasses unfamiliar situations, complex contents, and multistep problems.
Table 7.3 Target percentages of the TIMSS 2007 mathematics assessment devoted to cognitive domains
Fourth and eighth grades Weight (percent)
Fourth grade Eighth grade Knowing 40 35 Applying 40 40 Reasoning 20 25 Source: TIMSS 2007.
The science portion of the TIMSS test also assesses both content and cognitive domains. These domains at the fourth and eighth grade levels are described in table 7.4.
Table 7.4 Target percentages of the TIMSS 2007 science assessment devoted to content and cognitive domains
Content domains Fourth grade Weight (percent) Eighth grade Weight (percent) Life science 45 Biology 35 Physical science 35 Chemistry 20 Earth science 20 Physics 25 Earth science 20 Cognitive domains Fourth grade Weight (percent) Eighth grade Weight (percent) Knowing 40 Knowing 30 Applying 35 Applying 35 Reasoning 25 Reasoning 35 Source: TIMSS 2007.
Background context
As with reading, the learning of mathematics and science occurs within a context that encompasses numerous factors—among them

172
school type, school resources, instructional practices, student attitudes, and home support for learning.
Every cycle of TIMSS collects information about these contexts to promote understanding of the teaching and learning process as it relates to mathematics and science. Background questionnaires are collected from the individuals listed below:
• National research coordinator (national context/curriculum)
• Principals
• Teachers
• Students
The questionnaires cover five broad areas of interest: curriculum, schools and resources, teachers and their preparation, classrooms and their characteristics, and students (their backgrounds, attitudes, and behaviors).
Time requirements and scaling procedures
Like the PIRLS, the TIMSS assessment samples both students and items. To obtain the ambitious domain coverage while reducing the test burden on students, TIMSS uses a matrix sampling approach, dividing the entire item pool into 14 booklets, with each student completing just one booklet.
This reduces the testing time to 90 minutes for eighth-grade students and 72 minutes for fourth-grade students. An additional 30 minutes at each grade is required for the completion of questionnaires.
Use of scaling procedures developed through item response theory produces a comprehensive picture of the entire student population’s achievement without overburdening students.
The benefits of participation
Comparative studies of educational achievement often focus primarily on achievement data, but the interpretation of such data is not straightforward. Unless they take into account differences in the educational systems analyzed by assessments such as the TIMSS and PIRLS, countries risk developing polices that fail to address or even exacerbate educational needs.

173
The data collected through the background questionnaires allow policy makers not only to address particular policy needs and concerns related to the quantity, quality, and content of instruction but also to identify factors that may be linked to achievement or to subpopulations of national importance (such as gender and ethnicity). While it is not always possible in the international context to collect data on, for example, subgroups of interest that are internationally comparable (such as ethnicity), the PIRLS and TIMSS designs allow countries the option of collecting data on these variables. For example, the TIMSS reports (Beaton and others 1996) included information not only on such things as the characteristics of the students’ home environment (for example, books in the home) and of instructional practices (such as classroom organization) but also on some of the affective characteristics of the student populations, including students’ attitudes toward mathematics and science and their relationship to achievement. Data from the PIRLS study show, for example, that parental involvement in early reading activities is a powerful and positive influence on students’ reading ability at the grade-4 level. Similarly, in the case of Botswana, an extra year of teacher preparation was associated with higher levels of student achievement in mathematics.
Although studies such as PIRLS and TIMSS primarily describe how education is practiced within a given country, they are most powerful when they also compare educational practices across cultures and societies, thus expanding policy makers’ ideas about what might be possible. As Foshay and others (1962) note:
If custom and law define what is educationally allowable within a nation, the educational systems beyond one’s national boundaries suggest what is educationally possible.
Knowing how well students can read and how reading achievement can be improved remains of vital interest to policy makers in every country, rich and poor alike. To compete in an era of economic globalization and meet the requirements of knowledge-based economies, nations must have literate citizens. Furthermore, the ability to read is fundamental to all forms of personal learning and intellectual growth; it shapes an individual’s educational progress and is universally regarded as central to a nation’s social and economic development. These concerns and perspectives on the importance of reading have driven IEA’s ongoing efforts to evaluate how well students around the world master the skills involved in the reading process.

174
Research on the teaching of reading, as undertaken by IEA, enables countries to understand how well their educational and instructional practices work and how background factors (school, teacher, student, home) are implicated in the learning process. In its design and conduct of studies such as PIRLS, IEA attempts to identify factors that are amenable to intervention at the school, regional, or national level. Furthermore, IEA seeks to understand the outcomes of schooling after a fixed period of learning; hence its focus on grade rather than age. This approach allows for a close examination of the ways in which curriculum, teaching, school-related factors, and the students’ backgrounds interact in the process of learning to read.
This combination of policy and research-driven considerations is guided by the belief that new policies are likely to be most effective when they are informed by empirical research addressing the key elements of sound educational planning: curriculum, teaching, school resources, and student needs.
While the core business of IEA is to conduct research-based comparative large-scale studies that focus on the outcomes of schooling in key subject areas at important educational transition points, it is also fundamentally concerned with ways in which studies such as PIRLS affect policy development, research, and national capacity building. The considerable investment in research made by funding organizations, participating countries, and IEA itself should be justified by the reassurance that such research improves educational systems and, by extension, students’ lives.
How can data from PIRLS and TIMSS be used?
Policy development and review
The structure and design of the PIRLS and TIMSS assessments permit extensive analysis of the data for policy guidance. Some areas of inquiry include the following:
Understanding the variation of student performance across content and cognitive domains. For example, what are the characteristics of low and high performers? In which schools/regions can they be found? Do students perform better in some content areas than others? Are some cognitive skills better developed than others?

175
Understanding national performance in an international context and against international benchmarks. For example, how does a country’s performance compare with that of all the other international participants? How does it compare with that of similar countries? How does it compare with that of its economic competitors?
Understanding instructional practices. For example, what school-based factors are implicated a country’s level of achievement? How might these be different from factors at play in other countries?
Understanding school resources. For example, how much do school resources vary within and among countries? How do these variations affect educational improvement?
Understanding the relationship between context and student outcomes.
Monitoring the policy impact of change over time. How does performance change over time and how can this be explained?
Capacity building
IEA is committed to its aim of developing local capacity. It makes a significant investment in developing the participants’ broader knowledge of basic and advanced procedures related to assessment. Skills acquired during each assessment cycle can be applied to any assessment setting and have been adopted by a number of countries as they develop their own national systems.
As part of the process of conducting the PIRLS and TIMSS studies, the participant national research coordinators are trained in the following areas, to various levels:
• Test design as it relates to assessment frameworks
• Sampling
• Item writing
• Survey operations
• Translation and translation verification
• Scoring
• Quality control
• Data entry and management

176
• Data analysis and reporting
To facilitate the process of data management and analysis, IEA provides proprietary software that facilitates sampling, field operations, data management, and analysis.
Since 2000, several independent evaluations have assessed the impact of IEA’s studies. These studies may be found on IEA’s website, http://www.iea.nl.
What is reported?
The figures in this section, taken from the PIRLS 2006 report, illustrate some of the ways in which achievement information is provided to countries. They are just a few examples of the many indices that are constructed and reported on matters such as school resources, instructional practices, student background, and many other variables of educational achievement.
Figure 7.1 shows how average scores are reported. The table includes information about the confidence interval around the mean and the distribution of scores as they relate to the 5th, 25th, 75th, and 95th percentiles. Countries are listed according to their position relative to one another and to the scale score. Information related to achievement is also reported at the subdomain and cognitive processing levels.

177
Figure 7.1 Distribution of fourth-grade reading achievement, PIRLS 2006
Source: IEA 2006.
Trends in reading achievement
Both PIRLS and TIMSS are designed as trend studies that illustrate changes in performance over time. Figure 7.2 shows the average scale scores for countries that participated in both PIRLS assessments (2001 and 2006) together with the magnitude of the change that occurred during that period and an indication of whether such a change was statistically significant. Similar information is also available for many of the indices and variables that are collected through the background instruments.

178
Figure 7.2 Trends in fourth-grade reading achievement, PIRLS 2006 and PIRLS 2001
Source: IEA 2006.
Achievement benchmarks
Student performance in reading is at four points along The achievement scale of the PIRLS assessment is divided into four categories—advanced, high, intermediate, and low. The categories describe what students know and how well they can read, as defined in table 7.5. Figure 7.3 shows the percentages of students scoring at or above the cutoff points for each category.

179
Table 7.5 The PIRLS benchmarks of reading achievement
Low
(400
) Literary. When reading literary texts, students can: • Recognize explicitly stated details • Locate a specified part of the story and make an inference clearly suggested by the text Informational. When reading information texts, students can: • Locate and reproduce explicitly stated information that is readily accessible; for example, at the beginning of the
text or in a clearly defined section • Begin to provide a straightforward inference clearly suggested by the text
Inte
rmed
iate
(475
) Literary. When reading literary texts, students can: • Identify central events, plot sequences, and relevant story details • Make straightforward inferences about the attributes, feelings, and motivations of main characters • Begin to make connections across parts of the text Informational. When reading information texts, students can: • Locate and reproduce one or two pieces of information from within the text • Make straightforward inferences to provide information from a single part of the text Use subheadings, textboxes, and illustrations
High
(550
)
Literary. When reading literary texts, students can: • Locate relevant episodes and distinguish significant details embedded across the text. Make inferences to explain
relationships between intentions, actions, events, and feelings, and give text-based support • Recognize the use of some textual features (for example, figurative language, an abstract message) • Begin to interpret and integrate story events and character actions across the text Informational. When reading information texts, students can: • Recognize and use a variety of organizational features to locate and distinguish relevant information • Make inferences based on abstract or embedded information • Integrate information across a text to recognize main ideas and provide explanations • Compare and evaluate parts of a text to give a preference and a reason for it • Begin to understand textual elements, such as simple metaphors and the author’s point of view
Adva
nced
(625
)
Literary. When reading literary texts, students can: • Integrate ideas across a text to provide interpretations of a character’s traits, intentions, and feelings, and provide
full text-based support • Interpret figurative language • Begin to examine and evaluate story structure Informational. When reading information texts, students can: • Distinguish and interpret complex information from the different parts of the text and provide full text-based support • Understand the function of organizational features • Integrate information across a text to sequence activities and fully justify preferences
Source: IEA 2006.

180
Figure 7.3 Percentages of fourth-grade students reaching the PIRLS 2006 international benchmarks of reading achievement
Source: IEA 2006.
Background data
Figure 7.4 provides an example of how some of the background data are reported in relation to achievement. Specifically, this exhibit illustrates the relationship between hours of reading instruction and achievement over time. Many other variables are reported and used to both understand context and provide the basis of more complex secondary analyses. For key background variables, trend data are reported.

181
Figure 7.4 Number of hours reading is taught weekly to fourth graders (formal and integrated) with trends, PIRLS 2006
Source: IEA 2006.

182
Resources required to participate in IEA projects
Countries are able to manage IEA studies with relatively few full-time staff members. There are, however, some key positions that must be filled throughout the duration of the project. These positions may be located in a university, independent research institution, or in a ministry of education (MOE) assessment or research unit.
Staff roles and functions
The national research coordinator (NRC) oversees the implementation of the study in each country, and additional staff is required to run it. He or she is the main contact for international study coordination and is responsible for coordinating all the tasks in the country. The NRC must have an excellent command of English, which is IEA’s working language.
The NRC is responsible for organizing the national center. He or she Hires and supervises staff, assures that the required hardware and software and other necessary equipment and materials are available, and participates in international NRC meetings.
Other required staff members are as follows:
• Data manager (possibly half-time). Manages all data-related issues, adapts codebooks, organizes data entry, and verifies the entered data
• Data entry staff (required for short periods—four to six weeks—for field tests and main tests). Enter the data from the test questionnaires into the computer.
• Translators/translation reviewers. Translate the instruments into the local language(s) and verify the translation internally
• Office staff. Contact schools, authorities, and other players involved; organize the office and traveling
Individuals may fill one or several of these roles, depending on their capacity and the funds available. In addition, each national study center will need to select the following:
• School coordinators (usually school teachers who are not paid extra, although some countries provide a nominal teacher release day or equivalent). Organize and supervise

183
data collection in selected schools (field tests and main test)
• Test administrators (often classroom teachers): Conduct testing sessions in the selected classes
• National quality control monitor. Observes and reports on (main study) data collection in selected schools for one to two weeks during testing
• Scorers (usually work in teams of three or four during the open-ended scoring period, usually six weeks and often less). Mark student answers to the open-response test items
In-country tasks
The in-country tasks involved in PIRLS and TIMSS may be separated into six stages.
Stage 1: Contacting schools and sampling classes. IEA provides software to simplify many of these tasks.
• Contact the sampled schools to obtain cooperation.
• Identify and train school coordinators for each school.
• Request information about classes and their teachers from the sample schools.
• Sample two classes, whenever possible (per school and per target grade).
• List the students and their teachers in the sample classes.
• Assign test booklets to students.
• Assign questionnaires to students, teachers, and principals.
• Print tracking forms and labels.
Stage 2: Preparing the material
• Translate the TIMSS survey materials.
• Make document adaptations to achievement tests and questionnaires.
• Submit all instruments for international translation verification.

184
• Produce and assemble test booklets and questionnaires (using Adobe InDesign) and submit them for layout verification.
• Duplicate materials.
Stage 3: Administering the test
• Prepare (through an orientation) the classes selected for testing.
• Administer tests and questionnaires.
• Complete test administration forms.
• Calculate student response rates and hold makeup sessions.
• Return materials to the national study center.
• Carry out school visits for quality control.
• Track participation of schools, students, and teachers.
Stage 4: Scoring constructed response items
• Organize materials for scoring and data entry.
• Score constructed response items.
Stage 5: Creating the data files. The software mentioned here (WinW3S, WinDEM) is created by IEA. Countries participating in the IEA studies receive training in its use.
• Enter test administration information in the WinW3S.
• Export the WinW3S database to the IEA data processing center (DPC) (Windows data entry manager, WinDEM).
• Document adaptations in the national adaptation forms.
• Enter data in the WinDEM.
• Verify data.
• Submit materials to the international study center (ISC) and the IEA DPC.
Stage 6: Preparing national reports
• Conduct national analysis of data.
• Write reports.

185
• Disseminate national reports (in synchronization with the release of the international report).
Framework for estimating national costs of participating in PIRLS 2011
Participation fees
The PIRLS 2011 participation fees are assessed in two currencies. To hedge against currency risks, IEA invoices countries $75,000
and €75,000, spread evenly over the five years of the project (that is, $15,000 and €15,000 per year). These fees cover the many assessment activities required to develop survey instruments, conduct field tests, collect data, and report on the survey findings in a timely and accurate manner.
For example, the international costs include:
• Updating the study framework
• Developing replacement items for the reading literacy tests and scoring procedures
• Developing sample plans for each participating country, monitoring the sampling procedures in each country, and developing sampling weights
• Revising and streamlining the questionnaires (for students, teachers, parents, and schools)
• Developing procedures for translation verifications, conducting verifications, and managing those processes
• Developing operations and data collection manuals, and training countries in data collection and scoring procedures
• Training quality control monitors, conducting quality assurance site visits during data collection, and documenting the results
• Constructing an international database and checking and rechecking the accuracy and comparability of the national data sets
• Conducting a variety of data analyses—including scaling, estimating sampling errors, and deriving variables for reporting

186
• Preparing report tables and having them reviewed by the participating countries
• Writing and publishing international and technical reports
• Producing a thoroughly documented database and the accompanying user guide
The first two years of the study were focused on instrument development (including field test activities); year three was devoted to the main survey data collection; and years four and five were dedicated to data analysis and preparation of the international database and international reports.
Factors that may affect the budget
The national budget for PIRLS depends heavily on country practice, where the national study center is located, and such things as local labor rates. The major items to be taken into account are as follows:
Staff. For a study of this scope, IEA’s national study centers usually consist of one or two full-time researchers, plus a few (one to three) part-timers who assist with different tasks at different times. Among them are:
• Translators of the instruments
• Persons familiar with the Adobe InDesign (PageMaker) software to assemble booklets and questionnaires
• Persons to implement the test (school coordinators, test administrators)
• National quality control observer of data collection
• Scorers
• Data manager
• Clerical assistant
National study center. The national study center has to be equipped with at least three computers with Pentium processors or higher, Windows 2000/XP, Microsoft Office 2000/2003 (or later), Internet and e-mail access (with a possibility of sending files), InDesign, and Adobe Acrobat. Other costs include office supplies and mail (including courier services). The mailing costs should include the cost of sending about 1,400 test booklets (100 of

187
each booklet) to the DPC (after main data collection) for reliability coding.
Travel. Ten NRC meetings, most of them connected with a training program, are held in different countries over the span of the study. Two additional training sessions are held at the IEA DPC. Some countries send two (or more) persons to meetings (for example, an NRC plus the person responsible for managing scoring). After the study is completed and the database is published, a special meeting is devoted to using the database. This training should be attended by the NRC as well as other researchers, if possible.
Some travel within the country needs to be budgeted as well (for example, for training test administrators, monitoring schools during data collection, and so on).
Quality control. International quality control monitors are employed by IEA directly. The cost of their training and travel is covered by IEA. They also receive an honorarium for their work.
Instruments preparation. Preparing national versions of the survey instruments requires translation into the national language(s), printing, and distribution to schools. Estimates of the cost of preparing testing materials for PIRLS should take into account the following tasks:
• Field test printing
o 4 booklets @ about 30 pages each × 200 students each + extras
o 2 questionnaires (student and home) @ 24 pages each × 800 students each + extras
o 2 questionnaires (school and teacher) @ 24 pages each
× 25 schools each + extras
• Main survey printing
o 10 booklets @ about 30 pages each × 450 students each + extras
o 2 questionnaires (student and home) @ 24 pages each × 4,500 students each + extras
o 2 questionnaires (school and teacher) @ 24 pages each
× 150 schools each + extras

188
Scoring.
• Field test scoring: 15 open-ended questions per book (approx.) × 800 students + 400 reliability
• Main survey scoring: 15 open-ended questions per book (approx.) × 4,500 students + 650 reliability
• Cross-country scoring: 60 open-ended questions (4 passages) × 200 students each
Reporting and dissemination of the results. This includes the costs of preparing and publishing the main report, holding a press conference for its release, and/or any other form of the result dissemination (for example, publications, conferences, or workshops).
Framework for estimating national costs of participating in TIMSS (one grade)
Participation fees
Participation fees for one grade are $90,000 and €90,000, divided equally over four years. Participation fees for two grades are
$130,000 and €130,000, divided equally over four years.
Factors that may affect the budget
With regard to staff, equipment, training, quality control, instrument preparation, scoring, and reporting of results, the national budget required for TIMSS is similar to that required for PIRLS, as described in the previous section.
The costs of preparing, printing, distributing, and scoring national versions of the TIMSS survey instruments will likely be different from those of the PIRLS instruments. For TIMSS, the estimates should be as follows:
• Field test printing9
o 7 booklets @ about 60 pages each × 160 students + extras
o 1 student questionnaire @ 24 pages each × 800 students + extras
o 2 teacher questionnaires (science and mathematics
teacher) @ 20 pages each × 25 schools + extras
9 The number of booklets is based on TIMSS (2007). For TIMSS 2011 number of booklets for both the field test and the main study might change.

189
o 1 school questionnaire @ 16 pages each × 25 schools
• Main survey printing
o 14 booklets @ about 60 pages each × 350 to 380 students + extras
o 1 student questionnaire @ 24 pages each × 4,500 students + extras
o 2 teacher questionnaires (school and teacher) @ 20
pages each × 150 schools + extras
Scoring.
• Field test scoring: 800 booklets (approx.): 48 booklets per day = 17 person days
• Main survey scoring: 4,500 booklets (approx.): 48 booklets per day = 94 person days
• Cross-country scoring: 1,200 booklets (approx.): 48 booklets per day = 25 person days
Summary
In response to growing public demand for accountability in education and the use of hard evidence in the making of education policy, IEA has developed a comprehensive strategy for measuring the quality of educational outcomes in the key areas of mathematics, science, and reading, together with a means of understanding that achievement in a national and international context. IEA’s assessment strategy provides not only measures of achievement but also information on key strategic, policy-related, background variables that can support educational planning. When combined with local capacity, that strategy can contribute to the development of a self-sustaining process for the development and review of educational policy. This paper discussed the benefits, as well as the costs, of national participation in IEA’s assessments.

190
References
Beaton, A. E., I. V. S. Mullis, M. O. Martin, E. J. Gonzales, D. L. Kelly, and T. A. Smith. 1996. “Mathematics Achievement in the Middle School Years.” TIMSS International Study Center, Boston College, Chestnut Hill, MA.
Foshay, A. W., R. L. Thorndike, F. Hoytat, D. A. Pidgeon, and D. A. Walker. 1962. Educational Achievement of Thirteen-Year-Olds. Hamburg: UNESCO Institute for Education.
IEA (International Association for the Evaluation of Educational Achievement). 2006. PIRLS 2006 International Report. Amsterdam: IEA.
Mullis, I. V. S., Michael O. Martin, Ann M. Kennedy, and Pierre Foy. 2007. “IEA's Progress in International Reading Literacy Study in Primary School in 40 Countries.” TIMSS & PIRLS International Study Center, Boston College, Chestnut Hill, MA.
Mullis, I. V. S., A. M. Kennedy, M. O. Martin, and M. Sainsbury. 2004. PIRLS 2006 Assessment Framework and Specifications. Amsterdam: IEA.
Mullis, I. V. S., M. O. Martin, G. J. Ruddock, C. Y. O’Sullivan, A. Arora, and E. Erberber. 2005. “TIMSS Assessment Frameworks.” TIMSS International Study Center, Boston College, Chestnut Hill, MA.
Osborne, D., and T. Gaebler. 1993. Reinventing Government: How the Entrepreneurial Spirit is Transforming the Public Sector. New York: Plume.
Postlethwaite, T. N. 1974. “Introduction.” Comparative Education Review 18 (2): 157–63.
Tuijnman, A. C., and T. N. Postlethwaite. 1994. Monitoring the Standards of Education. Oxford: Pergamon.
United States National Commission on Excellence in Education. 1983. A Nation at Risk: The Imperative for Educational Reform: A Report to the Nation and the Secretary of Education, United States Department of Education. Washington, DC: United States Department of Education.

191
Chapter 8 Progress in International
Reading Literacy: The Trinidad and Tobago
Experience
Harrilal Seecharan
Harrilal Seecharan is assistant director for testing and assessment in the Division of Educational Research and Evaluation of the Ministry of Education of Trinidad and Tobago. He is responsible for managing and planning all test development and administration conducted by the ministry, as well as for resource allocation and deployment related to examination functions. Mr. Seecharan holds a master’s degree in education measurement and evaluation from the University of the West Indies in St. Augustine.
This paper provides the rationale for the participation of Trinidad and Tobago in the Progress in International Reading Literacy (PIRLS) 2006 study, its input into the development of test instruments, the impact of participation on the local capacity to conduct assessments, the technical support provided, and the present and future uses of the results obtained.
Background
Increasing globalization and interest in global mandates, including Education For All (EFA) (UNESCO 2000), has shifted the emphasis of educational quality assessments from a concern for inputs (such as student participation rates, physical facilities, curriculum materials, and teacher training) to a concern for outcomes (such as the knowledge and skills that students have acquired as a result of their exposure to schooling) (Kellaghan

LITERACY AND NUMERACY IN THE CARIBBEAN
192
and Greaney 2001b). The focus on outcomes of schooling reflects a view that in a globalized world, knowledge is a key strategic resource; thus, the availability of human resources is critical in determining the rate of human development. In this scenario, knowledge and skills are just another commodity, their development another investment, and the purpose of education becomes winning the global competition (Kellaghan and Greaney 2001a).
Evidence based on national tests and assessments in Latin America and the Caribbean (LAC) indicates that many students who leave school without the prerequisite literacy and numeracy skills are not well prepared for the transition from primary to secondary education and might have difficulty finding gainful employment (Murillo 2007; EFA Global Monitoring Report 2006). The introduction of universal secondary education (USE) in many countries has compounded the problem associated with literacy and numeracy in secondary schools, as most of the schools are not well prepared to assist underperforming students. As a result, many secondary school graduates are not well prepared for entry into the workforce or for continuing education.
In order to address the knowledge and skills gap, and ensure increased access and improved learning outcomes in an increasingly globalized environment, measures to acquire, generate, apply, and disseminate knowledge must be put in place. The assessment of knowledge and skills of individuals in relation to global standards through participation in national and international assessments is one such measure.
Why did Trinidad and Tobago participate in PIRLS 2006?
The government of Trinidad and Tobago—cognizant of its commitment to achieving the Millennium Development Goals (MDG), the EFA goals, and its vision 20:20 goal for developed country status by the year 2020—has identified human resource development (HRD) as a priority (The Government of the Republic of Trinidad and Tobago 2002; 2004). Along with this is a national commitment to establishing a high-quality education system in which students seamlessly transition from early childhood care and education (ECCE) through primary and secondary school to the tertiary level (Government of the Republic of Trinidad and Tobago 2004). Concomitant with the government’s focus on educational quality is

LITERACY AND NUMERACY IN THE CARIBBEAN
193
the shift from measuring quality in terms of inputs to that of outcomes, especially in literacy and numeracy and essential life skills.
Results from the national test standard 3 (grade 5) in mathematics and language arts show that many students are not meeting the requirements for literacy and numeracy (table 8.1 and figure 8.1).
Table 8.1 Performance of standard 3 students (grade 5) in national tests of mathematics and language arts, 2005
Percentage of test takers performing at indicated level Level 1
Below basic Level 2 Basic
Level 3 Proficient
Level 4 Advanced
Mathematics 13 31 30 22 Language arts 43.5 25.4 20.6 10.5 Source: Government of the Republic of Trinidad and Tobago 2005. Note: For definitions of the PIRLS levels, see Hans Wagemaker’s contribution to this volume.
The introduction of USE in Trinidad and Tobago in 2000 created an additional challenge to the education system, as teachers were often not well prepared to deal with students who did not have the prerequisite literacy and numeracy skills. Figure 8.1 shows the pass rates (grades 1–3) for mathematics and English A for 2004 (higher rate prior to USE) and 2005 when the first cohort of students entering secondary schools in 2000 under USE wrote their examinations.

LITERACY AND NUMERACY IN THE CARIBBEAN
194
While the extent of the deficits in literacy and numeracy is
clear—in the absence of systematic research—the ability of educational systems to respond to these deficits is limited as the reasons for student underachievement is not well understood.
National assessments versus international assessments
For educational systems to respond effectively to issues of underachievement and quality, answers to questions such as those listed below are needed:
• How well are students learning in the education system (with reference to general expectations, aims of the curriculum, preparation for further learning, or preparation for life)?
• Does evidence indicate particular strengths and weaknesses in the students’ knowledge and skills?
• Do particular subgroups in the population perform poorly? Do disparities exist, for example, between the achievements of boys and girls or different regions of the country?
Figure 8.1 Pass rates for Caribbean Secondary Examination Certificate (CSEC) for English A and mathematics
60.8 57
46.341.2
0
10
20
30
40
50
60
70
2004 2005
Year
Percent Pass
English A Mathematics
Source: Government of the Republic of Trinidad and Tobago 2005.Note: In 2005 all the students entering secondary schools in 2000 did not take the CSEC, as some were given an additional year.

LITERACY AND NUMERACY IN THE CARIBBEAN
195
• What factors are associated with student achievement? To what extent does achievement vary with characteristics of the learning environment (for example, school resources, teacher preparation and competence, and type of school) or with students’ home and community circumstances?
• Are national standards being met in the provision of resources (for example, textbooks, teacher qualifications, and other quality inputs)?
• Do the achievements of students change over time? This question may be of particular interest if the reforms of the education system are being undertaken. Answering the question requires carrying out assessments that yield comparable data at different points in time (Kellaghan and Greaney 2001b; 2004).
In Trinidad and Tobago, while current national tests can provide answers to the first three questions, procedures which allow for the linking of student achievement with factors that may impact on student performance need to be introduced.
Participation in international cooperative studies can fill this gap by providing empirical data about the quality of a nations’ education system as viewed from the perspective of a global community. Comparative analysis can extend the national picture by providing a large context within which to interpret national results. These can help policy makers reassess their programs and revise and examine existing practices in curricular provision, textbooks, teacher preparation, school organization, and instructional practices.
Other issues considered
To fully benefit from participation in international assessments, a number of issues were considered (Kellaghan and Greaney 2008). These include:
• The demands of meeting deadlines. Are communication and administrative systems for meeting deadlines for the different activities in place? The current systems in place were considered to be adequate for conducting the study on a national scale.
• Comparability of population and samples in different countries. The problem is most obvious where the age of

LITERACY AND NUMERACY IN THE CARIBBEAN
196
enrolling in schools, retention, and dropout rates differ from one country to another. Current sampling techniques employed by the International Association for the Evaluation of Educational Achievement (IEA) addresses this issue.
• National and PIRLS literacy framework. Although curricula across the world have common elements—particularly at the primary-school level—considerable differences between countries also exist in what is taught, when it is taught, and what standards of achievement are expected. For results to be meaningful, the elements of the PIRLS framework and the national framework should be examined as these will have an impact on the results obtained.
• Variation in test score performance. This is an important factor if one is to describe adequately the achievements of students in the education system and determine correlates of achievement. Carefully designed tests must ensure a relatively wide distribution of test scores. If the test is too difficult, limited information would be available since the majority of the students will be in the lowest group.
Learning to read and write is critical to a child’s success in school and later in life. One of the best predictors of whether a child will function completely in school and go on to contribute actively to society, is the level at which a child progresses in reading and writing. Although reading and writing abilities continue to develop throughout the life span, the early childhood years from birth through eight years are the most important period for literacy development. The decision to participate in PIRLS therefore provides the opportunity to address literacy development in the primary school system through the provision of high quality data which can inform of current policy, practices, and curricular provisions in the education system. This approach is expected to provide a platform for the importance of other subject areas.
Resource requirements for the study
Participating countries are required to fund and coordinate implementation of the study in their country. These studies have been coordinated by universities, ministries of education (MOEs), or assessment/research units. In Trinidad and Tobago this

LITERACY AND NUMERACY IN THE CARIBBEAN
197
activity was located in the Educational Research and Evaluation Division (DERE) in the MOE. Existing personnel resources and systems within the various divisions in the MOE were utilized in the conduct of the study.
There are a number of tasks associated with the conduct of a field trial and the main survey. These include:
• Contacting schools and sampling classes
• Preparing material
• Administration of tests
• Scoring constructed: response items
• Creation of databases: data entry and verification
• Preparation of national reports
Personnel
In order to complete these tasks and meet the PIRLS standards for the study, adequate staffing for national centers is necessary.
National research coordinator (NRC). The NRCs in each country coordinated the implementation of the study. Two officers from the DERE involved with the development and implementation of the national tests also coordinated the study.
Data manager. An information technology (IT) specialist with experience in coding, data entry, and data management was assigned to this task.
Data entry staff. Data entry for PIRLS was outsourced. A company used by the DERE for data capture for national tests was utilized for data capture. Data capture and cleaning was supervised by the data manager.
Translators/translation reviewers. English versions of all test instruments were used in Trinidad and Tobago. Adaptations to these were carried out by officers from the DERE and the Division of Curriculum Planning and Development.
Office staff. Office staff from the DERE provided support for the study.
School coordinators and test administrators. Principals from selected schools performed the role of school coordinators for

LITERACY AND NUMERACY IN THE CARIBBEAN
198
both the fields—tests and main survey. Classroom teachers conducted the test sessions in schools.
Scorers. Teachers with experience in scoring of national tests were trained and utilized for the scoring of constructed response items.
The use of existing personnel within the MOE in Trinidad and Tobago to carry out PIRLS 2006 required that the activities had to be well coordinated with other assessments carried out by the DERE.
Computers, software, and stationery
The computers and software in the DERE were utilized for this project. Stationery and office supplies were covered under the provision for national examinations.
Other costs
The major costs for PIRLS were the expenses for printing materials, data capture, and the attendance of NRCs at meetings. Approval for funding of these items was approved by the cabinet of Trinidad and Tobago.
Input into tests
Concerns have been expressed by some researchers that the test development process in international studies tends to reflect the power relations between partners; and inevitably some countries dominate while others are constantly outliers (Reddy 2005; Linn 2000). Instrument design in PIRLS, however, has been on the basis of consensus of participating countries. In test development, each participating country, including Trinidad and Tobago, was provided with the opportunity to submit material (passages) to be used in the study, participate in passage selection, item writing, review of materials, and final selection of passages and items for the study. In addition, test materials were adapted to suit the local context.
While more developed countries participated in the study than developing countries, the extent to which this impacted test development and achievement is uncertain.

LITERACY AND NUMERACY IN THE CARIBBEAN
199
Impact on local capacity to assess student learning
NRCs attend meetings organized by the IEA and are involved in the following activities in preparation for the conduct of the study:
• Test design
• Sampling
• Item writing
• Conduct of the survey
• Adaptation/translation and verification
• Scoring
• Quality control
• Data entry and management
• Data analysis
The study provided exposure to persons involved in the conduct of the assessment procedures coordinated by leading experts in the various fields. This provided the impetus for reexamining and validating some of the existing practices and the adoption of new practices. Yearly national tests are written in Trinidad and Tobago in mathematics, language arts, science, and social studies at the primary school level. The MOE has made changes to their test administration manual based on the PIRLS guidelines and has adopted the PIRLS standard for packing of national test scripts (three extra per class).
The current practice in the Caribbean region, including Trinidad and Tobago, is the use of the classical test theory to develop tests. While this approach is still relevant, the use of the item response theory (IRT) provides the opportunity for the equating of test items in addition to improving the local capacity to conduct trend studies. The MOE has scheduled the development of capacity in the IRT methodology with the aim of improving its internal national assessment procedures.
Sample selection
Selection of the sample for PIRLS 2006 provided exposure to the sample design which consisted of a set of specifications for the target and survey populations, sampling frames, survey units,

LITERACY AND NUMERACY IN THE CARIBBEAN
200
sample selection methods, and sample sizes. One option which is currently being considered is the use of a sample rather than a census for the national test.
Technical support for the various activities was readily available and provided throughout the study. Support for selection of the sample for the study was provided by Statistics Canada, test preparation was by Boston College while the data processing center (DPC) in Germany supported the data collection/entry process through training in the software provided by the IEA.
Results from PIRLS 2006
The overall reading literacy achievement average for Trinidad and Tobago was 436 points, significantly below the PIRLS scale average of 500. While the majority of countries had approximately a 250-point difference between the 5th and 95th percentile, the difference in Trinidad and Tobago indicated a much wider spread of the student’s scores (variance) with a 340-point difference between the top group and those at the 5th percentile.
Trinidad and Tobago’s average score for literary purposes was 434 while that for informational purposes was 440. Trinidad and Tobago had a small, but, significantly, higher achievement in reading for informational purposes compared to literary purposes. On two reading achievement scales for the reading processes—the retrieving and straightforward inference scale (438); and the interpreting, integrating, and evaluating scale (437)—there was no significant difference.
In addition, the study found the difference in average reading achievement for both girls (451) and boys (420) in Trinidad and Tobago was higher than the international average difference of 17 points. Only three countries had larger gender differences.
The problem of reading literacy in the education system in Trinidad and Tobago was highlighted from the results of national tests and some measures aimed at addressing this issue were implemented; for example, the developments of a national reading policy and the expansion of the Centre of Excellence for Teacher Training (CETT) program to the primary level are two such measures. The move to universal ECCE is another such measure which is expected to contribute to the improvement of reading literacy. The PIRLS 2006 results, however, provide the MOE with

LITERACY AND NUMERACY IN THE CARIBBEAN
201
data that can facilitate the reexamination of current policies, programs, and practices within an international context and also provide a basis for the introduction of new policies.
Review of the curriculum framework for reading
The results also indicate that a significant number of students in Trinidad and Tobago are not meeting international standards for reading literacy. In Trinidad and Tobago, the MOE develops curriculum guides, recommends textbooks, and has jurisdiction over all government and government-assisted schools. In addition, comparison of the framework for reading literacy in Trinidad and Tobago is broader than that within the PIRLS framework. This suggests that there is a lack of alignment between the intended curriculum and the “attained curriculum” or what students learn. This can also result from the system and teacher expectations being below the international standards. The review of the framework for literacy in the primary school curriculum and its organization for the teaching of reading is therefore necessary. The review should also include the following:
• Instructional time for reading
• Emphasis on reading
• Organization of classes for reading
• Gender differential in reading literacy
• Strategies for teaching of reading and assisting students with difficulties
• Range of materials to be used in the teaching of reading
• Literacy standards for each level in the primary school
These should be reviewed in the context of the best practices in top-achieving countries in PIRLS such as the Hong Kong SAR, Singapore, and Canada.
This is one of the consultancies scheduled under the review of the primary school curriculum as part of the seamless education project. While the review of PIRLS data is currently ongoing, the following are some of the areas under consideration:

LITERACY AND NUMERACY IN THE CARIBBEAN
202
Baseline for reading at a key developmental stage
The results from PIRLS therefore provide a baseline for reading literacy at standard 3 from which future improvements can be measured since PIRLS allows for the monitoring of trends.
International benchmarking
PIRLS measures achievement at a point where, typically, children are moving from learning to read to reading to learn. This is an important benchmarking point for reading literacy. Figure 8.2 shows the percentage of students in Trinidad and Tobago reaching the PIRLS 2006 international benchmarks compared to the international median. The PIRLS benchmarks provide an indication of what students at a particular benchmark can do, for example, at the low international benchmark they could display basic reading skills. They were able to recognize, locate, and reproduce explicitly stated details from informational texts, particularly if the details were at the beginning of the text. They were also able to answer some items requiring straightforward inferences.
Figure 8.2 Percentage of students reaching the PIRLS 2006 international benchmarks for reading achievement
64
38
132
94
76
41
70
102030405060708090
100
Low (400)
Intermediate(475)High(550)
Advanced(625)
International Benchmarks
Perc
ent o
f Stu
dent
s
Trinidad and Tobago International Median
Source: IEA 2006.

LITERACY AND NUMERACY IN THE CARIBBEAN
203
Validation of the national policy on ECCE
The results of PIRLS 2006 found a positive relationship between the students’ reading achievement and the amount of time children participated in ECCE. In Trinidad and Tobago, children who did not attend preprimary education registered an average achievement of 375, compared with an average achievement of around 450 for children who attended between 1 and 3 years—a difference of 75 points. (Internationally, the average difference is 50 points, according to Mullis, Martin, Kennedy, and Foy 2006).
The government of Trinidad and Tobago, in order to facilitate a seamless education system, has embarked on a program for universal ECCE by 2010 through the construction of new centers to reflect the highest quality design and outfitted in keeping with the teaching, learning, and development requirements for cognitive and social development of preschoolers and supported by appropriate curricula and teacher training. This is consistent with the move to increase both access and quality of ECCE in Trinidad and Tobago.
Validation of the national policy on the provision of textbooks/educational resources
The PIRLS results showed significant difference between the performance of students’ where there was a high index of home educational resources (more than 100 books, more than 25 children’s books, at least 3–4 educational aids, and where at least 1 parent has completed university education) and those students who came from homes with a low index (less than 25 books, less than 25 children’s books, no more than two educational aids, and where parents had not completed secondary education). The difference in performance in Trinidad and Tobago between these two groups was 135 points.
References
Government of the Republic of Trinidad and Tobago. 2002. Strategic Plan 2002–2006. Ministry of Education.
———. 2004. National Report on the Development of Education in Trinidad and Tobago. Ministry of Education.

LITERACY AND NUMERACY IN THE CARIBBEAN
204
———. 2005. Report on National Tests in Mathematics and Language Arts. Ministry of Education.
IEA (International Association for the Evaluation of Educational Achievement). 2006. Progress in Reading Literacy Study (PIRLS). Amsterdam.
Kellaghan, T., and V. Greaney. 2001a. “The Globalization of Assessment in the 20th Century.” Assessment in Education 8 (1): 87–102.
———. 2001b. Using Assessments to Improve the Quality of Education. Paris: International Institute of Educational Planning.
———. 2004. Assessing Student Learning in Africa. Washington, DC: World Bank.
———. 2008. Assessing Achievement Levels in Education. World Bank: Washington, DC.
Linn, R. L. 2000. “The Measurement of Student Achievement in International Studies.” In A. C. Porter and A. Gamoran, ed., Methodological Advances in Cross-National Surveys of Educational Achievement. National Research Council, Board of International Comparative Studies in Education. Washington, DC: National Academy Press.
Murillo, F. J. 2007. “Analysis of Achievement Results in Latin America from National Assessments.” Background paper prepared for the Education for All Global Monitoring Report 2008, Education for All by 2015: Will We Make It? Paris: UNESCO.
Mullis, I. V. S., M. O. Martin, A. M Kennedy, and P. Foy. 2006. PIRLS 2006 International Report. TIMSS & PIRLS International Study Centre, Boston College.
Reddy, V. 2005. “Cross-National Achievement Studies: Learning from South Africa’s Participation in Trends in Mathematics and Science Study (TIMSS).” Compare 35 (1): 63–67.
UNESCO (United Nations Educational, Scientific and Cultural Organization). 2000. The Dakar Framework for Action – Education for All: Meeting Basic Learning Needs. Paris: UNESCO.
———. 2006. EFA Global Monitoring Report 2006. Paris: UNESCO.

205
Chapter 9 Implications, Conclusions,
and the Way Forward
The two-day dialogue on literacy and numeracy in the Caribbean was organized by the Inter-American Development Bank (IDB) and the Caribbean Development Bank (CDB) to provide an opportunity for representatives of ministries of education in the Caribbean to discuss the performance—or underperformance—of students in two areas considered to be the foundations of learning and of subsequent success in the workplace and in society.
Literacy and numeracy are the keys to acquiring other skills essential in today’s economy—among them critical thinking and problem solving, collaboration and team work, agility and adaptability, initiative and entrepreneurialism, curiosity and imagination, good oral and written communication, and the ability to access and analyze information. But as was highlighted throughout the two-day discussions, too many students in the region pass through the primary education system without acquiring the skills they need to perform well in secondary school, let alone do well at a good job or prepare for higher education. Many of these same students leave secondary school unable to read and calculate at the expected levels.
Working in small groups, the participants in the meeting concluded that the main challenges to better student performance can be grouped into three areas:
• Capacity building within ministries of education and other agencies to enhance institutional capacity to collect and analyze reliable, timely, and comparable data
• Better teacher training programs
• More and better teaching and learning resources in schools.
Each of these areas is discussed in more detail below.
Capacity building and data constraints
The paucity of reliable, comparable data was flagged by all participants, who agreed that more and better systems of data

LITERACY AND NUMERACY IN THE CARIBBEAN
206
collection, management, and subsequent data analysis are needed to inform practice within individual schools as well as system-wide programs and policies. Lessons should be distilled from research and experience to improve both teaching and the training of teachers. In addition, protocols and procedures for capturing, recording, and analyzing data need to be made more consistent in form and execution so that meaningful comparisons can be made across nations and regions.
As Barbara Bailey noted in her presentation, the socioeconomic context within which schooling takes place—notably the pressures that lead boys, in particular, to drop out, take jobs (or turn to crime), and start families—has to be understood and taken into account in planning measures to improve performance. Most school systems, however, have little information about their students’ backgrounds. Cristina Accioly de Amorim, in her paper, underscored the difficulties of accessing and obtaining data about student performance. Harrilal Seecharan’s presentation about the data acquired through his country’s participation in PIRLS, an international assessment of reading literacy in primary schools in 40 countries, demonstrated how the Ministry of Education in Trinidad and Tobago was able to identify additional factors that might help to explain student performance, thereby enhancing the ministry’s ability to analyze and use the data for future policies and programs. While it would be helpful for the entire region to participate in such international assessments, the expense of participation might preclude most territories from participating without external financial assistance. The value of gathering and using data over a long period of time (in longitudinal studies) was well demonstrated by John Ainley’s presentation on Australia’s approach to literacy and numeracy. Dr. Ainley also underscored the impact of the early acquisition of skills on future labor market participation.
To address the data constraints, the participants in the closing session made the following recommendations:
• Consider establishing a regional student assessment system.
• Collect student data from various sources and integrate that data.
• Develop separate tests for language competency and literacy.
• Train teachers to interpret and use data.

LITERACY AND NUMERACY IN THE CARIBBEAN
207
• Track teachers and resources.
• Track students from grade to grade.
• Adopt educational management information systems and appropriate feedback mechanisms.
A decision to undertake these activities would likely expose several constraints, not least of which is the regional shortage of technical capacity. Some ministries and schools do not have enough trained people available to undertake these responsibilities on a consistent basis. In addition, evidence-based decision making is lacking at both the micro and macro levels. If countries are to benefit from gathering the suggested data, and if they are to develop and pursue educational plans that exploit those data, then they must have access to personnel who possess a combination of competencies: namely, those required to collect and analyze data, to develop and implement plans in the areas of literacy and numeracy, and to train others, thereby increasing the number of people who can contribute to solving the problem. This is an area in which the region will need significant technical support to develop a level of expertise sufficient to ensure the effectiveness and sustainability of programs designed to improve literacy and numeracy.
Teacher training
Teacher training emerged as another pressing issue, one that appears to offer great potential for further regional collaboration (building on the teacher training program of the Organization of American States and the professional mobility program of the CARICOM Single Market and Economy). Teacher training, as understood by the participants, encompasses pre- and in-service training in teacher training colleges and universities, or through other means. Many participants were vocal in their criticism of current training practices in the region, deeming them insufficient, inadequate, outdated, and irrelevant. Several alleged that current practices failed to prepare teachers to use technology to facilitate student learning.
The call for “passionate teachers” was heard throughout the two days of the conference, often in connection with the need for more and better pre- and in-service training. The logic was that good skills make for confident teachers. Confident teachers tend

LITERACY AND NUMERACY IN THE CARIBBEAN
208
to be the most passionate. And the most passionate teachers tend to elicit the best performance from their students.
Teaching teachers to address deficiencies in literacy and numeracy. As presently configured, teacher training programs do not appear to provide teachers with the skills to address deficiencies in literacy and numeracy. For example, teachers are generally unable to pinpoint literacy and numeracy deficiencies in their students because they lack the competence to diagnose those deficiencies. Further, many are often reactive, focusing on problems only after they have emerged, rather than engaging in developmental measures to prevent them in the first place. These issues relate to the delivery of instruction and have their genesis in weak training programs. For that reason, initial teacher training and subsequent professional development opportunities should focus on teaching appropriate methodologies to teach literacy and numeracy to all students. They should also provide support and individualized feedback to teachers about methods and applications, as demonstrated by Stafford Griffith’s paper on the CETT experience. Countries must concentrate on strengthening their teacher training programs as a matter of urgency. The provision of the training in conjunction with on-site support—as exemplified by the CETT initiative—seems promising.
The question of language. Training programs should also pay more attention to the issue of language. How best to address the varied language backgrounds of students in the region—especially Creole speakers and the children of immigrants—was a contentious issue in the dialogue, with some participants believing that efforts to accommodate the vernacular are a costly distraction from the essentials of learning. The majority view, however, was that judicious use of the vernacular can accelerate the achievement of literacy in both the vernacular and the principal language of instruction, while engaging students more effectively in the learning process. Teacher training programs should sensitize teachers to language issues, and a clear policy is required.
Another facet of the language question is the competence of teachers in Standard English (or other official languages of instruction). Teachers whose Standard English is faulty will encounter difficulties when trying to deal with dialects and will not present the best models for students grappling to develop literacy in a language different from their first language.

LITERACY AND NUMERACY IN THE CARIBBEAN
209
Particularly salient in this regard is the question of training to teach effectively in both the official language of instruction and in the students’ vernacular, as explored in Hazel Simmons McDonald’s presentation. (Such training should not be limited to teachers but should be extended to school administrators to ensure that all members share the same vision and practice a consistent methodology and approach.) Specific consideration should be given to strengthening the link between oral language development and strong literacy competence, especially since current programs of instruction very rarely give consideration to “interference” from the student’s mother tongue. This is a real problem in the Caribbean, where the language of instruction is very often different—sometimes radically so—from the mother tongue. Language acquisition principles in the Caribbean context must therefore be accorded due consideration.
Specific recommendations to improve training and professional development. The participants’ recommendations to improve teacher training included the following:
• Adopt a regional approach to the registration, certification, and licensing of teachers, and articulate that approach with international norms through greater cooperation with international agencies.
• Identify and adopt innovative modes of training through needs assessment and rigorous measurement of the impact of programming.
• Establish a Caribbean Journal of Teaching and Learning.
• Conduct more frequent and more thorough evaluations of programs at teacher training institutions.
Regarding language:
• Develop language-awareness programs for teachers and administrators in pre-service and on-site situations, including sustained monitoring and support.
• Support research and share findings from research to inform policy on instructing children of varied language backgrounds.
• Provide resources for teaching immigrant children who speak a foreign language or a mother tongue that is likely to interfere with language development in the language of instruction.

LITERACY AND NUMERACY IN THE CARIBBEAN
210
Resources for teaching and learning
The paucity of resources available for teaching and learning received a great deal of attention from participants and was identified for future intervention. During the past few years—and particularly since the advent of the international financial crisis—many school systems have seen their budgets reduced. The participants recognized that all of the topics they discussed will require additional funding but noted ruefully that the “fiscal space” required to provide more resources for schools and students was narrow indeed. On the other hand, the implications of not providing the requisite resources should be equally clear—we are already seeing the effects of poor student performance.
Even under the current difficult circumstances, most schools have access to basal readers, a useful resource in the teaching of reading. However, when a student moves to apply newly gained reading skills to the actual act of reading, a basal reader is not enough: it does not help to bring skills together in an authentic reading situation. Recreational reading materials, in the form of trade books or supplementary readers, meet that need. However, such materials are often totally absent from the classroom or are available only in limited quantities. In addressing literacy deficiencies, therefore, consideration must be given to the provision of materials that allow for the application of reading skills in authentic reading situations. For that reason, the group made the following recommendation:
• Provide a minimum number of trade books in all classrooms. Consider gender when making selections so that the interests of boys are adequately represented.
Other topics
Political will
More than a few participants indicated that political inertia can make it difficult to implement and pursue promising policies. Participants pointed to the failure of political leaders to sustain a commitment to educational reform in the long term in favor of short-term goals. To focus the attention of politicians and policy makers on long-term solutions, the participants recommended that a regional protocol define minimum standards and required resource allocations to meet those standards.

LITERACY AND NUMERACY IN THE CARIBBEAN
211
Parity for numeracy
By the end of the conference it became clear that most of the presentations focused more on literacy than on numeracy (or, more broadly, on instruction in math and science), where the current situation is even worse. It was also clear that many more interventions and programs were in place to address literacy than numeracy. Indeed, numeracy is seldom addressed in its own right; rather, it is usually subsumed under the rubric of literacy, with the general perception being that students’ numerical skills will improve alongside their reading comprehension. While this may be partially correct, comprehension is not the only factor underlying low numeracy levels. Participants agreed that little is known in the region about the latest research on improving the teaching of numeracy. To reinforce the call for more data, teacher training, and resources for teaching (math!), it was agreed that a separate event focusing exclusively on numeracy and math skills would be merited, as many teachers appear to fear teaching the subject or attempt to teach it without being properly prepared to do so.
Regionalism, not fragmentation
Throughout the Caribbean, one finds many different systems of educational administration, curriculum development, teacher training, and, yes, teaching. Teachers and educators encounter myriad ways of addressing the same issue as they move from school to school and from territory to territory. Standardization of structures and procedures is far from universal, even within individual countries. It is important, therefore, that a regional response to the issues affecting the development of literacy and numeracy must be preceded or at least accompanied by the development of common policies and guidelines that spell out what is to be done, when, and how. We should start with standardized definitions of literacy and numeracy, as well as regional benchmarks and assessment structures for judging the attainment of standards.
Consideration should be given to the following recommendations:
• Development and implementation of national literacy and numeracy plans in each territory
• Capacity building program for officers who facilitate and monitor literacy and numeracy programs in schools

LITERACY AND NUMERACY IN THE CARIBBEAN
212
• Collaboration with the University of the West Indies and other universities in which teachers undergo internships designed to help them develop competence in analyzing and interpreting data
• Piloting of remediation programs in specific territories, with dissemination of lessons learned to all countries of the region
• Development of formal orientation program on monitoring and evaluating literacy and numeracy initiatives for principals and other school leaders.

213
Appendixes
Organizers, presenters, and participants: Caribbean Subregional Meeting, Regional Policy Dialogue, Barbados Hilton, December 2–3, 2008.

214
Appendix 1 Agenda
Tuesday, December 2
8:30 am Registration
9:00 am Welcoming Remarks by IDB and CDB
Mr. Carlson Gough, Director, Projects Department, CDB
Mr. Marcelo Cabrol, Chief, Education Division, IDB
The Honorable Minister Ronald Jones, Ministry of Education and Human Resource Development, Barbados
Chair: Ms. Deidre Clarendon, Portfolio Manager, Social Sector Division, CDB
Session 1: Importance of basic skills in literacy and numeracy
9:30 am General overview of literacy and numeracy concepts, newest research, evidence and latest debates.
Presenter: Ms. Enid Martinez, Teachers College, Columbia University
Moderator: Dr. Idamay Denny, Ministry of Education and Human Resource Development, Barbados
10:00 am Open discussion among participants
10:30 am Coffee Break
10:45 am Long-term impacts of literacy and numeracy—the Australian experience. General overview of advantages of improving literacy and numeracy
Presenter: Dr. John Ainley, Deputy Chief Executive Officer of Research, Australian Council for Education Research
Moderator: Mr. Glenroy Cumberbatch, Caribbean Examinations Council
11:15 am Open discussion among participants
12:00 pm Lunch hosted by IDB and CDB
Session 2: Literacy and numeracy in the Caribbean
1:30 pm Regional study on literacy and numeracy in the Caribbean commissioned by CDB/IDB—status of literacy and numeracy in the Caribbean and existing interventions targeting literacy and numeracy in the region.

215
Presenter: Ms. Cristina Accioly de Amorim, Consultant IDB/CDB
Moderator: Ms. Jacintha Pringle, Ministry of Education, Antigua and Barbuda
2:00 pm Open discussion among participants
2:30 pm Explaining gender differences in school performance throughout the Caribbean
Presenter: Prof. Barbara Bailey, University of the West Indies
Moderator: Ms. Joan Cuffie, Head, Centre for Gender Development Studies, Nita Barrow Unit, UWI, Barbados
3:00 pm Open discussion among participants
3:30 am Coffee Break
4:00 pm Role of language and dialect in the development of literacy and basic skills
Presenter: Prof. Hazel Simmons McDonald, University of the West Indies
Moderator: Mr. Jasper Lawrence, Ministry of Education and Culture, Jamaica
4:30 pm Open discussion among participants
Wednesday, December 3
8:30 am Meeting Registration
9:00 am The accomplishments of the Caribbean Centre of Excellence for Teacher Training (CETT) project
Presenter: Prof. Stafford Griffith, University of the West Indies
Moderator: Dr. Martin Baptiste, Education Specialist, CDB
9:30 am Open discussion among participants
10:00 am Coffee Break
Session 3: International assessment for literacy and numeracy
10:30 am What the region would gain from participating in an international assessment
Presenter: Dr. Hans Wagemaker, Executive Director of the International Association for the Evaluation of Educational Achievement (IEA)
Moderator: Dr. Didacus Jules, Registrar, Caribbean Examinations Council
10:50 am Open discussion among participants
11.15 am Case Study: Trinidad and Tobago’s experience in participating in international assessment initiatives

216
Presenter: Mr. Harrilal Seecharan, Assistant Director, Testing and Assessment, Division of Educational Research and Evaluation, Ministry of Education, Testing and Assessment Subcomponent Moderator: Dr. Didacus Jules, Registrar, Caribbean Examinations Council
11:40 am Open discussion among participants
12:00 pm Working lunch hosted by IDB and CDB
Integrating technology in the curriculum for primary education to address literacy and numeracy
Presenter: Messrs. Michael Walker and Martin Walker, Emtooco Inc.
Moderator: Mr. Marcellus Albertin, Operations Officer, CDB
Closing Session: Steps forward (for officials of ministries of education only)
1:30 pm From knowledge to practice: Discussion among CDB and IDB government officials about next steps
Facilitator: Dr. Jennifer Obidah, Education Evaluation Centre, UWI Barbados
• Recommendations on a set of national policies, strategies, and programs for improving literacy and numeracy
• Identification of key underlying issues for underperformance and subsequent identification of an action plan/measures to improve them
• Identification of areas for closer regional collaboration in literacy and numeracy, such as teaching materials, teacher training, production of materials, technology, and curriculum.
• Devise an approach for securing the future participation of the Region in international assessments, such as PIRLS.
3:30 pm Closing remarks
Ms. Leyda Fajardo, Coordinator of the Regional Policy Dialogue, IDB
Mr. Marcelo Cabrol, Chief, Education Division, IDB
Ms. Yvonne Moses Grant, Division Chief, CDB

217
Appendix 2 Participants
Ministry representatives, by country
Anguilla
Mrs. Chanelle Petty Barret
Permanent Secretary, Ministry of Education
264 497 3930, 264 497 3042
264 497 5695, 265 497 2980 [email protected]
Ms. Rhonda Connor Chief Education Officer, Ministry of Education 264 497 2874 264 497 2980 [email protected]
Antigua and Barbuda
Ms. Jacintha Pringle Chief Education Officer, Ministry of Education 268 462 4959 268 462 4970 [email protected]
Barbados
Ms. Vaneisha Cadogan
Senior Education Officer (Curriculum and Assessment), Ministry of Education and Human Resource Development
246 430 2709 246 436 2411 [email protected]
Mrs. Pauline Miller Education Officer, Language Arts, Ministry of Education and Human Resource Development
246 430 2709 246 436 2411 [email protected]
Mrs. Wendy Griffith Education Officer, Mathematics, Ministry of Education and Human Resource Development
246 430 2709 246 436 2411 [email protected]
Mrs. Cristina Morris Education Officer, Reading, Ministry of Education and Human Resource Development
246 430 2709 246 436 2411 [email protected]
Belize
Mr. Christopher Aird Chief Education Officer, Ministry of Education, Youth and Sports
501 822 2329, 501 822 3353, 501 822 2380, 501 822 2698
501 822 3389 [email protected], [email protected], [email protected]
Mr. David Leacock Chief Executive Officer (PS), Ministry of Education, Youth and Sports
501 822 2329, 501 822 3353, 501 822 2380, 501 822 2698
501 822 3389 [email protected], [email protected], [email protected]
British Virgin Islands
Dr. Marcia Potter Chief Education Officer, Ministry of Education and Culture 284 494 3701 284 468 0021,
284 494 5421 [email protected]
Cayman Islands
Ms. Tanya Dwight Head Professional Development, Ministry of Education, Training, Employment, Sports and Culture
345 244 2417 345 949 9343 [email protected]
Dominica
Dr Jeffrey Blaize Chief Education Officer (Ag), Ministry of Education 767 448 2401 767 448 0644 [email protected],

LITERACY AND NUMERACY IN THE CARIBBEAN
218
Mr. Nicholas Goldberg
Senior Education Officer, Curriculum, Measurement and Evaluation Unit, Ministry of Education
767 448 2401 767 448 0644 [email protected]
Grenada
Mr. Byron St. Clair Chief Education Officer (Ag), Ministry of Education 473 440 2737 473 440 7701 [email protected]
Mrs. Denyse Brathwaite Ministry of Education 473 440 2737 473 440 7701 [email protected]
Guyana
Ms. Bibi Ali Education Officer (Curriculum), Ministry of Education 592 226 0364 592 225 8511 [email protected]
Ms. Claudette Phoenix
Education Officer (Measurement and Evaluation), Ministry of Education 592 226 0364 592 225 8511 [email protected],
Jamaica
Ms. Barbara Allen Senior Director (Planning and Development Division), Ministry of Education and Culture
876 922 5775, 876 502 5810 876 948 7755 [email protected]
Montserrat
Ms. Kathleen Greenaway
Chief Education Officer, Ministry of Education 664 494 2541 664 491 6941 [email protected]
Miss Yasmine White Education Officer, Ministry of Education 664 494 2541 664 491 6941 [email protected]
St. Kitts and Nevis
Mr. Patrick Welcome Chief Education Officer, Ministry of Education 869 495 2521 869 466 9874,
869 466 3351 [email protected], [email protected]
Mrs. Jennifer Hodge Principal Education Officer, Ministry of Education 869 495 2521 869 466 9874,
869 466 3351 [email protected], [email protected]
St. Lucia
Dr. Rufina Frederick Permanent Secretary, Ministry of Education
758 468 5207, 759 468 5202
758 452 1747, 758 452 2476 [email protected]
Mrs. Augusta Ifill Chief Education Officer, Ministry of Education
758 468 5288, 758 468 5206
758 452 1747, 758 452 2476
[email protected], [email protected]
St. Vincent and the Grenadines
Mrs. Susan Dougan Chief Education Officer, Ministry of Education 784 457 1104 784 457 1114 [email protected],
Suriname
Mr. Soenderpersad Hanoeman
Head, Curriculum Development, Ministry of Education and Community Development
597 49 8129, 598 46 2473, 599 49 8850
597 49 2473, 598 49 0289
[email protected], [email protected], [email protected]
Mrs. Margo Illes Consultant, Basic Education Improvement Project, Ministry of Education and Community Development
597 49 8129, 598 46 2473, 599 49 8850
597 49 2473, 598 49 0289
[email protected], [email protected], [email protected]
Trinidad and Tobago
Ms. Yvonne Lewis Chief Education Officer, Ministry of Education 868 622 5812 868 628 0145,
868 622 3775 [email protected]

LITERACY AND NUMERACY IN THE CARIBBEAN
219
Turks and Caicos Islands
Ms. Clara L. Gardiner Permanent Secretary, Ministry of Education, Youth, Sports and Culture
649 946 2801 ext 40618, 649 946 2808
649 946 1006, 649 946 2722 [email protected]
Dr. Beatrice Fulford Chief Education Officer, Ministry of Education, Youth, Sports and Culture
649 946 2801, 649 946 2808, 649 232 0972 (cell)
649 946 1000, 649 946 2722 [email protected]
Ms. Kaydeen Miles Education Officer, Literacy, Ministry of Education
649 946 4830, 649 244 9200 (cell)
649 941 5228 [email protected]
Session presenters and moderators
Prof. Hazel Simmons McDonald
Pro Vice-Chancellor and Principal, University of the West Indies, Open Campus
246 417 3800 246 417 4021 [email protected]
Dr. Jennifer Obidah Director, Education Evaluation Centre, School of Education, University of the West Indies
246 417 4705 246 417 0288 [email protected]
Mr. Harrilal Seecharan
Assistant Director (Research and Evaluation), Ministry of Education, Trinidad and Tobago
868 622 5812 868 628 0145, 868 622 3775 [email protected]
Dr. June George School of Education, University of the West Indies, St. Augustine Campus
868 662 2002 ext 2118 / 9868, 776 2411 (cell)
868 662 6615 [email protected], [email protected]
Prof. Barbara Bailey, PhD
Professor, Gender and Education and University Director, Center for Gender & Development Studies, University of the West Indies, Mona Campus
876-927-1913 876 927 1064 [email protected]
Prof. Stafford Griffith Professor of Research, Measurement and Evaluation, Institute of Education, University of the West Indies, Mona Campus
Ms. Enid Martinez Teachers College, Columbia University [email protected]
Ms. Cristina Accioly de Amorim
Consultant, Inter-American Development Bank 301 530 9295 [email protected]
Dr. John Ainley
Deputy CEO for Research, Australian Council for Education Research, and Research Director, National and International Surveys and Programmes, Australian Council for Educational Research (ACER)
Dr. Hans Wagemaker International Association for the Evaluation of Educational Achievement (IEA) [email protected]
Mr. Michael Walker Emtooco Inc, St. Lucia
Mr. Martin Walker Emtooco Inc, St. Lucia
Dr. Idamay Denny Deputy Chief Education Officer (Planning, Research and Development), Ministry of Education and Human Resource Development, Barbados
246 430 2709 246 436 2411 [email protected], [email protected]
Dr. Didacus Jules Registrar, Caribbean Examinations Council 246 436 6261 246 429 5421 [email protected]
Ms. Joan Cuffie Head, Centre for Gender Development Studies, University of the West Indies, Cave Hill Campus
246 417 4490 246 425 1327 [email protected]
Mr. Marcellus Albertin Operations Officer (Education), Caribbean Development Bank 246 431-1690 246 426 7269 [email protected]
Dr. Martin Baptiste Operations Officer (Education), Caribbean Development Bank 246 431 1602 246 426 7269 [email protected]

LITERACY AND NUMERACY IN THE CARIBBEAN
220
Mr. Jasper Lawrence Deputy Chief Education Officer, Ministry of Education and Culture
876 922 5775, 876 502 5810 876 948 7755 [email protected]
Mr. Glenroy Cumberbatch Caribbean Examinations Council
876 948 0413, 876 832 5159 (cell)
The Hon. Ronald Jones
Minister of Education and Human Resource Development, Barbados 246 430 2709 246 436 2411 [email protected]
Mr. Carlson Gough Director, Projects Department, Caribbean Development Bank
Institutional representatives and IDB and CDB staff
Mr. Ryan Burgess Inter-American Development Bank [email protected]
Ms. Tania Vera Inter-American Development Bank 202 623 3976 [email protected]
Mrs. Leyda Fajardo Inter-American Development Bank [email protected]
Mrs. Sabine Aubourg Inter-American Development Bank 202 623 1757 [email protected]
Mr. Marcelo Cabrol Inter-American Development Bank [email protected] ([email protected])
Mr. Steven Kennedy Consultant, Inter-American Development Bank 301 257 2566 [email protected]
Ms. Anneke Jessen Inter-American Development Bank [email protected]
Dr. Yolande Wright Caribbean Examinations Council 246 436 6261 246 429 5421 [email protected]
Mrs. Phyllis Roett Senior Development Officer, CIDA 246 429 3550 246 429 3780 [email protected]
Mr. Stephen Boyce Project Officer, Education, European Union 246 434 8501 246 427 8687 [email protected]
Ms. Myrna Bernard Director, Human Development, Caribbean Community Secretariat 592 222 0124 592 222 0171 [email protected]
Ms. Yvonne Moses Grant
Division Chief, Social Sector Division, Caribbean Development Bank
246 431 1720/21 [email protected]
Mr. Clairvair Squires Portfolio Manager, Social Sector Division, Caribbean Development Bank 246 431 1653 [email protected]
Mr. Elbert Ellis Operations Officer (Social Analyst), Project Services Division, Caribbean Development Bank
246 431 1688 [email protected]