listening to music with headphones: an assessment of...
TRANSCRIPT

Listening to Music with Headphones:An Assessment of Noise Exposureand Hearing Damage
Department of AcousticsAalborg University
Beatriz Gutiérrez CamareroIrene Moledero Domínguez


Institute of Electronic SystemsDepartment of AcousticsAalborg University
Title:
Headphone Sound Exposure and Hearing
Project period:ACO-85. Febrary - 7. June 2007
Projectgroup:1066
Group members:Beatriz GutiérrezIrene Moledero
Supervisor:Rodrigo Ordoñez
Number of copies: 4
Report – number of pages: 59
Appendix – number of pages: 87
Total number of pages: 146
Abstract:
Many studies suggest that music players used withheadphones can emitt sound pressure levels as highas the noises emitted in some industries and workingplaces. Both exposures might be harmful to hearingin prolongate use. Moreover the degree of damageproduced by listening to music with headphones isnot clearly defined. This has been the motivationfor this project which is to investigate the posiblepresence of a permanent hearing damage due toheadphone sound exposure.
In order to fullfil this aim, two populations (controland target) which differ significantly in their habitswhen listening to music from headphones are com-pared using a headphone sound exposure evaluationan a hearing assessment. This is carried out by testing20 selected subjects in a listening test.
This test consists of a pure tone audiometry, aDPOAE measurement and an analisis of the exposurelevel of the subjects in different environments.
It is concluded that the results obtained could not de-scribe a potential damage by listening to music froma MP with headphones. Moreover, the environmentaround a person affects the preferred volume settingthat this person select in his MP specially when theenvironment becomes noisy. However, users of MPswith headphones tent to listen to music at higher vol-ume settings than the non users.
3


PREFACE
This report was written by group 1066 of the 10th semester as the documentation of the The-sis of the international Master of Science programme in Acoustics at the Institute of ElectronicSystems at Aalborg University.
The report is primarily addressed to students and staff of the Department of Acoustics at Aal-borg University, and anyone interested in the possible noise inductive hearing loss due to theexposure to music from music players with headphones.
The report is divided in two parts; main report and appendix.The main report is divided intothe next several chapters:
• Chapter 1 gives an introduction to the reader and sets the framework for project focus.
• Chapter 2 presents an overview of the background theory related to thetopic of theproject.
• Chapter 3 introduces an analysis describing the most important considerations of theproject.
• Chapter 4 exposes a pilot test carried out to define some parameters used for a listeningtest.
• Chapter 5 exposes the listening test carried out to investigate the topic of the project.
• Chapter 6 presents the results obtained from the listening test and their analysis.
• Chapter 7 summaries the work done in the project and the results obtained.
The appendix part includes descriptions of measurements, supplementary documentation andimportant issues regarding the project.
A CD-ROM is enclosed. It contains the report in PDF-file format, the data obtained during theexperiment, the Matlab code, the sample files, articles and data sheets.
We would like to thank Miguel Angel Aranda de Toro and Juan Luis Mateo, for all the helpgiven to us during the project; Claus Vestergaard Skipper for their technical assistance and allthe subjects that participated in the experiment for their patience and good will.
5

Aalborg University, June 7, 2007
Irene Moledero Beatriz Guiterrez
6

CONTENTS
I Report 1
1 Introduction 3
1.1 The Aim of the Project . . . . . . . . . . . . . . . . . . . . . . . . . . . . . . 4
1.2 Scope of the Project . . . . . . . . . . . . . . . . . . . . . . . . . . . . . . .. 4
2 Hearing and Sound Exposure 5
2.1 Hearing and Sound . . . . . . . . . . . . . . . . . . . . . . . . . . . . . . . . 5
2.2 Hearing System anatomy . . . . . . . . . . . . . . . . . . . . . . . . . . . .. 6
2.3 Noise Inductive Hearing Loss (NIHL) . . . . . . . . . . . . . . . . .. . . . . 9
2.4 Hearing Assessment . . . . . . . . . . . . . . . . . . . . . . . . . . . . . . .. 11
2.5 Audiometry . . . . . . . . . . . . . . . . . . . . . . . . . . . . . . . . . . . . 11
2.6 OtoAcustic Emissions (OAE) . . . . . . . . . . . . . . . . . . . . . . . .. . . 13
2.7 Selection of the Assessment Techniques for NIHL . . . . . . .. . . . . . . . . 16
2.8 Chapter Conclusions . . . . . . . . . . . . . . . . . . . . . . . . . . . . . .. 19
3 Headphone Sound Exposure 21
3.1 Listening Devices: Music Players and Headphones . . . . . .. . . . . . . . . 21
3.2 Listening Source: Music . . . . . . . . . . . . . . . . . . . . . . . . . . .. . 22
3.3 Headphone Sound Exposure Evaluation . . . . . . . . . . . . . . . .. . . . . 22
3.4 Headphone Sound Exposure Parameters . . . . . . . . . . . . . . . .. . . . . 24
3.5 Chapter Conclusions . . . . . . . . . . . . . . . . . . . . . . . . . . . . . .. 25
4 Pilot Test 27
4.1 Preliminary Survey . . . . . . . . . . . . . . . . . . . . . . . . . . . . . . .. 27
4.2 Pilot Test Design . . . . . . . . . . . . . . . . . . . . . . . . . . . . . . . . .27
4.3 Chapter Conclusions . . . . . . . . . . . . . . . . . . . . . . . . . . . . . .. 32
5 Listening Test 35
i

CONTENTS5.1 Goals of the Listening Test . . . . . . . . . . . . . . . . . . . . . . . . .. . . 35
5.2 Listening Test Design . . . . . . . . . . . . . . . . . . . . . . . . . . . . .. . 35
5.3 Listening Test Subjects . . . . . . . . . . . . . . . . . . . . . . . . . . .. . . 36
5.4 First Part: Listening Test Questionnaire . . . . . . . . . . . .. . . . . . . . . 36
5.5 Second Part: Hearing Assessment . . . . . . . . . . . . . . . . . . . .. . . . 36
5.6 Third Part: MP Volume Adjustment . . . . . . . . . . . . . . . . . . . .. . . 37
5.7 Chapter Conclusions . . . . . . . . . . . . . . . . . . . . . . . . . . . . . .. 38
6 Listening Test Results 39
6.1 Listening Test Analysis . . . . . . . . . . . . . . . . . . . . . . . . . . .. . . 39
6.2 Analysis of Listening Level . . . . . . . . . . . . . . . . . . . . . . . .. . . . 40
6.3 Analysis of Exposure Level . . . . . . . . . . . . . . . . . . . . . . . . .. . . 43
6.4 Analysis of Hearing Thresholds and DPOAEs . . . . . . . . . . . .. . . . . . 45
6.5 Chapter Conclusion . . . . . . . . . . . . . . . . . . . . . . . . . . . . . . .. 52
7 Conclusions 55
Bibliography 57
II Appendix 61
A Assessment Techniques Parameters 63
A.1 Audiometry . . . . . . . . . . . . . . . . . . . . . . . . . . . . . . . . . . . . 63
A.2 DPOAE Measurements . . . . . . . . . . . . . . . . . . . . . . . . . . . . . . 63
B Types of headphones 65
B.1 Introduction . . . . . . . . . . . . . . . . . . . . . . . . . . . . . . . . . . . .65
B.2 Headphone Categories . . . . . . . . . . . . . . . . . . . . . . . . . . . . .. 65
C Exposure Level Calculation 67
C.1 Method . . . . . . . . . . . . . . . . . . . . . . . . . . . . . . . . . . . . . . 67
C.2 Setup and Equipment . . . . . . . . . . . . . . . . . . . . . . . . . . . . . . .68
C.3 Results . . . . . . . . . . . . . . . . . . . . . . . . . . . . . . . . . . . . . . . 68
D Pilot Test Measurements 73
D.1 Method . . . . . . . . . . . . . . . . . . . . . . . . . . . . . . . . . . . . . . 73
ii

CONTENTSD.2 Setup and Equipment . . . . . . . . . . . . . . . . . . . . . . . . . . . . . . .73
D.3 Results . . . . . . . . . . . . . . . . . . . . . . . . . . . . . . . . . . . . . . . 75
E Pilot Test Instructions 83
F Pilot Test Questionnaire 85
G Pilot Test Subjects 93
H Listening Test Instructions 97
I Instructions for the Test Experimenter 101
I.1 Basic Rules for the Test Experimenter . . . . . . . . . . . . . . . .. . . . . . 101
I.2 Test Experimenter Instructions . . . . . . . . . . . . . . . . . . . .. . . . . . 101
J Listening Test Questionnaire 105
K Listening Test Subjects 107
L Hearing Threshold and DPOAEs 115
L.1 Pure Tone Audiometry . . . . . . . . . . . . . . . . . . . . . . . . . . . . . .115
L.2 DPOAEs Measurements . . . . . . . . . . . . . . . . . . . . . . . . . . . . . 115
L.3 Results . . . . . . . . . . . . . . . . . . . . . . . . . . . . . . . . . . . . . . . 116
M Listening Environments 131
M.1 Method . . . . . . . . . . . . . . . . . . . . . . . . . . . . . . . . . . . . . . 131
M.2 Equipment and Setup . . . . . . . . . . . . . . . . . . . . . . . . . . . . . . .131
N ANalisy Of VAriance (ANOVA) 137
O Independent Samples T-Test Analysis 139
P Statistical Analysis 145
iii


Part IReport
1


CHAPTER 1
I NTRODUCTION
Over time, many scientific studies have investigated the potentially harmful effects of noise andits consequences. Many of them are focus on the hearing damage caused on adults that areexposed to a noisy environment at their working places [4][29][8]. Nevertheless, there are alsoleisure time activities that can produce hazardous noise levels as well [9][30][39]. These leisureexposures are for example: the sound emitted by some electronic devices such as toys or mobilephones, the sound in cinemas, the music in concerts etc.
Music players (MPs) used with headphones is other of these leisure activities. The use of thesedevices offer a convenient way to listen to music as high listening level as the user likes withoutdisturbing others. Some of these MPs are portables, for instance MP3 players or pocket comput-ers. Nevertheless there are many others which are not, such as televisions or Hi-Fi equipments.
One of the main reasons of the increasing of users of MPs with headphones is the popularity ofMP3 players in the last years. The reason of this success is its portability. Moreover, as technol-ogy improves, with greater music storage and longer batterylife, it is possible that people willchoose to listen for longer periods of time than ever before.
Scientific studies suggest that these MPs, portable or not, may cause hearing damage if they arenot used with a degree of caution [10][41]. The exposure time (how often, how long) and thelistening level are the main factors that may influence the possible hearing damage [42]. More-over, it seems that the acoustic environment around a personmay affect the listening level thata person sets in his MP [10][11].
Investigations about the possible hazardous effects of headphone sound exposure have beenmade before, however they have yielded to different results[9]. Some researchers conclude thatpersonal stereo systems pose a risk [9] whereas others claim that their effect is not so harmful[44][3]. In general, it is agreed that there is some level of possible risk to hearing in certainconditions. This leads to the aim of the project.
3

CHAPTER 1. INTRODUCTION1.1 The Aim of the Proje tThe aim of the project is to investigate the possible hearingdamage due to the use of MPswith headphones. In order to do that, two groups of subjects which differ significantly in theirlistening habits are analyzed by means of an evaluation of headphone sound exposure and ahearing assessment.1.2 S ope of the Proje tThe scope of the project is to:
• Describe the needed theory in order to fulfill the aim of the project. This includes theoryregarding the human hearing, hearing disorders and hearingassessment.
• Identify two groups of subjects denoted as control and target population. The target popu-lation is characterized by an exposure to music from MPs withheadphones at high listen-ing levels and during long periods of time. By contrast, the control population is definedas a group which do not use, or use MPs with headphones at not risky levels during veryshort periods of time.
• Design and carry out a listening test that consists of a hearing assessment and a headphonesound exposure evaluation of the populations defined before. Different environments towhich these populations are exposed to when using MPs with headphones are considered.
• Carry out the acoustic measurements of different MPs used with headphones in terms oftheir ability to produce sound pressure levels.
4

CHAPTER 2
HEARING AND SOUND EXPOSURE
This chapter reviews basic information about sound, human hearing, and how sound exposureaffects to the human hearing. Moreover some techniques to assess the ability to hear sounds areexplained. The chapter is concluded with the decisions madefor the project based on the theoryexplained.2.1 Hearing and SoundSound can be defined as pressure variations in the air createdby vibrating objects and prop-agated through a medium from one location to another. These pressure vibrations are calledsound pressure waves. The hearing process occurs when soundpressure waves reach the earsof a listener. The auditory system is the responsible of thishearing process, which is based ona conversion of the sound pressure waves to impulse signals.Then these impulsive signals aretransmitted to the brain where the sound is perceived.
In terms of amplitude, the hearing of a person is limited by the next two definitions: the thresh-old of hearing and the threshold of pain. The smallest intensity of a sound that a person needsto detect its presence is called hearing threshold [13], whereas the threshold of pain refers to theintensity of a sound stimulus at which it becomes interpreted as painful.
In terms of frequency range, a person is able to hear frequencies from 16 to 20kHz [7]. How-ever, a person is not equally sensitive at all frequencies, thus the threshold of hearing varies fromone frequency to another. Different hearing thresholds areexpected if the acoustics environmentor the technique used to measure the threshold are modified.
Furthermore, people is not equally sensitive, which means that the threshold of hearing variesamong persons. However, standard thresholds values can be derived from a group of otologi-cally normal persons. This concept is defined in the standardISO 8253-1(1989)[26] as:a personwho is free from all signs or symptoms of ear desiase and from obstructing wax in the ear canal,and who has no history of undued exposure to noise.
Figure 2.1 shows the standard thresholds values presented in ISO 389-7 [24]. It is observedthat the frequencies where the ear is more sensitive is at middle frequencies, between 500 and5000Hz [37].
5

CHAPTER 2. HEARING AND SOUND EXPOSURE20 100 1000 10000
−20
0
20
40
60
80
100
Frecuency [Hz]
SP
L [d
B r
ef. 2
0 µ
Pa]
Free fieldDiffuse Field
Figure 2.1: Minimum audible sound pressure level (thresholds values) presented in the standard ISO 389-7[24℄ in free �eld and di�use �eld of an otologi ally normal person in the age range from 18 yearsto 25 years. The data is plotted as a fun tion of frequen y. The pro edure used for obtainingthis data is de�ned in the standard ISO 8253-1 [26℄.It can be observed in Figure 2.1 that the minimum sound pressure level that a person can detectat 1000Hz corresponds to 20µPa. All the sound pressure levels expressed in decibels (dB)inthis report are referenced to this value.
The sounds that a person is exposed to, may modify his hearingthreshold under certain circum-stances. This sound exposure level is denoted byLEX,To according to ISO 1999 [23], which isapplied for determination of occupational noise exposure.LEX,To combines the listening leveland the exposure time to which a person is exposed during a reference time ofTohours.
In order to analyze how sound exposure can affect the hearing, some aspects related to theanatomy and physiology of the auditory system are explainedin the next section.2.2 Hearing System anatomyThe auditory system is divided into three main parts: the outer ear, the middle ear and the innerear, as it is shown in Figure 2.2. The outer ear is composed of the pinna, the ear canal andthe tympanic membrane. The pinna is the external cartilaginous part with asymmetrical andirregular shape. The middle ear is an air-filled cavity that is composed of three small bones,the ossicles. This part of the auditory system is connected via the Eustachian tube to the nasalpart of the pharynx. Finally, the inner ear comprise the cochlea and the auditory nerve throughwhich the impulse signals are sent to the brain.
6

2.2. HEARING SYSTEM ANATOMY2.2.1 Hearing pro essThe hearing process takes place in the three main parts that it is made up:Outer earThe incoming sound waves are filtered by the pinna together with the head and torso. Then thesound travels along the ear canal to reach the eardrum which starts to vibrate as the membrane ofa microphone would do. These vibrations are transmitted though the middle ear to the cochleaby the ossicles.Middle earThe major function of the middle ear is to ensure the efficienttransfer of sound from the airto the incompressible fluids that are inside the cochlea. If the incoming sounds were applieddirectly on the entrance of the cochlea, which is named oval window, most of them would besimple reflected back instead of enter into the cochlea. It happens because there is a differ-ence in acoustical impedance between the low impedance of the air in the eardrum and thehigh impedance of the fluid inside the cochlea. The main function of the ossicles is to act asan impedance adaptor, coupling the two different acoustical impedances. Thus, this functiontogether with the difference in area between of the eardrum and the oval window, improve thesound transmission. Moreover the amount of reflected sound is also reduced.
Figure 2.2: De omposition of the hearing organ in three main se tions: the outer ear (A), the middle ear(B) and the inner ear (C). Figure adapted from [13℄.Transmission of sound through the middle ear is most efficient at middle frequencies. In addi-tion, at low frequencies the sound transmission through themiddle ear is reduced due to some
7

CHAPTER 2. HEARING AND SOUND EXPOSUREcontraction caused by the minute muscles attached to the ossicles. This contraction is knownas middle ear reflex and it helps to prevent damage to the delicate structures of the cochlea.However this reflex is too slow to provide any protection against impulsive sounds, such as gunshots or hammer blows.Inner earOnce the sound is transmitted through the middle ear, it reaches the cochlea via the oval win-dow. The cochlea is a bony structure shaped like the spiral shell of a snail. Within of it thereis the incomprehensible fluid which acts as a medium to conduct the mechanical vibrations intopressure waves.
The colchea is divided into three cavities: the Scala vestibuli, the Scala media and the Scalatympani. The Scala media is bounded by two membranes: Reissnert’s membrane and BasilarMembrane (BM).
The start of the cochlea where the oval window is situated is known as base while the other endis named apex. When the oval window is set into motion, a pressure difference is applied acrossthe BM. As a consequence of this effect, a wave traveling fromthe narrow base toward the wideapex of the BM is formed. The amplitude of the sound wave created in the BM increases at first,then when the maximum peak is reached, the sound wave decreases abruptly.
The localization of the maximum peak depends on the frequency content of the incoming soundwave. High frequency sounds produces the maximum displacement of the BM close to the base.By contrast, low frequency sounds set the whole membrane into motion and reaches the maxi-mum near the apex. The BM is behaving as a frequency analyzer,each place on it, is sensitiveto a narrow frequency range. It can be appreciated in Figure 2.3 the shape of the traveling waveand the location of its maximum according to the frequency content.
displacement
Basilar membrane
0 5 10 15 20 25 30 35 40 45 50 55 60
1600 Hz 400 Hz 100 Hz
Apex
Distance from stapes along basilar membrane (mm)
BaseFigure 2.3: Displa ement along the BM for three di�erent frequen ies.8

2.3. NOISE INDUCTIVE HEARING LOSS (NIHL)2.2.2 The role of the hair ellsInside the Scala media, all along the BM are hair cells which form part of a structure namedthe Organ of Corti. Figure 2.4 shows a cross section of the Organ of Corti, where two types ofauditory cells can be appreciated: the inner hair cells and the outer hair cells.
Figure 2.4: Cross se tion of the Organ of Corti whi h ontains the inner and outer hair ells. Figure obtainedfrom [1℄.The inner hair cells are responsible for the transduction ofmechanical movements into neu-ral activity. These cells are connected to afferent neuronswhich carry informations from thecochlea to high levels of the auditory system [37].
The outer hair cells are connected to efferent neurons, which carry information from the brain tothe cochlea. The main role of the outer hair cells is to enhance the frequency selectivity and alsoto produce a non-linear amplification process at low levels in the BM [37]. However, practicallyno reaction is produced at more intense sounds. This non-linear function is easily damage bynoise. Next section explains this type of hearing disorder.2.3 Noise Indu tive Hearing Loss (NIHL)Noise-Inductive Hearing Loss (NIHL) is a sensorineural hearing disorder referred to as perma-nent damage, cause by noise, to the outer hair cells resulting in a decreasing of the amplificationability of the cochlea [8]. Anatomical changes such as the fusion or disappearance ofthe haircells are the main effects that causes this decreasing[8].
The outer hair cells are generally more susceptible to damage than the inner hair cells. Mainly,the ones corresponding to the frequencies between 3 to 6 kHz are affected [13]. Neverthelessif a person continues being exposed to harmful noises, the hearing damage spreads over otherfrequencies as well.
9

CHAPTER 2. HEARING AND SOUND EXPOSURENIHL is caused due to an over stimulation of the auditory system produced by an one-time ex-posure to loud sound, as well as by repeated exposure to sounds at various loud levels over anextended period of time. Therefore, the effects of these over stimulations can be seen slowlyover years of continuous exposure, or instantaneously after one-time exposure to loud sound. Inthe case of an overall year exposure, the full effects of NIHLare generally noticed after ten ormore years of noise exposure [8].
Furthermore, there are other reasons that can produce a damage in the hearing cells as an innerear infection due to external bacteria, an ingestion of ototoxic drugs or inherited conditions.
NIHL is a preventable hearing disorder that affects people of all ages and demographics becauseit depends mainly of the listening habits, the noisy environments that a person is exposed to, andthe characteristics of the noise. One of the possible consequences of noise exposure is tinnitus.
Tinnitus is defined as the abnormal perception of sounds for which there is no external stimulus[13]. It is usually to be perceived in one or both ears or in the head. Some people define itas a ringing noise, a buzzing or a whistling sound. This phenomena can be suffered also byotollogically normal persons after a sound exposure.
It has to be noticed the difference between the NIHL and the hearing loss associated with ad-vancing age, which is calledpresbyacusis. This hearing loss may be due to lesions in the externalor middle ear, but the most consistent effect of aging is on the hair cells and neurons [33].2.3.1 Hearing Loss Des riptorsThere are some descriptors associated with the hearing lossexplained in this section. Thesedescriptors are combined with the NIHL to give additional information. Some of them are:
• Bilateral versus unilateral hearing loss:Bilateral hearing loss occurs when both ears are affected, by contrast unilateral hearingloss means that only one ear is affected.
• Symmetrical versus asymmetrical hearing loss:The difference between symmetrical and asymmetrical hearing loss is based on the degreeof hearing loss in each ear. If both ears are damaged in the same way, the hearing loss issymmetrical. Otherwise it is asymmetrical.
• Progressive versus sudden hearing loss:A hearing loss is progressive when the damage produced in theear increased over time.However, a sudden hearing loss is a ear damage that occurs in avery short period of time.
• Temporary versus permanent hearing loss:
10

2.4. HEARING ASSESSMENTA temporary hearing loss or temporary threshold shift is defined as a change in the hear-ing thresholds that disappears within a period of time afterthe exposure. By contrast, apermanent hearing loss is a hearing disorder that does not vary over the time.
These descriptors of the NIHL can be identify using different methods. Next section explainsthe methods utilized for hearing assessment in this project.2.4 Hearing AssessmentThe purpose of hearing assessment is to quantify the abilityto hear sounds. A variety of methodscan be used, such as audiometry and OtoAcoustic Emissions (OAE).2.5 AudiometryThis test measures hearing thresholds by means of behavioral feedback from the subject. Theperson taking the test is instructed to give some type of response when a sound stimuli presentedis heard. There are different possibilities for the subjectto express if the sound is perceived suchas pressing a button or raising a finger. The response given bythe subject is caused by thesensory impression of the sound stimuli, but also the interpretation based on the experience andknowledge of the test subject influences in the decision of hearing or not a sound [34].
During this test, headphones are usually used. Thus sound travels through the air in the ear canalto stimulate the eardrum and then the auditory nerve. This procedure, which is specified in thestandard ISO 8253-1 [26], is called air conduction audiometry.
Thresholds are measured for different frequencies in each ear. The responses are recorded on agraph called audiogram that provides the Hearing Level (HL)for each frequency tested. The HLexpresses the difference in decibels between a measured hearing threshold and the thresholdsvalues derived from an otologically normal population at a particular frequency [25]. A straighthorizontal line at 0dB HL in the audiogram represents the hearing derived from these thresholdsvalues. For example if a person has a hearing threshold of 25dB HL at a specific frequency, itmeans that the hearing threshold is 25dB higher than the threshold of hearing obtained from apopulation considered otologically normal at that specificfrequency.Types of AudiometriesThere are many different types of audiometries for threshold determination. For instance themethod of limits, the Békésy method, the method of constant stimuli, forced choice methods,audioscan method, the method of adjustment etc.
11

CHAPTER 2. HEARING AND SOUND EXPOSUREMany of them gradually converge on the threshold by presenting sound stimuli at levels thatdepend on the response to previous trials, considering a trial as the answer given by the subjectin each stimuli presentation. After several trials of one subject, the hearing threshold is deter-minated according to a stop criteria.
The methods to be analyzed in detail for this project are the method of Limits and the Bekesymethod. Both methods are standardized in ISO 8253-1 [26].Method of LimitsThere are different versions of this method: Ascending, Descending and Bracketing. They allare based on the same principle: several pure tones at specific frequencies are presented to thesubject, so by means of a variation in the level of these pure tones the hearing threshold isdetermined.
• Descending MethodIt consists of a presentation of several pure tones startingfrom a level which is aboveto the threshold of hearing. Then the subject must show if thesound was heard or not.Since the starting level is above enough to the threshold of hearing, a positive answer isexpected. Then the level of the pure tone is decreased and presented again to the subject.This process is repeated until the subject is not able to perceive the sound. Every time thatthe subject finishes a descending from an audible to an inaudible stimuli is called a run[14]. Several runs are performed, so the threshold of the subject is obtained according tothe threshold levels across runs [14]. This is made for each frequency.
• Ascending MethodThe ascending method differs to the descending method in thestarting level of the puretones. In this case the sound that is first presented is set to alevel quite below to thethreshold of hearing. Then the level of the presented pure tones is increased until thesubject hears the sound. Again several runs are performed and the threshold is calculated.
• Bracketing MethodThis method combined the ascending and descending methods.Starting from a levelabove the threshold of hearing, the stimuli is decreasing until the subject can not per-ceived. Then the stimuli is increased again until the subject shows that can hear thesound. Therefore a combination of increasing and decreasing runs are performed whenusing this method. This process is repeated a certain numberof times for each frequency.Then from the values obtained in the descending and ascending runs, the threshold is cal-culated.
The drawbacks of this method are the anticipation and habituation of the subject to the task.Sometimes subjects anticipate hearing the stimulus and sometimes anticipate not to hear it.
12

2.6. OTOACUSTIC EMISSIONS (OAE)Other disadvantage is that is very dependent on the amount ofdecibels when increasing or de-creasing the levels. A big increasing or decreasing in the runs can lead to inaccurate results.
An advantage of this method is that a full range of performance levels can be estimated. How-ever, if only hearing threshold determination is desired, many trials will be presented until reachthe hearing threshold.Békésy MethodIn this method the stimulus is controlled by the test subjectwho adjusts the level continuouslyover the time to reach the hearing threshold. The sound stimuli are pure tones as well as in themethod of Limits, but the task of the subject is different. Inthis case the pure tone is presentedand the subject has to press a button when the tone is heard andto release it when the signal isinaudible. When the subject release the button, then the level of the tone increases automaticallyin a certain step size. Therefore the level is increased and decreased several times depending onthe answers of the subject. This will produce some sort of valleys and peaks around the min-imum audible level. The hearing threshold is calculated according to certain number of peaksand valleys.
A disadvantage of the Békésy method is that the measurementsdepends on the reaction time ofthe subject. If the stimulus are decreasing or increasing sofast that the subject does not havetime enough to press or depress the button according to his perception of the sounds, then thethresholds obtained are not reliable. This can be avoided using reasonably slower attenuationrates.
On the other hand, this method is fast an has the advantages ofspeed and reasonable precision.because of the tracking used to achieve the hearing threshold.2.6 OtoA usti Emissions (OAE)Besides the hearing process, a healthy human ear is able to produce inaudible sounds emitted bythe cochlea which are known as OAEs. They can be produced either spontaneously or by meansof a stimulation of the ear with one or several specific sound signals.
The OAEs are produced in a non damage cochlea by its own activity and reflect the activity ofthe outer hair cells. The sounds emitted by the ear are in factproduced due to a mechanicalmotion of the outer hair cells of the cochlea that is transmitted to the basilar membrane [31].
This active mechanical process is consequence of natural imperfections of the cochlea amplifiermechanism [43]. The motion of the hair cells creates a vibration which is driven by the cochlea,passing through the oscicles and finally reaches the tympanic membrane. Then a vibration of
13
CHAPTER 2. HEARING AND SOUND EXPOSUREthe tympanic membrane occurs and a sound wave is emitted by the ear. If a probe microphoneis placed into the ear canal closing it, then this sound wave can be recorded.
Although the position of the probe microphone the amplitudeof the OAEs may vary slightly[45], some studies have investigated how the amplitude of the OAE varies depending on thedegree of hearing loss[43][28][8][12] [31][32]. Most of them conclude that for a population thepresence of OAEs is related to normal hearing thresholds, whereas reduced OAE levels can beassociated with hearing loss.Types of OAEsThe OAEs can be classified as evoked or spontaneous OAEs. Evoked OAEs are inaudiblesounds emitted by the cochlea when the cochlea is stimulatedby a sound signal. When thissound reaches the ear, it is transmitted through the ear canal and the oscicles until the cochlea.Then the outer hair cells vibrate creating an inaudible sound that echoes back into the middleear again, which is the Evoked OAEs. By contrast, if the ear produces the vibration of the haircells by itself in the absence of any know stimulus, then the OAEs are called spontaneous OAEs.
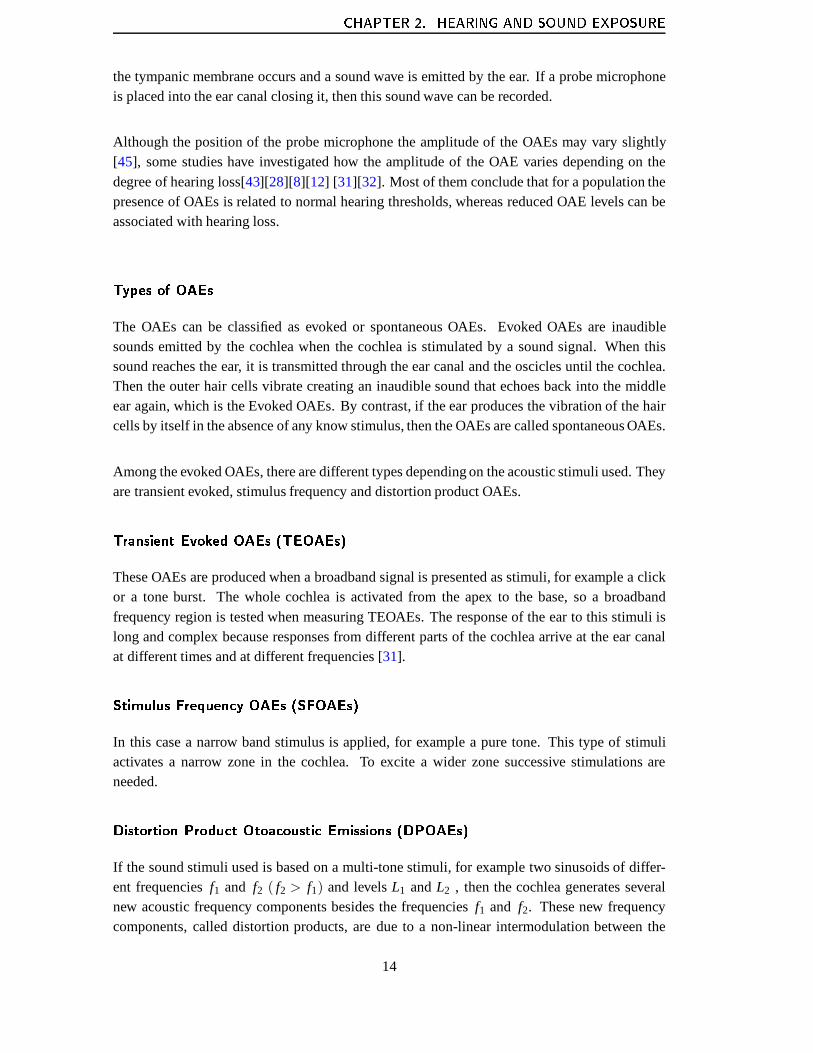
Among the evoked OAEs, there are different types depending on the acoustic stimuli used. Theyare transient evoked, stimulus frequency and distortion product OAEs.Transient Evoked OAEs (TEOAEs)These OAEs are produced when a broadband signal is presentedas stimuli, for example a clickor a tone burst. The whole cochlea is activated from the apex to the base, so a broadbandfrequency region is tested when measuring TEOAEs. The response of the ear to this stimuli islong and complex because responses from different parts of the cochlea arrive at the ear canalat different times and at different frequencies [31].Stimulus Frequen y OAEs (SFOAEs)In this case a narrow band stimulus is applied, for example a pure tone. This type of stimuliactivates a narrow zone in the cochlea. To excite a wider zonesuccessive stimulations areneeded.Distortion Produ t Otoa ousti Emissions (DPOAEs)If the sound stimuli used is based on a multi-tone stimuli, for example two sinusoids of differ-ent frequenciesf1 and f2 ( f2 > f1) and levelsL1 andL2 , then the cochlea generates severalnew acoustic frequency components besides the frequenciesf1 and f2. These new frequencycomponents, called distortion products, are due to a non-linear intermodulation between the
14

2.6. OTOACUSTIC EMISSIONS (OAE)two stimulus tones along the basilar membrane. In the case ofthe two sinusoids, the distortionproducts are 2f1− f2, 3f1−2 f2, 2f2− f1 etc. They are obtained according to Equation 2.1
f dp= f1 +N( f2− f1) (2.1)
where N is any positive or negative whole number [31].
It is shown that the intermodulation distortion produced atthe frequency 2f1− f2 is the DPOAEwhich can be measured easily due to its amplitude, although the cochlea also produces DPOAEsat other frequencies, as it was mentioned before. In order tohave a good response at that fre-quency, the levels and the frequencies of the tones must be selected adequately. Anf1/ f2 ratioat 1.2 and a intensity of 65 and 55dB sound pressure level forL1 andL2 respectively yields thegreatest DPOAEs [31].
Figure 2.5 shows the development of the traveling wavesf1 and f2 along the BM. In graph a)corresponds to a dead cochlea. It can be seen that the cochleadoes not respond to most of thestimulus energy. In graph b) a cochlea with a linear amplification of the outer hair cells is shown.However the outer hair cells do not have a linear behavior, and this results in intermodulationdistortion products (2f1− f2 and 2f2− f1) which then travel to their frequency places at points3 and 4 and generate the backward traveling waves. This can beseen in graph c). Therefore theDPOAEs generation is based on a two-source model: The first source is the initial non-linearinteraction of the primaries and the second source comes from the re-emission site at the charac-teristic place of the distortion product frequency. If a decreased DPOAE is measured, it may notnecessarily mean that the damage area of the BM corresponds to the place where the 2f1− f2and 2f2− f1 are generated. It could be by a BM damage in the overlap area between f1 and f2for example.
By modifying the frequency off1 and f2, the distortion product 2f1− f2 varies, therefore differ-ent frequencies can be tested. If the ratio betweenf1 and f2 or the intensity of the tones changes,the DPOAEs can not be compared among them in terms of amplitude. For this reason, thesetwo parameters have to be maintained constant all along the frequency range.
Depending on the frequency variation when changingf1 and f2 along the frequency range,different resolutions can be obtained. For example, if a frequency variation of 15Hz is used,many values are obtained for a specific range of frequencies.In this range peaks and valleysare detected when measuring the DPOAEs because of the high resolution. Nevertheless, if thefrequency variation is selected for giving DPOAEs values each 1000Hz, then these peaks andvalleys do not appear and a curve without abrupt changes is obtained. This small variationsdetected at high resolution are called DPOAEs fine structures.
Figure 2.6 shows an example of a clinical DPOAE analysis and illustrates its measurementresults. In the figure on the left, it can be seen the sound spectrum measured in a healthyhuman ear canal during stimulation of the pure tonesf1 (at 1425Hz) andf2 (at 1500Hz) with
15

CHAPTER 2. HEARING AND SOUND EXPOSURE
Figure 2.5: Development of the traveling waves along the BM in three ases. Graph a) shows the e�e t in adead o hlea. Graph b) shows the e�e t of a linear ampli� ation of the outer hair ells. Graph ) ilustrates the e�e ts of the non-linear e�e t of the outer hair ells. Taken from D.T Kemp[31℄.an amplitude of 70dB SPL both. The rest of the spectral lines that appears are due to theintermodulation tones produces by the cochlea. The figure onthe right shows the result of themeasurements after the presentation of the signalsf1 and f2 at different frequencies. This is calla DP-gram. The data of the spectrum of the left figure corresponds to the value shown in theright figure with an arrow. The shaded portion indicates the noise level during the measurement.The data is plotted as a function off2.2.7 Sele tion of the Assessment Te hniques for NIHLA description of the procedures selected in order to analyzethe NIHL and the final decision arepresented next.2.7.1 Sele tion of the Audiometry Method for NIHLIn this section the audiometric method is selected from the different audiometric methods pre-sented in Section 2.5. Before deciding the audiometry method, the following requirements aretaken into account:
1. The audiometry method select has to be accurate. The accuracy in this method can be
16
2.7. SELECTION OF THE ASSESSMENT TECHNIQUES FOR NIHLFigure 2.6: The �gure on the left shows the sound spe trum in a healthy human ear anal during stimulationby two pure tones, f1 (at 1425Hz) and f2 (at 1500Hz), both at 70 dB SPL. The �gure on therigh ilustrates the omplete DP-gram obtained after the measurements.
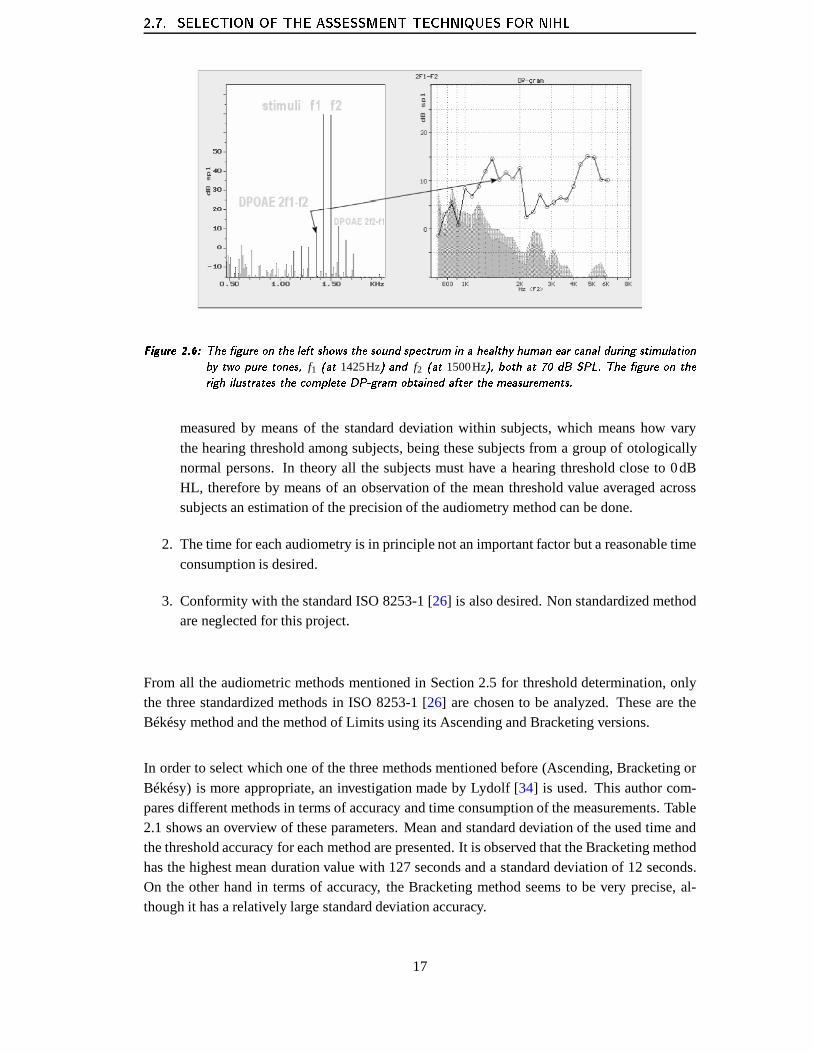
measured by means of the standard deviation within subjects, which means how varythe hearing threshold among subjects, being these subjectsfrom a group of otologicallynormal persons. In theory all the subjects must have a hearing threshold close to 0dBHL, therefore by means of an observation of the mean threshold value averaged acrosssubjects an estimation of the precision of the audiometry method can be done.
2. The time for each audiometry is in principle not an important factor but a reasonable timeconsumption is desired.
3. Conformity with the standard ISO 8253-1 [26] is also desired. Non standardized methodare neglected for this project.
From all the audiometric methods mentioned in Section 2.5 for threshold determination, onlythe three standardized methods in ISO 8253-1 [26] are chosen to be analyzed. These are theBékésy method and the method of Limits using its Ascending and Bracketing versions.
In order to select which one of the three methods mentioned before (Ascending, Bracketing orBékésy) is more appropriate, an investigation made by Lydolf [34] is used. This author com-pares different methods in terms of accuracy and time consumption of the measurements. Table2.1 shows an overview of these parameters. Mean and standarddeviation of the used time andthe threshold accuracy for each method are presented. It is observed that the Bracketing methodhas the highest mean duration value with 127 seconds and a standard deviation of 12 seconds.On the other hand in terms of accuracy, the Bracketing methodseems to be very precise, al-though it has a relatively large standard deviation accuracy.
17

CHAPTER 2. HEARING AND SOUND EXPOSUREAscending Bracketing Békésy
Accuracy (dB HL) 0.8±2 0.2±1.9 1.5±1.7Time consumption (seconds) 73± 6 127±12 62±12Table 2.1: Mean and standard deviation of the time used and the HL a ura y in the threshold determinationof As ending, Bra keting and Békésy method. This data is obtained from a investigation of Lydolfin his Ph.D.Thesis [34℄.
For a simple and a reasonable accurate method, the Bracketing method is chosen. Moreover thismethod can be used according to the facilities available forthe development of this project.
The sound stimuli used are discrete pure tones at 250, 500,750, 1000,1500, 2000,4000, 6000and 8000Hz. The time duration of each pure tone presentationis selected to be 300ms for allthe pure tones presentations along the frequency range. It was decided to choose this time tolet the subject time enough to hear and to create the responsepressing or not pressing when thesound is respectively heard or not heard [15].
Other parameter is the attenuation step size that indicateshow the sounds decrease or increasein level from one presentation of the signal to the next presentation. This parameter is desiredto be small to give a precise audiometry. If the subject answers that the sound was heard, adecreasing of 10dB is performed. However if the subject doesnot hear the sound an increasingof 5dB is performed.
The calculation of the threshold in the standard ISO 8253-1 [26] for the Bracketing methodrequires that three runs in series occur at the same level outof a maximum of five runs. Twoascending-descending runs are chosen in this project instead of three because when using three,the time consumption of the audiometry with all the frequencies becomes very large.
In the beginning of the audiometry an initial familiarization is carried out to be assure that thesubject has understood how to perform during the test. This familiarizations consist on a puretone at an audible level, which decreases until a certain level when the subject is not able to hearit. If the subject responds correctly to this first descent, the threshold determination goes on. Inthis part the attenuation step is the same specified before.
When changing from one frequency to another, the next frequency presented to the subject isplayed higher than the level recorded when the push button was not pressed in the last thresholddetermination.2.7.2 Sele tion of Otoa ousti Emissions for NIHLMany researchers [38][43][28][42] used OAEs for audiologic evaluation in their investigationabout NIHL.
18

2.8. CHAPTER CONCLUSIONSEvoked OAEs are frequently used instead of spontaneous OAEsfor hearing assessment becausenot all the healthy ears produce spontaneous OAEs. Table 2.2shows the prevalence of the differ-ent types of OAEs in human healthy ears which is defined as no cochlear pathology and hearingthreshold of 15dB HL or better. According with this table, TEOAEs and DPOAEs are the pos-sible evoked OAEs selected for this project.
Type of OAEs Stimulus Prevalence in normal earsSpontaneous OAEs No stimulus required approximately 60%Transient Evoked OAEs (TEOAEs) Click or tone burst 99%Stimulus Frequency OAEs (SFOAEs) Continuous pure tone unknownDistortion Product OAEs (DPOAEs) Two pure tones 99%Table 2.2: Classi� ation of the di�erent types of OAEs a ording to the stimulus applied to ex ite them andwith their prevalen e in normal ears (no o hlear pathology and hearing threshold of 15dBHL orbetter). The data is obtained from [16℄.
The broad band nature of the TEOAE does not permit a deeper analysis of the hearing due toits highly non-linearity. Moreover, the frequency analysis of the TEOAEs can not be related toa specific site of the BM, since the TEOAE level at any given frequency is a result of combinedsources [42]. By contrast, DPOAE allows to associate each DPOAE level with certain areasof the BM derived from the frequency of the emission signals [42]. Therefore DPOAEs arepreferable to TEOAEs for this project.DPOAEs allow to into account.quantify the degree of
DPOAEs are measured at the frequencies 2f1− f2, ranging from 635 to 3943kHz. Two sinu-soids with frequenciesf1 and f2 are selected to be presented to the subject to excite the OAEs.The distortion product is obtained varying the frequencyf2 from 1001 to 6165Hz. Fixed levelsof 65 and 45dB forL1 andL2 respectively and a fixed frequency ratio off2/ f1 = 1.22 are se-lected for the pure tones. Regarding the resolution of the measurements, eight DPOAE valuesper octave band are chosen.2.8 Chapter Con lusionsThough this chapter, it has been described the hearing assessment in order to detect a possiblehearing damage due to a sound exposure. As stated in the Introduction (Chapter 1), this projectinvolves the analysis of a specific situation: a headphone sound exposure by MPs.
Headphone sound exposure, as a sound exposure in itself, mayleads to NIHL. This NIHL isdiagnosed in this project by means of DPOAE measurements andpure tone audiometry. Thesetechniques are chosen since the DPOAEs measurements have the potential to indicate a mild
19

CHAPTER 2. HEARING AND SOUND EXPOSURENIHL before it is observed audiometrically [43][8].A summary of the parameters selected in these assessment methods are shown in Appendix A.
In addition, in next chapter a detail description of the sound exposure produced by MPs withheadphones is presented. Furthermore a explanation about how theLex,To is used to evaluatethis exposure is made.
20

CHAPTER 3
HEADPHONE SOUND EXPOSURE
Headphone sound exposure is a difficult and subjective exposure where many variables playan important role. This chapter defines in detail how all these variables are considered in thisproject for the analysis of a possible NIHL in a population.3.1 Listening Devi es: Musi Players and HeadphonesA MP is defined in this project as any kind of device which is able to play music files throughheadphones. The sound signal is produced by the MP, however the headphones are the trans-ducers responsible to convert the output signal in sound pressure level.
There are different types of MPs that can be considered for headphone sound exposure, never-theless, only the following devices are taken into account:
• Laptop computers or desk computers.
• Portable MPs: MP3 players, mobile phones, portable DVD, CD players, portable radios,pocket computer etc.
• Televisions or games console.
• Hi-Fi equipment, mini-stereo systems, professional stereo systems or similar.
• Mixer table or similar.
All the MP mentioned above must have a common point: They all must have the possibility tobe used with headphones.
Regarding to the headphones, there are five different categories, according to the standard ITU-T-1993 [27], that are considered. An explanation of each type can be seen in Appendix B. Thedifferent types of headphones are the following:
• Intra-concha.
• Supra-concha.
• Supra-aural.
21

CHAPTER 3. HEADPHONE SOUND EXPOSURE• Circum-aural.
• Insert.
In general, headphones do not incorporate acoustic insulation to protect from external noises.However some headphones in itself provide some attenuationdue to their structural properties.This insulation varies among the different types and among the different models of headphones.Therefore the exposure level can be modified slightlydepending on the type of headphones. Thisconsideration is not taken into account in this project because it is treated as an uncontrollablevariable because even though some headphones can provide greater attenuation compare toothers, this fact is a consequence of the particular exposure of each person. Thus, it can not becorrected, because then the real sound exposure will be distorted.3.2 Listening Sour e: Musi The source of sound exposure through the headphones that is considered for this project ismusic.When dealing with noises such as the machinery noisy,the sounds used to be more pre-dictable, so it is easier to analyze. However, in the case of music, the temporal variations, thefrequency content and the average to peak level can vary among different types of music or evenwithin a same song.
Some investigations [10] have concluded that depending on the type of music, the MP usersadjust the volume of their MP to different levels. It means that the type of music is a parameterwhich may affect on the headphone sound exposure. Thereforedepending on the music prefer-ences, people can be more or less exposed. Moreover people isnot used to listen to only onetype of music. Thus an estimation of the exposure time per each type of music is needed foreach person in order to compare the headphone sound exposureas a function of the music.
An analysis of the headphone sound exposure depending on thetype of music is consideredbeyond of the objectives of the project.3.3 Headphone Sound Exposure EvaluationIn this project the headphone sound exposure is calculated as LEX,To which is defined in thestandard ISO 1999 [23] and mentioned in Chapter 2. Equation C.4 shows the expression.
LEX,8h = Leq,Te+10log
(
TeTo
)
(3.1)
Te is the effective duration that the person is exposed to the noise in hours per day andTo cor-responds to a reference duration of 8 hours. It is namedexposure time. Information aboutTeis obtained by means of a questionnaire.
22

3.3. HEADPHONE SOUND EXPOSURE EVALUATIONLeq,Te correspond to the level that a person set in its MP. This is defined as the equivalent contin-uous sound pressure level which is the steady sound pressurelevel obtained from an integrationover a period of time of a fluctuating sound pressure level. Itis recorded from the sound pro-duced by the headphones. The expression of theLeq,Te can be seen in Equation 3.2. During allthe project the time of integration of all the measurements of Leq,Te is fixed to 60seconds.
Leq,Te= 10log1Te
Z Te
0
(
p(t)p0
)2
(3.2)
whereTe is the time of integration,p(t) is the instantaneous sound pressure level andp0 is thereference sound pressure which is 20µPa.3.3.1 Sound Levels Generated by the HeadphonesThe measurements of theLeq,60s produced by the headphones of a MP within the ear can be mea-sured with the MANIKIN technique and the MIRE technique stated in the standard ISO 11904-2and ISO 11904-1 respectively [22][21]. MANIKIN technique uses a standardised artificial earincluding microphones, whereas the MIRE technique uses a probe microphone inserted in theears of human subjects.
This last technique can not be used when measuring the sound produced by intra-concha andinsert headphones because the placement of the probe microphone with this type of headphonesis not possible with the correct fit. Furthermore the probe microphones are very delicate, sensi-tive to environmental conditions and difficult to calibrate[42].
On the other hand, the MANIKIN technique permits to use any king of headphones, and allowsrepeated measurements in a short period of time [42]. A disadvantage is the difficulty to use itoutside of the laboratory due to its weight and size. Moreover the pinna of the manikin doesnot have the same properties than a human ear, so placement inthe ear may not be exactly thesame than in a human being. However this technique is appliedin this project since it providesa simpler and more robust manner of measurement.
The acoustic field produced in the headphone cup can not be compared with a source that createsa sound field which is propagated in an open space. Therefore aconversion fromLeq,60s mea-sured in the ear canal to a field level un-disturbed by the presence of a manikin is needed. Thislevel is named as free-field related equivalent continuous A-weighted sound pressure level andit is denoted asLFF,Aeq. Moreover for this project this level is calledlistening level. AppendixC explains in detail the procedure to measure and calculate theLeq,60s, theLFF,Aeqand theLEX,8h.
23

CHAPTER 3. HEADPHONE SOUND EXPOSURE3.4 Headphone Sound Exposure ParametersThe parameters to take into account in order to perform a precise headphone sound exposureevaluation are explained in this chapter.3.4.1 EnvironmentsIt seems that the acoustic environment around a person may affect the preferred sound level thata person set in his MP [10].
People use MPs in many different situations. Therefore it isnecessary to define precisely theplaces and the characteristics of the environments where MPs are used. For instance it can notbe considered the same exposure to utilise a MP with headphones in a very quiet street or a park,or to use it in a cafeteria. Furthermore in the same environments different background levels arepossible. For example to use a MP while walking in a street canbe considered depending on thestreet as a very noisy or quiet environment.
The environments that are considered for the headphone sound exposure evaluation are:
• Quiet.
• Moderate.
• Noisy.3.4.2 Other Sound ExposuresIf a NIHL is diagnosed in a person who is exposed to another excessive sound apart from head-phone sound exposure by MPs, it is impossible to define which exposure is the responsible ofthe hearing damage.
All those persons who do not have any other exposure than the headphone sound exposurebesides not having other complication in his hearing, are considered as individuals who do nothave anyprevious hearing condition.
For this project a previous hearing condition is presented when a person:
• Suffers from a cold or has taken any medicine or another type of drugs that might influenceon his hearing.
• Has very often hearing problems as infections, ear noises, tinnitus, drainage etc.
• Has a know history of hearing damage diagnosed by a medical doctor.
• Has been exposed to impulsive or loud sounds for long periodsof time without hearingprotectors i.e. explosions, fireworks, shootings etc.
24

3.5. CHAPTER CONCLUSIONS• Has been working in a job were the use of headphones was neededfor at least two years
full time.
• Has been working in a noisy environment for at least two yearsfull time without usinghearing protectors.
• Is a musician or is professionally involved.
• Used to play an instrument or attend to concerts/discos veryoften without using hearingprotectors.3.4.3 Gender and Age Di�eren es
Among MP with headphones users, there are people of different ages. This project investigatesthe age range of the potential users of MPs with headphones ina population. However whetherthe age within the potential users is a parameter that affects the headphone sound exposure isnot an issue analysed in this project.
In addition, whether a gender difference exist when assessing noise exposure through the head-phones is not an issue to be investigated.3.5 Chapter Con lusionsIn the headphone sound exposure evaluation carried out for this project, different types of head-phones and MPs are selected to be analysed when music is played. Moreover quiet, moderateand noisy are the three environments considered.
In order to assess the influence that MPs with headphones produces on the hearing, a selectionof MP users according to theirLEX,8h and their previous hearing condition is made.
Next chapter explains the classification of subjects in two groups, defined as control and targetpopulation:
• Thecontrol population is a group of persons that do not present any previous hearingcondition besides not being potential MP users.
• The target population is formed by persons who do not present any previous hearingcondition besides listening to MP with headphones for long periods of time and at highvolume settings.
25

CHAPTER 4
PILOT TEST
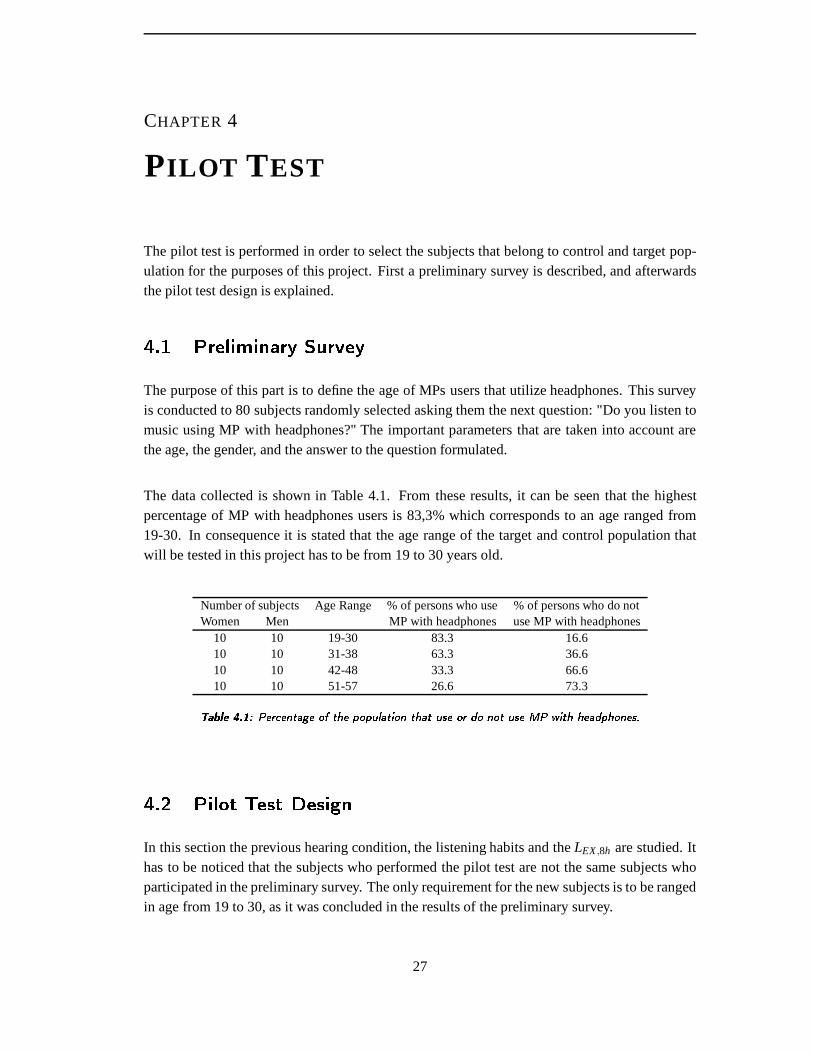
The pilot test is performed in order to select the subjects that belong to control and target pop-ulation for the purposes of this project. First a preliminary survey is described, and afterwardsthe pilot test design is explained.4.1 Preliminary SurveyThe purpose of this part is to define the age of MPs users that utilize headphones. This surveyis conducted to 80 subjects randomly selected asking them the next question: "Do you listen tomusic using MP with headphones?" The important parameters that are taken into account arethe age, the gender, and the answer to the question formulated.
The data collected is shown in Table 4.1. From these results,it can be seen that the highestpercentage of MP with headphones users is 83,3% which corresponds to an age ranged from19-30. In consequence it is stated that the age range of the target and control population thatwill be tested in this project has to be from 19 to 30 years old.
Number of subjects Age Range % of persons who use % of persons who do notWomen Men MP with headphones use MP with headphones
10 10 19-30 83.3 16.610 10 31-38 63.3 36.610 10 42-48 33.3 66.610 10 51-57 26.6 73.3Table 4.1: Per entage of the population that use or do not use MP with headphones.4.2 Pilot Test Design
In this section the previous hearing condition, the listening habits and theLEX,8h are studied. Ithas to be noticed that the subjects who performed the pilot test are not the same subjects whoparticipated in the preliminary survey. The only requirement for the new subjects is to be rangedin age from 19 to 30, as it was concluded in the results of the preliminary survey.
27

CHAPTER 4. PILOT TEST4.2.1 Goals of the Pilot TestThe goals of the pilot test are:
• To identify two groups of subjects: target and control population
• To define the most typical places where MPs are used.
This is done by means of
• Analysis of the previous hearing condition and the environments where MPs with head-phones are used. The subjects could select among the next environments: Bus, train, bike,motor-bike, car, street, home, university or at work. This is done with a questionnaire.
• An evaluation of the headphone sound exposure of the subjects testing the listening leveland the exposure time.
In addition, some other parameters are investigated in order to verify some of the decisions thatwere taken in the pilot test design. These are:
• The use of MP with headphones among the next devices: Portable MP, computer, televi-sion/DVD, HIFI equipment or mixer table.
• The type of headphones preferred by users among the next types: Intra-concha, supra-concha or circum-aural headphones.4.2.2 Method
It is decided to carry out this pilot test in Aalborg university offices which is a quiet environmentwhere the background noise can not vary suddenly from low to high levels. The instructionsgiven to the subjects are shown in Appendix E.
This pilot test is divided in two steps:
1. It consists of testing the volume listening preferences of the subjects when using MP withheadphones. The purpose is to obtain the sound exposure level of each subject. In orderto do that, two different types of headphones and one portable MP are presented to everysubject. They can be seen in Table 4.2. Each person must select the type of headphonesthat would choose in case of listening to music with headphones. Then, the task of thesubject will be to adjust the preferred volume control of onefrom seven different musicsamples of 60seconds that are stored in the portable MP. Table 4.3 shows title, author andtype of the music samples. A normalization of all the music samples is done to assure thatthey all have the same energy content. The music samples are popular and well knownsongs in order to allow the subjects to focus on the volume selection instead of anothernot important details i.e. the lyrics or the rhythm of the music.
28

4.2. PILOT TEST DESIGNAppendix D describes the selection of the portable MP and theheadphones as well as themusic samples used. The normalization performed in the music samples is also detailedin this appendix.
Device Model LAB-NrHeadphone Sony MDR -Headphone Creative MuVo V200 2157-41MP Creative MuVo V200 2157-41Table 4.2: Devi es used in the pilot test
2. It is based on a paper questionnaire inspired by the one used by Mattila & Zacharov [35].This questionnaire is formulated in order to identify thosesubjects who do not have anyprevious hearing condition and to get some information related to their listening habits.The entire questionnaire can be seen in the Appendix F.
Music Author Music Title Music TypeThe Beetles Help PopMilk Inc. In my eyes DanceFugees Ready or not Hip-hopWoody Allen Come On and Stomp JazzShakira Hips dont’t lie PopU2 Sunday Bloody Sunday RockVivaldi The Four Seasons ClassicalTable 4.3: Musi samples presented to the subje ts. The duration of all the musi samples is 60 se onds4.2.3 Evaluation and Results
A total of 61 persons, 40 males and 21 females, ranged in aged from 21 to 33 (median=23) tookpart of this study. Appendix G shows the results in detail.Previous Hearing ConditionFirstly, the subjects that do not present any previous hearing condition are selected and the restare rejected.
Regarding to the results collected from the questionnaire,any significant problem related tohearing infections or medicine that might have influence on the hearing was revealed by thesubjects. Five candidates showed a diagnosed hearing problem and one of them was sufferinga cold, therefore these six subjects, that correspond to a 9.83% of the tested population were
29

CHAPTER 4. PILOT TESTrejected.
There was not relevant case affected by impulsive or loud sounds as explosions, shootings orfirearms. The most common cases correspond to persons exposed to fireworks once or twiceper year. In addition there was a 8% of subjects that declaredthat they have been working in anoisy environments i.e. machinery noises in a factory. However it was during short periods oftime and in the most of cases hearing protectors were used.
A 32% of the subjects play some musical instrument as piano, guitar, drums, saxophone or elec-trical guitar. The 11.76% of these subjects play in a band in their free time and 88,24% play athome. There is only one subject who used to play around 80 hours per month, therefore thisparticipant is rejected. The rest of the subjects are accepted because any of them was profes-sionally involved in music and the exposure time was less than 32 hours.
A 82,69% of the subjects assists to discos or pop/rock concerts however since any subject at-tends regularly and the average is 2 times per month, then it is considered that any subject isseverely affected.
Thus, it can be concluded that 54 subjects, that correspondsto 88.52% of the population, areconsidered do not present any previous hearing condition. From these subjects the headphonesound exposure is analyzed.Headphone Sound ExposureThe next step is to calculate the headphone sound exposure toidentify the subjects of the targetand control population using the data collected from the control level setting and the time ex-posure marked in the questionnaire. This is done by means of the calculation of theLEX,8h as itwas explained in Section 3.3 in Chapter 3.
The levels that correspond to each control level setting aremeasured beforehand, so they wereknown before the performance of the pilot test. This can be seen in Appendix E.
The LEX,8h of all the subject can be seen in Table G.1 in Appendix G. Figure G.1 presentstheLEX,8h sorted from the minimum to the maximumLEX,8h. There are 11 subjects that are notMP users, therefore the exposure time is zero and consequently the correspondingLEX,8h is zero.
This data is evaluated according to the Danish legislation [5] which states that no person maybe subjected to noise with a level higher than 85dBA in an eight hour working day. Thereforethose persons who are exposed to levels above 85dBA are considered subjects of the target pop-ulation. On the other hand, all the subjects who performed aLEX,8h of less than 75dBA areconsidered control population.
30

4.2. PILOT TEST DESIGN1 5 10 15 20 25 30 35 40 45 50 54
0
10
20
30
40
50
60
70
80
90
100
110
LEX
8h
[dB
SP
L]
Reference number of the subjectsFigure 4.1: LEX,8h al ulated from the data olle ted in the pilot test. The LEX,8h of the subje ts is sortedfrom the minimum to the maximum LEX,8h
The difference between theLEX,8h in the population would be desired to be bigger, but due tolack of subjects interested to participate in the complete investigation, this range was reduced tobe only 10dB difference between populations.Parameters AnalysisThis last step evaluates the parameters mentioned in Section 4.2.1 using the data collected fromthe questionnaire.
Regarding to the environments where MPs with headphones areused, the subjects were askedabout how often they used to listen to their MPs (rarely, often or very often) and the type ofenvironment that corresponds to the place selected (quiet,moderate or noisy).
The analysis is made according to a 3-stage analysis system that is invented. A point scale from1 to 3 corresponding 1 to the weakest stage and 3 to the strongest as it can be seen in the ques-tionnaire is used. Figure 4.2 shows the results plot as a function of the number of points getin each environment. It can be seen that the two environmentsthat get the highest number ofpoints were bus and street.
A representation of the number of MPs users for each type of MPdevices is shown in Figure4.3. The participants display a high use of MP devices when headphones are used, especially
31

CHAPTER 4. PILOT TEST0
50
100
150
Num
ber
of P
oint
s
Types of Environments
bus
stree
tbik
e
mot
orbik
eca
rtra
in
hom
e
unive
rsity
workFigure 4.2: Environments where MPs with headphones are used. Ea h subje t ould hoose more than oneenvironment.
portable MP and personal computers or laptops are the MP mostused by the population tested.Therefore it is consistent with the decision taken of using aportable MP as reference device inorder to measure the headphone sound exposure.
Regarding the type of headphones that the population uses, it can be concluded that 71.11%use intra-concha headphones, 8.89% use supra-concha headphones and 20% use circum-auralheadphones. Therefore the headphones selected in AppendixD for this pilot test are accordingto the preferences of the people that use headphones for listening to MPs.4.3 Chapter Con lusionsWhen calculating the headphone sound exposure for each subject, the same exposure level wasconsidered for the total exposure time. This assumption is only an approximation because it isnot proved that the MP users listen to the music at the same level all the time.
The users may modify the control volume position of the MP depending on the environmentwhere they are listening to music. Due to this, another headphone sound exposure evaluationtaken into account different environments is performed in alistening test that is explained innext chapter. Bus and street, which are the most common places to use the MP as it was con-cluded in this pilot test, are used as references to evaluatetheLEX,8h in a quiet/moderate andnoisy environment respectively.
Furthermore, subjects did not use their MPs or their headphones in this pilot test. This may
32

4.3. CHAPTER CONCLUSIONSPMP users PC users TV/DVD users HIFI users Mixer users
0
5
10
15
20
25
30
35
40
45
50Clasification of music player users
Num
ber
of s
ubje
cts
Type of deviceFigure 4.3: Use of MPs with headphones as a fun tion of the users preferen es. Ea h subje t had thepossibility to sele t more than one devi echange the control level setting somehow for a lower or higher setting. Therefore it is asked tothe subjects to bring their own MP, headphones and music in the listening test. Thus, a moreaccurate evaluation of the real headphone sound exposure can be made.
From the total of persons that took part of this pilot test, 18subjects (28%) are selected as controlpopulation and 26 subjects (33%)as target population. These subjects are called to participate ina hearing assessment and a headphone sound exposure evaluation, which is carry out in differentenvironments.
33


CHAPTER 5
L ISTENING TEST
This chapter describes the design of the listening test. First the method and the goals of thelistening test are described. Then, a detail description ofeach part is explained. The results ofthis listening test will be given in detail in Appendix. K.5.1 Goals of the Listening TestThe goals of the listening test are:
• To measure the listening level,LFF,Aeq, in three environments: very quiet, quiet/moderateand noisy for the control and the target population.
• To calculate theLEX,8h for both populations taken into account two environments: quiet,quiet/moderate and noisy.
• To test the hearing thresholds and the DPOAEs for both populations.5.2 Listening Test DesignThe test is made as it explained in the following lines:
First the subject is conducted to a room where an instructionpaper is given. It can be seen inAppendix H. Then the subject must fill out a short questionnaire. After this, the subject is con-ducted to an audiometer cabin where DPOAEs measurements anda pure tone audiometry areperformed. Then, a break is given to the subject to be ensure that he does not get tired and losefocus. After the break, the subject is conducted to a listening room. A control volume adjust-ment of his MP using his headphones and music is performed in different environments severaltimes. Between each volume adjustment the subject come out of the room during 1 or 2 minutes.
The paper instructions given to the subjects can be seen in Appendix H. In addition, the con-ducted guidelines followed by the instructor can be found inAppendix I.
35

CHAPTER 5. LISTENING TEST5.3 Listening Test Subje tsTo perform this listening test, 26 and 18 subjects selected from the pilot test as target and controlpopulation respectively are invited to participate in thissecond part of the investigation. Fromthese subjects, 12 and 10 subjects of the target and control population respectively agreed toparticipate.
Table K.2 and K.1 in Appendix K shows reference number, age and sex of all the subjects ofcontrol and target population who participate in the listening test respectively.5.4 First Part: Listening Test QuestionnaireThe first task is to fill out a questionnaire. This questionnaire can be seen in Appendix J.
The objective is to estimate the exposure time when using headphones for listening to musicwith a MP in a quiet/moderate and noisy environment for all the subjects. The results can beseen in Figure K.2 of Appendix K.
In this questionnaire, as well as in the pilot test, the subjects who suffer from a cold or take anymedicine or another type of drugs are rejected. Any subject was in this situation, therefore nosubject was rejected.
Moreover there are some specific questions asked to have a better overview of the hearing stateof the subjects. The answers given by the subjects can be seenin Figure K.9 in Appendix K.5.5 Se ond Part: Hearing AssessmentAn audiometry test and DPOAEs are carried out. Appendix L describes these measurementsand presents the results.
From the target population, two subjects are neglected after the performance of these two tests.Subject EDR is neglected because a deep hearing loss at high frequency in his right hear wasdetected. This audiometry was repeated twice and the results obtained were approximatelythe same. The results of his audiometry can be observed in Table L.2 in Appendix L. Thishearing loss is considered to be produced by other reasons not related to the use of MPs withheadphones, therefore this subject is neglected. Moreover, there was a problem conducting theDPOAE measurement to the subject JLS. It was seen that after the DPOAE measurement of theright ear, the measurement system was blocked. It was due to an accumulation of wax that was
36

5.6. THIRD PART: MP VOLUME ADJUSTMENTstuck in the microphone probe of the measurement system. Then, the wax was removed and themeasurement finished. Observing his results, it can be seen that there is a strong asymmetricaldifference between the right and left ear of both tests. After this examination, it is decided notto take into account this subject because there are some signs that this subject had an excessiveamount of wax in his right ear. His audiometry and DPOAE measurements can be seen in TableL.2 and Figure L.17 respectively in Appendix L.5.6 Third Part: MP Volume AdjustmentOne of the goals of this listening test is to analyze theLEX,8h of both population. This parameteris calculated following the same procedure used in the pilottest. Therefore, first the subjectmust adjust the volume of his MP, thenLFF,Aeq is measured, and finally with this level and theexposure time,LEX,8h is obtained.
The main considerations in this listening test are:
• The subjects are asked to bring their own MP, headphones and music. Since not all theMPs are portable, computers and MPs easily transported are recommended. Moreover thedevices used in the pilot test are available just in case thatthe subjects can not bring theirown devices.
• Bus and street, which are the most common places to use the MP as it was concludedin the pilot test in Chapter 4, are used as references environments to evaluate theLEX,8h
in a quiet/moderate and noisy environment respectively. Moreover the subject is askedto adjust the MP when there is not environment being simulated. The environments arepresented to the subjects randomly. Furthermore, two repetitions of each environment aresimulated. Appendix M explains in detail the listening testsetup and the simulations ofthe environments.
• For the calculation of theLEX,8h, only the quiet/moderate and the noisy environment areconsidered since a very quiet situation is considered as an unrealistic environment.
• A familiarisation process is performed before starting this part of the listening test. Itconsist of an adjustment in one of the environments. This adjustment is not taken intoaccount for the results.
TheLEX,8h obtained for all the subjects is shown in Figure 5.1. Figuresand tables of the exposurelevel and the exposure time can be found in Appendix K.
37

CHAPTER 5. LISTENING TEST5.7 Chapter Con lusionsThe data from 10 subjects of the control and 10 subjects of thetarget population are collected tobe analyzed in next chapter.
From the pure tone audiometry and DPOAE measurements, 10 hearing threshold levels (HL)and 22 DPOAE levels are obtained respectively per subject and per ear. These values are ac-cording to the frequencies selected in section 2.7 in Chapter 2.
From the headphone sound exposure evaluation, for each subject, two exposure levels (LEX,8h)and three listening levels (LFF,Aeq) are calculated. The exposure levels corresponds to a quiet/-moderate and a noisy environment. Moreover, the listening levels corresponds to a very quiet,quiet/moderate and noisy environment.
VLL DVD HDA MCK ANT DNL BTZ LRM IRS HCR60
70
80
90
100Control Population
Lex,
8h [d
B S
PL]
Quiet/moderate EnvironmentNoisy Environment
LRI CLS ERC SMN YSN NCL SUS OLV JON CLA60
70
80
90
100Target Population
Lex,
8h [d
B S
PL]
SubjectsFigure 5.1: LEX,8h al ulated for the subje ts of the target and ontrol population a ording to the dataobtained in the listening test for a quiet/moderate and a noisy environment.38

CHAPTER 6
L ISTENING TEST RESULTS
This chapter contains an evaluation of the conducted listening test in order to analyze the datacollected using an statistical tool.6.1 Listening Test AnalysisThere are four parameters tested: exposure level (LEX,8h), listening level (LFF,Aeq), hearingthreshold level (HL) and DPOAE level. Moreover, there are some factors that are controlledin the listening test. Each factor contains a number of treatments. All factors and treatmentsused in this analysis are list below:
• Factor: Populations
– Treatment: Control population
– Treatment: Target population
• Factor: Ears
– Treatment: Left ear control population (LC)
– Treatment: Right ear target population (RC)
– Treatment: Left ear control population (LT)
– Treatment: Right ear target population (RT)
• Factor: Environments
– very quiet
– quiet/moderate
– noisy
• Factor: Frequencies
– Treatment: fiwhere:i=1,2,...,10 for the HL statistical analysis.i=1,2,...,22 for the DPOAE statistical analysis.
39

CHAPTER 6. LISTENING TEST RESULTSIn order to perform this statistical study an ANalysis Of VAriance test (ANOVA) and an Inde-pendent Sample T-test are applied using the Program SPSS 14.0. For further reading on themethod, reference is made to [36]. In Appendix N and Appendix O a further explanation aboutthe ANOVA and the T-test analysis is described.6.2 Analysis of Listening LevelThe aim of this section is to determine if the listening leveldiffers among the populations andthe environments.
In this study, the parameter analyzed is theLFF,Aeq. The factors and the treatments defined arethe followings:
• Factor A: Population
– TreatmentµA1: Control population
– TreatmentµA2: Target population
• Factor B: Environments
– TreatmentµB1: Very quiet environment
– TreatmentµB2: Quiet/moderate environment
– TreatmentµB3: Noisy environment
All the subjects, regardless of the type of population that they belong to, are introduced to thethree environments simulated.
The analysis of the listening level is done to answer the nextquestions:
• Do control and target population differ significantly on their performance on theLFF,Aeq?
• Second, is there any significant difference in listening level among very quiet, quiet/mod-erate and noisy environment?
• Finally, how do the two factors: populations and the environments interact in their effectonLFF,Aeq?6.2.1 Method
Since this test has two factors, it is analyzed using a two-way ANOVA test. Therefore, it ispossible to evaluate the influence of the two factors as well as the influence of a possible inter-action between them. In order to evaluate this statistical significance the next hypotheses areformulated:
40

6.2. ANALYSIS OF LISTENING LEVEL• For factor A: Populations.
– The null hypothesis,H0,A: It states that there is not significant difference betweentheLFF,Aeq means of the two populations. It is noted as:
H0,A : µA1 = µA2.
– The alternative hypothesis,H1,A: It states that there is a significant difference be-tween theLFF,Aeq means of the two populations.
H1,A : µA1 6= µA2.
• For factor B: Environments.
– The null hypothesis,H0,B: It states that there are not significant differences amongLFF,Aeq means of the three environments.
H0,B : µB1 = µB2 = µB3.
– The alternative hypothesis,H1,B: It states that at least one of the threeLFF,Aeqmeansis different from the others.
• For interaction between factors population and environments.
– The null hypothesis,H0,AB: It states that the interaction between factor populationsand environments has a significant effect onLFF,Aeq.
– The alternative hypothesis,H1,AB: It states that the interaction between factor popu-lations and environments has not a significant effect onLFF,Aeq.6.2.2 Results
Table 6.1 presents theLFF,Aeq means across subjects for the treatments and factors definedinthis section. Moreover the two-way ANOVA test results are presented in Table 6.2. Figure6.1 illustrates the Confidence Interval (IC) and the estimatedLFF,Aeq means for the two factors:populations (left) and environments (right).
Factor B MeanLFF,Aeq (dB) Standard Deviation Number of Subjects Mean forEnvironment Control Target Control Target Control Target environment (dB)very quiet 87.82 97.29 9.99 5.75 10 10 92.96quite/moderate 94.11 98.83 5.10 4.47 10 10 96.98noisy 97.52 101.39 3.38 4.42 10 10 99.76Mean for population (dB) 93.15 99.17Table 6.1: Data olle ted from the listening test for the LFF,Aeq analysis.
41

CHAPTER 6. LISTENING TEST RESULTSSum of Squares Degrees of Freedom Mean Squares F-value p-value
Factor A: Population 388,524 1,000 388,524 11,460 0,001Factor B: Environment 483,794 2,000 241,897 7,135 0,002
Interaction AxB 72,408 2,000 36,204 1,068 0,351Error 1830,744 54,000 33,903Total 571229,936 60,000Table 6.2: Results of the LFF,Aeq analysis using two-way ANOVA statisti al method.
Figure 6.1: Representation of the listening level as a fun tion of the population (left) and the environment(right). The Null hypothesis an be reje ted if the varian es lines do not overlap in the horizontaldire tion.6.2.3 Con lusionsIn this project the level of significance used is equal to 0.05. Then, to reject a null hypothesis,the p-value in the ANOVA table must be lower than 0.05.
From Table 6.1 it can be seen that the two factors present differences among theLFF,Aeqmeans.Furthermore, it is shown in Table 6.2 that the p-value in bothcases is lower than 0.05. Then, thenull hypothesesH0,A andH0,B can be rejected. This means that there is a significant differencebetween the performance of both populations. In addition, it also can be concluded that thelistening level varies significantly among the three environments.
Since the p-value from factor population and environment interaction is higher than 0.05. It canbe concluded that the interaction between these factors hasnot significant effect on the listeninglevel performance.
The same conclusions can be observed from Figure 6.1. If the variance lines that represents
42

6.3. ANALYSIS OF EXPOSURE LEVELthe IC from the estimatedLFF,Aeq does not overlap in the horizontal direction, two means areconsidered significantly different. In this case, the variance lines does not overlap, then the pop-ulations and the environments means are considered significantly different.
In order to analyze in detail the effect ofLFF,Aeq among the three environments an IndependentSample T-test is performed. The T-test design and the results obtained are presented in Ap-pendix O.
From the T-test results shown in Tables O.1, O.2 and O.3, the next conclusions are made. Thereis not a significant difference onLFF,Aeqperformance between very quiet and quiet environmentand between quiet/moderate and noisy environment. However, there exists a difference betweenvery quiet and noisy environmentLFF,Aeq performance.6.3 Analysis of Exposure LevelThe goal of this section is to determine if theLEX,8h of the control and the target populationwould differ among the environments.
This study is similar to the sound exposure level analysis described in Section 6.2. However, inthis case the parameter analyzed is theLEX,8h. The factors and the treatments are:
• Factor A: Population
– TreatmentµA1: Control population
– TreatmentµA2: Target population
• Factor B: Environment
– TreatmentµB1: Quiet/moderate environment
– TreatmentµB2: Noisy environment
Those subjects who belong either to the control or target population are introduced to all thetreatments defined by the factor environments. Notice that now factor B has two treatments.
Since theLEX,8h of the subjects that do not use MP with headphones is equal to zero. Thesesubjects are not taken in account in this study.
The analysis of the exposure level is done to answer the next questions:
• First, do control and target population differ significantly on their performance onLEX,8h?
• Second, is there any significant difference inLEX,8h between quiet/moderate and noisyenvironment?
43

CHAPTER 6. LISTENING TEST RESULTS• Finally, how do the two factors: populations and the environments interact in their effect
onLEX,8h ?6.3.1 MethodTo evaluate the influence of factor populations, environments and the interaction between thema two-way ANOVA analysis is applied. Thus, the hypotheses formulated are:
• For factor A: Populations.
– The null hypothesis,H0,A: It states that there is not significant difference betweentheLEX,8h means of the two populations. It is noted as:
H0,A : µA1 = µA2.
– The alternative hypothesis,H1,A: It states that there is a significant difference be-tween theLEX,8h means of the two populations.
H1,A : µA1 6= µA2.
• For factor B: Environments.
– The null hypothesis,H0,B: It states that there is not a significant difference betweentheLEX,8h means of the two environments.
H0,B : µB1 = µB2.
– The alternative hypothesis,H1,B: It states that there is a significant difference be-tween theLEX,8h means of the two environments.
H1,B : µB1 6= µB2.
• For interaction between factor populations and environments.
– The null hypothesis,H0,AB: It states that the interaction between factor populationsand environments has a significant effect onLEX,8h.
– The alternative hypothesis,H1: It states that the interaction between factor popula-tions and environments has not a significant effect onLEX,8h.6.3.2 Results
Table 6.3 shows the meanLEX,8h for the treatments and factors considered. In addition, in Table6.4 the results from the ANOVA analysis are presented.
A comparison of the mean listening levels and the IC of the twotreatments of factor popula-tion(left) and environment (right) can be shown in Figure 6.2.
44

6.4. ANALYSIS OF HEARING THRESHOLDS AND DPOAESFactor B MeanLEX,8h (dB) Standard Deviation Number of Subjects Mean forEnvironment Control Target Control Target Control Target environments (dB)quite/moderate 82.86 89.68 6.17 3.58 5 10 86.27noisy 78.31 88.33 7.76 9.55 5 10 83.32Mean for population (dB) 77.58 89.00Table 6.3: Data olle ted from the listening test for the LEX,8h analysis. The subje ts that do not use MPare nor in luded in this study.
Sum of Squares Degrees of Freedom Mean Squares F-value p-valueFactor A: Population 432,944 1,000 432,944 8,439 0,007
Factor B: Environment 0,872 1,000 0,872 0,017 0,897Interaction AxB 124,639 1,000 124,639 2,429 0,130
Error 1539,139 30,000 51,305Total 254214,503 34,000Table 6.4: Results of the LEX8h analysis using two-way ANOVA statisti al method6.3.3 Con lusions
Regarding the data exposed in Table 6.3 and Figure 6.2 (left), it can be seen that theLEX8h meansof factor populations are significantly different. Moreover the p-value of this factor, shown inTable 6.4, is equal to 0.007. This means thatH0,A can be rejected. Therefore theLEX8h variesdepending on the population.
The means of the factor environments are also different. However Figure 6.2 (right) shows thatthe IC are almost overlapped. Since the p-value is significantly higher than 0.05,H0,B is notrejected. Then it can be concluded thatLEX,8h do not depend on the environment.
From Table 6.4, it can be appreciate that the interaction effect between factor environments andpopulations is not present since the p-value is equal to 0.130.6.4 Analysis of Hearing Thresholds and DPOAEsIn this section the data obtained from the audiometric testsand the DPOAE measurements isanalyzed. Since the procedure followed is similar, both analysis are explained in the followinglines.
The purposes of this section are:
• To analyze if the HL differs for both populations and for the 10 frequencies tested.
• To analyze if the DPOAE level differs for both populations and for the 22 frequencies
45

CHAPTER 6. LISTENING TEST RESULTSFigure 6.2: Representation of LEX,8h in fun tion of the population (left) and the environment (right). Thenull hypothesis an be reje ted if the varian es lines do not overlap in the horizontal dire tion.
tested.
There are two factors: ears and frequencies. The parameter analyzed is HL or DPOAE leveldepending on the test. The treatments contained by the two factors are listed below:
• Factor A: Ears
– TreatmentµA1: LC
– TreatmentµA2: RC
– TreatmentµA3: LT
– TreatmentµA4: RT
• Factor B: Frequencies
– TreatmentµBi: f i
where:i=1,2,...,10 for the HL statistical analysis.i=1,2,...,22 for the DPOAE statistical analysis.
It should be noticed that the range of frequencies tested is different in the audiometric test thanin the DPOAE measurements.
Figures 6.3 and 6.4 present the HL mean and the standard deviation of the two ears of bothpopulations along the frequencies.
46

6.4. ANALYSIS OF HEARING THRESHOLDS AND DPOAES250 500 750 1k 1.5 k 2 k 3 k 4 k 6 k 8 k
−15
−10
−5
0
5
10
15
20
25
Frequency [Hz]
Thr
esho
ld [d
B H
L]
Mean Right Ear Control PopulationMean Left Ear Control Population
Figure 6.3: Representation of the HL mean and the standard deviation of left and right ear of ontrolpopulation.The data collected from the DPOAE test is presented in Figures 6.5 and 6.6. It representsthe DPOAE levels of left and right ear of both populations andfor the frequencies defined as√
f 1. f 2.
All these data is calculated by averaging across the ears of 10 subjects of control population and10 subjects of target population. All these values are shownin Table P.1 and P.2 of Appendix P.
From an analysis of the data presented above, the next questions can be stated:
• First, do LC, RC, LT and RT ears differ significantly on their HL performance? Do theydiffer on DPOAE level performance?.
• Second, is there any significant difference in HL among the frequencies tested? Is thereany difference in DPOAE level?
• Third, how do the two factors: ears and frequencies interactin their effect on HL? Howdo they interact in their effect on DPOAE level?6.4.1 Method
It is desired to analyze the performance of the parameter HL or DPOAE level on the factors earsand frequencies. Thus, a two-way ANOVA test is applied individually for HL and DPOAE leveldata.In next lines the hypotheses that corresponds to the hearingthresholds analysis are enunciated:
47

CHAPTER 6. LISTENING TEST RESULTS250 500 750 1k 1.5 k 2 k 3 k 4 k 6 k 8 k
−15
−10
−5
0
5
10
15
20
25
Frequency [Hz]
Thr
esho
ld [d
B H
L]
Mean Right Ear Target PopulationMean Left Ear Target Population
Figure 6.4: Representation of the HL mean and the standard deviation of left and right ear of target popu-lation.• For factor A: Ears.
– The null hypothesis,H0,A: It states that there are not significant differences amongthe HL means of the four ears. It is noted as:
H0,A : µA1 = µA2 = µA3 = µA4.
– The alternative hypothesis,H1,A: It states that at least one of the ears means is dif-ferent from the others.
• For factor B: Frequencies.
– The null hypothesis,H0,B: It states that there are not significant differences amongthe HL means of the ten frequencies.
H0,B : µB1 = µB2 = µBi . where i is the number of frequencies.
– The alternative hypothesis,H1,B: It states that at least one of the HL means of theten frequencies is different from the others.
• For interaction between factor ears and frequencies.
– The null hypothesis,H0,AB: It states that the interaction between factor ears andfrequencies has a significant effect on HL.
– The alternative hypothesis,H1,AB: It states that the interaction between factor earsand frequencies has not a significant effect on HL.
Since the hypotheses of DPOAE analysis are similar, they arenot described in this report.
48

6.4. ANALYSIS OF HEARING THRESHOLDS AND DPOAES1000 1500 2000 3000 4000 6000
−20
−15
−10
−5
0
5
10
15
20
25
30
Frequency [Hz]: geometric mean
DP
OA
E [d
B S
PL]
Mean DPOAE Left Ear Control PopulationMean DPOAE Right Ear Control PopulationMean Noise DPOAE Left Ear Control PopulationMean Noise DPOAE Right Ear Control Population
Figure 6.5: Representation of the DPOAE mean and the standard deviation for left and right ear of ontrolpopulation.6.4.2 ResultsIn the following lines the results obtained from the two-wayANOVA test are presented forhearing thresholds and DPOAE analysis.Hearing Thresholds resultsIn Table P.1 of Appendix P it is shown the HL means for the four ears and for the ten frequenciestested. Moreover, Table 6.5 presents the two way ANOVA test results obtained. The HL meansand the IC of the factors ears and frequencies are shown in Figure 6.7.
Sum of Squares Degrees of Freedom Mean Squares F-value p-valueFactor A: population 934,000 3,000 311,333 8,367 0,000Factor B: frequency 2942,750 9,000 326,972 8,788 0,000
Interaction AxB 1047,250 27,000 38,787 1,042 0,410Error 13395,000 360,000 37,208Total 21800,000 400,000Table 6.5: Results of the HL analysis using two-way ANOVA statisti al method
49

CHAPTER 6. LISTENING TEST RESULTS1000 1500 2000 3000 4000 6000
−20
−15
−10
−5
0
5
10
15
20
25
30
Frequency [Hz]: geometric mean
DP
OA
E [d
B S
PL]
Mean DPOAE Left Ear Target PopulationMean DPOAE Right Ear Target PopulationMean Noise DPOAE Left Ear Target PopulationMean Noise DPOAE Right Ear Target Population
Figure 6.6: Representation of the DPOAE mean and the standard deviation for left and right ear of targetpopulation.DPOAE resultsTable P.2 of Appendix P shows the DPOAE means of the four populations and for the 22 fre-quencies tested. In addition, Table 6.6 presents the two wayANOVA test results obtained. Arepresentation of the DPOAE means and the IC of the two factors analyzed is presented inFigure 6.8.
Sum of Squares Degrees of Freedom Mean Squares F-value p-valueFactor A: ears 1387,206 3,000 462,402 11,803 0,000
Factor B: frequencies 5359,802 21,000 255,229 6,515 0,000Interaction AxB 1088,462 63,000 17,277 0,441 1,000
Error 31026,891 792,000 39,175Total 47890,850 880,000Table 6.6: Results of DPOAE level analysis using two-way ANOVA statisti al method6.4.3 Con lusions
This section presents the conclusions obtained from the HL and DPOAE analysis.HL Con lusionsFrom Table 6.5 it can be seen that the p-value for factor ears is less than 0.05. Then, the nullhypothesisH0,A can be rejected. This means that at least one of the four treatments of factor
50
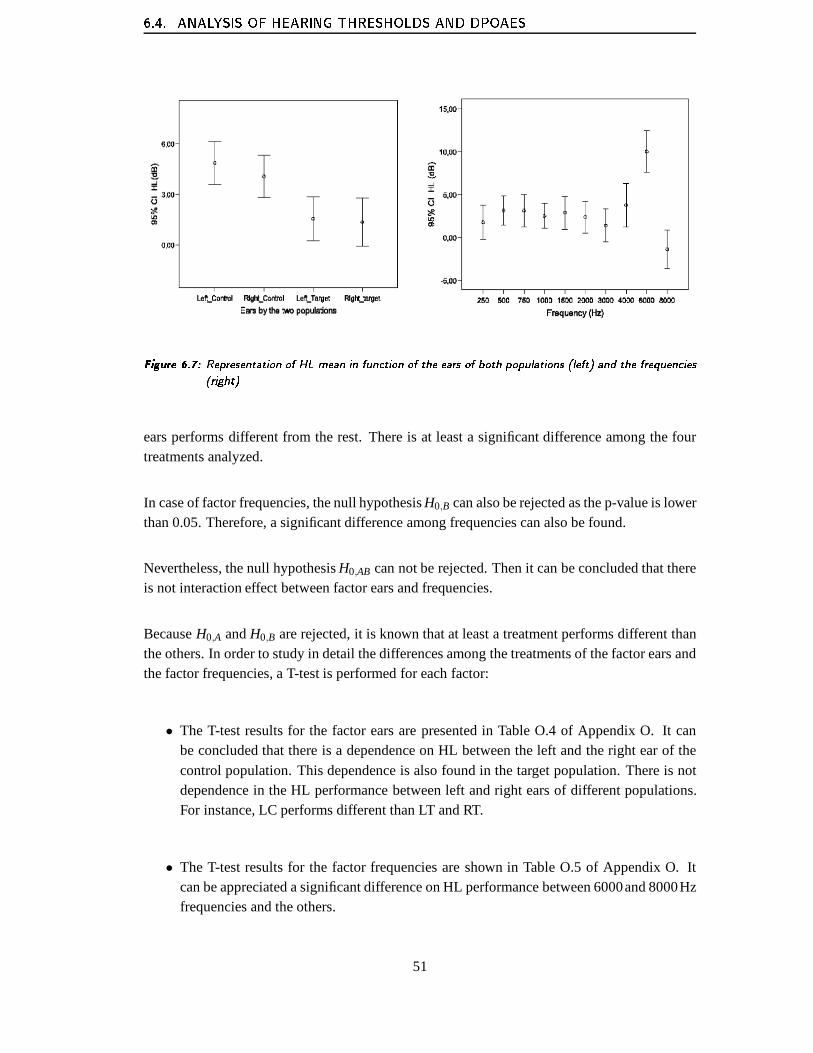
6.4. ANALYSIS OF HEARING THRESHOLDS AND DPOAESFigure 6.7: Representation of HL mean in fun tion of the ears of both populations (left) and the frequen ies(right)ears performs different from the rest. There is at least a significant difference among the fourtreatments analyzed.
In case of factor frequencies, the null hypothesisH0,B can also be rejected as the p-value is lowerthan 0.05. Therefore, a significant difference among frequencies can also be found.
Nevertheless, the null hypothesisH0,AB can not be rejected. Then it can be concluded that thereis not interaction effect between factor ears and frequencies.
BecauseH0,A andH0,B are rejected, it is known that at least a treatment performs different thanthe others. In order to study in detail the differences amongthe treatments of the factor ears andthe factor frequencies, a T-test is performed for each factor:
• The T-test results for the factor ears are presented in TableO.4 of Appendix O. It canbe concluded that there is a dependence on HL between the leftand the right ear of thecontrol population. This dependence is also found in the target population. There is notdependence in the HL performance between left and right earsof different populations.For instance, LC performs different than LT and RT.
• The T-test results for the factor frequencies are shown in Table O.5 of Appendix O. Itcan be appreciated a significant difference on HL performance between 6000and 8000Hzfrequencies and the others.
51
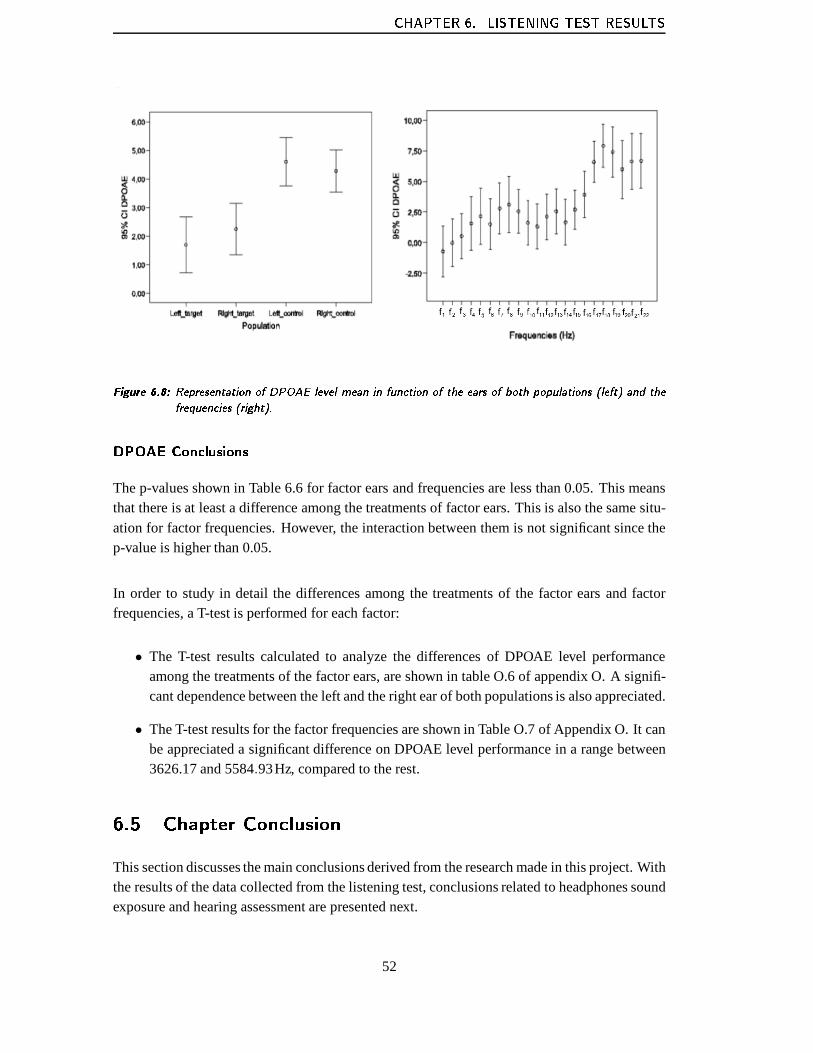
CHAPTER 6. LISTENING TEST RESULTSFigure 6.8: Representation of DPOAE level mean in fun tion of the ears of both populations (left) and thefrequen ies (right).DPOAE Con lusionsThe p-values shown in Table 6.6 for factor ears and frequencies are less than 0.05. This meansthat there is at least a difference among the treatments of factor ears. This is also the same situ-ation for factor frequencies. However, the interaction between them is not significant since thep-value is higher than 0.05.
In order to study in detail the differences among the treatments of the factor ears and factorfrequencies, a T-test is performed for each factor:
• The T-test results calculated to analyze the differences ofDPOAE level performanceamong the treatments of the factor ears, are shown in table O.6 of appendix O. A signifi-cant dependence between the left and the right ear of both populations is also appreciated.
• The T-test results for the factor frequencies are shown in Table O.7 of Appendix O. It canbe appreciated a significant difference on DPOAE level performance in a range between3626.17 and 5584.93Hz, compared to the rest.6.5 Chapter Con lusion
This section discusses the main conclusions derived from the research made in this project. Withthe results of the data collected from the listening test, conclusions related to headphones soundexposure and hearing assessment are presented next.
52

6.5. CHAPTER CONCLUSIONThe number of subjects tested was 20, which is not considereda number high enough to con-clude definitive assumptions regarding either the headphone sound exposure or the hearing as-sessment.6.5.1 Con lusions of Headphone Sound ExposureIt was observed that the subjects of both populations adjusted the listening level depending onthe environment. In general terms, a clear progression to higher volume settings is seen whenincreasing the external noise to which they are exposed to.
A significant difference was found in the listening level between a very quiet and a noisy envi-ronment. However, this difference was not between a very quiet and a moderate, or between amoderate and a noisy environment.
Nevertheless, it has to be noticed that not all the subjects responds in the same manner. Controlpopulation presents volume settings significantly higher than the target population for each en-vironment. This difference can be appreciated specially ina very quiet environment, where thecontrol population differs 10dB from the target population.
Related to exposure levels, it can be concluded that the target population is sightly more exposedthan the control. A difference in the exposure time is not clearly observed. In fact, only onesubject, which is YSN, showed a exposure time representative higher compare to the controlpopulation. Therefore, the listening level is the parameter which makes the difference betweenboth populations in terms of exposure level.6.5.2 Validity and Con lusions of Hearing AssessmentRegarding the results from the listening test it can be said that the resolution of the methods usedfor the hearing assessment implies not very precise resultsdue mainly to two reasons: First, thenumber of subjects tested for the investigation, and secondthe resolution of the audiometry testand DPOAEs measurements. Selecting a higher precision, better results could be expected.
The accuracy of the Bracketing method presented in Chapter 2for the pure tone audiometry is0.2 dB, but this accuracy does not correspond exactly to the method applied in this project. Inthat study [34], the attenuation step size varies during the threshold determination from 5dBto 2.5dB. By contrast, in this project a fixed step size of 5dB is selected. It leads to a non sogood accuracy. The effects of this step size can be reflected in the standard deviation of theaudiometry data. Nevertheless, the right ear of the controlpopulation presents at 6KHz higherstandard deviation compare to the rest of frequencies of that ear. Therefore the performance ofthe subjects of that population at 6KHz is not as homogeneousas for the rest of frequencies.
53

CHAPTER 6. LISTENING TEST RESULTSBy the analysis of the audiometries it is seen that a mild hearing damage is appreciated at 6KHzfor both populations. However it can not be concluded that itis due to the use of MPs withheadphones because it is present in both populations. For the rest of frequencies, there is notany high variation respect to the reference 0dB HL.
It is seems that the hearing threshold of the different populations tend to follow similar fre-quency patterns giving representative results. By contrast, a DPOAEs mean of a population cannot be representative due to the big differences between theDPOAE levels of subjects withina same population. This fact can be appreciated in the standard deviation values. Moreover,some investigations [8] state that a DPOAE is considered present when it is at least 6dB abovethe noise floor. If this criteria is applied to the DPOAEs meanof the populations, DPOAEs arepresent. However, this should be applied to each individualinstead to an average population.Therefore observations of the average across the DPOAE values of the ten subjects of each pop-ulation does not give a clear picture of the effects of the exposure. To have representative resultsa large number of subject should be tested.
From the statistical analysis of DPOAE, its is concluded that there is a significant differencebetween both populations. Moreover the results show that athigh and low frequencies theDPOAEs levels of the subjects are significantly different. This conclusion is expected since theDPOAEs have different amplitudes in different frequencies. Specially DPOAEs are not reliableat low frequencies since the noise of the measurement becomes higher at low frequency over-lapping the DPOAEs.
54

CHAPTER 7
CONCLUSIONS
The aim of the project is to investigate the possible hearingdamage due to the use of MPs withheadphones when listening to music. In order to achieve thisgoal, two groups of subjects de-noted as control and target populations were classified. This was done in a pilot test, where theheadphone sound exposure level was calculated by means of the exposure time and the listeninglevel.
A 33% of the subjects tested, were users highly exposed according to 85dB exposure level statedin the Danish legislation. This group was defined as the target population. Moreover, a 47% ofthe subjects reported a moderate exposure, whereas a 20% were non exposed. From these twolast groups, either the subjects whose exposure was lower than 75dB, or the subjects who werenot users of MPs with headphones, are named as the control population.
After this, a listening test was performed for the two populations to analyze the headphonesound exposure in a more accurately way. In this case, an individual study of the exposure levelin different environments is performed. Moreover a hearingassessment is carried out.
The headphone sound exposure of the listening test consist of a questionnaire and a controlvolume adjustment test. From this part, the listening habits, the listening level and the expo-sure time are obtained. This was done in three different environments which are very quiet,quiet/moderate and noisy. Concerning to the hearing assessment, an pure tone audiometry andDPOAE measurements were carried out.
All the data collected from target and control population were compared to investigate the pos-sible differences regarding to the parameters measured. The final conclusions obtained are:
• The contribution of headphone sound exposure to a possible hearing loss (NIHL) is asimportant as the contribution of occupational noise exposure, because the sound pressurelevels produced by the listening devices tested can reach values considerably high. Theselistening devices were able to produce sound pressure levels range from 91dB to 109dB.
• The environment around a person affects the preferred volume setting that this personselect in his MP specially when the environment becomes noisy. Moreover, users of MPswith headphones tent to listen to music at higher volume settings than the non users.
55

CHAPTER 7. CONCLUSIONS• Potential users of MPs with headphones are more exposed thanthe non potential users
mainly because they set higher volume settings, although their exposure times are similar.
• A mild hearing loss was found in the subjects at 6kHz, howeverit can not be concludedthat this damage is due to the use of MPs with headphones, because it is present for ex-posed and non exposed populations.
For all the reasons stated in this chapter, it is concluded that this study only represents a hearingstate from a group which could be considered in terms of hearing, as being within an averagepopulation with a slight hearing loss in the frequency of 6KHz. Although the subjects, theexposure times and noise levels measured may not be fully representative of an average study,there is no reason to believe that the values obtained are atypical for young people.
56

BIBLIOGRAPHY
[1] Cross section of the organ of corti.http://en.wikipedia.org/wiki/Organ_of_Corti .
[2] Sound data base.http://freesound.iua.upf.edu/index.php .
[3] J.L. Flanagan A Glorig, L.H. Whitney and N. Guttman. Hearing studies of noise on tele-phon operators.Journal of Speech and Hearing Research, 12:169–178, 1969.
[4] M. Baiamonte F. Mauli A. Peretti, F. Pedrielli and A. Farina. Headphone noise: occupa-tional noise exposure assessment for communication personnel. Euronoise Naples 2003,2006.
[5] Arbejdstilsynet. Atvejledning d.6.1 (sec. 3).http://www.at.dk/sw10715.asp , 2002.
[6] Dave Berriman.Headphones.Audio and hi-fi handboook pp.310-319. Oxford: Newnes,1998, 3rd edition, 1998.
[7] James Blauert.Spatial Hearing.The Psychophysics of Human Sound Localization. Mas-sachusetts Institute of Technology, revised edition edition, 1997.
[8] A. Laura Clark. Otoacoustic emission testing in the early identification ofnoise-inducedhearing loss in South African mineworkers. PhD thesis, University of Pretoria, 2004.
[9] W. Clark. Noise exposure from leisure activities: A review. Journal of the Acoustical
Society of America, 90:175–181, September 1991.
[10] P. Olkinuora E. Airo, J. Pekkarinen. Listening to musicwith earphones: An assessment ofnoise exposure.Acustica - Acta Acustica, 82:885–894, February 1996.
[11] B. J. Fligor. Does earphone type affect risk for recreational noise-induced hearing loss?Ear and Hearing, 25(6):513–527, 2006.
[12] E. Andrade F.P. Marques. Exposure to occupational noise: otoacoustic emissions testalterations.Rv. Bras. Otorrinolaringology,, 72(3):362–366, 2006.
[13] Stanley A. Gelfand.Essentials of Audiology. Thieme, fist edition, 1997.
[14] Stanley A. Gelfand.Hearing: An Introduction to Psychological and Physiological Acous-tics. Dekker, 1998.
[15] Thomas Graven-Nielsen.Personnal communication with Thomas Graven-Nielsen. PhDthesis, Laboratory or experimental pain research center for sensory-motor interaction, Aal-borg University, 2005.
57

BIBLIOGRAPHY[16] James Wilbur Hall. Handbook of Otoacoustic Emissions. Thomson Delmar Learning,
2000.
[17] Manual head and torso simulator. brüel & kjær. type 4128c.
[18] Toni Hirvonen.Headphone Listening Methods. PhD thesis, Helsinki University of Tech-nology, 2002.
[19] Standard iec 268-7. sound system equipment-headphones and earphones, 1996.
[20] Standard iec 61672-1. electroacoustics - sound level meters - part 1: Specifications, 2002.
[21] Standard iso 11904-1. acoustics - determination of sound immission from sound sourcesplaced close to the ear. part 1: technique using a microphonein a real ear(mire technique,2004.
[22] Standard iso 11904-2. acoustics - determination of sound immission from sound sourcesplaced close to the ear. part 2: Technique using a manikin, 2004.
[23] Standard iso 1999. acoustics - determination of occupational noise exposure and estimationof noise-induced hearing impairment, 1990.
[24] Standard iso 389-7. acoustics - reference zero for the calibration of audiometric equip-ment. part 7: Reference threshold of hearing under free-field and diffuse-field listeningconditions, 2005.
[25] Standard iso 389-8. acoustics - reference zero for the calibration of audiometric equipment.part 8: Reference equivalent threshold sound pressure levels for pure tones and circumauralheadphones, 2004.
[26] Standard iso 8253-1. acoustics - audiometric test methods - part 1: Basic pure tone air andbone conduction threshold audiometry, 1993.
[27] Standard itu t 1993. international telecommunicationunion recommendation p.57, 1993.
[28] L. M. Heller J. Lapsley, L. Marshall and L.M. Hughes. Low-level otoacoustic emissionsmay predict susceptibility to noise-induced hearing loss.April 2006.
[29] K. Broughton Jacqueline A. Assessment of the noise exposure of call centre operators.British Occupational Hygiene Society, 46(8):653–661, 2002.
[30] K. Burk K. Yaremchuk, L. Dickson. Noise level analysis of commercially available toys.Department of Audiology. Henry Ford Hospital, March 1997.
[31] D.T. Kemp. Otoacoustic emissions, their origin in cochlear function, and use.British
Medical Bulletin,, 63:223–241, 2002.
[32] E. L. LePage and N.M. Murray. Latent cochlear damage in personal stereo users: a studybased on click-evoked otoacoustic emissions.The Medical Journal of Australia, 169:599–592, 1998.
58

BIBLIOGRAPHY[33] L. M. Luxon. Disorders of hearing and balance.Reviews in Clinical Gerontology; Univer-
sity College London, UK, 8:31U43, 1998.
[34] Morten Lydof. The threshold of hearing & contours of equal loudness - a study of mea-suring methods and normal hearing. PhD thesis, Aalborg University, 1999.
[35] V. V. Mattila and N. Zacharov. GlsU a generalised listener selection procedure.Journalof the Audio Engineering Society, 49(546), 2001.
[36] Douglas C. Montgomery.Design and Analysis of Experiments. John Wiley & Sons Inc,6th edition, 2005.
[37] Brian C. J. Moore.An Introduction to Psycology of Hearing. Elsevier Academic Press,5th edition, 2004.
[38] Rodrigo Ordo nez.Temporary Changes in Human Hearing Caused by Intenses Sounds.PhD thesis, Aalborg University, 2005.
[39] D. Nondahl. Recreational firearm use and hearing loss.American Medical Association,March 2007.
[40] C.A. Poldy. Headphones.Loudspeaker and Headphone Handbook pp. 493-574. FocalPress, 2nd edition, 1994.
[41] D. Hammershøi R. Ordoñez, K. Reuter. Hearing damage by personal stereo: A literaturereview. Acoustics Department, Aalborg University, 2006.
[42] D. Hammershøi R. Ordoñez, K. Reuter. Sound exposure by personal stereo, field study ofyoung people in denmark.Acoustics Department, Aalborg University, 2006.
[43] Karen Reuter.Over-Exposure Effects on the Distortion Product OtoAcoustic Emission:Broadband and Finestructure. PhD thesis, Aalborg University, 2006.
[44] H.S. Cohen R.W. Alexander, A.H. Koening and C.P. Lebo. The effects of noise on telephonoperators.Journal of Occupational Medicine, 21(1):21–25, 1979.
[45] L. Wang and N. Le Goff.Investigation of the properties of otoacoustic emissions. PhDthesis, Aalborg University, 2002.
59


Part IIAppendix
61


APPENDIX A
ASSESSMENTTECHNIQUES
PARAMETERS
This appendix shows a summary of the parameters selected forboth hearing assessment methodsselected in Chapter 2.A.1 Audiometry
• Method: Fixed discrete pure tone audiometry where, for eachfrequency, the sound ispresented monaurally through headphones to the subject.
• Sound stimuli: Pure tones of a time length of 300ms are presented at 250,750, 500, 1000,1500, 2000, 3000, 4000, 6000 and 8000Hz.
• Patient instructions: The subject is instructed to press the button when hearing the soundstimulus, and to not press it when do not hear it.
• Familiarization process: A familiarization is carried outto let the subject get used to thetask. This is done by means of a threshold determination using a pure tone of 40dB. Afterthe familiarization, the first tone presented is played at higher level than the level recordedwhen the button was not pressed in the last threshold determination.
• Attenuation step size: The sound stimulus is presented at anaudible level of 40dB. Then,if the subject is able to hear the stimulus, a descent by stepsof 10dB is performed untilthe subject does not hear it. Then an increasing of 5dB is performed.
• Threshold determination: The threshold is determined whenthe subject responds twice ina row the same level before he does not hear the signal.A.2 DPOAE Measurements
• OAEs: DPOAEs are selected, where the distortion product at 2f1− f2 due to the inter-modulation between two tones along the basilar membrane aremeasured.
• A fixed frequency ratio off2/ f1 = 1.22 is set for all the measurements.
63

APPENDIX A. ASSESSMENT TECHNIQUES PARAMETERS• The level of the two pure tones was 65 and 45dB SPL forL1 andL2 respectively. This
values are kept constant for all the measurements.
• The equipment is able to test frequencies from 635 to 3943. The frequencies are obtainedfrom f2 = 1001-6165Hz. This allows to test the state of the hearing at635, 696, 769, 830,903, 1001, 1074, 1172, 1270, 1404, 1526, 1648, 1807, 1965, 2148, 2344, 2563, 2795,3027, 3308, 3625, and 3493kHz.
64

APPENDIX B
TYPES OF HEADPHONES
This appendix present a classification of the different types of headphones according to thestandard ITU-T-1993 [27].B.1 Introdu tionHeadphones (also known as earphones, stereo phones or headsets) are a pair of transducers thatreceive an electrical signal from a MP or receiver and use speakers placed in close proximity tothe ears to convert the signal into audible sound waves [19].
Important advantages of these devices are their privacy andportability characteristics. Moreoverheadphones do not excite room resonances, therefore it gives a more accurate acoustic sense.
Transducers commonly used in headphones are isodynamic, dynamic for example moving-coil,electrostatic and electret. A more deep explanation of the mechanical and electrical properties ofheadphones and transducers can be found in Poldy [40] but it is not examined in this appendix.B.2 Headphone CategoriesHeadphones can be divided in five categories based on their structural properties as it is ex-plained in the standard ITU-T-1993 [27].
Likewise, headphones can be classified as open or closed headphones.
Open headphone refers to an intentional leakage built in theback of the headphone cup. There-fore this kind of headphones are provided of an intentionally acoustic path between the externalenvironment and the ear canal [27]. By contrast, closed earphones are characterized becausethey prevent any acoustic coupling between the external environment and the ear canal [27].Although they are not completely airtight they can be considered nominally sealed. This kind ofheadphones are very good at containing the sound away from others and insulating the listenerfrom outside sounds.
65

APPENDIX B. TYPES OF HEADPHONESStandard ITU-T-93 [27] states that circum-aural, supra-aural, intra-concha andinsert head-phones can be open and closed, whereas supra-concha headphones can only be open.
Circum-aural HeadphonesCircum-aural headphones are defined as those headphones which enclose the pinna and seat onthe surrounding surface of the head. Contact to the head is normally maintained by compliantcushions. This kind of headphones may touch, but not significantly compress the pinna [27].
So long as the seal is effective, the frequency response is essentially flat down to a low frequencywhich is dependent only on the degree of sealing. A poor seal due to inadequate headband pres-sure can cause modifications in the headphone response.
The main disadvantage of this type of headphones is that theytent to be heavier and requiredgreater headband pressure. Moreover they also can make the ears hot and uncomfortable [6]
Supra-aural HeadphonesSupra-aural headphones are defined according to the standard ITU-T-1993 [27] as headphoneswhich rest upon the pinna and have an external diameter or maximum dimension of at least45mm.
Compare to circum-aural headphones, supra-aural models are lighter, with smaller cushions, anddo not surround the whole ear. They only cover the concha. Thecushion is flat and it is placedon top of the ear. Therefore supra-aural headphones are morecomfortable than circum-auralheadphones. However the frequency response of a supra-aural headphone is more dependent onthe headphone placement than in the case of circum-aural headphones [40].
Intra-concha headphonesIntra-concha headphones are intended to rest within the concha cavity of the ear. They have anexternal diameter (or maximum dimension) of less than 25mm but are not made to enter the earcanal [27].
This kind of headphones are inserted at the entrance of the ear canal and are supported by thecartilage of the concha. Compared to the previous types thismodel is very smaller and portable.Nevertheless they can be uncomfortable to some people and due to the size.
Insert headphonesInsert headphones are those headphones designed to enter partially or completely into the earcanal [27], thus the sound is almost conducted directly into the ear canal. These models providea good insulation from external sound. They are characterized because the small size of theirtransducers. This type of headphones are usually needed forprofessional issues.
66
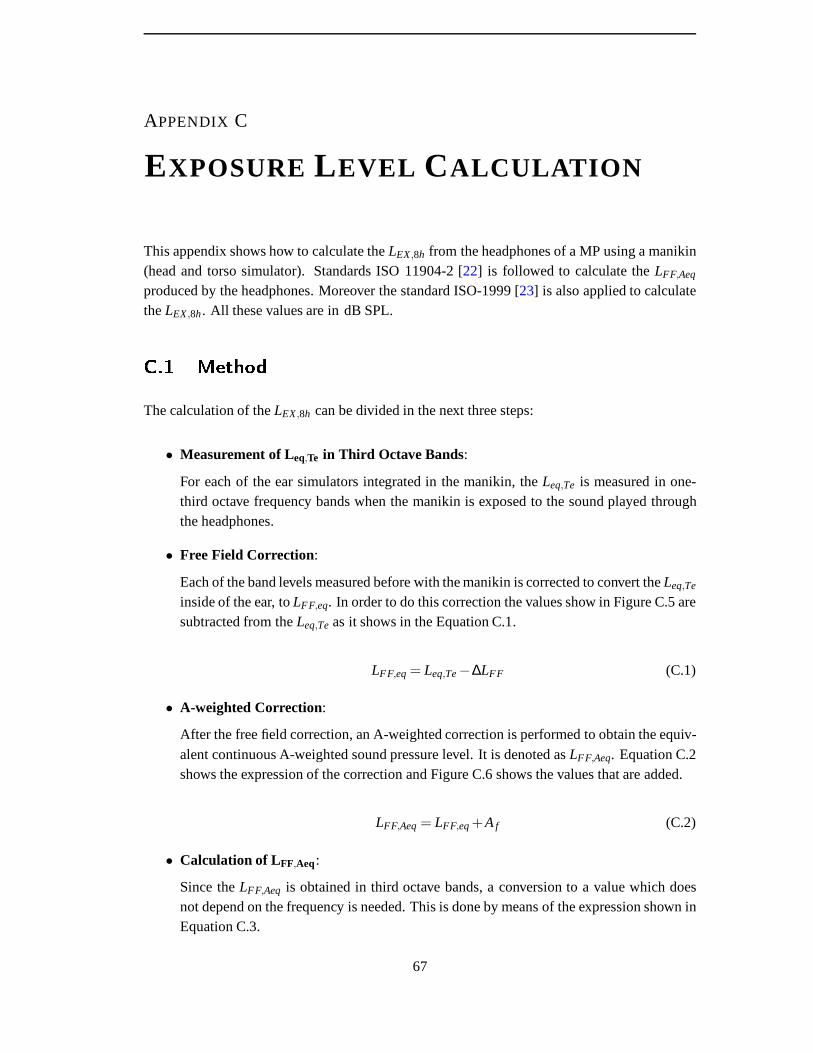
APPENDIX C
EXPOSURE L EVEL CALCULATION
This appendix shows how to calculate theLEX,8h from the headphones of a MP using a manikin(head and torso simulator). Standards ISO 11904-2 [22] is followed to calculate theLFF,Aeq
produced by the headphones. Moreover the standard ISO-1999[23] is also applied to calculatetheLEX,8h. All these values are in dB SPL.C.1 MethodThe calculation of theLEX,8h can be divided in the next three steps:
• Measurement of Leq,Te in Third Octave Bands:
For each of the ear simulators integrated in the manikin, theLeq,Te is measured in one-third octave frequency bands when the manikin is exposed to the sound played throughthe headphones.
• Free Field Correction:
Each of the band levels measured before with the manikin is corrected to convert theLeq,Te
inside of the ear, toLFF,eq. In order to do this correction the values show in Figure C.5 aresubtracted from theLeq,Te as it shows in the Equation C.1.
LFF,eq= Leq,Te−∆LFF (C.1)
• A-weighted Correction:
After the free field correction, an A-weighted correction isperformed to obtain the equiv-alent continuous A-weighted sound pressure level. It is denoted asLFF,Aeq. Equation C.2shows the expression of the correction and Figure C.6 shows the values that are added.
LFF,Aeq= LFF,eq+Af (C.2)
• Calculation of LFF,Aeq:
Since theLFF,Aeq is obtained in third octave bands, a conversion to a value which doesnot depend on the frequency is needed. This is done by means ofthe expression shown inEquation C.3.
67

APPENDIX C. EXPOSURE LEVEL CALCULATIONLFF,Aeq= 10log∑
f
10LFF,Aeq (C.3)
• Calculation of LEX,8h:
In order to calculate the sound exposureLEX,8h, Equation C.4 has to be applied
LEX,8h = LFF,Aeq+10log
(
TeTo
)
(C.4)
whereTeis the time that the person is exposed to his headphones in hours per day andTocorresponds to 8 hours.
As an example, the effect of these different steps has been applied to a measurement carried outwith a portable MP and its headphones. Next sections show theequipment, the setup and theresults.C.2 Setup and EquipmentTable C.1 lists the equipment used in these measurements andFigure C.1 illustrates the setup.
The measurements are done using the control volume position19 of the portable MP, with themusic sample “Help” from “The Beetles” and with an integration time forLeq,Te measurementof 60seconds. Furthermore a exposure time of 4 hours per day is used to calculate theLEX,8h.C.3 ResultsSince the data ofLeq,Te, LFF,eq, LFF,Aeq are frequency-dependent, the results are shown in thirdoctave bands. Moreover an average between the measurementsobtained from right and left earis done for each plot.
Figure C.2 shows theLeq,Te measured by the microphones placed on the ears of the manikin.Figure C.3 illustrates theLFF,eq after the free field correction. Figure C.4 shows theLFF,Aeqafterthe A-weighted correction.
Finally, the calculated value of theLFF,Aeq is 103.16dB SPL, and theLEX,8h is 100.15dB SPL.
68

C.3. RESULTSItem Model LAB-Nr:Head and Torso Simulator B&K 4128 08453060Portable MP Creative MuVo V200 215741Headphones Creative MuVo V200 215741Measurement System 0.1dB Harmonie 33964PC Fujitsu (laptop) -1600MB RAM, Intel M 760MHz 33964Table C.1: Equipment used for the measurements of the Leq,Te
outin out
out in
01 dB
Symphonie
Head and Torso Simulator
B&K 4128
PC
−
MP Figure C.1: Setup used for the measurements of the Leq,Te
69

APPENDIX C. EXPOSURE LEVEL CALCULATION16 31.5 63 125 250 500 1k 2k 4k 8k 16k
0
20
40
60
80
100
120
Leq,
60s
[dB
SP
L]
Frequency [Hz]Figure C.2: Leq,60s in third o tave bands measured by the mi rophones pla ed on the ears of the manikinwith the Creative MuVo V200 portable MP and its headphones. The ontrol volume positionsele ted for the measurement is 19 and the integration time is 60seconds. The data show in thisgraph is an average of the right and left ear.
70

C.3. RESULTS16 31.5 63 125 250 500 1k 2k 4k 8k 16k
0
20
40
60
80
100
120
LeqF
F,6
0s [
dB S
PL]
Frequency [Hz]Figure C.3: LeqFF,60s in third o tave bands al ulated after the free �eld orre tion. The data after the free�eld orre tion is shown in Figure C.2. The data show in this graph is an average of the rightand left ear.16 31.5 63 125 250 500 1k 2k 4k 8k 16k
0
20
40
60
80
100
120
LAeq
FF
,60s
[dB
SP
L]
Frequency [Hz]Figure C.4: LAeqFF,60s in third o tave bands al ulated after the free �eld orre tion and the A-weighted orre tion. The data after the A-weighted orre tion is shown in Figure C.3. The data show inthis graph is an average of the right and left ear.71

APPENDIX C. EXPOSURE LEVEL CALCULATION10
110
210
310
410
5−2
0
2
4
6
8
10
12
14
16
Frequency [Hz]
∆ [d
B S
PL]
Figure C.5: Standardized values of the free �eld orre tion for ear measurements of the manikin. The valuesthat are subtra ted are those whi h orrespond with the third o tave bands frequen ies.10
110
210
310
410
5−60
−50
−40
−30
−20
−10
0
10
Frequency [Hz]
A−
wei
ghte
d co
rrec
tions
[dB
SP
L]
Figure C.6: Standardized values of the A-weighted orre tion for ear measurements of the manikin. Thevalues that are subtra ted are those whi h orrespond with the third o tave bands frequen ies.These values are obtained from the standard IEC 61672-1 [20℄.72

APPENDIX D
PILOT TEST M EASUREMENTS
This appendix describes the measurements needed for the pilot test described in Chapter 4. Thenormalization of the music samples and the measurements forthe selection of the portable MPand the two headphones used in the pilot test are explained. Finally, theLFF,Aeqproduced by theselected MP with both headphones when the portable MP is set to different volume settings iscarried out.D.1 MethodThe measurements are divided in three different parts:
• Measurements related to the normalization of the music samples selected for the pilot test.
• Measurements in order to select a portable MP and a pair of headphones.
• Measurements of theLFF,Aeq produced at the different volume control positions of theportable MP and the headphones selected.D.2 Setup and Equipment
The measurements are carried out in the listening room A at Aalborg University. Figure D.1illustrates the setup and Table D.1 lists the equipment. Thesame setup and equipment is usedfor all the measurements described in this appendix.
The measurements are performed using a head and torso simulator. This device is equippedwith a set of soft artificial pinnas, an artificial ear canal and an occluded artificial ear whichallows to simulate the sound pressure level in the inner partof a real human ear. The pinnashave a hardness very close to that of a real human ear, therefore the head and torso simulatorenables easy and realistic mounting of headphones [17]. In addition headphones evaluation canbe performed because the artificial ear provides the correctacoustic loading [17].
The portable MP is connected to an adapter that splits the signal in two. One of its outputs isconnected to the headphones and other is connected to a voltmeter for measuring the outputvoltage of the MP. The headphones are placed on the head and torso simulator, thus the micro-phone of the artificial ear measures the sound pressure level. The measurements are recorded in
73

APPENDIX D. PILOT TEST MEASUREMENTSthe time domain with the 0.1dB Harmonie Measurement System and later they are proccessedin MATLAB in order to obtain theLAeq,60s. The integration time is set to 60seconds which isthe time duration of all the music samples.
The head and torso simulator has two artificial ear inserted in the right and left side of the head,therefore two measurements were obtained in each recording.
Item Model LAB-Nr:Head and Torso Simulator B&K 4128 08453060
PMPCreative MuVo V200 215741Supratech JazzFree -
Headphones
Creative 215741Super PowerBass CBX-15 -Supratech JazzFree -Miniheadphones a11P1 -Sony MDR 2741
Measurement System 0.1dB Harmonie 33964PC Fujitsu (laptop) -1600MB RAM, Intel M 760MHz 33964Voltmeter - -Table D.1: Equipment used for the pilot test measurements.
outin out
inout
Voltimeter
+
01 dB
Symphonie
Head and Torso Simulator
B&K 4128
PC
Adapter
−Adapter
MP Figure D.1: Setup used for the pilot test measurements.74

D.3. RESULTSD.3 ResultsD.3.1 Normalization of the Musi SamplesThe different selected music samples that are presented to the subject in the pilot test werecollected from different information sources. All the music samples are single-channel WAVEfiles, with a sample frequency of 44.1kHz, 16bits per sample and 60seconds of duration. Theproblem with these stimuli was the deficiency to control the level of the recordings beforehand.Due to this, when a music sample is played in the portable MP with the same volume controlposition, the equivalent level of the sound produced at the headphones is different depending onthe level used when the recordings of the songs were made. Therefore a normalization of themusic samples used in the pilot test is needed. For example Figure D.2 shows 30 seconds of twodifferent samples before the normalization. It is observedthat the energy content of these twosignals is different.
0 5 10 15 20 25 30
−1
−0.5
0
0.5
1
Time(s)
Am
plitu
de
0 5 10 15 20 25 30
−1
−0.5
0
0.5
1
Time(s)
Am
plitu
deFigure D.2: The upper �gure orresponds to �rst 30 se onds of the musi sample �Help� from �The Beetles"and the lower �gure orresponds to the �rst 30 se onds of the musi sample �Hips don't lie�from �Shakira�. Both �gures show the time signals before the normalization.The normalization is applied to all the music samples to get the sameLAeq,60s. This is donefollowing the definition ofLAeq,T stated in the standard ISO 1999 [23]. Equation D.1 shows theexpression where T is the duration of the recording,PA(t) is the instantaneous sound pressure(A-weighted) at time t in Pascals, andP0 is the standard reference pressure which is 20µPa. TheA-weighted is performed in order to get the signal as perceived by the ear.
LAeq,T = 10log
[
1T
Z T
0
P2A(t)
P20
dt
]
(D.1)
The procedure to normalize all the music samples is based on the calculation of theLAeq,60s ofone of the samples, and then adjust the rest to have the sameLAeq,T than this first sample, which
75

APPENDIX D. PILOT TEST MEASUREMENTSis the reference. This is implemented in MATLAB.
From Equation D.1, an expression for the normalization can be derived by means of a leveldifferencedBdi f f (in dB) between two equivalent continuous A-weighted soundpressure levels,LAeq1,T andLAeq2,T. This is show in Equation D.2 whereP2(t) is the time function (instantaneouspressure values) of the signal to be normalized andP1(t) is the time function of the referencesignal. Both,P1(t) andP2(t) are in Pascals.
dBdi f f = LAeq1,T −LAeq2,T = 20logZ T
0
P1(t)P2(t)
(D.2)
Thus, the equation that describes the normalization can be obtained solvingP2(t) from EquationD.2. The solution is described in Equation D.3.
P2(t) = P1(t).10−dBdi f f
20 (D.3)
The reference signal chosen is the music sample “Help” from the “The Beetles” which has aLAeq,60 of 96.03dB. Therefore, by applying Equation D.3 to all the music samples, they all areadjusted to this equivalent continuous A-weighted sound pressure level.
In order to test the normalization, theLAeq,60s of the stimuli is calculated in MATLAB after andbefore the normalization. Figure D.3 shows 30 seconds of thetwo stimuli shown in Figure D.2,but after the normalization.
0 5 10 15 20 25 30
−1
−0.5
0
0.5
1
Time(s)
Am
plitu
de
0 5 10 15 20 25 30
−1
−0.5
0
0.5
1
Time(s)
Am
plitu
deFigure D.3: The upper �gure orresponds to �rst 30 se onds of the sound stimulus �Help� from �The Beatles�and the lower �gure orresponds to the �rst 30 se onds of the sound stimulus �Hips don't lie�from �Shakira�. Both �gures show the time signals after the normalization. The LAeq,60s in both ases is 96.03dB
76

D.3. RESULTSD.3.2 Measurements for the Sele tion of the MP and the HeadphonesIn order to fairly select a portable MP and a pair of headphones, all possible combinations be-tween the two portable MP and the five sets of headphones shownin Table D.1 are tested. Eachcombination is identified by a reference name as it can be seenin Table D.2. For instance LD3would correspond to the Listening device (LD) formed by the Creative MuVo V200 portableMP and the Super PowerBass CBX-15 headphones.
A requirement for the portable MPs that are tested is that they must have a digital volume settingfor a easier control of the volume set by each subject.
Regarding the headphones, they must be portable, comfortable and easy to place. The types ofheadphones selected to be tested are supra-concha and intra-concha earphones. It is decided notto use circum-aural headphones because they are not considered portable. In addition, insertearphones are neither used because they are not comfortableenough furthermore, these devicesare associated with professional issues [18].
Item PMP Types of HeadphoneLD1 Creative MuVo V200 CreativeLD2 Creative MuVo V200 Supratech JazzFreeLD3 Creative MuVo V200 Super PowerBass CBX-15LD4 Creative MuVo V200 Miniheadphones a11P1LD5 Creative MuVo V200 Sony MDRLD6 Supratech JazzFree CreativeLD7 Supratech JazzFree Supratech JazzFreeLD8 Supratech JazzFree Super PowerBass CBX-15LD9 Supratech JazzFree Miniheadphones a11P1LD10 Supratech JazzFree Sony MDRTable D.2: Possible ombinations between the two MP and the four headphones with their orrespondingassigned name. The measurements are done a ording to these ombinations for the pilot testmeasurements.
Two LDs are selected according to the next requirements.
• First, the selected LDs must produce the highest sound pressure level among all the pos-sible LDs.
• Second, the two LDs chosen must have different types of headphones.
The selection is made according to the results of the next measurements.
• Sensitivity of the headphones.
• MaximumLFF,Aeq delivered by the LDs.
77

APPENDIX D. PILOT TEST MEASUREMENTSSensitivity of the Headphones:
The sensitivity of the headphones is measured playing in theportable MP a pure tone signal at1000Hz. Then, the sound pressure level is directly measuredby means of the software of theSymphonie system and the voltage is measured in the voltmeter. From these two measurementsa sensitivity value can be derived. This is done for all the headphones and for both cups ofeach headphone. Since it is a headphone measurement, eitherthe Supratech JazzFree MP or theCreative MuVo V200 MP can be used as a sound source because it does not change the results.
In Table D.3 the values of the sensitivities measured for thedifferent headphones are shown.
Headphones Type Voltage SPL SPL Sensitivity Sensitivity(Vrms) right cup (dB) left cup (dB) right cup(dB/V) left cup (dB/V)
Creative 0.268 101.7 102.5 113.93 113.13Supratech JazzFree 0.271 87.0 86.5 97.84 98.34Super PowerBass CBX-15 0.246 90.7 91.5 103.68 102.88Miniheadphones a11P1 0.270 76.7 81.3 92.67 88.07Sony MDR 0.251 101.6 103.0 115.00 113.60Table D.3: Measured sensitivity of the di�erent headphones. The measurements are performed for both upsplaying a pure tone at 1000Hzusing the Suprate h JazzFree MP. The sound pressure level ismeasured only at that frequen y.
Maximum L FF,Aeq delivered by the LDs:
The music sample used is the song "The Beetles" which is one ofthe stimuli signals presentedto the subject as it is explained in the design of the pilot test in Chapter 4. However any ofthe music samples could be used because they are all normalized. The integration time for thecalculation ofLFF,Aeq is set to the duration of the music sample which is 60seconds.
Listening LFF,Aeq (dB) LFF,Aeq (dB)
Device left cup right cupLD1 109.77 107.60LD2 104.57 104.92LD3 105.31 101.96LD4 97.29 90.78LD5 105.80 104.38LD6 109.43 106.24LD7 103.47 98.25LD8 102.43 97.45LD9 96.47 91.90LD10 104.60 103.73Table D.4: Maximum LFF,Aeq when the volume is set to the maximum for the di�erent LDs. The musi sample used is the song titled "Help" from "The Beetles".
78

D.3. RESULTSFinal SelectionFrom the results showed in table D.4 it can be concluded that LD1, which gives 109.77dB and107.60dB for the right and left cup respectively, are the devicesthat produce the highestLFF,Aeq.Taking in account that the other LD selected must have different type of headphones, the nextLD that gives a highLFF,Aeq is LD5. It produces 105.80dB and 101.96dB for right and leftcup respectively. In addition, the headphones of LD1 and LD5are the ones with the highestsensitivity, therefore they provide the highest sound pressure level among all the headphones. Itcan be appreciated in table D.3.
In conclusion, even though no big different among LD is seen,LD1 and LD2 are selected ac-cording these measurements.D.3.3 Volume Setting MeasurementsWith the two LDs selected in the last section, a measurement of theLFF,Aeq for different controlvolume positions is done. The measurements are performed moving the digital control positionfrom the minimum to the maximum volume. The signal used is again the musical excerpt from"The Beetles" and titled "Help" and the integration time forthe calculation ofLFF,Aeq is theduration of the music sample (60seconds).
The data obtained in the volume setting measurements is shown in Tables D.5 and D.6 for thetwo LDs. Moreover Figure D.4 shows this data in a graph.
79

APPENDIX D. PILOT TEST MEASUREMENTSControl Volume LFF,Aeq (dB) LFF,Aeq (dB) MeanLFF,Aeq (dB)
Position left cup right cup1 75.54 73.30 74.422 75.37 73.75 74.563 76.83 75.34 76.084 77.57 76.19 76.885 79.09 77.83 78.466 80.38 79.19 79.797 82.06 80.92 81.498 83.71 82.64 83.179 85.38 84.40 84.910 87.16 86.19 86.6811 89.12 88.18 88.6512 91.04 90.12 90.5813 92.97 92.02 92.5014 94.98 94.03 94.5015 96.99 96.00 96.5016 98.86 97.78 98.3217 100.68 99.45 100.0618 102.35 101.00 101.6719 103.91 102.42 103.1720 105.34 103.71 104.5221 106.55 104.78 105.6622 107.66 105.75 106.7123 108.64 106.57 107.6024 109.07 106.96 108.0225 109.77 107.60 108.68Table D.5: Maximum LFF,Aeq when the volume is set to di�erent positions for LD1.
80

D.3. RESULTSControl Volume LFF,Aeq (dB) LFF,Aeq (dB) MeanLFF,Aeq (dB)
Position left cup right cup1 70.64 66.72 68.682 71.03 67.24 69.143 71.96 68.71 70.344 72.44 69.06 70.755 74.43 71.19 72.816 74.32 71.27 72.807 75.44 72.52 73.988 76.67 73.84 75.269 78.18 75.42 76.8010 79.82 77.14 78.4811 81.58 79.02 80.3012 83.42 80.82 82.1213 85.37 82.86 84.1214 87.25 84.71 85.9815 89.24 86.68 87.9616 91.19 88.62 89.9117 93.21 90.66 91.9318 95.16 92.61 93.8919 97.14 94.58 95.8620 99.03 96.41 97.7221 100.80 98.15 99.4822 102.46 99.71 101.0823 104.06 101.25 102.6524 104.81 101.97 103.3925 105.96 105.96 105.96Table D.6: Maximum LFF,Aeq when the volume is set to di�erent positions for LD5.
81

APPENDIX D. PILOT TEST MEASUREMENTS
0 1 4 7 10 13 16 19 22 2560
70
80
90
100
110
120
Control Volume Positions
Leq
FF
(dB
A)
Listening Device1Listening Device5
Figure D.4: Mean LFF,Aeq produ ed by the LD1 and the LD5 measured at the headphones using an arti� ialhead and torso simulator. Cir les represents the measured values and the urve is al ulated byinterpolation. An average between the measurements of the right and left up is done. Thisdata an be also seen in Tables D.5 and D.6 respe tively82

APPENDIX E
PILOT TEST I NSTRUCTIONS
Welcome to our Listening Test. The pilot test you are about totake part in is carried out forthe final master thesis project performed by group 1066 of theAcoustic department of AAU. Itstudies the exposure level and the listening habits when music players with headphones are used.
Task 1: In this task you have to:
• Select one of two different headphones showed.
• Select one of seven music samples presented.
• Adjust the control volume setting of a given portable music player using the headphonesand the music sample elected before.
Two different types of headphones are going to be presented.You have to choose the one thatlooks more similar to the headphone that you use normally. Incase that you are not a musicplayer user, you must select that set of headphones that you would use if you were going tolisten to music with a music player.In next table there is a list of music samples of varied styles. You have to choose the sample thatyou would like to listen to.
Author TitleThe Beetles HelpMilk Inc. In my eyesFugees Ready or notWoody Allen Come On and StompShakira Hips dont’t lieU2 Sunday Bloody SundayVivaldi The Four SeasonsTable E.1: Musi samples
Task 2: In this task you have to fill out a questionnaire.
All your data will be stored and treated confidentially.Thanks for your participationAcoustics Department. Group 1066
83


APPENDIX F
PILOT TEST QUESTIONNAIRE
This is a questionnaire carried out for the final master thesis project performed by group 1066of the Acoustic department of Aalborg University. If you want to participate in this listeningexperiment, please fill in the form bellow. Your data will be stored and treated confidentially.F.0.4 Personal data:
• Name and Surname:....................................................................................................
• Age:.................... • Genre: � Woman � ManF.0.5 Prior experien e:1 Do you have a known history of hearing damage diagnosed by a medical doctor?
� Yes� No� I dont’t knowIf last answer was Yes, which and when?...........................................................................................................................................................................................................................
2 Have you ever had an ear operation?� Yes� No� I dont’t knowIf last answer was Yes, which and when?.............................................................................................................................................................................................................................
3 Do you ever had any hearing problem i.e. infections, ear noises, drainage...?� Yes� No� I dont’t knowIf last answer was Yes, how often?.....................................................................................................................................................................................................................................
4 Are you suffering a cold?� Yes
85

APPENDIX F. PILOT TEST QUESTIONNAIRE� No� I dont’t know
5 Have you ever had your hearing tested before?� Yes� No� I dont’t knowIf last answer was Yes, when, where and how did it go?.......................................................................................................................................................................................................
6 Does/Did anyone in your immediate family have hearing disorder?� Yes� No� I dont’t knowIf last answer was Yes, please explain..............................................................................................................................................................................................................................
7 Have you ever taken any medicine or another type of drugs that might have influence onyour hearing?� Yes� No� I dont’t knowIf last answer was Yes, which and when?.........................................................................................................................................................................................................................
8 Have you ever been exposed to loud sounds i.e. explosions, fireworks, shootings, firearms...?� Yes� No� I dont’t know
9 If last question was Yes:
– Please explain if you felt any pain in your ears or sudden lostof hearing?...................................................................................................................................................................
– Which kind of sound and how often have you been exposed?...................................................................................................................................................................................
– Did you use hearing protectors?� Yes� No� I dont’t knowIf last answer was Yes, for how long?......................................................................................................................................................................................................................
10 Have you ever had a job where you need to use headphones i.e.call center, dj...?� Yes
86

� No� I dont’t knowIf last answer was Yes, for how long?...................................................................................................................................................................................................................................
11 Have you ever worked in a very noisy environment where you could not talk easily withother people?� Yes� No� I dont’t know
12 If last question was Yes:
– Which kind of noise and in which environment?......................................................................................................................................................................................................
– How long and how often?..........................................................................................................................................................................................................................................
– Did you use hearing protectors?� Yes� No� I dont’t knowIf last answer was Yes, for how long?.................................................................................................................................................................................................................F.0.6 Listening habits:
13 Do you listen to music using music players with headphones?� Yes� NoIf last answer was No, please go to question number 23
14 If the music player with headphones that you use is a portable music player i.e. mp3,mobile telephone, portable radio, PDA ... please, fill out next table choosing how oftenand for how long time you have been using it:
How often? Day Time in hours per day How long?� 1 � 1 or less � 1 month
� weekly � 2 � 1-2 � 1-6 months� 3 � 2-4 � 6-12 months� 4 � 4-6 � 1-2 years� 5 � 6-8 � 2-5 years
� monthly � 6 � 8-10 � 5-10 years� 7 � more than 10 � more than 10 years
87
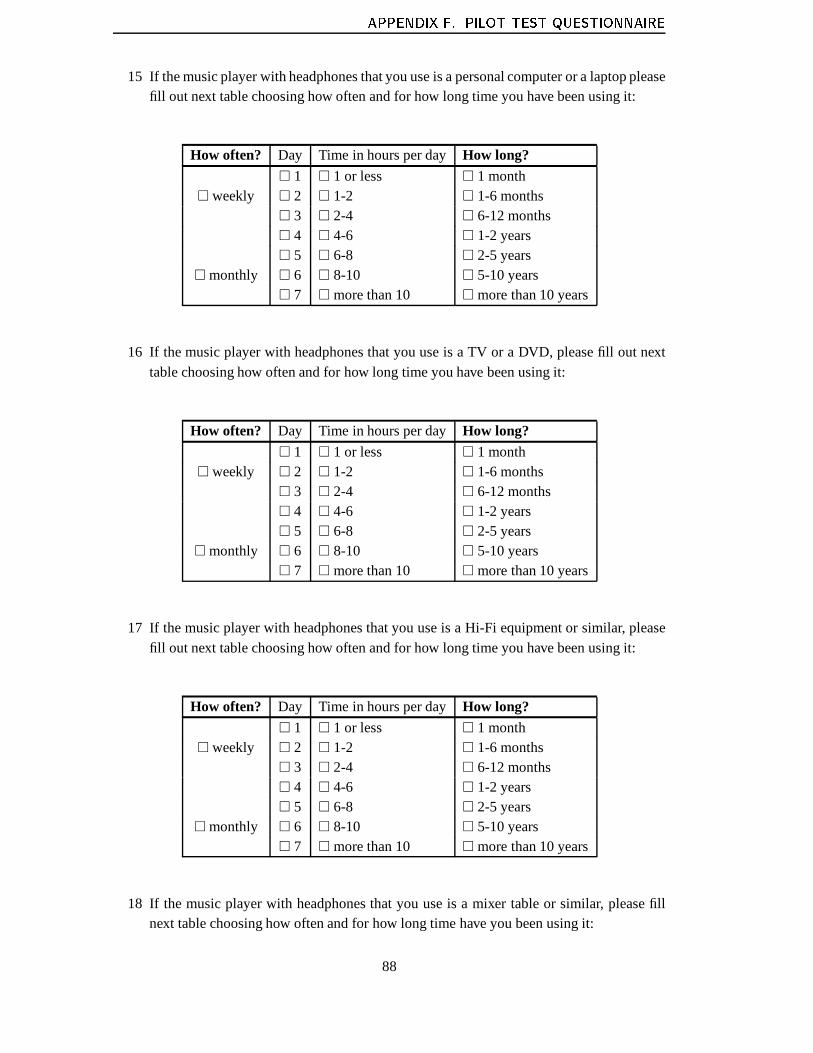
APPENDIX F. PILOT TEST QUESTIONNAIRE15 If the music player with headphones that you use is a personal computer or a laptop please
fill out next table choosing how often and for how long time youhave been using it:
How often? Day Time in hours per day How long?
� 1 � 1 or less � 1 month� weekly � 2 � 1-2 � 1-6 months
� 3 � 2-4 � 6-12 months� 4 � 4-6 � 1-2 years� 5 � 6-8 � 2-5 years
� monthly � 6 � 8-10 � 5-10 years� 7 � more than 10 � more than 10 years
16 If the music player with headphones that you use is a TV or a DVD, please fill out nexttable choosing how often and for how long time you have been using it:
How often? Day Time in hours per day How long?
� 1 � 1 or less � 1 month� weekly � 2 � 1-2 � 1-6 months
� 3 � 2-4 � 6-12 months� 4 � 4-6 � 1-2 years� 5 � 6-8 � 2-5 years
� monthly � 6 � 8-10 � 5-10 years� 7 � more than 10 � more than 10 years
17 If the music player with headphones that you use is a Hi-Fi equipment or similar, pleasefill out next table choosing how often and for how long time youhave been using it:
How often? Day Time in hours per day How long?
� 1 � 1 or less � 1 month� weekly � 2 � 1-2 � 1-6 months
� 3 � 2-4 � 6-12 months� 4 � 4-6 � 1-2 years� 5 � 6-8 � 2-5 years
� monthly � 6 � 8-10 � 5-10 years� 7 � more than 10 � more than 10 years
18 If the music player with headphones that you use is a mixer table or similar, please fillnext table choosing how often and for how long time have you been using it:
88

How often? Day Time in hours per day How long?� 1 � 1 or less � 1 month
� weekly � 2 � 1-2 � 1-6 months� 3 � 2-4 � 6-12 months� 4 � 4-6 � 1-2 years� 5 � 6-8 � 2-5 years
� monthly � 6 � 8-10 � 5-10 years� 7 � more than 10 � more than 10 years
19 Next table contains some places where music players with headphones can be used.Please fill the table marking how often you use to listen to your music player with head-phones and the type of environment which corresponds to the place selected. You onlyhave to mark those places where you use your music player.
how often? which environment?1 Rarely 2 Often 3 Very often 1 Quiet 2 Moderate 3 Noisy
bus � � � � � �
train � � � � � �
bike � � � � � �
motor-bike � � � � � �
car � � � � � �
street � � � � � �
home � � � � � �
university � � � � � �
at work � � � � � �
another place:........................... � � � � � �
20 Do you use to place the two earphones in your ears when you are listening to music withyour music player?� Yes� No
21 If last question was No, which ear do you use to cover?� right� left
22 Which kind of headphones do you use?� Inside the ear� On the ear� Around the ear
23 Are you a musician?� Yes
89

APPENDIX F. PILOT TEST QUESTIONNAIRE� NoIf last question was No, please go to question number 26If last answer was Yes, which kind of instrument do you play?...............................................
24 Are you playing in a:� Rock band � Orchestra � Jazz band � Big band � At home � pub� studio � at work � Another one: .......................................
25 Please, fill next table choosing how often do you play and for how long time have youbeen playing
How often? Day Time in hours per day How long?
� 1 � 1 or less � 1 month� weekly � 2 � 1-2 � 1-6 months
� 3 � 2-4 � 6-12 months� 4 � 4-6 � 1-2 years� 5 � 6-8 � 2-5 years
� monthly � 6 � 8-10 � 5-10 years� 7 � more than 10 � more than 10 years
26 Do you go to discotheques or pop/rock concerts?� Yes� No
27 If last question was Yes, please fill next table choosing how often do you go to discothe-ques or pop/rock concerts and for how long have you been goingto this places.
How often? Day Time in hours per day How long?� 1 � 1 or less � 1 month
� weekly � 2 � 1-2 � 1-6 months� 3 � 2-4 � 6-12 months
� monthly � 4 � 4-6 � 1-2 years� 5 � 6-8 � 2-5 years
� yearly � 6 � 8-10 � 5-10 years� 7 � more than 10 � more than 10 years
90

This questionnaire is a part of a master thesis which study the hearing and the sound exposurelevel when music players with headphones are used. Do you want to take part of our listeningtest? In this study your hearing will be tested using common and not risky methods as audiome-try and otoacoustic emissions (OAE). Furthermore the soundexposure level when you are usingportable music players with headphones will be measured andfinally, you will be asked to fill ashort questionnaire.
Do you want to participate?� Yes� No
Telephone number:.............................................................e-mail address:......................................................................
Thanks for your participationAcoustics Department. Group 1066
91


APPENDIX G
PILOT TEST SUBJECTS
This appendix lists the subjects who performed the pilot test and their results.
The reference number, the sex, the age and the volume controllevel setting of each of the sub-jects can be seen in Table G.1. Moreover theLFF,Aeq, the exposure time in hours per day and theLEX,8h calculated from the data collected in the pilot test are alsopresented.
It must be noticed that the subjects who present any hearing condition in the pilot test are notlisted in this table.
The data of Table G.1 is sorted from the minimumLEX,8h to the maximumLEX,8h. Figures G.1and G.2 plots the data shown in this table. Figure G.1 shows all the subjects whereas figure G.2shows only the subjects with aLEX,8h different from zero.
1 5 10 15 20 25 30 35 40 45 50 540
10
20
30
40
50
60
70
80
90
100
110
LEX
8h
[dB
SP
L]
Reference number of the subjectsFigure G.1: LEX,8h al ulated from the data olle ted in the pilot test. The LEX,8h of the subje ts is sortedfrom the minimum to the maximum LEX,8h. This data is also shown in Table G.193
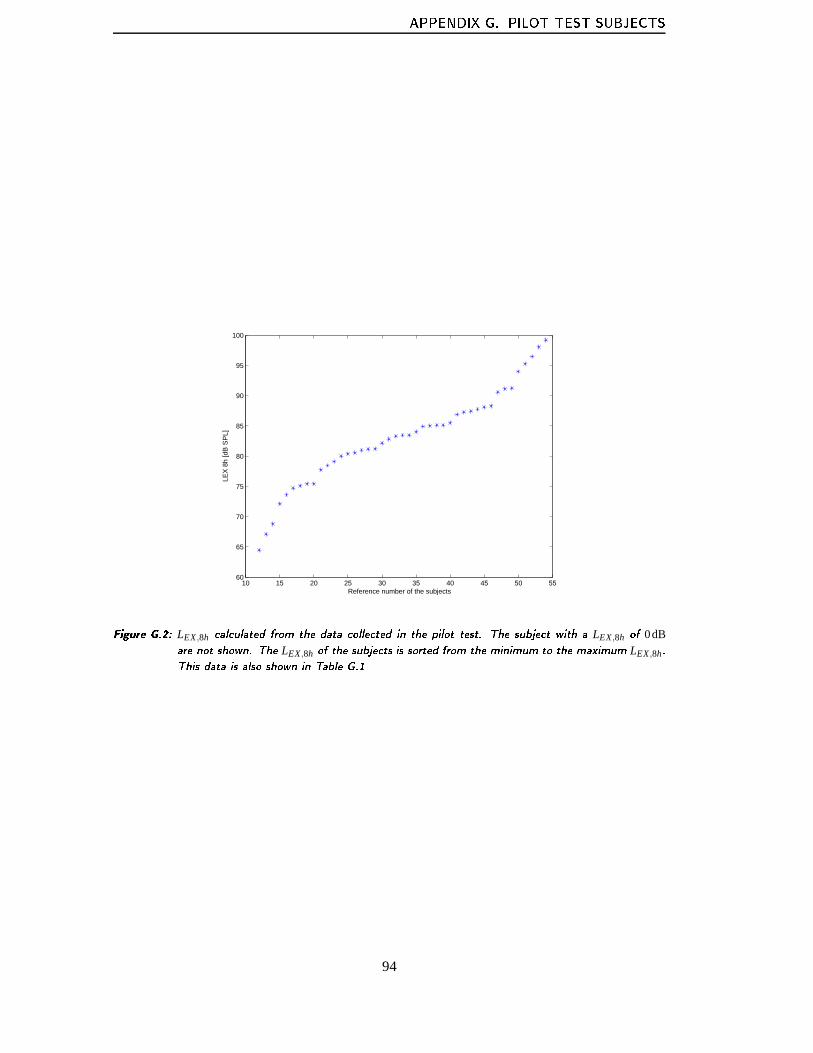
APPENDIX G. PILOT TEST SUBJECTS
10 15 20 25 30 35 40 45 50 5560
65
70
75
80
85
90
95
100
LEX
8h
[dB
SP
L]
Reference number of the subjectsFigure G.2: LEX,8h al ulated from the data olle ted in the pilot test. The subje t with a LEX,8h of 0dBare not shown. The LEX,8h of the subje ts is sorted from the minimum to the maximum LEX,8h.This data is also shown in Table G.194

Reference Number Sex Age Control Level SettingLFF,Aeq Hours per Day LEX,8h
1 male 30 16creative 98,32 0 0,002 female 22 10sony 78,48 0 0,003 male 27 13sony 84,12 0 0,004 female 22 18creative 101,67 0 0,005 female 24 20sony 97,72 0 0,006 female 24 12sony 82,12 0 0,007 male 21 15sony 87,96 0 0,008 male 24 19creative 103,17 0 0,009 female 31 17sony 91,93 0 0,0010 male 27 8sony 75,26 0 0,0011 female 22 9creative 84,89 0 0,0012 female 31 1creative 74,42 0,8 64,4213 female 25 6sony 72,80 2,13 67,0514 male 33 10creative 86,68 0,13 68,7815 male 25 12sony 82,12 0,8 72,1216 female 23 9creative 84,89 0,6 73,6417 female 26 13creative 92,50 0,13 74,7118 male 34 13sony 84,12 1 75,0819 male 24 10creative 86,68 0,6 75,4320 male 26 10creative 86,68 0,6 75,4321 female 21 10creative 86,68 1,2 78,4422 male 21 12sony 82,12 4 79,1123 female 23 9creative 84,89 2,6 80,0124 male 21 16sony 89,91 0,9 80,4225 female 24 16sony 89,91 0,93 80,5626 male 24 15sony 87,96 1,6 80,9727 male 22 13sony 84,12 4 81,1128 female 25 15sony 87,96 1,7 81,2329 male 24 16sony 89,91 1,33 82,1130 female 21 10creative 86,68 3,3 82,8331 male 29 14creative 94,50 0,6 83,2632 male 26 19sony 95,86 0,46 83,4533 male 28 13creative 92,50 1 83,4634 male 25 17sony 91,93 1,3 84,0435 male 27 10creative 86,68 5,3 84,8936 male 24 16sony 89,91 2,6 85,0237 female 21 18sony 93,89 1,06 85,1138 male 24 18sony 93,89 1,06 85,1139 male 25 12creative 90,58 2,5 85,5340 male 22 20sony 97,72 0,66 86,8841 female 26 12creative 90,58 3,7 87,2342 male 22 21sony 99,48 0,5 87,4343 male 27 15creative 96,50 1,06 87,7244 male 27 22sony 101,08 0,4 88,0745 female 24 19creative 103,17 0,26 88,2946 male 21 18sony 93,89 3,7 90,5447 male 23 19creative 103,17 0,5 91,1348 male 26 20sony 97,72 1,8 91,2449 male 22 15creative 96,50 4,5 94,0050 male 23 19creative 103,17 1,3 95,2851 male 22 21sony 99,48 4 96,4752 female 28 20creative 104,52 1,8 98,0553 male 25 21creative 105,66 1,8 99,1954 female 22 22sony 101,08 5,9 99,76Table G.1: List of the subje ts who performed the pilot test. The subje ts who presented any hearing ondition in the pilot test are not listed in this table.95


APPENDIX H
L ISTENING TEST I NSTRUCTIONS
Welcome to our Listening Test!
The listening test you are about to participate is part of a listening experiment that studies theeffects of using music players with headphones on the hearing. You have already participated inthe first phase and now it comes the second phase. In this paperyou will find a short descriptionof the parts of the listening test. Read carefully these instructions and if you have any doubt, donot hesitate to ask us. Feel free to eat cake and drink coffee or soda while you are reading thispaper:
• FIRST PART:The first part takes around 5 minutes and consist of a questionnaire and several questionsabout your listening habits. It is quite similar to the questionnaire that you filled out inthe first phase of this listening experiment.
• SECOND PART:This second part takes around 20 minutes and consist of an audiologic evaluation. Yourears will be tested using two not risky methods which are an audiometric test and otoa-coustic emissions measurements. If you are interested on the results of the tests, we cangive them to you in the end of the listening test. After this, you will have a break of 5minutes. During this time you can leave the room, eat more cake and drink coffee or soda.
• THIRD PART:This third part will take around 20 minutes. Your task will beto adjust the volume of yourown music player using your own headphones in different environments. If you could notbring your own devices, we will provided you the music playerand the headphones thatyou used in the first phase of this experiment.
This is a brief explanation of the listening test. It is very important that you feel relaxed andcomfortable during all the experiment. If for any reason youwant to quit the experiment, youcan do it at any time without any explanation.Thank you very much for your participation.Group 1066. Acoustic Department
97
APPENDIX H. LISTENING TEST INSTRUCTIONSFirst Part: Audiometry Test• DESCRIPTION:
During this test you will have to wear a pair of headphones. When you place them, besure that they fit your ears well. Then different sounds will be presented, first on one earand then in the other.
• YOUR TASK:Your task is to press a button that you will have in your hand whenever you hear some-thing. If no sound is heard, you do not have to press the button. In order to be sure thatyou understand this procedure a trial will be performed in the beginning.
• TIPS:It is very important that you feel relax and concentrated during this test because weaksounds are going to be presented.Se ond Part: Otoa ousti Emissions Measurements
• DESCRIPTION:In this hearing test, a test probe will be inserted in your earand some sounds will beplayed through it. All the sounds will be played at comfortable levels.
• YOUR TASK:During this test you do not have to do anything, you just have to be relaxed.
• TIPS:This measurement is very sensitive to movements of the probe, so you must try to bequiet, do not move and try not to swallow.
Remember that after this test you will have a short break of 10minutes when you can enjoy ourcake and coffee.
98

Third Part: Adjustment of the Volume of your Musi Playerusing your Headphones in di�erent Environments• DESCRIPTION:
You are going to be conducted to a listening room where a street, a bus and a very quietenvironment are going to be simulated in different moments.
• TASKS:Your task is to set the volume of your music player using your headphones every timethat an environment is simulated. It is very important that you select the volume thatyouwould useif you would be in these situations.
You will be sit down in a listening room. The first thing you have to do is to listen to theenvironment during 20 or 30 seconds without headphones and with the music player off.Then, you must place the headphones on, turn on the music and play the song you wouldlike to listen to. Finally you have to adjust the volume of themusic player and let us knowthat you finished by means of an intercomunicator.
After the volume setting of each environment, you will have abreak of 3 minutes and youwill have to leave the room.This procedure will be repeat 9 times.
It is very important that after each volume setting you do nottouch or vary the controlvolume of the music player.
The maximum time that you have for the volume settings is 5 minutes per environment.You can choose any song that you have in your music player , butonce you chose it, youwill have to use that song for all the environments.
The first time that you adjust the volume of your music player is taken as trial to makeyou get used to the procedure to follow.
• TIPS:In this part of the listening test you have to trust your feelings and try to imagine that youare in a bus, a street or a quiet environment. Feel free to set the volume that you woulduse, no matter which one it is. Remember that there is not right or wrong settings, soplease try to be honest and show your preferences.
99


APPENDIX I
I NSTRUCTIONS FOR THE TEST
EXPERIMENTER
This appendix explains the procedure followed by the test experimenter when doing the listeningtest with a subject. Basic rules and some general issues thatshould be well known by the testexperimenter are described in this appendix.I.1 Basi Rules for the Test ExperimenterIt is important that the subject is feeling well and comfortable doing the complete listening test.In order to do this, different rules that must be followed by the test experimenter are defined inthe next lines:
• The test experimenter must be polite all the time, even if thesubject is tired, angry, orimpolite.
• The test experimenter must act as if he is in control of everything during the experiment.
• It is the experimenters task to welcome the subject by means of guiding the subject andeliminating possible misunderstandings.
• It is the experimenters task to have a good treatment of the subject and explain to him theneeded indications in order to do the listening.I.2 Test Experimenter Instru tions
The instructions followed by the test experimenter for the different parts of the listening test aredescribed in this section:I.2.1 Wel ome and Introdu tion
• Welcome the subject and say that we appreciate to have him/her as a subject.
• Conduct the subject to the waiting room.
• Invite the subject to sit down and offer him soda and cake in the waiting room.
101
APPENDIX I. INSTRUCTIONS FOR THE TEST EXPERIMENTER• Hand the instructions paper to the subject and ask him/her toread it thoroughly.
• Ask if they understand what they read and if they have any questions or objections to it.
• Start the listening test.I.2.2 First Part of the Listening Test: Personal Questionnaire• Give the questionnaire to the subject.
• Instruct the subject in the procedure of filling it out.
• Take the questionnaire with you and conduct the subject intothe audiometry cabin.I.2.3 Se ond Part of the Listening Test: Bekesy Audiometry and DPOAEsMeasurements• Instruct the subject where to sit in order to perform the audiometry.
• Give the audiometry instructions to the subject.
• Ask if they understand what they read and if they have any questions or objections to it.
• Be sure that the subject puts on the headphones correctly in terms of left/right.
• Start the familiarization process of the audiometry.
• When finished, ask the subject if everything is all right and if he/she has any questionsregarding the method.
• Perform the audiometry for both ears.
• Save the data in the audiometer with the name of the subject.
• Introduce the subject to the DPOAEs measurements.
• Give the DPOAEs measurements instructions to the subject.
• Ask if they understand what they read and if they have any questions or objections to it.
• Put the plastic globes on the hands and place the test probe inthe hear of the subject.
• Be sure that the test probe is correctly placed by testing it in the OAEs measurementequipment.
• Perform the DPOAEs measurements per each ear and save the data of each subject in thefloppy disc and the hard disc of the computer.
• When the measurement is finished, conduct the subject to the waiting room. Feel free tosmall talk but do not discuss any technical test related issues. Wait until after the listeningtest is done with discussing the test in general.
102
I.2. TEST EXPERIMENTER INSTRUCTIONSI.2.4 Third Part of the Listening Test: Control Volume Adjustment• Introduce the subject to the control volume adjustment part.
• Ask to the subjects about the music player and the headphonesthey brought. Be sure thatthey wrote correctly the model of the devices in the questionnaire as well as the musicsample that they are going to use for this part.
• Give the control volume adjustment instructions to the subject.
• Be sure that the subject understand what he read and ask if he has any questions.
• Conduct the subject to the listening room and show him where to sit.
• Remain to the subject that he has to listen to the environmentduring 20 or 30 secondswithout headphones, and after that he has to place the headphones on and play the musicin his music player for the control volume adjustment.
• Remain to the subject to contact with the text experimenter after each control volumeadjustment by means of the inter-communicator.
• Explain to the subject how the inter-communicator system works.
• Remain to the subject that the first control volume adjustment does not count as data forthe listening test. It is only in order to make him used to the task.
• Tell the subject that there is no wrong answers since we are interested in his/her opinion.
• When the subject finishes each control volume adjustment, goback into the listening roomand conduct him to the waiting room.
• Then go into the listening room again and measure the SPL in the head and torso simulatorproduced by the music player of the subject, using the music sample and the controlvolume position that he selected. Do not forget to save the data in the measurementsystem.
• When all the volume adjustments have finished tell the subject that the listening test isover.
• Answer possible questions that the subject can have.
• Say “Thank you”, and show the subject to the entrance.
103

APPENDIX I. INSTRUCTIONS FOR THE TEST EXPERIMENTER
104

APPENDIX J
L ISTENING TEST QUESTIONNAIREJ.0.5 Personal data:• Name and Surname:...............................................................................................
• Music Player:........................................................................................................
• Headphones:.........................................................................................................
• Music Sample:.........................................................................................................J.0.6 Prior experien e:• Are you suffering or have you had recently a cold?
� Yes� No� I dont’t Know
• Have you ever taken any medicine or another type of drugs thatmight have influence onyour hearing?� Yes� No� I dont’t Know
• Have you ever had?
105

APPENDIX J. LISTENING TEST QUESTIONNAIRENever Sometimes Often Very often
buzzing noises in your ear � � � �
sudden lost of hearing � � � �
wax in your ears � � � �
pain or headache due to powerful sounds � � � �
hearing problems when you are listening TV � � � �
hearing problems when you talk by phone � � � �
nervous or anxious feeling after being in a noisy area� � � �
ringing in the ears after being in a noisy area � � � �
pain in your ears when you travel by plane � � � �
hearing problems after listening to musicusing portable music players with headphones � � � �J.0.7 Listening habits:• Please, fill next table with the corresponding time that you use to listen to your music
player with headphones in quiet/moderate environments such as the street, the universityor at home for example:
How often? Day Time in hours per day How long?� 1 � 1 or less � 1 month
� weekly � 2 � 1-2 � 1-6 months� 3 � 2-4 � 6-12 months� 4 � 4-6 � 1-2 years� 5 � 6-8 � 2-5 years
� monthly � 6 � 8-10 � 5-10 years� 7 � more than 10 � more than 10 years
• Please, fill next table with the corresponding time that you use to listen to your musicplayer with headphones in noisy environments such as the bus, the train or the bike forexample:
How often? Day Time in hours per day How long?� 1 � 1 or less � 1 month
� weekly � 2 � 1-2 � 1-6 months� 3 � 2-4 � 6-12 months� 4 � 4-6 � 1-2 years� 5 � 6-8 � 2-5 years
� monthly � 6 � 8-10 � 5-10 years� 7 � more than 10 � more than 10 years
Thank you for your participation.Group 1066. Acoustic Department.
106

APPENDIX K
L ISTENING TEST SUBJECTS
This appendix lists the subjects who performed the listening test and their results.According to the results of the pilot test, some subjects areclassified as target and some as con-trol population.
The subjects of the control and target population who performed the listening test are shown inTable K.1 and K.2 respectively. The reference number and an assigned nickname is specifiedin this table to differ among subjects. Moreover, this tableillustrate theLEX,8h calculated fromthe listening test data as well as theLFF,Aeq for the different environments tested (very quiet,quiet/moderate, noisy).
Figures K.1 and K.2 show theLFF,Aeqand the exposure time for each subject in both populationsand for very quiet, quiet/moderate and noisy environment. The data from these two graph can becombined to obtain theLEX,8h, which is show in Figure K.3, for each subject in both populationstoo.
Figure K.4 shows the meanLFF,Aeq for both populations in the different environments tested(very quiet, quiet/moderate, noisy). Moreover, Figure K.5shows the meanLEX,8h for a quiet/-moderate and noisy environment.
Figures K.6, K.7 and K.8 illustrate again the data of theLFF,Aeq selected for all the subject inboth populations, but as a function of the environments.
Figure K.9 shows the information obtained from the prior experience of the listening test ques-tionnaire.
107

APPENDIX K. LISTENING TEST SUBJECTSReference Number Nickname Environment LFF,Aeq Hours per Day LEX,8h
2 VLLVery Quiet 73,94Quiet/Moderate 90,21 0,00 0,00Noisy 100,80 0,00 0,00
3 DVDVery Quiet 85,28Quiet/Moderate 93,32 0,00 0,00Noisy 99,45 0,00 0,00
5 HDAVery Quiet 98,13Quiet/Moderate 100,36 0,00 0,00Noisy 98,54 0,00 0,00
7 MCKVery Quiet 88,50Quiet/Moderate 90,78 0,00 0,00Noisy 91,86 0,00 0,00
8 ANTVery Quiet 102,04Quiet/Moderate 98,88 0,00 0,00Noisy 102,04 0,00 0,00
12 DNLVery Quiet 76,95Quiet/Moderate 88,39 0,67 77,60Noisy 99,53 0,67 88,74
13 BTZVery Quiet 77,56Quiet/Moderate 91,56 0,80 81,56Noisy 92,99 0,13 75,21
15 LRMVery Quiet 83,34Quiet/Moderate 89,56 0,53 77,80Noisy 95,61 0,03 71,81
17 IRSVery Quiet 97,73Quiet/Moderate 103,34 0,67 92,55Noisy 98,98 0,27 84,21
18 HCRVery Quiet 94,80Quiet/Moderate 94,79 0,80 84,79Noisy 95,36 0,03 71,56Table K.1: LFF,Aeq and LEX,8h al ulated for the subje ts of the ontrol population a ording to the dataobtained in the listening test for a very quiet, a quiet/moderate and a noisy environment.
108

Reference Number Nickname Environment LFF,Aeq Hours per Day LEX,8h
31 LRIVery Quiet 90,74Quiet/Moderate 96,04 0,03 72,24Noisy 103,26 0,47 90,92
33 CLSVery Quiet 102,56Quiet/Moderate 104,82 1,07 96,07Noisy 107,59 0,07 86,79
34 ERCVery Quiet 94,80Quiet/Moderate 97,30 0,93 87,97Noisy 103,32 0,40 90,31
39 SMNVery Quiet 99,10Quiet/Moderate 91,56 0,67 80,77Noisy 97,57 0,93 88,24
41 YSNVery Quiet 88,53Quiet/Moderate 97,49 0,67 86,70Noisy 93,56 2,67 88,79
42 NCLVery Quiet 87,86Quiet/Moderate 92,43 0,03 68,63Noisy 97,27 1,07 88,52
45 SUSVery Quiet 100,16Quiet/Moderate 103,24 0,03 79,44Noisy 105,11 0,27 90,34
46 OLVVery Quiet 103,02Quiet/Moderate 98,83 1,87 92,51Noisy 103,91 0,13 86,13
50 JONVery Quiet 102,07Quiet/Moderate 103,08 0,17 86,27Noisy 106,30 1,33 98,52
52 CLAVery Quiet 104,12Quiet/Moderate 103,55 1,33 95,76Noisy 96,07 1,33 88,28Table K.2: LFF,Aeq and LEX,8h measured in dB SPL al ulated for the subje ts of the target populationa ording to the data obtained in the listening test for a very quiet, a quiet/moderate and a noisyenvironment.
109

APPENDIX K. LISTENING TEST SUBJECTSVLL DVD HDA MCK ANT DNL BTZ LRM IRS HCR
70
80
90
100
110Control Population
LFF
,Aeq
[dB
SP
L]
Very quiet EnvironmentQuiet/moderate EnvironmentNoisy Environment
LRI CLS ERC SMN YSN NCL SUS OLV JON CLA70
80
90
100
110Target Population
LFF
,Aeq
[dB
SP
L]
SubjectsFigure K.1: LFF,Aeq al ulated for the subje ts of the target and ontrol population a ording to the dataobtained in the listening test for a very quiet, a quiet/moderate and a noisy environment.VLL DVD HDA MCK ANT DNL BTZ LRM IRS HCR
0
0.5
1
1.5
2
2.5
3Control Population
Tim
e [h
ours
/day
]
Very quiet EnvironmentQuiet/moderate EnvironmentNoisy Environment
LRI CLS ERC SMN YSN NCL SUS OLV JON CLA0
0.5
1
1.5
2
2.5
3Target Population
Tim
e [h
ours
/day
]
SubjectsFigure K.2: Exposure time al ulated for the subje ts of the target and ontrol population a ording to thedata obtained in the listening test for a quiet/moderate and a noisy environment.110
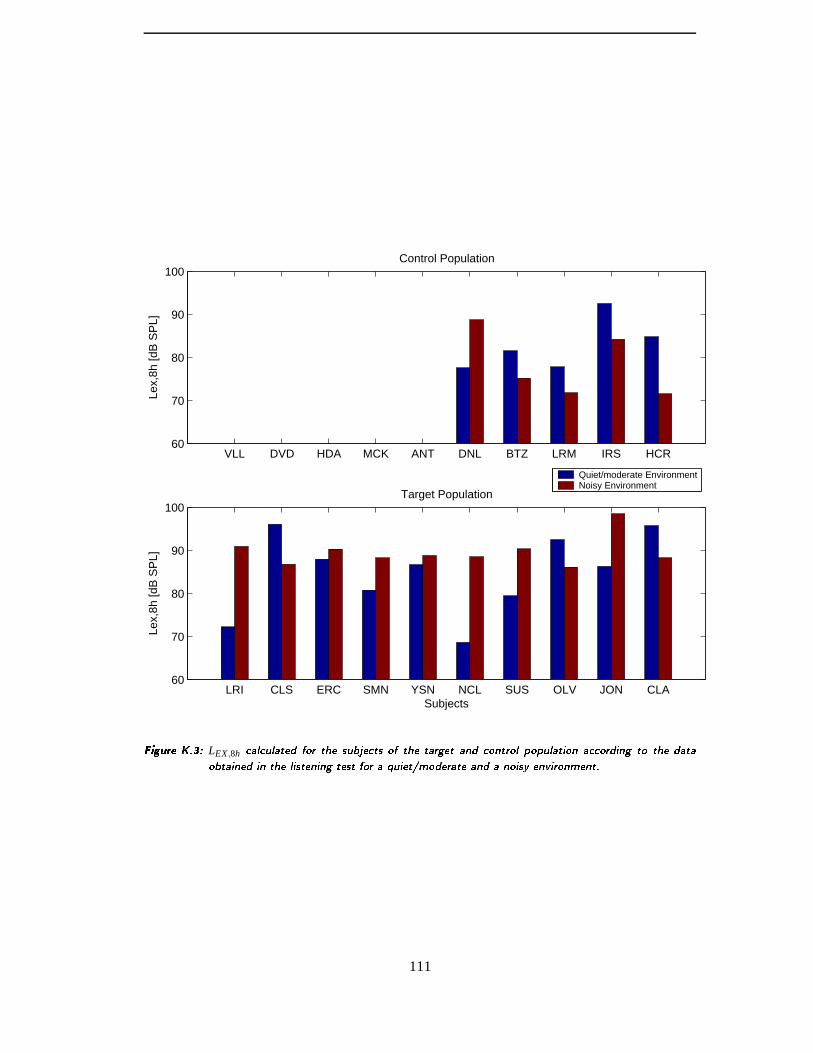
VLL DVD HDA MCK ANT DNL BTZ LRM IRS HCR60
70
80
90
100Control Population
Lex,
8h [d
B S
PL]
Quiet/moderate EnvironmentNoisy Environment
LRI CLS ERC SMN YSN NCL SUS OLV JON CLA60
70
80
90
100Target Population
Lex,
8h [d
B S
PL]
SubjectsFigure K.3: LEX,8h al ulated for the subje ts of the target and ontrol population a ording to the dataobtained in the listening test for a quiet/moderate and a noisy environment.111

APPENDIX K. LISTENING TEST SUBJECTSControl Target
80
85
90
95
100
105
110
Populations
Mea
n LF
F,A
eq [d
B S
PL]
Very quiet EnvironmentQuiet/moderate EnvironmentNoisy Environment
Figure K.4: Mean LFF,Aeq al ulated a ross all the subje ts of the target and ontrol population a ording tothe data obtained in the listening test for a very quiet, a quiet/moderate and a noisy environment.Control Target
50
60
70
80
90
100
110
Populations
Mea
n Le
x,8h
[dB
SP
L]
Quiet/moderate EnvironmentNoisy Environment
Figure K.5: Mean LEX,8h al ulated a ross all the subje ts of the target and ontrol population a ording tothe data obtained in the listening test for a quiet/moderate and a noisy environment.112

very quiet quiet/moderate noisy70
75
80
85
90
95
100
105
L F
F,A
eq [d
B S
PL]
Environments
VLLDVDHDAMCKDNLLRMIRSBTZANTHCR
Figure K.6: LFF,Aeq al ulated for the subje ts of the ontrol population a ording to the data obtained inthe listening test for a very quiet, a quiet/moderate and a noisy environment.very quiet quiet/moderate noisy
85
90
95
100
105
110
L F
F,A
eq [d
B S
PL]
Environments
LRICLSERCSMNYSNNCLSUSOLVJONCLA
Figure K.7: LFF,Aeq al ulated for the subje ts of the target population a ording to the data obtained in thelistening test for a very quiet, a quiet/moderate and a noisy environment.113

APPENDIX K. LISTENING TEST SUBJECTSvery quiet quiet/moderate noisy
85
90
95
100
105
LFF
.Aeq
[dB
SP
L]
Environments
LFF,Aeq Mean Control PopulationLFF,Aeq Mean Target Population
Figure K.8: Mean LFF,Aeq al ulated a ross all the subje ts of the target and ontrol population a ording tothe data obtained in the listening test for a very quiet, a quiet/moderate and a noisy environment.1 2 3 4 5 6 7 8 9 10
0
2
4
6
8
10
Control Population
Num
ber
of s
ubje
cts
1 2 3 4 5 6 7 8 9 100
2
4
6
8
10
Target Population
Num
ber
of s
ubje
cts
Prior experience items
NeverSometimesOftenVery Often
Figure K.9: Number of people from the ontrol and target population who su�er: 1-buzzing noises in yourear, 2-sudden lost of hearing, 3-wax in your ears, 4-pain due to powerful sounds, 5-hearingproblems when listening TV, 6-hearing problems when talking by phone, 7-nervous after beingin a noisy area, 8-ringing in the ears after being in a noisy area, 9-pain the ears when travelingby plane,10-hearing problems after listening a MP with headphones.114

APPENDIX L
HEARING THRESHOLD AND DPOAES
This appendix describes the pure tone audiometry and the DPOAEs measurements conductedin the listening test in order to assess the hearing of the subjects. The appendix finishes with thedata obtained from these measurements.L.1 Pure Tone AudiometryThe audiometry is carried out in the audiometric cabin B4 from the Acoustics Department atAalborg University, which is a room with special treatment to the walls, ceiling, and floor inorder to comply with the specifications about the noise floor stated in the standard ISO 8253-1[26].
The audiometer Madser Orbiter 922 is chosen to perform the audiometry test. The audiometrymethod used is the pure tone audiometry, which is selected inSection 2.7 in Chapter 2. Thesubject is equipped with a set of headphones and two roller pens. One of these roller pens is redand the other one is blue corresponding to right and left respectively. The device tests the earsone at a time. The subject must press the corresponding roller pens whenever a sound is heard.In the end of this Appendix the results obtained in the audiometry tests are shown.L.2 DPOAEs MeasurementsThe measurements are performed in the audiometer cabin B4 inthe Acoustic Department atAalborg University where there was a noise controlled environment. The equipment used tocarry out the DPOAEs measurements is the ILO96 from Otodynamic. It is selected since it isthe equipment available in the Acoustic Department at Aalborg University. This equipment canmeasure either TEOAEs or DPOAEs.
The equipment is based on a system amplification unit connected to a computer which has in-stalled the software to measure and record the OAEs. The amplification unit has, apart from theconnection to the computer, an ear probe which contains two small loudspeakers and a micro-phone. This ear probe is placed on the ear of the subject usinga small foam which makes theplacement on the ear easier. Every loudspeaker of the probe is used to play each pure tone and
115

APPENDIX L. HEARING THRESHOLD AND DPOAESthe microphone is used to record the DPOAEs produced by the ear of the subject.
DPOAEs were measured for both ears in each subject. The data from the measurement is col-lected in .SPR format and it is later processed in order to plot the results. The results obtainedfrom these measurements are presented in the last section ofthis appendix.
After each measurement, the level of the DPOAEs is compared to the noise level to verify itis not masking the cochlear emissions. This can be seen in theequipment immediately afterthe measurement is carried out. If noise level masks the cochlear emissions, the measurementsare repeated. Moreover in the ear calibration is done for each subject and for each ear. This isautomatically performed by the DPOAEs measurement system.
Not only external noise can alters the OAEs response, but also the internal noises from the sub-ject (coughing for example) can create difficulties when recording the DPOAEs. Therefore it isimportant to ask for the subject to remain quiet and try to notswallow during the measurements.L.3 ResultsThe data obtained in the audiometry test was collected and isshown in Table L.2 and L.1.
The data obtained from the DPOAEs measurements is presentedin one plot for every subject.The DPOEAs of the right and left ears are presented in the samegraph, but in different colors.The thick red line in each graph correspond to DPOAEs or the right ear, whereas the thick blueline represent the results of the DPOAEs measurements of theleft ear. The noise measured,which is plotted as blue and red fine lines in the graphs, corresponds to the noise measuredduring the DPOAEs measurements for the right and left ears respectively. The DPOAEs data isplotted as a function of the geometric mean of the pure tones of the DPOAEs (
√f1. f2).
116

L.3. RESULTSFrequencies [Hz]
Subject Ear 250 500 750 1000 1500 2000 3000 4000 6000 8000
VLLL -5 5 5 5 5 5 0 0 15 0R -5 5 10 10 5 10 0 0 0 -10
DVDL 0 5 0 5 5 10 5 0 10 -10R 10 5 5 5 5 5 0 5 10 5
HDAL 5 5 5 5 5 5 0 5 15 -5R 5 10 0 0 0 5 0 15 25 5
MCKL 5 15 20 15 15 15 10 25 20 10R 0 10 10 5 5 -5 5 5 5 0
ANTL 0 5 0 5 -5 0 0 10 5 -10R 0 5 0 0 0 0 0 10 -5 -5
DNLL 5 5 5 0 5 0 0 5 20 0R 0 5 5 0 5 0 -5 10 25 10
BTZL 5 5 10 5 5 0 -5 0 15 5R 5 0 5 0 0 0 0 5 15 5
LRML 5 5 0 5 5 5 0 5 15 5R -5 0 -5 0 5 10 0 0 10 0
IRSL 0 0 -5 -10 0 5 0 15 5 -5R -5 0 5 0 15 5 5 0 20 -5
HCRL -5 5 10 10 5 5 10 15 10 5R 0 5 5 5 10 10 10 15 5 -10Table L.1: Hearing thresholds of the test subje ts of the ontrol population measured in the listening test.
250 500 750 1k 1.5 k 2 k 3 k 4 k 6 k 8 k
−15
−10
−5
0
5
10
15
20
25
Frequency [Hz]
Thr
esho
ld [d
B H
L]
Mean Right Ear Target PopulationMean Left Ear Target Population
Figure L.1: Mean and standard deviation of the hearing thresholds of the target population for left and rightear.117

APPENDIX L. HEARING THRESHOLD AND DPOAESFrequencies [Hz]
Subject Ear 250 500 750 1000 1500 2000 3000 4000 6000 8000
EDRL 10 10 5 5 10 5 15 35 50 45R 0 10 5 -5 -10 0 0 5 -10 5
LRIL -10 -10 5 5 -10 5 0 -10 10 5R -10 -10 -5 0 -10 -10 0 -10 10 5
CLSL -5 -5 5 -5 -5 5 5 -5 10 -5R 5 5 -5 -5 10 5 5 5 -5 0
ERCL 5 5 15 10 5 5 0 5 0 -5R 5 5 5 5 0 0 5 10 0 0
JLSL 10 5 5 5 15 10 15 15 15 10R 5 10 15 20 25 25 20 20 20 35
SMNL 5 0 5 0 5 5 0 5 10 5R 10 5 0 0 5 5 15 5 15 10
YSNL 5 0 5 5 -10 -10 -10 5 15 -10R 5 0 -10 0 5 -10 -10 -5 20 15
NCLL -5 -5 -5 0 5 0 5 15 10 0R 5 0 5 0 5 0 0 -5 5 -10
SUSL 5 0 0 0 5 5 -5 5 5 -5R 0 0 -5 0 0 5 -5 0 5 -5
OLVL 5 5 0 0 -10 -5 -10 0 10 -10R 0 0 5 5 0 -10 -10 -10 -5 -10
JONL 5 5 5 0 0 0 -5 5 20 0R -10 0 0 5 5 5 -5 -10 15 -5
CLAL 10 10 5 0 5 0 0 5 10 -10R 20 15 5 5 10 5 5 -5 5 -10Table L.2: Hearing thresholds of the test subje ts of the target population measured in the listening test.
250 500 750 1k 1.5 k 2 k 3 k 4 k 6 k 8 k
−15
−10
−5
0
5
10
15
20
25
Frequency [Hz]
Thr
esho
ld [d
B H
L]
Mean Right Ear Control PopulationMean Left Ear Control Population
Figure L.2: Mean and standard deviation of the hearing thresholds of the ontrol population for left and rightear.118

L.3. RESULTS1000 1500 2000 3000 4000 6000
−20
−15
−10
−5
0
5
10
15
20
25
30
Frequency [Hz]: geometric mean
DP
OA
E [d
B S
PL]
DPOAE: Subject VLL, Right and Left ears
DPOAE Right EarDPOAE Left EarNoise measured Right EarNoise measured Left Ear
Figure L.3: DPOAEs of right and left ears in subje t VLL. This subje t belongs to the ontrol population.1000 1500 2000 3000 4000 6000
−20
−15
−10
−5
0
5
10
15
20
25
30
Frequency [Hz]: geometric mean
DP
OA
E [d
B S
PL]
DPOAE: Subject DVD, Right and Left ears
DPOAE Right EarDPOAE Left EarNoise measured Right EarNoise measured Left Ear
Figure L.4: DPOAEs of right and left ears in subje t DVD. This subje t belongs to the ontrol population.119
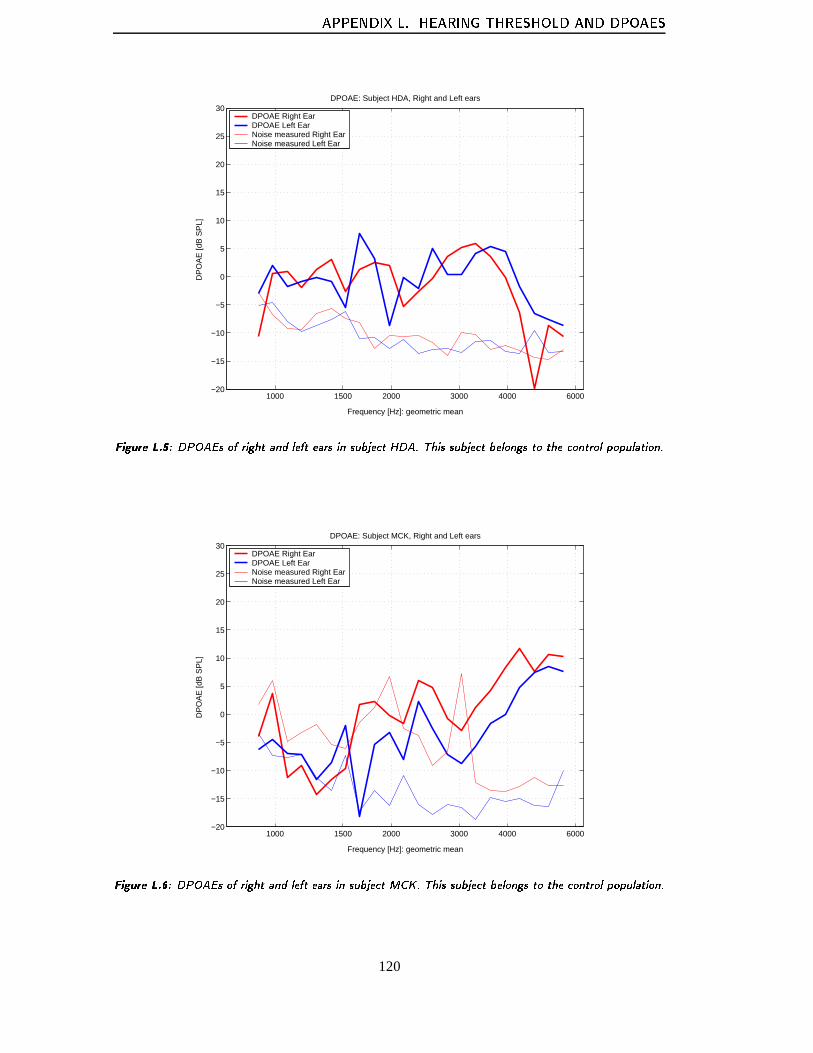
APPENDIX L. HEARING THRESHOLD AND DPOAES1000 1500 2000 3000 4000 6000
−20
−15
−10
−5
0
5
10
15
20
25
30
Frequency [Hz]: geometric mean
DP
OA
E [d
B S
PL]
DPOAE: Subject HDA, Right and Left ears
DPOAE Right EarDPOAE Left EarNoise measured Right EarNoise measured Left Ear
Figure L.5: DPOAEs of right and left ears in subje t HDA. This subje t belongs to the ontrol population.1000 1500 2000 3000 4000 6000
−20
−15
−10
−5
0
5
10
15
20
25
30
Frequency [Hz]: geometric mean
DP
OA
E [d
B S
PL]
DPOAE: Subject MCK, Right and Left ears
DPOAE Right EarDPOAE Left EarNoise measured Right EarNoise measured Left Ear
Figure L.6: DPOAEs of right and left ears in subje t MCK. This subje t belongs to the ontrol population.120

L.3. RESULTS1000 1500 2000 3000 4000 6000
−20
−15
−10
−5
0
5
10
15
20
25
30
Frequency [Hz]: geometric mean
DP
OA
E [d
B S
PL]
DPOAE: Subject ANT, Right and Left ears
DPOAE Right EarDPOAE Left EarNoise measured Right EarNoise measured Left Ear
Figure L.7: DPOAEs of right and left ears in subje t ANT. This subje t belongs to the ontrol population.1000 1500 2000 3000 4000 6000
−20
−15
−10
−5
0
5
10
15
20
25
30
Frequency [Hz]: geometric mean
DP
OA
E [d
B S
PL]
DPOAE: Subject DNL, Right and Left ears
DPOAE Right EarDPOAE Left EarNoise measured Right EarNoise measured Left Ear
Figure L.8: DPOAEs of right and left ears in subje t DNL. This subje t belongs to the ontrol population.121

APPENDIX L. HEARING THRESHOLD AND DPOAES1000 1500 2000 3000 4000 6000
−20
−15
−10
−5
0
5
10
15
20
25
30
Frequency [Hz]: geometric mean
DP
OA
E [d
B S
PL]
DPOAE: Subject BTZ, Right and Left ears
DPOAE Right EarDPOAE Left EarNoise measured Right EarNoise measured Left Ear
Figure L.9: DPOAEs of right and left ears in subje t BTZ. This subje t belongs to the ontrol population.1000 1500 2000 3000 4000 6000
−20
−15
−10
−5
0
5
10
15
20
25
30
Frequency [Hz]: geometric mean
DP
OA
E [d
B S
PL]
DPOAE: Subject LRM, Right and Left ears
DPOAE Right EarDPOAE Left EarNoise measured Right EarNoise measured Left Ear
Figure L.10: DPOAEs of right and left ears in subje t LRM. This subje t belongs to the ontrol population.122

L.3. RESULTS1000 1500 2000 3000 4000 6000
−20
−15
−10
−5
0
5
10
15
20
25
30
Frequency [Hz]: geometric mean
DP
OA
E [d
B S
PL]
DPOAE: Subject IRS, Right and Left ears
DPOAE Right EarDPOAE Left EarNoise measured Right EarNoise measured Left Ear
Figure L.11: DPOAEs of right and left ears in subje t IRS. This subje t belongs to the ontrol population.1000 1500 2000 3000 4000 6000
−20
−15
−10
−5
0
5
10
15
20
25
30
Frequency [Hz]: geometric mean
DP
OA
E [d
B S
PL]
DPOAE: Subject HCR, Right and Left ears
DPOAE Right EarDPOAE Left EarNoise measured Right EarNoise measured Left Ear
Figure L.12: DPOAEs of right and left ears in subje t HCR. This subje t belongs to the ontrol population.123

APPENDIX L. HEARING THRESHOLD AND DPOAES1000 1500 2000 3000 4000 6000
−20
−15
−10
−5
0
5
10
15
20
25
30
Frequency [Hz]: geometric mean
DP
OA
E [d
B S
PL]
DPOAE: Subject EDR, Right and Left ears
DPOAE Right EarDPOAE Left EarNoise measured Right EarNoise measured Left Ear
Figure L.13: DPOAEs of right and left ears in subje t EDR. This subje t belongs to the target population.1000 1500 2000 3000 4000 6000
−20
−15
−10
−5
0
5
10
15
20
25
30
Frequency [Hz]: geometric mean
DP
OA
E [d
B S
PL]
DPOAE: Subject LRI, Right and Left ears
DPOAE Right EarDPOAE Left EarNoise measured Right EarNoise measured Left Ear
Figure L.14: DPOAEs of right and left ears in subje t LRI. This subje t belongs to the target population.124

L.3. RESULTS1000 1500 2000 3000 4000 6000
−20
−15
−10
−5
0
5
10
15
20
25
30
Frequency [Hz]: geometric mean
DP
OA
E [d
B S
PL]
DPOAE: Subject CLS, Right and Left ears
DPOAE Right EarDPOAE Left EarNoise measured Right EarNoise measured Left Ear
Figure L.15: DPOAEs of right and left ears in subje t CLS. This subje t belongs to the target population.1000 1500 2000 3000 4000 6000
−20
−15
−10
−5
0
5
10
15
20
25
30
Frequency [Hz]: geometric mean
DP
OA
E [d
B S
PL]
DPOAE: Subject ERC, Right and Left ears
DPOAE Right EarDPOAE Left EarNoise measured Right EarNoise measured Left Ear
Figure L.16: DPOAEs of right and left ears in subje t ERC. This subje t belongs to the target population.125

APPENDIX L. HEARING THRESHOLD AND DPOAES1000 1500 2000 3000 4000 6000
−20
−15
−10
−5
0
5
10
15
20
25
30
Frequency [Hz]: geometric mean
DP
OA
E [d
B S
PL]
DPOAE: Subject LRM, Right and Left ears
DPOAE Right EarDPOAE Left EarNoise measured Right EarNoise measured Left Ear
Figure L.17: DPOAEs of right and left ears in subje t JLS. This subje t belongs to the target population.1000 1500 2000 3000 4000 6000
−20
−15
−10
−5
0
5
10
15
20
25
30
Frequency [Hz]: geometric mean
DP
OA
E [d
B S
PL]
DPOAE: Subject SMN, Right and Left ears
DPOAE Right EarDPOAE Left EarNoise measured Right EarNoise measured Left Ear
Figure L.18: DPOAEs of right and left ears in subje t SMN. This subje t belongs to the target population.126

L.3. RESULTS1000 1500 2000 3000 4000 6000
−20
−15
−10
−5
0
5
10
15
20
25
30
Frequency [Hz]: geometric mean
DP
OA
E [d
B S
PL]
DPOAE: Subject YSN, Right and Left ears
DPOAE Right EarDPOAE Left EarNoise measured Right EarNoise measured Left Ear
Figure L.19: DPOAEs of right and left ears in subje t YSN. This subje t belongs to the target population.1000 1500 2000 3000 4000 6000
−20
−15
−10
−5
0
5
10
15
20
25
30
Frequency [Hz]: geometric mean
DP
OA
E [d
B S
PL]
DPOAE: Subject NCL, Right and Left ears
DPOAE Right EarDPOAE Left EarNoise measured Right EarNoise measured Left Ear
Figure L.20: DPOAEs of right and left ears in subje t NCL. This subje t belongs to the target population.127
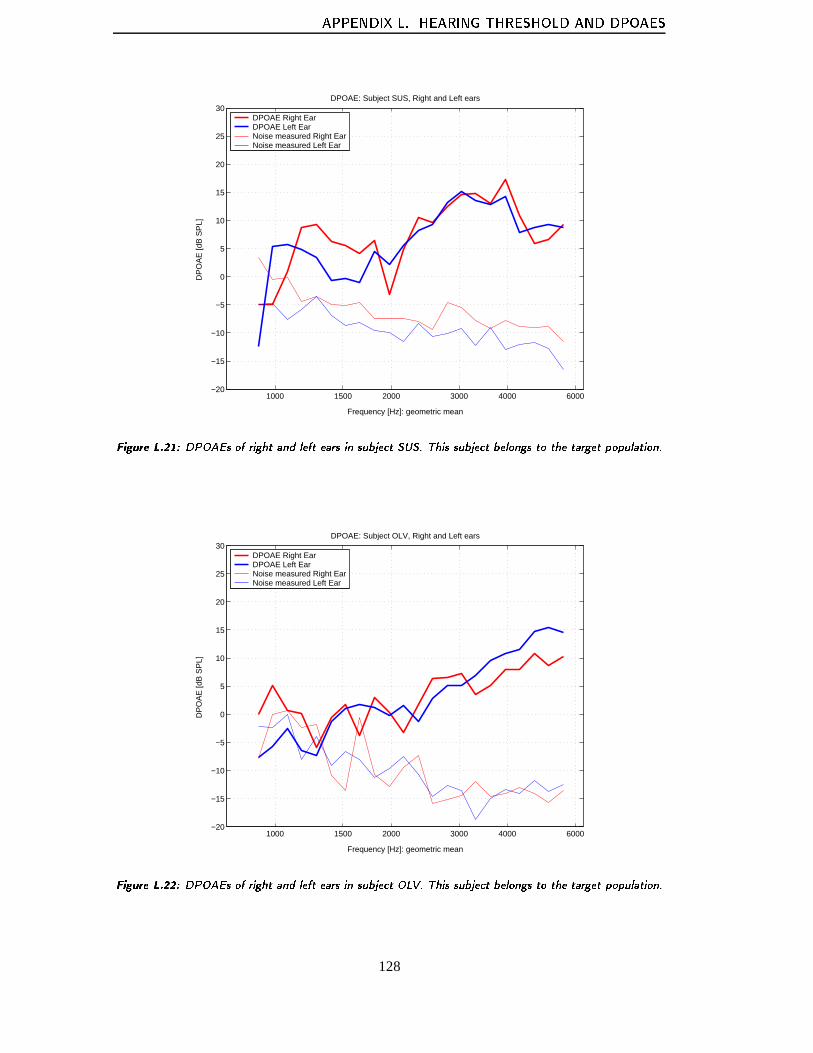
APPENDIX L. HEARING THRESHOLD AND DPOAES1000 1500 2000 3000 4000 6000
−20
−15
−10
−5
0
5
10
15
20
25
30
Frequency [Hz]: geometric mean
DP
OA
E [d
B S
PL]
DPOAE: Subject SUS, Right and Left ears
DPOAE Right EarDPOAE Left EarNoise measured Right EarNoise measured Left Ear
Figure L.21: DPOAEs of right and left ears in subje t SUS. This subje t belongs to the target population.1000 1500 2000 3000 4000 6000
−20
−15
−10
−5
0
5
10
15
20
25
30
Frequency [Hz]: geometric mean
DP
OA
E [d
B S
PL]
DPOAE: Subject OLV, Right and Left ears
DPOAE Right EarDPOAE Left EarNoise measured Right EarNoise measured Left Ear
Figure L.22: DPOAEs of right and left ears in subje t OLV. This subje t belongs to the target population.128

L.3. RESULTS1000 1500 2000 3000 4000 6000
−20
−15
−10
−5
0
5
10
15
20
25
30
Frequency [Hz]: geometric mean
DP
OA
E [d
B S
PL]
DPOAE: Subject JON, Right and Left ears
DPOAE Right EarDPOAE Left EarNoise measured Right EarNoise measured Left Ear
Figure L.23: DPOAEs of right and left ears in subje t JON. This subje t belongs to the target population.1000 1500 2000 3000 4000 6000
−20
−15
−10
−5
0
5
10
15
20
25
30
Frequency [Hz]: geometric mean
DP
OA
E [d
B S
PL]
DPOAE: Subject CLA, Right and Left ears
DPOAE Right EarDPOAE Left EarNoise measured Right EarNoise measured Left Ear
Figure L.24: DPOAEs of right and left ears in subje t CLA. This subje t belongs to the target population.129

APPENDIX L. HEARING THRESHOLD AND DPOAES1000 1500 2000 3000 4000 6000
−20
−15
−10
−5
0
5
10
15
20
25
30
Frequency [Hz]: geometric mean
DP
OA
E [d
B S
PL]
Mean DPOAE Left Ear Control PopulationMean DPOAE Right Ear Control PopulationMean Noise DPOAE Left Ear Control PopulationMean Noise DPOAE Right Ear Control Population
Figure L.25: Mean and standard deviation DPOAE of the test subje ts of the ontrol population for left andright ear.1000 1500 2000 3000 4000 6000
−20
−15
−10
−5
0
5
10
15
20
25
30
Frequency [Hz]: geometric mean
DP
OA
E [d
B S
PL]
Mean DPOAE Left Ear Target PopulationMean DPOAE Right Ear Target PopulationMean Noise DPOAE Left Ear Target PopulationMean Noise DPOAE Right Ear Target Population
Figure L.26: Mean and standard deviation DPOAE of the test subje ts of the target population for left andright ear.130

APPENDIX M
L ISTENING ENVIRONMENTS
The following appendix describes the simulation of the quiet/moderate and noisy environmentsof the listening test. The background noise in a bus and in a street are used as referencesenvironments to simulate these situations respectively.M.1 MethodThe simulation is done in a listening room by playing in an omnidirectional source two differentsignals corresponding to each environment. The omnidirectional sound source is used becauseit allows to create a semi-diffuse sound field where the soundpressure level is approximately thesame in all the room. This is desired because in a real situation where a MP with headphones isused, the background noise generally corresponds to a semi-diffuse sound field.M.2 Equipment and SetupThe complete listening test setup is shown in Figure M.1. In this figure it can be seen the soundsource which produces the environments as well as the computer and the amplifier that drive thesignals. Table M.1 lists the equipment utilized.
Item Model LAB-Nr:Omnidirectional sourcePower Amplifier 00000000 00000000Computer 00000000 00000000Table M.1: Equipment used for the listening test.M.2.1 Sound Stimuli for the Environments
Most noise in the environments contains energy at many different frequencies combining to-gether to give it its overall character. Therefore is complicated to analyze these environments.
The noise from a bus is a continuous non stationary noise, which has its energy content at lowfrequency. Moreover the amplitude of the signal varies overthe time because the noise emitted
131

APPENDIX M. LISTENING ENVIRONMENTSPC
Powerampin
out
out
test subject
Omnidirectionalsource
in
Listening roomFigure M.1: Setup used for the listening test. The subje t is equipped with his own portable MP or withthe referen e portable MP used in the pilot test. The task of the subje t in this part of thelistening test is to adjust the ontrol volume position when a noisy (bus), a moderate (street),and a quiet (silen e) sound environments are being simulated.by a bus depends on its speed, its acceleration and many otherparameters. Therefore it is acomplex sound which is difficult to simulate.
The noise from a street can be related to many different noises. In this case it is defined asenvironmental noise, for example the song of a bird, some cars passing by or the sound of thewind, corresponding to a quiet or moderate environment.
These environments are simulated with two WAV files: one recorded inside of a bus and onerecorded in a street. These signals are obtained from a sounddatabase in Internet [2]. The signalfor the bus environment is a sample of 46seconds which contains some of the different noisesthat can be produced in a bus, for example people talking, thesound produced when openingand closing the doors of the bus, or the sound produced by the bus when braking or starting.The signal for the street environment is a sample of 90seconds which contains different noisesthat can be recorded in a quiet street.
Figures M.3 and M.2 show the time signals that are used.
A possible problem with these signals is that they are not very long, so the subject may needmore time than the duration of these files to adjust the volume. For this reason each of thesesignals is concatenated until getting a duration of 5minutes approximately each one. The con-catenation is done as a linear cross-fade of 5seconds between the signals to concatenate. Thesignals are amplified such that the energy of the end of the first file is equal to the energy of thenext file. Figure M.4 shows an example of a pair of files of the street environment concatenated.
132

M.2. EQUIPMENT AND SETUP0 5 10 15 20 25 30 35 40 45
−1
−0.8
−0.6
−0.4
−0.2
0
0.2
0.4
0.6
0.8
1
Time(s)
Am
plitu
de
Figure M.2: Noise signal used for the simulation of the bus listening environmentIn order to decide the sound pressure level at which these files have to be played, some fieldmeasurements are performed inside of two buses and in a street..M.2.2 ResultsNoise levels were measured using a Monacor SM-4 sound level meter set to a A-weighting slowmeter response. The slow meter response is selected becausethe reading of the values in thesound level meter is easier. This is because the integrationtime in order to calculate the soundpressure level is longer when using the slow meter response in the sound level meter.
The objective of these measurements is to obtain a maximum and a minimum sound pressurelevel for each of the environments mentioned before. In order to do that several measurementsare done in each environment. The time of the performance of the measurement is alwaysbetween 10 A.M. and 4 P.M.M.2.3 Bus MeasurementsThese measurements are performed inside of the buses number2 and number 12 at Aalborg(Denmark). Measurements in bus stops are not carried out.Since the noise in a bus may vary depending on many variables such as the recording time,the type of bus, the traffic noise, the number of passengers traveling in the bus, etc. a total of18 measurements are performed in different moments. These measurements are carried out inthree different positions in the bus: In the end, in the middle and in the beginning of the bus.Moreover two repetitions are performed in each position in different moments: When the busstops, when the bus moves and when the bus starts or brakes.
133

APPENDIX M. LISTENING ENVIRONMENTS0 10 20 30 40 50 60 70 80 90
−1
−0.8
−0.6
−0.4
−0.2
0
0.2
0.4
0.6
0.8
1
Time(s)
Am
plitu
de
Figure M.3: Noise signal used for the simulation of the street listening environmentM.2.4 Street MeasurementsTo estimate the sound pressure level in a street is not a easy task, as well as in the bus, becausemany parameters have an important influence in the sound pressure level measured. Since theidea is to simulate an environment with a moderate or low noise level, a not very noisy streetclose to Aalborg University is used. The street selected is Fredrik Bajers Vej. The measurementsare performed close to the entrance of the building seven of Aalborg University, which is in thisstreet. There are different noises that can be recorded in this street depending on the situation.In this case the measurement is focus on recording the level of the sound produced by peopletalking in the street with a moderate or low environmental noise. Moreover the position in thestreet is taken into account for the recordings. Therefore two positions are defined: close to theroad and far away from the road. A total of 9 measurements are performed in different momentsdepending on the amount of people present.M.2.5 Field Measurements ResultsThe data were collected by a reading of the screen in the soundlevel meter. Table M.2 and TableM.3 shows the data collected for thestreetenvironment and thebusenvironment respectively.These tables show A-weighted sound pressure levels.
From the results of this appendix, the maximum and minimum sound pressure level measuredfor the listening environments are obtained. These are 90 and 106.2dB for thebus listeningenvironment and 64.5 and 77,3dB SPL for thestreetlistening environment.
After testing these levels in the listening room used for thesimulation it was observed that thenoise levels in thebussituation where to high compare to a read situation. For these reason itwas decided to reduce this levels until a realistic situation was achieved.
134

M.2. EQUIPMENT AND SETUP20 40 60 80 100 120 140 160
−1
−0.8
−0.6
−0.4
−0.2
0
0.2
0.4
0.6
0.8
1
Time(s)
Am
plitu
de
Figure M.4: Signal of the street listening environment reated by on atenating the sele ted �le twi e in arow.Positions in the bus
State of the bus Beginning Middle Endstopped 90 88,8 95starting 93,7 96,0 98moving 96 95,7 106,2stopped 89,0 90 97starting 94,4 94 98,8moving 99,7 98 104,7Table M.2: A-weighted sound pressure level measured for the bus listening environment. Three di�erent posi-tions in the bus and three di�erent states of the bus are taken into a ount. These measurementsare performed twi e.
Number of people presentPosition in the street 0-2 persons More than 2 persons
close to the road 65,4 70,2far from the road 50,9 63,9close to the road 77,3 70,9far from the road 66,0 65,4Table M.3: A-weighted sound pressure level measured for the street listening environment. Di�erent situa-tions are taken into a ount depending on the amount of people present in the re ording anddepending on the position in the street. These measurements are performed twi e.
135


APPENDIX N
ANALISY OF VA RIANCE (ANOVA)
In this appendix it can be found a brief explanation of the ANOVA test method applied.ANOVA is used to test for the equality of several means. The test designed with two factorrequires a two-way ANOVA. By which it is possible to test the equality among the treatmentmeans of the two factors as well as the interactions between them. The treatments means of eachfactor is tested for equality and it can be stated if, they aredifferent within a level of significance.
Furthermore, the two-way ANOVA provides a knowledge about the interaction effect of the fac-tors. This effect is best explained by a small example: A person might like both fish and meatseparately. But when mixing them (interaction), the taste might not please the person.
Statistical hypotheses are a statement about the problem situation. The population mean for thei’th treatment is denotedµi, the tested null-hyphothesisH0 is denoted as:
H0 : µ1 = µ2 = ... = µi.
In order to test the hyphoteses the standard level of significance among statisticians is used. Thisvalue is noted asα, moreover it is equal to 0.05. This implies a maximun of 5% of probabilityof making a Type I Error. This error occurrs if the null hypothesis is rejected when it is true. Itcan be noted as:
α = P(type I error) = P(re ject H0 |H0 is true)
Three assumptions are required for the ANOVA method to be exact, however a violations ofthese assuptions does not necessarily to lead false conclusions:
1. The treatment data must be normally distributed
2. The variance must be the same for all treatments
3. The observations must be independient. Being an observation one of the possible convina-tions between the treatments of the two factors.
Figure N.1shows the normalization plot. The observations marked with circles are normallydistributed if the residual from the line is small.
137

APPENDIX N. ANALISY OF VARIANCE (ANOVA)
Figure N.1: Representation of the normalization plot of the dependent variables: LFF,Aeq(left-up), LEX,8h(right up), HL(left-down), DPOAEL(right-down)The compliance with the second assumption can be appreciated from the standard deviationvalues shown in the listening level, exposure level, hearing thresholds and DPOAEs analysisperformed for this project.
The third assumption can be assumed since there are two different groups of test subjects.
138

APPENDIX O
I NDEPENDENT SAMPLES T-T EST
ANALYSIS
In this appendix it can be found a brief explanation of the T-tests test method applied.
An Independent Samples T-test compares the mean scores of two groups on a given variable. Inthis test the dependent variables are:LFF,Aeq, HL and DPOAEL.
The next assumptions are made:
• The dependent variable is normally distributed. It can be appreciated from Figure N.1.
• The two groups have approximately equal variance on the dependent variable. The equal-ity of variances is tested using Levenet’s Test. It is explained below.
• The two groups are independent of one another
The hypotheses formulated are:
• Null: The means of the two treatments tested are not significantly different.
• Alternate: The means of the two treatments tested are significantly different
The null hypotheses can be rejected if the p-value obtained from the t-test is less than 0.05.O.0.6 Listening Level T-testThis section describes the T-Tests performed by the treatments defined for factor environment.These treatments are: very quiet, quiet/moderate and noisyenvironment. TheLFF,Aeqmeans arecompared in groups of two by two. Then, the three T-test performed are:
1. T-test beetween: Very quiet and quite/moderate environment
2. T-test beetween: Very quiet and noisy environment
3. T-test beetween: Quite moderate and noisy environment
139

APPENDIX O. INDEPENDENT SAMPLES T-TEST ANALYSIST-test between: very quiet and quite/moderate environmentIn Table O.1 the results of the Levenet’s test are shown. The significance value (Sig) is 0.012which is smaller than 0.05. Then, it can not be assumed that the variances of both groups areapproximately equal. Therefore a p-value equal to 0,084 canbe read from the second line ofTable O.1.
Levene’s Test t-test for Equality of MeansHL F Sig t df p-value Mean Std. Error Confidence Interval
Assumption Difference Difference Lower UpperEqual variances 6.933 0.012 -1.780 42 0.082 -4.015 2.255 -8.568 0.536
Not Equal variances -1.780 33.980 0.084 -4.015 2.255 -8.600 0.568Table O.1: Results from Independent Samples T-test between: very quiet and quite/moderate environment.T-test between: quiet/moderate and noisy environmentTable O.2 shows the results of the Levenet’s test and the Independent Samples T-test. Since Sigis equal to 0.186, it can assume that the variances are approximately equal.The p-value obtained from the T-test is 0.067, which is greater than 0.05.
Levene’s Test t-test for Equality of MeansHL F Sig t df p-value Mean Std. Error Confidence Interval
Assumption Difference Difference Lower UpperEqual variances 1,812 0.186 -1.880 42 0.067 -2.788 1.482 -5.780 0.204
Not Equal variances -1.880 40.534 0.067 -2.788 1.482 -5.783 0.207Table O.2: Results from Independent Samples T-test between: quiet/moderate and noisy environment.T-test between: very quiet and noisy environmentTable O.3 shows that it can not be assumed equality of variances. However, the null hypothesiscan be rejected as the p-value is 0.004.
Levene’s Test t-test for Equality of MeansHL F Sig t df p-value Mean Std. Error Confidence Interval
Assumption Difference Difference Lower UpperEqual variances 17.514 0.001 -3.148 42 0.003 -6.804 2.162 -11.165 -2.442
Not Equal variances -3.148 30.370 0.004 -6.804 2.162 -11.215 -2.392Table O.3: Results from Independent Samples T-test between: very quiet and noisy environment.140

O.0.7 Hearing Threshold and DPOAE T-testIn this sections there is not described in detail the procedure followed to obtained the resultsfrom each T-Tests performed. A single matrix which containsthe p-value results from each testis shown.HL T-test among the ears of both populationsTable O.4 shows the p-values obtained from the HL T-Tests performed among the two ears ofboth populations.
LC RC LT RTLC 0.378 0.000 0.000RC 0.378 0.006 0.005LT 0.000 0.006 0.837RT 0.000 0.005 0.837Table O.4: Results from Independent Samples T-test: among the ears of both populationsHL T-test among the frequen ies
Table O.5 shows the p-values obtained from the HL T-Tests performed among the 10 frequenciestested.
250 500 750 1000 1500 2000 3000 4000 6000 8000250 0.287 0.309 0.537 0.410 0.641 0.783 0.2110.000 0.037500 0.287 1.000 0.571 0.843 0.546 0.169 0.6790.000 0.002750 0.309 1.000 0.534 0.851 0.565 0.190 0.6890.000 0.0031000 0.537 0.571 0.534 0.753 0.914 0.346 0.3890.000 0.0041500 0.410 0.843 0.851 0.753 0.705 0.266 0.5780.000 0.0052000 0.641 0.546 0.565 0.914 0.705 0.449 0.3770.000 0.113000 0.783 0.169 0.190 0.346 0.266 0.449 0.1340.000 0.624000 0.211 0.679 0.689 0.389 0.578 0.377 0.134 0.001 0.0036000 0.000 0.000 0.000 0.000 0.000 0.000 0.000 0.001 0.0068000 0.037 0.002 0.003 0.004 0.0050.110 0.620 0.003 0.006Table O.5: Results from Independent Samples T-test among the ears of both populationsDPOAE T-test among the frequen ies
Table O.6 presents the p-values obtained from the DPOAE T-Tests performed among the twoears of both populations. A dependence between right and left ears of control and target popu-lations is found.
141

APPENDIX O. INDEPENDENT SAMPLES T-TEST ANALYSISLC RC LT RT
LC 0.416 0.000 0.000RC 0.416 0.000 0.001LT 0.000 0.000 0.568RT 0.000 0.001 0.568Table O.6: Results from Independent Samples T-test among the ears of both populationsDPOAE T-test among the frequen ies
The p-values obtained from the the DPOAE T-tests carried outamong the 22 frequencies testedin DPOAE are presented in table O.7.
142

905 984 1076 1172 1282 1398 1524 1658 1810 1980 2156905 0.624 0.372 0.132 0.065 0.132 0.018 0.015 0.018 0.090 0.144984 0.624 0.683 0.280 0.148 0.283 0.050 0.039 0.052 0.215 0.3181076 0.372 0.683 0.470 0.269 0.481 0.105 0.081 0.115 0.394 0.5441172 0.132 0.280 0.470 0.706 0.971 0.413 0.326 0.479 0.960 0.8631282 0.065 0.148 0.269 0.706 0.673 0.680 0.553 0.782 0.719 0.5661398 0.132 0.283 0.481 0.971 0.673 0.380 0.298 0.441 0.927 0.8901524 0.018 0.050 0.105 0.413 0.680 0.380 0.833 0.862 0.399 0.2861658 0.015 0.039 0.081 0.326 0.553 0.298 0.833 0.698 0.310 0.2211810 0.018 0.052 0.115 0.479 0.782 0.441 0.862 0.698 0.465 0.3311980 0.090 0.215 0.394 0.960 0.719 0.927 0.399 0.310 0.465 0.8062156 0.144 0.318 0.544 0.863 0.566 0.890 0.286 0.221 0.331 0.8062350 0.044 0.113 0.225 0.694 0.982 0.446 0.630 0.500 0.736 0.704 0.5352563 0.019 0.055 0.119 0.479 0.777 0.442 0.873 0.710 0.991 0.466 0.3332793 0.091 0.214 0.390 0.947 0.734 0.914 0.415 0.324 0.484 0.985 0.7943049 0.010 0.032 0.077 0.397 0.693 0.359 0.948 0.769 0.899 0.373 0.2533316 0.001 0.005 0.012 0.104 0.233 0.087 0.416 0.582 0.289 0.082 0.0503626 0.000 0.000 0.000 0.000 0.002 0.000 0.005 0.015 0.001 0.000 0.0003948 0.000 0.000 0.000 0.000 0.000 0.000 0.000 0.001 0.000 0.000 0.0004306 0.000 0.000 0.000 0.000 0.001 0.000 0.002 0.006 0.001 0.000 0.0004695 0.000 0.000 0.000 0.007 0.021 0.005 0.043 0.082 0.022 0.004 0.0025121 0.000 0.000 0.000 0.002 0.006 0.001 0.013 0.030 0.005 0.001 0.0005582 0.000 0.000 0.000 0.001 0.006 0.001 0.012 0.027 0.005 0.001 0.000
2350 2563 2793 3049 3316 3626 3948 4306 4695 5121 5582905 0.044 0.019 0.091 0.010 0.001 0.000 0.000 0.000 0.000 0.000 0.000984 0.113 0.055 0.214 0.032 0.005 0.000 0.000 0.000 0.000 0.000 0.0001076 0.225 0.119 0.390 0.077 0.012 0.000 0.000 0.000 0.000 0.000 0.0001172 0.694 0.479 0.947 0.397 0.104 0.000 0.000 0.000 0.007 0.002 0.0011282 0.982 0.777 0.734 0.693 0.233 0.002 0.000 0.001 0.021 0.006 0.0061398 0.446 0.442 0.914 0.359 0.087 0.000 0.000 0.000 0.005 0.001 0.0011524 0.630 0.873 0.415 0.948 0.416 0.005 0.000 0.002 0.043 0.013 0.0121658 0.500 0.710 0.324 0.769 0.582 0.015 0.001 0.006 0.082 0.030 0.0271810 0.736 0.991 0.484 0.899 0.289 0.001 0.000 0.001 0.022 0.005 0.0051980 0.704 0.466 0.985 0.373 0.082 0.000 0.000 0.000 0.004 0.001 0.0012156 0.535 0.333 0.794 0.253 0.050 0.000 0.000 0.000 0.002 0.000 0.0002350 0.731 0.722 0.633 0.175 0.001 0.000 0.000 0.011 0.003 0.0022563 0.731 0.484 0.112 0.302 0.002 0.000 0.001 0.024 0.006 0.0052793 0.722 0.484 0.860 0.090 0.000 0.000 0.000 0.005 0.001 0.0013049 0.633 0.112 0.860 0.995 0.001 0.000 0.000 0.023 0.005 0.0053316 0.175 0.302 0.090 0.995 0.036 0.003 0.014 0.174 0.670 0.0623626 0.001 0.002 0.000 0.001 0.036 0.277 0.532 0.673 0.979 0.9533948 0.000 0.000 0.000 0.000 0.003 0.277 0.713 0.192 0.371 0.3864306 0.000 0.001 0.000 0.000 0.014 0.532 0.713 0.360 0.606 0.6254695 0.011 0.024 0.005 0.023 0.174 0.673 0.192 0.360 0.691 0.6705121 0.003 0.006 0.001 0.005 0.670 0.979 0.371 0.606 0.691 0.9775582 0.002 0.005 0.001 0.005 0.062 0.953 0.386 0.625 0.670 0.977Table O.7: Results from Independent Samples T-test among the frequen ies
143


APPENDIX P
STATISTICAL ANALYSIS
This appendix contains a list of Tables and Figures obtainedduring from statistical analysis.
Table P.1 represents the HL mean and the standard desviationvalues of the data collected fromaudiometric test.
Factor B Mean HL (dB) Standard Deviation Number of Subjects HL Meanf(Hz) LC RC LT RT LC RC LT RT Control Target (dB)250 0.50 1.50 3.00 2.00 4.12 4.97 6.32 8.88 10 10 1.75500 4.50 5.50 2.00 0.50 3.69 3.69 6.15 6.32 10 10 3.12750 4.00 5.00 -0.50 4.00 7.07 4.59 5.27 5.5 10 10 3.121000 2.50 4.50 1.50 1.50 6.43 3.54 4.22 3.37 10 10 2.501500 5.00 4.00 3.00 -1.00 4.97 4.71 6.99 5.87 10 10 2.872000 4.00 5.00 -0.50 1.00 4.71 5.16 4.97 6.85 10 10 2.373000 1.50 2.00 0.00 -2.00 4.83 4.12 5.37 7.82 10 10 0.374000 6.50 8.00 -2.50 3.00 8.23 5.8 6.77 7.17 10 10 3.756000 11.00 13.00 6.50 10.00 5.37 10.22 5.16 8.51 10 10 10.128000 -0.50 -0.50 -1.00 -3.50 6.85 6.85 6.35 8.76 10 10 -1.37Mean (dB) 3.90 4.85 1.15 1.55Table P.1: Data olle ted from the from audiometri test.
Table P.2 presents the DPOAE mean and the standard desviation values of the data collectedfrom DPOAE measurements.
145

APPENDIX P. STATISTICAL ANALYSISFactor B MeanLFF,Aeq (dB) Standard Deviation Number of Subjects DPOAE Meanf(Hz) LC RC LT RT LC RC LT RT Control Target (dB)904,89 -2.55 -5.60 -0.22 3.64 6.93 4.90 6.37 6.81 10 10 -1.18983,68 -2.41 -0.30 3.62 1.70 6.39 5.37 4.88 4.45 10 10 0.651075,53 0.21 -3.56 2.27 2.43 5.52 5.34 6.59 4.78 10 10 0.331172,27 -1.27 0.17 4.22 2.54 8.23 6.22 6.64 6.10 10 10 1.411281,62 1.05 -0.62 3.45 4.31 6.72 8.40 6.71 7.02 10 10 2.041397,59 0.71 -1.26 2.51 3.30 6.53 5.50 8.51 5.45 10 10 1.311524,34 2.14 0.33 4.21 3.99 6.63 5.23 7.30 7.11 10 10 2.661657,81 0.39 1.81 5.01 5.69 9.27 5.63 6.19 5.54 10 10 3.221809,77 2.23 2.57 3.56 2.96 6.38 3.79 5.10 4.96 10 10 2.831979,87 -0.35 1.44 2.57 2.32 7.48 4.30 4.96 6.62 10 10 1.492155,95 0.27 1.59 1.88 2.62 6.16 4.95 4.57 4.21 10 10 1.592349,98 0.41 2.34 2.89 3.36 5.53 5.78 4.82 6.05 10 10 2.252562,70 2.24 2.58 2.94 3.62 4.87 4.32 6.21 6.31 10 10 2.842793,45 1.40 1.46 1.76 2.34 5.89 3.64 7.65 6.07 10 10 1.743048,78 0.92 2.02 3.72 3.54 5.43 4.38 5.08 5.86 10 10 2.553316,17 2.88 4.53 4.48 3.73 6.65 5.18 6.47 6.15 10 10 3.903626,17 5.41 6.39 7.88 5.93 5.86 6.05 5.79 4.27 10 10 6.403948,24 6.65 7.59 9.30 7.43 6.42 6.26 5.40 5.36 10 10 7.744305,73 7.32 7.97 8.57 6.67 6.95 8.24 4.85 4.86 10 10 7.634694,53 5.83 4.89 7.77 6.84 7.44 10.32 5.17 4.67 10 10 6.335120,51 5.44 6.08 9.57 7.16 8.44 8.42 3.84 3.57 10 10 7.065581,93 4.62 5.67 9.24 7.94 8.54 9.29 3.61 3.90 10 10 6.86Mean (dB) 4.60 4.27 1.97 2.18Table P.2: Data olle ted from DPOAE measurements.
146