listening to motherssm iii
TRANSCRIPT

Listening to MothersSM IIINew Mothers Speak Out
Eugene R. DeclercqCarol Sakala
Maureen P. CorrySandra Applebaum
Ariel Herrlich
June 2013
Report of National Surveys of Women’s Childbearing ExperiencesConducted October – December 2012 and January – April 2013
Childbirth Connection260 Madison Avenue, 8th Floor
New York, NY 10016P 212.777.5000F 212.777.9320
transform.childbirthconnection.org
Recommended citation:Declercq ER, Sakala C, Corry MP, Applebaum S, Herrlich A.Listening to Mothers SM III: New Mothers Speak Out.New York: Childbirth Connection, June 2013.
To obtain a file of this report and related resources, visit transform.childbirthconnection.org/reports/listeningtomothers/.For help representing or interpreting survey results or other survey-related matters, please contact [email protected].
The authors and issuing organization declare that they have no proprietary, financial, professional, or other interest that could be construed as influencing the content of this report.

I
Contents
List of Tables & Figures ............................................................................ III
Preface ................................................................................................. V
Major Survey Findings ............................................................................ IX
Maternal Well-Being ... IXChild Well-Being ... XIFamily and Relationships ... XIIEmployment, Maternity Leave, Child Care, and Health Insurance ... XIIIViews of Maternity Care Quality and Engaging in Maternity Care ... XIVLooking at Some Important Variations in Experience ... XVTrends: Comparing Results Across Listening to MothersSM Surveys ... XVIAdditional Results Describing Pregnancy and Birth Experiences ... XVII
Introduction .......................................................................................... 1
Who was Included in Our Sample, and How We Reached Them ... 1Data Analysis and Reporting ... 2Reading the Text, Tables, and Figures ... 3Selection of Quotations from Survey Participants ... 4Project Responsibility ... 4
1. Maternal Well-Being ........................................................................... 5
Postpartum Care ... 5Medical Care ... 7Burden of New Maternal Health Concerns After Birth ... 8Postpartum Well-Being and Daily Activities ... 11Maintaining Wellness ... 13Mothers’ Postpartum Weight Loss ... 14Feelings After Birth ... 15Postpartum Mental Health ... 16
2. Child Well-Being ................................................................................. 18
Rating of Child’s Health ... 18Health Care ... 18Breastfeeding ... 21Selected Practices: Circumcision, Pacifier Use, Co-Sleeping ... 27
3. Family and Relationships ..................................................................... 29
Mothers with a Spouse, a Partner, or Neither ... 29Sharing Child Care with a Spouse or Partner ... 30Types of Support Available from a Spouse or Partner and from Others ... 31Attachment to the New Baby ... 33Hoped for Number of Children ... 34Assistance from WIC ... 34
LTM III: New Mothers Speak Out / Contents

II
4. Employment, Maternity Leave, Child Care, and Health Insurance ................. 35
Employment During Pregnancy ... 35Maternity Leave ... 36Employment After Birth ... 38Mothers Who Were Not Employed During Pregnancy ... 43Students ... 43Child-Care Arrangements ... 44Health Insurance ... 45
5. Views of Maternity Care Quality and Engaging in Maternity Care ................ 47
Opinions About Proper Use of Maternity Care Interventions ... 47General Perspectives on Maternity and Health Care Quality ... 49Perspectives on the Quality of Maternity Care that Mothers
had Recently Received ... 51Interest In and Views About the Right to Make Birth Choices ... 52Engagement, Information, and Decision Making in Maternity Care ... 55
6. Looking at Some Important Variations in Experience ................................. 57
Comparing Childbearing Experiences by Race and Ethnicity ... 58Comparing Childbearing Experiences by Primary Payer of
Maternity Care ... 62
7. Trends: Comparing Results Across Listening to MothersSM Surveys ................ 66
Conclusion ........................................................................................... 69
Appendix A Methodology ........................................................................ 73
Appendix B Demographic Overview of Survey Participants and Comparison with Federal Birth Certificate Data ............................................. 76
Appendix C Sources for New Listening to MothersSM Survey Items ..................... 78
Appendix D Additional Results for Pregnancy and Birth Experiences .................. 81
Learning About Pregnancy ... 81Prenatal Care and Planning for Birth ... 81Sources of Information About Pregnancy and Birth During Pregnancy ... 82Giving Birth ... 85
About Childbirth Connection, Harris Interactive, and the W.K. Kellogg Foundation .................................................................... 88
LTM III: New Mothers Speak Out / Contents

III
List of Tables & Figures
Tables
1 Provision of information on key topics, by type of birth attendant .......... 62 Provider advice on limiting total number of cesareans, by type of
birth attendant ........................................................................... 7
3 Rehospitalization of mothers and babies, by race/ethnicity ................... 84 Mothers’ experience of selected new-onset health problems in first
two months and at six months or more after birth .............................. 95 Extent to which pain interfered with mothers’ routine activities at
two time periods, by mode of birth .................................................. 12
6 Maintaining wellness .................................................................... 13
7 Mothers’ feelings in the first two months after birth ............................ 15
8 Persistence of symptoms of depression from initial to follow-up surveys .. 16
9 Use of mental health services, by depression screening scores in initial and follow-up surveys ................................................................... 17
10 Baby feeding patterns from 7 to 21 months postpartum ....................... 22
11 Mothers’ leading reasons for not establishing and for discontinuing breastfeeding ............................................................................. 23
12 Whether mothers breastfed as long as they liked, by insurance and support services .......................................................................... 24
13 Mothers’ awareness of breastfeeding recommendations from the American Academy of Pediatrics ..................................................... 26
14 Mothers’ breastfeeding intent and practice, with up to five previous births ............................................................................ 27
15 Types and level of support from spouse or partner .............................. 31
16 Types and level of support from others ............................................. 32
17 Feelings indicating mothers’ attachment to their babies ....................... 33
18 Employer support during pregnancy ................................................ 36
19 Mothers’ experience with paid maternity leave benefits ...................... 37
20 Mothers’ time away from paid work, by poverty status ........................ 40
21 Reasons mothers could not stay home as long as wanted ..................... 40
22 Challenges in mothers’ return to paid job .......................................... 41
23 Challenges in mothers’ transition to paid job ..................................... 42
24 Child-care arrangements, by employment status ................................ 44
25 Hours per week baby in child care, by employment status .................... 45
26 Out-of-pocket payments, by primary insurance source ......................... 46
27 Attitudes toward maternity-related tests and treatments ..................... 48
LTM III: New Mothers Speak Out / Tables & Figures

IV
Tables cont’d
28 Mothers’ ratings of the quality of maternity care and health care in the United States ......................................................................... 49
29 Rating factors that determine the quality of hospital maternity care ....... 50
30 Rating the quality of phases of care ................................................. 51
31 Concern about errors in the course of maternity and pediatric care ........ 52
32 Mothers’ openness to birth center and home births for any future pregnancies ....................................................................... 53
33 Mothers’ views about women’s right to choose a home birth ................ 53
34 Mothers’ views about women’s right to choose a mode of birth ............. 54
35 Attitudes toward future cesareans ................................................... 54
36 Maternity care practices: information and choice ............................... 55
37 Attitudes indicating activation relative to maternity care ...................... 56
38 Variation in mothers’ experiences, by race/ethnicity ............................ 59
39 Variation in mothers’ experiences, by primary payer of maternity care .... 63
40 Trends Across Listening to Mothers SM surveys ..................................... 67
41 Unweighted and weighted demographic profile of survey participants and comparison with federal birth certificate data .............................. 76
42 Prenatal providers’ recommended weight gain, by Body Mass Index (BMI) just before pregnancy ........................................................... 82
43 Value of selected online resources as sources of information about pregnancy and birth ..................................................................... 83
44 Impact of searching online for health information during pregnancy ....... 84
45 Rates of intervention that mothers experienced around the time of birth ...................................................................................... 86
Figures
1 Extent to which mothers’ physical health interfered with ability to care for baby in first two months after birth, by mode of birth ............... 11
2 Net maternal weight gain since conception, from birth through time of follow-up survey ...................................................................... 14
3 Number of well-child and sick-child visits, by age of child ...................... 19
4 Rate of exclusive breastfeeding from birth through 12 months .............. 21
5 Proportion of mothers who breastfed as long as they had wanted .......... 25
6 Frequency of baby co-sleeping in first six months after birth, by race/ethnicity ............................................................................. 28
7 Responsibility for baby care, by employment status ............................ 30
8 Weeks after birth when mothers began paid work, through the first year ............................................................................... 38
9 When mothers returned to a paid job after birth ................................ 39
LTM III: New Mothers Speak Out / Tables & Figures

V
Preface
Childbirth Connection’s ongoing Listening to MothersSM Initiative is devoted to un-derstanding experiences and perspectives of childbearing women, newborns, and families and using this knowledge to improve maternity policy, practice, education, and research. Listening to MothersSM surveys are central to this initiative. They en-able us to compare actual experiences of childbearing women and newborns to mothers’ values and preferences, as well as to optimal evidence-based care, optimal outcomes, and protections granted by law. Identified gaps present opportunities to improve conditions during this crucial developmental period for about four million mothers and babies annually in the United States.
The landmark Listening to MothersSM I survey (2002) was the first time that women in the United States were polled at the national level about their maternity experi-ences. It offered an opportunity to understand many dimensions of the maternity experience that had not previously been measured nationally, and provided what are likely to be much more accurate figures for numerous items that are measured but have been shown to be undercounted in other national data sources. Listening to MothersSM I results, presented in a survey report and focused articles, have been well received and widely cited. Most importantly, health plans, hospitals, profession-al organizations, advocacy groups, and others have used the survey results to inform their efforts to improve maternity care and women’s maternity experiences.
Listening to MothersSM II (2006), a national survey of women who gave birth in U.S. hospitals in 2005, continued to break new ground. In addition to continuing to docu-ment many core items measured in the first survey, the second survey also explored some topics in greater depth and some new and timely topics. We also recontacted mothers six months after they participated in Listening to MothersSM II, and most responded to a follow-up survey that about their postpartum experiences. Results from these surveys were presented in a report based on the initial survey, a follow-up report combining findings from both surveys, and focused articles, and have again been well-received and widely used in diverse contexts.
Listening to MothersSM III (2012), a national survey of women who gave birth in U.S. hospitals in 2011-12, again included both continuing items and new topics of special relevance to the rapidly evolving health and maternity care environments. We recently issued a report with initial results from that survey, focusing especially on pregnancy and birth. We were grateful to again be able to invite initial survey participants to complete a follow-up survey in the early months of 2013. This report presents results of the follow-up survey, drawing on initial survey results as needed. It includes an in-depth national look at women’s experiences in the months after giving birth from the perspective of maternal well-being, baby well-being, family and relationships, and employment and child care. Further, we examined many aspects of women’s views about the quality of maternity care and engaging in their care, and devote a chapter to these subjects. This report also looks at subgroup differences based on the three largest race/ethnicity groupings (white non-Hispanic, black non-Hispanic, and Hispanic
LTM III: New Mothers Speak Out / Preface

VI
women) and beneficiaries of the two largest maternity care payer groups (women covered by private insurance and Medicaid or CHIP, the Child Health Insurance Pro-gram), trends across multiple surveys, and (in the final appendix) some additional items describing pregnancy and birth experiences.
All five of the Childbirth Connection surveys noted above were planned and carried out by the same core investigator team and conducted by Harris Interactive®. Each benefited from a multi-disciplinary, multi-stakeholder National Advisory Council that provided guidance on survey development, implementation, and reporting. The sur-vey reports and related documents, including questionnaires and a list of all publica-tions to date, are available at www.childbirthconnection.org/listeningtomothers/. Childbirth Connection’s website focusing on maternity care quality improvement features both Listening to MothersSM III reports and a wealth of related resources, at transform.childbirthconnection.org/listeningtomothers/. We strongly encourage readers of this report to consult as well the companion report, Listening to Moth-ersSM III: Pregnancy and Birth (2013).
The datasets from the first three surveys are deposited in the Odum Institute Data Archive at the University of North Carolina (www.odum.unc.edu/odum/) and are publicly available for use by researchers and students. In the future, the new datas-ets will also be available in that archive.
The Listening to MothersSM survey questionnaires are valuable tools that can be ap-plied to other populations – to understand, for example, maternity experiences at the state level, within a health plan, among women using a particular hospital, or at the national level in another country. We welcome the opportunity to collaborate with others who wish to better understand mothers’ experiences in a diverse range of contexts and improve conditions for mothers, babies and families.
The survey results reported here clarify that there are many opportunities to im-prove the outcomes and experiences of childbearing women and their families in the postpartum period. They also point to opportunities to help women better understand and navigate their maternity care. We hope that those involved with childbearing families will review the results and identify priority areas for quality im-provement within their own work. We also hope survey results will increase aware-ness among childbearing women of these concerns and motivate them to learn more about safe and effective care, understand their maternity rights, and seek the best possible care and life circumstances for themselves and their babies.
Acknowledgments
We want to express our gratitude to the mothers in all 50 states who freely shared their maternity experiences with us at a time when they faced considerable respon-sibilities and challenges.
We are extremely grateful to the W.K. Kellogg Foundation for generous support of both the initial and follow-up Listening to MothersSM III surveys. Thanks especially to our Project Officer, Diana N. Derige, and to the Foundation’s Communications team.
LTM III: New Mothers Speak Out / Preface

VII
We thank everyone on the larger team that contributed to our survey and report. Roz Pierson, PhD, and our co-author Sandra Applebaum, MS, led the project team at Har-ris Interactive. Jessica Turon provided background research that contributed to our questionnaire development. Ellen Papciak-Rose designed this report. Amy Romano developed data briefs. Kat Song provided communications and media support.
We are grateful to members of the Listening to MothersSM III National Advisory Coun-cil, who provided guidance on the development, dissemination, and application of the new surveys. Their rich and varied perspectives have strengthened these proj-ects in many ways. They are:
Listening to Mothers SM III National Advisory Council
Rachel Abramson, RN, MS, IBCLCHealthConnect One
Jill ArnoldConsumer Representative
Shaudi Bazzaz, MPP, MPHCatalyst for Payment Reform
Leah Binder, MA, MGALeapfrog Group
Debra Bingham, DrPH, RNAssociation of Women’s Health, Obstetric and Neonatal Nurses
Kate Chenok, MBAPacific Business Group on Health
Maureen P. Corry, MPHChildbirth Connection
Katherine Criswell, RN, MSNProvidence Health & Services
Eugene R. Declercq, PhD, MBABoston University School of Public Health
Deborah Dee, PhD, MPHCenters for Disease Control and Prevention
Diana DerigeW.K. Kellogg Foundation
R. Louise Floyd, DSN, RNCenters for Disease Control and Prevention
LTM III: New Mothers Speak Out / Preface

VIII
Jack Fowler, PhDInformed Medical Decisions Foundation
Andrea Friedman, JDNational Partnership for Women & Families
Reem M. Ghandour, DrPH, MPAHealth Resources and Services Administration
Jane Hooker, RN, MN, CPHQNational Association of Public Hospitals and Health Systems
Paul Jarris, MDAssociation of State and Territorial Health Officials
Lorrie Kline Kaplan, CAEAmerican College of Nurse-Midwives
Leah Kaufman, MDAmerican College of Obstetricians and Gynecologists
Mary Lawlor, CPMNational Association of Certified Professional Midwives
Christine H. Morton, PhDCalifornia Maternal Quality Care Collaborative
Brian J. Osberg, MPHNational Governors Association
Carol Sakala, PhD, MSPHChildbirth Connection
Mark P. Sloan, MDThe Permanente Medical Group
Stephanie Teleki, PhDCalifornia HealthCare Foundation
Sarah Thomas, MSNational Committee for Quality Assurance
Additional Participant
Stephen Cha, MDCenter for Medicaid and CHIP Services
The authors and issuing organization bear full responsibility for the content of this report, which does not necessarily reflect the views of other individuals and groups named above.
LTM III: New Mothers Speak Out / Preface

IX
Major Survey Findings
This report presents results relating to women’s postpartum experiences from two national surveys carried out by Childbirth Connection. These surveys continued the work of Childbirth Connection’s first national Listening to MothersSM survey, which was conducted and reported in 2002 and the Listening to MothersSM II pregnancy and childbirth and postpartum follow-up surveys in 2006. For Listening to MothersSM III, 2400 mothers completed the survey online. All survey participants were 18 through 45 years, could participate in English, and had given birth to single babies in a U.S. hospital from July 1, 2011 through June 30, 2012. Participants completed the initial online survey, averaging about 30 minutes in length, from October through Decem-ber 2012. Mothers who completed the initial survey were recontacted and invited to complete a follow-up survey between January 29 and April 15, 2013. A total of 1072 mothers, or 45% of the initial participants, were reached and completed the survey.
To develop a national profile of childbearing women, the new datasets were adjusted with demographic and propensity score weightings using methodology developed and validated by Harris Interactive. Consequently, the results are generally represen-tative of U.S. mothers 18 through 45 who gave birth to single babies in a hospital in 2011-12. The respondents are generally comparable to published national data for U.S. birthing mothers on critical factors such as age, race/ethnicity, parity, birth attendant, and mode of birth. A recent report, Listening to MothersSM III: Pregnancy and Birth, presents key results from the initial survey, and the present report focuses on the women’s postpartum experiences and their values, preferences, and beliefs about maternity care and childbearing, with an appendix presenting selected addi-tional pregnancy and childbirth results.
Maternal Well-Being
Postpartum Office VisitsAmong the 10% of mothers who did not have a postpartum office visit between 3 and 8 weeks after birth, the leading reasons were that “I felt fine and didn’t need to go,” (42%), followed by “I felt that I had already completed all of my maternity care” (18%), “too hard to get to office” (12%), and “didn’t have insurance (7%).
Access to Postpartum CareThree-fourths (76%) of mothers stated that in the two months after their baby’s birth, they had a telephone number of a nurse, doctor, midwife, or health visitor to contact with any concerns about themselves or their babies.
Postpartum InformationMothers were most likely to say they were “definitely” given enough information from their providers about birth control methods (57%) and least likely to have been
LTM III: New Mothers Speak Out / Major Survey Findings

X
informed about changes in sexual response and feelings (30%). Women whose birth attendant had been a midwife were more likely to have adequate information about birth control methods while those who had had a family doctor birth attendant were most likely to have enough information about postpartum depression, healthy eating, exercise, and changes in sexual response.
Limiting Total Number of CesareansA little more than one fourth (28%) of mothers who had had one or more cesareans said they were told by their provider to limit the lifetime total number of cesareans they received, and the average maximum number of cesareans recommended was 3.2.
Regular Medical ProviderMost mothers relied on a family doctor (42%) as their medical provider after they completed maternity care, with 22% relying on an obstetrician/gynecologist, 9% on an internal medicine doctor, and 15% stating that they had no regular medical pro-vider. The lack of a regular medical provider was significantly higher among mothers whose birth had been paid for by Medicaid or CHIP (17%) than those with private insurance (10%).
Burden of Health Concerns After BirthIn the Listening to MothersSM III follow-up survey, we provided mothers with a list of 16 conditions and asked if these had been a new problem in the first two months af-ter birth, and, if so, whether they were a major or minor problem and whether they were still a problem at the time of the survey. Problems that were cited by at least two in five mothers included sleep loss (58% overall, 21% major), feeling stressed (54%, 17% major), physical exhaustion (51%, 16% major), sore nipples/breast tender-ness (48%, 12% major), backache (46%, 12% major), weight control (45%, 16% major), and lack of sexual desire (43%, 13% major). Mothers who had experienced a cesar-ean reported a problem with itching (51%, 13% major) and with numbness (48%, 12% major) at the scar.
At six or more months after birth, about one in three mothers (34%) indicated they were still feeling stressed, had problems with sleep loss (30%) or weight control (29%). Among those mothers who had had a cesarean, 20% reported continuing numbness, and 20% cited continued itchiness at the incision site.
Postpartum Health and Caring for BabyMothers were asked to rate if physical or emotional problems had interfered with their ability to care for their baby in the first two months after birth, and 37% re-ported their postpartum physical health interfered at least “some” with their ability to care for their baby, while 29% reported that their postpartum emotional health interfered at least “some.” More than half (56%) of mothers said that pain did inter-fere at least “a little bit” in their routine activities in the first two months, with 7% indicating that pain interfered either “quite a bit” (5%) or “extremely” (2%).
Weight ChangeWe learned in the initial Listening to MothersSM III survey that mothers had gained on average 24 pounds during their pregnancy and averaged losing 20 pounds at the time of that survey. We again asked about their weight at the time of the follow-up survey and, on average, mothers’ weight had not changed between the first and second surveys. The result is a net weight gain of 4 pounds from their weight just before becoming pregnant.
LTM III: New Mothers Speak Out / Major Survey Findings

XI
Current Mental Health StatusWe asked mothers about their emotional state in the two weeks prior to the follow-up survey, and about one in three mothers reported “feeling down, depressed or hopeless” (35%) or having “little interest or pleasure in doing things” (36%) for at least several days in the past two weeks. A total of 6% reported “feeling down” and 7% felt “little interest” nearly every day. Applying an algorithm used with these questions to screen for depression resulted in 17% of mothers meeting criteria for likely depression.
Consulting a Professional About Emotional or Mental Well-beingWe asked mothers in the follow-up survey if at any time since birth they had con-sulted a mental health or health care professional about their emotional or mental well-being, and 18% reported they had. Mothers who met the screening criteria for depression were much more likely to have sought help (37%) than those who did not (14%), though this means 63% of mothers with indicators of depression had not con-sulted a professional for help.
Child Well-Being
Overall Rating of Child’s HealthWe asked mothers to rate their child’s current health. The mothers were generally very positive, with 98% saying their child’s health was excellent (78%) or good (20%).
Child Health Care ProvidersPediatricians were most often (79%) named by mothers as their child’s primary care provider. Family doctors (17%), nurse-practitioners (2%), and physician assistants (1%) accounted for the remainder. Use of a family physician was greatest among mothers who had relied on a family physician for their prenatal care (79%).
Breastfeeding DurationMothers described the pattern of duration of exclusive breastfeeding over a twelve-month period, with rates ranging from 50% in the first month to 37% at the end of three months, 17% at six months, 9% at nine months, and 2% at one year.
Reasons for Not Establishing or Continuing BreastfeedingWe asked the mothers who intended to breastfeed but were not doing so a week after the birth the reasons they didn’t, and “baby had difficulty nursing” (31%) was most commonly cited, followed by “too hard to get breastfeeding going” (23%), “for-mula more convenient” (23%), and “I didn’t get enough support to get breastfeed-ing going” (17%). We asked a similar question of mothers who were breastfeeding, either exclusively or in combination with formula feeding, at one week but were no longer doing so at the time of the follow-up survey, and the leading answers were “trouble getting breastfeeding going well” (39%), “fed my baby breast milk as long as I intended to” (22%), “formula or solid food more convenient” (22%), and “baby stopped nursing – baby’s decision” (18%).
Immunization PreferencesWe asked mothers about their approach to immunizations relative to the recom-mended schedule of immunizations, and 83% of mothers indicated they preferred
LTM III: New Mothers Speak Out / Major Survey Findings

XII
to get all immunizations according to guidelines, while 12% preferred to make modi-fications (for example, in the schedule or dose), and 3% preferred not to have their children immunized. We explored differences by region, and mothers living in the Western part of the United States (7%) were more likely to prefer to avoid immuni-zation compared with mothers from the Northeast (0%).
Satisfaction with Duration of BreastfeedingWe asked all mothers who did breastfeed and were not currently doing so if they had breastfed as long as they wanted. Half (49%) stated that they had.
CircumcisionAlmost eight in ten mothers (79%) who gave birth to a son reported that he had been circumcised, with use varying widely by race/ethnicity. First-time Hispanic mothers were far less likely (54%) than first-time white (87%) or black (88%) non-Hispanic mothers to have their son circumcised.
Pacifier UseMore than half of mothers (58%) reported that their baby had used a pacifier on a regular basis. Among mothers whose baby was at least a year old, the average amount of time the baby used a pacifier was 9.5 months.
Co-SleepingOne in eight mothers (12%) reported that their baby always slept in the same bed with them in the first six months after birth, and an additional 29% stated the baby often (12%) or sometimes (17%) did.
Family and Relationships
Sharing Child Care with Spouse or PartnerWe asked mothers who reported having a spouse or partner how they shared daily care for their baby. Overall, mothers reported they provided more of the child care (61%), with 35% reporting that care was shared equally, and 3% reporting that their spouse or partner provided more care. This was most strongly related to the moth-er’s current employment status, with slightly less than half (49%) of mothers who worked full time outside the home saying child care was equally shared.
Attachment To New BabyWe asked mothers a series of questions concerning their feelings about their new baby. Not surprisingly mothers felt very positively toward their new baby, with 95% saying they enjoy interacting with their baby most or all the time, and similar indica-tions of attachment expressed concerning how cute they found their baby, whether they spoke to the baby regularly, and their desire to hold the baby.
Hoped for Number of ChildrenMothers in our survey said they would like to have, on average, three children, with three (31%) and two (25%) the most common responses. Only 8% wanted a single child, while 19% indicated a desire for four, 9% preferred five, and 9% wanted more than five. The ideal most often mentioned was one more child than they currently had.
LTM III: New Mothers Speak Out / Major Survey Findings

XIII
Employment, Maternity Leave, Child Care, and Health Insurance
Employment During Pregnancy and Working to the Due DateMore than half (61%) of mothers indicated they were employed during their pregnan-cy, primarily as full-time (33%) or part-time (23%) employees for someone else. A small proportion (6%) of mothers were self-employed, and two in five mothers (39%) were not employed during their pregnancy. Of those mothers who were employed, most worked almost to their due date, stopping on average about 3 weeks before their due date, with 34% working until there was less than a week before their due date.
Pregnancy Related Challenges to EmploymentMothers who were employed outside the home were asked if, during their preg-nancy, they had needed accommodations such as a need for more breaks, a change in some duties, or a change in schedule. Most mothers both needed and asked for some accommodations, and their employers generally attempted to address the concerns they raised.
Paid Maternity Leave BenefitsOf those mothers who had been employed by someone else during pregnancy, 63% indicated that their employer provided paid maternity leave benefits. Among these mothers, one-third (34%) indicated they received 100% of pay, and three out of four (76%) received at least half their regular salary. Among the subset of mothers who received 100% of their pay in maternity benefits, the average length of time of paid leave was eight weeks.
Working for Employer while on Maternity LeaveAlmost half (46%) of mothers who had been employed during pregnancy did work for their employer while on maternity leave. A total of 23% reported working a little of the time, 16% some of the time, and the remainder most (5%) or all (2%) of the time.
Current Employment StatusAbout three in ten (31%) of the mothers in the follow-up survey indicated they were currently employed on a full-time basis. Another 22% were employed on a part-time basis, and a small portion were full-time students (3%) or still on paid leave (3%), while the remainder (41%) were neither employed, nor students, nor on leave.
Stayed Home as Long as Wanted ToMothers who had transitioned to paid work were asked if they had stayed home as long as they wanted, and nearly three-quarters (72%) had stayed home as long as they wanted. The primary reasons why they went back to work were that that they could not afford more time off (72%), followed by related answers – their maternity leave had come to an end (43%) or they were worried about consequences at work, such as lower pay, worse assignments, or fewer opportunities for promotion (22%).
How Long Should Maternity Leave Be?Mothers who were employed or on maternity leave were asked what would be the ideal amount of time off with their baby in a system with good maternity leave bene-fits. The most common answer (20% of mothers) was six months, and the second most common answer (17%) was twelve months. The overall average was seven months.
LTM III: New Mothers Speak Out / Major Survey Findings

XIV
Child Care ArrangementsMothers described a variety of arrangements for child care when we asked those em-ployed outside the home who cared for their baby. On average, they cited more than one source of help. For mothers employed full time, there was a heavy reliance on family, either their spouse or partner (34%) or another family member (43%). Moth-ers also relied on child care centers (26%) and family day care providers (18%). Those mothers employed part time relied predominantly on family – either partners (51%) or other family members (44%).
Time in Child CareAlmost half (47%) of mothers reported being home with their children, but for those who reported being in school or employed, one-fourth (26%) reported their child was in day care at least 33 hours a week. For mothers employed full time outside the home, that figure rose to 55%.
Sick Time for Child CareMost mothers with access to sick leave (82%) reported they could use it to care for a sick child. Only 11% stated they could not, and 8% were unsure.
Health InsuranceThe pattern of insurance coverage that mothers established during pregnancy did not necessarily continue in the postpartum period, with 28% of mothers reporting their insurance status changed between the two surveys. At the time of the follow-up sur-vey, 18% had no health insurance. Among mothers whose primary payer for mater-nity care had been private insurance, 10% were uninsured at follow-up, versus 26% of mothers whose primary payer for maternity care services had been Medicaid or CHIP.
Views of Maternity Care Quality and Engaging in Maternity Care
Maternity Care Tests and TreatmentsWe asked mothers whether they agreed or disagreed with a series of statements concerning maternity care tests and treatments. They expressed considerable confi-dence that newer tests marked an improvement in care (74% agree), that their pro-vider’s recommendations reflect best current research (82% agree), that more tests meant better quality care (63% agree), and that more expensive tests and treatments were better (52% agree).
Rating the Quality of the U.S. Maternity and Health Care SystemsNineteen percent of mothers rated the U.S. health care system as “excellent,” 43% as good, and 38% as “fair” or “poor.” Thirty-five percent rated the U.S. maternity care system as “excellent,” 49% as “good,” and 16% as “fair” or “poor.”
Identifying Factors that Determine Hospital Maternity Care QualityMothers assessed whether eight different factors were indications of the quality of maternity care at a specific hospital. In six of the cases, a majority of mothers rated the item as “very important,” including “protects mothers and newborns from get-ting infections in the hospital” (80%), “has attentive, caring maternity nurses” (77%),
LTM III: New Mothers Speak Out / Major Survey Findings

XV
and “has a low rate of medical mistakes” (76%). The two lowest-rated factors were “being a teaching hospital” (33% “very important”) and “has been highly rated by a website or magazine” (28% “very important”).
Rating the Quality of Different Phases of Maternal and Newborn CareMothers rated the quality of care at five stages of maternal care and their baby’s office visits in the first two months after birth. The ratings were generally very posi-tive, with no stage of care being rated as “poor” by more than 3%, and 86% or more giving each stage a rating of “good ” or better.
Concerns About Errors in the Course of Maternity and Pediatric CareMothers were asked about their levels of concern with serious medical errors at four different stages of their care – prenatal visits, birth in the hospital, their own post-partum visits, and their baby’s office visits. While a majority were “not at all” to “not too” concerned in every case, they most commonly cited concern about their time in the hospital, with 24% “somewhat” and 19% “very” concerned.
Interest In and Views About the Right to Make Birth ChoicesMothers were asked about settings where they might be interested in giving birth in the future and, among those planning more children, two-thirds would consider a birthing center that is separate from a hospital, with one-fourth definitely wanting that option. A little more than one-fourth would consider a home birth. Two thirds (64%) thought a woman should have a right to a home birth if she chooses. Mothers also strongly supported the right of a mother to choose a vaginal birth after cesar-ean (VBAC) (69%). Their support was more mixed for the right to choose an elective cesarean, with 40% stating a mother should have a choice and 38% disagreeing.
Activation Relative to Maternity CareWe adapted to maternity care relevant items from the Patient Activation Measure. Mothers expressed confidence in their ability to maintain control over their involve-ment with maternity care, with, for example, 89% agreeing with the statement, “I was confident I could tell my maternity care provider concerns I had even when he or she did not ask.”
Looking at Some Important Variations in Experience
Variations by Race/EthnicityWe stratified our results by the three race/ethnicity groupings with large enough samples for measuring possible differences: Hispanic, black non-Hispanic, and white non-Hispanic mothers. Non-Hispanic black mothers were most likely among the three groups to state that they had definitely received enough information on healthy eating, birth control, and postpartum depression in postpartum visits; have babies who had been rehospitalized and had themselves been rehospitalized since birth; report co-sleeping with the baby; report they were doing extremely well get-ting enough sleep and managing stress; and report they were getting support from a spouse or partner. They were least likely to learn they were pregnant from a home pregnancy test and report their desire to be home with the baby was the reason they were not currently employed.
LTM III: New Mothers Speak Out / Major Survey Findings

XVI
Hispanic mothers were most likely to lack health insurance or be on Medicaid at the time of the follow-up survey, to say that emotional support and practical support were available “a little” or “none of the time” from someone who was not a spouse/partner, and report being worried about the baby when not with him/her. Hispanic mothers were least likely to have a Body Mass Index in the normal range postpartum, say they were doing extremely well getting exercise postpartum, be employed full time during pregnancy, rate prenatal visits and baby care visits as “very good,” and report feeling confident they could tell their maternity care provider about concerns.
Non-Hispanic white mothers were most likely to have private insurance at the time of the follow-up survey, have taken their baby for a well-child visit, and report their desire to be home with the baby was the reason they were not currently employed. White non-Hispanic mothers were least likely to consider online access to health records as “very important,” say that taking care of their baby is “always fun,” re-port daily care for the baby was equally divided with their spouse/partner, rate the overall quality of health care in the United States as “excellent” or “good,” and be concerned about a serious medical error in a hospital.
Comparing Childbearing Experiences by Primary Payer of Maternity CareWe also compared experiences of beneficiaries of the two largest maternity care payer categories: private insurance and Medicaid or CHIP (the Child Health Insurance Program). There was a greater likelihood for mothers who had had Medicaid insurance for their maternity care to lose their health insurance postpartum, use WIC services, report they were not doing well with eating a healthy diet postpartum, and consider a high rating by a web page or magazine an important measure of hospital quality. Mothers with private insurance for their pregnancy and their baby’s birth were more likely to say pain had not interfered with routine activities in the two weeks prior to the survey, report a Body Mass Index in the normal range, report feeling supported in the months after birth, and report that their baby had had no sick-child visits.
Trends: Comparing Results Across Listening to Mothers SM Surveys
We examined trends across some items that were available in multiple Listening to MothersSM surveys. Notable differences over time included a growing proportion of mothers indicating paid maternity leave was available from their employer and receiv-ing spousal/partner support in many areas. There were notable declines in the propor-tion of mothers getting more than 90% of their salary during paid maternity leave, in the proportion of mothers reporting their babies were in day care for 33 or more hours a week, and in mothers reporting difficulties with child care and breastfeeding in the transition to paid work. There was also a general decline in mothers’ support for a woman’s right to choose for herself whether to have a vaginal or cesarean birth.
LTM III: New Mothers Speak Out / Major Survey Findings

XVII
Additional Results Describing Pregnancy and Birth Experiences
Due to space limitations in the initial survey, we included a small number of additional questions on these topics in the follow-up survey, and Appendix D reports the results.
Learning About PregnancyWhereas 76% of mothers indicated they learned about their pregnancy through a home pregnancy test (on average after 5.3 weeks), 24% used a health professional (6.9 weeks).
Switching Maternity Care Providers and HospitalsWe asked mothers whether they had switched either providers or their hospital dur-ing their pregnancy. A total of 22% of mothers indicated they had switched in each case, with “to increase the chance of having the care and choices that I wanted,” be-ing the leading reason in each instance.
Use and Value of Online Resources for Pregnancy and Birth InformationPregnancy and childbirth related blogs were most highly valued among a series of online resources, with 78% of mothers using these as sources of pregnancy and birth information and two-thirds (68%) of those mothers citing them as somewhat or very valuable. A majority (53%) of mothers who used online forums, chatrooms, and group discussions for this purpose found them at least somewhat valuable, and smaller proportions who used Facebook and online videos as such informa-tion sources cited them as at least somewhat valuable (43% and 41%, respectively). These results were, not surprisingly, strongly related to age, with mothers less than 30 significantly more likely to use and find valuable each of these resources.
Spontaneous Onset of LaborWe attempted to identify the proportion of mothers who experienced “spontane-ous onset of labor” – labor starting on its own. At most, 54% had labors that started on their own, and this is likely to be an overestimate.
Primary Maternity Care AttendantMothers who had given birth before were asked if the person who attended the birth of their most recent baby had attended a previous birth, and that was the case for 44% of experienced mothers, with another quarter (25%) indicating it was a dif-ferent provider from the same group. One-third (34%) of the experienced mothers had a different provider who was not from the same group.
Summary of Interventions Experienced Around the Time of BirthCombining results from both the initial and follow-up surveys yields a summary of the numerous interventions that the mothers experienced around the time of birth. For example, 53% experienced attempted labor induction, and 30% had a medically induced labor. Eighty-nine percent (of women who labored) experienced electronic fetal monitoring, 83% used pain medications, 50% experienced synthetic oxytocin, and 36% had artificially ruptured membranes. Eleven percent had assisted vaginal delivery with vacuum extraction or forceps, and 31% had a cesarean section.
LTM III: New Mothers Speak Out / Major Survey Findings

1
Introduction
This report continues Childbirth Connection’s ongoing Listening to MothersSM Initia-tive to focus the discussion of maternity care in the United States on the people who care about it the most: mothers themselves. To date, Childbirth Connection has car-ried out three periodic national Listening to MothersSM (LTM) surveys: LTM I (2002), LTM II (2006), and LTM III (2012). Following the second and third surveys, we had the opportunity to invite participants to complete a follow-up survey. This report pres-ents results from the LTM III follow-up survey, in combination with relevant findings from the initial LTM III survey. The five LTM surveys are the first systematic national studies of U.S. women’s perceptions of their childbearing experiences. They have documented for the first time at the national level the frequency of many practices and experiences from before pregnancy through the postpartum period that have been otherwise recorded only at the clinical, community or state level, if at all. They offer an unprecedented level of understanding about many aspects of the experi-ence of childbearing in the United States.
The work reported here was developed through collaborative efforts of a core team from Childbirth Connection, Boston University School of Public Health, and Harris Inter-active, with the support of the Listening to MothersSM III National Advisory Council (see Preface for a list of Council members). Harris Interactive administered the surveys.
Who was Included in Our Sample, and How We Reached Them
Listening to MothersSM III Initial SurveyFrom October 11 through December 26, 2012, 2400 women completed the initial survey online. Members of the Harris Interactive national online panel and of other national survey panels were screened for possible eligibility, and eligible women were invited to respond to a survey about women’s childbearing experiences.
All survey participants were 18 to 45 years of age, had given birth to a single, still-living baby in a hospital from July 2011 through June 2012, and could respond to a survey that was in English. We excluded mothers with multiple births and with out-of-hospital births, as their experiences are quite different from other mothers and the numbers that would have been included in the sample would have been too small to analyze. Mothers whose babies had died were excluded to avoid causing them added grief. If a contacted mother had lost a child, she was offered contact information for several national organizations that provide support to bereaved parents. Apart from questions about reproductive history, the survey focused on pre-pregnancy through postpartum experiences relating to births that had taken place in 2011-12. Looking at the results by time elapsed since giving birth allows us to cross-sectionally analyze the postpartum
LTM III: New Mothers Speak Out / Introduction

2
experiences of mothers at different periods since the birth. On average, the survey took about 30 minutes to complete. An appendix in the initial survey report, Listening to MothersSM III: Pregnancy and Birth, describes the methodology in detail.
Listening to MothersSM III Follow-Up SurveyChildbirth Connection also sponsored a follow-up survey directed to LTM III partici-pants. From January 29 through April 15, 2013, 1072 of the original 2400 respon-dents (45%) completed the postpartum survey. Due to the LTM III eligibility require-ments, all 1072 follow-up survey participants were 18 to 45 years of age, had given birth to a single, still-living baby in a U.S. hospital from mid-2011 to mid-2012, and could respond to a survey that was in English. The follow-up online survey also took approximately 30 minutes to complete. Here we report results from the follow-up survey, along with relevant data collected in the initial survey. Combining results from both surveys allows us to analyze some key topics (e.g., infant feeding and pat-terns of weight gain and loss) up to 21 months postpartum. Unless otherwise noted, reported results are from the follow-up survey.
Survey QuestionnairesThe full initial and follow-up survey questionnaires are available at transform.child-birthconnection.org/reports/listeningtomothers/. The initial survey primarily fo-cused on experiences from before pregnancy through the early postpartum period. The follow-up survey primarily focused on the mothers’ and families’ experiences since the birth and on attitudes, beliefs, and preferences relating to maternity care quality and childbearing. However, the follow-up survey did include several addi-tional questions related to pregnancy and birth experiences, and results of those ad-ditional items are presented in the final appendix to this report.
We encourage individuals citing results from the Listening to MothersSM surveys to consult the questionnaires to understand the specific questions posed, choices of-fered, and groups of women (“base”) who responded to the questions, whether all mothers or specific subgroups.
Mothers’ Survey Participation ExperienceThere were many indications that the survey participants were exceptionally engaged in the survey and interested in having their voices heard, including their willingness to take more time answering questions than typical survey respondents. Moreover, a substantial majority in both surveys responded to open-ended questions.
Data Analysis and Reporting
Data WeightingTo develop a national profile of childbearing women aged 18 through 45 and giving birth to single babies in hospitals, the data were adjusted with demographic and propensity score weightings using methods developed and validated by Harris Inter-active. The propensity score, a measure of the propensity to be online, adjusts for the qualities of the online participants to result in a weighted sample that is more representative of the target population as a whole. Because of the slightly different demographic makeup of initial and follow-up survey participants, separate weighting systems were developed for results of the two surveys.
LTM III: New Mothers Speak Out / Introduction

3
Demographic Profile of RespondentsAppendix B presents a summary of the representativeness of the surveys in compar-ison with a national population of mothers. The careful weighting of data resulted in a population of respondents that closely mirrors the target population – identified as mothers 18 through 45 who gave birth to a single infant in a hospital in 2010 (the most recent year for which a birth certificate file was available to describe this na-tional population). The profile of our respondents generally parallels a comparable national birthing population in such key areas as race/ethnicity, age, birth attendant, mode of birth, and number of times the mother had given birth.
Supplementary Material in AppendicesAppendix A provides a more detailed discussion of the survey methodology, includ-ing processes for recruiting eligible women, facilitating and monitoring their comple-tion of the survey, and weighting of the results. Appendix B is described above. Appendix C identifies items in the follow-up survey that are new to Listening to MothersSM surveys, and the source of these items. Appendix D presents results of the additional items relating to pregnancy and birth included in the follow-up survey. This Appendix should be considered an essential supplement to the report of the initial survey, Listening to MothersSM III: Pregnancy and Birth.
Reading the Text, Tables, and Figures
Percentages may not always add up to 100% because of rounding, the acceptance of multiple answers from respondents, or exclusion of rarely chosen response catego-ries from a table.
The term “base” is used to identify the total number of respondents answering that question. Since many questions are only asked of a subgroup of the sample (e.g., only women who reported doing paid work outside the home were asked about child care while doing such work), some results are based on small sample sizes. Caution should be used in drawing conclusions from results based on smaller samples.
Readers should also be alert to exactly which population is being referred to in the tables, figures, and text since in many cases we probe the data through several lay-ers. We try to make clear throughout exactly who is being referred to. Although this can lead to some inelegant, if accurate phrasing, our primary goal was clarity.
When subgroup comparisons are presented in tables, an asterisk indicates compari-sons where the differences are statistically significant at the p < .01 level based on a chi-square test. When comparisons discussed in the text are significant at the p < .01 level, this is noted in the text.
LTM III: New Mothers Speak Out / Introduction

4
Selection of Quotations from Survey Participants
Women who participated in the initial and follow-up surveys had multiple opportuni-ties to provide fully open-ended comments. A remarkable number of mothers took the time to respond to one or more of these invitations. We received many vivid and moving stories, observations, and opinions that bring the women’s experiences and the numbers to life. Faced with the challenge of selecting comments for this report from among this large and important set of remarks, we gave priority to either con-trasts that suggest the range of women’s experiences or those that illustrate notable survey results. Some quotes illustrate a situation of concern for a relatively small pro-portion that nonetheless impacts many mothers or babies. Since about four million women give birth annually in the United States, each percentage point represents nearly 40,000 mothers and babies each year. The quotations reproduce the women’s exact words, though we have in some cases standardized spelling and punctuation. Qualitative researchers are separately analyzing and reporting on open-ended ques-tions directed to all survey participants.
Project Responsibility
The team from Childbirth Connection, Boston University School of Public Health, and Harris Interactive collaboratively developed the survey questionnaires, with support from the Listening to MothersSM III National Advisory Council. The National Advisory Council communicated by email as the surveys were refined, carried out, and re-ported. Roz Pierson, Senior Vice President, and Sandra Applebaum, Senior Research Manager, led the Harris team responsible for management of the project and initial analysis of results. The data presented in this report were reviewed and in many instances further analyzed by Eugene Declercq, Boston University School of Public Health; Carol Sakala, Maureen Corry, and Ariel Herrlich of Childbirth Connection; and Sandra Applebaum of Harris Interactive. Harris Interactive has reviewed the en-tire report and finds it to be a fair and accurate depiction of the survey results.
As with all Harris Interactive surveys, the initial and follow-up LTM III surveys comply with the code and standards of the Council of American Survey Research Organiza-tions and the code of the National Council of Public Polls. The non-Harris authors had access to only deidentified files provided by Harris interactive, similar to the ver-sions that will later be archived at the Odum Institute (www.odum.unc.edu/odum/).
LTM III: New Mothers Speak Out / Introduction

5
1. Maternal Well-Being
Women experience extraordinary physiologic changes, emotional challenges, and social transitions in the period from conception through the weeks and months after birth. In addition, as our initial Listening to MothersSM III report detailed, childbirth in U.S. hospitals involves high rates of surgery, medications, and other interventions (see Table 45), with potential for unintended consequences. After sustained atten-tion from pregnancy through childbirth, the health system gives relatively little at-tention to the well-being of women in the postpartum period, and maternity care ends about six weeks after birth. We wanted to better understand women’s use of health services after birth, the degree to which they experienced a broad range of possible new health problems, and the persistence of such problems. Mothers also had an opportunity to describe how health problems impacted their daily life, their pattern of weight gain and loss, and aspects of their emotional welfare – including experience with symptoms of depression. Combined survey results enabled us to describe their postpartum experiences for up to 21 months after their 2011-12 births in the context of their demographic characteristics, childbirth experiences, family composition, and insurance status.
Postpartum Care
Office Visits and Access to CareAlmost all (90%) women had at least one office visit with their maternity care pro-vider between the time they left the hospital and eight weeks after the birth of their child. One-third (34%) had one office visit, about one out of four (28%) had two visits, and three in ten (29%) had three or more visits (results from initial LTM III survey). One in ten mothers (10%) reported not having a visit, and we asked those mothers the reason for not having a visit. The largest proportion of those mothers (42%) re-sponded that “I felt fine and didn’t need to go,” followed by “I felt that I had already completed all of my maternity care” (18%), “too hard to get to office” (12%), “didn’t have insurance” (7%), and “I had given birth before and did not need help” (4%), with the remainder citing “other.”
Telephone and Home Visit GuidanceWe asked mothers if, in the two months after their baby’s birth, they had had the telephone number of a nurse, doctor, midwife, or health visitor to contact with any concerns about themselves or their babies, and 76% indicated that they did have such a contact. We also asked if they had received a home visit from a health profes-sional in the first two months, and about 13% indicated they had from their materni-ty care team, 9% from the baby’s team, and 8% from a home visiting program. Since some mothers received visits from more than one of these sources, after eliminating overlap, about 18% of mothers reported at least one home visit.
LTM III: New Mothers Speak Out / 1. Maternal Well-Being
“After giving birth I did
not receive as much at-
tention from my health
care providers as during
the pregnancy. ”
“It took me … 3 months
in all for recovery. My mid-
wives were there for me
via phone or in person the
entire time. ”
“I received a visit at
home from a nurse to
see how I was doing. She
… checked my incision,
checked my baby over,
and gave me and baby
some free gifts. She set us
up with a visiting teacher
that helps with learning
growth of my baby along
with info on local baby
groups… It was a well
needed visit. She gave me
tips on how to do things
until I was healed. ”
“Your body does not stay
the same. Your time is cut
in more than half. Things
become more compli-
cated. ”

6
Guidance About Common ConcernsWe also asked mothers about the provision of information from their provider on issues of importance to postpartum mothers, and Table 1 presents the results. Over-all, mothers were most likely to say they were “definitely” given enough information about birth control methods (57%) and least likely to have been informed about changes in sexual response and feelings (30%). We divided those responses by the type of birth attendant they had had (obstetrician, family doctor, or midwife) and found a different distribution of responses. Mothers with midwives were substan-tially more likely to have received enough information about birth control methods while those with family doctors were most likely to have received enough informa-tion about postpartum depression, healthy eating, exercise and changes in sexual re-sponse. With the exception of birth control, mothers with obstetricians as their birth attendant were least likely to state they were definitely given enough information in their postpartum visits on these issues.
Table 1. Provision of information on key topics, by type of birth attendant
During visits with your maternity care provider after the birth, were you given enough information about...?
Base: had one or more postpartum visits among follow-up LTM III mothers n=950
% definitely yes
Alln=950
Obstetriciann=676
Family doctorn=66
Midwifen=99
Birth control methods that you can use after giving birth* 57% 56% 52% 77%
Postpartum depression* 44% 43% 56% 46%
How long to wait before getting pregnant again 41% 40% 48% 46%
Healthy eating* 39% 37% 60% 44%
The importance of exercise* 36% 34% 50% 43%
Changes in your sexual response and feelings* 30% 28% 53% 34%
p < .01 for differences by type of provider
Follow-up in Women with Diabetes or Gestational DiabetesMore than half (56%) of the mothers who reported in our first survey that they had been told they had preexisting or gestational diabetes reported receiving a post-partum test for diabetes or high blood sugar. Likelihood of a postpartum test varied somewhat by Body Mass Index, either just before becoming pregnant or at the time of birth, with postpartum diabetes testing most likely for mothers at either the obese or underweight ends of the spectrum, and least likely for mothers in the normal range.
LTM III: New Mothers Speak Out / 1. Maternal Well-Being
“The “baby blues” hit
hard for about four weeks
following my daughter’s
birth.... My childbirth ...
instructor ... never ex-
plained how awful it can
be. My maternity care
providers never addressed
it before I gave birth....
This ... should be given
more attention in ma-
ternity and postpartum
care. ”

7
Limiting Total Number of CesareansA little more than one-fourth (28%) of mothers who had one or more cesareans said they were told by their provider to limit their lifetime total number of cesareans (Table 2), and the average number of cesareans recommended as a maximum was 3.2. Once again, we stratified that result by provider and found substantial differences, with family doctors (72%) and midwives (58%) much more likely to recommend a limit. On average, family doctors recommended the lowest amount (2.7), and mid-wives cited the highest (4.0). Notably, almost 9 in 10 mothers with prior cesareans had an obstetrician as their birth attendant, likely reflecting the strong likelihood of repeat cesareans.
Table 2. Provider advice on limiting total number of cesareans, by type of birth attendant
Base: had one or more cesareans among follow-up LTM III mothers n=375
Alln=375
Obstetriciann=305
Family doctorn=18
Midwifen=24
Was told by provider to limit total number of cesareans to a specific number
28% 25% 72% 58%
Recommended maximum number of cesareans 3.2 3.1 2.7 4.0
p < .01 for difference in recommendations by providerNote: few respondents had family doctor and midwife birth attendants
Medical Care
Regular Medical ProviderWe asked mothers who their medical provider was after they completed maternity care, and 42% indicated it was their family doctor, 22% relied on an obstetrician/gynecologist, 9% reported using an internal medicine doctor, and 15% stated they had no regular medical provider. The remaining responses were divided among midwives, clinics, nurse practitioners, and physician assistants. The lack of a regular medical provider was almost twice as likely among mothers whose birth had been paid for by Medicaid (17%) as among those with private insurance (10%) (p < .01).
RehospitalizationWe asked mothers if, since the birth, they had for any reason returned to the hospi-tal at least overnight. For overall comparison purposes, we limited this to mothers who had given birth at least nine months earlier (since mothers with a more recent birth would have had less opportunity to have been hospitalized), and 13% replied that they had returned to the hospital (Table 3). The likelihood of rehospitalization varied by mothers’ race/ethnicity, with non-Hispanic black mothers almost twice as likely as other groups to be rehospitalized (p < .01).
LTM III: New Mothers Speak Out / 1. Maternal Well-Being
“I was very worried
about how my body
would handle having
four c-sections. ”

8
Table 3. Rehospitalization of mothers and babies, by race/ethnicity
Base: nine or more months elapsed since birth among follow-up LTM III mothers n=1006 Mother Baby
All 13% 9%
Non-Hispanic black 21% 17%
Non-Hispanic white 12% 7%
Hispanic 11% 8%
p < .01 for differences by race/ethnicity for mothers and babies
We asked mothers when they returned to the hospital. About one-fourth (28%) re-ported being rehospitalized within the first two months after birth, and 42% within the first six months after birth. Overall, mothers with a vaginal birth (15%) were more likely to report returning to the hospital than those with a cesarean (8%) (p < .01), though slightly more than half (49%) of rehospitalized mothers with a cesarean were rehospitalized in the first 6 months after birth compared with mothers with a vaginal birth (34%).
We asked the reason for their return to the hospital, and the most common re-sponse was pain related to the birth, with 25% of those mothers who were rehospi-talized (3% of entire sample) indicating that was the reason for the hospital stay. The remaining responses were scattered among a wide range of categories led by fever or infection (18% of those hospitalized), complications of surgery (8%), and vaginal bleeding (8%).
Burden of New Maternal Health Concerns After Birth
The initial survey asked women about specific aspects of their health following the birth of their child. They were asked whether they had experienced any of a list of six postpartum health concerns as new “major” or “minor” problems (not as continuing chronic difficulties) within the first two months after birth. Mothers who did experi-ence the condition as a problem were asked whether they were still experiencing the problem at the time of the survey. In the follow-up survey, we expanded the list to in-clude an additional 16 items that were not initially included due to space limitations, and we asked whether any of the 16 conditions that were troubling in the first two months after birth continued to be a problem at the time of that survey (Table 4).
LTM III: New Mothers Speak Out / 1. Maternal Well-Being
“Heavy bleeding … was
not taken as seriously by
my nurse as I thought it
should be…. I ended up
having to be hospitalized
for postpartum hemor-
rhage and had to have a
blood transfusion at about
8 weeks postpartum. I wish
that the nurse had taken
my concerns about the
bleeding a little more seri-
ously earlier on. ”
“I was quite surprised
about the physical pain I
was in after delivery. ”

9
Table 4. Mothers’ experience of selected new-onset health problems in first two months and at six months or more after birth
Base: all mothers eligible for question (see notes)
In first two monthsProblem persisted
to six months or more
Major new problem
Minor new problem
Major/minor new
problem
Vaginal only*
Painful perineum n=1656 11% 30% 41% 7%
Infection from cut or torn perineum n=1656 5% 13% 18% 4%
Cesarean only (base varies)
Pain at site of cesarean incision n=744* 19% 39% 58% 16%
Itching at cesarean incision n=351** 13% 38% 51% 20%
Numbness at cesarean incision site n=351** 12% 36% 48% 20%
Infection at site of cesarean incision n=744* 8% 16% 24% 5%
All mothers n=2400*
Urinary problems 9% 22% 31% 11%
Bowel problems 9% 21% 30% 9%
All mothers n=1072**
Sleep loss 21% 38% 58% 30%
Feeling stressed 17% 37% 54% 34%
Physical exhaustion 16% 35% 51% 27%
Weight control 16% 28% 45% 29%
Other breastfeeding problems 16% 17% 33% 5%
Lack of sexual desire 13% 30% 43% 24%
Sore nipples/breast tenderness 12% 35% 48% 9%
Backache 12% 34% 46% 26%
Feelings of depression 10% 21% 31% 15%
Heavy bleeding 9% 18% 27% 8%
Frequent headaches 8% 21% 29% 19%
Painful intercourse 7% 20% 27% 10%
Hemorrhoids 6% 17% 23% 9%
Breast infection 6% 9% 15% 3%
*Base: initial LTM III mothers with a vaginal birth (n=1656), a cesarean birth (n=744), or either (n=2400).**Base: follow-up LTM III mothers with a cesarean birth (n=351) or with either a vaginal or cesarean birth (n=1072)
LTM III: New Mothers Speak Out / 1. Maternal Well-Being

10
New-Onset Problems in First Two Months After Vaginal BirthTwo out of five (41% overall; 11% major) mothers with a vaginal birth cited a painful perineum as a problem in the first two months after birth in the initial survey. Perine-al pain as a major problem was strongly related to whether a mother experienced an episiotomy (18%) or did not (9%) (p < .01). Almost one out of five (18%) cited a prob-lem with perineal infection, with 5% saying it had been a major problem (Table 4).
New-Onset Problems in First Two Months After Cesarean BirthThe problem cited by the greatest proportion of women was among those women who had experienced a cesarean section: nearly six out of ten women with cesareans (58%) considered pain at the site of the incision to have been a problem in the first two months after birth, with 19% citing it as a major problem in the initial survey. One in four (24%) reported an infection associated with her cesarean. In the follow-up survey, half the mothers with a cesarean reported a problem with itching (51% overall; 13% major) or numbness (48% overall; 12% major) at the site of the cesarean incision in the first two months (Table 4).
New-Onset Problems in First Two Months After All BirthsProblems that might affect mothers regardless of mode of birth and cited by at least half the respondents in the follow-up survey were sleep loss (58% overall, 21% ma-jor), feeling stressed (54%, 17% major), and physical exhaustion (51%, 16% major). More than two in five mothers cited sore nipples/breast tenderness (48%, 12% major), backache (46%, 12% major), weight control (45%, 16% major), and lack of sexual desire (43%, 13% major). Mothers also frequently mentioned breastfeeding problems other than tenderness or infection (33%), feelings of depression (31%), frequent headaches (29%), painful intercourse (27%), or heavy bleeding (27%). One-quarter experienced hemorrhoids (23%), and 15% had a problem with breast infections (Table 4).
Persistence of New-Onset Problems to Six Months or MoreMany initial health problems abate in the weeks and months after birth. To under-stand the extent to which these concerns continued to be problems for the moth-ers over a longer period, we asked if a problem cited as a difficulty in the first two months, “was still a problem now?” at the time of both the initial and follow-up sur-veys. Table 4 presents the results.
At six or more months after birth, about one in three mothers (34%) indicated they were still feeling stressed or had problems with sleep loss (30%), followed by continu-ing problems with weight control (29%), physical exhaustion (27%), backache (26%), and lack of sexual desire (24%). Among those mothers who had a cesarean, 20% re-ported continuing numbness, and 20% cited continued itchiness at the incision site. Whereas 16% of mothers who had a cesarean reported pain at the site of the incision at six months or beyond, only 7% of women with a vaginal birth reported continued problems with perineal pain.
Space limitations did not allow us to ask whether the women had sought profes-sional help for the various problems that we documented. We refer readers to the first Listening to MothersSM survey report, which covered this topic.
LTM III: New Mothers Speak Out / 1. Maternal Well-Being
“I had extreme pain that
was not relieved at all by
baths or pain medicine,
and when I called my OB-
GYN office they dismissed
my concerns. ”
“The postpartum “baby
blues” and extended dis-
comfort with sex after preg-
nancy surprised me. ”“I had a horribly scary ex-
perience with postpartum
bleeding. It was not easing
up, and I was still experi-
encing heavy bleeding at
six weeks. ”“The negatives include
vaginal soreness, still, after
5 months (the doctor had
to re-do my stitches). ”“I am also still experienc-
ing urinary issues, and I
wish they would have of-
fered more advice on the
subject. ”“No one told me before
birth that the c-section
area would always be
kind of numb and kind of
painful if pressure was put
on it. ”

11
Postpartum Well-Being and Daily Activities
Mothers were asked to state the extent to which physical or emotional problems had interfered with their ability to take care of their baby in the first two months after giving birth, with five responses ranging from “not at all” to “some,” “a fair amount,” “quite a bit,” and “a great deal.” About one-third of mothers reported that during the first two months their postpartum physical health (37%) or emotional health (29%) interfered at least “some” with their ability to care for their baby, with 42% of all mothers reporting physical and/or emotional impairment. Only 16% in each case reported these problems interfered at least a “fair amount” (Figure 1).
Figure 1. Extent to which mothers’ physical health interfered with ability to care for baby in first two months after birth, by mode of birth
Base: all follow-up LTM III mothers n=1072
p < .01 for differences, by mode of birth
65%
9%
20%
Vaginal Cesarean
60%
6%
23%
4%↙
3%↙
3%↙ 7%
• Not at all
• Some
• A fair amount
• Quite a bit
• A great deal
LTM III: New Mothers Speak Out / 1. Maternal Well-Being
“The cesarean recovery
was far more difficult than
I was prepared for. It was
weeks before I felt like my
normal self again. In a pre-
vious pregnancy, a nurse
giving labor classes had
said that a cesarean was
‘a breeze’. ”
“I had now experienced
both a vaginal birth and a
c-section and I knew that
it was much easier to
recover after a natural
birth. ”

12
We asked mothers about the degree to which pain interfered with their everyday activities in the first two months after birth (initial survey) and in the two weeks prior to the survey (follow-up survey), with five response choices ranging from “not at all” to “extremely.” Table 5 presents the results. About three in four said that pain did interfere at least “a little bit” in their routine activities in the first two months, with 7% saying “quite a bit” and 4% “extremely.”
In the two weeks preceding the follow-up survey, more than half (56%) of mothers said that pain did interfere at least “a little bit”, with 7% indicating that pain inter-fered either “quite a bit” (5%) or “extremely” (2%). At both time periods, there were significant differences by mode of birth (p < .01). In the initial survey, there was a clear tendency for greater reported problems with pain among mothers with a ce-sarean, while in the follow up survey the distinctions were not as pronounced and not all in the same direction.
Table 5. Extent to which pain interfered with mothers’ routine activities at two time periods, by mode of birth
How much did pain interfere with your routine activities?
In two months after birthBase: all initial LTM III mothers
In two weeks prior to follow-up surveyBase: all follow-up LTM III mothers
Vaginaln=1656
Cesareann=744
Alln=2400
Vaginaln=721
Cesareann=351
Alln=1072
Extremely 3% 10% 4% 1% 2% 2%
Quite a bit 6% 16% 7% 6% 3% 5%
Moderately 21% 25% 22% 14% 19% 16%
A little bit 43% 36% 42% 37% 27% 33%
Not at all 27% 14% 24% 42% 49% 45%
p < .01 for differences in both time periods, by mode of birth
LTM III: New Mothers Speak Out / 1. Maternal Well-Being
“The pain after birth was
more than I expected. I
did not tear or have any-
thing wrong, but it took me
2 weeks to be able to walk
the same, and 3 months in
all for recovery. ”
“I was in so much pain,
I would set tasks and
concentrate on complet-
ing individual tasks. It is the
only way I survived. ”

13
Maintaining Wellness
We asked mothers who completed the follow-up survey to rate how they were doing in the two weeks prior to the survey on several basic health promotion behaviors, and the results are presented in Table 6. Mothers reported the greatest concern with getting enough exercise, with 26% thinking they were doing “not at all well” and only 33% rating themselves as doing “very well” or “extremely well.” Mothers rated them-selves most positively in terms of managing stress, with 37% doing at least very well. Eating a healthy diet and getting enough sleep were rated in between the others, with about three-fifths of the mothers rating themselves as doing at least fairly well in those areas. All of these dimensions were strongly related to mothers’ self-report of both their physical and emotional health. For example, 39% of mothers who re-ported their physical health had interfered with caring for their baby a great deal re-ported not eating well compared with only 13% of those who had said physical health had not been a problem indicating they were not eating well (p < .01).
Table 6. Maintaining wellness
Thinking about the past two weeks, how well do you think you are doing with each of the following?
Base: all follow-up LTM III mothers n=1072
Not at all well
Somewhat well
Fairly well
Very well
Extremely well
Getting enough exercise 26% 17% 25% 20% 13%
Getting enough sleep 17% 22% 32% 17% 12%
Eating a healthy diet 14% 20% 34% 18% 15%
Managing stress 9% 22% 31% 24% 13%
Breastfeeding, an important preventive practice with long-term implications for women’s health, is primarily covered in the following chapter.
LTM III: New Mothers Speak Out / 1. Maternal Well-Being
“After giving birth, I felt
that anything I could do in
the gym wouldn’t com-
pare to what I did in the
delivery room! ”“There are days when
it’s hard for me just to get
a shower, or eat a decent
meal, because many
times when I go to do
these things, she will start
crying, so I have to take
care of her. ”

14
Mothers’ Postpartum Weight Loss
In the initial survey, we asked mothers to report their weight at three different time periods: at the time they became pregnant, at the time of birth, and at the time of the survey. In the follow-up survey, we again asked about their weight. Combining the two surveys, we can chart the process of average postpartum weight loss for up to 21 months postpartum. Figure 2 presents the results, starting with mothers’ re-ports of gaining, on average, almost 24 pounds during their pregnancy, and losing 20 pounds at the time of the first survey. When asked about their current weight in the follow-up survey, on average, it was no different than the weight reported several months earlier in the initial survey. The result is that between the beginning of preg-nancy and the time when they completed the follow-up survey mothers reported gaining about four pounds.
Figure 2. Net maternal weight gain since conception, from birth through time of follow-up survey
Base: all follow-up LTM III mothers n=1072
Poun
ds
30
25
20
15
5
10
0Birth 4 – 6
months7 – 9
months12 months totime of survey
10 – 12months
Time since birth
All n=1072 •First-time mothers n=492 •
Experienced mothers n=580 •
LTM III: New Mothers Speak Out / 1. Maternal Well-Being
“I gained a lot of weight
with him and haven’t
been able to loose it
very easily. ”“I envy those who
manage to return to their
prepregnancy weight. It is
not easy for many. Having
a difficult time losing
pregnancy weight after
each birth makes me
self-conscious. ”
“I did not feel like myself
again for about a year
after because I had such
a hard time losing all the
weight. ”

15
Feelings after Birth
We asked mothers whether particular words accurately described their feelings in the first two months after birth. Table 7 presents the results. The most uniform responses were related to fatigue, with 85% of mothers describing themselves as “tired” and 24% “rested.” Other feelings described by at least half of the mothers were “supported” (79%), “confident” (72%) and “messy” (61%). About one in three mothers reported feeling “unsure” (36%), “organized” (36%), or “isolated” (32%).
Of interest are some variations in these responses. First-time and experienced moth-ers differed substantially on two of the eight items (Table 7). While not feeling very different about such matters as being “organized,” “messy,” “isolated,” or “tired,” first-time mothers were more likely to report feeling “supported” (86% to 75%) (p < .01) and more likely to report feeling “unsure” (43% to 31%) (p < .01). Not shown in the table, mothers who did not have a spouse or partner were less likely to report feeling “supported” and more likely to feel “isolated” than those with a spouse or partner. Mothers without a spouse or a partner were also more likely to feel “orga-nized” and less likely to report being “tired” (p < .01). Mothers’ reports of feelings generally did not vary by mode of birth.
Table 7. Mothers’ feelings in the first two months after birth
Some women use the following words to describe their feelings in the weeks and months after birth. Thinking back to the first two months after you gave birth, did you feel...?
Base: follow-up LTM III mothers (see note)
First-time mothers
Experienced mothers
All mothers
Tired 81% 88% 85%
Supported* 86% 75% 79%
Confident 73% 72% 72%
Messy 60% 62% 61%
Organized 40% 33% 36%
Unsure* 43% 31% 36%
Isolated 29% 34% 32%
Rested 23% 25% 24%
* p < .01 for differences between first-time and experienced mothersNote: participants were randomly asked to respond to either (above, in order) response choic-
es 2, 3, 6, and 7 (n=522, with 210 first-time and 312 experienced mothers) or response choices 1, 4, 5, and 8 (n=550, with 225 first-time and 325 experienced mothers)
LTM III: New Mothers Speak Out / 1. Maternal Well-Being
“With this, my third birth,
I finally had the drug-
free natural birth I always
wanted. I also had an
easier recovery. This left
me feeling more confident
as a woman and mother,
and I will be more confi-
dent in approaching any
future births. ”“The worst thing was ba-
sically being abandoned
and forgotten by all my
friends after I had my baby.
Feeling isolated and hav-
ing little support aside
from my husband. ”“Emotionally, I am a lot
stronger of a person. It
amazes me how quick
I can make a decision
regarding parenting. I am
learning not to make a
big deal of small things –
choose my battles. Physi-
cally, I am exhausted all
the time. ”
“Before I had a child I
never understood what it
was like to be truly tired...
but now I do. ”

16
Postpartum Mental Health
We used the Patient Health Questionnaire-2 (PHQ-2) to ask mothers about possible depressive symptoms in the two weeks prior to both the initial and follow-up surveys (Table 8). About one in three mothers reported “feeling down, depressed or hope-less” (35%) or having “little interest or pleasure in doing things” (36%) for at least sev-eral days in the two weeks before completing the follow-up survey. Also, 6% reported “feeling down” and 7% felt “little interest” nearly every day. Using the developers’ recommended scoring and cut point, we used both questions to identify those moth-ers who screened as likely to be depressed. In clinical settings, such women would be referred for evaluation. Overall, 17% of mothers screened as likely to be depressed in the postpartum survey compared with 14% in the original survey. Table 8 compares results in the two surveys. Notably, a large majority of mothers (76%) did not reach the screening standard for depression in either survey, while 7% met the standard in both. One in ten (10%) who did not reach the threshold for depression in the first survey did so in the postpartum and 7% reached the threshold in the first survey, but not the follow-up.
While 17% of all mothers in the follow-up survey met the screening criteria for depression, responses varied by demographic factors, with mothers who paid for the birth out-of-pocket (38%), with five or more children (36%), who had neither a spouse nor a partner (33%), who had had an unplanned pregnancy (29%), and were uninsured (25%) all reporting rates significantly higher than average (p < .01).
Table 8. Persistence of symptoms of depression from initial to follow-up surveys
Base: all follow-up LTM III mothers n=1072
Follow-up Survey
Initial Survey
Total
Screened as not likely to
be depressed
Screened as likely to
be depressed
Screened as not likely to be depressed 76% 7% 83%
Screened as likely to be depressed 10% 7% 17%
Total 86% 14% 100%
Note: All initial and follow-up LTM III survey participants responded to the Patient Health Questionnaire-2 (PHQ-2) two-question depression screener. Above figures are based on the recommended cut point indicating likely depression.
LTM III: New Mothers Speak Out / 1. Maternal Well-Being
“Being a working mother
is definitely a challenge.
Especially after my first
child, I experienced a ton
of guilt. There is immense
pressure in today’s society
to do it all, and to do it
well, and to be happy
doing it. I don’t think I
realized at the time that I
was ‘depressed’. After my
second child, I decided to
be more proactive. I am
taking a low dose anti-
depressant and ‘trying’
not to feel guilty about
taking some time to myself
on some of my days off,
instead of spending every
possible moment with
my kids. ”
“I had had three prior
children before so I knew
what to expect but would
have never thought that
post-partum depression
would happen to me. ”“I wish there would be
a better way to mentally
prepare yourself for the
massive life change that
happens. It was very
overwhelming for the first
month and I was worried I
had depression but it was
just a very big adaptation
that I had to go through. ”

17
In the follow-up survey, we asked mothers if they had consulted a health care or mental health professional at any time since birth about their emotional or mental well-being, and 18% reported they had. Interestingly, mothers’ responses were not strongly related to the amount of time since they gave birth, with at least 22% of mothers who had given birth from 10 to 12 months earlier and 22% who gave birth from 19 to 21 months earlier reporting they had had such a consultation.
Table 9 examines whether or not mothers consulted a provider concerning their mental or emotional health, stratified by their PHQ-2 scores for both surveys. While 18% of all mothers reported seeking help, that figure varied widely based on wheth-er they screened as likely to be depressed. Mothers who met the standard for likely depression in both surveys were almost four times as likely to have sought help (45% to 12%) than those who did not meet the standard in either survey, while one-third (33%) of mothers who met the standard in one or the other survey sought help. Of great concern, more than half the mothers (55%) who met screening criteria for de-pression in both the initial and follow-up surveys failed to report getting any help.
Table 9. Use of mental health services, by depression screening scores in initial and follow-up surveys
Since giving birth, have you consulted a health care or mental health professional (for example, either your maternity or primary caregivers, a social worker, psychologist, or psychiatrist) with concerns about your emotional or mental well-being?
Base: all follow-up LTM III mothers n=1072
Follow-up survey % “yes” consulted
Initial survey % “yes” consulted
Total
Screened as not likely to
be depressed
Screened as likely to
be depressed
Screened as not likely to be depressed 12% 33% 14%
Screened as likely to be depressed 33% 45% 37%
Total 14% 39% 18%
LTM III: New Mothers Speak Out / 1. Maternal Well-Being
“I suffered, and am still
suffering, from PPD. My
child will be 6 months old
tomorrow, and I actually
went to the Dr. today to try
something else to help. I
have been on about 5 dif-
ferent anti-depressants....
I am just now starting to
get a little better. I never
thought about PPD being
a problem until it hit me
like a ton of bricks 2 days
after I came home from
the hospital. ”“My OB was helpful
knowing that I am prone
to PPD, but unfortunately,
there are very few mental
health resources for
women, even when they
know they are depressed
and need help. It’s almost
impossible to get an ap-
pointment with a psy-
chologist or psychiatrist,
even if you can manage
to find one that’s on your
insurance plan. I really
needed help but I could
barely get a therapist to
return my calls (literally – I
called and left messages
and they wouldn’t call
me back). ”“I like that they are ad-
dressing PPD as an ACTUAL
illness. ”

18
2. Child Well-Being
Experiences from the prenatal period through the initial weeks and months of a baby’s life establish a foundation for lifelong health and well-being. Combined results from the initial and follow-up Listening to MothersSM III surveys enabled us to describe many dimensions of early life experiences of babies born in U.S. hospitals in 2011-12 for up to 21 months after birth. This chapter describes mothers’ assessment of the babies’ health status, the babies’ experience with use of child health services, the babies’ feeding and especially breastfeeding experiences, and use of selected prac-tices – circumcision, pacifiers, and co-sleeping.
Rating of Child’s Health
We asked mothers to rate their child’s current health. Mothers were generally very positive, with 98% saying their child’s health was excellent (78%) or good (20%). This finding is consistent across a wide array of factors, including race/ethnicity, income, age, intendedness of pregnancy, and source of payment for maternity care. These ratings did vary when comparing babies that were rehospitalized (7% of mothers rated those babies’ health fair; 0% poor) with babies that were not (2% fair/poor). However, even among babies that had subsequent hospital stays, almost half the mothers (48%) rated their baby’s current health as excellent.
Health Care
Length of Time Child Stayed in Hospital After BirthA majority of mothers (65%) reported that their baby came home within 2 days after being born, with only 6% staying six or more days. The length of stay varied widely by mode of birth, with 59% of babies born by cesarean staying three or more days compared with 22% of babies born vaginally. Not surprisingly, babies born by cesar-ean who spent time in a neonatal intensive care unit (NICU) were much more likely to stay six or more days (33%) than those born by cesarean who were not in a NICU (1%) (p < .01).
Child’s Health Care ProviderJust as obstetricians were the predominant providers of maternal health services, mothers most often named pediatricians (79%) as their child’s primary care provider. Family doctors (17%), nurse-practitioners (2%), and physician assistants (1%) account-ed for the remainder. Use of a family physician was greatest among mothers who had relied on a family physician for their prenatal care (79%).
LTM III: New Mothers Speak Out / 2. Child Well-Being
“He was a healthy baby
in every way. He hadn’t
gotten sick once. He was
happy, and interactive. ”“With my son, he had
some birth defects that
he was born with that re-
quired more attention and
more in-depth care. ”
“My child had to spend
two days in the NICU....
I knew it was the best
place for my baby, but
I was angry about the
separation and angry at
the NICU nurses for not
listening to my wishes and
trying to feed the baby
apart from me. ”

19
Well- and Sick-Child VisitsMothers reported making about six well-child and two sick-child visits on average (Figure 3). This figure was obviously strongly related to the time elapsed since birth, with mothers who had given birth 7 to 12 months earlier averaging 6.8 total visits and those giving birth 13 to 21 months earlier averaging 9.3 total visits. There were some interesting lack of differences among subgroups and for consistency we limited the comparison to mothers who had given birth within a year of the survey. There were no notable differences by race/ethnicity or between first-time and experienced mothers, nor were there differences by how mothers rated their child’s health.
Figure 3. Number of well-child and sick-child visits, by age of child
Base: all follow-up LTM III mothers n=1074 • Well-child visit • Sick-child visit
Immunization PreferencesWe asked mothers about their approach to immunizations relative to the recom-mended schedule of immunizations. More than four in five (83%) mothers indicated they preferred to get all immunizations according to guidelines, while 12% preferred to make modifications, such as adjustments to timing or dosage, and 3% preferred not to have their children immunized.
We also asked mothers to self-describe their political ideology and they did as either liberal (27%), moderate (45%), or conservative (28%). The likelihood of a mother not wanting to have her child immunized was strongly related to self-perceived political ideology, with mothers who self-described themselves as conservative (7%) more likely than self-described liberals (1%) (p < .01) to not want immunizations. We also explored differences by region, and mothers living in the Western part of the United States (7%) were more likely to prefer to avoid immunization compared with mothers from the Northeast (0%) (p < .01). Combining these two factors, 17% of mothers who were self-described conservatives and from the Western region preferred not to have their child immunized compared with 0% for self-described liberals from the Northeast.
7.0 2.3
4.6 1.7
5.5 1.7
6.5 2.7
7.0 2.3
0 10.08.06.04.02.0
19 – 21 months
16 – 18 months
13 – 15 months
10 – 12 months
7 – 9 months
Total number of visits
LTM III: New Mothers Speak Out / 2. Child Well-Being
“We refused to have
the Hep B vaccine given
to our daughter in the
hospital. We decided
ahead of time to wait until
her 2 month check up. We
refused because she was
not at risk for Hep B. Her
pediatrician accepted this
refusal with no disagree-
ment. We met with him
weeks before giving birth
and he told us this was
common and acceptable
for babies who are not at
risk. He followed up with
us about this decision at
her 2 month check up, at
which time she received
the vaccine. ”
“I feel a sense of pride
when his well-child checks
go well. ”“Being at her doctor’s
appointments and know-
ing that she is gaining
weight and growing
makes me feel proud! I
had a part in that, with
breastfeeding her. ”

20
RehospitalizationA total of 9% of mothers reported that their child had to return to the hospital for at least an overnight stay (Table 3, in previous chapter). To make the rehospitalization figures more comparable, we limited the cases to babies who had been born at least nine months earlier. These results varied by race/ethnicity, with babies born to non-Hispanic black mothers more than twice as likely to be hospitalized (17%) as babies born to non-Hispanic white mothers (7%) (p < .01). It also varied by health measures such as rating of the child’s health (29% hospitalization rate for infants with health rated “fair” or “poor,” compared with 6% for those rated as “excellent,” p < .01) and number of sick-child visits (3.2 sick-child visits for those with a hospitalization com-pared with 2.0 such visits for those without one (p < .01).
Of those babies hospitalized after birth, almost one-fourth (22%) returned to the hos-pital within one month and more than one-third (38%) within 3 months. Overall, 3% of all mothers in the survey reported that their babies had been rehospitalized within 3 months of birth. The reasons given by mothers for infant hospitalizations varied widely, with no single response selected by at least one-third of mothers. Breathing problems, fever or infections, digestive problems, and jaundice were most often cited.
LTM III: New Mothers Speak Out / 2. Child Well-Being
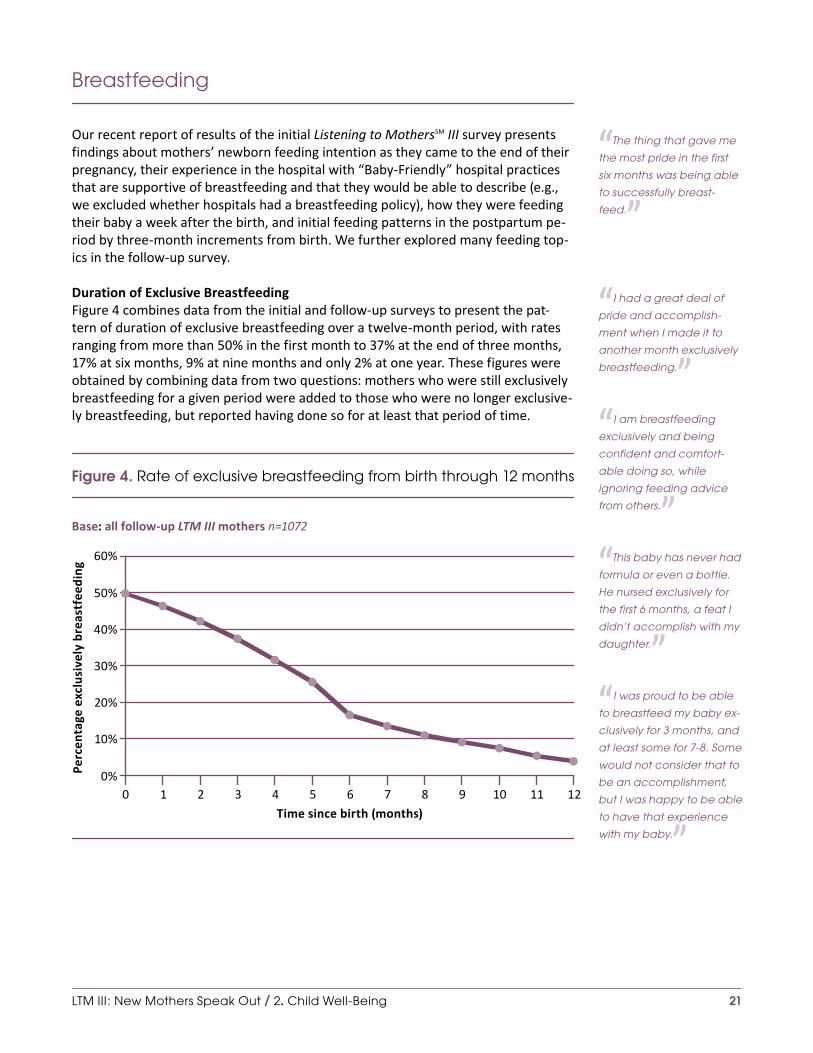
21
Breastfeeding
Our recent report of results of the initial Listening to MothersSM III survey presents findings about mothers’ newborn feeding intention as they came to the end of their pregnancy, their experience in the hospital with “Baby-Friendly” hospital practices that are supportive of breastfeeding and that they would be able to describe (e.g., we excluded whether hospitals had a breastfeeding policy), how they were feeding their baby a week after the birth, and initial feeding patterns in the postpartum pe-riod by three-month increments from birth. We further explored many feeding top-ics in the follow-up survey.
Duration of Exclusive BreastfeedingFigure 4 combines data from the initial and follow-up surveys to present the pat-tern of duration of exclusive breastfeeding over a twelve-month period, with rates ranging from more than 50% in the first month to 37% at the end of three months, 17% at six months, 9% at nine months and only 2% at one year. These figures were obtained by combining data from two questions: mothers who were still exclusively breastfeeding for a given period were added to those who were no longer exclusive-ly breastfeeding, but reported having done so for at least that period of time.
Figure 4. Rate of exclusive breastfeeding from birth through 12 months
Base: all follow-up LTM III mothers n=1072
60%
50%
40%
30%
10%
20%
0%Perc
enta
ge e
xclu
sive
ly b
reas
tfee
ding
121 2 3 4 5 6 7 8 9 10 110
Time since birth (months)
LTM III: New Mothers Speak Out / 2. Child Well-Being
“The thing that gave me
the most pride in the first
six months was being able
to successfully breast-
feed. ”
“I had a great deal of
pride and accomplish-
ment when I made it to
another month exclusively
breastfeeding. ”“I am breastfeeding
exclusively and being
confident and comfort-
able doing so, while
ignoring feeding advice
from others. ”“This baby has never had
formula or even a bottle.
He nursed exclusively for
the first 6 months, a feat I
didn’t accomplish with my
daughter. ”“I was proud to be able
to breastfeed my baby ex-
clusively for 3 months, and
at least some for 7-8. Some
would not consider that to
be an accomplishment,
but I was happy to be able
to have that experience
with my baby. ”

22
Baby Feeding Patterns Table 10 presents a different breakdown, looking at mothers by three-month peri-ods, and illustrates the changing pattern of infant and toddler feeding from seven through twenty-one months postpartum. One in three mothers (34%) reported they were still feeding their baby at least some breast milk at the time they completed the follow-up survey. This was related to the time since they had given birth, with 40% of mothers with babies 7 to 12 months old still giving their babies at least some breast milk compared with 27% of mothers with babies 13 to 18 months old. Formu-la use was more common at 7 to 12 months (69%) and had a pronounced drop-off, with 27% of mothers with babies at least a year old still using formula. Most all the mothers (93%) reported giving their babies at least some baby food or table food after 6 months. The likelihood of a mother still providing her baby with some breast milk for at least one year was largely unrelated to demographic characteristics with one exception. Non-Hispanic black mothers (48%) were more likely to report con-tinuing at least some breastfeeding after one year compared with Hispanic (28%) or white non-Hispanic mothers (27%) (p < .01). In all, 31% of mothers met the American Academy of Pediatrics recommendation for some breastfeeding continuing to 12 or more months.
Table 10. Baby feeding patterns from 7 to 21 months postpartum
Are you currently feeding your child any...?
Base: all follow-up LTM III mothers n=1072
Age of baby at time of follow-up survey
7-9 mosn=149
10-12 mosn=241
13-15 mosn=198
16-18 mosn=270
19-21 mosn=215
Alln=1072
Breast milk 41% 39% 18% 34% 40% 34%
Formula 76% 66% 21% 29% 33% 43%
Solid food 90% 92% 94% 92% 96% 93%
Reasons for Not Establishing and for Discontinuing BreastfeedingWe asked mothers in the initial survey how they had intended to feed their newborn as they approached the end of their pregnancy and how they were actually feeding their newborn a week after giving birth. About one mother in twenty (5%) reported that at one week she had not fulfilled her intention to breastfeed exclusively or in combination with formula feeding. In the follow-up survey, we asked those specific mothers their reasons for not breastfeeding, and Table 11 reports the reasons cited by 8% or more of this group. Mothers could check more than one answer and many did, with “baby had difficulty nursing” (31%) being most commonly cited, followed by “too hard to get breastfeeding going” (23%) and “formula more convenient” (23%). Other commonly cited answers included, “I didn’t get enough support to get breastfeeding going” (17%), “I didn’t plan to breastfeed much anyway, as I planned to go back to my paying job soon” (13%), “I had to take medicine and didn’t want my baby to get it” (12%), “I tried breastfeeding and didn’t like it” (12%), and “It was too
LTM III: New Mothers Speak Out / 2. Child Well-Being
“I am still giving my
little one breast milk. I am
proud that I have made
it over 8 months now and
am going to try and make
it to a year. ”“I am able to stay calm
and committed to nursing
my baby as long as pos-
sible, hopefully up to and
possibly slightly past her
first year of life. Getting a
good start and staying
positive with breastfeed-
ing has helped tremen-
dously. ”
“The worst thing was ….
not being able to breast-
feed my son as I had
planned and feeling
depressed and guilty
about that. ”

23
hard with my own health challenges” (12%). Since this is a relatively small subset of mothers (n=58 in the postpartum survey), analysis of these results by subgroups was not feasible.
Table 11. Mothers’ leading reasons for not establishing and for discontinuing breastfeeding
(choose all that apply)
Base: intended to breastfeed at end of pregnancy among follow-up LTM III mothers n=614
Base: breastfeeding at one week among follow-up LTM III mothers n=551
Reasons cited by 8% or more mothers for not breastfeeding at one week
Reasons cited by 8% or more mothers for not breastfeeding at time of survey
My baby had difficulty nursing 31% I had trouble getting breastfeeding going well 39%
It was too hard to get breastfeeding going 23% Formula or solid food was more convenient 22%
Formula was more convenient 23% I fed my baby breast milk as long as I had planned 22%
I didn’t get enough support to get breastfeeding going
17%My baby stopped nursing; it was the baby's decision
18%
I didn’t plan to breastfeed much anyway, as I planned to go back to my paying job soon
13%I was working at a paying job or school, and other people were feeding the baby
9%
I had to take medicine and didn’t want my baby to get it through breast milk
12%I did not have enough help to work through the challenges
8%
I tried breastfeeding and didn’t like it 12%I had to take medicine and didn’t want my baby to get it through breast milk
8%
It was too hard with my own health challenges 12%
After the birth, I changed my mind about wanting to breastfeed
9%
Note: numerous other reasons were cited by fewer than 8% of respondents
We asked a similar question of mothers who were breastfeeding at one week, either exclusively or in combination with formula feeding, and were no longer doing so at the time of the follow-up survey. The answers were distributed more widely (Table 11), led by “had trouble getting breastfeeding going well” (39%), “fed my baby breast milk as long as I intended to” (22%), “formula or solid food more convenient” (22%), “baby stopped nursing – baby’s decision” (18%), and “went back to job/school”(10%).
LTM III: New Mothers Speak Out / 2. Child Well-Being
“I could tell from his
cry and round-the-clock
nursing that he wasn’t
getting enough from me.
I definitely wanted to
breastfeed my babies
exclusively, but my body
just didn’t produce
enough milk. ”

24
Satisfaction with Duration of BreastfeedingWe asked all mothers who reported any breastfeeding at one week, and were not currently breastfeeding at the time they participated in the follow-up survey (n=530) if they had breastfed as long as they wanted. Table 12 presents the results. Half (49%) stated that they had.
Table 12. Whether mothers breastfed as long as they liked, by insurance and support services
Base: breastfeeding at one week and not currently breastfeeding among follow-up LTM III mothers n=530
% breastfed as long as liked
All 49%
Primary insurer during pregnancy
Private insurance 52%
Medicaid or CHIP 50%
WIC during pregnancy
Yes 53%
No 45%
WIC postpartum (for mother, baby, or both)
Yes 49%
No 48%
Had home visit from a health professional
Yes 50%
No 49%
Had a telephone number to call for postpartum advice
Yes 51%
No 40%
LTM III: New Mothers Speak Out / 2. Child Well-Being
“Breastfeeding has been
the biggest accomplish-
ment for my daughter
and me. Breastfeeding is
much more difficult than
most make it out to be. It
took a long time for both
of us to get the hang of it
and I battled low supply
at the beginning. Once
nursing became routine,
then I battled sore nipples,
blisters on the nipples, and
an infection, which made
it hard to keep pushing
through, but we are still
nursing at 10 months and
are hoping to make it
to 12. ”“I was proud that I could
breastfeed my baby since
I tried for three weeks with
my first child and was
unsuccessful. ”“I was very proud that I
was able to breastfeed
my daughter for as long
as I did. ”
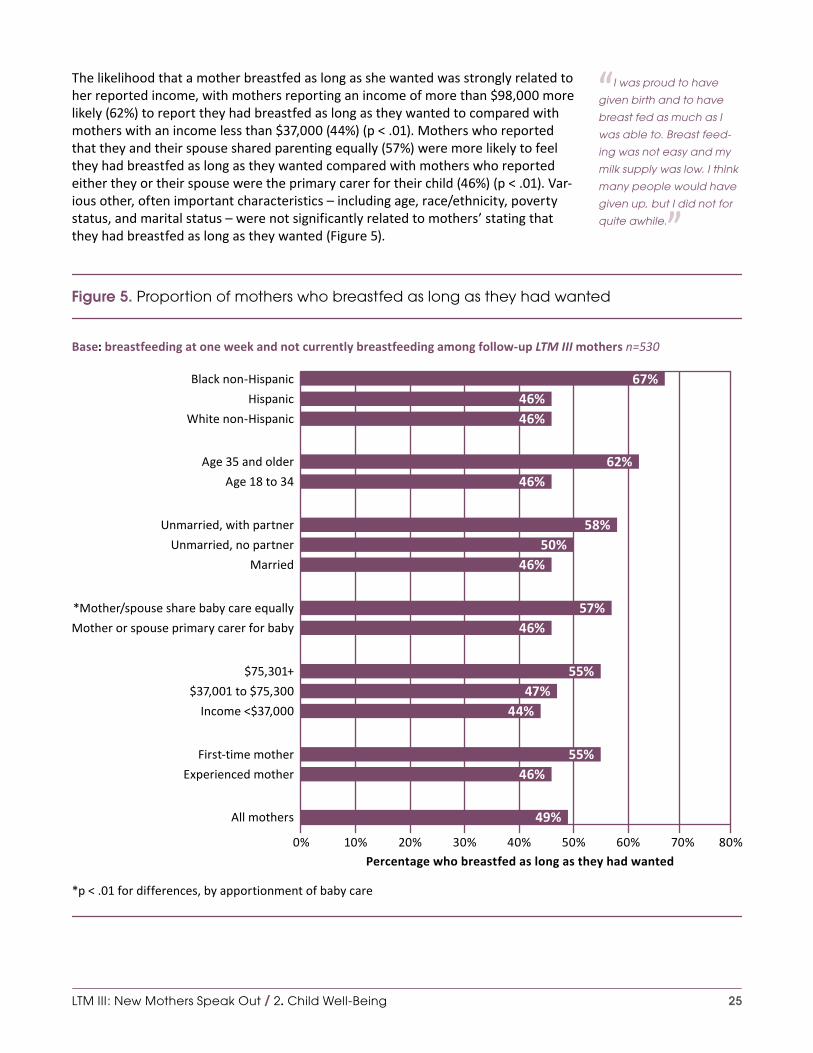
25
The likelihood that a mother breastfed as long as she wanted was strongly related to her reported income, with mothers reporting an income of more than $98,000 more likely (62%) to report they had breastfed as long as they wanted to compared with mothers with an income less than $37,000 (44%) (p < .01). Mothers who reported that they and their spouse shared parenting equally (57%) were more likely to feel they had breastfed as long as they wanted compared with mothers who reported either they or their spouse were the primary carer for their child (46%) (p < .01). Var-ious other, often important characteristics – including age, race/ethnicity, poverty status, and marital status – were not significantly related to mothers’ stating that they had breastfed as long as they wanted (Figure 5).
Figure 5. Proportion of mothers who breastfed as long as they had wanted
Base: breastfeeding at one week and not currently breastfeeding among follow-up LTM III mothers n=530
*p < .01 for differences, by apportionment of baby care
40% 80%70%60%50%30%20%10%0%Percentage who breastfed as long as they had wanted
67%46%
47%55%
46%57%
46%50%
58%
46%62%
46%
44%
55%46%
49%
Black non-Hispanic
Hispanic
White non-Hispanic
Age 35 and older
Age 18 to 34
Unmarried, with partner
Unmarried, no partner
Married
*Mother/spouse share baby care equally
Mother or spouse primary carer for baby
$75,301+
$37,001 to $75,300
Income <$37,000
Experienced mother
First-time mother
All mothers
LTM III: New Mothers Speak Out / 2. Child Well-Being
“I was proud to have
given birth and to have
breast fed as much as I
was able to. Breast feed-
ing was not easy and my
milk supply was low. I think
many people would have
given up, but I did not for
quite awhile. ”

26
Knowledge of American Academy of Pediatrics Breastfeeding RecommendationsMothers were asked if they knew the recommendations for duration of breastfeed-ing from the American Academy of Pediatrics (AAP), and Table 13 summarizes their responses. The official guidelines state, “The AAP recommends exclusive breast-feeding for about 6 months, with continuation of breastfeeding for 1 year or longer as mutually desired by mother and infant,” a recommendation also supported by the World Health Organization and the Institute of Medicine. Mothers’ responses suggested awareness of the recommendations, with 43% of the mothers stating 6 months for exclusive breastfeeding and 60% citing 12 months for any breastfeeding. The mean responses for exclusive breastfeeding were 7 months and for any breast-feeding 11 months. Responses did not vary significantly by whether or not the moth-er had been exclusively breastfeeding or exclusively formula feeding at one week.
Table 13. Mothers’ awareness of breastfeeding recommendations from the American Academy of Pediatrics
To the best of your understanding, what are the breastfeeding recommendations of the American Academy of Pediatrics?
Base: all follow-up LTM III mothers n=1072
All mothersn=1072
Exclusive breastfeeding at one week
n=551
Exclusive formula feeding
at one weekn=220
Feed breast milk as the only food until your baby is at least |_| months old
7.0 7.0 6.6
Along with solid food, continue to breastfeed until your baby is at least |_| months old
11.3 11.8 9.6
Note: American Academy of Pediatrics recommends exclusive breastfeeding for about the first six months of life, followed by breastfeeding in combination with complementary foods until at least 12 months of age, and continued breast-feeding as long as mutually desired by mother and baby.
Breastfeeding HistoryWe asked the mothers how many babies they had birthed and, for each, how they had intended to feed the baby and how they were actually feeding a week after the birth. Table 14 presents results for the optimal situation of exclusive breastfeeding, ranging from those who had one prior birth to five prior births. The results, which may have been impacted by challenges with recall, strikingly suggest that the likeli-hood of intending to exclusively breastfeed and of doing so a week after birth are powerfully and inversely related to the number of births.
LTM III: New Mothers Speak Out / 2. Child Well-Being
“I had such a difficult
time breastfeeding…. Day
in and day out of pump-
ing every 2-4 hours really
took a toll on me. I thought
about giving up so many
times but I ... knew it was
the best thing for my son.
I made it to 6 months and
… I was so proud of stick-
ing to it. My son has never
been sick. ”
“I wish I would have
been more patient with
breastfeeding, I did not
have as easy a time as I
did with my other children.
Now that I look back, I feel
like I ‘gave up’ too early,
and it makes me sad. ”

27
Table 14. Mothers’ breastfeeding intent and practice, with up to five previous births
Base: had given birth one or more times prior to current birth among follow-up LTM III mothers n=637
Previous births
Intended to exclusively breastfeed as came to the end of that pregnancy
Was exclusively breastfeeding one week after that birth
First n=637 47% 42%
Second n=292 37% 34%
Third n=115 21% 27%
Fourth n=66 9% 13%
Fifth n=24 7% 7%
Selected Practices: Circumcision, Pacifier Use, Co-Sleeping
CircumcisionEight in ten mothers (79%) who gave birth to a son reported that he had been cir-cumcised. The practice of circumcision varied widely by race/ethnicity, with first-time Hispanic mothers far less likely (54%) than white (87%) or black (88%) non-His-panic first-time mothers to have their son circumcised (p < .01). Similar differences occurred for experienced mothers, with 47% of Hispanic mothers with at least one other child reporting they had their sons circumcised (p < .01).
Pacifier UseOur first Listening to MothersSM III report describes the extent to which hospital staff provided newborns with pacifiers in the context of “Baby-Friendly” hospital prac-tices. The follow-up survey asked mothers about ongoing pacifier use. Slightly more than half of mothers (58%) reported that their baby had ever used a pacifier on a reg-ular basis. Among mothers with babies 13 or more months old, the average amount of time the baby had used the pacifier was 9.5 months. We also asked if the baby was still using a pacifier at the time of the follow-up survey, and in those cases the aver-age length of use was 12 months.
LTM III: New Mothers Speak Out / 2. Child Well-Being
“I did not have my son
circumcised. They double-
checked that I really didn’t
want it done and then
they respected my wishes
not to do so. ”
“Women should be told
that exclusively pumping
breastmilk is a viable op-
tion. I did it with all three
of my children for a year
each. ”
“I do not feel a pacifier is
a way to calm my baby. ”“I am especially proud of
not using a pacifier. ”

28
Co-SleepingOne in ten mothers (12%) reported that her baby always slept in the same bed with her in the first six months after birth, and an additional three in ten stated the baby often (12%) or sometimes (17%) did. This was strongly related to race/ethnicity (Figure 6), with black non-Hispanic mothers reporting co-sleeping often or always 29% of the time (13% always) compared with 25% for Hispanic mothers (16% always) and 22% for white non-Hispanic mothers (10% always) (p <. 01).
Figure 6. Frequency of baby co-sleeping in first six months after birth, by race/ethnicity
Base: all follow-up LTM III mothers n=1072
p < .01 for differences by race/ethnicity
16%
• Never
• Rarely
• Sometimes
• Often
• Always
Black non-Hispanic Hispanic White non-Hispanic
18%
13%
16%
28%
33%
16%
42%
10%
15%
12%
22%27%
9%
26%
LTM III: New Mothers Speak Out / 2. Child Well-Being
“He was able to sleep
in his crib by 2 months. I
didn’t have to co-sleep
with him like I did with my
first child. ”“She sleeps by herself. I
don’t need to carry her or
put a pacifier, and I try to
do a good job. ”
“I liked the times when
he was content in my arms
or sleeping by me. ”“When I got my baby to
sleep in her crib, for the
first time I felt like I was do-
ing something right. ”

29
3. Family and Relationships
Women and families with babies face unique challenges and responsibilities, and our initial and follow-up surveys help us better understand their circumstances in the United States. Nearly all other western industrial nations have established a more comprehensive system of supports for new mothers and families. We were eager to learn whether the mothers had a spouse or partner and, if so, the relative involve-ment of the mothers and their spouses/partners in care of the babies who were born in 2011-2012, as well as the mothers’ access to support from the their spouse or partner and from others. This chapter also describes the mothers’ attachment to their new babies, the total number of children they hope to have, and use of WIC ser-vices in the postpartum period. The following chapter further helps understand the circumstances of women and families in the postpartum period by reporting patterns and experiences of employment and use of child care services at this time.
Mothers with a Spouse, a Partner, or Neither
We asked mothers if they were currently married, unmarried with a partner, or un-married with no partner and, as they had reported in the initial survey, most (66%) reported being married, a few (11%) were without a partner, and the remainder were unmarried with a partner (23%).
There were some interesting differences when we compared mothers’ responses to a question about their marital status at the time of the birth (in the initial survey) to their response to a similar question at the time of the follow-up survey from six to twenty-one months later. Most mothers (94%) who reported being married at the time of the birth were still married at the time of the follow-up survey. Among mothers who had reported being unmarried with a partner at the time of birth, 20% were now married, and 17% reported not having a partner. Among mothers who reported being unmarried with no partner at the time of the birth, 15% were now married, and 28% had a partner.
Differences in marital status by race/ethnicity at the time of birth were repeated at the time of the follow-up survey, with white non-Hispanic mothers most likely to be married (76%), followed by Hispanic (57%) and black non-Hispanic (44%) mothers (p < .01). Black non-Hispanic and Hispanic mothers both reported a rate of 13% for having neither a spouse nor a partner, and 9% of white non-Hispanic mothers had neither.
LTM III: New Mothers Speak Out / 3. Family and Relationships
“I feel needed as a
person now. But I also feel
like I am not me anymore,
just mommy, a cook, a
chauffeur and bill payer.
Sometimes I am resentful
of the lack of help. ”
“Wait to have children
until you’re married and
have the support. ”“I had been going
through this process with-
out the father but with sup-
port from my family. ”“My husband and I are
separated and have
been since my son was
3 months. ”“I wish I had more time
to myself and more alone
time with my husband. ”

30
Sharing Child Care with a Spouse or Partner
We asked mothers who reported having a spouse or partner how they apportioned daily care for the child born in 2011-12. Overall, mothers reported that they provided more of the child care (61%), with 35% reporting that care was shared equally and 3% reporting that their spouse or partner provided more care. As Figure 7 illustrates, this was strongly related to the mother’s current employment situation, with almost half (49%) of mothers who worked full time outside the home saying child care was equally shared while 24% of those staying at home indicated care was equally shared (p < .01). There was an interesting relationship with age, as mothers who were 30-39 were most likely to say they provided most of the care (71%), a much higher rate than mothers under 30 (54%) (p < .01). Shared care was more commonly reported by Hispanic (47%) and non-Hispanic black (46%) mothers than non-Hispanic white (29%) mothers (p < .01).
Figure 7. Responsibility for baby care, by employment status
Base: has a spouse or partner among follow-up LTM III mothers n=954Note: “Not sure” responses are not shown
p < .01 for differences, by employment status
• Spouse/partner provides more care
• Daily care shared equally
• I provide more care
Employed full time Employed part time Not employed
24%
74%
42%
55%
49%
45%
7%3%
↙
LTM III: New Mothers Speak Out / 3. Family and Relationships
“I’m happy to keep my
job and family balanced.
The baby is so much work.
My husband has been
very supportive. We’re
raising the baby as a team
and this has strengthened
our marriage. ”“My first few weeks after
giving birth were hard for
me because I felt exhaust-
ed and that I had no help
from my partner. ”
“I thought I was over-
whelmed prior to the baby
but I feel it is tenfold now
because my spouse works
so much and I don’t get
enough help. ”“I’m more tired and
have a hard time getting
everything done. Then
when I do I don’t have any
time to myself. I’m always
doing things for the kids
and when they go to sleep
my husband wants me to
show him attention. ”

31
Types of Support Available From a Spouse or Partner and From Others
We described four types of support (emotional, practical, affectionate, and enjoy-ment) that mothers might receive from their spouses/partners and asked how of-ten mothers with a spouse or partner received such support (Table 15). Mothers’ responses were generally consistent across all the dimensions. They were most likely to cite affectionate support as being available (45% “all the time”), followed by emotional (41% “all”), enjoyment (40%), and practical (39%) support. For each type of support, from 15% to 18% of mothers indicated that they received such support “none” or “a little” of the time. Both married mothers and those unmarried with partners generally cited similar levels of support.
Table 15. Types and level of support from spouse or partner
Since the birth of your baby, how often are the following types of support available from your (spouse/partner)?
Base: has spouse or partner among follow-up LTM III mothers n=954
None of the time
A little of the time
Some of the time
Most of the time
All of the time
Affectionate, such as showing me affection and helping me feel wanted
4% 11% 14% 26% 45%
Emotional, such as listening to my concerns and giving good advice
4% 12% 18% 24% 41%
Enjoyment, such as having fun or relaxing together 6% 12% 18% 23% 40%
Practical, such as helping me get things done or get needed information
5% 10% 20% 26% 39%
LTM III: New Mothers Speak Out / 3. Family and Relationships
“I felt like super mom for
being able to handle it all
mostly by myself while my
husband was at work. ”“If both partners do not
prepare to be a big sup-
port system for each other,
it can be very disappoint-
ing for the couple. ”
“Family members,
friends, and people in
general should be more
sensitive to the needs of
second or third time moth-
ers because there were
many times I felt dismissed
by others when verbalizing
my thoughts, feelings, and
concerns by statements
like, ‘Well, you are a pro
at this’ or ‘This is your third
time around, you have
nothing to worry about’.”

32
We asked mothers to rate the support they received along the same four dimensions from those other than their spouse or partner or, in the case of single mothers, from anyone (Table 16). While the overall ratings were generally lower, mothers did appear to have access to significant levels of support from those around them. They were most likely to cite emotional support from others (52% “all” or “most of the time”) and least likely to cite practical support or enjoyment (44% “all” or “most of the time”).
Not surprisingly, mothers who indicated they were unmarried with no partner were more likely to cite support from others than were mothers who were married or unmarried with a partner. For example, 33% of women with neither a spouse nor partner reported they received practical support from others “all the time,” while 20% of married mothers and 17% of unmarried mothers with partners cited such a level of support (p < .01).
Table 16. Types and level of support from others
Since the birth of your baby, how often are the following types of support available from other people you know?*
Base: all follow-up LTM III mothers n=1072None of the time
A little of the time
Some of the time
Most of the time
All of the time
Affectionate, such as showing me affection and helping me feel wanted
9% 16% 27% 27% 20%
Emotional, such as listening to my concerns and giving good advice
8% 14% 25% 28% 24%
Enjoyment, such as having fun or relaxing together 9% 18% 28% 23% 21%
Practical, such as helping me get things done or get needed information
11% 18% 27% 24% 20%
* Mothers without a spouse or partner were asked: “... how often are the following types of support available from people you know?”
LTM III: New Mothers Speak Out / 3. Family and Relationships
“My marriage is stronger
but my other friendships/
relationships are very dif-
ferent now because all of
my focus is on the baby. ”
“I could have benefitted
from some help because I
think I had a touch of the
baby blues and was over-
whelmed because I had
two other young children
at home and breastfeed-
ing wasn’t going well.
I didn’t want to bother
anyone with my feelings....
I know I wanted people to
think I could do it all and
not look down on me as a
mother if I couldn’t. ”

33
Attachment To the New Baby
We asked mothers a series of questions comprising a postpartum attachment scale concerning their feelings about their new baby. Table 17 summarizes the responses. Not surprisingly, mothers felt very positively toward their new baby, with 95% saying they enjoyed interacting with their baby most or all the time, and similarly favorable responses about how cute they find their baby, whether they speak to the baby reg-ularly, and desire to hold their baby. The only dimensions with slightly more varied re-sponses concerned whether or not the mother worried about her child when they were apart (40% all the time); whether or not she missed touching her baby when they were apart (64% all the time); and a statement “Taking care of my baby is fun,” which 57% of mothers indicated was true all the time. These responses did vary significantly based on whether or not the mother screened as likely to be depressed, with such mothers less positive. Notably, even in cases where mothers were likely to be depressed, 79% or more expressed positive feelings toward their baby most or all the time.
Table 17. Feelings indicating mothers’ attachment to their babies
How well do the following statements describe your feelings about your baby?
Base: follow-up LTM III mothers (see note) Always Most of the time Not really Not at all
I speak to my baby when caring for him/her 84% 12% 2% 2%
I am willing to do anything for my child 81% 12% 3% 4%
I enjoy interacting with my child 80% 15% 3% 3%
I feel my child is terribly precious 79% 13% 4% 4%
I feel at peace when my child is close by 77% 16% 3% 4%
I want to touch or hold my baby when I see him/her 73% 20% 3% 4%
I miss touching or holding my baby when he/she is not with me
64% 24% 10% 3%
Taking care of my baby is fun 57% 36% 5% 2%
I worry about my child in many ways when my child is not with me
40% 28% 23% 9%
I am not that interested in my child 6% 3% 4% 88%
I don't find my baby cute 6% 3% 4% 88%
Note: participants were randomly asked to respond to either (above, in order) response choices 1-3, 5, 7, and 11 (n=522) or response choices 4, 6, and 8-10 (n=550)
LTM III: New Mothers Speak Out / 3. Family and Relationships
“I don’t think about my-
self as much as I used to ...
I think about my baby, all
the time. ”“She’s perfect to me. I
could go on and on about
her wonderful ways. ”“I love that she is such
a happy baby. I also love
seeing her doing cute little
things, like saying hi to
people she sees. ”

34
Hoped for Number of Children
Mothers in our survey said they would like to have, in all and on average, three chil-dren, with three (31%) and two (25%) the most common responses. Only 8% wanted a single child (i.e., mothers with one who said they did not want any more), while 19% indicated a desire for four, 9% preferred five, and 9% wanted more than five. These numbers are higher than general fertility surveys since the mothers in our sur-vey already have at least one child, and 60% had two or more. When we stratified their answers by how many children they now had at home, we found that 81% of women with one child already at home wanted at least one more. Of those with two children, 68% wanted at least one more; and among those who already had three or more children, 48% wanted at least one more child. In each case, the ideal most often mentioned was one more child than they currently had.
Assistance from WIC
Our recent report of the initial Listening to MothersSM III survey describes women’s use of WIC (the Special Supplemental Nutrition Program for Women, Infants, and Children) services during pregnancy. In the follow-up survey, we asked about use of WIC services after the birth. Those services reached nearly half (49%) of families, with 31% of mothers reporting that both they and their babies had participated in WIC, 16% reporting that the babies alone participated, and 2% reporting that the mothers alone participated. Among families with WIC services going to both moth-ers and babies, participation was more likely if Medicaid or CHIP rather than private insurance had been the primary payer of maternity services, if the mother was employed part rather than full time, if she was unmarried with a partner or unmar-ried without a partner rather than being married, if she was black non-Hispanic or Hispanic rather than white non-Hispanic, and if she had high school or less or some college education rather than being a college graduate or having a higher level of education (p < .01 for all).
LTM III: New Mothers Speak Out / 3. Family and Relationships
“I am so glad to be a
mother and have a hus-
band that is there for me.
We look forward in
the future for more joy
and babies. ”“I am pretty much done
having babies. ”

35
4. Employment, Maternity Leave, Child Care, and Health Insurance
Unlike the United States, nearly all other western industrial nations have policies in place providing for paid extended leave and other supports available to new moth-ers and families. We used our follow-up survey to obtain new and updated informa-tion about women’s experiences with employment during pregnancy and after birth, and with maternity leave and child care. This chapter also presents results relating to new mothers who were students, those who were not employed during pregnan-cy and/or by the time of the follow-up survey, and current health insurance as well as out-of-pocket costs for maternity care.
Employment During Pregnancy
Employment Status During Pregnancy and Working Up to the Due DateMore than half (61%) of mothers indicated they were employed during their preg-nancy, primarily as full-time (33%) or part-time (23%) employees for someone else. A small proportion (6%) of mothers were self-employed. About two in five mothers (39%) were not employed during their pregnancy, though that varied widely, with only 31% of first-time mothers but 44% of experienced mothers (p < .01) at home during their pregnancy. Of those mothers who were employed, most worked almost to their due date, stopping on average about three weeks before their due date, with 34% working until less than a week before their due date.
Pregnancy-Related Challenges to EmploymentTable 18 presents responses to a sequence of questions concerning employer support for mothers during pregnancy. First, we asked mothers who were not self-employed if, during their pregnancy, they needed the accommodations listed in the table. Sub-stantial proportions of mothers did need each of these accommodations, most no-tably more breaks or a change in schedule. We then queried mothers on whether or not they had asked for such accommodations, and in most cases they had. Most all mothers reported that their employer attempted to address their concerns if they asked, which should encourage more pregnant mothers to seek accommodations. However, the circumstances of those mothers who needed accommodation and did not ask – including whether they understood their request would not be addressed or that permission was not required – cannot be determined from the responses.
LTM III: New Mothers Speak Out / 4. Employment, Maternity Leave, Child Care, and Health Insurance
“Now, I would have ad-
vised myself ... to work less
leading up to the birth,
and obtain more rest. ”“I could have taken off
from work just a week or
a few days before delivery
instead of the 2 weeks
leave I took before
the birth. ”“At my job, they did not
care about the baby’s
health, and had no
consideration for preg-
nancy at all. ”

36
Most of the very small number of mothers who had a concern, raised it with their employer, and had the employer turn it down, thought their employers had honored similar workplace requests from other workers with a physical limitation (69%). In those cases where a request was refused, mothers reported the primary reason was, in the case of a change in duties, that the employer had a policy of refusing all such requests or that it was seen as unreasonable or too difficult to satisfy. How-ever, these involved less than 1% of mothers employed during pregnancy.
Table 18. Employer support during pregnancy
During that pregnancy, did you face any of the following pregnancy-related situations with your paid job? Did you need...?
Base: employed by someone else during pregnancy among follow-up
LTM III mothers
% faced pregnancy-related
situation with paid job n=598
Of those who faced situation, % asked employer to
address need n varies
Of those who asked employer to address need, % whose employer attempted
to address concernn varies
To take more frequent breaks, such as extra bathroom breaks
71% 58% 95%
A change in your schedule or more time off, for example, to see your prenatal care providers
61% 74% 91%
A change in duties, such as less lifting or more sitting
53% 63% 91%
Some other type of workplace adjustment due to a pregnancy-related condition
40% 62% 87%
Maternity Leave
Paid Maternity LeaveOf those mothers who had been employed by someone else during pregnancy, 63% indicated that their employer provided a paid maternity leave benefit, with 64% of those working full time and 61% of those working part time having access to these benefits. We asked mothers how long they had to be working for their employer to be eligible for such benefits, and more than one-third (39%) were not sure. Among those who were aware and who had access to paid maternity leave benefits, the median number of months of employment required to qualify for this benefit was six. Among mothers who worked full time for someone else during pregnancy and received paid maternity benefits (Table 19), one-third (34%) indicated they received 100% of pay, and three out of four (76%) received at least half their regular salary. The time period for which mothers received pay varied widely, with three key peri-ods dominant: four weeks or less (24% of mothers receiving paid leave); five to eight weeks (43%), and nine to twelve weeks (27%). Looking at the subset of mothers who
LTM III: New Mothers Speak Out / 4. Employment, Maternity Leave, Child Care, and Health Insurance
“Sleep more while you
are on maternity leave. ”

37
had worked full time during pregnancy and who received 100% of their pay in ma-ternity benefits, the average length of time of coverage was eight weeks, with 43% receiving benefits for 6 weeks or less and 12% for 12 weeks or more.
Table 19. Mothers’ experience with paid maternity leave benefits
Base: mothers who were employed full time during pregnancy and employer had paid leave and mother took leave among follow-up LTM III mothers n=193
Number of weeks received paid maternity leave
Percentage of regular salary received during paid maternity leave
None 0% None 0%
1 – 4 24% 1 – 25% 6%
5 – 8 43% 26 – 50% 18%
9 – 12 27% 51 – 75% 27%
13 – 16 4% 76 – 99% 15%
17+ 3% 100% 34%
Unpaid Maternity LeaveWe also asked mothers about unpaid leave, which is a right guaranteed to pregnant women who work for a company with 50 or more employees under the 1993 Family and Medical Leave Act. A total of 69% of mothers stated their employer had a policy on unpaid leave, 21% indicated there was no such policy, and another 10% were not sure. Of those mothers with access to unpaid leave, 44% chose to use it and 42% did not. Of those mothers who worked for someone else during their pregnancy and knew their employer’s leave policies, a majority (55%) reported that their employer had policies for both paid and unpaid leave. Of those mothers indicating they had not taken unpaid leave, a majority (57%) indicated they were taking paid leave. Like-wise, among those mothers saying they took unpaid leave, half (50%) stated they had taken paid leave as well.
For those mothers whose employer had a policy allowing unpaid leave, mothers who knew how long it took to quality for such leave reported that on average it took 8 weeks of employment to qualify for such leave. Notably, more than half of the moth-ers (52%) could not report how long it would take to qualify for unpaid leave. Of those mothers who did use unpaid leave, the median number of weeks they took was 6 weeks with 93% taking 12 weeks or less. We also asked mothers how long they could take unpaid leave and have their job protected, and again, a substantial proportion (41%) could not respond. Of those who did, the median response was 12 weeks, with answers ranging up to one year, though 86% of mothers indicated 12 weeks or less.
Working for Employer While on Maternity LeaveJust over half (54%) of mothers who had been employed during pregnancy did not do any work for their employer while on maternity leave. A total of 23% reported working a little of the time, 16% some of the time, and the remainder most (5%) or all (2%) of the time. This distribution did not vary significantly by family income.
LTM III: New Mothers Speak Out / 4. Employment, Maternity Leave, Child Care, and Health Insurance
“During the first six
months, I was proud to be
spending every single mo-
ment with the baby, since
I had taken unpaid leave.
I really didn’t mind that,
as it was very important
to bond with the baby. I
could have used more
of that. ”
“I had to use my vaca-
tion time because I did
not qualify for maternity
leave pay. ”
“I was able to work
from home (part time) to
extend my maternity leave
while caring for my son. It
was awesome! ”

38
Employment After Birth
Current Employment and Student StatusMore than three in ten (31%) mothers who participated in the follow-up survey indi-cated that they were employed on a full-time basis at that time. Another 22% were employed part time, a small portion were students and not employed (3%) or still on paid leave (3%), while the remainder (41%) were neither employed, nor students, nor on leave. Mothers currently employed full time were more likely to be married, above the poverty level, and white non-Hispanic (all p < .01). Mothers who were employed generally worked at least some of the time at their employer’s workplace (89%).
Patterns of EmploymentWe asked mothers in the follow-up survey about their employment patterns after they had their baby. Among those mothers who had returned to paid work, 28% had returned by six weeks, and half (49%) were back to work by twelve weeks (Figure 8). They typically (86%) continued in the same arrangement (full time, part time, or self-employed) that they had been in during pregnancy. Overall, 23% of all mothers, whether they had been employed during pregnancy or not, had paid work responsi-bilities by 12 weeks after the birth.
Figure 8. Weeks after birth when mothers began paid work, through the first year
90%
80%
70%
60%
50%
40%
30%
10%
20%
0 10 15 20 25 30 35 40 45 505
Weeks after birth
Perc
enta
ge d
oing
full-
or
part
-tim
e pa
id w
ork
0%
100%
•Those employed during pregnancy among follow-up LTM III mothers
n=508
•All follow-up
LTM III mothers n=1072
LTM III: New Mothers Speak Out / 4. Employment, Maternity Leave, Child Care, and Health Insurance
“I feel that my perfor-
mance as a mother out-
weighs that of my profes-
sional life or other roles
that I fulfill. Since becom-
ing a mother, maintaining
my identity outside of
motherhood has been cru-
cial to my mental health
and being able to deal
with the stresses of taking
care of a child full time. ”“The biggest change
for me personally was
switching from having a
career to being a stay at
home mom…. You are left
with wondering who you
still are some days…. My
husband always reminds
me I have the most im-
portant job in the world,
and I know that as it was
my decision to be home,
but still – I don’t earn any
money now and that is
hard on me mentally
and our household. ”“Being a stay-at-home
mom has been a harder
adjustment for me than
being a working mom
was. ”

39
Figure 9 presents another view of patterns of returning to employment, in three-month increments from birth to 21 or more months. Among women who were em-ployed during pregnancy and had resumed paid work by the time of the follow-up survey, the largest group by far (49%) resumed paid work in the first three months after birth, followed by 26% from three to six months postpartum. Much smaller proportions, from 1% to 8%, resumed employment in the six increments depicted after six months.
Figure 9. When mothers returned to a paid job after birth
Base: employed during pregnancy and resumed paid job after birth among follow-up LTM III mothers n=508
We asked mothers if, in their return to paid work, they worked a number of hours that was comparable to what they had done during pregnancy. While 59% stated they did, 21% were working more and 20% were working fewer hours. In most cases (63%), the change in hours was the mother’s choice, and in an additional 17% of cases, mothers reported was a mutual decision by themselves and their employer. In 21% of the cases, mothers indicated it was their employer’s decision.
Mothers who were employed during pregnancy were asked about the amount of time they took off from work both before giving birth and after. The results are pre-sented in Table 20 and are stratified by whether or not mothers’ family income was above or below 200% of the U.S. poverty level. On average, mothers worked until three weeks before their due date and returned to work twenty-one weeks after. While there was little difference by poverty status in how close to their due date they continued with paid work, mothers whose family income was above 200% of the poverty level tended to return to work three weeks sooner (18.3 weeks) than mothers in the lower income category (21.5 weeks) (p < .01).
3 or fewer 3 – 6 6 – 9 9 – 12 12 – 15 15 – 18 18 – 21 21 or more
49%
26%
5% 2%6% 8%
1% 2%
Months after birth
LTM III: New Mothers Speak Out / 4. Employment, Maternity Leave, Child Care, and Health Insurance
“After having my second
child, I am tired. I long for
personal time and time
with my husband. I feel the
sacrifices I have made are
for the good of my chil-
dren. I struggle to keep my
family, work and personal
life balanced… I have a
different focus in my life,
my children. ”
“This last birth has made
me a better mother. I have
gone from working a FT
very good paying job to
having a low paying PT
job. I have gotten a lot
done around the house
but it never seems like
enough and I am much
lonelier than I was in the
past. We never go out
since we can’t afford to
and it’s been very trying.
I feel like it’s all my fault. ”
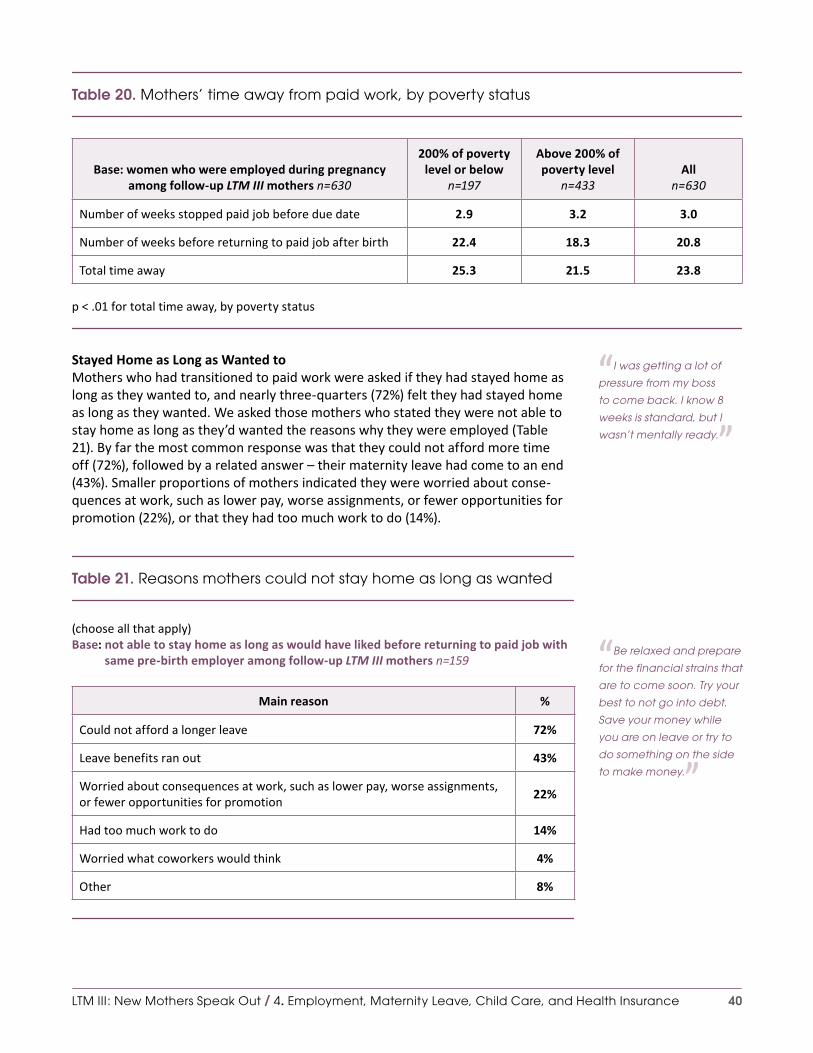
40
Table 20. Mothers’ time away from paid work, by poverty status
Base: women who were employed during pregnancy among follow-up LTM III mothers n=630
200% of poverty level or below
n=197
Above 200% of poverty level
n=433All
n=630
Number of weeks stopped paid job before due date 2.9 3.2 3.0
Number of weeks before returning to paid job after birth 22.4 18.3 20.8
Total time away 25.3 21.5 23.8
p < .01 for total time away, by poverty status
Stayed Home as Long as Wanted toMothers who had transitioned to paid work were asked if they had stayed home as long as they wanted to, and nearly three-quarters (72%) felt they had stayed home as long as they wanted. We asked those mothers who stated they were not able to stay home as long as they’d wanted the reasons why they were employed (Table 21). By far the most common response was that they could not afford more time off (72%), followed by a related answer – their maternity leave had come to an end (43%). Smaller proportions of mothers indicated they were worried about conse-quences at work, such as lower pay, worse assignments, or fewer opportunities for promotion (22%), or that they had too much work to do (14%).
Table 21. Reasons mothers could not stay home as long as wanted
(choose all that apply) Base: not able to stay home as long as would have liked before returning to paid job with
same pre-birth employer among follow-up LTM III mothers n=159
Main reason %
Could not afford a longer leave 72%
Leave benefits ran out 43%
Worried about consequences at work, such as lower pay, worse assignments, or fewer opportunities for promotion
22%
Had too much work to do 14%
Worried what coworkers would think 4%
Other 8%
LTM III: New Mothers Speak Out / 4. Employment, Maternity Leave, Child Care, and Health Insurance
“I was getting a lot of
pressure from my boss
to come back. I know 8
weeks is standard, but I
wasn’t mentally ready. ”
“Be relaxed and prepare
for the financial strains that
are to come soon. Try your
best to not go into debt.
Save your money while
you are on leave or try to
do something on the side
to make money. ”
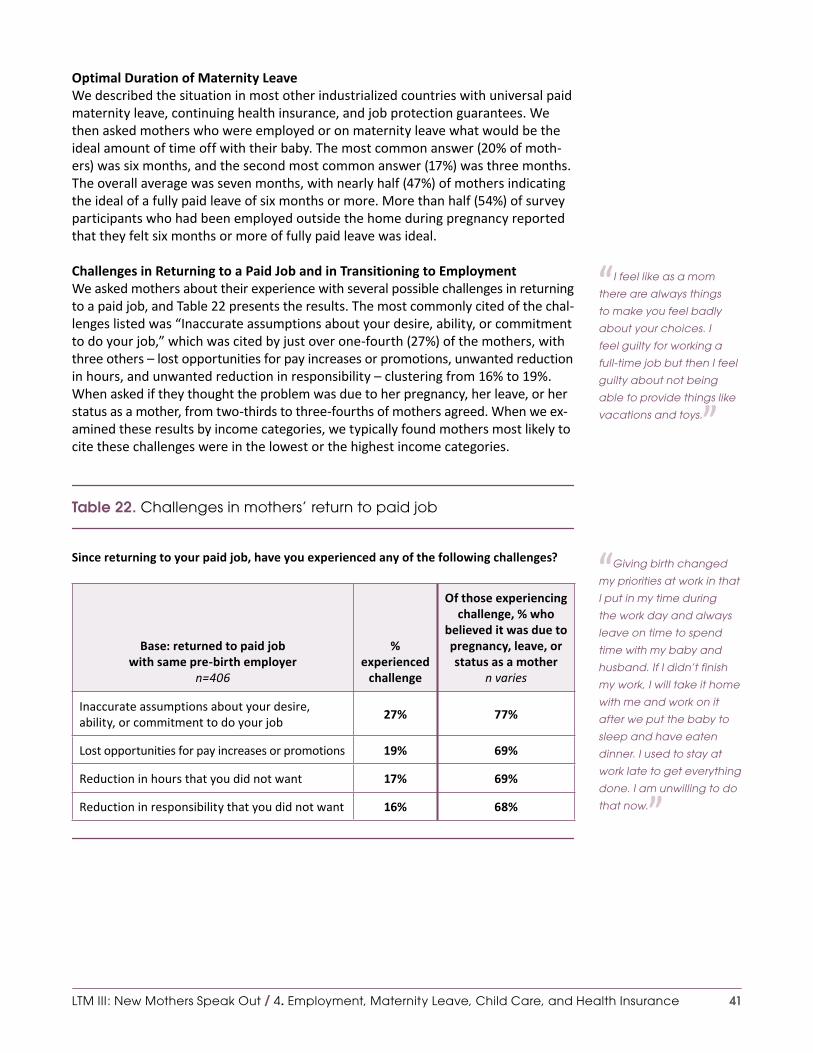
41
Optimal Duration of Maternity LeaveWe described the situation in most other industrialized countries with universal paid maternity leave, continuing health insurance, and job protection guarantees. We then asked mothers who were employed or on maternity leave what would be the ideal amount of time off with their baby. The most common answer (20% of moth-ers) was six months, and the second most common answer (17%) was three months. The overall average was seven months, with nearly half (47%) of mothers indicating the ideal of a fully paid leave of six months or more. More than half (54%) of survey participants who had been employed outside the home during pregnancy reported that they felt six months or more of fully paid leave was ideal.
Challenges in Returning to a Paid Job and in Transitioning to EmploymentWe asked mothers about their experience with several possible challenges in returning to a paid job, and Table 22 presents the results. The most commonly cited of the chal-lenges listed was “Inaccurate assumptions about your desire, ability, or commitment to do your job,” which was cited by just over one-fourth (27%) of the mothers, with three others – lost opportunities for pay increases or promotions, unwanted reduction in hours, and unwanted reduction in responsibility – clustering from 16% to 19%. When asked if they thought the problem was due to her pregnancy, her leave, or her status as a mother, from two-thirds to three-fourths of mothers agreed. When we ex-amined these results by income categories, we typically found mothers most likely to cite these challenges were in the lowest or the highest income categories.
Table 22. Challenges in mothers’ return to paid job
Since returning to your paid job, have you experienced any of the following challenges?
Base: returned to paid job with same pre-birth employer
n=406
% experienced
challenge
Of those experiencing challenge, % who
believed it was due to pregnancy, leave, or status as a mother
n varies
Inaccurate assumptions about your desire, ability, or commitment to do your job
27% 77%
Lost opportunities for pay increases or promotions 19% 69%
Reduction in hours that you did not want 17% 69%
Reduction in responsibility that you did not want 16% 68%
LTM III: New Mothers Speak Out / 4. Employment, Maternity Leave, Child Care, and Health Insurance
“I feel like as a mom
there are always things
to make you feel badly
about your choices. I
feel guilty for working a
full-time job but then I feel
guilty about not being
able to provide things like
vacations and toys. ”
“Giving birth changed
my priorities at work in that
I put in my time during
the work day and always
leave on time to spend
time with my baby and
husband. If I didn’t finish
my work, I will take it home
with me and work on it
after we put the baby to
sleep and have eaten
dinner. I used to stay at
work late to get everything
done. I am unwilling to do
that now. ”
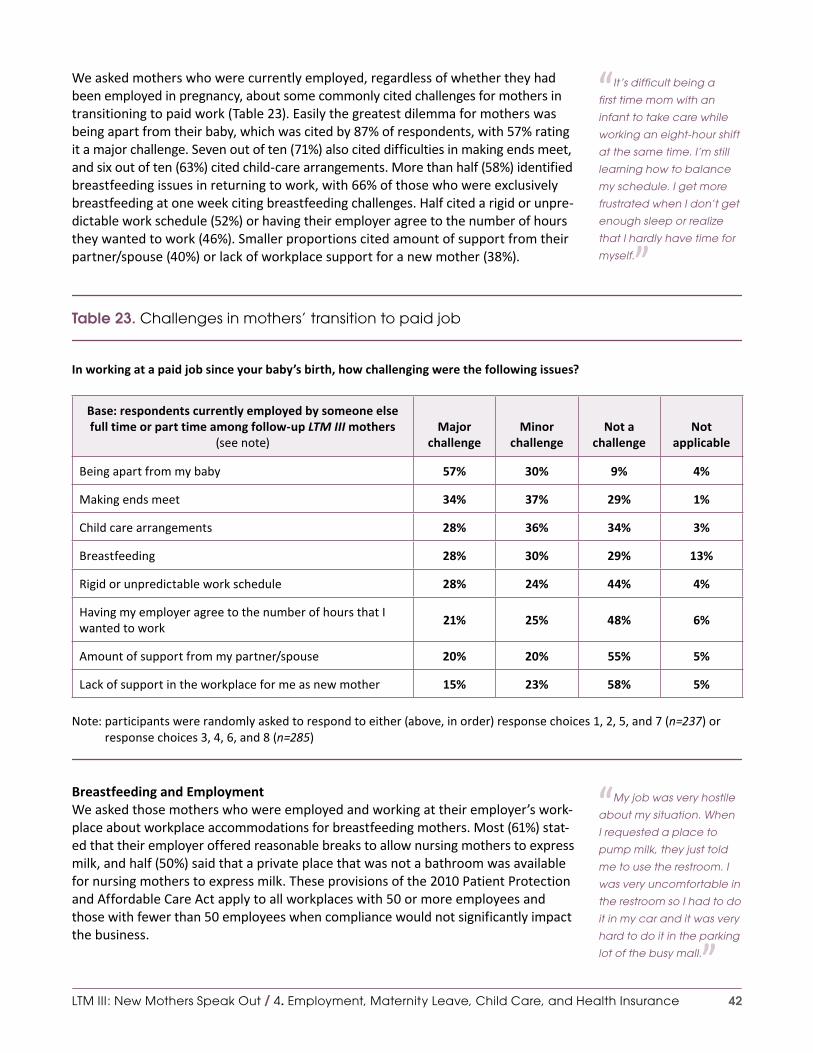
42
We asked mothers who were currently employed, regardless of whether they had been employed in pregnancy, about some commonly cited challenges for mothers in transitioning to paid work (Table 23). Easily the greatest dilemma for mothers was being apart from their baby, which was cited by 87% of respondents, with 57% rating it a major challenge. Seven out of ten (71%) also cited difficulties in making ends meet, and six out of ten (63%) cited child-care arrangements. More than half (58%) identified breastfeeding issues in returning to work, with 66% of those who were exclusively breastfeeding at one week citing breastfeeding challenges. Half cited a rigid or unpre-dictable work schedule (52%) or having their employer agree to the number of hours they wanted to work (46%). Smaller proportions cited amount of support from their partner/spouse (40%) or lack of workplace support for a new mother (38%).
Table 23. Challenges in mothers’ transition to paid job
In working at a paid job since your baby’s birth, how challenging were the following issues?
Base: respondents currently employed by someone else full time or part time among follow-up LTM III mothers
(see note)Major
challengeMinor
challengeNot a
challengeNot
applicable
Being apart from my baby 57% 30% 9% 4%
Making ends meet 34% 37% 29% 1%
Child care arrangements 28% 36% 34% 3%
Breastfeeding 28% 30% 29% 13%
Rigid or unpredictable work schedule 28% 24% 44% 4%
Having my employer agree to the number of hours that I wanted to work
21% 25% 48% 6%
Amount of support from my partner/spouse 20% 20% 55% 5%
Lack of support in the workplace for me as new mother 15% 23% 58% 5%
Note: participants were randomly asked to respond to either (above, in order) response choices 1, 2, 5, and 7 (n=237) or response choices 3, 4, 6, and 8 (n=285)
Breastfeeding and EmploymentWe asked those mothers who were employed and working at their employer’s work-place about workplace accommodations for breastfeeding mothers. Most (61%) stat-ed that their employer offered reasonable breaks to allow nursing mothers to express milk, and half (50%) said that a private place that was not a bathroom was available for nursing mothers to express milk. These provisions of the 2010 Patient Protection and Affordable Care Act apply to all workplaces with 50 or more employees and those with fewer than 50 employees when compliance would not significantly impact the business.
LTM III: New Mothers Speak Out / 4. Employment, Maternity Leave, Child Care, and Health Insurance
“It’s difficult being a
first time mom with an
infant to take care while
working an eight-hour shift
at the same time. I’m still
learning how to balance
my schedule. I get more
frustrated when I don’t get
enough sleep or realize
that I hardly have time for
myself. ”
“My job was very hostile
about my situation. When
I requested a place to
pump milk, they just told
me to use the restroom. I
was very uncomfortable in
the restroom so I had to do
it in my car and it was very
hard to do it in the parking
lot of the busy mall. ”

43
We asked women who were employed either full or part time when they completed the follow-up survey whether their plans for employment after giving birth affected the decisions they made about how to feed their baby – for example, whether or when to breastfeed, use formula, or pump. Just about half (49%) said that plans for employment had impacted their baby feeding decisions. We asked the mothers who responded affirmatively how their plans for infant feeding had been impacted. Most of their open-ended responses described ways that employment had impinged on breastfeeding, implying that the volume and/or duration of breastfeeding would otherwise have been greater.
Mothers Who Were Not Employed During Pregnancy
In all, 39% of mothers responding to the follow-up survey were not employed during their pregnancy. This was strongly related to whether they had given birth before, with those mothers for whom this was their first birth far less likely to not have been employed during pregnancy (31%) compared with mothers with two (42%) or three or more (56%) children at home (p < .01). The combination of age and women’s sta-tus as a new or experienced mother was very powerful: 86% of first-time mothers 30 or older were employed during their pregnancy.
We asked those mothers who had not been employed during pregnancy if they had been employed since giving birth, and 16% of mothers who had not been employed during pregnancy were now employed, either in a part-time (10%) or full-time (6%) capacity.
Students
About one in ten mothers identified themselves as either full- (7%) or part-time (12%) students. There was some minor overlap as a small portion (8%) of those mothers who listed themselves as full-time employees also listed themselves as being full-time stu-dents. Mothers who were full- or part-time students were more likely to be younger, non-Hispanic black, and unmarried with a partner than those who were not students.
LTM III: New Mothers Speak Out / 4. Employment, Maternity Leave, Child Care, and Health Insurance
“It is driving me crazy all
this ‘Breastfeeding Only,
Formula is Evil’ fervor. Not
that I disagree that breast-
feeding is better, but I had
to go to formula because
I have to WORK because
this country has no paid
maternity leave! If they
really want to get women
breastfeeding, address
this problem. ”
“When I was going to
school, I was proud that I
could handle taking care
of my baby and learning,
but I had to quit because
of a lack of child care. I
stopped feeling proud of
myself and I have yet to
feel accomplished. ”

44
Child-Care Arrangements
Use of Different Types of Child CareIn the follow-up survey, we asked mothers who were employed outside the home about child-care arrangements for their baby born in 2011-12, and they described a variety of arrangements (Table 24). We asked mothers to list all sources of child care. On average, mothers listed 1.4 sources of child care. One in eight mothers (13%) who worked full or part time stated they were responsible for child care while at work (16% among part-time, and 11% among full-time workers), with half of these mothers also noting at least one other source of care. Mothers who used either a child care center or family day care generally relied predominantly on that source; those using a spouse/partner, other family member, or friends relied on multiple sources.
Mothers who were employed full time relied heavily on family, either their spouse or partner (34%) or another family member (43%). Mothers also relied on family day care providers (18%) and child care centers (26%). Mothers who were employed part-time relied predominantly on family – either spouse or partners (51%) or others (44%). One-fifth (20%) reported that a family day care provider took care of their child.
Table 24. Child-care arrangements, by employment status
While you are working for pay, who watches the child who was born on [baby’s birth date]? (choose all that apply)
Base: currently employed full or part time among follow-up LTM III mothers
Part timen=239
Full timen=334
Alln=573
A family member (not spouse/partner) 44% 43% 44%
Spouse/partner* 51% 34% 41%
Staff at a child care center* 14% 26% 21%
A family day care provider working in her or his home 20% 18% 19%
Me 16% 11% 13%
Friend or neighbor 13% 10% 11%
Nanny 5% 7% 7%
*p < .01 for difference between full and part time
Time with Child-Care Providers Other Than Self or Spouse/PartnerAt the time of the follow-up survey, 47% of mothers reported being home with their children. We asked mothers who were in school or employed at that time to provide an average number of hours their child was with a child-care provider other than themselves or their spouse/partner (Table 25). More than one-quarter (26%) of these mothers reported their child was in day care at least 33 hours a week. For mothers working full time outside the home, that figure rises to 45%.
LTM III: New Mothers Speak Out / 4. Employment, Maternity Leave, Child Care, and Health Insurance
“I work at the day care
center my daughter
goes to. ”“He’s a very well round-
ed baby and loves day
care, which has made
him into a very social and
secure explorer. ”

45
Table 25. Hours per week baby in child care, by employment status
Base: has child-care provider other than self or spouse/partner among follow-up LTM III mothers
Employed outside home*Student full or part time
n=64Full time
n=241Part time
n=116
Fewer than 8 hours 15% 37% 69%
8 to up to 17 hours 20% 31% 22%
17 to up to 33 hours 20% 23% 3%
33 to up to 40 hours 23% 6% 6%
40 hours or more 22% 3% 0%
*p < .01 for differences by employment and student status
Sick Leave Availability for Child CareWe asked mothers who were employed at the time of the follow-up survey about the availability of paid sick days. Mothers who were employed full time outside the home reported having an average of eight paid sick days annually.
Among those mothers who had access to sick leave, four out of five (82%) reported they could use their paid sick leave to care for a sick child, and only 11% stated they could not (8% were unsure), figures that varied significantly by income. Eighty-nine percent of mothers with a pre-tax household income greater than $75,000 reported that they had access to paid sick leave to care for a sick child, compared to 61% of mothers with an income less than $37,000 (p < .01).
Health Insurance
The pattern of insurance coverage for mothers established during their pregnancy did not necessarily continue after they had their baby. More than one-fourth of mothers (28%) saw their insurance status change between the period of their maternity care and the time of our follow-up survey. Whereas 5% of mothers had reported that they were the primary payers for their maternity services, 18% reported not having health insurance at the time of the follow-up survey. The loss of insurance coverage after giving birth varied strongly by type of prior insurance and region. Among moth-ers who identified private insurance as the primary payer of their maternity services, 10% reported not having insurance at the time of the follow-up survey compared with 26% of mothers formerly covered by Medicaid and CHIP, the Child Health Insur-ance Program (p < .01). Regionally, we found 5% of mothers in the Northeast report-ing they didn’t currently have insurance compared with 16% in both the West and Midwest, and 25% in the South. A majority (54%) of mothers who had some type of insurance coverage during pregnancy but did not have it now were mothers formerly with Medicaid or CHIP coverage, with the highest rates among mothers living in the South and West.
LTM III: New Mothers Speak Out / 4. Employment, Maternity Leave, Child Care, and Health Insurance
“A major coding mix up
between the provider and
my insurance company
caused over 9 months of
insurance trouble and
work for myself as I pur-
chase my own insur-
ance. ”
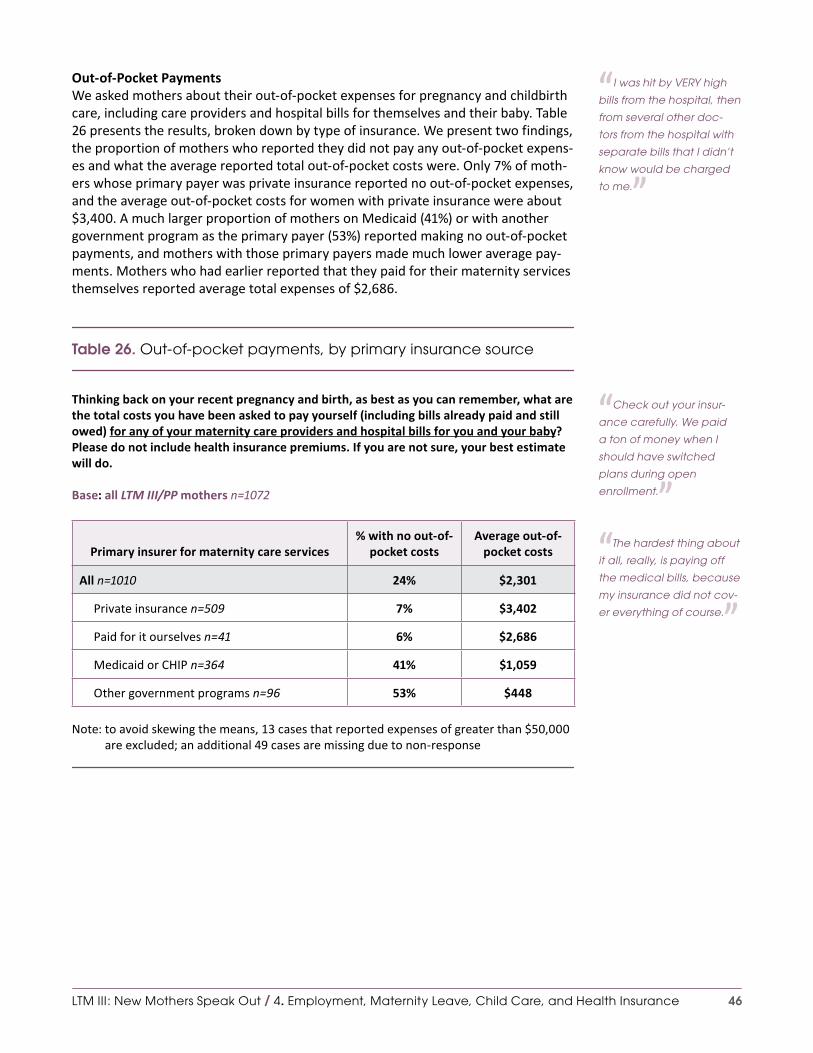
46
Out-of-Pocket PaymentsWe asked mothers about their out-of-pocket expenses for pregnancy and childbirth care, including care providers and hospital bills for themselves and their baby. Table 26 presents the results, broken down by type of insurance. We present two findings, the proportion of mothers who reported they did not pay any out-of-pocket expens-es and what the average reported total out-of-pocket costs were. Only 7% of moth-ers whose primary payer was private insurance reported no out-of-pocket expenses, and the average out-of-pocket costs for women with private insurance were about $3,400. A much larger proportion of mothers on Medicaid (41%) or with another government program as the primary payer (53%) reported making no out-of-pocket payments, and mothers with those primary payers made much lower average pay-ments. Mothers who had earlier reported that they paid for their maternity services themselves reported average total expenses of $2,686.
Table 26. Out-of-pocket payments, by primary insurance source
Thinking back on your recent pregnancy and birth, as best as you can remember, what are the total costs you have been asked to pay yourself (including bills already paid and still owed) for any of your maternity care providers and hospital bills for you and your baby? Please do not include health insurance premiums. If you are not sure, your best estimate will do.
Base: all LTM III/PP mothers n=1072
Primary insurer for maternity care services% with no out-of-
pocket costsAverage out-of-
pocket costs
All n=1010 24% $2,301
Private insurance n=509 7% $3,402
Paid for it ourselves n=41 6% $2,686
Medicaid or CHIP n=364 41% $1,059
Other government programs n=96 53% $448
Note: to avoid skewing the means, 13 cases that reported expenses of greater than $50,000 are excluded; an additional 49 cases are missing due to non-response
LTM III: New Mothers Speak Out / 4. Employment, Maternity Leave, Child Care, and Health Insurance
“I was hit by VERY high
bills from the hospital, then
from several other doc-
tors from the hospital with
separate bills that I didn’t
know would be charged
to me. ”
“Check out your insur-
ance carefully. We paid
a ton of money when I
should have switched
plans during open
enrollment. ”“The hardest thing about
it all, really, is paying off
the medical bills, because
my insurance did not cov-
er everything of course. ”

47
5. Views of Maternity Care Quality and Engaging in Maternity Care
As with the broader United States health care system, many initiatives are under way to improve the quality of maternity care and foster women’s engagement and active participation in their maternity care. In our follow-up survey, we gave prior-ity to better understanding respondents’ views about these matters, to be able to accelerate the pace of quality improvement and active engagement of childbearing women. This chapter covers an array of related issues: views about the proper use of maternity-related tests and treatments; general ratings of health care and mater-nity care quality and indications of maternity care quality; views about the quality of the maternity care that the women had themselves received; their interest in and views about the right to choose birth setting and mode of birth; and information, decision making, and activation. This chapter should be considered a companion to the chapter on “Choice, Control, Knowledge, and Decision Making” in our recent sur-vey report, Listening to MothersSM III: Pregnancy and Birth.
Opinions about Proper Use of Maternity Care Interventions
As presented in our recent report, 59% of mothers who completed the initial Listen-ing to MothersSM III survey agreed that “giving birth is a process that should not be interfered with unless medically necessary,” 16% disagreed, and 26% neither agreed nor disagreed.
The follow-up survey examined related topics. We asked mothers whether they agreed or disagreed with a series of statements concerning maternity care tests and their provider’s reliance on them, and Table 27 presents the results. Mothers expressed considerable confidence that newer tests marked an improvement in care (74% agree to 10% disagree) and that their provider’s recommendations reflect best current research (82% agree to 10% disagree). They agreed, though not as strongly, that more tests meant better quality care (63% agree to 22% disagree) and that more expensive tests were better (52% agree to 27% disagree). When asked if “Too many women do not get the maternity tests and treatments they need” about 3 times as many mothers agreed than disagreed (60% to 23%). Mothers were more evenly split over the issue of whether mothers get too many tests (43% agree to 40% disagree). There were some differences by age, with younger mothers more confi-dent in and supportive of testing than older mothers.
LTM III: New Mothers Speak Out / 5. Views of Maternity Care Quality and Engaging in Maternity Care
“Just relax and let nature
take its course. Women
have been having babies
since the beginning of
time and babies seem to
know what they’re doing
when it comes to be
being born. ”
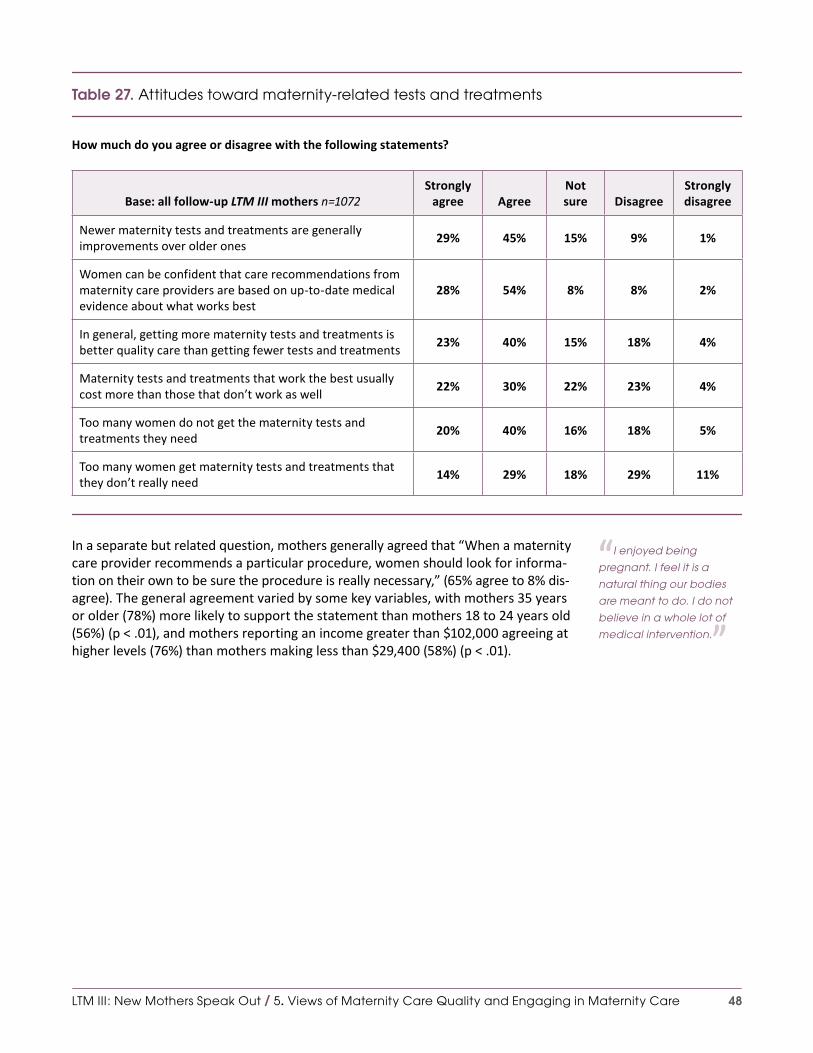
48
Table 27. Attitudes toward maternity-related tests and treatments
How much do you agree or disagree with the following statements?
Base: all follow-up LTM III mothers n=1072Strongly
agree AgreeNot sure Disagree
Strongly disagree
Newer maternity tests and treatments are generally improvements over older ones
29% 45% 15% 9% 1%
Women can be confident that care recommendations from maternity care providers are based on up-to-date medical evidence about what works best
28% 54% 8% 8% 2%
In general, getting more maternity tests and treatments is better quality care than getting fewer tests and treatments
23% 40% 15% 18% 4%
Maternity tests and treatments that work the best usually cost more than those that don’t work as well
22% 30% 22% 23% 4%
Too many women do not get the maternity tests and treatments they need
20% 40% 16% 18% 5%
Too many women get maternity tests and treatments that they don’t really need
14% 29% 18% 29% 11%
In a separate but related question, mothers generally agreed that “When a maternity care provider recommends a particular procedure, women should look for informa-tion on their own to be sure the procedure is really necessary,” (65% agree to 8% dis-agree). The general agreement varied by some key variables, with mothers 35 years or older (78%) more likely to support the statement than mothers 18 to 24 years old (56%) (p < .01), and mothers reporting an income greater than $102,000 agreeing at higher levels (76%) than mothers making less than $29,400 (58%) (p < .01).
LTM III: New Mothers Speak Out / 5. Views of Maternity Care Quality and Engaging in Maternity Care
“I enjoyed being
pregnant. I feel it is a
natural thing our bodies
are meant to do. I do not
believe in a whole lot of
medical intervention. ”

49
General Perspectives on Maternity and Health Care Quality
Rating the Quality of the U.S. Maternity and Health Care SystemsAs we reported in our initial report, over one-third (36%) of mothers who completed the Listening to MothersSM III survey rated the U.S. maternity care system as “excellent,” and nearly half rated it as “good.”
In the follow-up survey, we asked mothers to rate the quality of health care in the United States. A total of 19% of the mothers rated the U.S. health care system as “ex-cellent,” 43% rated it as “good,” and 38% rated the overall system as “fair” or “poor”. The ratings varied widely by race/ethnicity with non-Hispanic white mothers (13% ex-cellent) less positive than Hispanic or non-Hispanic black (24% and 26% excellent re-spectively) mothers. Interestingly, mothers who reported they currently did not have insurance did not rate the system more poorly than those who did, nor did mothers responses vary by type of insurance they currently had. These ratings are also no-ticeably lower than mothers’ ratings of maternity care in the United States, though the two ratings were strongly related, with mothers who rated the maternity care system fair or poor twice as likely to rate the system as a whole as poor (Table 28).
Table 28. Mothers’ ratings of the quality of maternity care and health care in the United States
Maternity care in the United StatesBase: all initial LTM III mothers n=2400
Health care in the United StatesBase: all follow-up LTM III mothers n=1072
Excellent 36% 19%
Good 49% 43%
Fair 14% 33%
Poor 2% 5%
p < .01 for differences between maternity care and health care generally
Identifying Factors that Determine Maternity Care QualityTable 29 summarizes mothers’ ratings of eight factors that contribute to assessments of quality of care. At least half the mothers rated six of the eight items as very im-portant. The highest rated factor was “protects mothers and newborns from getting infections in the hospital,” with 80% of mothers rating it as very important, followed by “has attentive, caring maternity nurses,” (77%) and “has a low rate of medical mis-takes” (76%). The two criteria that did not garner as much support in determining a mother’s assessment of quality of care (though a majority in each case rated the item as at least “fairly important,”) were being a teaching hospital (33% rated very impor-tant) and being highly rated by a rating website or magazine (28% very important).
LTM III: New Mothers Speak Out / 5. Views of Maternity Care Quality and Engaging in Maternity Care
“I think we should have
less medical intervention
unless medically necessary.
My body did everything
that it was supposed to
do but it was not allowed
to complete the process
because of hospital rules
and fear of lawsuits. ”
“My maternity experi-
ence, even though
unplanned, was a good
experience. Most of the
people involved were
knowledgable and
helpful. ”

50
Table 29. Rating factors that determine the quality of hospital maternity care
How important are each of the following factors in determining the quality of maternity care at a particular hospital?
Base: follow-up LTM III mothers (see note)
Very important
Fairly important
Not important at all or not too
important Not sure
Protects mothers and newborns from getting infections in the hospital
80% 11% 7% 3%
Has attentive, caring maternity nurses 77% 14% 7% 2%
Has a low rate of medical mistakes in the care of mothers and babies
76% 13% 9% 2%
Offers the latest maternity care technology and equipment
58% 25% 12% 4%
Is highly rated on quality by women who have given birth there
58% 23% 14% 5%
Its maternity services are reasonably priced 50% 27% 20% 5%
Is a teaching hospital and trains doctors, nurses and other health professionals
33% 25% 34% 9%
Has been highly rated by a rating website or magazine
28% 33% 30% 7%
Note: participants were randomly asked to respond to either (above, in order) response choices 1, 2, 3, and 6 (n=522) or response choices 4, 5, 7, and 8 (n=550)
Quality Differences Among Local Maternity Care Providers Mothers were asked to put the following question in the context of obstetricians, family doctors and midwives, respectively: “Based on what you’ve heard, read, or experienced yourself, do you think there are big, small, or no differences in the qual-ity of maternity care provided by … in your area?” Overall, mothers felt there were bigger differences in the quality of maternity care among local obstetricians (33% saying there was a big difference) than among family doctors (26%) or midwives (20%). In the case of midwives, 38% of the mothers could not rate the differences, twice as many mothers as were unsure about rating obstetricians or family doctors (19% not sure in each case). Experienced mothers were no more likely to be able to rate any of these providers than first-time mothers.
Quality Differences of Maternity Care Among Local HospitalsWe also asked mothers if they thought there were big differences in the quality of maternity care at local hospitals, and one-third (35%) thought there were big differ-ences, slightly more (37%) thought there were small differences, 15% felt there was no difference, and 13% were not sure. These findings did not vary by maternal age, or whether or not this was a first birth, but did vary slightly by race/ethnicity, with non-Hispanic white mothers less likely to be “not sure,” (10%) than Hispanic (18%) or non-Hispanic black (19%) mothers.
LTM III: New Mothers Speak Out / 5. Views of Maternity Care Quality and Engaging in Maternity Care
“Gather more info on
your doctor. If you are
uncomfortable knowing
they might not deliver your
child, choose another
one. ”
“I was very comfortable
and confident about the
care I would receive the
day of delivery. The hospi-
tal was my top choice and
my doctor’s group was the
best in the region. ”

51
Perspectives on the Quality of Maternity Care that Mothers Had Recently Received
Rating the Quality of Different Phases of Maternal and Newborn CareMothers rated the quality of their care at several key stages of the maternity and in-fant care process, and some results are summarized and broken down by providers in Table 30. Overall, the ratings were very positive with none of the stages of care being rated as poor by more than 3% of the mothers. At least 54% of mothers rated care at each stage as “very good” (the highest rating), with the minor exception of those mothers who had a home visit, 46% of whom rated care as very good. We did discover some differences when we broke down the results by the likely provider at that stage (Table 30). For example, in terms of prenatal care, mothers rated it highly overall (32% good; 57% very good), though those with family doctors were more likely to rate it poorly than those with midwives or obstetricians. Likewise, while maternity care in the hospital up through birth received high marks, those with fam-ily doctors or midwives gave more negative ratings than those with obstetricians. Those with pediatricians were about half as likely to give baby care visits negative ratings as those with family doctors.
Table 30. Rating the quality of phases of care
Base: all follow-up LTM III mothers n=1072
Prenatal provider*
Prenatal visits n=1072 Obstetrician Family doctor Midwife
Rated quality of prenatal visits as “Fair” or “Poor” 9% 29% 13%
Birth attendant*
Care in hospital n=1072 Obstetrician Family doctor Midwife
Rated quality of care in hospital from admission through giving birth as “Fair” or “Poor”
9% 20% 19%
Child’s health care provider*
Child’s office visits n=1044 Pediatric provider Family doctor
Rated quality of office visits with baby’s care provider(s) in the first two months after birth as “Fair” or “Poor”
9% 21% –
*p < .01 for differences by providerNote: few respondents had family doctor and midwife birth attendants
LTM III: New Mothers Speak Out / 5. Views of Maternity Care Quality and Engaging in Maternity Care
“Knowing that my baby’s
pediatrician was highly
rated, meaning that he
was getting the quality
care he needed, made
me feel safe. ”

52
Concern About Errors in the Course of Maternity and Pediatric CareMothers were asked about their levels of concern with serious medical errors in dif-ferent settings, and their responses are presented in Table 31. While they expressed general confidence in the system, there were variations in their responses. Moth-ers were most likely to identify concern about a serious error or mistake leading to injury or harm happening in the hospital during the birth or in the immediate post-partum period (43% at least somewhat concerned). They were less likely to be con-cerned about a baby care visit (35% at least somewhat concerned), a prenatal visit (30%), or a postpartum visit for their own care (30%). These opinions did vary by de-mographic characteristics, with non-Hispanic black and Hispanic mothers generally expressing more concern than non-Hispanic white mothers. For example, in terms of a baby care visit, 52% of Hispanic mothers were at least somewhat concerned about the possibility of a medical error compared with 33% of non-Hispanic black mothers and 28% of non-Hispanic white mothers (p < .01).
Table 31. Concern about errors in the course of maternity and pediatric care
How concerned are you, if at all, about a serious error or mistake leading to injury or harm happening when...?
Base: all follow-up LTM III mothers n=1072Very
concernedSomewhat concerned
Not at all concerned or not
too concerned Not sure
You go to a maternity care provider’s office or clinic for prenatal care
16% 14% 65% 5%
You are in a hospital for giving birth and the early period after birth
19% 24% 52% 6%
You go to a maternity care provider’s office or clinic for postpartum care
14% 16% 64% 6%
Your baby goes to his/her care provider’s office or clinic for care
19% 16% 59% 6%
Interest In and Views About the Right to Make Birth Choices
A growing interest in out-of-hospital births led us to ask mothers their opinions about some birth setting options, and Table 32 presents the results. We asked mothers who intended to have more children whether they would consider birth center or home birth settings for a future birth. Among mothers planning a future pregnancy, two-thirds would consider a birthing center and a little more than one-fourth would con-sider a home birth. One-fourth of mothers indicated they would “definitely” want the birth center option. It is important to note that births at home and at birth centers
LTM III: New Mothers Speak Out / 5. Views of Maternity Care Quality and Engaging in Maternity Care
“I was released without
a script for blood pres-
sure medicine which I
had been on for my entire
week and a half in the
hospital (pre-eclamptic).
This caused my vision to be
impaired and was a scare
since I shouldn’t have
gone off those meds at
all much less all at once.
Doctor said it was an over-
sight that I didn’t get the
right prescription. ”
“I would consider a
freestanding birth center
with more support/a
different approach to
breastfeeding and with-
out the epidural option
available. I didn’t like
getting interrupted for
constant monitoring
during the night at the
hospital after I had
given birth. ”

53
are more popular with experienced mothers. We also asked mothers about a wom-an’s right to give birth at home, and they strongly affirmed that right, with 66% think-ing mothers should be able to choose a home birth and 11% disagreeing (Table 33).
Table 32. Mothers’ openness to birth center and home births for any future pregnancies
For any future births, how open would you be to giving birth...?
Base: would like more children among follow-up LTM III mothers n=744
In a birth center that is separate from a hospital At home
Definitely would want this 25% 11%
Would consider this 39% 18%
Definitely would not want this 27% 64%
Not sure 5% 5%
I don’t want to have any more biological children 4% 3%
Table 33. Mothers’ views about women’s right to choose a home birth
How much do you agree or disagree with the following statement?
Base: all follow-up LTM III mothers n=1072
Agreestrongly
Agreesomewhat
Neither agree or disagree
Disagreesomewhat
Disagree strongly
If a woman wants to have her baby at home, she should be able to do so
34% 32% 23% 5% 6%
We gave mothers a series of three statements concerning choice in mode of birth and asked if they agreed or disagreed with them (Table 34). We asked if mothers should have the right to choose a cesarean birth, a vaginal birth, and a vaginal birth after cesarean (VBAC) if they wished, and there was generally strong support for mothers having control, most notably in the case of vaginal birth (76% agreed; 9% disagreed) and VBAC (69% agreed; 7% disagreed). In the case of a cesarean, the findings were more mixed, with 40% stating a mother should have a choice, 38% disagreeing, and 22% in the middle (see Table 34).
LTM III: New Mothers Speak Out / 5. Views of Maternity Care Quality and Engaging in Maternity Care
“There has been a lot
of talk about c-sections
being wrong, but I highly
disagree with that. Even
though I had a vaginal
birth, every mother is en-
titled to have her baby the
way she wants to, as long
as her medical profession-
als agree. ”
“I would definitely want
to give birth with the same
midwifery group.... They
are trying to open the first
official birth center in our
area and I would ... prefer
to deliver in a place like
that instead. ”“I would prefer a birthing
center but there aren’t any
in my state so I’m using the
same hospital. ”“I am pregnant again! I
didn’t like being strapped
down, forbidden to move
around, and not given any
food.... I decided ... that
the next time ... I wanted
to do it in the comfort of
my own home with a mid-
wife. I’ve already chosen
one and couldn’t be more
excited about it! ”

54
Table 34. Mothers’ views about women’s right to choose a mode of birth
How much do you agree or disagree with the following statements? If a woman who...?
Base: all follow-up LTM III mothers n=1072
Agreestrongly
Agreesomewhat
Neither agree or disagree
Disagreesomewhat
Disagree strongly
Has never had a cesarean wants to have a vaginal birth, she should have the opportunity to do so
49% 27% 15% 5% 4%
Had a previous cesarean wants to have a vaginal birth, she should have the opportunity to do so
34% 35% 24% 3% 4%
Has never had a cesarean wants to have a cesarean, she should be able to do so
16% 24% 22% 14% 24%
We asked mothers if in the future they were pregnant, had no medical reason for a cesarean, and could decide for themselves, how likely they would be to choose a cesarean (Table 35). One in six (15%) women said they would be very likely to choose elective cesarean birth if given the choice in the future, though, as might be expected, these figures are strongly related to recent birth experience. Fewer than one in twelve (8%) mothers who had not had a prior cesarean and recently experienced a vaginal birth responded that she might very likely choose what would be an elective primary cesarean in the future, while women who had experienced either a primary or re-peat cesarean in their last birth were more evenly split (55% unlikely; 45% likely) in their preference for a repeat cesarean.
Table 35. Attitudes toward future cesareans
There has been some publicity lately about women having the right to choose a cesarean even if there is no medical reason for it. If you were pregnant in the future, had no medical reasons for a cesarean, and could decide for yourself, how likely would you be to want to have your next baby by cesarean section?
Base: all follow-up LTM III mothers n=1072 Not likely at all Not very likely Somewhat likely Very likely
All mothers 53% 18% 14% 15%
Most recent mode of birth
Vaginal (not VBAC) 61% 19% 12% 8%
Repeat cesarean 42% 12% 15% 31%
Primary cesarean 37% 19% 24% 21%
Vaginal birth after cesarean (VBAC) 33% 36% 9% 21%
Note: few respondents had vaginal birth after cesarean (VBAC)
LTM III: New Mothers Speak Out / 5. Views of Maternity Care Quality and Engaging in Maternity Care
“The hospital I went to
is not known for its great
VBAC success rate. I am
afraid I would end up
with another c-section if
I went back to that same
hospital. ”

55
Engagement, Information, and Decision Making in Maternity Care
Information and Maternity Care Decision MakingMothers were given four statements about information they would like to see pro-vided and their role in making decisions concerning maternity care (Table 36). On the whole, they would like to receive as much information as possible concerning risks associated with each birth option (91%) and would prefer their provider to dis-cuss the option of not receiving a given test or treatment (88%). They also expressed interest in learning about the cost to themselves of each option (86%). About two-thirds, however, also said they preferred “… to rely on my maternity care provider to make the best decisions for me” (65%).
Table 36. Maternity care practices: information and choice
How much do you agree or disagree with each of the following statements about your options for maternity care tests treatments, or procedures?
Base: all follow-up LTM III mothers n=1072Strongly
agree Agree DisagreeStrongly disagree
I would like my maternity care provider to tell me about the risks associated with each option so I know how each could affect me
36% 55% 7% 2%
In deciding about care, I would like my maternity care provider to always discuss the option of choosing no test or treatment
26% 62% 9% 2%
I would like my maternity care provider to help me understand how much each option will cost me and my family
25% 61% 9% 6%
I prefer to rely on my maternity care provider to make the best decisions for me
14% 51% 28% 7%
LTM III: New Mothers Speak Out / 5. Views of Maternity Care Quality and Engaging in Maternity Care
“My caregiver ultimately
let me make all the deci-
sions about my pregnancy
care after explaining all of
the choices in great detail.
I was very pleased with
my caregiver choice, and
that is why I used her for all
three pregnancies. ”
“I think it is important to
empower women by tell-
ing them everything and
anything they may experi-
ence before, during, and
after giving birth. I felt like
a lot of what I was going
through was never talked
about. ”

56
Attitudes Suggestive of Activation Relative to Maternity CareWe adapted to maternity care relevant items from the Patient Activation Measure. Mothers expressed confidence in their ability to maintain control over their involve-ment with maternity care, with 89% agreeing with the statement, “I was confident I could tell my maternity care provider concerns I had even when he or she did not ask.” As is clear in Table 37, large majorities also agreed with other statements con-cerning their involvement, including 89% agreeing that, “When all is said and done, I am the person who is in charge of my pregnancy,” and 86% expressing confidence they could take an active role in their maternity care. These findings were consistent across various demographic groups, but did vary between first-time and experienced mothers, with the latter more confident in their ability to be involved in the process.
Table 37. Attitudes indicating activation relative to maternity care
How much do you agree or disagree with each statement as it applies to you personally?
Base: all follow-up LTM III mothers n=1072Strongly
agree Agree DisagreeStrongly disagree
Not applicable
I was confident I could tell my maternity care provider concerns I had even when he or she did not ask
52% 37% 5% 3% 4%
When all is said and done, I am the person who is in charge of my pregnancy
49% 40% 5% 2% 4%
I was confident that I could take an active role in my own maternity care
44% 42% 5% 3% 7%
I was confident that I would know when I needed to check with my maternity care provider and when I could handle things myself
41% 46% 7% 2% 5%
I was able to stay with healthy lifestyle behaviors throughout pregnancy
38% 48% 8% 2% 4%
Importance of Having Access to Electronic Health RecordsMothers expressed considerable interest in having access to maternity and health records online, with 41% rating such access as very important and an additional 37% as somewhat important, while only 15% considered it not important.
LTM III: New Mothers Speak Out / 5. Views of Maternity Care Quality and Engaging in Maternity Care
“Be more adamant
about what you want....
You can tell the doctors
‘no’. ”“This was my first preg-
nancy and I was very
uninformed about every-
thing…. I wish I would
have stayed healthier in
my eating and exercising
while pregnant. ”

57
6. Looking at Some Important Variations in Experience
Many of our overall results reveal important patterns when examined by key sub-groups. In some cases, we made reference to such breakdowns in our earlier discus-sion of findings. We summarize in this section findings by two critical comparisons – differences, and similarities, by race/ethnicity and by primary source of payment for maternity care services. In examining the tables, readers should be aware that in some cases and as noted the analysis is of a subgroup of mothers (e.g., those with diabetes) resulting in smaller sample sizes and accounting for what seems like an un-usual finding where an apparently large difference is not statistically significant.
LTM III: New Mothers Speak Out / 6. Looking at Some Important Variations in Experience
“I think educating and
empowering women is es-
pecially important. If it had
not been for my relative
privilege, my pregnancy
and birth would have
been totally different, and
I think it is very sad and
telling about our society
that that is true. ”
58
Comparing Childbearing Experiences by Race and Ethnicity
Table 38 compares mothers’ experiences and attitudes by the largest race/ethnic-ity groupings, which have sufficient data for comparisons, that is, data from non-Hispanic white (“white,” below), non-Hispanic black (“black”), and Hispanic women. While some items are noteworthy for the lack of differences across the groups, we focus primarily here on items for which there are differences that have not been discussed earlier in the report. The comparisons include some pregnancy and birth topics, newly reported in Appendix D.
Black mothers were most likely among the three groups to regularly watch TV shows on pregnancy and childbirth; state that they had definitely received enough information on healthy eating, birth control, and postpartum depression from their postpartum provider; have babies who were rehospitalized since birth; have had no well-child visits for their baby; report co-sleeping with the baby; report they were doing extremely well getting enough sleep and managing stress and getting support from a spouse or partner; report being interested in a home birth in the future; feel that more maternity tests are better than fewer ones; and consider access to online records important. Black mothers were least likely to learn they were pregnant from a home pregnancy test and report they were still home with the baby by choice.
Hispanic mothers were most likely to lack health insurance or be on Medicaid at the time of the follow-up survey, report being worried about the baby when not with him/her, and report that pain interfered with routine activities postpartum. Hispanic mothers were least likely to have their baby son circumcised, have a Body Mass Index in the normal range postpartum, say they were doing extremely well getting exercise postpartum, be employed full time during pregnancy, rate prenatal visits and baby care visits as “very good,” and report feeling confident they could tell their maternity care provider about concerns.
White mothers were most likely to have used a home pregnancy test, have had pri-vate insurance at the time of the follow-up survey, report a lack of sexual desire as a new problem after birth, report postpartum pain did not interfere with their routine activities, have taken their baby for a well-child visit and not be employed postpar-tum so she could stay home with the baby. White mothers were least likely to use WIC services or rely on Medicaid for insurance at the time of the follow-up survey, have regularly watched TV shows about pregnancy and childbirth, consider online access to health records as “very important,” have felt she got enough information on healthy eating or postpartum depression during postpartum office visits, say that taking care of their baby is “always fun,” report daily care for the baby was equally divided with their spouse/partner, be concerned about a serious medical error in a hospital, or rate the U.S. health care system as “excellent” or “good.”
LTM III: New Mothers Speak Out / 6. Looking at Some Important Variations in Experience

59
Table 38. Variation in mothers’ experiences, by race/ethnicity
Base: all follow-up LTM III mothers selecting the respective identities(unless otherwise specified)
White non-Hispanic
n=593
Black non-Hispanic
n=159Hispanic
n=245
Pregnancy and birth**
Confirmed pregnancy with home pregnancy test* 84% 64% 69%
Changed maternity care provider 17% 31% 23%
Changed provider to increase chance of getting desired care and choices (among those who changed maternity care provider)
29% 63% 35%
Baby was circumcised (among those who had a boy)* 89% 88% 48%
Watched TV shows about pregnancy and childbirth regularly* 26% 44% 32%
Postpartum care
Definitely got enough information about healthy eating (among those with one or more postpartum office visits)*
30% 56% 49%
Definitely got enough information about postpartum depression (among those with one or more postpartum office visits)*
39% 63% 42%
Definitely got enough information about birth control methods (among those with one or more postpartum office visits)*
54% 78% 53%
Tested for diabetes or high blood sugar since giving birth (among those with chronic or gestational diabetes)
65% 62% 34%
Consulted professional with concerns about emotional or mental well-being since giving birth
17% 20% 18%
Caring for new baby
Baby rehospitalized since birth* (among those born nine or more months earlier)
7% 17% 8%
Baby had had no well child visits when completed follow-up survey* 1% 9% 4%
In first six months, baby never or rarely slept in same bed with mother or anyone else*
64% 43% 60%
Always worries about child when separated* 32% 40% 56%
Taking care of baby is always fun* 49% 70% 74%
Maternal well-being
Lack of sexual desire a major or minor new problem in first two months after birth*
46% 27% 39%
In first two months after giving birth, emotional well-being interfered with ability to care for baby a great deal/quite a bit*
4% 13% 10%
Pain did not interfere at all with routine activities in two weeks before completing follow-up survey*
50% 40% 35%
Mother rehospitalized since giving birth* (among those who gave birth nine or more months earlier)
11% 21% 12%
→
LTM III: New Mothers Speak Out / 6. Looking at Some Important Variations in Experience

60
Base: all follow-up LTM III mothers selecting the respective identities(unless otherwise specified)
White non-Hispanic
n=593
Black non-Hispanic
n=159Hispanic
n=245
Maternal well-being cont’d
Body Mass Index in normal range when completed follow-up survey 45% 44% 31%
Doing extremely well getting enough exercise in two weeks before completing follow-up survey*
12% 26% 5%
Doing extremely well eating a healthy diet in two weeks before completing follow-up survey*
11% 31% 9%
Doing extremely well managing stress in two weeks before completing follow-up survey*
10% 27% 13%
Doing extremely well getting enough sleep in two weeks before completing follow-up survey*
8% 22% 9%
Relationships and sources of support
Daily care for baby shared equally (among those with spouse or partner)* 29% 46% 47%
Practical support available from spouse/partner all the time (among those with spouse or partner)*
36% 62% 35%
Enjoyment available from spouse/partner all the time (among those with spouse or partner)*
34% 61% 41%
Emotional support available from someone who is not a spouse or partner a little or none of the time*
19% 14% 34%
Practical support available from someone who is not a spouse or partner a little or none of the time*
29% 15% 38%
Affection available from someone who is not a spouse or partner all or most of the time*
43% 66% 44%
Enjoyment available from someone who is not a spouse or partner all or most of the time
40% 61% 43%
Since birth of baby, both mother and baby used WIC services* 19% 52% 45%
Employment and education
Employed full time during pregnancy* 39% 37% 28%
Employer offered paid maternity leave (among those who were employed by someone else during pregnancy)*
59% 70% 64%
Not employed when completed follow-up survey, as wanted to be home full time with baby (among those not employed)*
74% 47% 65%
Health insurance
Lacked health insurance when completed follow-up survey* 14% 16% 32%
Had private health insurance when completed follow-up survey (among those who had insurance)*
76% 69% 50%
Had Medicaid or CHIP health insurance when completed follow-up survey (among those who had insurance)*
14% 21% 36%
→
Table 38 cont’d. Variation in mothers’ experiences, by race/ethnicity
LTM III: New Mothers Speak Out / 6. Looking at Some Important Variations in Experience

61
Base: all follow-up LTM III mothers selecting the respective identities(unless otherwise specified)
White non-Hispanic
n=593
Black non-Hispanic
n=159Hispanic
n=245
Attitudes
Rated prenatal visits as “very good”* 64% 60% 42%
Rated office visits with baby’s pediatric provider as “very good” (among those who had at least one pediatric visit)*
60% 54% 43%
Definitely would want to give birth at home in the future (among those who would like to have more children)*
10% 26% 4%
Definitely would not want to give birth at home in the future (among those who would like to have more children)*
29% 27% 74%
Is very concerned about a serious error or mistake happening in a hospital for giving birth or the early period after birth*
13% 21% 28%
Feels there are no differences in the quality of care among obstetricians in the area*
23% 20% 10%
Rates the overall quality of health care in the United States as “excellent” or “good”*
53% 72% 72%
Agrees strongly that getting more maternity tests and treatments is better quality care than getting fewer tests and treatments*
18% 37% 22%
Agrees strongly that was able to maintain healthy lifestyle behaviors throughout pregnancy*
39% 54% 29%
Agrees strongly that was confident she could tell maternity care provider about concerns when provider did not ask*
56% 62% 36%
Considers online access to health records to be “very important”* 29% 59% 50%
*p < .01 for differences among race/ethnicity groupings** Most prenatal and labor and birth results were reported in Listening to MothersSM III: Pregnancy and Birth. See Appendix
D for additional items about those care phases collected in follow-up survey.Bases differ from those provided when item is “(among [a named group])”.
Table 38 cont’d. Variation in mothers’ experiences, by race/ethnicity
LTM III: New Mothers Speak Out / 6. Looking at Some Important Variations in Experience

62
Comparing Childbearing Experiences by Primary Payer of Maternity Care
Table 39 compares experiences of beneficiaries of the two largest maternity care payer groups: private insurance and Medicaid or CHIP, the Child Health Insurance Program. As in the case of race/ethnicity, we highlight differences while understand-ing there are a number of notable areas where there are no differences between these two groups of beneficiaries, such as baby’s type of provider and likelihood of baby’s or mother’s rehospitalization after birth. Not included in this table are moth-ers who reported that their primary source of payment for maternity services had been another government program (such as the Federal Employee Health Benefits Program or Veterans Health Administration, 9% of follow-up survey participants) or themselves (4% of follow-up survey participants). As discussed in Chapter 4, there were some shifts in insurance status between coverage of maternity services and insurance coverage at the time of the follow-up survey. Most notably, a considerable proportion of women who had been covered by Medicaid or CHIP was no longer eli-gible for that coverage and became uninsured. The comparisons include some preg-nancy and birth topics, newly reported in Appendix D.
In addition to likelihood of being uninsured at the time of the follow-up survey, mothers who had had Medicaid coverage for maternity services were more likely to use WIC services, be a student, report they definitely got enough information on key topics during postpartum visits, report a problem with frequent headaches postpar-tum, report they were not doing well with eating a healthy diet postpartum, report that they had had an unwanted reduction in paid work hours postpartum, be very concerned about serious errors occurring at four stages of care, and consider a high rating by a web page or magazine an important measure of hospital quality. Mothers with private insurance for their pregnancy and their baby’s birth were more likely to be married, correctly identify American Academy of Pediatrics recommendations on breastfeeding, say pain had not interfered with routine activities in the two weeks prior to the survey, have a Body Mass Index in the normal range, report feeling sup-ported in the months after birth, report that their baby had had no sick-child visits, and be employed full time during pregnancy.
LTM III: New Mothers Speak Out / 6. Looking at Some Important Variations in Experience

63
Table 39. Variation in mothers’ experiences, by primary payer of maternity care
Base: all follow-up LTM III mothers with the respective primary insurance source (unless otherwise specified)
Medicaid or CHIPn=370
Private insurancen=513
Pregnancy and birth**
Confirmed pregnancy with home pregnancy test* 69% 83%
Maternity care provider recommended certain amount of weight gain* 49% 62%
Watched TV shows about pregnancy and childbirth* 72% 57%
Induced own labor (among those who tried to self-induce)*** 65% 30%
Baby was circumcised (among those who had a boy)* 68% 85%
Postpartum care
Had no postpartum visits because “felt fine and didn’t need to go” (among those with no postpartum visits)
53% 25%
Definitely got enough information about healthy eating (among those with one or more postpartum office visits)*
50% 29%
Definitely got enough information about importance of exercise (among those with one or more postpartum visits)*
45% 28%
Definitely got enough information about changes in sexual response/feelings (among those with one or more postpartum visits)*
41% 22%
Told by maternity care provider to limit total lifetime number of cesar-eans (among those who had had one or more cesareans)
31% 28%
Total lifetime maximum number of cesareans recommended by provider (among those with cesareans who received recommendation)
3.0 3.4
Had telephone number of a care provider to contact about concerns in the first two months after birth
77% 80%
Health professional made a home visit in the first two months after birth 28% 34%
Consulted professional with concerns about emotional or mental well-being since giving birth
20% 16%
Tested for diabetes or high blood sugar since giving birth (among those with chronic or gestational diabetes)
47% 57%
Caring for new baby
Baby rehospitalized since birth (among those born nine or more months earlier)
9% 8%
Baby had had no sick-child visits when completed follow-up survey* 35% 22%
Feeding child any breast milk at time of follow-up survey 32% 33%
Feeding child any formula at time of follow-up survey* 55% 34%
Breastfed as long as wanted to (among those breastfeeding at one week and not currently breastfeeding)
50% 52%
Correctly identified American Academy of Pediatrics breastfeeding duration recommendation as 12 months or more*
33% 47%
→
LTM III: New Mothers Speak Out / 6. Looking at Some Important Variations in Experience

64
Base: all follow-up LTM III mothers with the respective primary insurance source (unless otherwise specified)
Medicaid or CHIPn=370
Private insurancen=513
Caring for new baby cont’d
“Always” wants to touch or hold baby when sees baby* 89% 71%
Taking care of baby is “always” fun* 78% 50%
Speaks to baby when caring for baby “always” or “most of the time”* 92% 99%
Does not worry at all when separated from child* 15% 4%
Maternal well-being
Frequent headaches “major” or “minor” new problem in first two months after birth*
38% 22%
Lack of sexual desire “major” or “minor” new problem in first two months after birth*
32% 52%
Pain did not interfere at all with routine activities in two weeks before completing follow-up survey*
36% 55%
In first two months after birth, emotional well-being interfered with ability to care for baby “a great deal”*
6% 1%
Mother rehospitalized since giving birth (among those who gave birth nine or more months earlier)
13% 10%
Body Mass Index in normal range when completed follow-up survey* 30% 49%
Doing not at all well eating a healthy diet in two weeks before completing follow-up survey*
20% 8%
Doing somewhat or not at all well managing stress in two weeks before completing follow-up survey*
41% 22%
Relationships, sources of support, finances
Felt “supported” in first two months after birth* 73% 84%
Daily care for baby shared equally (among those with spouse or partner)* 42% 30%
Total out-of-pocket payment for care provider and hospital maternal-newborn care was $0*
40% 7%
Since birth, both mother and baby used WIC services* 55% 12%
Married at time of follow-up survey* 54* 81%
Did not have health insurance at time of follow-up survey* 26% 10%
Employment and education
Employed full time during pregnancy for someone else* 24% 48%
Employer offered maternity leave (among those employed by someone else during pregnancy)
62% 62%
Took paid leave (among those employed by someone else during pregnancy and employer offered leave)
70% 83%
→
Table 39 cont’d. Variation in mothers’ experiences, by primary payer of maternity care
LTM III: New Mothers Speak Out / 6. Looking at Some Important Variations in Experience

65
Base: all follow-up LTM III mothers with the respective primary insurance source (unless otherwise specified)
Medicaid or CHIPn=370
Private insurancen=513
Employment and education cont’d
Employer offered unpaid leave with job protection (among those em-ployed by someone else during pregnancy)
57% 75%
Took unpaid leave with job protection (among those employed by some-one else during pregnancy and employer offered unpaid leave)
47% 62%
Has returned to work for pay since birth (among those employed during pregnancy)
77% 77%
Has experienced unwanted reduction in hours (among those employed by someone else during pregnancy and had returned to same employer)*
28% 8%
Looks after baby while doing paid work (among those doing paid work)* 20% 9%
Workplace policy allows use of sick days to care for sick child (among those currently employed and with paid sick-day benefit)
76% 84%
Currently a student* 28% 14%
Attitudes
Definitely would want to give birth at home in future pregnancy (among those who would like to have one or more additional child)*
16% 7%
Very concerned about a serious error or mistake leading to injury or harm happening at maternity care provider’s office or clinic for prenatal care*
23% 11%
Very concerned about a serious error or mistake leading to injury or harm happening in a hospital for giving birth and the early period after birth*
25% 13%
Very or somewhat concerned about a serious error or mistake leading to injury or harm happening at maternity care provider’s office or clinic for postpartum care*
38% 22%
Very or somewhat concerned about a serious error or mistake leading to injury or harm happening when baby goes to care provider’s office or clinic for care*
42% 28%
Considers high rating by rating website or magazine to be very impor-tant in determining the quality of maternity care at a particular hospital*
44% 21%
Rates the overall quality of health care in the United States as “excellent” or “good”
63% 58%
Agrees that “Newer maternity care tests and treatments are generally improvements over older ones”
75% 78%
Agrees that “I prefer to rely on my maternity care provider to make the best decisions for me”*
73% 60%
*p < .01 for differences between payer groups** Most prenatal and birth results were reported in Listening to MothersSM III: Pregnancy and Birth. See trends tables in
that recent report for many additional pregnancy and birth items. See Appendix D in this report for additional items about those care phases collected in follow-up survey.
*** Most who reported that self-induction brought on labor also had medical induction.Bases differ from those provided when item is “(among [a named group])”.
Table 39 cont’d. Variation in mothers’ experiences, by primary payer of maternity care
LTM III: New Mothers Speak Out / 6. Looking at Some Important Variations in Experience

66
7. Trends: Comparing Results Across Listening to MothersSM Surveys
The Listening to MothersSM surveys have documented women’s childbearing experi-ences in the United States over about a decade. In making comparisons across the three surveys, it is important to understand the time frame for them. Participants in the first survey were responding about births that had taken place over a 24-month period from mid-2000 to mid-2002. Listening to MothersSM II participants had hos-pital births in 2005, and participants in the most recent survey had hospital births from mid-2011 through mid-2012. While LTM II and LTM III and their respective follow-up surveys have included timely new items, numerous continuing items have been included in two or all three surveys. This section looks across the three surveys to consider trends during what has been in many respects a time of flux for the U.S. maternity and health care systems. Table 40, inclusive of results from the follow-up LTM III survey, should be considered to be a companion to trend tables inclusive of results from the initial LTM III survey in our recent Listening to MothersSM III: Preg-nancy and Birth report.
Table 40 presents trends across some items that were available in multiple Listening to MothersSM surveys. The comparisons include some pregnancy and birth topics, newly reported in Appendix D. While we primarily included in this table cases of dif-ferences over time, there was relative stability over time in mothers’ rating of their baby’s health, mothers’ likelihood of working up to the due date, and the likelihood of mothers’ consulting a health care or mental health professional for mental health support. Notable differences over time included a slight decline in the reliance on home pregnancy tests, a larger proportion of mothers indicating in the more recent survey that they had experienced an “urge to push,” while at the same time an in-crease in mothers’ reports of health professionals pressing on their belly to help push the baby out. There were notable declines in the proportion of mothers get-ting more than 90% of their salary during paid maternity leave, in the proportion of mothers reporting their babies were in day care for 33 or more hours a week, and in mothers’ reporting that child care and breastfeeding had been challenging in the transition to paid work. There was also a general decline in mothers’ support for a woman’s right to choose for herself whether to have a vaginal or cesarean birth. There were also higher rates in the most recent survey of routine pacifier use, moth-ers’ reporting pain interfering with caring for the baby, different forms of support by a spouse or partner, and the availability of paid maternity leave.
LTM III: New Mothers Speak Out / 7. Trends: Comparing Results Across Listening to Mothers SM Surveys

67
Table 40. Trends Across Listening to MothersSM surveys
LTM I2000-02
LTM II2005
LTM IIfollow-up
2005
LTM IIIfollow-up2011-12
Pregnancy and birth*
Learned about pregnancy from home pregnancy test n.a. – 83% 76%
Mother reported an “urge to push” the baby out (among vaginal births)
n.a. – 68% 83%
Health professional pressed down on belly to help push the baby out (among vaginal births)
n.a. – 17% 25%
Had the same provider/group as in prior birth (among experi-enced mothers)
n.a. – 56% 66%
Had continuous electronic fetal monitoring (among those who experienced labor)
66% 76% – 60%
Postpartum
Mother did not have a postpartum visit with maternity care pro-vider because of lack of insurance (among those with no post-partum visit)
n.a. – 10% 7%
Baby’s health described as “excellent”/“very good” 76% / 20% 75% / 22% 78% / 19% 78% / 20%
Baby’s care provider was a pediatrician or family physician n.a. – 75% / 21% 79% / 17%
Baby exclusively breastfed at six months n.a. – 20% 17%
Mothers breastfed as long as wanted to n.a. – 46% 49%
Baby used a pacifier on daily basis n.a. – 48% 58%
Baby slept in bed with parents “always” in first six months n.a. – 18% 12%
Postpartum “major” new-onset problems
Physical exhaustion 24% 24% – 16%
Lack of sexual desire 24% – 19% 13%
Weight control n.a. – 23% 16%
Itching at cesarean incision site (among those with cesarean) n.a. – 24% 13%
In first two months, physical health interfered with ability to care for baby “quite a bit” or “a great deal”
n.a. – 4% 8%
Mother consulted a health care or mental health professional since giving birth
19% 19% 18% 18%
→
LTM III: New Mothers Speak Out / 7. Trends: Comparing Results Across Listening to Mothers SM Surveys

68
LTM I2000-02
LTM II2005
LTM IIfollow-up
2005
LTM IIIfollow-up2011-12
Postpartum cont’d
In 2 weeks prior to survey, mother doing “very well” or “extreme-ly well” in getting exercise
n.a. – 16% 33%
In 2 weeks prior to survey, mother doing “very well” or “extreme-ly well” in eating a healthy diet
n.a. – 21% 33%
Mothers and spouse/partner share daily care for baby equally n.a. – 25% 35%
Since birth, emotional support from spouse/partner available to mother “all the time” (among those with a spouse or partner)
n.a. – 30% 41%
Employment
Worked to within one week of due date (among those employed during pregnancy)
n.a. 39% 34% 34%
Employer had paid maternity leave (among those employed during pregnancy)
n.a. 40% – 63%
Mothers received more than 90% of pay during maternity leave (among those employed during pregnancy, who had and took paid maternity leave)
n.a. 50% – 31%
While at work child is in care of someone other than mother or spouse/partner for 33 or more hours (among those employed at time of survey)
n.a. – 46% 26%
Major challenge in transition to work was child care arrangements (among those employed at time of survey)
n.a. – 20% 28%
Major challenge in transition to work was breastfeeding (among those employed at time of survey)
n.a. – 16% 28%
Attitudes
Rate health care in United States as “excellent”/”good” n.a. – 17% / 53% 19% / 43%
Support for woman’s right to choose a primary cesarean n.a. 46% – 40%
Support for woman’s right to choose a vaginal birth after cesarean n.a. 85% – 69%
If given choice in future birth would “very likely” choose cesarean (among those with a vaginal birth)
2% 13% – 9%
* Most prenatal and birth results were reported in Listening to MothersSM III: Labor and Birth. See trends tables in that recent report for many additional pregnancy and birth items. See Appendix D in this report for additional items about those care phases collected in follow-up survey, including those shown above.
n.a. indicates item was not available in a previous survey, at all, or through comparable data– indicates that item was available from companion survey directed to same mothers (see adjacent column)
Table 40 cont’d. Trends Across Listening to MothersSM surveys
LTM III: New Mothers Speak Out / 7. Trends: Comparing Results Across Listening to Mothers SM Surveys
69
Conclusion
The combined initial and follow-up Listening to MothersSM III (LTM III) surveys offer an unprecedented look at experiences of childbearing women and their youngest children in the United States. This report focuses on major topics of the follow-up survey: 1) experiences of women, babies, and families from birth until well into the second year (including physical and emotional health, breastfeeding experiences, family and other support, employment and maternity leave, child care, and health insurance); 2) the women’s perspectives on many topics relating to maternity care quality and engaging in maternity care; and 3) a small number of additional items about pregnancy and birth not presented in our recent report on the initial survey, Listening to MothersSM III: Pregnancy and Birth. This report also looks at important variations in women’s experiences, by race/ethnicity and primary payer of maternity services, and trends across a decade of Listening to MothersSM surveys. Results point to many opportunities to improve conditions for women, babies, and families, and we highlight key concerns and opportunities here. With nearly four million births annually, each percentage point represents about 40,000 mother-baby pairs and families every year.
Postpartum Experiences From Birth into the Second YearHow childbearing women, babies, and families fare during this crucial period mat-ters deeply. Our survey results clarify that mothers of young children in the United States have diverse, demanding responsibilities; experience notable social, physi-cal, and emotional challenges; and face inadequate policies, services, and support. Following sustained attention during pregnancy and around the time of birth – and high rates of procedures, tests, and medications at that time – the women receive relatively little systematic support in the months following birth.
Key concerns with the physical and emotional well-being of mothers who have re-cently given birth include:
• In the first two months after birth, mothers reported experiencing 22 different conditions as new problems – from various types of pain and infection to uri-nary and bowel problems, concern with weight control and lack of sexual de-sire, feelings of stress and depression, and sleep loss and exhaustion. From 6% to 21% considered each condition to be a “major” new problem, while from 15% to 58% considered each to be either a “major” or “minor” new problem.
• Six months or more after the birth, at least one mother in five experienced persisting backache, sleep loss, stress, physical exhaustion, lack of sexual de-sire, and – in those who had had a cesarean – itching and numbness at the incision site. Sixteen percent of women who had had a cesarean reported per-sisting pain and 5% persisting infection at the incision site.
• From 31% to 43% felt they were doing “not at all well” or “somewhat well” getting enough exercise and enough sleep, eating a healthy diet, and managing stress.
• Relative to their weight just before becoming pregnant, the mothers weighed on average four pounds more than they did before giving birth. →
LTM III: New Mothers Speak Out / Conclusion

70
• Using an established depression screening tool, 14% of the mothers screened as likely to be depressed in the two weeks prior to the initial survey and 17% just before the follow-up survey. Even among those who met the criteria at both points, a majority had not consulted a professional with concerns about their mental or emotional health by the time of the second survey.
• Thirteen percent of the mothers and nine percent of the babies had been re-hospitalized for at least one night, which was much more likely among black than white or Hispanic mothers and babies.
Despite the range and extent of early physical and emotional conditions, 10% of the mothers had no postpartum office visit, 34% had a single visit, and 28% had two visits.
Of women with a spouse or partner, 15% or more reported that the spouse or partner provided four different types of support “none of the time” or “a little of the time,” and 22% or more reported that others provided those types of support “none of the time” or “a little of the time.” Of women who were employed full time and had a spouse or partner, 45% reported providing most care for the baby versus 7% reporting that the spouse or partner provided most care, and 49% saying that it was shared equally.
On average, the women paid $2301 out of pocket for hospital and provider charges for their maternal and newborn care. Just 5% reported that they themselves were the primary payer for their maternity services; and their out-of-pocket costs averaged $2686. However, the much larger group of women who had had private insurance reported paying an average of $3402 out of pocket. At the time of the follow-up sur-vey, 18% of the mothers did not have health insurance, including 10% of those whose maternity care had been covered by private insurance and 26% whose maternity care had been covered by Medicaid or CHIP, the Child Health Insurance Program.
Many survey participants and their babies did not get benefits of breastfeeding, at all or for the quantity and/or duration that professionals recommend.
• While mothers appeared to be aware of exclusive breastfeeding recommenda-tions of the American Academy of Pediatrics, just 17% met the recommenda-tion for exclusive breastfeeding to six months, and well below half met the recommendation to continue some breastfeeding to at least 12 months.
• Just 54% intended to exclusively breastfeed, 50% were doing so a week after the birth, and just 49% of those said they had breastfed as long as they liked. In addition to experiencing many hospital practices that are known to undermine breastfeeding (described in the first LTM III survey report), the women described difficulties getting breastfeeding going, inadequate support for breastfeeding, the convenience of formula and solid food, and the adverse impact of employ-ment on planning and carrying out breastfeeding.
• Exclusive breastfeeding intent and practice appear to fall off steeply as women have more children.
LTM III: New Mothers Speak Out / Conclusion

71
In contrast to nearly all other high-income nations, women in the United States are not entitled to a fixed amount of paid maternity leave. Offering this is voluntary.
• Among women who had been employed by someone else during pregnancy, 63% had a paid leave benefit, and 76% of those received at least half of their salary. For those with paid leave, the average duration was eight weeks.
• About 23% of all mothers and 49% who had been employed during pregnancy were employed by 12 weeks postpartum. Most (72%) felt they had stayed home as long as they liked. Financial pressure was a key driver for those who would have liked to be home longer.
• On average, the mothers named seven months as the optimal length of fully paid leave.
• Most who transitioned to paid work identified such challenges as being apart from the baby, breastfeeding, and making ends meet; and a minority felt they experienced each of several types of workplace discrimination relating to their pregnancy, leave, or motherhood.
Views of Maternity Care Quality and Engaging in Maternity CareCurrent health policies in the United States recognize the need to improve the quality and value of maternity care and health care overall, and to actively engage patients in their care. We took advantage of the LTM III surveys to better understand how child-bearing women view these and related matters. Our results can be used to improve women’s understanding of maternity care and better engage them in this care.
A major survey finding is that many mothers had limited awareness of established qual-ity of care concerns, contrary to views of national health and maternity care leaders and to national policy aims. Notably, this group had themselves experienced many trou-bling care practices that were not consistent with best evidence and troubling process-es, such as pressure to have interventions and failure to provide balanced information (for a summary, see the Conclusion to our recent report of the initial LTM III survey).
• Mothers gave high ratings to health care in the United States and even higher ratings to maternity care in the United States (35% excellent; 49% good). Their rating of the various phases of their own care was uniformly high.
• Mothers understood that high-quality hospital maternity care protects women and babies from getting infections in hospitals, involves attentive and caring nurses, and receives favorable ratings by the women who receive care.
• Whereas problems with overuse, underuse, and unwarranted practice varia-tion are well-established, mothers agreed that recommendations of maternity care providers reliably reflect current evidence about what works best (82% versus 10% disagree), that getting more rather than fewer maternity tests and treatments is generally better quality care (63% versus 22%), and that more effective tests and treatments generally cost more than those that don’t work as well (52% versus 27%).
• Mothers understood that high-quality maternity care limits medical mistakes in their hospital care. While most were “not at all concerned” or “not too concerned” about a serious error leading to injury or harm in all phases of their care and in their baby’s office visits, they expressed greatest concern about mistakes lead-ing to harm while in the hospital for giving birth (19% “very concerned”; 24% “somewhat concerned”). →
LTM III: New Mothers Speak Out / Conclusion
72
• Mothers expressed confidence in their ability to be activated relative to ma-ternity care, with 85% or more agreeing with specific items. Similarly, 85% or more agreed that they want to know the risks of each care option, about the option of choosing no test or treatment, and the cost to them of each option. Nonetheless, 65% agreed that they prefer to have their maternity care pro-vider make the best decisions for them.
The style of care in birth centers and at home births has repeatedly been found to be more closely aligned than typical hospital care with needs of most women and newborns, who are healthy and benefit from support for their own capacities for op-timal timing of labor, and for laboring, giving birth, breastfeeding, and attachment. The judicious use of technology in these settings avoids side effects and waste of unneeded interventions. An important survey result is openness of the respondents, who had all had hospital births, to giving birth in a birth center and at home. Among those who planned to give birth again, fully one-quarter would “definitely” want to give birth in a birth center that is separate from a hospital, and an additional 39% would consider it. And 11% who expect to give birth again would “definitely” want to give birth at home, while an additional 18% would consider a home birth.
Additional Pregnancy and Birth ResultsAppendix D presents additional pregnancy and birth results that were not reported in our recent companion report. The new results continue to show the extent to which pregnant women consult and value various online sources for pregnancy and birth information, with relevant blogs and online discussion lists most used and val-ued for this purpose. For the most part, the women’s online searching experience for these topics was positive, with most expressing confidence and a minority re-sponding with frustration, confusion, or fear.
With some additional results on labor and birth interventions collected in the follow-up survey, Appendix D includes a summary table (combining results from both LTM III surveys) showing the range and extent of use of interventions that women experience at this time to start labor, drive it along, monitor the baby, and accelerate the pushing phase, as well as the use of cesarean section, either without or following labor. We asked about tests, drugs, and procedures that the women might reasonably be able to report rather than about a full inventory of those they may have experienced. While selective, the items included here clarify that in U.S. hospitals an array of external procedures and drugs largely drives childbirth, beginning with determining its timing, rather than giving priority to the innate hormonally-driven physiologic capacities of women and their babies, which confer important benefits and limit adverse effects.
LTM III: New Mothers Speak Out / Conclusion

73
Appendix AMethodology
This report presents results relating to women’s postpartum experiences, along with attitudes, preferences, and beliefs relating to childbearing and maternity care quality from two national surveys carried out by Childbirth Connection. These surveys con-tinue Childbirth Connection’s pioneering work in carrying out the first national Listen-ing to MothersSM survey, which was conducted in 2002, and the initial and follow-up Listening to MothersSM II surveys, conducted in 2006. Harris Interactive® conducted the Listening to MothersSM III (LTM III) survey from October 11 to December 26, 2012, among 2400 respondents. Harris Interactive contacted the same women to partici-pate in the LTM III follow-up survey from January 29 to April 15, 2013. Of the original respondents, a total of 1072 (45%) completed the postpartum survey. Data from both surveys were weighted to reflect the target population of women 18 through 45 years who gave birth in U.S. hospitals in 2011 to a single baby, with the baby still liv-ing at the time of the survey, and who could respond to the survey in English (see “Data Weighting”).
The Survey Questionnaires A core team from Childbirth Connection, the Boston University School of Public Health, and Harris Interactive collaboratively developed the questionnaires, with guidance from the multi-disciplinary Listening to MothersSM III National Advisory Council. The questionnaires retained some items from the previous Listening to MothersSM sur-veys, pursued some previous topics in greater depth, and added new topics (see Ap-pendix C). The full survey questionnaires for all LTM surveys are available at: www.childbirthconnection.org/listeningtomothers/.
Sample SourcesPotential respondents to the initial survey were drawn from the Harris Poll Online (HPOL), Research Now/E-Rewards, GMI, and Offerwise Hispanic panels. To eliminate the potential for duplicate data for panelists who may be a member of multiple pan-els, Harris uses digital fingerprint technology. Any respondent identified as a dupli-cate by this technology is automatically deleted by programming logic. The duplicate technology provides each respondent with a fraud score ranging from 0 to 100. By default, any respondent with a score greater than 0 is excluded from the final data. In addition, Harris employs duplicate IP address checks. Duplicate IP addresses are verified by and cross-checked between panels. In addition to digital fingerprint technology and duplicate IP checks, Harris also verifies GEO IP Encoding. If a respon-dent’s IP is not from the correct GEO IP location, then that respondent is prevented from entering the survey.
LTM III: New Mothers Speak Out / Appendix A: Methodology
74
Eligibility RequirementsPotential respondents to the initial survey were asked a series of preliminary ques-tions to determine their eligibility. Eligible women had to be 18 through 45 years of age, have given birth between July 1, 2011 and June 30, 2012 in a hospital to a single baby, have that child still living at the time the survey was conducted, and be able to respond to a survey in English. To minimize bias, the screening questions were de-signed so that the eligibility criteria were not readily apparent.
We decided to examine only singleton births because the relatively small proportion of multiple births in the U.S. is distinct from all births in many important ways, and would yield too few participants for us to examine separately. Likewise, we focused on hospital births because there are so few home (0.8% in 2010) or freestanding birth center (0.3%) births that we would not have had sufficiently large subgroups to analyze these. Moreover, question wording was considerably simplified for respon-dents by referring to the hospital experience and birth of a single child. We elimi-nated births to mothers whose babies were not living at the time of the survey for several reasons. From an ethical perspective, we felt that survey participation could be distressing to this group of mothers. From the perspective of data analysis, they are another distinctive and small group. Further, questionnaire wording would have been complicated. It would be valuable to carry out parallel surveys to better under-stand groups that have been excluded from the core Listening to MothersSM surveys, including surveys in other languages.
Eligibility for the follow-up survey was limited to all participants in the initial LTM III survey.
Online InterviewingFor the initial LTM III survey, an email was sent to a sample of women age 18 through 45 drawn from the various panels inviting them to participate in the survey. Embed-ded in the invitation was a direct link to the survey website enabling recipients to proceed to the survey immediately or at a later time more convenient to them. The survey was hosted on a secure server and used advanced web-assisted interviewing technology. After proceeding to the survey website, respondents were screened to determine their eligibility. Respondents satisfying the eligibility requirements were able to proceed into the actual survey. Once in the survey, respondents could com-plete the entire questionnaire in one session or could choose to complete it in mul-tiple sessions, an important consideration for mothers of young children. Additional steps taken to maximize response included sending “reminder” invitations to respon-dents who did not respond to the initial invitation.
All LTM III participants were invited to take the follow-up survey. Several reminder emails were sent to non-responders during the field period. Potential respondents were asked a few preliminary questions to determine whether they were the same person who took the initial survey.
Data ProcessingFor both datasets, all data were tabulated, checked for internal consistency, and pro-cessed by computer. A series of computer-generated tables was then produced show-ing the results of each survey question, both by the total number of respondents and by key subgroups.
LTM III: New Mothers Speak Out / Appendix A: Methodology
75
Data WeightingTo more accurately reflect the target population, the data were weighted by key de-mographic variables, as well as by a composite variable known as a propensity score, intended to reflect a respondent’s propensity to be online. Demographic variables used for weighting included educational attainment, age, race/ethnicity, geographic region, and household income using data from the March 2011 Supplement of the U.S. Census Bureau’s Current Population Survey; and mode of birth and number of times women have given birth, using data from the U.S. Centers for Disease Control and Prevention’s 2010 reporting of birth certificate data. (The latter was the most recent available birth certificate file at the time of data weighting and analysis of both surveys.) The propensity score took into account selection biases that occur when conducting research using an online panel, and included measures of demo-graphic, attitudinal, and behavioral factors that are components of the selection bias. Several articles describe this methodology and report experiences with validat-ing applications of the methodology.1 Because of the slightly different demographic makeup of initial and follow-up survey participants, separate weighting systems were developed for results of the two surveys.
As a consequence of the methodology described, the Listening to MothersSM III sur-vey was designed to be representative of the national population of women giving birth in 2011 and 2012, with the following exclusions: teens younger than 18 and mothers older than 45, mothers who had given birth outside of a hospital, women with multiple births and with babies who had died, and women who were unable to participate in English.
Comparing SubgroupsWhen testing for differences between subgroups, it is common to accept a p < .05 level of chance of error. To be even more confident in interpreting our results, when comparisons are made, we used p < .01 as the cutoff for identifying differences in the groups being compared. This reduces the possibility that the differences cited are based on random variation.
Non-Sampling ErrorSampling error is only one type of error encountered in survey research. Survey research is also susceptible to other types of error, such as data handling and inter-viewer recording error. The procedures followed by Harris Interactive are designed to keep errors of these kinds to a minimum.
Note
1. Smith R, Brown HH. Assessing the quality of data from online panels: Moving for-ward with confidence. Harris Interactive White Paper, n.d.; Terhanian G, Bremer J. Confronting the selection-bias and learning effects problems associated with Internet research. Harris Interactive White Paper, August 16, 2000; Terhanian G, Bremer J, Smith R, Thomas R. Correcting data from online surveys for the effects of nonrandom selection and nonrandom assignment. Harris Interactive White Pa-per, 2000; Taylor H, Bremer J, Overmeyer C, Siegel JW, Terhanian G. Touchdown! Online polling scores big in November 2000. Public Perspective 2001 March/April;12(2):38-39; Taylor H, Terhanian G. Heady days are here again. Public Per-spective 1999 June/July;10(4):20-23. Additional information about Harris Interac-tive Method is available at: www.harrisinteractive.com.
LTM III: New Mothers Speak Out / Appendix A: Methodology

76
Appendix BDemographic Overview of Survey Participants and Comparison With Federal Birth Certificate Data
Table 41. Unweighted and weighted* demographic profile of survey participants and comparison with federal birth certificate data
Base: all follow-up LTM III mothers n=1072Singleton hospital
births to mothers 18+** %
Unweighted number
Unweighted%
Weighted %
Age
18 – 24 199 19% 32% 32%
25 – 29 272 25% 28% 29%
30 – 34 352 33% 25% 25%
35 – 39 184 17% 12% 12%
40 – 45 65 6% 3% 3%
Education
High school or less 156 15% 41% 45%
Some college 374 35% 29% 27%
College graduate 397 37% 21%28%
Post-graduate 145 14% 9%
Income
< $29,400 152 14% 26% –
$29,401 – $37,000 64 6% 6% –
$37,001 – $52,30 167 16% 17% –
$52,301 – $75,300 254 24% 20% –
$75,301 or more 380 35% 26% –
→
LTM III: New Mothers Speak Out / Appendix B: Demographic Overview of Survey Participants

77
Base: all follow-up LTM III mothers n=1072Singleton hospital
births to mothers 18+** %
Unweighted number
Unweighted%
Weighted %
Race/Ethnicity
White non-Hispanic 710 66% 55% 54%
Black non-Hispanic 103 10% 15% 15%
Hispanic 186 17% 23% 24%
Asian and other 68 6% 6% 7%
Maternal birth place
United States 992 93% 92% 76%
Other country 80 8% 8% 24%
Number of times has given birth
One 492 46% 41% 39%
Two 366 34% 32% 32%
Three or more 214 20% 27% 29%
*See Appendix A for a description of weighting procedure** Figures from 2010 reporting of birth certificate data; at the time of publication, the most recent available national birth
certificate file was of 2010 births
Table 41 cont’d. Unweighted and weighted* demographic profile of survey participants and comparison with federal birth certificate data
LTM III: New Mothers Speak Out / Appendix B: Demographic Overview of Survey Participants

78
Appendix CSources for New Listening to MothersSM Survey Items
Many items from previous Listening to MothersSM surveys were retained in the Lis-tening to MothersSM III surveys, and the new surveys also enabled us to explore new topics. In adding new items, we preferred to use or adapt previously validated items, as available and with permission, and we developed some new items as well. Use of items that have been or will be used with other populations enables comparison of results across groups. This appendix describes sources of items that were first used or adapted in a Listening to MothersSM survey with the most recent LTM III follow-up survey. The Methodology appendix to the LTM II follow-up survey report (New Moth-ers Speak Out) describes sources for items initially brought in to that survey, and an appendix to the initial LTM III survey report (Listening to MothersSM III: Pregnancy and Birth) describes sources for items initially brought in with that survey.
Maternal Well-BeingWe developed new items to assess whether women had received home visits in the first two months, whether women with chronic or gestational diabetes had received related tests in the postpartum period, and whether care providers had recommended that women with one or more cesareans limit their lifetime total number of cesar-eans. We adapted established items about women’s postpartum care experiences, as follows and with permission:
• Telephone access to a care provider in first two months for concerns about self or baby, adapted from Women’s Experience of Maternity Care 1
• Adequacy of guidance about key postpartum topics, adapted from The Cana-dian Maternity Experiences Survey 2
Child Well-BeingWe developed new items to gauge preferences relating to immunization of babies, to examine knowledge of American Academy of Pediatrics breastfeeding recommen-dations, and to begin to understand the breastfeeding history of women with one or more previous births.
Family and RelationshipsWe adapted established items, as follows and with permission:
• Political philosophy, adopted question series previously used by Harris Interactive3
• Feelings of attachment to newborn child, adopted from the Postpartum Maternal Attachment Scale, Core Maternal Attachment Subscale 4
• Use of WIC (Women’s Infant, and Children) Special Supplemental Nutrition Program services after birth, adapted from Pregnancy Risk Assessment Monitoring System (PRAMS) 5
LTM III: New Mothers Speak Out / Appendix C: Sources for New Listening to Mothers SM Survey Items

79
Employment, Maternity Leave, Child Care, and Health InsuranceWe worked with colleagues at the National Partnership for Women and Families to develop new items relating to workplace accommodations to pregnancy, access to unpaid leave and job guarantee, postpartum changes in employment conditions/en-vironment and possible association with maternity status, and workplace accommo-dations for breastfeeding women (provisions of Affordable Care Act). We developed a new item to examine health insurance coverage at the time of the survey. We also developed an item about the impact of impending employment plans on breastfeed-ing decisions.
Women’s Views of Maternity Care Quality and Engaging in Their CareWe expanded the scope of questions about women’s attitudes, beliefs, and prefer-ences relating to maternity care and childbearing. We developed new items about women’s ratings of the quality of different phases of maternity care and their support for an array of birth choices, for themselves and others. We also adapted numerous items about views of maternity care quality and safety, with permission as follows:
• Attitudes towards maternity care tests and treatments, adapted from The Public and the Health Care Delivery System6
• Level of concern regarding medical error through the spectrum of maternity care experiences, adapted from National survey on Americans as Health Care Consumers: An Update on the Role of Quality Information 7
• Importance of factors in determining the quality of maternity care, adapted from Washington Residents’ Perceptions of Hospitals 8
• Perception of differences in the quality of care among local obstetricians and hospitals, adapted from 2008 Update on Consumers’ Views of Patient Safety and Quality Information9
• Attitudes toward verifying information from maternity care provider about tests and treatments with third-party information sources, adapted from an online survey 10
• Patient Activation Measure (PAM), relevant items adapted to circumstances of maternity care 11
• Importance of having access to online maternity and health records, adapted from Public Views on U.S. Health System Reorganization: A Call for New Directions 12
Supplementary Pregnancy and Birth Items (Appendix D)We developed new items to understand whether care providers had recommended a specific pregnancy weight gain; whether women had changed maternity care pro-viders and/or planned hospital for birth during pregnancy and, if so, why; the types of devices (operating systems) that women used to gain access to the Internet; and their cervical dilation at hospital admission. We adapted established items about ad-ditional pregnancy and birth items, as follows and with permission:
• Use of various online resources as sources of information about pregnancy and birth, adapted from How America Searches: Health and Wellness 13
• Feelings while searching for online health information during pregnancy, adapted from the Pew Internet & American Life Project 14
LTM III: New Mothers Speak Out / Appendix C: Sources for New Listening to Mothers SM Survey Items

80
Notes
1. Care Quality Commission. Women’s experience of maternity care, 2010. Available at: http://www.cqc.org.uk/public/reports-surveys-and-reviews/surveys/maternity-services-survey-2010.
2. Public Health Agency of Canada. The Canadian maternity experiences survey, 2006. Available at: www.phac-aspc.gc.ca/rhs-ssg/survey-eng.php.
3. Harris Interactive, provided by Sandra Applebaum.
4. Nagata M, Nagai Y, Sobajima H, Ando T, Nishide Y, Honjo S. Maternity blues and at-tachment to children in mothers of full-term normal infants. Acta Psychiatr Scand 2000 101(3):209-17; Nagata M, Nagai Y, Sobajima H, Ando T, Honjo S. Depression in the mother and maternal attachment – Results from a Follow-Up Study at 1 Year Postpartum. Psychopathology 2003 36(3):142-51; Nagata M, Nagai Y, Sobajima H, Ando T, Honjo S. Depression in the early postpartum period of attachment to chil-dren – in mothers of NICU infants. Inf Child Dev 2004 13(2):93-110.
5. Centers for Disease Control and Prevention. PRAMS questionnaires. Available at: www.cdc.gov/prams/Questionnaire.htm.
6. National Public Radio, Robert Wood Johnson Foundation, Harvard School of Public Health. The public and the health care delivery system, April 2009. Available at: http://www.kff.org/kaiserpolls/posr042209pkg.cfm.
7. Kaiser Family Foundation, Agency for Healthcare Research and Quality. National survey on Americans as health care consumers: An update on the role of quality information, December 2000. Available at: http://www.ahrq.gov/professionals/quality-patient-safety/quality-resources/tools/kffupdate/kfftoplines00.pdf.
8. Washington State Hospital Association, Moore Information. Washington resi-dents’ perceptions of hospitals, 2005. PowerPoint Presentation, available at: http://www.wsha.org/files/64/PollShortMailedVersion-May2005.ppt.
9. Kaiser Family Foundation. 2008 Update on consumers’ views of patient safety and quality information. Available at: http://www.kff.org/kaiserpolls/posr101508pkg.cfm.
10. National Business Group on Health. Employee healthcare decision making survey, 2007.
11. Hibbard JH, Mahoney ER, Stockard J, Tusler M. Development and testing of a short form of the Patient Activation Measure. Health Serv Res 2005 40(6 part 1):1918-30.
12. How SKH, Shih A, Lau J, Schoen C. Public views on U.S. health system organization: A call for new directions. The Commonwealth Fund, August 2008. Available at: http://www.commonwealthfund.org/Publications/Data-Briefs/2008/Aug/Public-Views-on-U-S--Health-System-Organization--A-Call-for-New-Directions.aspx.
13. Elkin, N. How America searches: Health and wellness. iCrossing: A Digital Market-ing Company, August 2008. Available at: http://www.icrossing.com/sites/default/files/how-america-searches-health-and-wellness.pdf.
14. Fox S. Pew Internet & American Life Project. Pew Research Center. Online health search, 2006. Available at: http://www.pewinternet.org/Reports/2006/Online-Health-Search-2006.aspx.
LTM III: New Mothers Speak Out / Appendix C: Sources for New Listening to Mothers SM Survey Items

81
Appendix DAdditional Results for Pregnancy and Birth Experiences
Our recently issued first Listening to MothersSM III report presents extensive data on the respondents’ pregnancy and birth experiences. We included a small number of addi-tional questions on these topics in the follow-up survey, and results are reported here.
Learning About Pregnancy
We asked mothers in the postpartum survey how they learned they were pregnant and when they learned they were pregnant, and 76% indicated they learned about their pregnancy through a home pregnancy test (on average after 5.2 weeks), while 24% indicated it was a health professional who informed them (6.9 weeks) (p < .01 for difference in weeks when learned pregnant).
Prenatal Care and Planning for Birth
Provider Recommendations About Weight GainWe asked mothers if their provider made a recommendation about weight gain, and overall 59% said they had been given a recommendation. Table 42 presents the rec-ommendation stratified by pre-pregnancy Body Mass Index (BMI). The recommen-dations vary little by BMI, with mothers who were underweight being encouraged to gain on average 25 pounds, while obese mothers were told 22 pounds.
LTM III: New Mothers Speak Out / Appendix D: Additional Results for Pregnancy and Birth Experiences
“I was told in the begin-
ning of my pregnancy I
was too thin and needed
to put on weight…. I
gained a lot of weight and
towards the end they kept
bringing it up as being
‘concerned’. Mixed signals
were being sent through-
out. ”

82
Table 42. Prenatal providers’ recommended weight gain, by Body Mass Index (BMI) just before pregnancy
Base: all follow-up LTM III mothers n=1072
UnderweightBMI
<18.5n=115
NormalBMI
18.5 – 24.9n=501
OverweightBMI
25.0 – 29.9n=243
ObeseBMI30+
n=213
Provider made a weight gain recommendation 64% 63% 56% 50%
Recommended weight gain (lbs) n=450 25 25 23 22
Midpoint of recommended range (lbs) n=181 30 26 24 22
Note: respondents whose providers made a weight gain recommendation were given the option of identifying a specific recommended weight gain or a recommended weight gain range
Prenatal Office VisitsThe mothers reported traveling an average of 13 miles one way for their prenatal visits. This compares with an average of 14 miles to the place they gave birth. There was some regional variation, with mothers from the South traveling the farthest for prenatal visits on average (14 miles) while those in the Northeast reported the least average distance (10 miles).
Switching Maternity Care Providers and HospitalsWe asked mothers about whether they switched either providers or the hospital where they planned to give birth during their pregnancy. A total of 22% of mothers indicated they had switched in each case. Among those women who made a change, a slight majority (51%) switched both their provider and hospital, while 27% switched only their provider and 22% switched their hospital but not provider. In terms of the reasons for changing, mothers were given three choices and the leading reason they chose for switching providers was “to increase the chance of having the care and choices that I wanted” (38%), followed by a desire for a more convenient location (27%), and financial reasons (24%). In the case of changing hospitals the reasons were ranked in the same order but at different rates: “increase choice of care” (35%), loca-tion (33%), and finances (24%).
Sources of Information About Pregnancy and Birth During Pregnancy
Note: the first and second Listening to MothersSM surveys and reports examined many sources of information about pregnancy, birth, and parenting that were not addressed in the most recent surveys. Please consult prior reports about friends, relatives, books, and other information sources.
LTM III: New Mothers Speak Out / Appendix D: Additional Results for Pregnancy and Birth Experiences
“Many women in our
area travel up to 45 minutes
to a metropolitan area to
deliver their babies. We
chose to remain in our
small, rural hospital…. Our
primary care physician
is … an attending physi-
cian in that hospital…. We
didn’t want to travel. ”“I started initially with a
regular OB/GYN doctor
but did not like how he was
treating me so I switched
to a midwife. When I
moved to a different state
I continued with midwife
care but then had to
switch to another doctor
again at 39 weeks because
of my complications. ”“I switched to a doctor
who was more willing to give
me the care I wanted in a
much friendlier and more
supportive environment. ”

83
Use and Value of Online Resources for Pregnancy and Birth InformationWe asked mothers in our initial Listening to MothersSM III survey to assess the value to them of various online resources such as Facebook and Wikipedia. Table 43 presents the results. Pregnancy and childbirth related blogs were clearly the most frequently valued with 78% of mothers using this resource and 87% of those who used them as pregnancy and birth information sources citing them as somewhat or very valuable. Most (77%) who used online forums, chatrooms, and group discus-sions for this purpose found them at least somewhat valuable, followed by online video sites (69%), Facebook (67%), and others as shown in the table. These results were, not surprisingly, strongly related to age, with mothers less than 30 significantly more likely to use and find valuable every one of these sources (p < .01). For exam-ple, Facebook was used by 74% of mothers under 30 as a source of information on pregnancy and childbirth information compared with 60% of mothers over 30, with younger mothers more likely to cite it as a very valuable source than older mothers (p < .01). The differences were even more pronounced for online video sites, which were used by 72% of mothers under 30 compared with only 52% of mothers over 30, with younger mothers more likely to rate these sites as “very valuable” (p < .01).
Table 43. Value of selected online resources as sources of information about pregnancy and birth
Base: used Internet for pregnancy and birth information among initial LTM III women n=2263
Base: used specific resources for information about pregnancy and childbirth n varies
Did not use for this purpose
Very valuable
Somewhat valuable
Not valuable
Pregnancy and childbirth-related blogs 47% 40% 13% 22%
Online forums, chat rooms, and group discussion lists (Yahoo! Groups, Google Groups, etc.)
36% 41% 24% 31%
Online video sites (YouTube, Vimeo, etc.) 35% 34% 32% 39%
Facebook 31% 36% 33% 33%
Other social media (Twitter, Google Plus, etc.) 31% 28% 41% 45%
Wikipedia 30% 37% 33% 41%
Social news sites (Digg, Reddit, del.icio.us, RSS, etc.) 26% 27% 46% 48%
Impact During Pregnancy of Online Information About Pregnancy and BirthOverall, 97% of mothers reported using the Internet as a source of information on pregnancy and childbirth, a figure we presented in our initial report. We asked those mothers who had used the Internet about their experience, and Table 44 presents the results. Mothers reported generally positive experiences with their Internet searches for information on pregnancy and childbirth. Almost three fourths (72%)
LTM III: New Mothers Speak Out / Appendix D: Additional Results for Pregnancy and Birth Experiences
“Doctors don’t seem to
give much info on what
you’re supposed to eat or
not eat during pregnancy.
Much of the info I had, I
found on the Internet. ”“I read many books on
childbirth and ways to
deal with the pain of child-
birth without medication,
and I feel like they were
much more helpful than
any websites or blogs. ”
“I would try to not over-
flow my brain with some
false information given off
the Internet. ”

84
said the Internet information they found usually or always made them feel reassured that they could make an appropriate decision, and 59% felt the information made them confident they could raise new questions with their provider. Fewer than one in five mothers felt the information usually or always made them feel frightened or confused, and they usually were not frustrated by difficulty in finding information. A slightly larger proportion of mothers (27%) always or usually felt overwhelmed by the amount of information they found online.
Table 44. Impact of searching online for health information during pregnancy
When searching online for health information during your pregnancy, how often did you feel...?
Base: used online sources among follow-up LTM III mothers (see note) Always Usually Sometimes Never
Reassured that you could make appropriate health care decisions 34% 38% 21% 7%
Confident to raise new questions or concerns about a health issue with your maternity care provider
25% 34% 28% 13%
Overwhelmed by the amount of information you found online 11% 16% 42% 31%
Frustrated by a lack of information or an inability to find what you were looking for online
6% 7% 40% 48%
Frightened by the serious or graphic nature of the information you found online
5% 12% 39% 45%
Confused by the information you found online 3% 8% 51% 38%
Note: participants were randomly asked to respond to either “overwhelmed,” “frustrated,” and “frightened” (n=518) or “reassured,” “confident,” and “confused” (n=492)
Experience Watching Television Programs Created to Show Women Giving BirthA total of 65% of mothers in our survey indicated they had watched televisions pro-grams created specifically to show a women’s labor and birth experiences, with 32% of these mothers (21% of all mothers) indicating they watched these shows regu-larly. When we asked those mothers who watched regularly or sometimes what im-pact the shows had had on them as a pregnant woman, 56% indicated it made them feel excited about their upcoming birth, 50% said it helped them understand what it would be like to give birth, 39% said it helped clarify their preferences for birth, 35% said it helped them learn medical terms and technology, and 25% (30% of first-time mothers) said it caused them to worry about their upcoming birth. Viewing generally had a greater impact on first-time rather than experienced mothers. For example, 67% of first-time mothers said the shows helped them understand what it would be like to give birth, compared with 38% of experienced mothers (p < .01). Likewise, 50% of first-time mothers said the shows helped them clarify their preferences for their birth compared with 32% of experienced mothers (p < .01).
LTM III: New Mothers Speak Out / Appendix D: Additional Results for Pregnancy and Birth Experiences
“Whatever information I
needed I could research
online or in a book and I
felt prepared. ”
“I wasn’t prepared for
how tiring it was to push
the baby out. TV makes
it look easy, but I had
to push for 90 minutes
straight. ”

85
Giving Birth
Spontaneous Onset of LaborThe benefits of labor that starts on its own are increasingly recognized. We calculated the percentage of survey participants who experienced what is known as “spontane-ous onset of labor” by adding the proportions of vaginal births with neither self- nor medically-induced labor and of unplanned cesareans not preceded by labor induction. At most, 54% had labors that started on their own, a likely overestimate, as some were “not sure” whether labor induction had caused labor to begin and we could not iden-tify mothers with medical induction that did not start labor and resulted in a cesarean.
Primary Maternity Care AttendantMothers who had given birth before were asked if the person who attended the birth of their most recent baby had attended a previous birth, and that was the case for 41% of our mothers, with another quarter of the mothers (25%) indicating it was a different provider from the same group. One-third (34%) of mothers had a differ-ent provider who was not from the same group.
Vaginal Exams: Cervical Dilation Just After Hospital AdmissionThe cervix of mothers, on average, was dilated three centimeters when they arrived at the hospital. This is generally considered to be “early” rather “active” labor.
Fetal Monitoring During LaborFor 89% of women who experienced labor, electronic fetal monitoring (EFM) was used to record the baby’s heartbeat, either alone (66%) or in combination with a handheld device such as a “Doppler” or stethoscope (23%). Among women using EFM, 80% were monitored either continuously throughout labor (60%) or for most of the time during labor (20%). Smaller proportions were monitored intermittently (12%) or as a base-line measure (i.e., for only a short period of time just after hospital admission) (5%).
Pushing the Baby OutWe asked mothers if they experienced what has been termed an “urge to push,” and among those with a vaginal birth, 31% said they had a mild urge and 52% stated they had a strong urge to push the baby out. This rate was powerfully related to ex-periencing an epidural, with 65% of those not having an epidural citing a strong urge to push compared with 43% of mothers with an epidural (p < .01). We also asked what determined when and how hard they pushed, and 30% pushed when a nurse or provider told them to, while 29% relied on their body’s own sensations, and 39% indicated they used both. Additionally, mothers were asked if they experienced a health professional pressing down on their belly to help push the baby out (“fundal pressure”), and 25% stated they had experienced such pressure.
Summary of Interventions Experienced Around the Time to BirthCombining results from the initial and follow-up surveys yields a summary of inter-ventions that mothers experienced around the time of birth (Table 45). Overall, 53% experienced attempted labor induction, and 30% had a medically induced labor. Eighty-nine percent who experienced labor had electronic fetal monitoring, 83% of all mothers used pain medications, 50% experienced synthetic oxytocin, and 36% had artificially ruptured membranes. Eleven percent had assisted vaginal delivery with vacuum extraction or forceps, and 31% had a cesarean section. Rates of subcategories of these and of additional interventions among all mothers are also shown in Table 45.
LTM III: New Mothers Speak Out / Appendix D: Additional Results for Pregnancy and Birth Experiences
“For my first pregnancy, I
rarely saw my doctor and
he literally arrived in time
to ‘catch’ my baby as I
delivered. This time around
I used a different doc-
tor who was much more
involved in my pregnancy
and it just seemed to
make the whole experi-
ence much better. ”“Having the same doctor
for my past 2 pregnancies
has been wonderful. He is
always very attentive and
makes me feel comfort-
able to talk to him about
anything. ”“The nurse …. was
telling me to push ex-
tremely hard, which
resulted in a major tear.
I know that my body was
doing the work already
so I will not be pushing
so hard the next time. ”“The midwife wanted to
rush the birth. I wanted to
just listen to my body (I was
having no complications),
but she kept wanting to
hurry my pushing. ”

86
Table 45. Rates of intervention that mothers experienced around the time of birth
Base: all initial LTM III mothers n=2400 (unless otherwise specified)
Intervention Rate among all mothers
Labor induction
Attempted self-induction 29%
Self-induced labor* 13%**
Attempted medical induction 41%
Medically induced labor 30%
Total attempted induction 53%
Synthetic oxytocin (“Pitocin”)
To induce labor 26%
To speed up established labor 31%
To induce and/or speed up labor 50%
Breaking of membranes
To induce labor 16%
To speed up established labor 20%
To induce and/or speed up labor 36%
Electronic fetal monitoring (among mothers who experienced labor)
Continuously or for most of labor* 66%
Intermittently or as a baseline measure* 23%
Any electronic fetal monitoring* 89%
Pain medications
Epidural analgesia 67%
Narcotics 16%
General anesthesia 7%
Use of any pain medication 83%
Assisted vaginal birth
Vacuum extraction 7% (10%)***
Forceps 4% (6%)***
Vacuum extraction or forceps 11% (15%)***
→
LTM III: New Mothers Speak Out / Appendix D: Additional Results for Pregnancy and Birth Experiences

87
Intervention Rate among all mothers
Other pushing phase interventions
Directed pushing* 47% (71%)***
External pressure on belly to move baby down* 18% (28%)***
Episiotomy 12% (17%)***
Back-lying position for pushing out baby 47% (68%)***
Cesarean section
Initial (“primary”) 15%
Repeat cesarean 16%
Initial and repeat cesarean 31%
Other interventions
Intravenous drip 62%
One or more vaginal exams 51%
Bladder catheter 47%
Initial separation of baby for routine care 26%
*Base: all follow-up LTM III mothers n=1072**Most who reported that self-induction brought on labor also had medical induction
***Figures in parentheses are rates among vaginal births
Table 45 cont’d. Rates of intervention that mothers experienced around the time of birth
LTM III: New Mothers Speak Out / Appendix D: Additional Results for Pregnancy and Birth Experiences

88
About Childbirth Connection, Harris Interactive, and the W.K. Kellogg Foundation
About Childbirth Connection
Childbirth Connection is a national not-for-profit organization that was founded in 1918 as Maternity Center Association. Its mission is to improve the quality and value of maternity care through consumer engagement and health system transformation. Childbirth Connection promotes safe, effective, and satisfying evidence-based ma-ternity care and is a voice for the needs and interests of childbearing families.
Childbirth Connection’s national U.S. Listening to MothersSM surveys collect, measure, and give voice to women’s childbearing experiences. They are widely consulted sourc-es for understanding women’s pre-pregnancy, pregnancy, birth, and postpartum ex-periences and their knowledge, attitudes, and preferences about these matters. With the assistance of Harris Interactive, Childbirth Connection has carried out three Listening to MothersSM surveys over the past decade, along with follow-up surveys directed to participants of the second and third surveys. The survey reports, ques-tionnaires, and related resources are available at: www.childbirthconnection.org/listeningtomothers/.
Through the Transforming Maternity Care Partnership, Childbirth Connection works with stakeholders from across the health care system to implement priority recom-mendations from the consensus, direction-setting Blueprint for Action: Steps Toward a High-Quality, High-Value Maternity Care System. The Blueprint; a companion report, 2020 Vision for a High-Quality, High-Value Maternity Care System; and other re-sources for improvement and transformation are available at: transform.childbirth-connection.org.
About Harris Interactive
Harris Interactive is one of the largest market research and consulting firms in the world and the global leader in conducting online research. Harris is the first com-pany to have successfully built and launched an online market research panel. Since its inception in 1997, Harris Interactive has hosted more than 95 million completed online interviews from Harris Poll OnlineSM Panel respondents.
LTM III: New Mothers Speak Out / Childbirth Connection, Harris Interactive, and the W.K. Kellogg Foundation

89
Harris Interactive offers solutions in the areas of market and customer insight, cor-porate brand and reputation strategy, as well as marketing, advertising, public rela-tions, and communications research. Its expertise covers a wide range of industries including health care, technology, public affairs, energy, telecommunications, finan-cial services, insurance, media, retail, restaurant, and consumer packaged goods.
Serving clients in more than 196 countries and territories through its North American and European offices, Harris specializes in delivering research solutions that help Harris and its clients stay ahead of what’s next.
About the W.K. Kellogg Foundation
The W.K. Kellogg Foundation, founded in 1930 by breakfast cereal pioneer Will Keith Kellogg, is among the largest philanthropic foundations in the United States. Based in Battle Creek, Michigan, WKKF engages with communities in priority places across the country and internationally to create conditions that propel vulnerable children to realize their full potential in school, work, and life.
LTM III: New Mothers Speak Out / Childbirth Connection, Harris Interactive, and the W.K. Kellogg Foundation