list of appendices - california department of state … · 28/11/2011 · list of appendices ....
TRANSCRIPT

List of Appendices
Introduction
Appendix 0.A: Team Biographies
Appendix 0.B: Compilation of Recommendations
Section 1: Summary of Major Findings
Section 2: Management Assessment
Appendix 2.A: Existing DMH Headquarters Organization Chart
Appendix 2.B: Proposed High-level DMH Headquarters Organization Chart
Section 3: Organizational Assessment
Appendix 3.A: Redirected Positions and Costs: Hospital Positions Borrowed by
Headquarters
Appendix 3.B: State Hospital and Psychiatric Programs Organization Charts (Executive
Offices and Fiscal Branches)
Section 4: Weak Administrative Processes
Appendix 4.A: Supplemental Internal Controls Audit Information
Appendix 4.B: Cash Flow Form
Appendix 4.C: Comparison of 7A to Staffing Standards (placeholder)
Appendix 4.D: Allocation Rollup
Appendix 4.E: Sample Allocation Sheets
Appendix 4.F: Funds 872 and 942 Data
Section 5: Information Technology
Section 6: Medical and Other Patient Care Issues
Appendix 6.A: State Hospital and Psychiatric Programs Organization Charts (Medical
Staff)
Appendix 6.B: Filling Behind—Cost of registry, temporary help, and overtime compared
to state staff cost.
Appendix 6.C: Patients by Level of Care, By Hospital
Appendix 6.D: Average Length of Stay, By Hospital
Appendix 6.E: Treatment Team List
Appendix 6.F: Pharmaceutical Advisory Board Charter
Appendix 6.G: Common Drug Formulary Committee Charter
151 of 271

Appendix 6.H: Psychopharmacology Advisory Committee Policy Directive
Appendix 6.I: CALSTARS Outside Medical, Registry, and Pharmaceutical Costs
Appendix 6.J: State Hospital Reported Outside Medical Cost Summary
Section 7: Hospital Deficit
Appendix 7.A: Records for Prior Year Deficiency
Appendix 7.B: Records for Current Year Deficiency
Appendix 7.C: Tables Comparing Deficit and Average Cost per Patient by Hospital
Appendix 7.D: PLP Cost Calculation
Appendix 7.E: Board of Control Claims Data
Appendix 7.F: Information from Enhancement Plan Budget Change Proposal
Appendix 7.G: List of Enhancement Plan Redirected Positions
Appendix 7.H: CALSTARS Summary of Workers Compensation, Temporary Help,
Overtime, and Registry Services
Appendix 7.I: Supplemental DMH State Hospital Estimate Review Information
Section 8: Other Issues
Appendix 8.A: Headquarters Deficit Summary
Appendix 8.B: Special Repairs List
152 of 271

Appendix 0.A: Project Team
The project team altogether has 225 years of state service.
Irene Briggs has worked 16 years for the State, 8 years of which have been managing both
budget and policy at the Department of Mental Health and Department of Transportation. The
majority of her work experience is in managing departmental budget development and revenue
forecasting functions.
Gloria Deroo worked 34 years for the State, 33 years of which were with the Department of
Forestry and Fire Protection in various administrative program areas. The majority of her work
experience is in personnel, budgeting, business services and program administration.
Roger Desrosiers worked 31 years for the State, 28 years of which were in managing accounting
operations for Department of Forestry and Fire Protection, Department of General Services,
California Department of Corrections & Rehabilitation, and Department of Motor Vehicles. The
majority of work experience is in accounts receivable, accounts payable, cash receipts, cost
accounting, fiscal systems analysis and year-end financial statement preparation.
Christina Edens has worked 13 years for the State, 12 of which were as an analyst and manager
at the Department of Mental Health. Her work experience includes program administration,
contracts, budgets, accounting and operations.
Catherine Hendon has a master’s degree in counseling psychology and a Project Management
Professional certification. She has worked 3 years for the State as an analyst and manager at
the Department of Mental Health. The majority of her work experience is in strategic planning
and project management.
Carla Lenerd has 30 years of service with the State, 15 years as an executive with the State
Controller’s Office and EdFund. The majority of her work experience is in accounting,
budgeting, debt service management, and general administration.
Manny Mateo worked 42 years for the State, 34 years of which were as an executive in the
Department of Finance, the Attorney General's Office, the State Treasurer's Office, the State
Controller's Office, and the former Department of Health. The majority of his work experience
is fiscal policy analysis, accounting, budgeting, state bond negotiation and trust management,
and general administration.
Shelley Mateo worked 26 years for the State, 18 years of which were as an executive in the
Department of Finance and the Department of Forestry and Fire Protection. The majority of
her work experience is in fiscal policy analysis, budgeting and general administration.
153 of 271

Valerie Varzos is a Certified Public Accountant with a Masters in Business Administration. Her
career includes 30 years in State service, with 10 years of experience auditing state and local
governments as well as the health care industry prior to her career in information technology.
During her career with the State, Ms. Varzos specialized in the development of government
financial and administrative systems. She both developed systems and provided independent
oversight to some of the largest and most complex state projects. Her career includes working
at several State agencies including the State Controller’s Office, the Department of Finance, the
California Technology Agency, the Department of Health Care Services, and the Department of
Motor Vehicles.
154 of 271

Appendix 0.B: Compilation of Recommendations
Recommendations Reference Item # 1. Management Assessment: General Management Standards of personal responsibility: The executive leadership must articulate and continually
reinforce performance standards of personal responsibility and openness. Update duty statements for fiscal responsibility. Modify senior management duty statements to
add specific responsibilities for fiscal and internal controls. Add EDs to senior management team. Increase the hospitals’ presence on the senior management
team. Deputy director structure: Revise the deputy director structure by adding a deputy director of
operations to whom the executive directors report. This deputy should have the specific mandate of raising to the executive office any conflicts between hospitals’ mission requirements and budget realities, and devising plans to resolve such conflicts. Appendices 2.A and 2.B show the existing and proposed deputy structure with possible functional responsibilities for the deputy director of operations. Appendix 2.B also includes a proposed clinical deputy that is discussed in Section 3 (Organizational Assessment) and Section 6 (Medical Issues).
Communication: Remove communication barriers between headquarters’ divisions and between headquarters and the hospitals.
Address poor service orientation at headquarters.
Develop a cohesive body of policies and procedures, ensuring hospital input.
Develop a plan for structured sharing of management information between levels of the organization. Although information technology is key to that goal, lack of department-wide information systems should not prevent instituting regular management reporting.
As the budget permits, reinstitute meetings between organizational levels of the department. Hold these meetings at hospitals whenever practical so that headquarters managers and staff members have the opportunity to learn the hospital mission.
Section 2, p. 18
1.1
1.2
1.3
1.4
1.5
1.5a 1.5b 1.5c
1.5d
155 of 271

Recommendations Reference Item # 2. Management Assessment: Analytic Staffing Add budget policy staff: Size the budget office to 1) review budget change proposals for policy
coherence and completeness of cost/benefit considerations, 2) review hospitals’ expenditure projections to form an independent assessment of accuracy, and 3) advise the executive directors, the deputies, and the executive office of likely impacts of external and internal budget pressures.
Add bed utilization planning function: Create a bed utilization unit that addresses capacity planning and patient movement by commitment type and operational needs (e.g., violence, geriatrics, skilled nursing needs). The unit would recommend strategies for matching facility design and usage to population acuity characteristics, and would be a major source of input to capital outlay planning. The team sees this function placed under the deputy director of operations.
Add cost containment analysis: Create a cost containment unit that systematically collects cost savings concepts, developing them into full proposals with feasibility assessments and cost/benefit analysis. Vest this function with the deputy director of operations since that division has the most in-depth knowledge of hospital operations.
Section 3, p. 22
2.1
2.2
2.3
3. Organizational Assessment: Budgeting Budget office/divisions Fill budget office vacancies. To ensure timely submission of budget documents to Finance, the
budget office must immediately fill all vacancies. It also needs additional temporary help to meet training and workload demands this fall.
Instill correct ethic. The administrative division must espouse and practice a strong ethic for correct budget management and reporting of problems.
Provide staff for hospital oversight. Staff the headquarters budget office correctly for working with hospitals and providing budget policy assistance. This is work that previously was not performed.
Establish headquarters unit budgets. Prepare and distribute unit allocations as quickly as possible after fall budget preparation is completed and training requirements are met. Begin with budgeting at the division level to ease the transition. (The draft unit allotments previously prepared by the budget office but never distributed, are too detailed.)
Train headquarters units to manage allocations. Train the headquarters divisions in budget
Section 3, p. 27
3.1
3.2
3.3
3.4
3.5
156 of 271

Recommendations Reference Item # management. Ensure that each division has an administrative assistant to assist with transaction reconciliation and expenditure control. This same assistant could assist the division with other administrative processes.
LTCS fiscal unit Refocus fiscal unit. Reorganize the duties of the fiscal unit so that it no longer performs budget
office functions and focuses instead on program cost analysis and cost containment. Move that revised function from the LTCS division to the deputy director of operations or to the administrative division.
Hospitals’ fiscal offices Improve hospitals’ budget management. Develop a plan to gradually increase the sophistication
of hospital budget management.
Create a hospital accounting self-governance group. Establish a hospital-based fiscal advisory position by expanding the duties of one of the fiscal officers. Task the fiscal officers as a group to develop a plan for increasing hospital budgeting strength, under the leadership of the fiscal advisory position.
Give the group necessary tools. Provide the hospitals with appropriate budget management tools. Share hospitals’ best desktop budget systems. Share headquarters tools (such as the Excel version of the Schedule 8) with the hospitals.
Staff hospital budgeting correctly. As hospital budget systems evolve in complexity, staff them correctly.
Begin by returning the fiscal positions that headquarters has borrowed from the hospitals.
Perform a workload analysis at each step of system expansion and solicit resources as needed.
3.6
3.7
3.7a
3.7b
3.8
4. Organizational Assessment: Accounting Headquarters accounting office Instill correct FISMA ethic. The administrative division must instill in the accounting office, from
the top down, a strong ethic for fiscal management and reporting of problems (Fiscal Integrity and State Manager’s Accountability Act of 1983—FISMA).
Section 3, p. 30
4.1
157 of 271
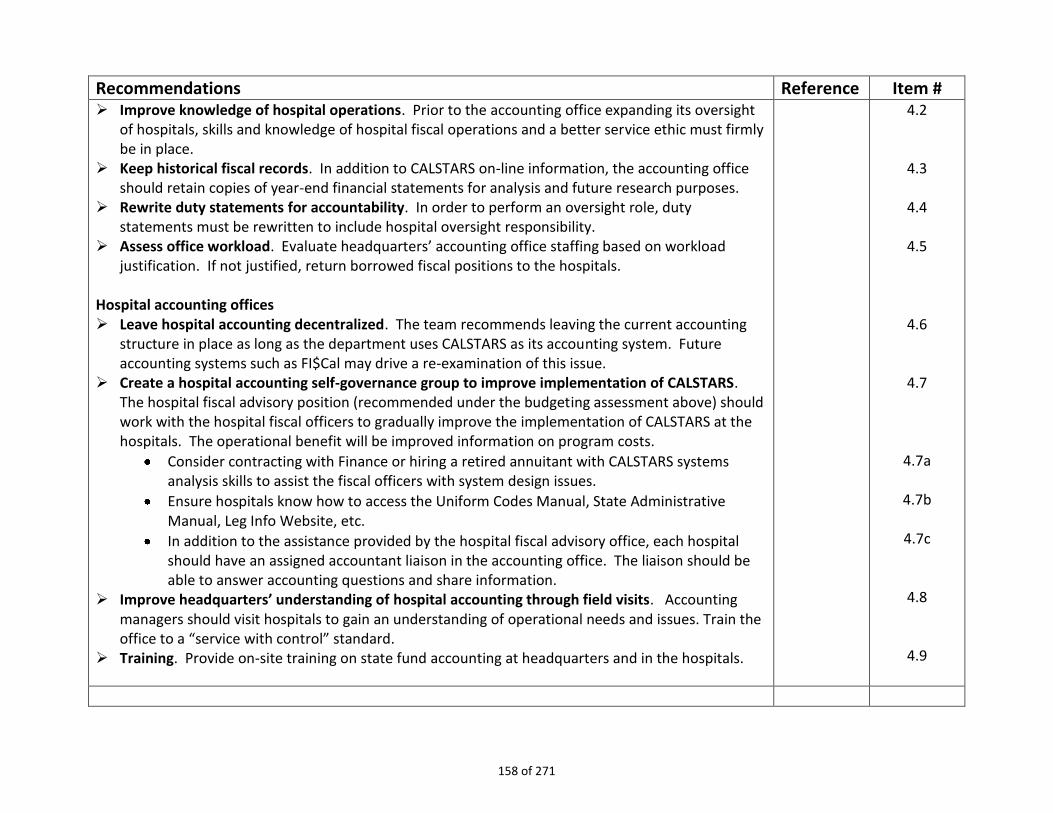
Recommendations Reference Item # Improve knowledge of hospital operations. Prior to the accounting office expanding its oversight
of hospitals, skills and knowledge of hospital fiscal operations and a better service ethic must firmly be in place.
Keep historical fiscal records. In addition to CALSTARS on-line information, the accounting office should retain copies of year-end financial statements for analysis and future research purposes.
Rewrite duty statements for accountability. In order to perform an oversight role, duty statements must be rewritten to include hospital oversight responsibility.
Assess office workload. Evaluate headquarters’ accounting office staffing based on workload justification. If not justified, return borrowed fiscal positions to the hospitals.
Hospital accounting offices Leave hospital accounting decentralized. The team recommends leaving the current accounting
structure in place as long as the department uses CALSTARS as its accounting system. Future accounting systems such as FI$Cal may drive a re-examination of this issue.
Create a hospital accounting self-governance group to improve implementation of CALSTARS. The hospital fiscal advisory position (recommended under the budgeting assessment above) should work with the hospital fiscal officers to gradually improve the implementation of CALSTARS at the hospitals. The operational benefit will be improved information on program costs.
Consider contracting with Finance or hiring a retired annuitant with CALSTARS systems analysis skills to assist the fiscal officers with system design issues.
Ensure hospitals know how to access the Uniform Codes Manual, State Administrative Manual, Leg Info Website, etc.
In addition to the assistance provided by the hospital fiscal advisory office, each hospital should have an assigned accountant liaison in the accounting office. The liaison should be able to answer accounting questions and share information.
Improve headquarters’ understanding of hospital accounting through field visits. Accounting managers should visit hospitals to gain an understanding of operational needs and issues. Train the office to a “service with control” standard.
Training. Provide on-site training on state fund accounting at headquarters and in the hospitals.
4.2
4.3
4.4
4.5
4.6
4.7
4.7a
4.7b
4.7c
4.8
4.9
158 of 271

Recommendations Reference Item # 5. Organizational Assessment: Personnel
More decentralization. Where allowable, decentralize processing tasks more completely,
reshaping headquarters into a “service with control” role. Resolve exam blockage. Negotiate a solution with SPB that leaves the workload for job analysis
within practical reach of the department. The problem is impeding hospital operations. Reduce headquarters processing times. Evaluate turn-around times in the classification and pay
unit.
Section 3, p. 33
5.1
5.2
5.3
6. Organizational Assessment: Contracting Delegate more completely. Shorten the contract approval process. Reduce the contract approval time to no more than three
months. Provide more assistance. Assist the hospitals in addressing contract needs. Accountability through better policies and procedures. Rely on written policies and procedures
for accountability, created collaboratively, rather than time-consuming review loops at headquarters with shifting standards.
Formalize the business services officers group. Assign a permanent legal liaison to the group for continuity in the provision of contracting legal advice.
Reassign contract signature responsibilities. Decrease bottlenecking by placing headquarters’ contract signature responsibilities with the business services office, not with the administrative deputy director.
Update the signature cards for contracts so that hospitals can take advantage of the $250,000 contract threshold.
Conduct audits: Charge headquarters with conducting periodic audits of hospitals’ contracting practices.
Help hospitals track contract status. Create a system to communicate contract location and status. This function will be automated in the new Fi$Cal system, but implementation of that system in DMH may be at least five years away.
More centralized contracting. Consider broader use of centralized contracting in certain areas (such as for lab services) for cost savings, but do so collaboratively with the hospitals and avoid
Section 3, p. 35
6.1 6.2/25.2
6.3 6.4
6.5
6.6/26.1
6.7
6.8
6.9/25.3
6.10
159 of 271
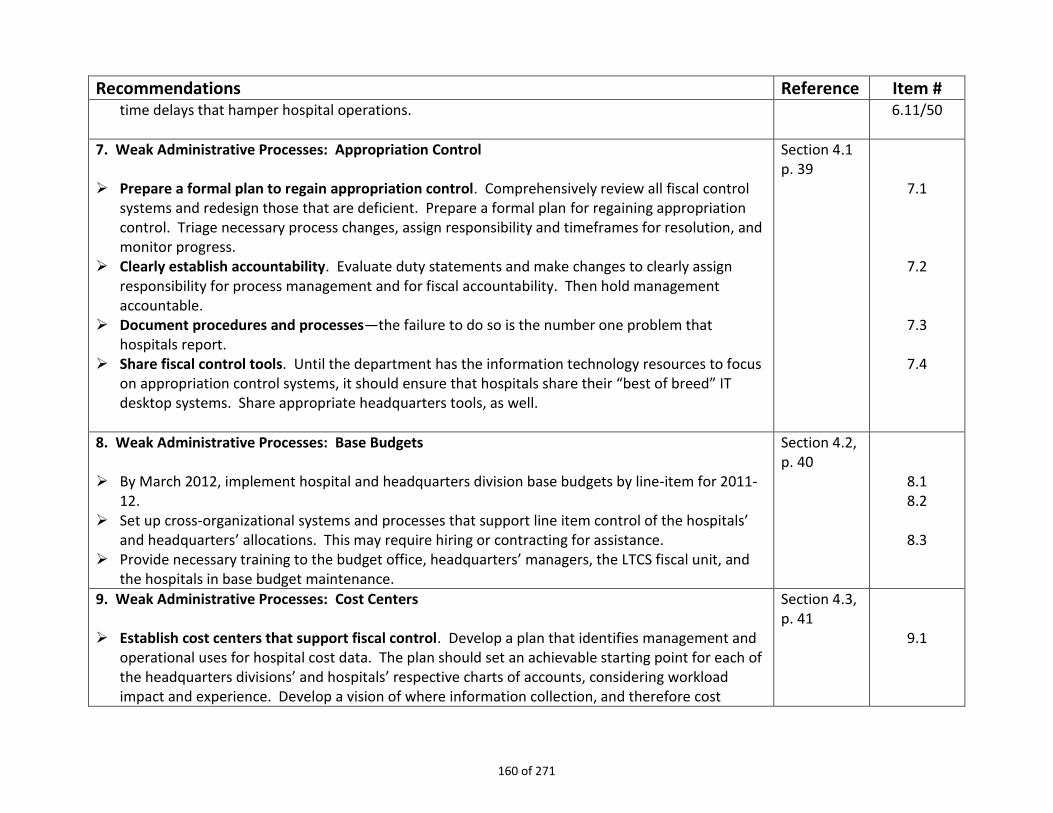
Recommendations Reference Item # time delays that hamper hospital operations. 6.11/50
7. Weak Administrative Processes: Appropriation Control
Prepare a formal plan to regain appropriation control. Comprehensively review all fiscal control systems and redesign those that are deficient. Prepare a formal plan for regaining appropriation control. Triage necessary process changes, assign responsibility and timeframes for resolution, and monitor progress.
Clearly establish accountability. Evaluate duty statements and make changes to clearly assign responsibility for process management and for fiscal accountability. Then hold management accountable.
Document procedures and processes—the failure to do so is the number one problem that hospitals report.
Share fiscal control tools. Until the department has the information technology resources to focus on appropriation control systems, it should ensure that hospitals share their “best of breed” IT desktop systems. Share appropriate headquarters tools, as well.
Section 4.1 p. 39
7.1
7.2
7.3
7.4
8. Weak Administrative Processes: Base Budgets By March 2012, implement hospital and headquarters division base budgets by line-item for 2011-
12. Set up cross-organizational systems and processes that support line item control of the hospitals’
and headquarters’ allocations. This may require hiring or contracting for assistance. Provide necessary training to the budget office, headquarters’ managers, the LTCS fiscal unit, and
the hospitals in base budget maintenance.
Section 4.2, p. 40
8.1 8.2
8.3
9. Weak Administrative Processes: Cost Centers Establish cost centers that support fiscal control. Develop a plan that identifies management and
operational uses for hospital cost data. The plan should set an achievable starting point for each of the headquarters divisions’ and hospitals’ respective charts of accounts, considering workload impact and experience. Develop a vision of where information collection, and therefore cost
Section 4.3, p. 41
9.1
160 of 271
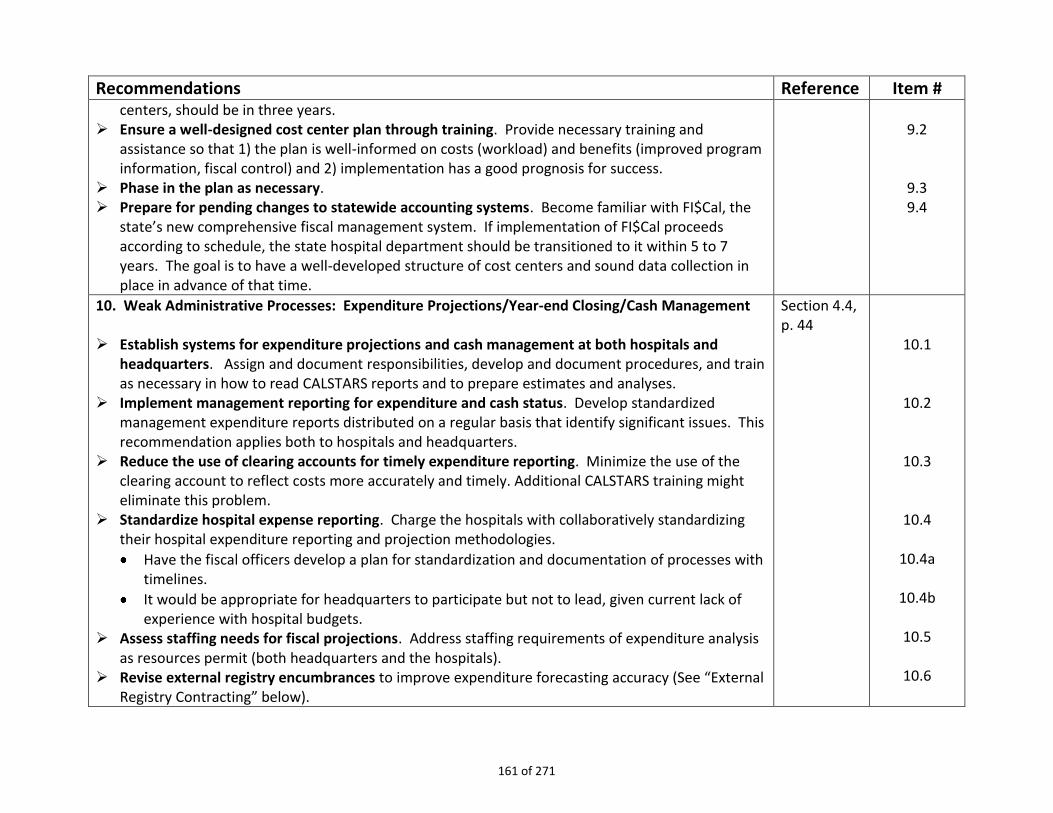
Recommendations Reference Item # centers, should be in three years.
Ensure a well-designed cost center plan through training. Provide necessary training and assistance so that 1) the plan is well-informed on costs (workload) and benefits (improved program information, fiscal control) and 2) implementation has a good prognosis for success.
Phase in the plan as necessary. Prepare for pending changes to statewide accounting systems. Become familiar with FI$Cal, the
state’s new comprehensive fiscal management system. If implementation of FI$Cal proceeds according to schedule, the state hospital department should be transitioned to it within 5 to 7 years. The goal is to have a well-developed structure of cost centers and sound data collection in place in advance of that time.
9.2
9.3 9.4
10. Weak Administrative Processes: Expenditure Projections/Year-end Closing/Cash Management Establish systems for expenditure projections and cash management at both hospitals and
headquarters. Assign and document responsibilities, develop and document procedures, and train as necessary in how to read CALSTARS reports and to prepare estimates and analyses.
Implement management reporting for expenditure and cash status. Develop standardized management expenditure reports distributed on a regular basis that identify significant issues. This recommendation applies both to hospitals and headquarters.
Reduce the use of clearing accounts for timely expenditure reporting. Minimize the use of the clearing account to reflect costs more accurately and timely. Additional CALSTARS training might eliminate this problem.
Standardize hospital expense reporting. Charge the hospitals with collaboratively standardizing their hospital expenditure reporting and projection methodologies.
Have the fiscal officers develop a plan for standardization and documentation of processes with timelines.
It would be appropriate for headquarters to participate but not to lead, given current lack of experience with hospital budgets.
Assess staffing needs for fiscal projections. Address staffing requirements of expenditure analysis as resources permit (both headquarters and the hospitals).
Revise external registry encumbrances to improve expenditure forecasting accuracy (See “External Registry Contracting” below).
Section 4.4, p. 44
10.1
10.2
10.3
10.4
10.4a
10.4b
10.5
10.6
161 of 271
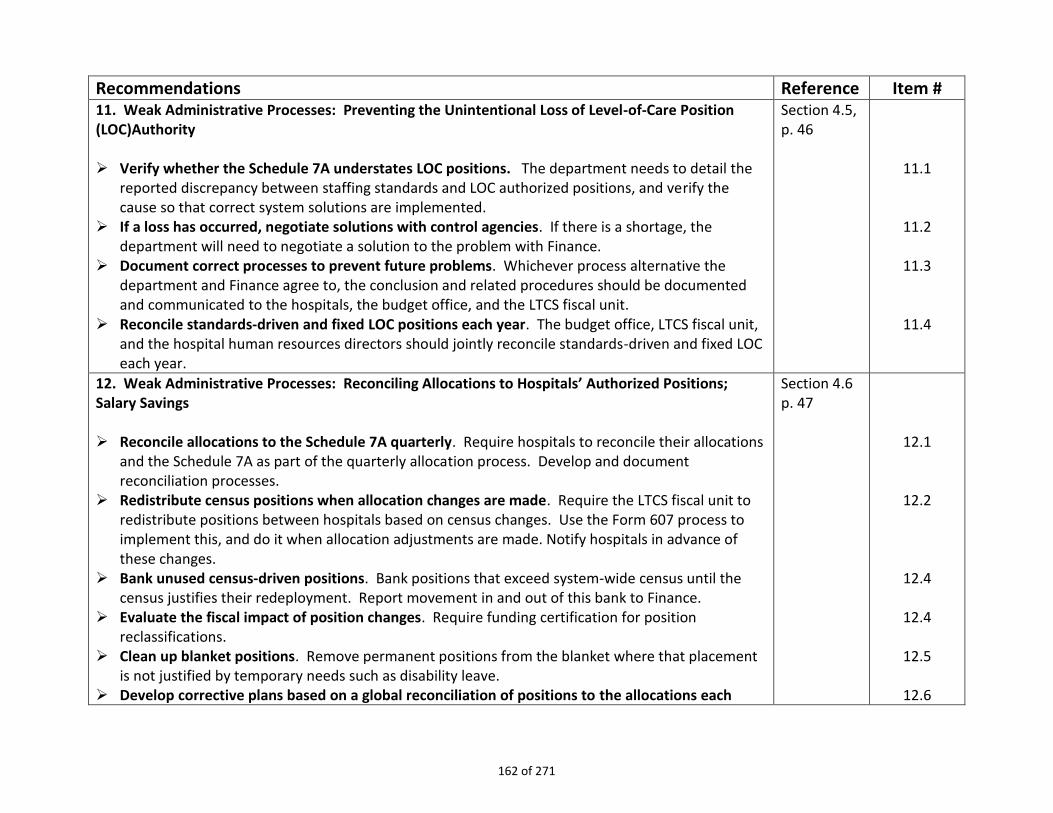
Recommendations Reference Item # 11. Weak Administrative Processes: Preventing the Unintentional Loss of Level-of-Care Position (LOC)Authority Verify whether the Schedule 7A understates LOC positions. The department needs to detail the
reported discrepancy between staffing standards and LOC authorized positions, and verify the cause so that correct system solutions are implemented.
If a loss has occurred, negotiate solutions with control agencies. If there is a shortage, the department will need to negotiate a solution to the problem with Finance.
Document correct processes to prevent future problems. Whichever process alternative the department and Finance agree to, the conclusion and related procedures should be documented and communicated to the hospitals, the budget office, and the LTCS fiscal unit.
Reconcile standards-driven and fixed LOC positions each year. The budget office, LTCS fiscal unit, and the hospital human resources directors should jointly reconcile standards-driven and fixed LOC each year.
Section 4.5, p. 46
11.1
11.2
11.3
11.4
12. Weak Administrative Processes: Reconciling Allocations to Hospitals’ Authorized Positions; Salary Savings Reconcile allocations to the Schedule 7A quarterly. Require hospitals to reconcile their allocations
and the Schedule 7A as part of the quarterly allocation process. Develop and document reconciliation processes.
Redistribute census positions when allocation changes are made. Require the LTCS fiscal unit to redistribute positions between hospitals based on census changes. Use the Form 607 process to implement this, and do it when allocation adjustments are made. Notify hospitals in advance of these changes.
Bank unused census-driven positions. Bank positions that exceed system-wide census until the census justifies their redeployment. Report movement in and out of this bank to Finance.
Evaluate the fiscal impact of position changes. Require funding certification for position reclassifications.
Clean up blanket positions. Remove permanent positions from the blanket where that placement is not justified by temporary needs such as disability leave.
Develop corrective plans based on a global reconciliation of positions to the allocations each
Section 4.6 p. 47
12.1
12.2
12.4
12.4
12.5
12.6
162 of 271

Recommendations Reference Item # year. Require that the hospitals, budget office, and LTCS fiscal unit reconcile the staffing standards to the Schedule 7A, and the Schedule 7A to available funding for each hospital at the beginning of each year. Discrepancies between staffing standards, position authority, and funding, beyond normal salary savings, should be identified to the hospitals and the senior management team and a corrective plan developed.
Train hospitals on correct management of salary savings. The current approach focuses on the listing of authorized positions rather than actual funding availability.
12.7
13. Weak Administrative Processes: Reconciliation of Hospitals’ Allocations, the Hospital Appropriation, and State Controller Accounts Regain control over reconciliation: Assign responsibilities and document the process of reconciling
the LTCS fiscal unit’s allocation data with the budget offices’ appropriation records and with the State Controller’s sub-appropriations for the hospitals.
Keep involved parties informed. When funds are moved between sub-appropriations at year-end to ensure payment of payrolls, make sure the LTCS fiscal unit and hospitals are informed.
Provide reasons for changes. Release allocation changes with detailed instructions for the correct way to load the adjustment and the reason for the change. Document this process.
Section 4.7, p. 48
13.1
13.2
13.3
14. Weak Administrative Processes: Staffing standards used for the population BCP Update staffing standards to better reflect actual operations. Update the methodology for the
population BCP to include a more complete range of staffing requirements for the department (admission suite staffing, enhanced observations, acuity staffing). This issue connects with the deficit. See also staffing recommendations for the pharmacy and physical medicine programs below under “medical issues.”
Make corresponding changes to allocations. The allocation process should parallel any changes made to the population BCP.
Section 4.8. p. 50
14.1
14.2
15. Weak Administrative Processes: Planning and resource acquisition for operating expenses Require each hospital to prepare an annual analysis of its operating expenses versus budget, and to
submit a copy to the LTCS fiscal unit and the budget office. Use a standard format developed collaboratively by headquarters and the hospitals. Present this analysis to Finance with the annual
Section 4.9 p. 50
15
163 of 271

Recommendations Reference Item # population BCP, regardless of funding policy to establish a history of program need.
16. Weak Administrative Processes: Resource Acquisition for NLOC positions Analyze NLOC staffing needs and be prepared to request funding adjustments when budget
policy permits. Use the “build it and they will come” approach for resource aquisition. Prepare workload standards for programs such as hospital police in anticipation of the time when funding may be available. Workload standards can also assist with program management.
Pilot this effort. Charge the hospital administrators with selecting one or two areas to pilot this effort so that workload impact is manageable.
Section 4.10, p. 51
16.1
16.2
17. Weak Administrative Processes: Deficit Management Prepare a program of deficit management. Using guidelines provided in the report, assign the
hospital administrators, the accounting office, and LTCS fiscal unit, and the budget office the task of identifying how the department can best manage a deficit situation. Establish a due date of December 15th, 2011, since cash shortages may occur this winter.
Section 4.11, p. 52
17
18. Weak Administrative Processes: Internal Controls Auditing/Response to Audits Use limited resources wisely. Make best use of limited resources by providing coordination
assistance for the auditor and reshaping her duties to follow up on major audit findings in order to assess whether compliance was achieved.
Use a team approach. Consider a team approach to reviewing compliance with major audit finding. These teams might be drawn from the hospitals.
Document a plan. Draft a plan and procedures to implement better enforcement of compliance with audit findings.
Section 4.12, p. 53
18.1
18.2
18.3
19. Weak Administrative Processes: Incorrect Application of Benefit Rates Document and train staff in benefit costing. Document processes and train hospital and all budget
office staff on correct calculation and application of benefit rates. Plan a technical review of the budget. Conduct a technical analysis of the base budget in the
spring of 2010 (see recommendations under “Hospital Deficit” below.)
Section 4.13, p. 54
19.2
19.3
164 of 271
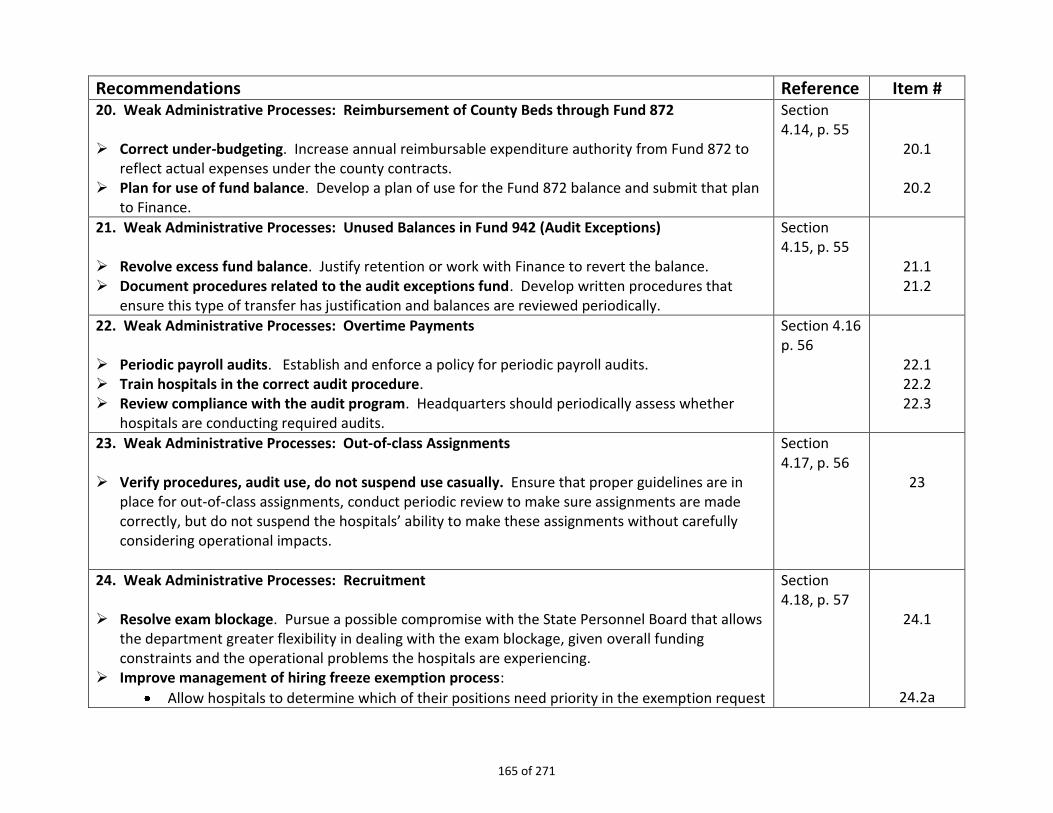
Recommendations Reference Item # 20. Weak Administrative Processes: Reimbursement of County Beds through Fund 872 Correct under-budgeting. Increase annual reimbursable expenditure authority from Fund 872 to
reflect actual expenses under the county contracts. Plan for use of fund balance. Develop a plan of use for the Fund 872 balance and submit that plan
to Finance.
Section 4.14, p. 55
20.1
20.2
21. Weak Administrative Processes: Unused Balances in Fund 942 (Audit Exceptions) Revolve excess fund balance. Justify retention or work with Finance to revert the balance. Document procedures related to the audit exceptions fund. Develop written procedures that
ensure this type of transfer has justification and balances are reviewed periodically.
Section 4.15, p. 55
21.1 21.2
22. Weak Administrative Processes: Overtime Payments Periodic payroll audits. Establish and enforce a policy for periodic payroll audits. Train hospitals in the correct audit procedure. Review compliance with the audit program. Headquarters should periodically assess whether
hospitals are conducting required audits.
Section 4.16 p. 56
22.1 22.2 22.3
23. Weak Administrative Processes: Out-of-class Assignments Verify procedures, audit use, do not suspend use casually. Ensure that proper guidelines are in
place for out-of-class assignments, conduct periodic review to make sure assignments are made correctly, but do not suspend the hospitals’ ability to make these assignments without carefully considering operational impacts.
Section 4.17, p. 56
23
24. Weak Administrative Processes: Recruitment Resolve exam blockage. Pursue a possible compromise with the State Personnel Board that allows
the department greater flexibility in dealing with the exam blockage, given overall funding constraints and the operational problems the hospitals are experiencing.
Improve management of hiring freeze exemption process:
Allow hospitals to determine which of their positions need priority in the exemption request
Section 4.18, p. 57
24.1
24.2a
165 of 271
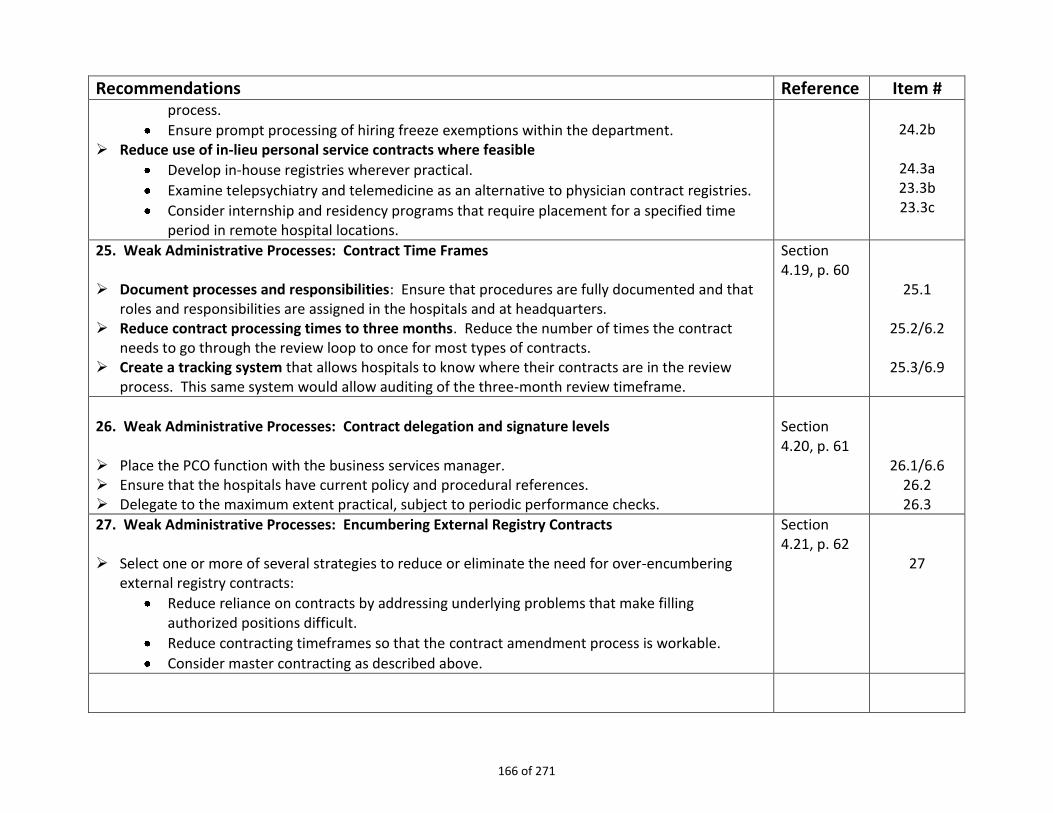
Recommendations Reference Item # process.
Ensure prompt processing of hiring freeze exemptions within the department. Reduce use of in-lieu personal service contracts where feasible
Develop in-house registries wherever practical.
Examine telepsychiatry and telemedicine as an alternative to physician contract registries.
Consider internship and residency programs that require placement for a specified time period in remote hospital locations.
24.2b
24.3a 23.3b 23.3c
25. Weak Administrative Processes: Contract Time Frames Document processes and responsibilities: Ensure that procedures are fully documented and that
roles and responsibilities are assigned in the hospitals and at headquarters. Reduce contract processing times to three months. Reduce the number of times the contract
needs to go through the review loop to once for most types of contracts. Create a tracking system that allows hospitals to know where their contracts are in the review
process. This same system would allow auditing of the three-month review timeframe.
Section 4.19, p. 60
25.1
25.2/6.2
25.3/6.9
26. Weak Administrative Processes: Contract delegation and signature levels Place the PCO function with the business services manager. Ensure that the hospitals have current policy and procedural references. Delegate to the maximum extent practical, subject to periodic performance checks.
Section 4.20, p. 61
26.1/6.6 26.2 26.3
27. Weak Administrative Processes: Encumbering External Registry Contracts Select one or more of several strategies to reduce or eliminate the need for over-encumbering
external registry contracts:
Reduce reliance on contracts by addressing underlying problems that make filling authorized positions difficult.
Reduce contracting timeframes so that the contract amendment process is workable.
Consider master contracting as described above.
Section 4.21, p. 62
27
166 of 271

Recommendations Reference Item # 28. Information Technology: Organizing Solutions The department should organize solutions in the following categories:
Quick wins – no funding required
Longer term improvements – no funding required
Allocation of existing resources to highest priority efforts, including cost saving proposals. Recognize that redirecting existing resources will require the elimination of corresponding existing workload or providing additional temporary help until the savings is realized.
Identification of high priority efforts, including cost saving proposals that require additional funding
Section 5, p. 84
28
29. Information Technology: Organization Comply with GC 11545; all IT resources are the responsibility of the CIO including telecom. Manage the IT organization as a single division but recognize the benefits of statewide location
with IT staff co-located with the primary customer, the hospital staff. Standardize existing software. Leverage existing resources by standardizing existing software and
selecting “best of breed” for each function. Share solution successes between the organizations. Regionalize IT to provide local leadership, support, synergy, and provide day to day IT operational
services to the psychiatric programs. Reevaluate IT classifications statewide to ensure position duties are aligned with the position
classification. Reevaluate workload and staffing in response to the demands of the hospitals; recognize 24/7
hospital operations in the evaluation
Section 5, p. 84
29.1 29.2
29.3
29.4
29.5
29.6
30. Information Technology: IT Budget Budget development timeframes. The IT budget should be developed 18 to 24 months in advance
of the budget year. Follow approval and funding cycles. IT project budgets must follow the project approval cycle and
the Legislative funding cycle. Add necessary IT administrative staff. IT Administration should include an IT budget and IT project
Section 5, p. 84
30.1
30.2
30.3
167 of 271
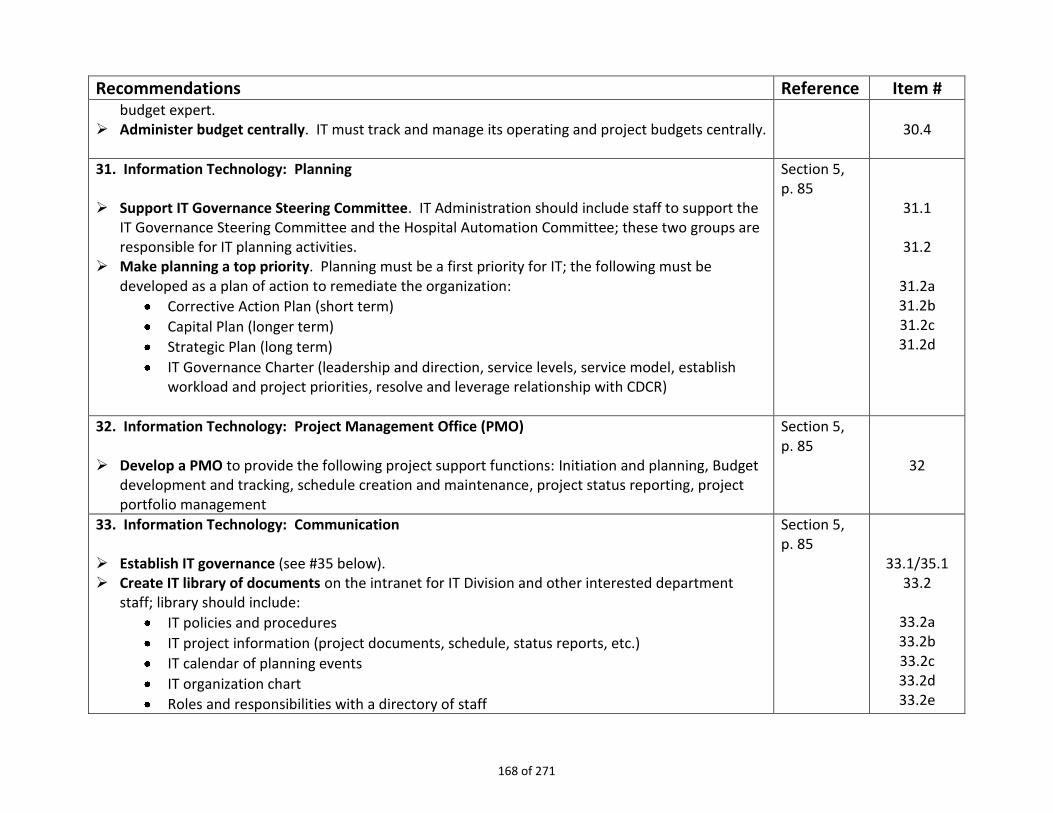
Recommendations Reference Item # budget expert.
Administer budget centrally. IT must track and manage its operating and project budgets centrally.
30.4
31. Information Technology: Planning Support IT Governance Steering Committee. IT Administration should include staff to support the
IT Governance Steering Committee and the Hospital Automation Committee; these two groups are responsible for IT planning activities.
Make planning a top priority. Planning must be a first priority for IT; the following must be developed as a plan of action to remediate the organization:
Corrective Action Plan (short term)
Capital Plan (longer term)
Strategic Plan (long term)
IT Governance Charter (leadership and direction, service levels, service model, establish workload and project priorities, resolve and leverage relationship with CDCR)
Section 5, p. 85
31.1
31.2
31.2a 31.2b 31.2c 31.2d
32. Information Technology: Project Management Office (PMO) Develop a PMO to provide the following project support functions: Initiation and planning, Budget
development and tracking, schedule creation and maintenance, project status reporting, project portfolio management
Section 5, p. 85
32
33. Information Technology: Communication Establish IT governance (see #35 below). Create IT library of documents on the intranet for IT Division and other interested department
staff; library should include:
IT policies and procedures
IT project information (project documents, schedule, status reports, etc.)
IT calendar of planning events
IT organization chart
Roles and responsibilities with a directory of staff
Section 5, p. 85
33.1/35.1 33.2
33.2a 33.2b 33.2c 33.2d 33.2e
168 of 271
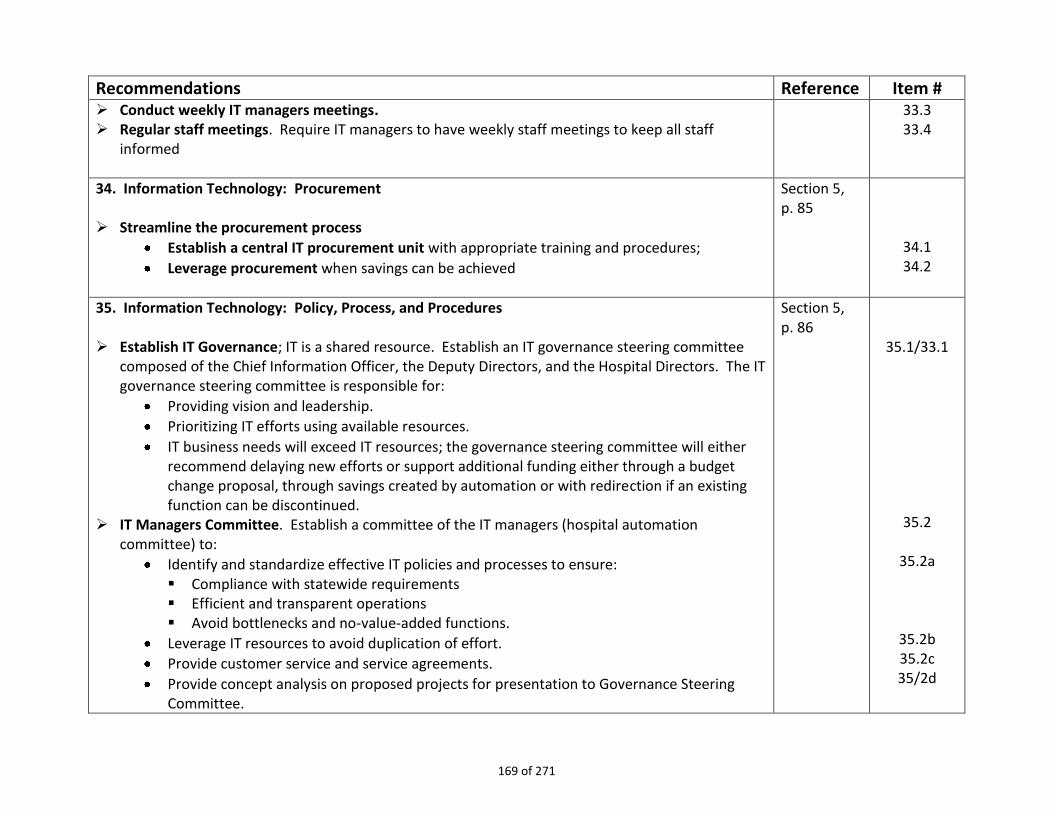
Recommendations Reference Item # Conduct weekly IT managers meetings. Regular staff meetings. Require IT managers to have weekly staff meetings to keep all staff
informed
33.3 33.4
34. Information Technology: Procurement Streamline the procurement process
Establish a central IT procurement unit with appropriate training and procedures;
Leverage procurement when savings can be achieved
Section 5, p. 85
34.1 34.2
35. Information Technology: Policy, Process, and Procedures Establish IT Governance; IT is a shared resource. Establish an IT governance steering committee
composed of the Chief Information Officer, the Deputy Directors, and the Hospital Directors. The IT governance steering committee is responsible for:
Providing vision and leadership.
Prioritizing IT efforts using available resources.
IT business needs will exceed IT resources; the governance steering committee will either recommend delaying new efforts or support additional funding either through a budget change proposal, through savings created by automation or with redirection if an existing function can be discontinued.
IT Managers Committee. Establish a committee of the IT managers (hospital automation committee) to:
Identify and standardize effective IT policies and processes to ensure: Compliance with statewide requirements Efficient and transparent operations Avoid bottlenecks and no-value-added functions.
Leverage IT resources to avoid duplication of effort.
Provide customer service and service agreements.
Provide concept analysis on proposed projects for presentation to Governance Steering Committee.
Section 5, p. 86
35.1/33.1
35.2
35.2a
35.2b 35.2c 35/2d
169 of 271

Recommendations Reference Item # 36. Application Systems Support and Stabilization
Develop documentation for systems in production now. Develop a plan that stabilizes the existing clinical application systems, improves performance
and work with customers to identify areas of functionality that could be streamlined. Ensure that the existing staff are trained or fill with qualified staff that maintain the 14
statewide systems. Develop a current and executable disaster recovery plan for the existing clinical applications. Identify an application architect to develop software development standards including coding,
documentation, and development processes.
Section 5, p. 86
36.1 36.2
36.3
36.4 36.5
37. Information Technology: Infrastructure Develop enterprise architecture. Identify an enterprise architect to develop DMH enterprise
architecture. Follow statewide enterprise architecture standards. Operations and service requests. Adopt a standard methodology for operations and service
requests such as IT Infrastructure Library. Develop a schedule to replace aging infrastructure. Strategies for system reliability and availability. Recognize the need for 99.9% reliability and
system availability and develop a strategy that will meet that need at a reduced risk. Standardize systems and applications and centrally host them at a Tier 3 data center once the
communication reliability is resolved. (Tier 3 data center provides the conditions for 99.982% availability and reliability by providing plant and system infrastructure features such as dual-power sources, cooling, ventilation, redundant independent distribution paths, physical security, and more.)
Section 5, p. 86
37.1
37.2 37.3
37.4 37.5
37.6
38. Information Technology: Security Plan and resource a security program and infrastructure. Develop a multi-year plan to resource
and implement a security program and security infrastructure.
Section 5, p. 87
38
39. Information Technology: Disaster Recovery Corrective plan for disaster recovery. The IT division must review the disaster recovery report
Section 5, p. 87
39.1
170 of 271

Recommendations Reference Item # critique provided by the Technology Agency and develop a corrective action plan.
Develop a disaster recovery infrastructure. Periodic disaster recovery testing. Schedule periodic disaster recovering testing (drills) to ensure
recovery procedures are in place and staff is trained.
39.2 39.3
40. Information Technology: Asset Management Select asset management tools. Examine asset management tools used by other agencies;
determine which tool may be used or shared by the department. Dedicate staff to asset management maintenance.
Section 5, p. 87
40.1
40.2
41. Information Technology: Staffing Workload Complete a workload study for existing services; workload for IT must be determined based on the
type of work and the rate of changes required (i.e. changes to software or to equipment). Fund new work correctly. All new products and services must be properly resourced going
forward.
Section 5, p. 87
41.1
41.2
42. Information Technology: Succession Planning Individual development plans. Require managers to provide individual development plans for
staff. Fund training. Provide for a reasonable training complement for staff that reflects their duties. Train in state policy and procedures. Provide all IT staff relevant training in state policies and
administrative processes; Rotate staff to provide cross training.
Section 5, p. 87
42.1 42.2 42.3
42.4
43. Information Technology: Recommended Projects The following projects were proposed for safety and efficiency by both program and IT managers
interviewed:
Electronic medical records (federal mandate to be implemented by FY 2014-15)
Standard reports (and reporting) department wide
Ability to measure program outcomes
Section 5, p. 87
43.1 43.2 43.3
171 of 271

Recommendations Reference Item # Scheduling tool for staffing hospital shifts
IT tools for patient treatment (schools and cognitive disorders)
Computer training rooms for employee training of internal applications
Develop billing system to recover funds from public and private medical insurance.
Repair infrastructure and security for system reliability and integrity.
Implement Voice over Internet protocol (VOIP) for communication between hospitals; pilot at Napa SH was successful. Telecommunication costs will only be reduced if communication between hospitals is via VOIP.
Develop personal duress alarm system for employee safety at all campus; prioritize campuses with the highest risk.
Replace metal keys with electronic keys to reduce lock-downs, overtime, and locksmith costs.
43.4 43.5 43.6 43.7 43.8 43.9
43.10
43.11
44. Medical and Other Patient Care Issues: Deputy Director Structure Establish a clinical deputy director at headquarters who is a forensic psychiatrist. Provide the
program direction, oversight, and teamwork environment that the medical staff has reported it needs.
Section 6, p. 122
44.1/1.4
45. Medical and Other Patient Care Issues: Cost Consciousness Medical cost consciousness is needed. Promote the management position that cost-consciousness
is necessary for the medical community. State hospitals, just as private hospitals, have a bottom line for the budget.
Section 6, p. 122
45
46. Medical and Other Patient Care Issues: Enhancement Plan Reassess the Enhancement Plan with the intent of refocusing on 1) more physician interaction with
patients in lieu of paperwork involvement and 2) the forensic mission.
Section 6, p. 122
46
47. Medical and Other Patient Care Issues: Pharmacy and Physical Health Program Assessments Assess pharmacy and physical health programs for robustness. Recognize that the patient
population is increasingly at risk medically, and evaluate the physical health and pharmacy programs for robustness. Consider more staffing in general, more on-staff specialties, and more on-site clinics.
Section 6, p. 122
47
172 of 271

Recommendations Reference Item # 48. Medical and Other Patient Care Issues: Pharmacy Cost Containment Objectives Establish pharmacy cost containment objectives.
Preserve the savings that will materialize as proprietary drugs go generic.
Ensure the use of generics whenever clinically appropriate.
Improve review processes: o For non-formulary drugs ensure that the review process is robust, performed by qualified
clinicians, and data is collected on rates of denial/approval. The non-formulary review process should be uniform across facilities.
o For formulary drugs, consider implementing the preauthorization review process under development by senior medical staff for selected expensive formulary medications or high liability formulary medications.
Use committee platforms effectively for the statewide pharmacy program. The current contract language makes it difficult for departments to choose to use generics over proprietary drugs. Strong committee participation is needed to change this situation.
Section 6, p. 122
47.1 47.2 47.3
47.3a
47.3b
47.4
49. Medical and Other Patient Care Issues: Contracted Health Care Provider Network
Consider a contracted health care provider network for outside medical services (like Health Net provides for CDCR) to enhance access to services, reduce contracting workload, and potentially have access to utilization management for outside medical services.
Section 6, p. 122
50. Medical and Other Patient Care Issues: Statewide Contracting for Medical Support Use statewide contracting more often to reduce workload and improve contract rates. This could
be done as a stand-alone contract or be bundled with a larger healthcare network provider contract. Laboratory services, x-ray imaging and contract registries are reasonable places to start, but hospitals should be included in the planning process.
Section 6, p. 123
50/6.11
51. Medical and Other Patient Care Issues: Conflict of Interest Policy revisions to address conflict of interest. Ensure that vendor contact with physicians has
neither the substance nor the appearance of conflict of interest. The team recommends an overall review of the conflict of interest policies for the medical staff.
Section 6, p. 123
51
173 of 271

Recommendations Reference Item # 52. Medical and Other Patient Care Issues: Electronic Health Records. Develop electronic health records to help medical staff manage patient care and to serve as input
to a cost management system. Electronic health records should also save medical staff time.
Section 6, p. 123
52
53. Medical and Other Patient Care Issues: Manuals Automate manual. Explore the option of an automated manual in place of multiple special orders;
some special orders are outdated and need review.
Section 6, p. 123
53
54. Medical and Other Patient Care Issues: Medicare Billings Re-establish a medical billing unit. Request resources for a replacement Medicare and private
insurance billing unit, offsetting that cost either through revenue collection or through the scheduling of reimbursements.
Create incentives to reduce physician billing errors. To create the incentive needed to curb physician errors in billing claims, schedule some portion of the recovery either against the current hospital budget, or set up an incentive-based fund (such as for medical equipment) that can be accessed only when cost recovery exceeds anticipated General Fund revenue from billings.
Section 6, p. 123
54.1
54.2
55. Medical and Other Patient Care Issues: Data Analysis for Cost Control Plan medical cost containment data needs. Identify the key data needed to evaluate and control
costs trends in patient care. Develop methods to identify medical costs by patient commitment type, level of care, age, and chronic condition. Plan for IT system and account system changes to meet at least that minimum information threshold.
Section 6, p. 123
55
56. The Hospital Deficit, Short-Term Recommendations: Plan for Managing the Deficit Situation Recognize that it might not be possible to avert a deficiency in the current year through savings
alone. Plan appropriately for a deficiency situation. Section 4 of this report (#11) suggests ways to improve the department’s deficit management.
Section 7, p. 141
56
174 of 271

Recommendations Reference Item # 57. The Hospital Deficit, Short-Term Recommendations: Technical Review of the Budget Since the team did not conduct a technical review of the budget, it recommends that the
department do so to ensure that technical budgeting processes are sound and do not contribute to the deficit.
Section 7, p. 141
57
58. The Hospital Deficit, Short-Term Recommendations: Assess Managers’ Fiscal Performance Periodically assess the department’s management team on fiscal performance. For hospitals,
establish review criteria, such as cost per patient. Hold managers accountable.
Section 7, p. 142
58
59. The Hospital Deficit, Short-Term Recommendations: Transparency Principles Adopt transparency principals with other stakeholders who will be influenced by the department’s
budget situation.
Keep employees apprised of the budget and cash situation and whether it might affect them.
Prepare a vendor payment plan in cooperation with the hospitals, including methods to advise the vendor community of status.
Section 7, p. 142
59
60. The Hospital Deficit, Long-Term Recommendations: Organizational Issues Improve organizational issues that impair fiscal control following the recommendations set out in
Section 3. Key among these are 1) to put in place a deputy director structure that will provide the leadership for recommended changes, and 2) strengthen the budget offices at headquarters and in the hospitals.
Section 7, p. 142
See above.
61. The Hospital Deficit, Long-Term Recommendations: Process Issues Improve process issues that impair fiscal control following the recommendations set out in Section
4. A key process goal is the establishment of base budgets at both the hospitals and headquarters.
Section 7, p. 142
See above
62. The Hospital Deficit, Long-Term Recommendations: Medical Cost Consciousness Improve medical cost consciousness as recommended in Section 6.
Section 7, p. 142
See above.
175 of 271

Recommendations Reference Item # 63. The Hospital Deficit, Long-Term Recommendations: Enhancement Plan Simplify and refocus the Enhancement Plan both for savings and for better attention on the
forensic mission and clinician/patient interaction, as noted in Section 6.
Section 7, p. 142
See above.
64. The Hospital Deficit, Long-Term Recommendations: Reliable Data for Cost Control IT needed to support cost control. Modernize the data management environment in the
department so that change—including issues of fiscal control—can be based on reliable data. See Section 5.
Section 7, p. 142
See above.
65. Other Issues: Headquarters’ Category Over-expenditures Reporting of problems by the fiscal division: New division leadership must instill in the accounting
and budget offices a strong ethic for appropriate fiscal management, including the reporting of problems for correct resolution.
Executive offices role in supporting reporting of problems. The executive office needs to encourage the reporting of problems and error throughout the department.
Section 8, p. 144
65.1/3.2/4.1
65.2
66. Other Issues: Strategic and Business Planning Mission outputs for the strategic plan, mission inputs for the business plan. Update the strategic
plan and consider developing a business plan that focuses on mission inputs. Give the plans the right focus. Ensure that the department’s primary challenges are the focus of
the plans. Consider reassigning some of the current objectives in the strategic plan to an action plan.
Communicate through the plans. Use the strategic and business plans as primary sources of communication with not only the mental health community, but also with patient families, the Administrations, the Legislature, the DMH workforce, and other stakeholders such as the department’s provider and vendor network. Make sure the plans are jargon-free and readable for the average citizen.
Section 8, p. 148
66.1
66.2
66.3
176 of 271

Recommendations Reference Item # 67: Other Issues: Metropolitan State Hospital’s (SH) Future Address Metropolitan SH’s underutilization. Consider these possibilities:
Metropolitan SH as single SNF site. Explore the option of using Metropolitan SH as the single DMH SNF site providing services for individuals who qualify for SNF services. (See the report for the hospital’s proposal.)
Metropolitan SH as the telemedicine hub. Explore the possibility of creating a telemedicine hub at Metropolitan SH.
Metropolitan SH as a recruitment base. Consider expanding programs at the hospital that might assist with recruitment at other state hospitals.
Section 8, p. 149
67.1 67.2
67.3
67.4
68. Other Issues: Special Repairs Conduct a facilities needs assessment.
Section 8, p. 150
68
177 of 271

Appendix 2.A
178 of 271
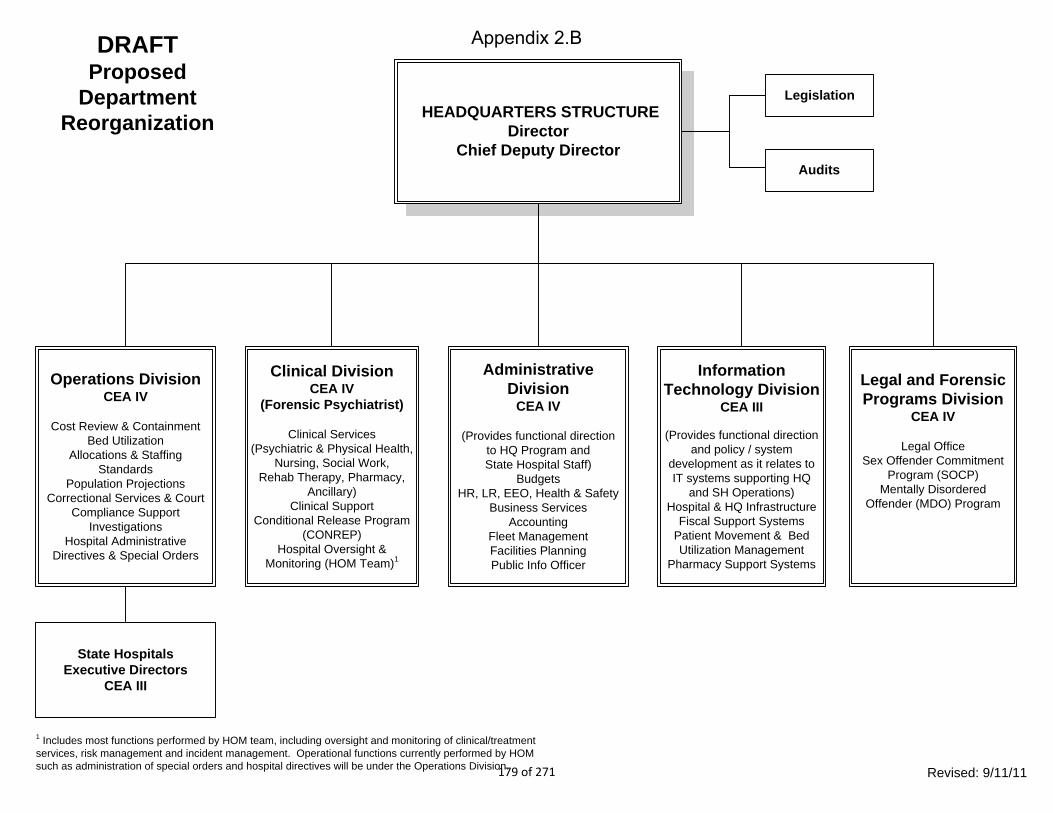
HEADQUARTERS STRUCTUREDirector
Chief Deputy Director
Operations DivisionCEA IV
Cost Review & ContainmentBed Utilization
Allocations & Staffing Standards
Population ProjectionsCorrectional Services & Court
Compliance SupportInvestigations
Hospital Administrative Directives & Special Orders
Clinical DivisionCEA IV
(Forensic Psychiatrist)
Clinical Services (Psychiatric & Physical Health,
Nursing, Social Work, Rehab Therapy, Pharmacy,
Ancillary)Clinical Support
Conditional Release Program (CONREP)
Hospital Oversight & Monitoring (HOM Team)1
Administrative Division
CEA IV
(Provides functional direction to HQ Program and State Hospital Staff)
BudgetsHR, LR, EEO, Health & Safety
Business ServicesAccounting
Fleet ManagementFacilities PlanningPublic Info Officer
DRAFTProposed
DepartmentReorganization
Information Technology Division
CEA III
(Provides functional direction and policy / system
development as it relates to IT systems supporting HQ
and SH Operations)Hospital & HQ Infrastructure
Fiscal Support SystemsPatient Movement & Bed Utilization Management
Pharmacy Support Systems
Legislation
Audits
State HospitalsExecutive Directors
CEA III
Legal and Forensic Programs Division
CEA IV
Legal OfficeSex Offender Commitment
Program (SOCP)Mentally Disordered
Offender (MDO) Program
1 Includes most functions performed by HOM team, including oversight and monitoring of clinical/treatment services, risk management and incident management. Operational functions currently performed by HOM such as administration of special orders and hospital directives will be under the Operations Division. Revised: 9/11/11
Appendix 2.B
179 of 271

Appendix 3.A: State Hospital and LTCS Loaned/Redirected Positions As of July 15, 2011
Loaned
From
Loaned
To Original Position # Original Class Current Reclass # Current Class
1.0 ASH HOM 455-500-8329-001 Associate MH Spec 455-500-8329-001 Associate MH Specialist 58,488
1.0 ASH ? 455-500-8558-003 Supv Spec Invest 461-800-8548-001 73,032
1.0 ASH HQ
455-518-1312-007;
455-541-4707-001 455-518-5795-001 Staff Counsel III
102,960
1.0 ASH HQ 455-050-1139-004 455-050-1139-001 Off Tech 35,700
Sub-Total 270,180
1.0 CSH HOM 437-603-7609-003 Sr. Psychiatrist Supv 437-603-7609-001 Sr. Psychologist (Sup) 250,866
1.0 CSH HOM 437-702-8253-095 Psych Tech Medical Record Consultant 60,750
1.0 CSH Legal 437-427-7659-008 Pharmacist I 437-500-5795-002 Staff Counsel III 102,960
1.0 CSH Legal 437-427-7659-007 Pharmacist I 437-500-5778-001 Staff Counsel 75,012
1.0 CSH HOFS 437-341-9699-010 Health Services Spec 437-543-5393-801 Associate Personnel Analyst 58,488
1.0 CSH HOFS 437-500-6749-001 Chief of Plant Ops III 437-500-3961-001 Sr. Architect 107,952
1.0 CSH Personnel 437-341-9699-019 Health Services Spec 437-543-5157-800 Staff Services Analyst 43,578
1.0 CSH HQ 437-xxx-8325-xxx Staff MH Specialist (position to be located and reclassed to SMHS) 64,242
1.0 CSH HQ 437-500-1247-005 437-500-1728-001 Executive Assistant 43,704
1.0 CSH HQ 437-518-1470-701 437-518-1579-001 Associate Prog Analalyst 63,096
Sub-Total 870,648
1.0 MSH HOM 487-230-5758-001 Office Tech 487-230-5758-001 RPS II 70,560
1.0 MSH HOM 487-231-8101-002 Psych Tech 487-231-8101-002 Nursing Coordinator 73,092
1.0 MSH HQ
487-230-1148-803;
487-230-1148-806 487-230-4800-001 SSM I
67,236
Sub-Total 210,888
1.0 NSH HOM 480-012-8236-062 Psych Tech Asst 480-201-8316-001 Rehab Therapist 41,676
1.0 NSH HOM 480-500-7594-001 Medical Director 480-500-7594-001 Psychiatrist (Medical Director) 265,524
1.0 NSH HOM 480-548-2193-002 Food Service Tech II 480-548-5731-001 RA II 61,410
1.0 NSH WaRMSS 480-518-1337-002 Sr. ISA (Spec.) 76,080
1.0 NSH WaRMSS 480-518-1337-003 Sr. ISA (Spec.) 76,080
1.0 NSH CSSU ?? ?? Program Director (safety) 86,814
1.0 NSH HQ 480-518-1312-005 480-518-5778-001 Staff Counsel 75,012
1.0 NSH HQ 480-541-4549-001 480-541-4549-001 Accountg Admin I Sup 67,236
1.0 NSH HQ 480-521-5157-701 480-521-5304-001 Assoc Admin Analyst (A/S) 61,410
Sub-Total 811,242
1.0 PSH HOM 502-062-8236-007 Psych Tech Asst 502-201-9831-025 Sr. Psychologist (Sup) 107,820
1.0 PSH HQ 502-541-5157-702 502-541-5157-701 SSA 43,5781.0 PSH HQ 502-544-5393-001 502-544-5393-001 Assoc Bud Analyst 58,488
1.0 PSH HOM 502-548-2194-009 Food Svc Tech I 502-500-4800-002 SSM I 67,236
Sub-Total 277,122
1.0 SVPP HQ Accounting Officer 51,066
Sub-Total 51,066
$2,491,146
$3,363,047
Mid Range Yearly Salary
180 of 271
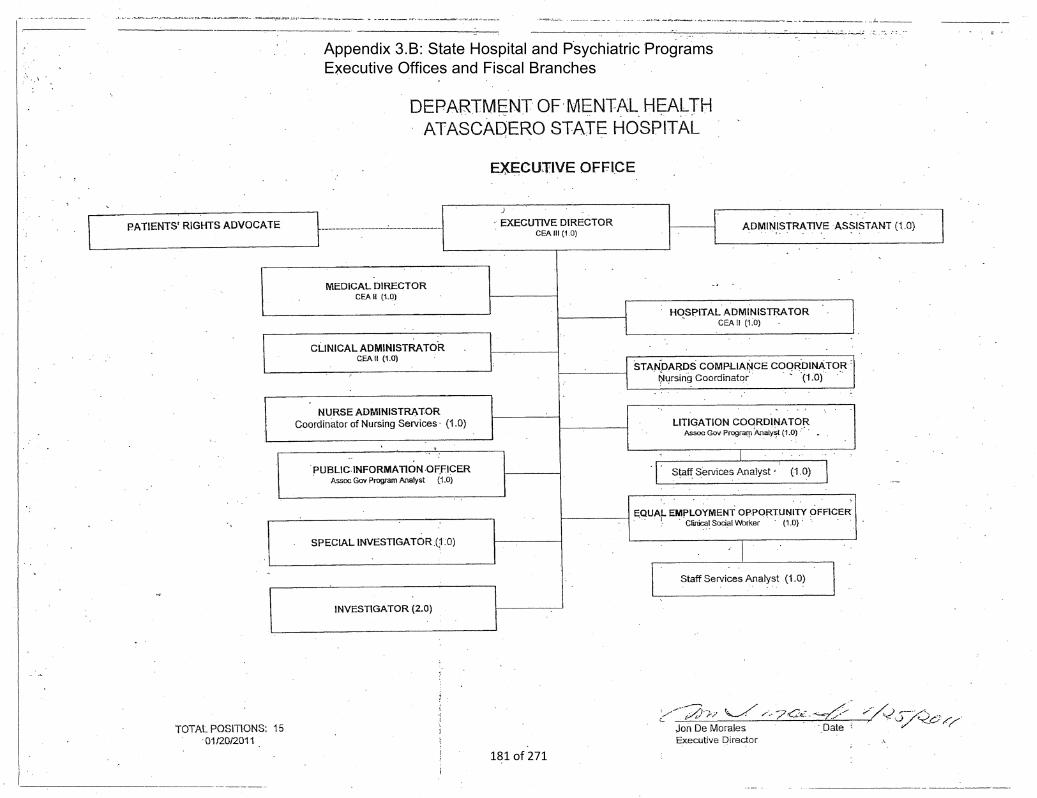
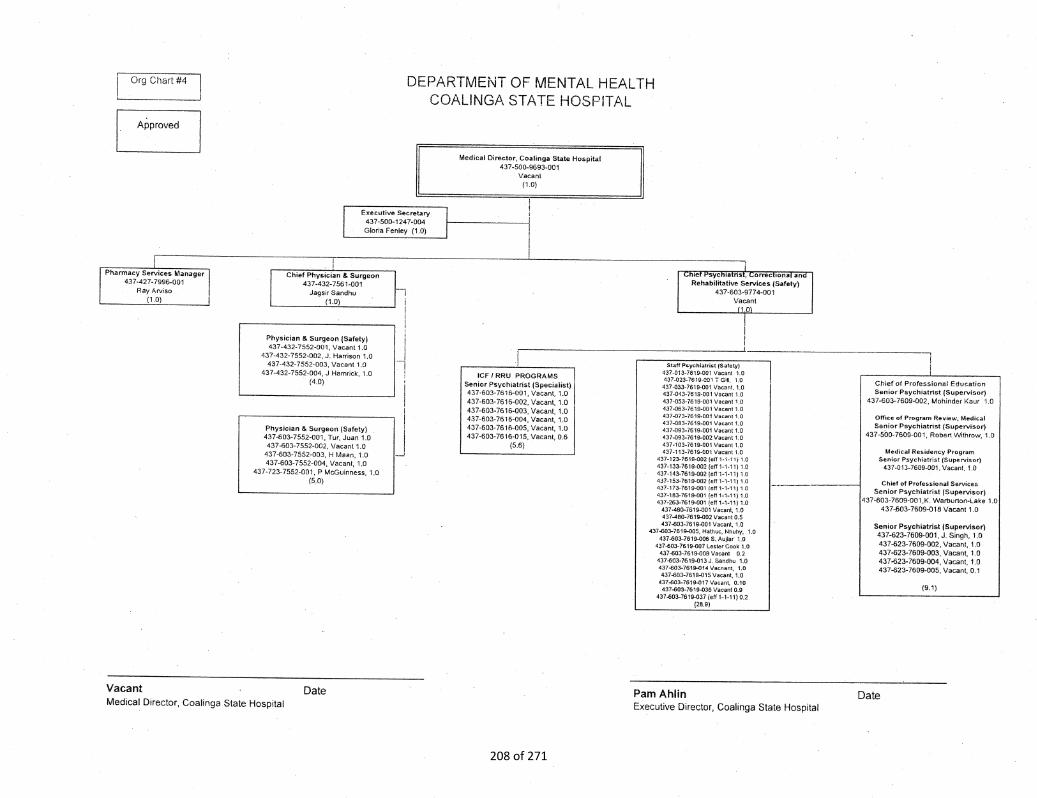
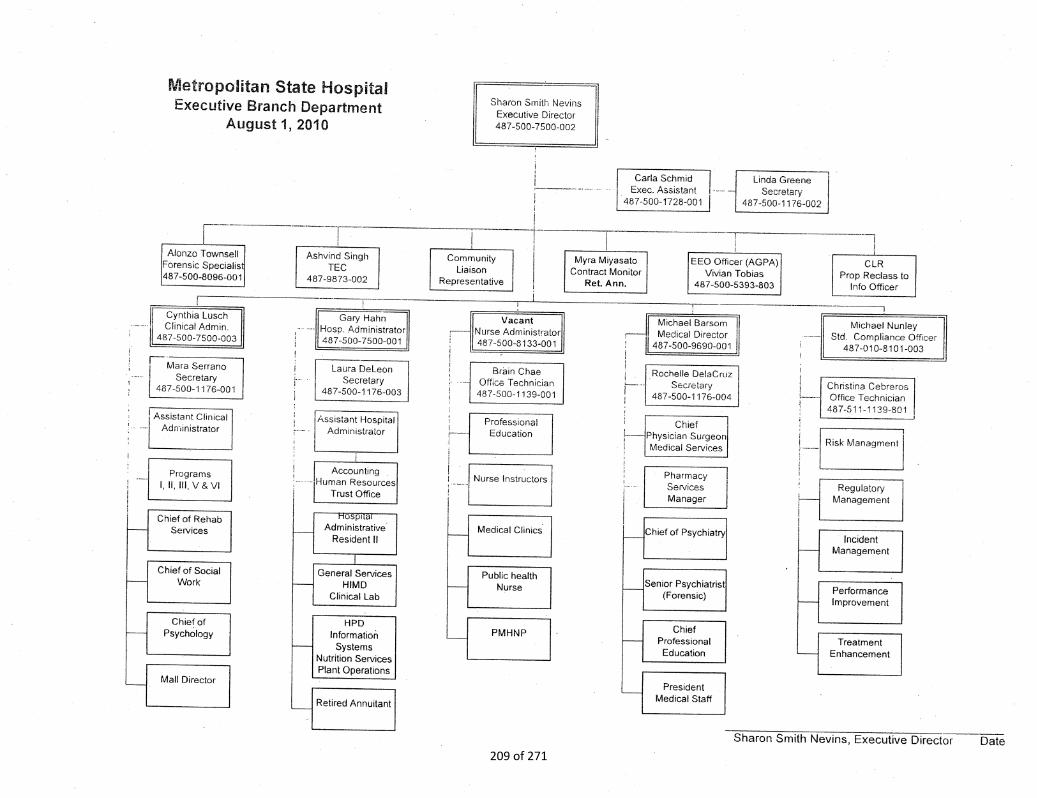
Appendix 3.B: State Hospital and Psychiatric Programs
Executive Offices and Fiscal Branches
181 of 271

182 of 271
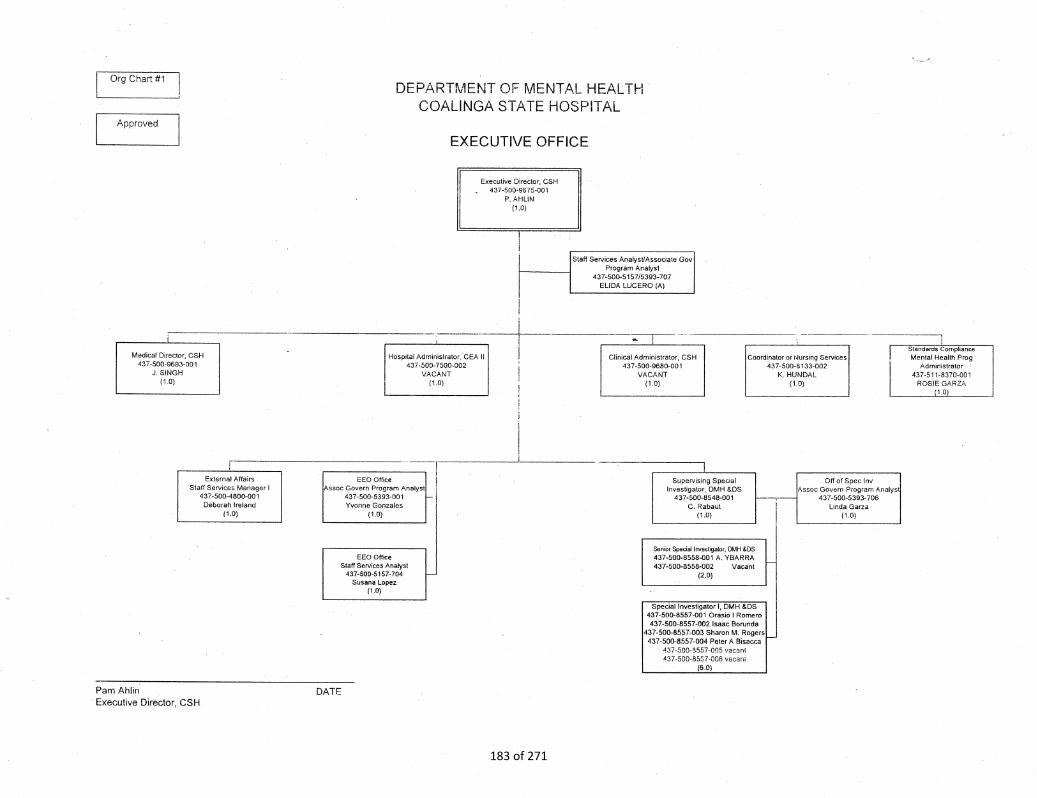
183 of 271

184 of 271
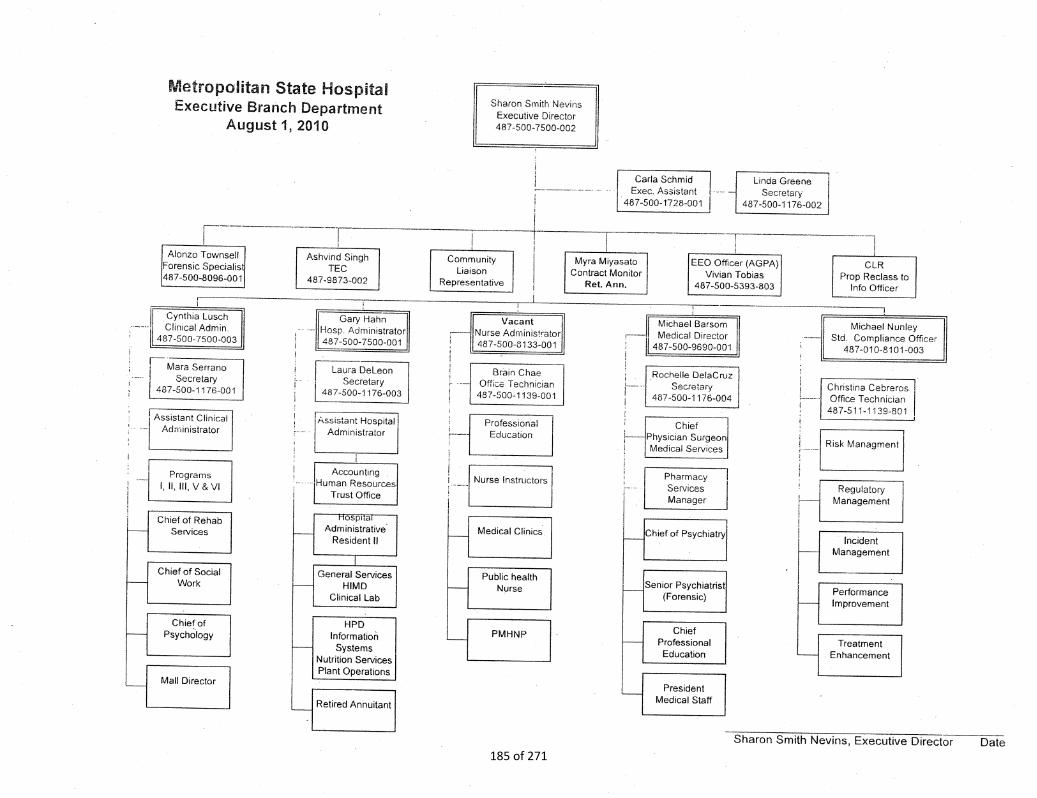
185 of 271
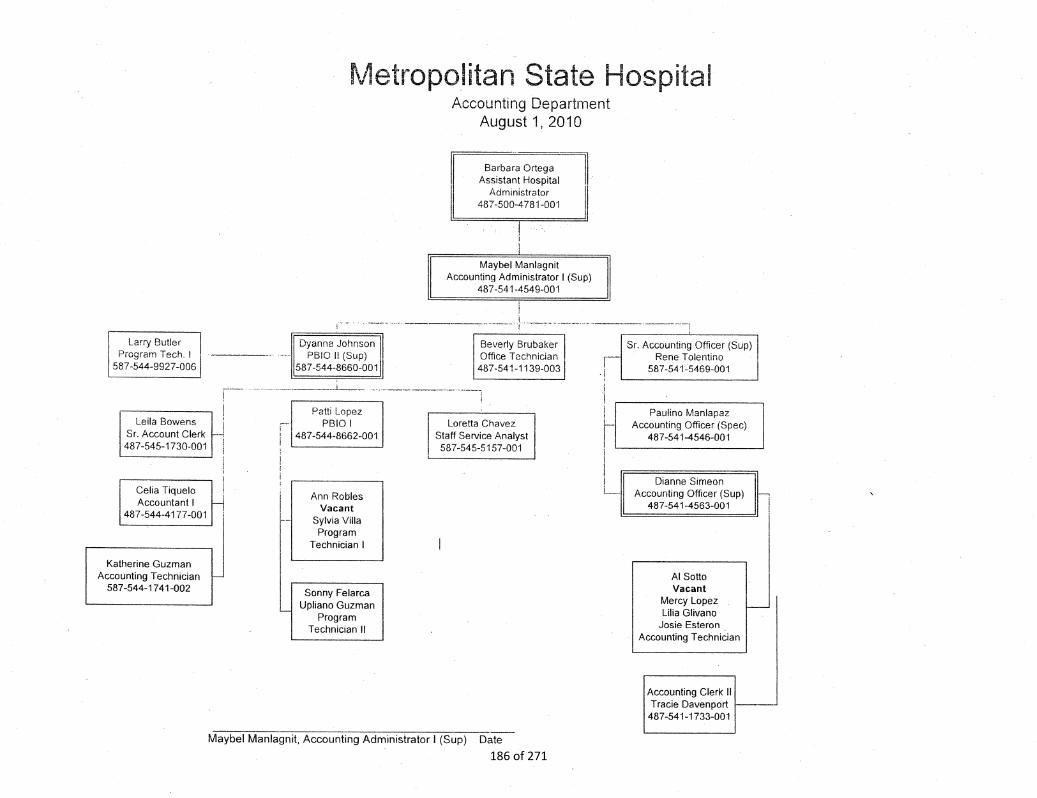
186 of 271
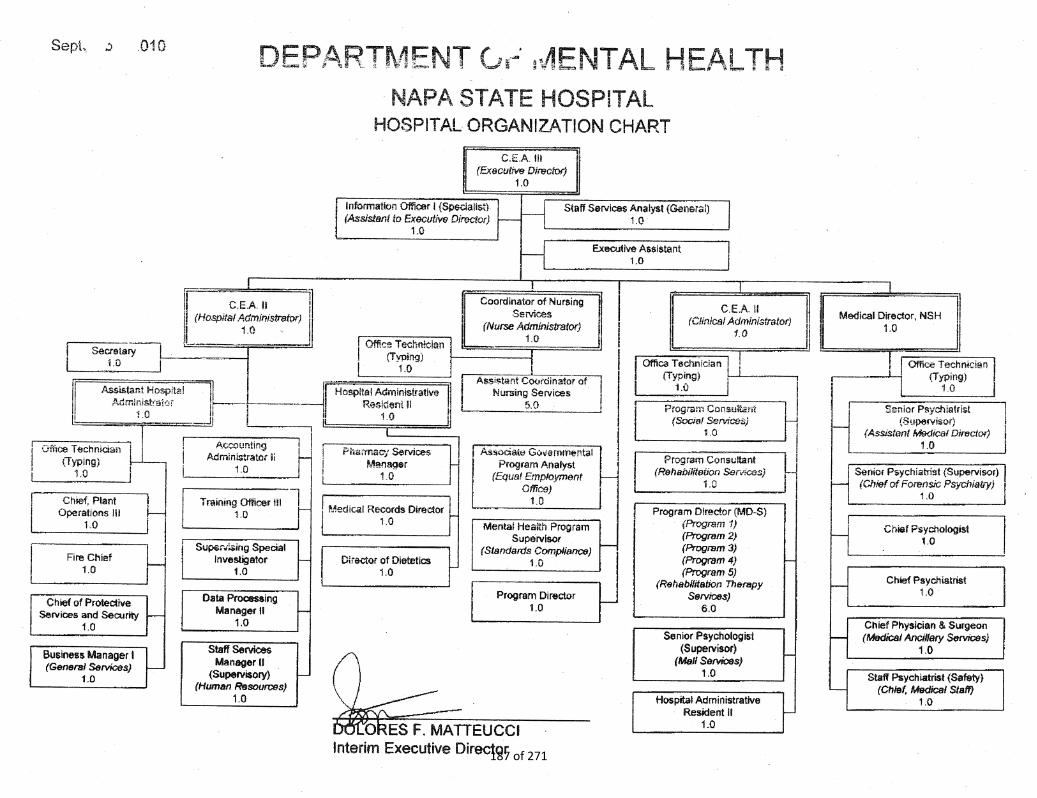
187 of 271
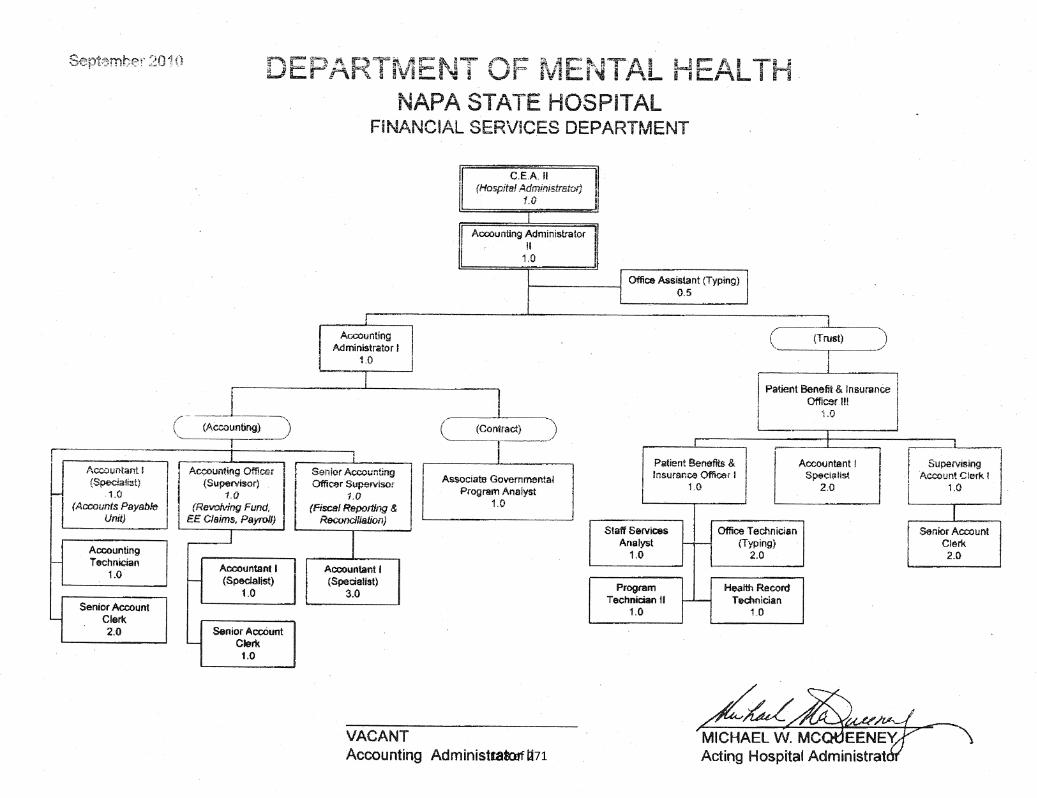
188 of 271
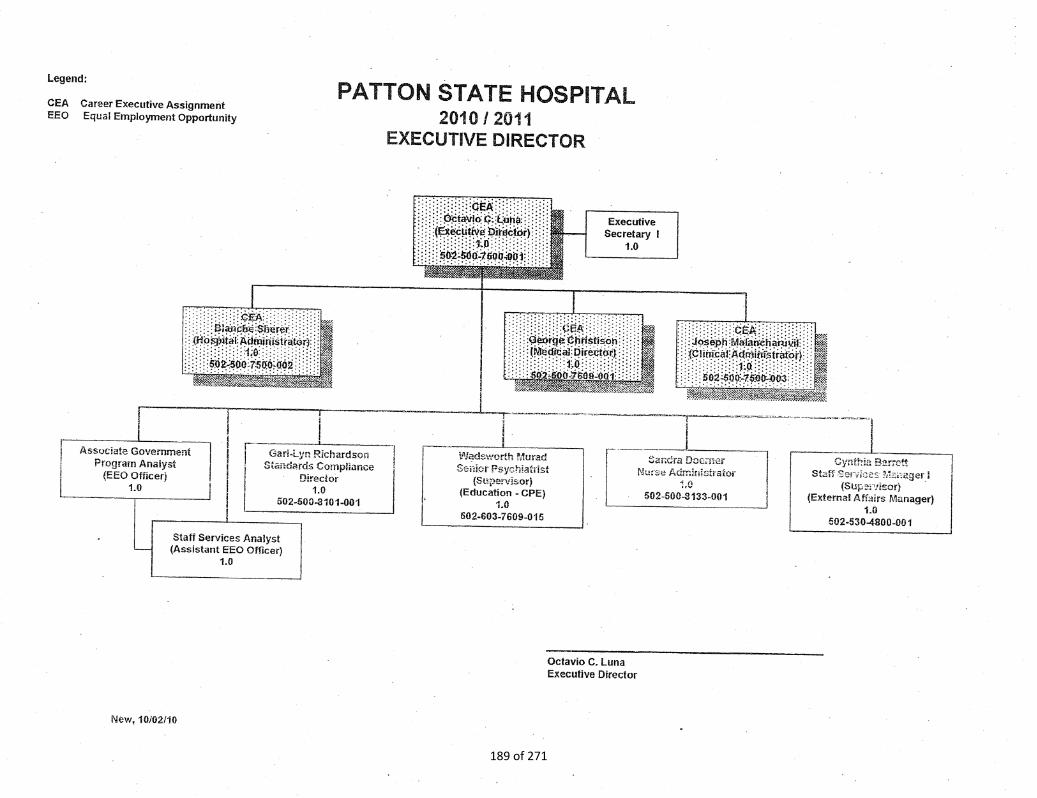
189 of 271

190 of 271

191 of 271

192 of 271

193 of 271

Appendix 4.A
194 of 271

195 of 271

196 of 271

197 of 271
198 of 271

199 of 271

200 of 271

201 of 271

Hospital System Summary
2011-12 Operating Expenditure Cash Projections
Object BUDGET CATEGORIES / FY July August Sept October November December January February March April May June FM 13 Total Operating
Code LINE ITEMS Actual Actual Projection Projection Projection Projection Projection Projection Projection Projection Projection Projection
Projection &
OEE Deferral Expenditures
BEGINNING CASH 1,167,600,000 1,098,247,431 1,001,996,911 896,909,117 789,267,143 685,776,065 591,337,625 496,347,661 404,173,953 312,364,357 221,260,020 130,035,660 28,394,784 (97,884,795)
PERSONAL SERVICES
003 Salaries & Wages 11/12 48,270,047 54,730,302 55,799,606 55,783,892 58,413,737 58,688,220 59,498,951 59,490,079 58,992,263 59,228,828 59,140,875 59,563,317 13,915,475 701,515,591
salary adjustment BU agreement (2,500,000) (2,500,000) (2,500,000) (2,500,000) (10,000,000)
033 Temp Help 11/12 525,003 1,664,563 1,788,400 1,790,994 1,804,155 1,778,893 1,759,879 1,730,739 1,767,472 1,771,393 1,714,632 1,711,530 926,402 20,734,055
083 Overtime 11/12 1,266,011 9,979,774 9,526,928 9,527,074 10,483,992 9,831,788 10,059,432 9,733,575 9,549,033 9,703,187 10,282,747 10,057,866 7,969,817 117,971,225
FY 11/12 Subtotal - Salaries 11/12 50,061,062 66,374,639 67,114,933 67,101,960 70,701,884 70,298,901 71,318,261 68,454,392 67,808,768 68,203,409 68,638,254 71,332,713 22,811,694 830,220,871
FY 11/12 Staff Benefits 11/12 18,367,087 21,245,461 22,882,241 24,019,704 24,173,524 23,675,806 23,405,020 23,647,174 23,591,931 23,747,822 23,543,229 23,817,226 5,583,090 281,699,315
FY 11/12 Subtotal Personal Services 11/12 68,428,148 87,620,100 89,997,175 91,121,664 94,875,409 93,974,707 94,723,281 92,101,566 91,400,699 91,951,230 92,181,483 95,149,939 28,394,784 1,111,920,186
OPERATING EXPENSES & EQUIPMENT
413 C&PS-External-Hlth & Med. 11/12 166,470 995,307 3,842,264 5,154,538 4,104,180 3,973,147 3,942,662 3,823,613 3,833,386 3,141,477 3,430,739 3,542,677 7,643,733 47,594,192
deferral (2,000,000) (2,000,000) (2,000,000) (2,000,000) (2,000,000) (2,000,000) (2,000,000) 14,000,000 0
326 C&PS-External 11/12 27,620 148,296 1,543,776 1,550,226 1,558,776 1,543,776 1,562,738 1,543,776 1,558,776 1,543,776 1,543,776 19,713,415 831,433 34,670,158
deferral (500,000) (500,000) (500,000) (500,000) (500,000) (1,000,000) (10,000,000) 13,500,000 0
506 Foodstuffs 11/12 123,719 1,306,589 1,199,868 1,298,933 1,261,933 1,370,293 1,233,418 1,310,591 1,368,617 1,139,404 1,223,312 1,128,697 732,371 14,697,745
516 Chemicals, Drugs & Lab Supplies 11/12 63,151 872,389 457,346 534,820 540,985 479,446 514,948 551,470 597,259 458,849 520,677 455,052 216,623 6,263,014
516 01 Pharmacueticals 11/12 2,785,757 2,967,161 4,371,608 3,602,620 3,625,427 3,638,029 3,511,464 3,449,474 3,662,344 3,476,799 3,635,004 3,332,000 1,637,796 43,695,483
deferral (1,000,000) (1,000,000) (1,000,000) (1,000,000) (1,000,000) (1,000,000) (1,000,000) 7,000,000 0
VARIOUS Other 11/12 798,692 4,883,830 6,217,166 10,587,248 4,924,444 7,025,452 6,501,529 5,493,294 8,388,591 6,292,876 5,389,445 6,519,170 10,036,867 83,058,604
deferral (6,566,335) (6,000,000) (5,000,000) (8,000,000) (6,000,000) (5,000,000) (6,500,000) 43,066,335 0
FY 11/12 Critical OE&E for CF Purposes 3,965,409 11,173,572 17,632,028 22,728,385 16,015,745 7,963,808 7,766,759 7,672,217 7,908,972 6,553,181 6,742,953 15,191,011 98,665,157 229,979,196
FY 11/12 TOTAL ALL OE&E from original 3,965,409 11,173,572 17,632,028 22,728,385 16,015,745 18,030,143 17,266,759 16,172,217 19,408,972 16,053,181 15,742,953 34,691,011 21,098,822 229,979,196
FY 11/12 Total PS & OE&E 72,393,557 98,793,672 107,629,202 113,850,049 110,891,154 101,938,515 102,490,040 99,773,783 99,309,671 98,504,412 98,924,436 110,340,951 127,059,941 1,341,899,381
Add: Reimbursments 3,040,988 2,543,152 2,541,409 2,541,409 3,733,409 3,833,409 3,833,409 3,933,409 3,833,409 3,733,409 4,033,409 5,033,409 780,362 43,414,586
Add: Reimbursments (spread) 3,666,667 3,666,667 3,666,667 3,666,667 3,666,667 3,666,667 3,666,667 3,666,667 3,666,667 0 33,000,000
Ending Cash Balance 1,098,247,431 1,001,996,911 896,909,117 789,267,143 685,776,065 591,337,625 496,347,661 404,173,953 312,364,357 221,260,020 130,035,660 28,394,784 (97,884,795) (1,363,369,590)
Assumptions
$1 Personal Services costs are paid
#2 Life and safety OE&E 413 326 506 516 506.01 are paid to the extent possible
$3 Rembursements will be mostly collected by June 30
11/9/2011 Page 1 of 1
Appendix 4.B: Cash Flow Form
202 of 271

Appendix 4.C: Comparison of 7A to Staffing Standards
Placeholder
203 of 271

Initial
LOC Non-LOC Salary Allocation
Unit Staffing Staffing Savings Subtotal OE&E 2011-12
Atascadero 123,426,298 53,166,876 (6,380,208) 170,212,967 $34,155,587 $204,368,553
Coalinga 84,234,720 65,156,536 (5,397,418) 143,993,838 $30,242,182 $174,236,020
Metropolitan 80,454,712 54,236,142 (4,867,740) 129,823,114 $20,575,719 $150,398,833
Napa 133,029,903 63,747,064 (7,110,875) 189,666,092 $38,093,080 $227,759,172
Patton 179,036,368 51,234,060 (8,320,880) 221,949,547 $49,813,635 $271,763,182
Subtotal 600,182,002 287,540,678 (32,077,121) 855,645,559 $172,880,203 $1,028,525,761
Vacaville 53,089,302 6,521,540 (2,158,742) 57,452,100 $743,000 $58,195,100
Salinas Valley 67,477,024 6,733,558 (2,681,185) 71,529,397 $277,000 $71,806,397
Headquarters $0 $17,999,391 $17,999,391
Special Repairs (held in Reserve until distributed) $0 $1,372,787 $1,372,787
TOTALS $720,748,328 $300,795,776 ($36,917,048) $984,627,056 $193,272,381 $1,177,899,437
Total State Hospital Budget FY 2011-12 $1,249,125,000
Total Initial State Hospital Allocation ($1,177,899,437)
Reserve Balance $71,225,563
To be distributed in future allocations:
Lottery Funds $145,000
Medicare (Part B) $500,000
Psych Tech 20/20 Training Program $250,000
BALANCE OF RESERVE $72,120,563
Assumptions:
Date: August 22, 2011
1) LOC and NLOC staffing captures reductions for a) misc. reductions per BL 10-33 Employee Comp, b) 5% PLP for five months (July-Nov), c) 7% WorkForce
Cap, d) 5% salary savings.
2) LOC and NLOC staffing captures 62.3 positions established as approved for the VPP 64 Bed Expansion.
3) Includes Personal Services for HPO, Grounds Safety Teams and PC 7301 transfers.
Appendix 4.D: HOSPITAL ALLOCATION ROLLUP
FISCAL YEAR 2011-12
Attachment "A"
Initial Allocation
204 of 271
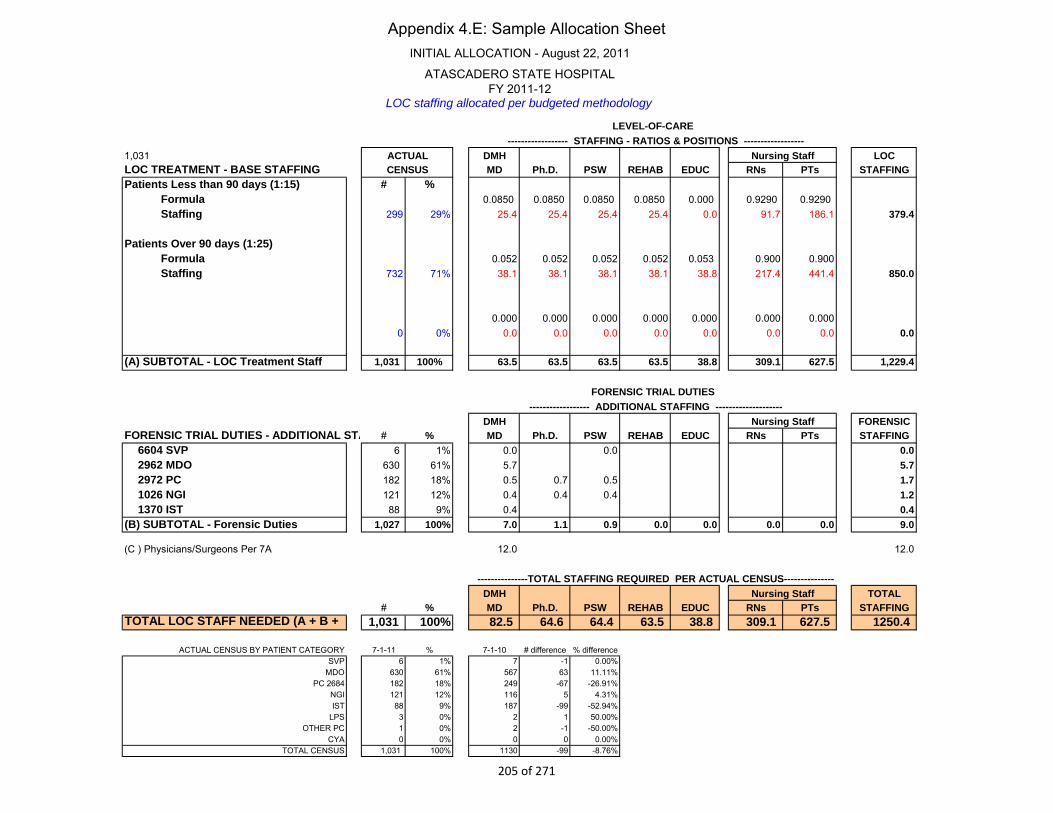
1,031 DMH LOC
LOC TREATMENT - BASE STAFFING MD Ph.D. PSW REHAB EDUC RNs PTs STAFFING
Patients Less than 90 days (1:15) # %
Formula 0.0850 0.0850 0.0850 0.0850 0.000 0.9290 0.9290
Staffing 299 29% 25.4 25.4 25.4 25.4 0.0 91.7 186.1 379.4
Patients Over 90 days (1:25)
Formula 0.052 0.052 0.052 0.052 0.053 0.900 0.900
Staffing 732 71% 38.1 38.1 38.1 38.1 38.8 217.4 441.4 850.0
0.000 0.000 0.000 0.000 0.000 0.000 0.000
0 0% 0.0 0.0 0.0 0.0 0.0 0.0 0.0 0.0
(A) SUBTOTAL - LOC Treatment Staff 1,031 100% 63.5 63.5 63.5 63.5 38.8 309.1 627.5 1,229.4
DMH FORENSIC
FORENSIC TRIAL DUTIES - ADDITIONAL STAFF# % MD Ph.D. PSW REHAB EDUC RNs PTs STAFFING
6604 SVP 6 1% 0.0 0.0 0.0
2962 MDO 630 61% 5.7 5.7
2972 PC 182 18% 0.5 0.7 0.5 1.7
1026 NGI 121 12% 0.4 0.4 0.4 1.2
1370 IST 88 9% 0.4 0.4
(B) SUBTOTAL - Forensic Duties 1,027 100% 7.0 1.1 0.9 0.0 0.0 0.0 0.0 9.0
(C ) Physicians/Surgeons Per 7A 12.0 12.0
DMH TOTAL
# % MD Ph.D. PSW REHAB EDUC RNs PTs STAFFING
TOTAL LOC STAFF NEEDED (A + B + 1,031 100% 82.5 64.6 64.4 63.5 38.8 309.1 627.5 1250.4
ACTUAL CENSUS BY PATIENT CATEGORY 7-1-11 % 7-1-10 # difference % difference
SVP 6 1% 7 -1 0.00%
MDO 630 61% 567 63 11.11%
PC 2684 182 18% 249 -67 -26.91%
NGI 121 12% 116 5 4.31%
IST 88 9% 187 -99 -52.94%
LPS 3 0% 2 1 50.00%
OTHER PC 1 0% 2 -1 -50.00%
CYA 0 0% 0 0 0.00%
TOTAL CENSUS 1,031 100% 1130 -99 -8.76%
LEVEL-OF-CARE
------------------ STAFFING - RATIOS & POSITIONS ------------------
ACTUAL Nursing Staff
INITIAL ALLOCATION - August 22, 2011
ATASCADERO STATE HOSPITAL
FY 2011-12LOC staffing allocated per budgeted methodology
---------------TOTAL STAFFING REQUIRED PER ACTUAL CENSUS---------------
Nursing Staff
CENSUS
FORENSIC TRIAL DUTIES
------------------ ADDITIONAL STAFFING --------------------
Nursing Staff
Appendix 4.E: Sample Allocation Sheet
205 of 271

State Hospital Account Fund 0872 History
As of 7/1/05 As of 7/1/06 As of 7/1/07 As of 7/1/08 As of 7/1/09 As of 7/1/10 As of 7/1/11
Balance 11,441,406.37 21,589,670.79 34,690,630.55 51,242,514.10 46,125,171.36 39,790,155.33 33,365,233.53
Receipts 78,128,453.55 79,901,254.23 77,073,871.04 81,449,243.55 82,810,451.34 84,725,999.16 27,457,199.43
Interest 1,187,305.78 1,886,123.08 1,734,012.51 1,082,032.88 374,008.29 210,736.83 86,439.34
Disbursements 69,167,494.91 68,686,417.55 62,256,000.00 79,548,619.17 89,819,475.66 90,961,657.79 15,010,892.74
GF Loans - 8,100,000.00 7,800,000.00 8,200,000.00 7,000,000.00
GF Repayment 8,100,000.00 7,800,000.00 8,200,000.00
Balance 21,589,670.79 34,690,630.55 51,242,514.10 46,125,171.36 39,790,155.33 33,365,233.53 47,097,979.56
As of 6/30/06 As of 6/30/07 As of 6/30/08 As of 6/30/09 As of 6/30/10 As of 6/30/11 As of 10/31/11
Special Deposit Account 09420001 1945 603
Funds Due from DHCS to Remit to Counties
As of 38,899.00 39,264.00 39,630.00 39,995.00 40,360.00 40,725.00
Cash in State Treasury16,118,863.43 29,120,670.63 26,824,229.30 49,825,385.30 27,447,668.03 68,863,000.42
JE0057370 dated 6/27/07 transferred $23,288,969.74 from 0001 4450 2004 101 90 to the 09420001 1945 603 account and
JE0057792 dated 6/27/07 transferred $1,139,090.02 from 0001 4450 2004 101 90 to the 09420001 1945 603 account.
It appears neither transfer should have been made since the cash is still in the 0942 Account.
Appendix 4.F: Funds 872 and 942 Data
206 of 271

Appendix 6.A: State Hospital and Psychiatric Programs
Medical Organization Charts
207 of 271
208 of 271
209 of 271
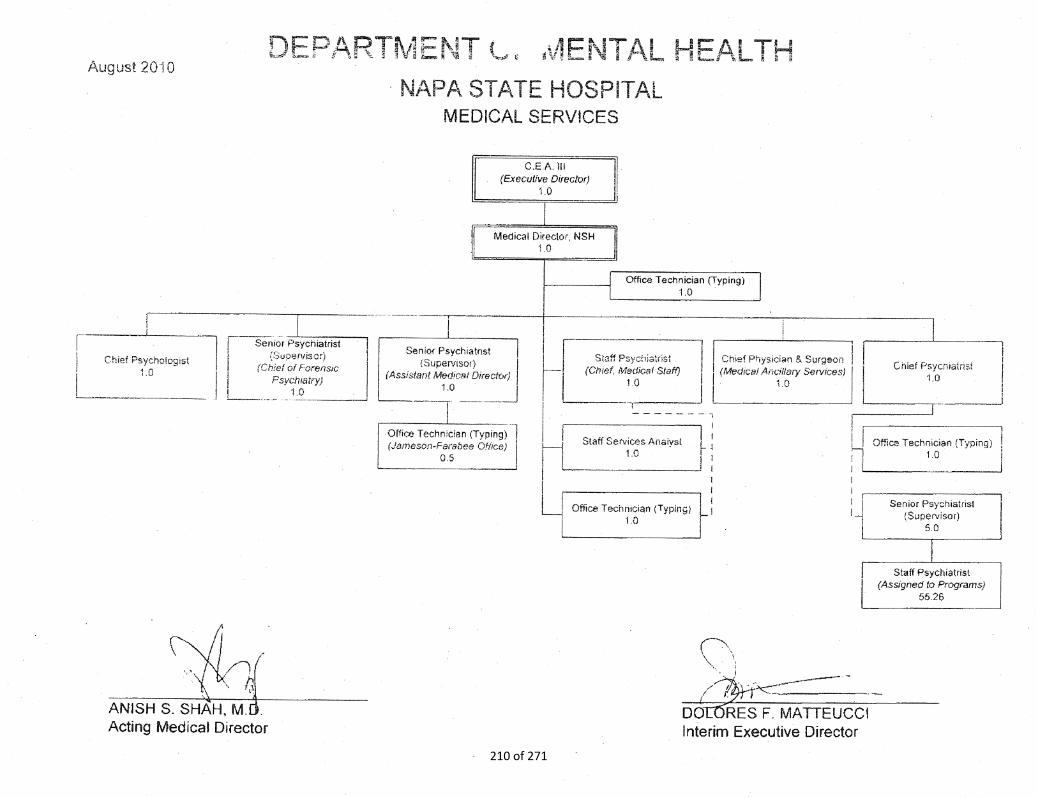
210 of 271

211 of 271

212 of 271

213 of 271
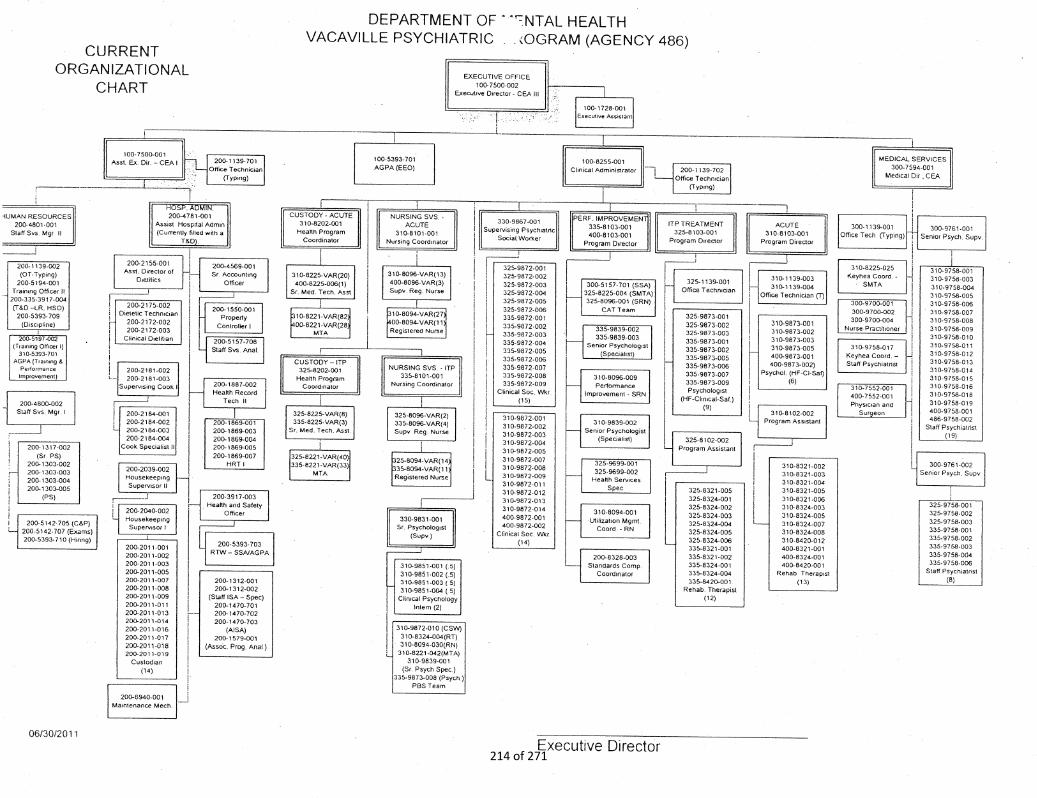
214 of 271

Class Temp Help Ret Annt Second Pos
Min Max Min Max Min Max Min Max Min Max Min Max Min Max Min Max
Psy Tech
Hourly Cost $26 $28 $34 $36 $39 $42 $24 $35 $39 $42 $31 $34 $26 $28 $26 $28
Daily Cost $270 $291 $312 $336 $192 $280 $312 $336 $250 $269 $208 $224 $208 $224
Position Cost (monthly)
Vacant $4,476 $4,915
Filled with $5,819 $6,390 $6,864 $7,392 $4,224 $6,160 $6,864 $7,392 $5,491 $5,914 $4,576 $4,928 $4,576 $4,928
Filled Position (monthly)
Cover with $12,683 $13,782 $10,043 $12,550 $12,683 $13,782 $11,310 $12,303 $10,395 $11,318 $10,395 $11,318
4. Second position based on straight time rate
5. Monthly Salary based on salary plus 30% for benefits for full-time
6. Monthly salary based on salary plus 20% for Temp Help
7. Contract hires Coalinga only.
3. Rates based on 8 hour day and 176 hour month for Temp Help and Ret Annt (total different for 168 hour month).
Salary Rate Overtime Contract 2nd Shift
Department of Mental Health
Comparison of Filling Behind Strategies
Regular
1. Minimum of Range S to max of Range U.
2. Second shift based on time and half
Appendix 6.B: Filling Behind Cost Comparison
215 of 271

Class Temp Help Ret Annt Second Pos
Min Max Min Max Min Max Min Max Min Max Min Max Min Max Min Max
RN
Hourly Cost $40 $46 $52 $60 $60 $69 $39 $50 $60 $69 $48 $55 $40 $46 $40 $46
Daily Cost $416 $478 $480 $552 $312 $400 $480 $552 $384 $442 $320 $368 $320 $368
Position Cost (monthly)
Vacant $6,938 $8,030
Filled with $9,019 $10,439 $10,560 $12,144 $6,864 $8,800 $10,560 $12,144 $8,448 $9,715 $7,040 $8,096 $7,040 $8,096
Filled Position (monthly)
Cover with $19,579 $22,583 $15,883 $19,239 $19,579 $22,583 $17,467 $20,154 $16,059 $18,535 $16,059 $18,535
4. Second position based on straight time rate
Salary Rate Regular Overtime Contract
7. Contract hires Coalinga only.
3. Rates based on 8 hour day and 176 hour month (total different for 168 hour month).
5. Monthly Salary based on salary plus 30% for benefits for full-time
6. Monthly salary based on salary plus 20% for Temp Help
Department of Mental Health
Comparison of Filling Behind Strategies
2nd Shift
1. Minimum of Range T to max of Range T (For Salinas Valley check Rg U).
2. Second shift based on time and half
216 of 271
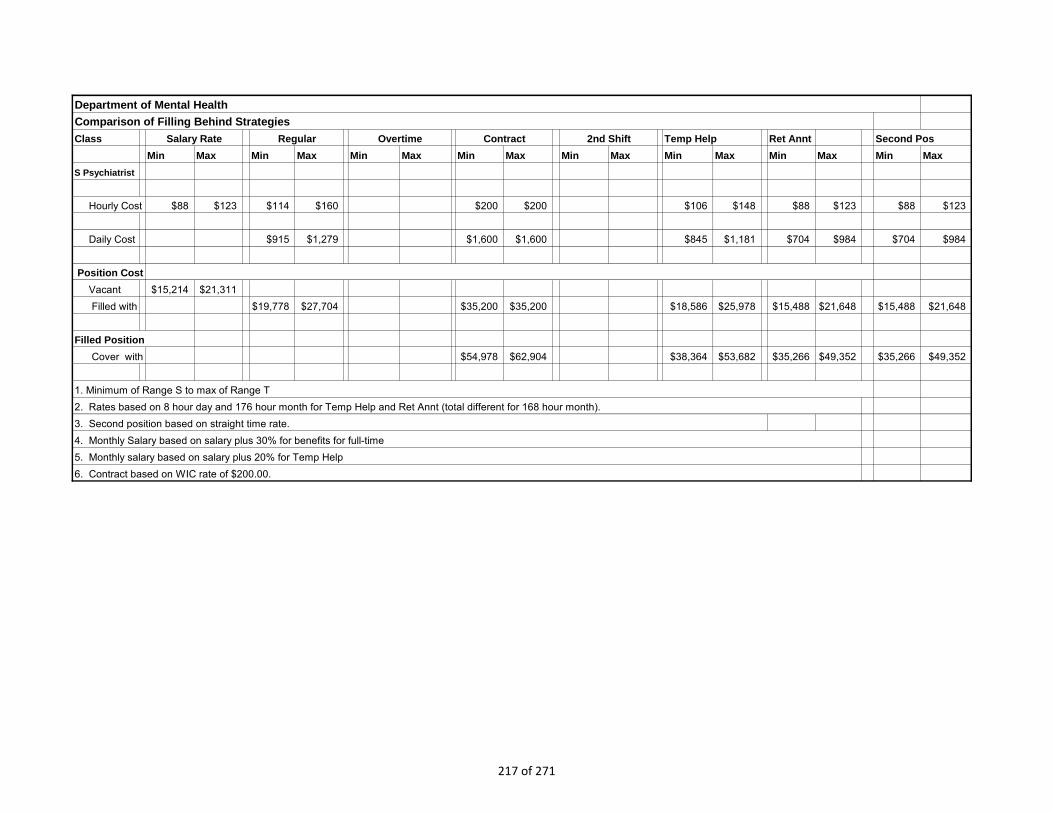
Department of Mental Health
Comparison of Filling Behind Strategies
Class Temp Help Ret Annt Second Pos
Min Max Min Max Min Max Min Max Min Max Min Max Min Max Min Max
S Psychiatrist
Hourly Cost $88 $123 $114 $160 $200 $200 $106 $148 $88 $123 $88 $123
Daily Cost $915 $1,279 $1,600 $1,600 $845 $1,181 $704 $984 $704 $984
Position Cost
Vacant $15,214 $21,311
Filled with $19,778 $27,704 $35,200 $35,200 $18,586 $25,978 $15,488 $21,648 $15,488 $21,648
Filled Position
Cover with $54,978 $62,904 $38,364 $53,682 $35,266 $49,352 $35,266 $49,352
Salary Rate Regular Overtime Contract
4. Monthly Salary based on salary plus 30% for benefits for full-time
5. Monthly salary based on salary plus 20% for Temp Help
6. Contract based on WIC rate of $200.00.
2nd Shift
1. Minimum of Range S to max of Range T
2. Rates based on 8 hour day and 176 hour month for Temp Help and Ret Annt (total different for 168 hour month).
3. Second position based on straight time rate.
217 of 271

Department of Mental Health
Comparison of Filling Behind Strategies
Class Temp Help Ret Annt Second Pos
Min Max Min Max Min Max Min Max Min Max Min Max Min Max Min Max
Hosp Police
Hourly Cost $20 $25 $26 $33 $30 $38 $24 $30 $20 $25
Daily Cost $208 $260 $240 $300 $192 $240 $160 $200
Position Cost (monthly)
Vacant $3,455 $4,360
Filled with $4,492 $5,668 $5,280 $6,600 $4,224 $5,280 $3,520 $4,400
Filled Position (monthly)
Cover with $9,772 $12,268 $8,716 $10,948 $8,012 $10,068
Overtime Contract 2nd Shift
3. Monthly salary based on salary plus 20% for Temp Help
1. Rates based on 8 hour day and 176 hour month for Temp Help and Ret Annt (total different for 168 hour month).
2. Monthly Salary based on salary plus 30% for benefits for full-time
Salary Rate Regular
218 of 271

Class Temp Help Ret Annt Second Pos
Min Max Min Max Min Max Min Max Min Max Min Max Min Max Min Max
MTA
Hourly Cost $25 $35 $33 $46 $38 $53 $38 $53 $30 $42 $25 $35 $25 $35
Daily Cost $260 $364 $300 $420 $300 $420 $240 $336 $200 $280 $200 $280
Position Cost (monthly)
Vacant $4,416 $6,144
Filled with $5,741 $7,987 $6,600 $9,240 $6,600 $9,240 $5,280 $7,392 $4,400 $6,160 $4,400 $6,160
Filled Position (monthly)
Cover with $12,341 $17,227 $12,341 $17,227 $11,021 $15,379 $10,141 $14,147 $10,141 $14,147
4. Second position based on straight time rate
2nd Shift
1. Minimum of Range J to max of Range K
2. Second shift based on time and half
3. Rates based on 8 hour day and 176 hour month (total different for 168 hour month).
Salary Rate Regular Overtime Contract
Department of Mental Health
Comparison of Filling Behind Strategies
5. Monthly Salary based on salary plus 30% for benefits for full-time
6. Monthly salary based on salary plus 20% for Temp Help
219 of 271
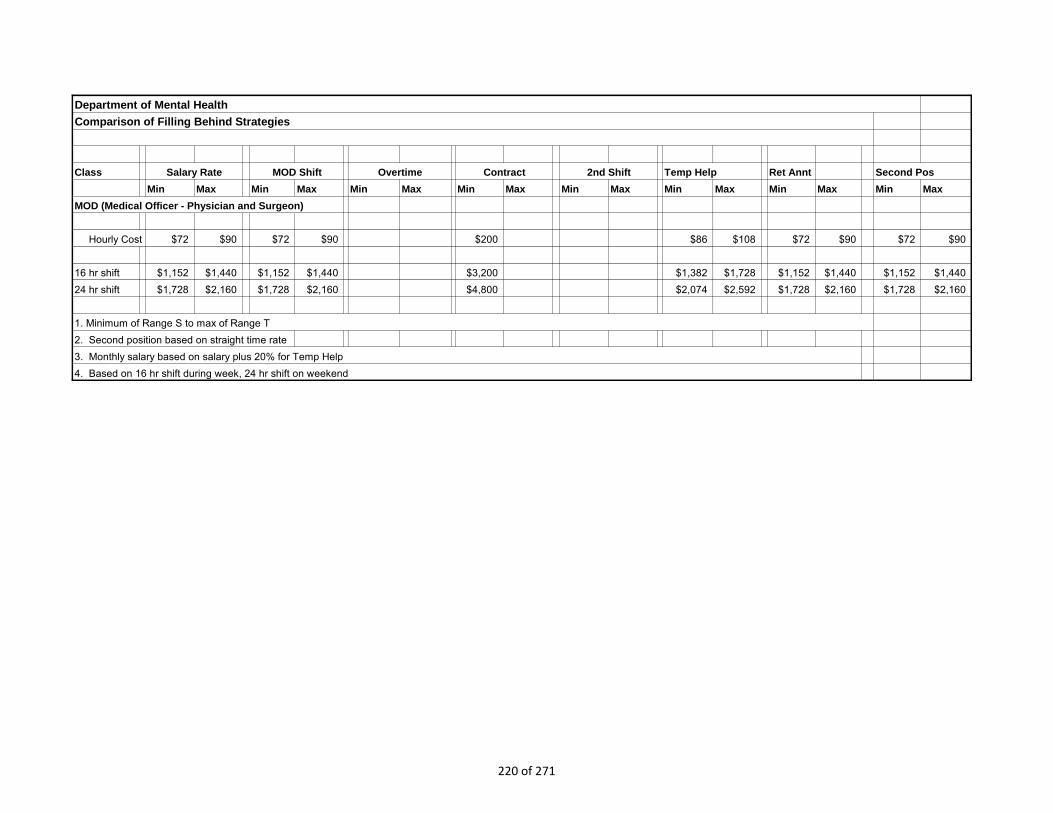
Class Temp Help Ret Annt Second Pos
Min Max Min Max Min Max Min Max Min Max Min Max Min Max Min Max
MOD (Medical Officer - Physician and Surgeon)
Hourly Cost $72 $90 $72 $90 $200 $86 $108 $72 $90 $72 $90
16 hr shift $1,152 $1,440 $1,152 $1,440 $3,200 $1,382 $1,728 $1,152 $1,440 $1,152 $1,440
24 hr shift $1,728 $2,160 $1,728 $2,160 $4,800 $2,074 $2,592 $1,728 $2,160 $1,728 $2,160
2. Second position based on straight time rate
2nd Shift
1. Minimum of Range S to max of Range T
3. Monthly salary based on salary plus 20% for Temp Help
4. Based on 16 hr shift during week, 24 hr shift on weekend
Department of Mental Health
Comparison of Filling Behind Strategies
Salary Rate MOD Shift Overtime Contract
220 of 271

Class Temp Help Ret Annt Second Pos
Min Max Min Max Min Max Min Max Min Max Min Max Min Max Min Max
POD (S Psychiatrist)
Hourly Cost $88 $123 $88 $123 $200 $106 $148 $88 $123 $88 $123
16 hr shift $1,408 $1,968 $1,408 $1,968 $3,200 $1,690 $2,362 $1,408 $1,968 $1,408 $1,968
24 hr shift $2,112 $2,952 $2,112 $2,952 $4,800 $2,534 $3,542 $2,112 $2,952 $2,112 $2,952
2. Second position based on straight time rate
4. Based on 16 hr shift during week, 24 hr shift on weekend
Salary Rate POD Shift Overtime Contract 2nd Shift
Department of Mental Health
Comparison of Filling Behind Strategies
3. Monthly salary based on salary plus 20% for Temp Help
1. Minimum of Range S to max of Range T
221 of 271

Appendix 6.C: Average Daily Census by Level of Care1,2
All Hospitals and Psychiatric Programs
Level of Care FY 2005-06 FY 2006-07 FY 2007-08 FY 2008-09 FY 2009-10 FY 2010-11
ACUTE PSY 1273.9 1266.4 1346.3 1536.7 1704.2 1739.8
SNF 80.4 86.1 84.9 80.1 73.3 73.6
ICF - SUBACUTE 3581.5 3616.7 3543.4 3465.8 3468.7 3557.1
ACUTE CHILD 31.3 24.2 5.7 0.0 0.0 0.0
RESIDENTIAL 73.0 276.9 449.3 442.2 443.1 436.6
Systemwide Total 5040.8 5271.3 5430.5 5525.6 5690.2 5808.1
Level of Care FY 2005-06 FY 2006-07 FY 2007-08 FY 2008-09 FY 2009-10 FY 2010-11
ACUTE PSY 20.6 22.2 19.2 17.0 18.2 25.0
SNF 25.5 27.1 25.7 23.7 20.4 22.3
ICF - SUBACUTE 1114.6 1117.6 1111.5 1098.1 1097.7 1101.3
Napa SH Total 1160.8 1167.0 1156.5 1138.8 1136.4 1148.6
Level of Care FY 2005-06 FY 2006-07 FY 2007-08 FY 2008-09 FY 2009-10 FY 2010-11
ACUTE PSY 438.7 375.7 381.2 513.0 580.9 545.6
SNF 54.9 59.0 59.1 56.3 52.9 51.3
ICF - SUBACUTE 148.3 214.1 210.7 65.9 13.6 9.2
ACUTE CHILD 31.3 24.2 5.7 0.0 0.0 0.0
Metro SH Total 673.2 672.9 656.7 635.3 647.3 606.1
Level of Care FY 2005-06 FY 2006-07 FY 2007-08 FY 2008-09 FY 2009-10 FY 2010-11
ACUTE PSY 480.2 476.4 483.4 482.7 483.0 469.7
ICF - SUBACUTE 1020.6 1016.4 1016.1 1021.8 1021.0 1020.3
Patton SH Total 1500.8 1492.8 1499.5 1504.5 1504.0 1490.0
Level of Care FY 2005-06 FY 2006-07 FY 2007-08 FY 2008-09 FY 2009-10 FY 2010-11
ACUTE PSY 145.0 139.4 148.3 201.0 215.9 263.6
ICF - SUBACUTE 1136.2 1016.0 866.0 817.4 813.6 877.5
Atascadero SH Total 1281.1 1155.4 1014.3 1018.4 1029.5 1141.1
Level of Care FY 2005-06 FY 2006-07 FY 2007-08 FY 2008-09 FY 2009-10 FY 2010-11
ACUTE PSY 4.0 19.6 20.6 19.5 18.1 18.5
ICF - SUBACUTE 61.1 144.2 204.5 327.2 428.6 449.3
RESIDENTIAL 73.0 276.9 449.3 442.2 443.1 436.6
Coalinga SH Total 138.1 440.7 674.4 788.8 889.9 904.4
Level of Care FY 2005-06 FY 2006-07 FY 2007-08 FY 2008-09 FY 2009-10 FY 2010-11
ACUTE PSY 133.3 136.7 137.1 133.6 156.6 186.3
ICF - SUBACUTE 99.8 107.4 133.6 134.4 93.3 98.4
Vacaville PP Total 233.7 245.0 271.7 268.7 250.7 285.7
Level of Care FY 2005-06 FY 2006-07 FY 2007-08 FY 2008-09 FY 2009-10 FY 2010-11
ACUTE PSY 52.1 96.5 156.9 169.9 231.4 231.1
ICF - SUBACUTE 1.0 1.0 1.0 1.0 1.0 1.0
Salinas Valley PP Total 53.1 97.5 157.9 170.9 232.4 232.1
²There are 366 days for FY 2007-08.
¹Average Daily Census (Source: Admission, Discharge, and Transfers System) is calculated by taking the
total patient days for each level of care, and dividing this total by the number of days in each year (e.g.,
SVPP's ICF-subacute average daily census for FY 2005-06 = 365 ÷ 365 = 1.0).
222 of 271

Commitment
Type HO
SP ALOS
FY 2001
ALOS
FY 2011
Percent
Change
Commitment
Type HO
SP ALL HOSP
ALOS
FY 2001
ALL HOSP
ALOS
FY 2011
Percent
Change
CDCR ASH 249.9 199.5 -20.18%
CDCR PSH 107.3 168.5 57.11%
CDCR SVPP 0.0 241.0 N/A
CDCR VPP 115.5 83.2 -27.98%
DJJ MSH 0.0 222.5 N/A
DJJ NSH 0.0 271.5 N/A
DJJ PSH 0.0 48.5 N/A
IST ASH 108.2 133.7 23.53%
IST MSH 319.8 249.3 -22.05%
IST NSH 235.5 248.5 5.51%
IST PSH 156.2 186.4 19.30%
IST SVPP 0.0 179.5 N/A
LPS ASH 480.4 1602.0 233.47%
LPS MSH 365.2 811.4 122.16%
LPS NSH 1340.8 490.1 -63.45%
LPS PSH 1253.4 1192.3 -4.87%
MDO ASH 525.0 441.3 -15.95%
MDO CSH 0.0 384.2 N/A
MDO MSH 211.0 1749.9 729.33%
MDO NSH 316.2 1907.0 503.16%
MDO PSH 516.1 1418.7 174.90%
NGI ASH 313.1 951.0 203.70%
NGI MSH 616.0 1399.6 127.21%
NGI NSH 1301.9 2257.7 73.41%
NGI PSH 1427.4 2151.2 50.71%
Other PC ASH 1039.5 177.0 -82.97%
Other PC MSH 92.6 266.6 187.90%
Other PC NSH 106.9 293.6 174.63%
Other PC PSH 709.4 661.2 -6.79%
SVP ASH 695.1 0.0 N/A
SVP CSH 0.0 1096.7 N/A
487.1
695.1
349.6
1096.7
1180.2
1689.9
199.5
1023.9
157.6
N/A
914.6
392.1ALL
Appendix 6.D: AVERAGE LENGTH OF STAY* (ALOS) BY COMMITMENT TYPE AND HOSPITAL
CDCR
DJJ
IST
LPS
204.9
860.0
MDO 201.02%
9.82%
N/A
ALL
ALL
ALL
ALL
-2.67%
19.07%
173.0
180.8
NGI
OTHER PC
SVP
*These figures only include days where patients were physically present in the state hospitals/psychiatric programs, not days where patients were out on
leave:
([Discharge Date] - [Admission Date] - [Out on Leave Days] = Length of Stay).
Data Source: HCO/ODS ("Patient History" table) - Yumie Park
Run Date: 10/25/2011
ALL
ALL
ALL
84.76%
-28.23%
57.78%
223 of 271

ASH CSH MSH NSH PSH SVP VVP
Interdisciplinary Team:
1. Individual x x x x x x x
2. Treating Psychiatrist x x x x x x x
3.Treating Psychologist x x x x x x x
4.Treating Rehab Therapist x x x x x x x
5.Treating Social Worker x x x x x x x
6.Registered Nurse x x x x x x x
7.Psychiatric Technician x x x x x
8. Family, Guardian, Advocate, Attorney x
9. Pharmacist and staff (see #2) (see #2) x
10. Team Recorders x x
11.Dietician x x x (if app)
12. Registered Dietician x x
13. Medical Technical Assistant x x
14. Program Medical Consultant x (SNF)
Forensic Review Panel
1. Director of Forensic Psychiatry x x x x
2. Facility Director or designee x x x x
3. Medical Director or designee x x x x
4. Chief of Psychology or designee x x x x
5. Chief of Social Services or designee x x x x
6. Chief of Nursing Services or designee x x x x
7. Chief of Rehab Services or designee x x x x
Postive Behavior Support Team 3 teams 3 teams
1. Clinical Psychologist 1,1,1 x x x x x
2. Registered Nurse 1,2,1 x x x x
3. Two Psychiatric Technicians (1 of
whom may be a behavior specialist) 3,3,3 x x x x
4. Medical Technical Assistant x
5. Sr Psychologist x
6. Social Worker x
7. Data Analyst (who may be a behavior
specialist)
existing
member x x x
Appendix 6.E
TEAMS AND GROUPS USED BY HOSPITALS
No
t un
der o
rder
224 of 271

ASH CSH MSH NSH PSH SVP VVP
Appendix 6.E
TEAMS AND GROUPS USED BY HOSPITALS
9.. Research Specialist x x
Developmental and Cognitive Abilities Team
1. Clinical Psychologist x x x x
2. Registered Nurse x x x x
3. Social worker x x x x
4. Psychiatric Technician x (2) x x x
5. Data analyst (who may be a behavior
spec)
existing
team
member x x x
Behavioral and Consultation Committee
1. Chief of Psychology x x
2. Chief of Psychiatry x x
3. Sr Psychologist x
4. Psychology Specialized Services
Coordinator x
Program Review Committee (PRC)
1. Program Director x x x x
2. Senior Psychiatrist x x x x
3. Senior Psychologist
no or
sporadic x x x
4. Senior Social Worker
no or
sporadic x x x
5. Senior Rehab Therapist
no or
sporadic x x x
6. Health Services Specialist x x x x
7. Nursing Coordinator x x x x
8. Risk Manager SC liaison x x x x
9. US’s x x x
Enhanced Trigger Review Committee (ETRC)
1. Chief of Psychiatry x x x x
2. Clinical Administrator x x x x
No
t Estaablish
ed
Rep
laced w
ith
PSSC
belo
w
225 of 271

ASH CSH MSH NSH PSH SVP VVP
Appendix 6.E
TEAMS AND GROUPS USED BY HOSPITALS
3. Discipline Chiefs x x x x
4. Coordinator of Psychology Specialist
Services x x x
5. Standards Compliance Director x x x x
6. Risk Manager SC Lead x x x x
7. PBS Team Leader or designee x x x
8. The following should attend if an
individual from their program is being
discussed: Senior Psychiatrist, Senior
Psychologist, and Program Director x x x x
9. The following should attend if an
individual from their unit is being
discussed: Unit Supervisor, WRPT
Psychiatrist and Psychologist x x x x
Psychology Specialist Services Committee (PSSC)
1. Coordinator to Psychology specialist
Services x x x x
2. Chief of Psychology x x x x
3. Chief of Psychiatry x x x x
4. Clinical Administrator x x x x
5. Risk Manager SC Lead x x x x6. The following should attend if an
individual from their program is being
discussed: Senior Psychiatrist, Senior x x x x
7. The following should attend if an
individual from their unit is being
discussed: Unit Supervisor, WRPT
Psychiatrist and Psychologist
x (Unit
Sup no
or
sporadic
) x x x
8. The following should attend if an
individual is receiving or will receive
psychology specialist services: PBS
Team Leader x x x x
Medical Risk Management Committee (MRMC)
Chief Physician and Surgeon x x x x
Nurse Administrator x x x x
Medical Director x x x x
Risk Manager SC Behavior Specialist x x x x
CNS HSS x x x
226 of 271

ASH CSH MSH NSH PSH SVP VVP
Appendix 6.E
TEAMS AND GROUPS USED BY HOSPITALS
Facility Review Committee (FRC)
Medical Director x x x x
Clinical Administrator x x x x
Discipline Chiefs (Psychiatry,
Psychology, RT, SW) x x x x
Nurse Administrator x x x x
Standards Compliance Director x x x x
Risk Manager SC Lead x x x x
PSSC and PBS lead x x x
The following should attend if an
individual from their program is being
discussed: Senior Psychiatrist, Senior
Psychologist, and Program Director x x x x
The following should attend if an
individual from their unit is being
discussed: Unit Supervisor, WRPT
Psychiatrist and Psychologist x x x x
Risk Management Committee
Medical Director Chair x x
Committee Chairs from ETRC, MRMC,
PSSC x x
Chief of Psychiatry x x
SC Director x x
Data analyst x
Data Manager x
OT x x
Quality Council (expanded to incl Prog Directors and Dept Heads)
Executive Team (ED, CA, HA, MD, and
NA) x x x x
AHA and Dept Heads x
Standards Compliance Director x x x x
Risk Manager x x x x
PD Representative x
Anyone who is interested in attending.
We are open to all, the minutes are
distributed to members, PD’s and US’s. x x
No
t Estaablish
ed
227 of 271
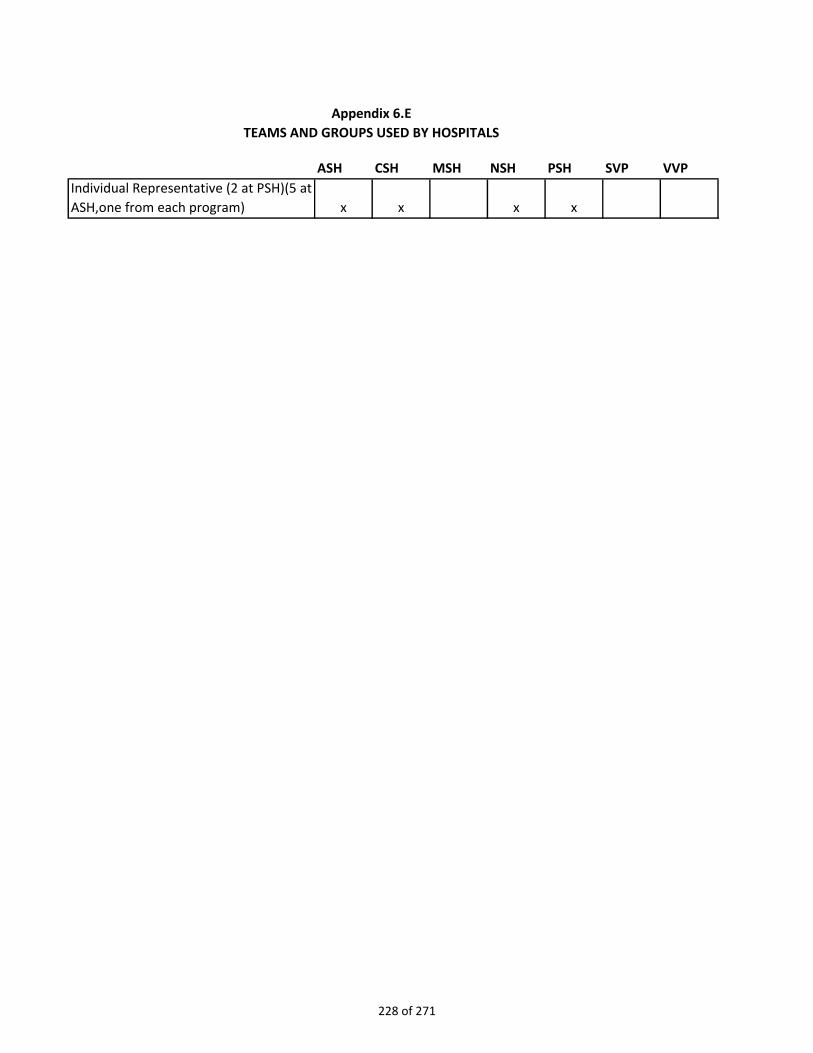
ASH CSH MSH NSH PSH SVP VVP
Appendix 6.E
TEAMS AND GROUPS USED BY HOSPITALS
Individual Representative (2 at PSH)(5 at
ASH,one from each program) x x x x
228 of 271
Appendix 6.F
THE DEPARTMENT OF GENERAL SERVICES
PHARMACY ADVISORY BOARD
CHARTER
2011
229 of 271
Page 2 of 5
TABLE OF CONTENTS
Introduction …………….……………………………. 3
Background ………………………………………….. 3
PAB Mission ………………………….……………… 3
PAB Values ……………………….…………………. 3
PAB Goals ………….…………….………………….. 4
PAB Membership …………..………………………. 4
PAB Conflict of Interest …………………………….. 4
PAB Process................................................................. 4
PAB Roles and Responsibilities…………………….. 4
Charter Amendments and Revisions ………..…… 5
PBM Charter Approvals …………………………… 5
230 of 271

Page 3 of 5
A. Introduction
Recognizing that State governmental entities need to control the costs relating to the
purchase and use of pharmaceuticals and medical supplies, the Department of General
Services (DGS), by virtue of this Charter and under the authority of Government Code
(GC) 14982(a) et seq., does hereby establish the Pharmacy Advisory Board (PAB).
The Directors of the DGS, Department of Mental Health (DMH), Department of
Developmental Services (DDS), Department of Health Care Services (DHCS),
California Department of Public Health (CDPH), the Secretaries of the California
Department of Corrections and Rehabilitation (CDCR), California Department of
Veterans Affairs (CDVA), the Receiver of the California Correctional Health Care
Services, the Chief Executive Officer of the California Public Employees Retirement
System (CalPERS), and the President of the University of California (UC), are the
Executive Sponsors, and hereby direct the PAB to meet, discuss, make decisions, and act
on critical issues relevant to authorities granted and legislative expectations of
Government Code (GC) Sections 14977 through 14982.
The PAB drives operational decisions to lower levels in the organizations when
appropriate, and gives clear direction.
B. Background
The DGS Pharmaceutical Acquisitions Section (Rx Section) has procured
pharmaceuticals for State Agencies for many years. Beginning in 2000 the California
Legislature recognized the increasing costs of pharmaceuticals and introduced legislation
establishing the Statewide Pharmaceutical Program and requiring the DGS and State
Agencies to work together to control drug costs.
C. PAB Mission
Coordinate the efforts of various State and local governmental entities, as appropriate, to
identify and implement opportunities for cost savings and quality improvement regarding
pharmaceuticals and medical supplies.
D. PAB Values
Integrity – We do the right things for the right reasons.
Accountability – We hold ourselves and each other responsible for all we do.
Communication – We listen and share information openly and honestly with the
goal of mutual understanding and transparency.
Excellence – We strive for the best for each other and our customers.
Innovation – We cultivate ideas and implement improvements throughout our
organizations.
Teamwork – We value our organizational diversity and work together to achieve
great results.
231 of 271

Page 4 of 5
E. PAB Goals
1. Rational Drug Use - Establish systems that ensure the most cost effective medication
therapy within State and local governmental entities.
2. Strategic Procurement Initiatives - Leverage departmental efficiencies to obtain the
best value on pharmaceutical and medical supply procurements.
3. Program Quality – Establish and monitor performance standards for protocols,
guidelines and contracts established for State and local governmental entities
supporting the Statewide Pharmaceutical Program.
4. Cost Management Strategies – Develop short term and long term plans integrating
private, government, and industry resources for managing drug and medical supply
costs within State and local governmental entities.
F. PAB Membership
Membership is appointed by the Executive Sponsors. Additional State and local
governmental entities eligible to participate in the Statewide Pharmaceutical Program
pursuant to GC Section 14978 may participate in the PAB as appropriate.
G. Conflict of Interest
PAB members shall be free from interests that could compromise the objectivity
necessary to make independent assessments.
H. PAB Process
The PAB shall be organized in a manner consistent with improving communications and
processes. The PAB Members shall form standing and ad Hoc committees to align with
the goals of the PAB. The PAB shall appoint and dedicate appropriate resources to
committees it forms. The DGS shall administer the PAB under the authority of GC
Sections 14977 through 14982.
I. PAB Roles and Responsibilities.
PAB Member
Implement the goals of the PAB charter.
Provide leadership and oversight on issues that cross Agency or Departmental
lines, and advise the PAB.
Receive review, recommend, and reports on high priority and sensitive issues.
Serves as the point of contact between the PAB and their Executive Sponsor, and
appropriate resources within their agencies.
o Provides briefings on current issues.
o Receives and gives feedback to the PAB.
232 of 271

Page 5 of 5
Coordinates and appoints appropriate resources to subcommittees and
workgroups established by the PAB.
DGS Pharmaceutical Program Manager (Facilitator)
Manages meeting logistics
Tracks PAB action items through resolution.
J. Charter Amendments and Revisions
This Charter may be revised or amended as and when necessary. The PAB shall review
any proposed changes, revisions, or amendments and submit to their various Executive
Sponsors for approval.
K. PAB Charter Approvals
_______________________________ ______________________________ Department of General Services California Correctional Health Care Services
Fred Klass, Director J. Clark Kelso, Receiver
_______________________________ ______________________________ Department of Mental Health Department of Developmental Services
Cliff Allenby, Acting Director Terri Delgadillo, Director
_______________________________ ______________________________ CalPERS University of California
Anne Stausboll, Chief Executive Officer Dr. Mark G. Yudof, President
_______________________________ ______________________________ California Department of Corrections and Department of Health Care Services
Rehabilitations Toby Douglas, Director
Matthew Cate, Secretary
_____________________________________ ____________________________________
California Department of Public Health California Department of Veterans Affairs
Dr. Ron Chapman, Director Peter James Gravett, Secretary
233 of 271

Approved by CDF Committee on August 17, 2010
Appendix 6.G
THE DEPARTMENT OF GENERAL SERVICES
COMMON DRUG FORMULARY COMMITTEE
CHARTER
2011
234 of 271

Page 2 of 7
TABLE OF CONTENTS
Introduction ………………………………………………………………. 3
Background ……………………………….…………………………….……. 3
Mission…..……………………………………………………………….……. 3
Values ……………………………………………………………………….....3
Goals………………………………………………………………..…………. 4
Procedural Objectives…………………………………………………………4
Responsibilities ……………………….…………….……………………..…. 5
Membership…………………………………………………………………….5
Conflict of Interest …………………………….……………………………....5
Confidentiality …………………………………………………………..…….. 5
Decisions ……………………………………………………………………..... 5
Subcommittees ……………………………………..…………………………. 6
Support ……. …………………………………………………………………. 6
Charter Amendments and Revisions ……………………………………….. 7
Charter Approvals……………………………..………………………………7
235 of 271
Page 3 of 7
A. Introduction
Recognizing State governmental need to leverage resources improving efficiencies to
establish quality standards and control the costs relating to the purchase and use of
pharmaceuticals and medical supplies, the Pharmacy Advisory Board (PAB), by virtue
of this Charter, does hereby establish the Common Drug Formulary (CDF) Committee.
Committee membership is appointed by the PAB. The CDF Committee functions to:
Promote Rational Drug use to ensure the most cost effective medication therapy is
used within State and local governmental agencies.
Develop information on the relative effectiveness and safety of prescription drugs.
Promote program quality by establishing and monitoring performance standards for
protocols, guidelines and contracts supporting the SPP.
Investigate and implement options and strategies to achieve the greatest savings on
prescription drugs.
B. Background
Beginning in 2000 the California Legislature recognized the increasing costs of
pharmaceuticals and introduced legislation (Government Code Sections 14977 through
14982) establishing the Statewide Pharmaceutical Program (SPP) and requiring the
Department of General Services (DGS) and State Agencies to work together to control
drug costs. In order to meet the statutory requirements established by Government Code
(GC) Sections 14978 and 14982(3), the DGS established the Common Drug Formulary
(CDF) Committee as a subcommittee of the Pharmacy Advisory Board (PAB).
C. Mission
The CDF Committee will implement a Common Drug Formulary System.
D. Values
1. Integrity – We do the right things for the right reasons.
2. Accountability – We hold ourselves and each other responsible for all we do.
3. Communication – We listen and share information openly and honestly with the
goal of mutual understanding and transparency.
4. Excellence – We strive for the best for each other and our customers.
5. Innovation – We cultivate ideas and implement improvements throughout our
organizations.
6. Teamwork – We value our organizational diversity and work together to achieve
great results.
236 of 271

Page 4 of 7
E. Goals
The following are goals of the CDF Committee:
1. Rational Drug Use - Establish systems that ensure medically appropriate and cost
effective medication therapy within State and local governmental entities.
2. Program Quality – Establish and monitor performance standards for protocols,
guidelines and contracts established for State and local governmental entities
supporting the Statewide Pharmaceutical Program.
3. Cost Management Strategies – Control costs on prescription drugs.
F. Responsibilities
The responsibilities of the CDF Committee are as follows:
1. Maintain a regular meeting schedule.
2. Maintain a CDF that ensures access to medically appropriate, cost-effective drugs
while promoting and/or assuring the continuity and standardization of medical care.
3. Develop or adopt Clinical Practice Guidelines when appropriate. Clinical Practice
Guidelines are defined as “systematically developed statements to assist practitioner
and patient decisions about appropriate health care for specific clinical
circumstances”1
4. Develop or adopt Clinical Protocols when appropriate. Clinical Protocols are defined
as an agreed upon series of treatment steps which should or must be taken to assure
optimal care
G. Procedural Objectives
The following are procedural objectives of the CDF Committee:
1. Determining the composition of the CDF.
2. Develop and maintain the clinical rationale for criteria used to select pharmaceuticals
for the CDF.
3. Serve as clinical experts as needed for implementing GC Sections 14977-14982.
4. Work with the DGS to maintain a list of definitions of terms pertinent to the CDF
Committee in carrying out its mission.
5. Maintain a current CDF membership list.
6. Provide the PAB at their April meeting with the CDF Strategic Plan that would be in
effect for the next fiscal year.
7. Prepare and maintain CDF Meeting Agendas.
8. Prepare and maintain CDF Meeting Minutes.
1 The National Guideline Clearinghouse™ (NGC) employs the definition of clinical practice guideline developed by
the Institute of Medicine (IOM).
237 of 271
Page 5 of 7
9. Prepare and maintain a formulary list of drugs.
10. Develop policies for the operation of the CDF System.
11. Develop guidelines for the Implementation and Administration of the CDF System.
12. Develop procedures for the operation of the CDF System.
13. Work with the DGS to establish cost effective pharmaceutical contracts.
14. Coordinate with involved agencies to implement and administer the CDF System.
H. Membership
The CDF Committee shall be composed of representatives appointed by the PAB, or the
Directors of the entities participating in the pharmacy program established by GC
Sections 14977 through 14982. The CDF Committee members shall be physicians,
pharmacists, or other health care professionals a majority of whom are actively
practicing.
I. Conflict of Interest
Committee members shall be free from interests that could compromise the objectivity
necessary to make independent assessments concerning formulary status of individual
drugs, prescribing guidelines, coverage criteria, or clinical program issues brought before
the CDF Committee.
J. Confidentiality
The CDF Committee will develop procedures relevant to confidentiality.
K. Decisions
Decisions of the CDF Committee regarding formulary status of individual drugs, use of
specified prescribing guidelines and protocols, implementation of individual programs
designed to affect drug utilization, and requests for approval by the Common Drug
Formulary Committee of any other clinical program or intervention must be made by
unanimous consensus.
Consensus is a process for group decision-making. It is a method by which an entire
group of people can come to an agreement. The input and ideas of all participants are
gathered and synthesized to arrive at a final decision supportable by all.
Consensus does not mean that everyone thinks that the decision made is necessarily the
best one possible, or even that they are sure it will work. What it does mean is that in
coming to that decision, everyone feels that their position on the matter was understood
and given a proper hearing. Consensus means that all members of the Common Drug
Formulary Committee agreed to the decision made.
238 of 271
Page 6 of 7
1. Absent CDF members shall be briefed on a consensus issue by the DGS and/or the
CDF Chairperson. If all absent members agree to support an issue, unanimous
consensus is declared for that issue.
2. If all absent CDF members cannot agree to support an issue after being briefed, the
issue may be reintroduced at a subsequent meeting.
3. A vacancy in CDF membership shall not preclude the remaining members of the
CDF Committee from reaching unanimous consensus.
L. Subcommittees
The CDF Committee may designate subcommittees of one or more members to act for
the CDF Committee with respect to specified issues.
M. Support
The PAB and the DGS will ensure the CDF Committee receives the following support:
1. The PAB shall ensure the personnel resources needed for effective operation of the
CDF System.
2. The DGS Pharmaceutical Consultant II, or alternate shall provide leadership and
liaison to the CDF Committee, the DGS, and the PAB to coordinate and accomplish
the objectives of GC Sections 14977 through 14982.
3. The CDF Committee members will develop and implement procedures for managing
the CDF Committee.
4. The DGS will support the CDF Committee by:
i. Scheduling meetings.
ii. Providing meeting accommodations.
iii. Working with the Chairperson in establishing the agenda for each meeting.
iv. Distributing the agenda and other meeting materials in advance of each
meeting.
v. Compiling and storing the minutes from the CDF Committee meetings.
5. The DGS will periodically report to the CDF on the following issues:
i. Contract development and negotiations status.
ii. Development of work products to implement the CDF System.
iii. Assessment of progress to implement Government Code Sections 14977-14982
goals and other mission critical objectives.
iv. Identification of constraints to achieve Government code Sections 14977-14982
objectives.
v. Recommendations to address program risk and program quality assurance
activities.
vi. Compliance reports for the CDF.
vii. Report on cost effectiveness of CDF System.
N. Charter Amendments and Revisions
239 of 271

Page 7 of 7
1. This Charter may be revised or amended as and when necessary. The PAB shall
review and approve any proposed changes, revisions or amendments to this
Charter.
2. The CDF Committee shall review this Charter annually and provide the PAB with
any proposed changes, revisions or amendments to the Charter at their October
meeting.
O. Charter Approvals
240 of 271

State of California – Health and Human Services Agency Department of Mental Health
Policy Directive Number 805 Page 1 of 3
POLICY DIRECTIVE MH 359 (Rev. 1/99) No.: 805 Effective Date: February 11, 2009 Supersedes: July 19, 2004 (Original signed by the Director) Approved: STEPHEN W. MAYBERG, Ph.D. Director
Subject: PSYCHOPHARMACOLOGY ADVISORY COMMITTEE (PAC) Page 1 of 3
Reference: Government Code Section 11152; and DMH Special Order 105 Purpose: To define the function of the Department of Mental Health (DMH)
Psychopharmacology Advisory Committee (PAC) as well as the appointments and terms for its membership.
Definition: The Psychopharmacology Advisory Committee is established by the
Director to advise DMH on issues pertaining to psychopharmacology and to develop and maintain the Department’s Psychotropic Medication Policy.
Method: Composition
PAC membership is composed of:
• One representative from the Medical Directors Council; • One pharmacist from each State Hospital and Psychiatric Program; • One psychiatrist from each State Hospital and Psychiatric
Program; • One pharmacist or psychiatrist from the Department of Juvenile
Justice; • One pharmacist or psychiatrist from the Department of Veterans
Affairs; • One pharmacist or psychiatrist from California Department of
Corrections and Rehabilitation; • One pharmacist or psychiatrist from Department of Developmental
Services; • Two county medical directors representing the California Mental
Health Directors Association (CMHDA); • Medical Director(s) from DMH headquarters; and • One pharmacist from DMH Headquarters.
Appendix 6.H
241 of 271

State of California – Health and Human Services Agency Department of Mental Health
Policy Directive Number 805 Page 2 of 3
Nomination and Appointment Process
When a vacancy occurs, the Director will request a nomination from the respective state hospital, psychiatric program Medical Director, designated department director, or CMHDA for consideration for appointment to the committee. The Director will review and make official appointments to the committee, and a letter will be sent to each member appointed to the committee.
Terms
The Director appoints each member to the committee for a period of three (3) years. At the discretion of the Director, members may be reappointed for subsequent terms. Members may be removed at the discretion of the Director.
PAC Chair
The committee’s members will nominate two (2) of its members for appointment by the Director to serve as committee chair. Of those two nominations, the Director may appoint one or two individuals to chair/co-chair the committee, respectively. The committee Chair(s) will serve in that capacity for three (3) years. The Chair(s) may be reappointed for subsequent terms at the discretion of the Director or may be removed at the discretion of the Director.
Voting Members
The DMH PAC voting membership is comprised of all DMH Director- appointed individuals from the Medical Directors Council, each state hospital and psychiatric program, and other state departments, with the exception of DMH Headquarters Medical Director(s) and pharmacy representative(s) who shall be ex officio and non-voting. The PAC generally operates by consensus; however, specific motions can be approved by simple majority. For PAC meetings, a quorum shall be defined as at least one (1) Chair and at least three (3) voting members.
PAC Responsibilities
• The committee shall develop policies and related materials for the
use of psychotropic medications, as described in Special Order 105: DMH Psychotropic Medication Policy, in DMH hospitals and psychiatric programs to include, but not limited to, pre-treatment evaluation, dosage, length of treatment, protocols/algorithms, monitoring, and management of side effects.
242 of 271

State of California – Health and Human Services Agency Department of Mental Health
Policy Directive Number 805 Page 3 of 3
Medical Directors Council Review: Proposed PAC revisions to the Psychotropic Medication Policy shall be reviewed and commented on by the Medical Directors Council in a timely manner. The Medical Directors Council may endorse, reject, revise, or remand for revision to PAC all proposed draft policy changes. The actions of Medical Directors Council shall be communicated to the Chair(s) of PAC by the Chair of the Medical Directors Council. Any relevant questions or proposals for policy revision shall be submitted by the Chair of the Medical Directors Council to PAC.
Approval and Implementation: Following approval by the PAC and the Medical Directors Council, revisions to the Psychotropic Medication Policy shall be presented at least annually to the Director for approval in consultation with the DMH Medical Director(s) and Pharmacist(s). The approved DMH Psychotropic Medication Policy shall be appended to Special Order 105 and shall be adopted for implementation by each hospital and psychiatric program. Any systematic exceptions or deviations from the policies, as opposed to isolated errors or departures, shall be presented by the respective Chief of Staff to the governing body at its semi-annual meeting.
• The PAC serves as an intra-departmental centralized forum for
discussion of information, ideas, approaches, and new research data regarding the therapeutic decision process, medication terminology, dosage guidelines, and medication management.
• DMH state hospital or psychiatric program clinical staff may submit
proposals or questions to the PAC via its Chair(s) or via appointed PAC members. The committee will invite other agencies, departments and experts in the field as necessary to participate and discuss current issues, approaches and drug research findings.
• Committee members may also serve as appointees on statewide
medication and drug formulary related work groups as determined by the Director.
Frequency of Meetings
The committee meets at least every four months and as often as is necessary to meet its responsibilities, using audio or video conferencing as much as possible to reduce travel expenses. Between meetings, the Chair(s) may act on behalf of the PAC with respect to facilitating moving policy recommendations forward or making non-substantive revisions to proposed policy language.
243 of 271

Appendix 6.I: Outside Med./ Registry/Pharmacuetical expenses
ASH CSH MSH PSH NSH SVPP VPP TOTAL
Category FY
Outside Medical Contracts
(Personal Svcs & Other)
413/418
5/6 3,546,233 839,368 1,889,496 8,691,676 3,549,111 223,948 9,888 18,749,720
6/7 3,241,022 4,173,672 2,246,789 11,937,141 5,040,978 2,410,909 20,104 29,070,615
7/8 26,327,217 12,698,697 1,540,997 13,299,609 10,925,027 1,880,805 1,101,681 67,774,033
8/9 22,220,633 14,283,978 1,008,390 15,707,050 9,326,526 724,570 113,040 63,384,187
9/10 20,719,113 21,438,580 1,287,513 11,731,742 7,714,891 5,856,116 461,024 69,208,979
10/11 20,427,736 23,583,912 1,267,738 18,518,542 11,331,127 9,552,801 1,551,473 86,233,329
11/12 16,707,439 9,279,484 1,745,775 16,277,062 7,525,403 10,942,849 2,273,746 64,751,758
TOTAL Outside Medical 113,189,393 86,297,691 10,986,698 96,162,822 55,413,063 31,591,998 5,530,956 399,172,621
Personal Svcs/Registry
5/6 1,316,339 413,465 488,042 188,115 0 0 0 2,405,961
6/7 1,289,014 0 587,341 158,879 243,567 0 0 2,278,801
7/8 23,257,558 7,692,693 708,257 969,441 6,190,722 0 0 38,818,671
8/9 19,921,527 4,784,099 551,463 957,192 2,825,117 0 0 29,039,398
9/10 17,576,980 14,097,497 385,366 158,465 434,727 0 0 32,653,035
10/11 16,064,998 16,642,247 517,252 367,946 1,879,207 0 0 35,471,650
11/12 N/A N/A N/A N/A N/A N/A N/A N/A
Sub-total 79,426,416 43,630,001 3,237,721 2,800,038 11,573,340 0 0 140,667,516
Other
5/6 2,229,894 425,903 1,401,454 8,503,561 3,549,111 223,948 9,888 16,343,759
6/7 1,952,008 4,173,672 1,659,448 11,778,262 4,797,411 2,410,909 20,104 26,791,814
7/8 3,069,659 5,006,004 832,740 12,330,168 4,734,305 1,880,805 1,101,681 28,955,362
8/9 2,299,106 9,499,879 456,927 14,749,858 6,501,409 724,570 113,040 34,344,789
9/10 3,142,133 7,341,083 902,147 11,573,277 7,280,164 5,856,116 461,024 36,555,944
10/11 4,362,738 6,941,665 750,486 18,150,596 9,451,920 9,552,801 1,551,473 50,761,679
11/12 N/A N/A N/A N/A N/A N/A N/A N/A
Sub-total 33,762,977 42,667,690 7,748,977 93,362,784 43,839,723 31,591,998 5,530,956 258,505,105
244 of 271
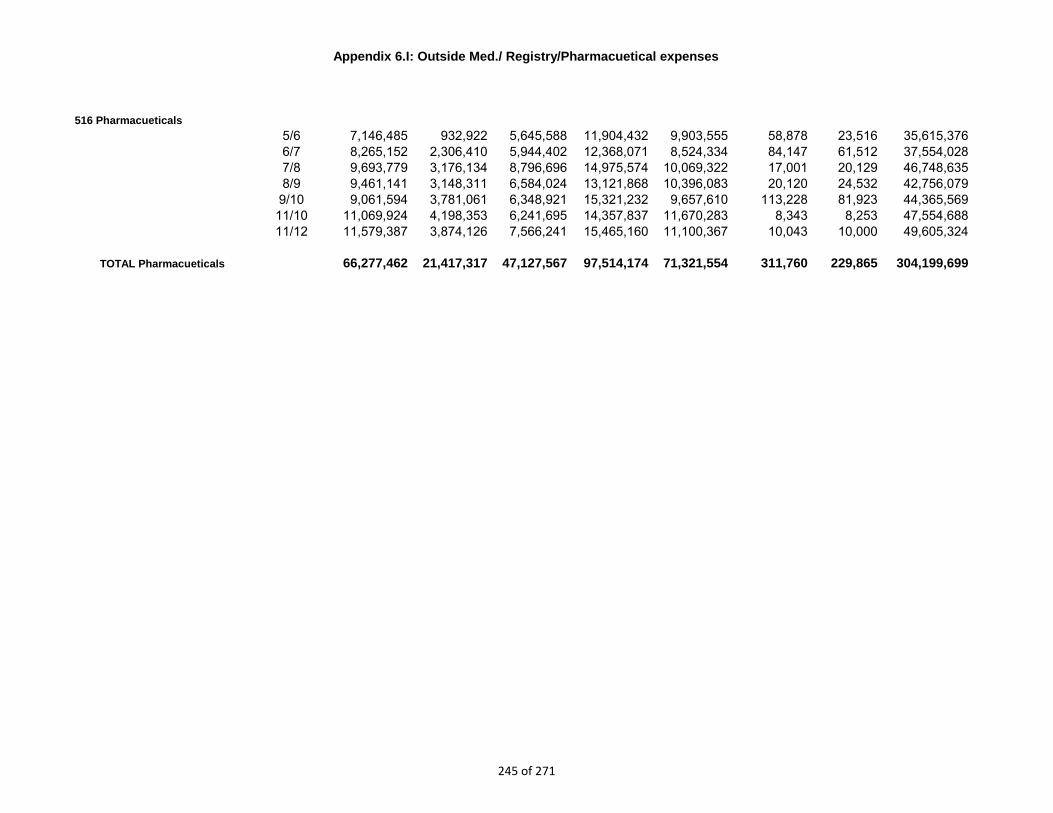
Appendix 6.I: Outside Med./ Registry/Pharmacuetical expenses
516 Pharmacueticals
5/6 7,146,485 932,922 5,645,588 11,904,432 9,903,555 58,878 23,516 35,615,376
6/7 8,265,152 2,306,410 5,944,402 12,368,071 8,524,334 84,147 61,512 37,554,028
7/8 9,693,779 3,176,134 8,796,696 14,975,574 10,069,322 17,001 20,129 46,748,635
8/9 9,461,141 3,148,311 6,584,024 13,121,868 10,396,083 20,120 24,532 42,756,079
9/10 9,061,594 3,781,061 6,348,921 15,321,232 9,657,610 113,228 81,923 44,365,569
11/10 11,069,924 4,198,353 6,241,695 14,357,837 11,670,283 8,343 8,253 47,554,688
11/12 11,579,387 3,874,126 7,566,241 15,465,160 11,100,367 10,043 10,000 49,605,324
TOTAL Pharmacueticals 66,277,462 21,417,317 47,127,567 97,514,174 71,321,554 311,760 229,865 304,199,699
245 of 271

07/08 Outside
Hospitalization in $
# of
Hospitalization
s over
$100,000
07/08 Outside
Medical Services in $
08/09 Outside
Hospitalization
in $
# of
Hospitalizations
over $100,000
08/09 Outside
Medical Services in
$
09/10 Outside
Hospitalization in $
# of
Hospitalization
s over
$100,000
$ Amount of
Hospitalizations
due to violence
(harm to
09/10 Outside
Medical
Services in $
10/11 Outside
Hospitalization in $
# of
Hospitalization
s over
$100,000
$ Amount of
Hospitalizations
due to violence
(harm to
10/11 Outside
Medical Services in $
$1,926,238.20
5 totaling
$953,574.12 $2,553,704.86 $828,817.76
1 totaling
$359,019.67 $2,018,787.66 $1,584,898.48 0 $2,995.12 $1,488,980.13 $2,171,249.66 0 $63,746.96 $2,186,244.40
07/08 Outside
Hospitalization in $
# of
Hospitalization
s over
$100,000
07/08 Outside
Medical Services in $
08/09 Outside
Hospitalization
in $
# of
Hospitalizations
over $100,000
08/09 Outside
Medical Services in
$
09/10 Outside
Hospitalization in $
# of
Hospitalization
s over
$100,000
$ Amount of
Hospitalizations
due to violence
(harm to self, harm
to others)*
09/10 Outside
Medical
Services in $
10/11 Outside
Hospitalization in $
# of
Hospitalization
s over
$100,000
$ Amount of
Hospitalizations
due to violence
(harm to self, harm
to others)*
10/11 Outside
Medical Services in $
$1,468,652.86 0 $3,705,493.93 $4,981,094.461 totaling
$266,859.05$4,272,630.34
$8,063,275.94
(includes BOC)0
3 incidents
totaling:
$18,196.66
$2,541,074.10
(includes BOC)$5,279,786.73
1 totaling
$356,134.42
7 incidents
totaling:
$41,586.57
$3,438,157.96
07/08 Outside
Hospitalization in $
# of
Hospitalization
s over
$100,000
07/08 Outside
Medical Services in $
08/09 Outside
Hospitalization
in $
# of
Hospitalizations
over $100,000
08/09 Outside
Medical Services in
$
09/10 Outside
Hospitalization in $
# of
Hospitalization
s over
$100,000
$ Amount of
Hospitalizations
due to violence
(harm to self, harm
to others)*
09/10 Outside
Medical
Services in $
10/11 Outside
Hospitalization in $
# of
Hospitalization
s over
$100,000
$ Amount of
Hospitalizations
due to violence
(harm to self, harm
to others)*
10/11 Outside
Medical Services in $
7,597.59$ 0 22,478.98$ 71,767.34$ 0 36,739.22$ 341,877.68$ 0
5 incidents
totalling:
$3,410.22 50,148.99$ 152,877.95$ 0
11 incidents
totalling:
$12,609.59 76,284.11$
07/08 Outside
Hospitalization in $
# of
Hospitalization
s over
$100,000
07/08 Outside
Medical Services in $
08/09 Outside
Hospitalization
in $
# of
Hospitalizations
over $100,000
08/09 Outside
Medical Services in
$
09/10 Outside
Hospitalization in $
# of
Hospitalization
s over
$100,000
$ Amount of
Hospitalizations
due to violence
(harm to self, harm
to others)*
09/10 Outside
Medical
Services in $
10/11 Outside
Hospitalization in $
# of
Hospitalization
s over
$100,000
$ Amount of
Hospitalizations
due to violence
(harm to self, harm
to others)*
10/11 Outside
Medical Services in $
1,444,722.34$ 3 $ 1,375,810.72 4,336,301.56$ 3 $ 2,230,331.05 $6,577,133.59 (includes BOC)8
10 incidents
totalling: $
251,948.08
$2,821,504.97
(includes BOC) 7,576,256.63$ 6
16 incidents
totalling:
$804,742.45 $ 2,661,722.37
07/08 Outside
Hospitalization in $
# of
Hospitalization
s over
$100,000
07/08 Outside
Medical Services in $
08/09 Outside
Hospitalization
in $
# of
Hospitalizations
over $100,000
08/09 Outside
Medical Services in
$
09/10 Outside
Hospitalization in $
# of
Hospitalization
s over
$100,000
$ Amount of
Hospitalizations
due to violence
(harm to self, harm
to others)*
09/10 Outside
Medical
Services in $
10/11 Outside
Hospitalization in $
# of
Hospitalization
s over
$100,000
$ Amount of
Hospitalizations
due to violence
(harm to self, harm
to others)*
10/11 Outside
Medical Services in $
$15,346,445.66 15 $4,015,217.12 $11,377,413.22 24 $5,270,767.48 $10,401,909.26 25 356,411.55 $3,150,591.42 $11,194,420.56 14 366,966.31 $6,653,789.59
PSH
2009-10 (Amount Includes Board of Control Claims)2007-08 2008-09
Appendix 6.J: State Hospital Outside Medical Costs
2010-11
ASH
CSH
MSH
NSH
246 of 271
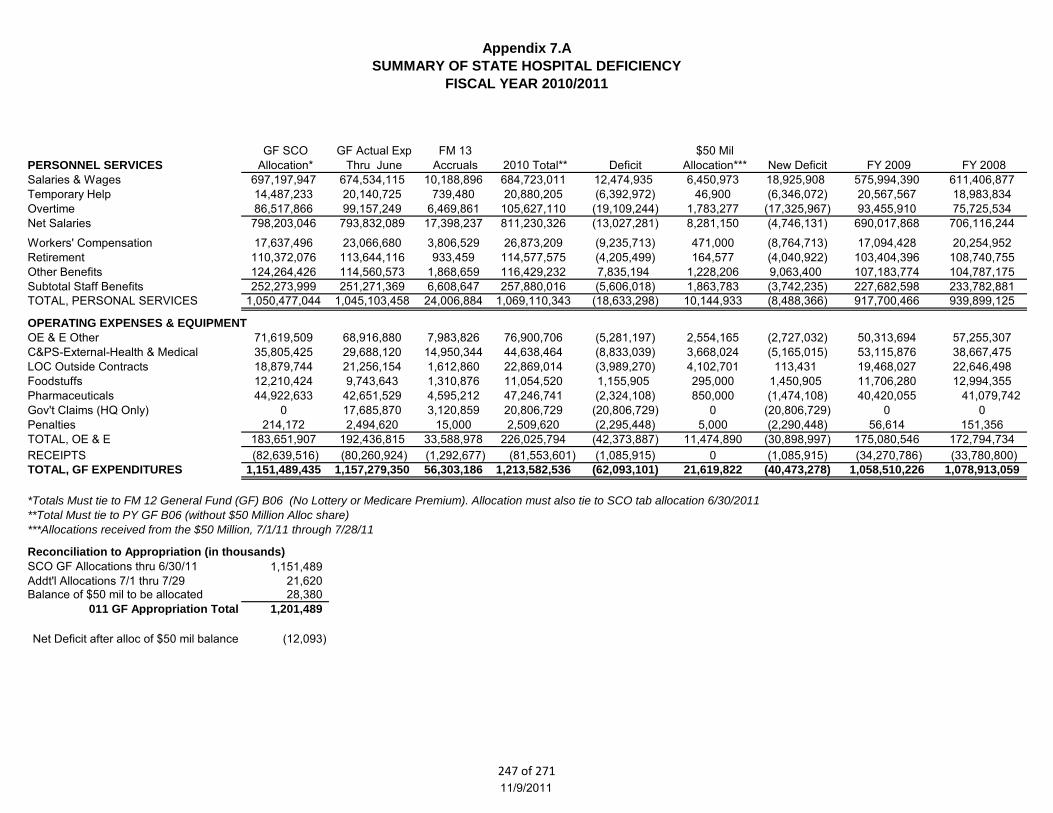
Appendix 7.A
SUMMARY OF STATE HOSPITAL DEFICIENCY
FISCAL YEAR 2010/2011
GF SCO GF Actual Exp FM 13 $50 Mil
PERSONNEL SERVICES Allocation* Thru June Accruals 2010 Total** Deficit Allocation*** New Deficit FY 2009 FY 2008
Salaries & Wages 697,197,947 674,534,115 10,188,896 684,723,011 12,474,935 6,450,973 18,925,908 575,994,390 611,406,877
Temporary Help 14,487,233 20,140,725 739,480 20,880,205 (6,392,972) 46,900 (6,346,072) 20,567,567 18,983,834
Overtime 86,517,866 99,157,249 6,469,861 105,627,110 (19,109,244) 1,783,277 (17,325,967) 93,455,910 75,725,534
Net Salaries 798,203,046 793,832,089 17,398,237 811,230,326 (13,027,281) 8,281,150 (4,746,131) 690,017,868 706,116,244
Workers' Compensation 17,637,496 23,066,680 3,806,529 26,873,209 (9,235,713) 471,000 (8,764,713) 17,094,428 20,254,952
Retirement 110,372,076 113,644,116 933,459 114,577,575 (4,205,499) 164,577 (4,040,922) 103,404,396 108,740,755
Other Benefits 124,264,426 114,560,573 1,868,659 116,429,232 7,835,194 1,228,206 9,063,400 107,183,774 104,787,175
Subtotal Staff Benefits 252,273,999 251,271,369 6,608,647 257,880,016 (5,606,018) 1,863,783 (3,742,235) 227,682,598 233,782,881
TOTAL, PERSONAL SERVICES 1,050,477,044 1,045,103,458 24,006,884 1,069,110,343 (18,633,298) 10,144,933 (8,488,366) 917,700,466 939,899,125
OPERATING EXPENSES & EQUIPMENT
OE & E Other 71,619,509 68,916,880 7,983,826 76,900,706 (5,281,197) 2,554,165 (2,727,032) 50,313,694 57,255,307
C&PS-External-Health & Medical 35,805,425 29,688,120 14,950,344 44,638,464 (8,833,039) 3,668,024 (5,165,015) 53,115,876 38,667,475
LOC Outside Contracts 18,879,744 21,256,154 1,612,860 22,869,014 (3,989,270) 4,102,701 113,431 19,468,027 22,646,498
Foodstuffs 12,210,424 9,743,643 1,310,876 11,054,520 1,155,905 295,000 1,450,905 11,706,280 12,994,355
Pharmaceuticals 44,922,633 42,651,529 4,595,212 47,246,741 (2,324,108) 850,000 (1,474,108) 40,420,055 41,079,742
Gov't Claims (HQ Only) 0 17,685,870 3,120,859 20,806,729 (20,806,729) 0 (20,806,729) 0 0
Penalties 214,172 2,494,620 15,000 2,509,620 (2,295,448) 5,000 (2,290,448) 56,614 151,356
TOTAL, OE & E 183,651,907 192,436,815 33,588,978 226,025,794 (42,373,887) 11,474,890 (30,898,997) 175,080,546 172,794,734
RECEIPTS (82,639,516) (80,260,924) (1,292,677) (81,553,601) (1,085,915) 0 (1,085,915) (34,270,786) (33,780,800)
TOTAL, GF EXPENDITURES 1,151,489,435 1,157,279,350 56,303,186 1,213,582,536 (62,093,101) 21,619,822 (40,473,278) 1,058,510,226 1,078,913,059
*Totals Must tie to FM 12 General Fund (GF) B06 (No Lottery or Medicare Premium). Allocation must also tie to SCO tab allocation 6/30/2011
**Total Must tie to PY GF B06 (without $50 Million Alloc share)
***Allocations received from the $50 Million, 7/1/11 through 7/28/11
Reconciliation to Appropriation (in thousands)
SCO GF Allocations thru 6/30/11 1,151,489
Addt'l Allocations 7/1 thru 7/29 21,620Balance of $50 mil to be allocated 28,380
011 GF Appropriation Total 1,201,489
Net Deficit after alloc of $50 mil balance (12,093)
11/9/2011
247 of 271

Appendix 7.B: Hospital System Summary
2011-12 Operating Expenditure Projections
Object BUDGET CATEGORIES / FY July August Sept October November December January February March April May June FM 13 Total Operating
Code LINE ITEMS Allocation Actual Actual Projection Projection Projection Projection Projection Projection Projection Projection Projection Projection Projection Expenditures Surplus/(Deficit)
PERSONAL SERVICES
003 Salaries & Wages 09/10 563,994,868 43,381,305 50,098,478 50,256,886 49,879,094 49,503,397 50,199,182 51,283,141 50,417,171 49,194,566 50,566,489 50,359,733 54,933,131 9,769,885 609,842,460 (45,847,592)
(includes 088 Holiday Pay) 10/11 634,309,218 49,870,456 53,193,643 53,007,872 52,829,332 54,290,303 55,330,515 55,661,900 55,389,066 54,154,781 56,559,710 53,180,977 55,372,624 13,564,616 662,405,793 (28,096,575)
Avg. Jun & Aug- 5% inc in Nov. 11/12 642,524,923 48,270,047 54,727,669 55,956,068 55,407,542 57,609,918 57,748,871 58,414,692 58,385,523 57,915,204 58,174,443 58,106,786 58,581,160 11,527,067 690,824,990 (48,300,067)
033 Temp Help 09/10 13,568,279 596,534 1,710,225 1,705,489 1,750,533 1,733,567 1,807,679 1,739,530 1,773,183 1,478,127 1,597,844 1,469,297 1,525,268 638,703 19,525,980 (5,957,701)
10/11 17,840,326 570,795 1,607,112 1,686,247 1,723,000 1,782,072 1,720,532 1,873,750 1,815,745 1,699,512 1,789,351 1,678,486 1,972,603 567,966 20,487,173 (2,646,847)
August actual for entire year 11/12 2,439,278 525,003 1,712,952 1,720,199 1,801,021 1,784,749 1,759,486 1,740,472 1,711,332 1,748,066 1,751,986 1,695,226 1,692,127 745,822 20,388,441 (17,949,162)
083 Overtime 09/10 84,523,733 935,899 7,430,484 8,341,945 7,935,951 9,449,445 8,595,533 8,585,582 9,294,254 8,030,461 8,301,230 9,053,231 9,719,890 4,723,379 100,397,286 (15,873,552)
10/11 111,336,028 1,425,232 9,600,592 8,868,027 8,615,050 10,035,062 8,701,185 9,766,232 9,399,327 8,803,621 9,438,628 10,464,864 9,910,924 4,964,743 109,993,489 1,342,539
Aug X 9, Oct and Nov PY OT for Court Monitors 11/12 63,166,496 1,266,011 9,847,551 8,971,350 8,935,136 9,685,512 9,278,941 9,506,585 9,180,728 8,996,186 9,150,340 9,729,900 9,505,019 6,589,032 110,642,292 (47,475,795)
FY 09/10 Subtotal - Salaries 09/10 662,086,880 44,913,738 59,239,187 60,304,321 59,565,579 60,686,409 60,602,395 61,608,253 61,484,609 58,703,154 60,465,564 60,882,261 66,178,289 15,131,967 729,765,726 (67,678,845)
FY 10/11 Subtotal - Salaries 10/11 763,485,572 51,866,483 64,401,347 63,562,147 63,167,382 66,107,437 65,752,233 67,301,883 66,604,138 64,657,914 67,787,690 65,324,326 67,256,151 19,097,325 792,886,455 (29,400,883)
FY 11/12 Subtotal - Salaries 11/12 708,130,698 50,061,062 66,288,172 66,647,616 66,143,700 69,080,178 68,787,298 69,661,749 69,277,583 68,659,456 69,076,770 69,531,912 69,778,306 18,861,921 821,855,722 (113,725,025)
Staff Benefits:
103 OASDI 09/10 24,164,746 1,763,167 1,806,091 1,747,961 1,727,429 1,782,598 1,871,446 1,874,728 1,865,655 1,881,066 1,816,969 1,837,370 1,838,162 51,092 21,863,735 2,301,011
104 Dental Ins & 105 Health/Welfare included in 134 below10/11 25,601,912 1,845,941 1,803,901 1,823,304 1,828,092 1,840,505 2,032,444 2,008,143 2,052,332 2,030,513 2,039,017 2,017,221 2,051,817 48,233 23,421,463 2,180,449
August actual for entire year 11/12 24,814,495 1,961,316 1,988,698 2,007,766 1,990,813 2,040,623 2,114,889 2,154,361 2,186,911 2,222,741 2,241,085 2,286,165 2,354,680 187,489 25,737,539 (923,044)
106 Retirement 09/10 121,238,687 7,989,331 9,022,754 9,134,207 9,130,722 9,066,994 9,160,808 9,283,964 9,102,977 8,987,080 9,235,759 9,093,194 9,394,120 373,953 108,975,862 12,262,825
10/11 126,528,162 9,135,893 9,572,320 9,656,856 14,408,524 11,274,854 11,504,761 9,146,464 9,220,112 9,039,752 9,437,335 8,944,394 9,258,501 540,086 121,139,851 5,388,310
August actual for entire year 11/12 116,591,082 8,453,002 9,541,755 9,881,612 10,698,566 10,456,748 10,534,170 10,300,982 10,300,784 10,273,429 10,273,311 10,271,011 10,328,289 1,471,793 122,785,452 (6,194,370)
125 Workers' Compensation 09/10 20,670,145 0 0 4,581,120 1,928,755 1,646,923 1,878,835 2,082,416 1,870,215 1,774,200 2,283,931 2,437,189 (4,431,574) (3,108,134) 12,943,877 7,726,267
10/11 21,955,039 0 0 0 1,322,876 7,151,647 3,945,107 2,103,000 2,612,860 2,005,056 2,683,760 1,295,492 0 4,224,486 27,344,285 (5,389,246)
Average May - August 11/12 26,581,322 539,233 1,858,557 3,283,071 2,296,142 2,671,839 2,331,491 2,160,003 2,411,567 2,224,303 2,349,786 2,197,231 2,128,182 1,177,891 27,629,296 (1,047,973)
127 Industrial Disability Leave 09/10 7,030,937 327,494 496,769 555,970 569,005 539,537 560,918 670,069 604,971 757,872 712,415 600,149 641,990 344,843 7,382,000 (351,064)
10/11 8,774,076 372,860 527,220 537,839 554,814 687,671 816,971 707,690 733,578 839,307 1,033,172 768,348 834,746 279,756 8,693,971 80,105
August actual for entire year 11/12 8,437,200 472,799 666,274 793,259 681,941 772,527 833,332 726,841 744,776 794,686 782,197 726,789 738,114 208,876 8,942,411 (505,211)
132 Nonindustrial Disability Leave 09/10 2,644,703 33,486 126,838 117,784 221,270 173,289 234,549 182,486 229,856 343,839 311,720 264,435 231,753 58,526 2,529,829 114,873
10/11 3,086,709 48,363 115,520 183,654 289,362 171,533 241,423 181,166 277,940 204,789 287,541 352,460 381,268 101,294 2,836,314 250,394
August actual for entire year 11/12 3,000,096 32,847 216,533 240,849 321,821 241,163 220,632 233,426 315,865 275,508 322,881 320,523 302,623 155,957 3,200,627 (200,531)
133 Unemployment Insurance 09/10 1,641,563 0 0 0 0 357,263 165,462 144,720 0 498,505 0 223,580 208,538 249,000 1,847,068 (205,505)
10/11 1,689,160 0 0 0 127,641 186,274 213,683 0 (15,515) 232,017 (21,125) 164,611 337,919 261,500 1,487,005 202,154
Same as last year (SALY) 11/12 1,477,882 2,132 18,553 19,103 163,478 246,444 39,391 164,686 39,760 134,630 164,537 121,428 231,427 285,342 1,630,911 (153,029)
134 Other 09/10 78,783,368 5,988,569 6,319,893 5,486,544 5,463,637 6,383,547 6,525,394 6,549,858 6,567,730 6,620,995 6,567,989 6,543,238 6,673,774 419,846 76,111,015 2,672,354
(includes 135 Life Insur, 136 Vision, 137 Medicare) 10/11 88,501,132 6,187,251 6,463,557 6,580,613 6,838,058 6,799,644 7,355,003 7,316,513 7,256,603 7,354,856 7,417,505 7,281,624 7,250,611 836,773 84,938,613 3,562,520
August actual for entire year 11/12 81,170,130 6,905,758 7,232,769 7,269,613 7,165,072 7,362,271 7,415,230 7,455,554 7,416,667 7,445,694 7,404,919 7,414,641 7,466,028 826,278 88,780,495 (7,610,366)
FY 09/10 Subtotal - Staff Benefits 09/10 256,174,149 16,102,047 17,772,345 21,623,586 19,040,817 19,950,150 20,397,412 20,788,242 20,241,404 20,863,557 20,928,784 20,999,153 14,556,763 (1,610,873) 231,653,386 24,520,762
FY 10/11 Subtotal - Staff Benefits 10/11 276,136,190 17,590,308 18,482,518 18,782,266 25,369,367 28,112,127 26,109,392 21,462,977 22,137,910 21,706,290 22,877,207 20,824,150 20,114,862 6,292,127 269,861,502 6,274,688
FY 11/12 Subtotal - Staff Benefits 11/12 262,072,206 18,367,087 21,523,138 23,495,272 23,317,833 23,791,617 23,489,135 23,195,852 23,416,331 23,370,990 23,538,715 23,337,790 23,549,345 4,313,625 278,706,731 (16,634,525)
11/16/2011 Page 1 of 4
248 of 271
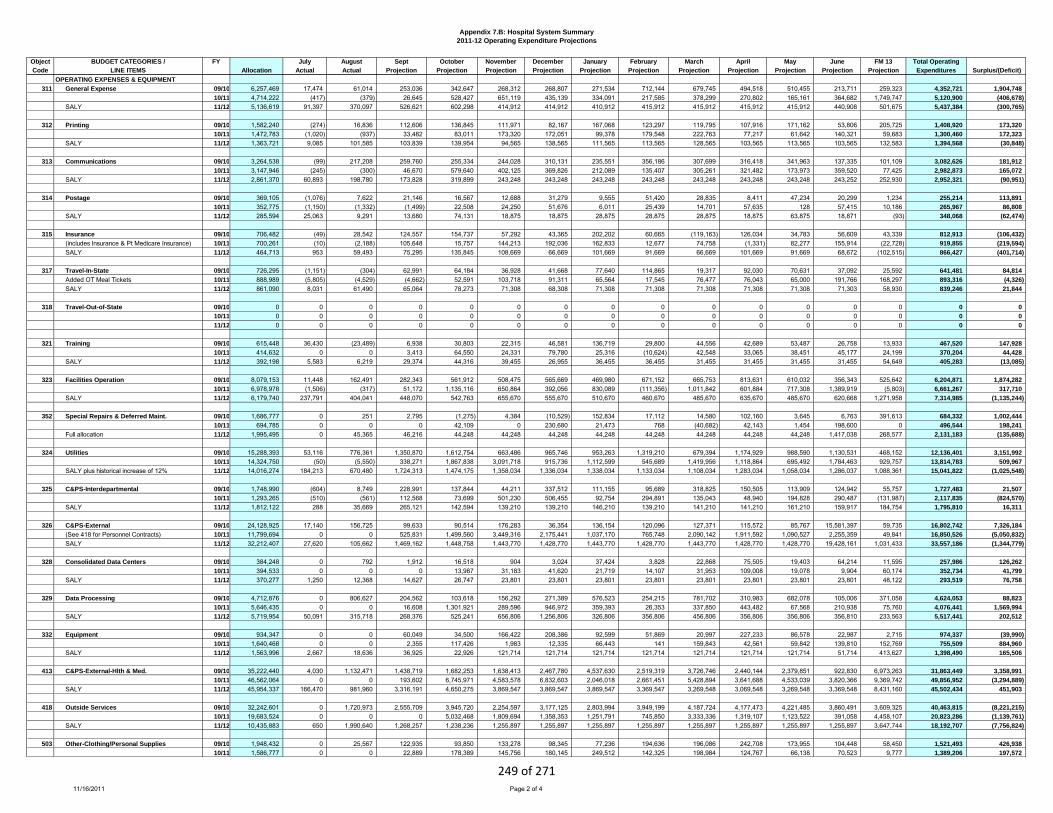
Appendix 7.B: Hospital System Summary
2011-12 Operating Expenditure Projections
Object BUDGET CATEGORIES / FY July August Sept October November December January February March April May June FM 13 Total Operating
Code LINE ITEMS Allocation Actual Actual Projection Projection Projection Projection Projection Projection Projection Projection Projection Projection Projection Expenditures Surplus/(Deficit)
OPERATING EXPENSES & EQUIPMENT
311 General Expense 09/10 6,257,469 17,474 61,014 253,036 342,647 268,312 268,807 271,534 712,144 679,745 494,518 510,455 213,711 259,323 4,352,721 1,904,748
10/11 4,714,222 (417) (379) 26,645 528,427 651,119 435,139 334,091 217,585 378,299 270,802 165,161 364,682 1,749,747 5,120,900 (406,678)
SALY 11/12 5,136,619 91,397 370,097 526,621 602,298 414,912 414,912 410,912 415,912 415,912 415,912 415,912 440,908 501,675 5,437,384 (300,765)
312 Printing 09/10 1,582,240 (274) 16,836 112,606 136,845 111,971 82,167 167,068 123,297 119,795 107,916 171,162 53,806 205,725 1,408,920 173,320
10/11 1,472,783 (1,020) (937) 33,482 83,011 173,320 172,051 99,378 179,548 222,763 77,217 61,642 140,321 59,683 1,300,460 172,323
SALY 11/12 1,363,721 9,085 101,585 103,839 139,954 94,565 138,565 111,565 113,565 128,565 103,565 113,565 103,565 132,583 1,394,568 (30,848)
313 Communications 09/10 3,264,538 (99) 217,208 259,760 255,334 244,028 310,131 235,551 356,186 307,699 316,418 341,963 137,335 101,109 3,082,626 181,912
10/11 3,147,946 (245) (300) 46,670 579,640 402,125 369,826 212,089 135,407 305,261 321,482 173,973 359,520 77,425 2,982,873 165,072
SALY 11/12 2,861,370 60,893 198,780 173,828 319,899 243,248 243,248 243,248 243,248 243,248 243,248 243,248 243,252 252,930 2,952,321 (90,951)
314 Postage 09/10 369,105 (1,076) 7,622 21,146 16,567 12,688 31,279 9,555 51,420 28,835 8,411 47,234 20,299 1,234 255,214 113,891
10/11 352,775 (1,150) (1,332) (1,499) 22,508 24,250 51,676 6,011 25,439 14,701 57,635 128 57,415 10,186 265,967 86,808
SALY 11/12 285,594 25,063 9,291 13,680 74,131 18,875 18,875 28,875 28,875 28,875 18,875 63,875 18,871 (93) 348,068 (62,474)
315 Insurance 09/10 706,482 (49) 28,542 124,557 154,737 57,292 43,365 202,202 60,665 (119,163) 126,034 34,783 56,609 43,339 812,913 (106,432)
(includes Insurance & Pt Medicare Insurance) 10/11 700,261 (10) (2,188) 105,648 15,757 144,213 192,036 162,833 12,677 74,758 (1,331) 82,277 155,914 (22,728) 919,855 (219,594)
SALY 11/12 464,713 953 59,493 75,295 135,845 108,669 66,669 101,669 91,669 66,669 101,669 91,669 68,672 (102,515) 866,427 (401,714)
317 Travel-In-State 09/10 726,295 (1,151) (304) 62,991 64,184 36,928 41,668 77,640 114,865 19,317 92,030 70,631 37,092 25,592 641,481 84,814
Added OT Meal Tickets 10/11 888,989 (5,805) (4,529) (4,662) 52,591 103,718 91,311 65,564 17,545 76,477 76,043 65,000 191,766 168,297 893,316 (4,326)
SALY 11/12 861,090 8,031 61,490 65,064 78,273 71,308 68,308 71,308 71,308 71,308 71,308 71,308 71,303 58,930 839,246 21,844
318 Travel-Out-of-State 09/10 0 0 0 0 0 0 0 0 0 0 0 0 0 0 0 0
10/11 0 0 0 0 0 0 0 0 0 0 0 0 0 0 0 0
11/12 0 0 0 0 0 0 0 0 0 0 0 0 0 0 0 0
321 Training 09/10 615,448 36,430 (23,489) 6,938 30,803 22,315 46,581 136,719 29,800 44,556 42,689 53,487 26,758 13,933 467,520 147,928
10/11 414,632 0 0 3,413 64,550 24,331 79,780 25,316 (10,624) 42,548 33,065 38,451 45,177 24,199 370,204 44,428
SALY 11/12 392,198 5,583 6,219 29,374 44,316 39,455 26,955 36,455 36,455 31,455 31,455 31,455 31,455 54,649 405,283 (13,085)
323 Facilities Operation 09/10 8,079,153 11,448 162,491 282,343 561,912 508,475 565,669 469,980 671,152 665,753 813,631 610,032 356,343 525,642 6,204,871 1,874,282
10/11 6,978,978 (1,506) (317) 51,172 1,135,116 650,864 392,056 830,089 (111,356) 1,011,842 601,884 717,308 1,389,919 (5,803) 6,661,267 317,710
SALY 11/12 6,179,740 237,791 404,041 448,070 542,763 655,670 555,670 510,670 460,670 485,670 635,670 485,670 620,668 1,271,958 7,314,985 (1,135,244)
352 Special Repairs & Deferred Maint. 09/10 1,686,777 0 251 2,795 (1,275) 4,384 (10,529) 152,834 17,112 14,580 102,160 3,645 6,763 391,613 684,332 1,002,444
10/11 694,785 0 0 0 42,109 0 230,680 21,473 768 (40,682) 42,143 1,454 198,600 0 496,544 198,241
Full allocation 11/12 1,995,495 0 45,365 46,216 44,248 44,248 44,248 44,248 44,248 44,248 44,248 44,248 1,417,038 268,577 2,131,183 (135,688)
324 Utilities 09/10 15,288,393 53,116 776,361 1,350,870 1,612,754 663,486 965,746 953,263 1,319,210 679,394 1,174,929 988,590 1,130,531 468,152 12,136,401 3,151,992
10/11 14,324,750 (50) (5,550) 338,271 1,867,838 3,091,718 915,736 1,112,599 545,689 1,419,956 1,118,864 695,492 1,784,463 929,757 13,814,783 509,967
SALY plus historical increase of 12% 11/12 14,016,274 184,213 670,480 1,724,313 1,474,175 1,358,034 1,336,034 1,338,034 1,133,034 1,108,034 1,283,034 1,058,034 1,286,037 1,088,361 15,041,822 (1,025,548)
325 C&PS-Interdepartmental 09/10 1,748,990 (604) 8,749 228,991 137,844 44,211 337,512 111,155 95,689 318,825 150,505 113,909 124,942 55,757 1,727,483 21,507
10/11 1,293,265 (510) (561) 112,568 73,699 501,230 506,455 92,754 294,891 135,043 48,940 194,828 290,487 (131,987) 2,117,835 (824,570)
SALY 11/12 1,812,122 288 35,669 265,121 142,594 139,210 139,210 146,210 139,210 141,210 141,210 161,210 159,917 184,754 1,795,810 16,311
326 C&PS-External 09/10 24,128,925 17,140 156,725 99,633 90,514 176,283 36,354 136,154 120,096 127,371 115,572 85,767 15,581,397 59,735 16,802,742 7,326,184
(See 418 for Personnel Contracts) 10/11 11,799,694 0 0 525,831 1,499,560 3,449,316 2,175,441 1,037,170 765,748 2,090,142 1,911,592 1,090,527 2,255,359 49,841 16,850,526 (5,050,832)
SALY 11/12 32,212,407 27,620 105,662 1,469,162 1,448,758 1,443,770 1,428,770 1,443,770 1,428,770 1,443,770 1,428,770 1,428,770 19,428,161 1,031,433 33,557,186 (1,344,779)
328 Consolidated Data Centers 09/10 384,248 0 792 1,912 16,518 904 3,024 37,424 3,828 22,868 75,505 19,403 64,214 11,595 257,986 126,262
10/11 394,533 0 0 0 13,987 31,183 41,620 21,719 14,107 31,953 109,008 19,078 9,904 60,174 352,734 41,799
SALY 11/12 370,277 1,250 12,368 14,627 26,747 23,801 23,801 23,801 23,801 23,801 23,801 23,801 23,801 48,122 293,519 76,758
329 Data Processing 09/10 4,712,876 0 806,627 204,562 103,618 156,292 271,389 576,523 254,215 781,702 310,983 682,078 105,006 371,058 4,624,053 88,823
10/11 5,646,435 0 0 16,608 1,301,921 289,596 946,972 359,393 26,353 337,850 443,482 67,568 210,938 75,760 4,076,441 1,569,994
SALY 11/12 5,719,954 50,091 315,718 268,376 525,241 656,806 1,256,806 326,806 356,806 456,806 356,806 356,806 356,810 233,563 5,517,441 202,512
332 Equipment 09/10 934,347 0 0 60,049 34,500 166,422 208,386 92,599 51,869 20,997 227,233 86,578 22,987 2,715 974,337 (39,990)
10/11 1,640,468 0 0 2,355 117,426 1,983 12,335 66,443 141 159,843 42,561 59,842 139,810 152,769 755,509 884,960
SALY 11/12 1,563,996 2,667 18,636 36,925 22,926 121,714 121,714 121,714 121,714 121,714 121,714 121,714 51,714 413,627 1,398,490 165,506
413 C&PS-External-Hlth & Med. 09/10 35,222,440 4,030 1,132,471 1,438,719 1,682,253 1,638,413 2,467,780 4,537,630 2,519,319 3,726,746 2,440,144 2,379,851 922,830 6,973,263 31,863,449 3,358,991
10/11 46,562,064 0 0 193,602 6,745,971 4,583,578 6,832,603 2,046,018 2,661,451 5,428,894 3,641,688 4,533,039 3,820,366 9,369,742 49,856,952 (3,294,889)
SALY 11/12 45,954,337 166,470 981,960 3,316,191 4,650,275 3,869,547 3,869,547 3,869,547 3,369,547 3,269,548 3,069,548 3,269,548 3,369,548 8,431,160 45,502,434 451,903
418 Outside Services 09/10 32,242,601 0 1,720,973 2,555,709 3,945,720 2,254,597 3,177,125 2,803,994 3,949,199 4,187,724 4,177,473 4,221,485 3,860,491 3,609,325 40,463,815 (8,221,215)
10/11 19,683,524 0 0 0 5,032,468 1,809,694 1,358,353 1,251,791 745,850 3,333,336 1,319,107 1,123,522 391,058 4,458,107 20,823,286 (1,139,761)
SALY 11/12 10,435,883 650 1,990,640 1,268,257 1,238,236 1,255,897 1,255,897 1,255,897 1,255,897 1,255,897 1,255,897 1,255,897 1,255,897 3,647,744 18,192,707 (7,756,824)
503 Other-Clothing/Personal Supplies 09/10 1,948,432 0 25,567 122,935 93,850 133,278 98,345 77,236 194,636 196,086 242,708 173,955 104,448 58,450 1,521,493 426,938
10/11 1,586,777 0 0 22,889 178,389 145,756 180,145 249,512 142,325 198,984 124,767 66,138 70,523 9,777 1,389,206 197,572
11/16/2011 Page 2 of 4
249 of 271
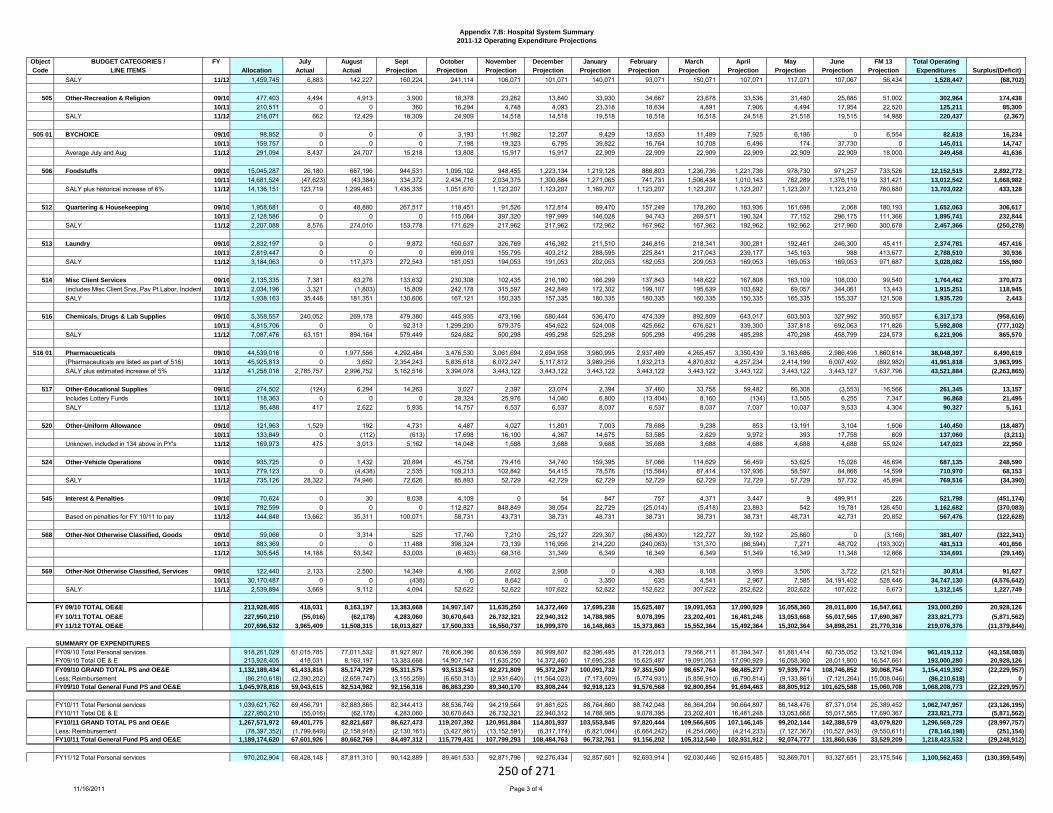
Appendix 7.B: Hospital System Summary
2011-12 Operating Expenditure Projections
Object BUDGET CATEGORIES / FY July August Sept October November December January February March April May June FM 13 Total Operating
Code LINE ITEMS Allocation Actual Actual Projection Projection Projection Projection Projection Projection Projection Projection Projection Projection Projection Expenditures Surplus/(Deficit)
SALY 11/12 1,459,745 6,883 142,227 160,224 241,114 106,071 101,071 140,071 93,071 150,071 107,071 117,071 107,067 56,434 1,528,447 (68,702)
505 Other-Recreation & Religion 09/10 477,403 4,494 4,913 3,900 18,378 23,262 13,840 33,930 34,667 23,678 33,536 31,480 25,885 51,002 302,964 174,438
10/11 210,511 0 0 360 16,294 4,748 4,093 23,318 18,634 4,891 7,906 4,494 17,954 22,520 125,211 85,300
SALY 11/12 218,071 662 12,429 18,309 24,909 14,518 14,518 19,518 18,518 16,518 24,518 21,518 19,515 14,988 220,437 (2,367)
505 01 BYCHOICE 09/10 98,852 0 0 0 3,193 11,982 12,207 9,429 13,653 11,489 7,925 6,186 0 6,554 82,618 16,234
10/11 159,757 0 0 0 7,198 19,323 6,795 39,822 16,764 10,708 6,496 174 37,730 0 145,011 14,747
Average July and Aug 11/12 291,094 8,437 24,707 15,218 13,808 15,917 15,917 22,909 22,909 22,909 22,909 22,909 22,909 18,000 249,458 41,636
506 Foodstuffs 09/10 15,045,287 26,180 667,196 944,531 1,095,102 948,455 1,223,134 1,219,128 886,803 1,236,736 1,221,736 978,730 971,257 733,526 12,152,515 2,892,772
10/11 14,681,524 (47,623) (43,384) 334,372 2,434,716 2,034,375 1,300,884 1,271,065 741,731 1,506,434 1,010,143 762,289 1,376,119 331,421 13,012,542 1,668,982
SALY plus historical increase of 6% 11/12 14,136,151 123,719 1,299,463 1,435,335 1,051,670 1,123,207 1,123,207 1,169,707 1,123,207 1,123,207 1,123,207 1,123,207 1,123,210 760,680 13,703,022 433,128
512 Quartering & Housekeeping 09/10 1,958,681 0 48,880 267,517 118,451 91,526 172,814 89,470 157,249 178,260 183,936 161,698 2,068 180,193 1,652,063 306,617
10/11 2,128,586 0 0 0 115,064 397,320 197,999 146,028 94,743 269,571 190,324 77,152 296,175 111,366 1,895,741 232,844
SALY 11/12 2,207,088 8,576 274,010 153,778 171,629 217,962 217,962 172,962 167,962 167,962 192,962 192,962 217,960 300,678 2,457,366 (250,278)
513 Laundry 09/10 2,832,197 0 0 9,872 160,637 326,769 416,382 211,510 246,816 218,341 300,281 192,461 246,300 45,411 2,374,781 457,416
10/11 2,819,447 0 0 0 699,019 155,795 403,212 288,595 225,841 217,043 239,177 145,163 988 413,677 2,788,510 30,936
SALY 11/12 3,184,063 0 117,373 272,543 181,053 194,053 191,053 202,053 182,053 209,053 169,053 169,053 169,053 971,687 3,028,082 155,980
514 Misc Client Services 09/10 2,135,335 7,381 83,276 133,632 230,308 102,435 216,180 166,299 137,843 148,622 167,808 163,109 108,030 99,540 1,764,462 370,873
(includes Misc Client Srvs, Pay Pt Labor, Incidental Pt Exp, Vol Expense)10/11 2,034,196 3,321 (1,803) 15,809 242,178 315,597 242,849 172,302 199,107 195,639 103,692 69,057 344,061 13,443 1,915,251 118,945
SALY 11/12 1,938,163 35,448 181,351 130,606 167,121 150,335 157,335 180,335 180,335 160,335 150,335 165,335 155,337 121,508 1,935,720 2,443
516 Chemicals, Drugs & Lab Supplies 09/10 5,358,557 240,052 269,178 479,380 445,935 473,196 580,444 536,470 474,339 892,809 643,017 603,503 327,992 350,857 6,317,173 (958,616)
10/11 4,815,706 0 0 92,313 1,299,200 579,375 454,622 524,008 425,662 676,621 339,300 337,818 692,063 171,826 5,592,808 (777,102)
SALY 11/12 7,087,476 63,151 894,164 579,449 524,682 500,298 495,298 525,298 505,298 495,298 485,298 470,298 458,799 224,573 6,221,906 865,570
516 01 Pharmacueticals 09/10 44,539,016 0 1,977,556 4,292,484 3,476,530 3,061,694 2,694,958 3,980,995 2,937,489 4,265,457 3,350,439 3,163,686 2,986,496 1,860,614 38,048,397 6,490,619
(Pharmaceuticals are listed as part of 516) 10/11 45,925,813 0 3,652 2,354,243 5,835,618 6,072,247 5,117,812 3,989,256 1,932,213 4,870,832 4,257,234 2,414,199 6,007,492 (892,982) 41,961,818 3,963,995
SALY plus estimated increase of 5% 11/12 41,258,018 2,785,757 2,996,752 5,162,516 3,394,078 3,443,122 3,443,122 3,443,122 3,443,122 3,443,122 3,443,122 3,443,122 3,443,127 1,637,796 43,521,884 (2,263,865)
517 Other-Educational Supplies 09/10 274,502 (124) 6,294 14,263 3,027 2,397 23,074 2,394 37,460 33,758 59,482 66,308 (3,553) 16,566 261,345 13,157
Includes Lottery Funds 10/11 118,363 0 0 0 28,324 25,976 14,040 6,800 (13,404) 8,160 (134) 13,505 6,255 7,347 96,868 21,495
SALY 11/12 95,488 417 2,622 5,935 14,757 6,537 6,537 8,037 6,537 8,037 7,037 10,037 9,533 4,304 90,327 5,161
520 Other-Uniform Allowance 09/10 121,963 1,529 192 4,731 4,487 4,027 11,801 7,003 78,688 9,238 853 13,191 3,104 1,606 140,450 (18,487)
10/11 133,849 0 (112) (613) 17,698 16,100 4,367 14,675 53,585 2,629 9,972 393 17,758 609 137,060 (3,211)
Unknown, included in 134 above in PY's 11/12 169,973 475 3,013 5,162 14,048 1,588 3,688 9,688 35,688 3,688 4,688 4,688 4,688 55,924 147,023 22,950
524 Other-Vehicle Operations 09/10 935,725 0 1,432 20,894 45,758 79,416 34,740 159,395 57,066 114,629 56,459 53,625 15,026 48,694 687,135 248,590
10/11 779,123 0 (4,438) 2,535 109,213 102,842 54,415 78,576 (15,584) 87,414 137,936 58,597 84,866 14,599 710,970 68,153
SALY 11/12 735,126 28,322 74,946 72,626 85,893 52,729 42,729 62,729 52,729 62,729 72,729 57,729 57,732 45,894 769,516 (34,390)
545 Interest & Penalties 09/10 70,624 0 30 8,038 4,109 0 54 847 757 4,371 3,447 9 499,911 226 521,798 (451,174)
10/11 792,599 0 0 0 112,827 848,849 38,054 22,729 (25,014) (5,418) 23,883 542 19,781 126,450 1,162,682 (370,083)
Based on penalties for FY 10/11 to pay 11/12 444,848 13,662 35,311 100,071 58,731 43,731 38,731 48,731 38,731 38,731 38,731 48,731 42,731 20,852 567,476 (122,628)
568 Other-Not Otherwise Classified, Goods 09/10 59,066 0 3,314 525 17,740 7,210 25,127 229,307 (86,430) 122,727 39,192 25,860 0 (3,166) 381,407 (322,341)
10/11 883,369 0 0 11,488 398,324 73,139 116,956 214,220 (240,063) 131,370 (86,594) 7,271 48,702 (193,302) 481,513 401,856
11/12 305,545 14,188 53,342 53,003 (6,463) 68,316 31,349 6,349 16,349 6,349 51,349 16,349 11,348 12,866 334,691 (29,146)
569 Other-Not Otherwise Classified, Services 09/10 122,440 2,133 2,500 14,349 4,166 2,602 2,908 0 4,383 8,108 3,959 3,506 3,722 (21,521) 30,814 91,627
10/11 30,170,487 0 0 (438) 0 8,642 0 3,350 635 4,541 2,967 7,585 34,191,402 528,446 34,747,130 (4,576,642)
SALY 11/12 2,539,894 3,669 9,112 4,094 52,622 52,622 107,622 52,622 152,622 307,622 252,622 202,622 107,622 6,673 1,312,145 1,227,749
FY 09/10 TOTAL OE&E 213,928,405 418,031 8,163,197 13,383,668 14,907,147 11,635,250 14,372,460 17,695,238 15,625,487 19,091,053 17,090,929 16,058,360 28,011,800 16,547,661 193,000,280 20,928,126
FY 10/11 TOTAL OE&E 227,950,210 (55,016) (62,178) 4,283,060 30,670,643 26,732,321 22,940,312 14,788,985 9,078,395 23,202,401 16,481,248 13,053,668 55,017,565 17,690,367 233,821,773 (5,871,562)
FY 11/12 TOTAL OE&E 207,696,532 3,965,409 11,508,315 18,013,827 17,500,333 16,550,737 16,999,370 16,148,863 15,373,863 15,552,364 15,492,364 15,302,364 34,898,251 21,770,316 219,076,376 (11,379,844)
SUMMARY OF EXPENDITURES
FY09/10 Total Personal services 918,261,029 61,015,785 77,011,532 81,927,907 78,606,396 80,636,559 80,999,807 82,396,495 81,726,013 79,566,711 81,394,347 81,881,414 80,735,052 13,521,094 961,419,112 (43,158,083)
FY09/10 Total OE & E 213,928,405 418,031 8,163,197 13,383,668 14,907,147 11,635,250 14,372,460 17,695,238 15,625,487 19,091,053 17,090,929 16,058,360 28,011,800 16,547,661 193,000,280 20,928,126
FY09/10 GRAND TOTAL PS and OE&E 1,132,189,434 61,433,816 85,174,729 95,311,575 93,513,543 92,271,809 95,372,267 100,091,732 97,351,500 98,657,764 98,485,277 97,939,774 108,746,852 30,068,754 1,154,419,392 (22,229,957)
Less: Reimbursement (86,210,618) (2,390,202) (2,659,747) (3,155,259) (6,650,313) (2,931,640) (11,564,023) (7,173,609) (5,774,931) (5,856,910) (6,790,814) (9,133,861) (7,121,264) (15,008,046) (86,210,618) 0
FY09/10 Total General Fund PS and OE&E 1,045,978,816 59,043,615 82,514,982 92,156,316 86,863,230 89,340,170 83,808,244 92,918,123 91,576,568 92,800,854 91,694,463 88,805,912 101,625,588 15,060,708 1,068,208,773 (22,229,957)
FY10/11 Total Personal services 1,039,621,762 69,456,791 82,883,865 82,344,413 88,536,749 94,219,564 91,861,625 88,764,860 88,742,048 86,364,204 90,664,897 86,148,476 87,371,014 25,389,452 1,062,747,957 (23,126,195)
FY10/11 Total OE & E 227,950,210 (55,016) (62,178) 4,283,060 30,670,643 26,732,321 22,940,312 14,788,985 9,078,395 23,202,401 16,481,248 13,053,668 55,017,565 17,690,367 233,821,773 (5,871,562)
FY10/11 GRAND TOTAL PS and OE&E 1,267,571,972 69,401,775 82,821,687 86,627,473 119,207,392 120,951,884 114,801,937 103,553,845 97,820,444 109,566,605 107,146,145 99,202,144 142,388,579 43,079,820 1,296,569,729 (28,997,757)
Less: Reimbursement (78,397,352) (1,799,849) (2,158,918) (2,130,161) (3,427,961) (13,152,591) (6,317,174) (6,821,084) (6,664,242) (4,254,066) (4,214,233) (7,127,367) (10,527,943) (9,550,611) (78,146,198) (251,154)
FY10/11 Total General Fund PS and OE&E 1,189,174,620 67,601,926 80,662,769 84,497,312 115,779,431 107,799,293 108,484,763 96,732,761 91,156,202 105,312,540 102,931,912 92,074,777 131,860,636 33,529,209 1,218,423,532 (29,248,912)
FY11/12 Total Personal services 970,202,904 68,428,148 87,811,310 90,142,889 89,461,533 92,871,796 92,276,434 92,857,601 92,693,914 92,030,446 92,615,485 92,869,701 93,327,651 23,175,546 1,100,562,453 (130,359,549)
11/16/2011 Page 3 of 4
250 of 271

Appendix 7.B: Hospital System Summary
2011-12 Operating Expenditure Projections
Object BUDGET CATEGORIES / FY July August Sept October November December January February March April May June FM 13 Total Operating
Code LINE ITEMS Allocation Actual Actual Projection Projection Projection Projection Projection Projection Projection Projection Projection Projection Projection Expenditures Surplus/(Deficit)
FY11/12 Total OE & E 207,696,532 3,965,409 11,508,315 18,013,827 17,500,333 16,550,737 16,999,370 16,148,863 15,373,863 15,552,364 15,492,364 15,302,364 34,898,251 21,770,316 219,076,376 (11,379,844)
FY11/12 GRAND TOTAL PS and OE&E 1,177,899,436 72,393,557 99,319,625 108,156,716 106,961,866 109,422,533 109,275,804 109,006,464 108,067,777 107,582,810 108,107,849 108,172,065 128,225,902 44,945,862 1,319,638,829 (141,739,393)
Less: Reimbursement (76,241,826) (3,040,988) (2,543,152) (2,541,409) (2,541,409) (3,733,409) (3,833,409) (3,833,409) (3,933,409) (3,833,409) (3,733,409) (4,033,409) (5,033,409) (33,780,362) (76,414,586) 172,760
FY11/12 Total General Fund PS and OE&E 1,101,657,610 69,352,569 96,776,473 105,615,308 104,420,457 105,689,125 105,442,396 105,173,056 104,134,369 103,749,401 104,374,440 104,138,656 123,192,493 11,165,500 1,243,224,243 (141,566,632)
11/16/2011 Page 4 of 4
251 of 271

SUMMARY OF STATE HOSPITAL ALLOCATIONS AND EXPENDITURES 2009/2010
(IN THOUSANDS)
Estimated Cost Per Population Allocation Expenditures Deficiency Patient ASH 1,022 210,585 221,503 (10,918) 216.7 CSH 829 141,918 150,393 (8,475) 181.4 MSH 668 149,469 151,934 (2,465) 227.4 NSH 1,160 230,599 236,496 (5,897) 203.9 PSH 1,525 286,220 289,397 (3,177) 189.8 SVPP 44,892 44,279 613 VPP 48,235 46,848 1,387 HQ 15,552 15,552 TOTALS 5,204 1,127,470 1,156,402 (28,932)
Cost Per Patient – 5 Hospitals 5,204 1,049,723 201.7 11/08/11
Appendix 7.C
252 of 271

SUMMARY OF STATE HOSPITAL ALLOCATIONSAND EXPENDITURES 2010/2011
(IN THOUSANDS) Estimated Cost Per Percentage Growth Population Allocation Expenditures Deficiency Patient Over Prior Year ASH 1,141 215,520 237,682 (22,162) 208.3 -3.8% CSH 905 174,707 174,230 477 192.5 6.1% MSH 635 149,935 167,118 (17,183) 263.2 15.7% NSH 1,163 222,272 253,683 (31,411) 218.2 7.0% PSH 1,515 262,264 312,338 (50,074) 206.2 8.6% SVPP 68,751 59,655 9,096 VPP 50,659 54,968 (4,309) HQ 30,145 34,189 (4,044) TOTALS 5,359 1,174,253 1,293,863 (119,610)
Cost per patient –5 hospitals 5,359 1,145,051 213.7 5.9% 11/10/11
253 of 271
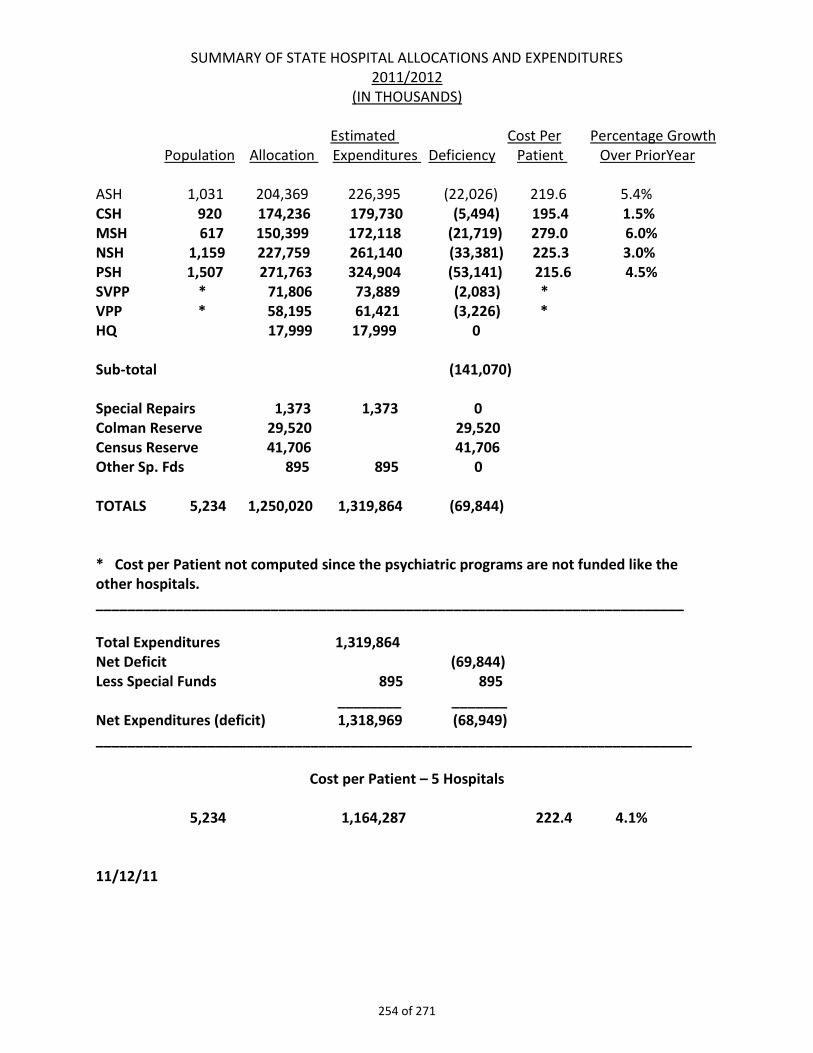
SUMMARY OF STATE HOSPITAL ALLOCATIONS AND EXPENDITURES 2011/2012
(IN THOUSANDS)
Estimated Cost Per Percentage Growth Population Allocation Expenditures Deficiency Patient Over PriorYear ASH 1,031 204,369 226,395 (22,026) 219.6 5.4% CSH 920 174,236 179,730 (5,494) 195.4 1.5% MSH 617 150,399 172,118 (21,719) 279.0 6.0% NSH 1,159 227,759 261,140 (33,381) 225.3 3.0% PSH 1,507 271,763 324,904 (53,141) 215.6 4.5% SVPP * 71,806 73,889 (2,083) * VPP * 58,195 61,421 (3,226) * HQ 17,999 17,999 0 Sub-total (141,070) Special Repairs 1,373 1,373 0 Colman Reserve 29,520 29,520 Census Reserve 41,706 41,706 Other Sp. Fds 895 895 0 TOTALS 5,234 1,250,020 1,319,864 (69,844) * Cost per Patient not computed since the psychiatric programs are not funded like the other hospitals. __________________________________________________________________________ Total Expenditures 1,319,864 Net Deficit (69,844) Less Special Funds 895 895 ________ _______ Net Expenditures (deficit) 1,318,969 (68,949) ___________________________________________________________________________
Cost per Patient – 5 Hospitals 5,234 1,164,287 222.4 4.1% 11/12/11
254 of 271
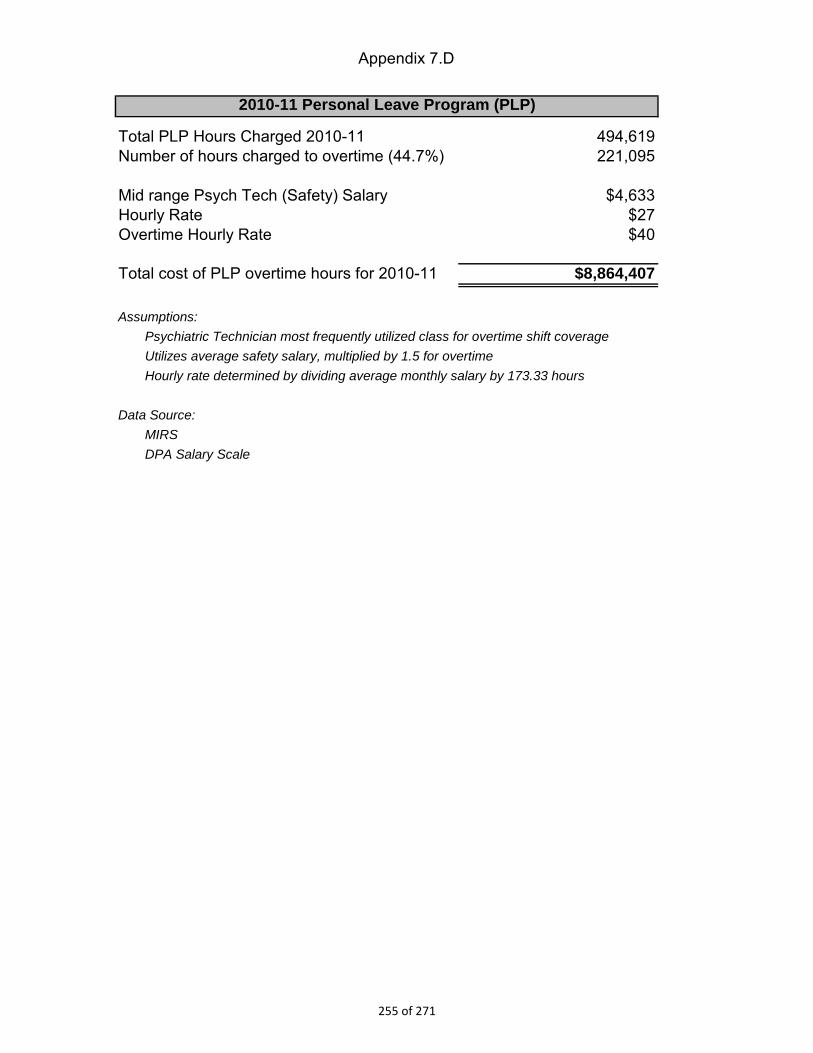
Appendix 7.D
2010-11 Personal Leave Program (PLP)
Total PLP Hours Charged 2010-11 494,619
Number of hours charged to overtime (44.7%) 221,095
Mid range Psych Tech (Safety) Salary $4,633
Hourly Rate $27
Overtime Hourly Rate $40
Total cost of PLP overtime hours for 2010-11 $8,864,407
Assumptions:
Psychiatric Technician most frequently utilized class for overtime shift coverage
Utilizes average safety salary, multiplied by 1.5 for overtime
Hourly rate determined by dividing average monthly salary by 173.33 hours
Data Source:
MIRS
DPA Salary Scale
255 of 271
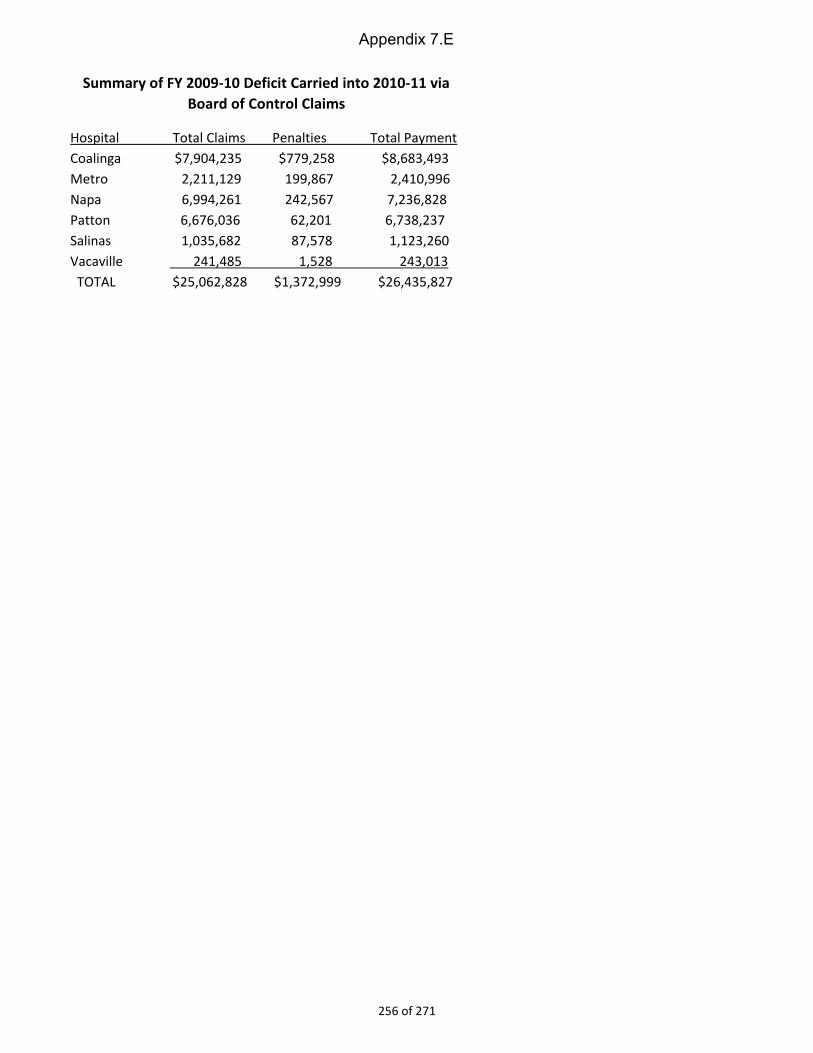
Appendix 7.E
Hospital Total Claims Penalties Total Payment
Coalinga $7,904,235 $779,258 $8,683,493
Metro 2,211,129 199,867 2,410,996
Napa 6,994,261 242,567 7,236,828
Patton 6,676,036 62,201 6,738,237
Salinas 1,035,682 87,578 1,123,260
Vacaville 241,485 1,528 243,013
TOTAL $25,062,828 $1,372,999 $26,435,827
Summary of FY 2009-10 Deficit Carried into 2010-11 via
Board of Control Claims
256 of 271

Appendix 7.F
Position Information from Enhancement Plan BCP
HQ ASH CSH MSH NSH PSH TOTAL
By Choice Psychiatric Technician 0.0 2.0 2.0 2.0 2.0 2.0 10.0 454,269$
Clerical Support Office Technician 0.0 17.0 1.5 13.5 0.0 16.0 48.0 1,681,344$
Compliance Monitoring Psychiatric Social Worker 0.0 4.1 1.0 2.0 3.4 3.8 14.3 868,366$
Compliance Monitoring Registered Nurse 0.0 4.1 1.0 2.0 3.4 3.8 14.3 1,012,780$
Compliance Monitoring Rehabiltation Therapist 0.0 4.1 1.0 2.0 3.4 3.8 14.3 659,123$
Compliance Monitoring Senior Psychiatrist 0.0 8.1 1.0 4.0 6.8 7.6 27.5 4,391,290$
Compliance Monitoring Senior Psychologist 0.0 5.7 1.0 2.8 4.8 5.3 19.6 1,410,265$
Core Clinical and Level of Care Staffing Psychiatric Social Worker 0.0 -3.7 2.7 -6.9 0.3 -8.4 -16.0 (971,599)$
Core Clinical and Level of Care Staffing Psychiatric Technician 0.0 10.3 -0.6 3.7 -2.7 2.3 13.0 590,550$
Core Clinical and Level of Care Staffing Registered Nurse 0.0 5.1 -3.6 11.0 3.9 1.1 17.5 1,239,416$
Core Clinical and Level of Care Staffing Rehabiltation Therapist 0.0 0.0 -2.4 5.0 -4.8 18.3 16.1 742,090$
Core Clinical and Level of Care Staffing Senior Psychiatrist 0.0 -5.4 6.8 2.9 7.5 7.4 19.2 3,065,918$
Core Clinical and Level of Care Staffing Senior Psychologist 0.0 46.1 0.5 22.9 20.8 45.0 135.3 9,735,146$
Dietary Services Clinical Dietician 0.0 2.9 0.0 0.0 1.7 0.9 5.5 256,009$
HQ Support Associate Mental Health Specialist 1.0 0.0 0.0 0.0 0.0 0.0 1.0 57,380$
HQ Support Consulting Psychologist 1.0 0.0 0.0 0.0 0.0 0.0 1.0 65,533$
Investigations Special Investigator 0.0 1.8 0.0 2.1 2.9 1.8 8.6 472,821$
Neuropsychologists Senior Psychologist 0.0 1.0 1.0 1.0 1.0 1.0 5.0 359,761$
PBS Teams Health Records Technician I 0.0 4.7 1.0 2.4 4.0 4.4 16.5 567,879$
PBS Teams Psychiatric Social Worker 0.0 1.0 1.0 1.0 1.0 1.0 5.0 303,625$
PBS Teams Psychiatric Technician 0.0 8.4 1.0 3.8 7.0 7.8 28.0 1,271,953$
PBS Teams Registered Nurse 0.0 4.7 1.0 2.4 4.0 4.4 16.5 1,168,593$
PBS Teams Senior Psychologist 0.0 4.7 1.0 2.4 4.0 4.4 16.5 1,187,213$
Trigger System Health Records Technician I 0.0 1.0 1.0 1.0 1.0 1.0 5.0 172,085$
Trigger System Psychiatric Social Worker 0.0 3.0 2.0 2.0 3.0 3.0 13.0 789,424$
GRAND TOTAL 2.0 130.7 20.9 85.0 78.4 137.7 454.7 31,551,234$
ENHANCEMENT PLAN FY 06-07 BUDGET CHANGE PROPOSAL (BCP) POSITIONS
POSITIONS
CATEGORY CLASSIFICATION AMOUNT
257 of 271

Appendix 7.G
List of Enhancement Plan Redirected Positions
Classification ASH Coalinga Metro Napa Patton Salinas Vacaville Total Annual Cost EP Cost*
Sr Psychiatrist 4 0 4 8 11 0 0 27 $9,632,654 $7,017,182
Sr Psychologist 22 7 8 16 15 0 4 72 $10,292,624 $7,497,956
Psychiatric Social Worker 8 2 4 0 26 0 1 41 $4,154,065 $3,026,147
Rehab Therapist 8 2 7 0 12 0 1 29 $2,841,422 $2,069,915
Registered Nurse 32 23 12 30 34 1 3 134 $16,947,761 $12,346,080
Psychiatric Technician 107 18 23 18 107 0 0 273 $21,598,509 $15,734,050
Health Record Technician 0 3 0 0 1 0 0 4 $248,802 $181,247
Clinical Dietitian 0 11 1 4 6 0 0 21 $1,580,088 $1,151,060
Special Investigator 0 4 1 3 5 0 0 13 $1,105,712 $805,487
Office Technician 4 3 0 10 1 0 0 18 $902,275 $657,288
Stock Clerk 0 0 0 0 1 0 0 1 $45,173 $32,907
Custodian 0 0 0 0 9 0 0 9 $356,334 $259,581
Asst Dir Nutr Service 0 0 0 0 1 0 0 1 $86,116 $62,734
Psych Tech Asst 4 0 0 0 13 0 0 17 $753,523 $548,925
Health Service Specialist 0 0 0 0 1 0 0 1 $126,099 $91,861
Licensed Vocational Nurse 0 0 1 0 3 3 0 7 $404,320 $294,538
Unit Supervisor 5 1 5 0 1 0 0 12 $1,355,687 $987,589
Office Assistant 0 0 16 0 27 0 0 43 $1,779,486 $1,296,317
Nursing Coordinator 2 0 1 0 1 1 0 5 $664,195 $483,852
Student Assistant 0 0 0 0 5 0 0 5 $114,339 $83,293
Pharmacist I 0 0 0 1 1 0 0 2 $304,162 $221,575
Pharm Tech 0 0 0 0 3 0 0 3 $159,629 $116,287
Physical Therapist II 0 0 0 1 1 0 0 2 $158,922 $115,771
Physical Therapist 1 0 0 3 3 0 0 7 $504,543 $367,548
Physical Therapy Asst. 0 0 0 2 1 0 0 3 $142,367 $103,712
Occupational Therapist 2 0 0 1 3 0 0 6 $579,882 $422,432
Sr. Occup Therapist 0 0 0 1 0 0 0 1 $106,318 $77,451
Behavioral Specialist 2 24 0 0 0 0 0 26 $2,326,858 $1,695,066
Nurse Practitioner 13 0 0 0 0 0 0 13 $1,982,965 $1,444,548
Sr Psych Tech 11 4 2 0 4 0 0 21 $1,768,635 $1,288,413
Chief Psych 0 0 0 1 0 0 0 1 $365,080 $265,953
Research Prog Spec II 0 0 0 1 0 0 0 1 $99,073 $72,173
Program Director 0 0 0 1 0 0 0 1 $121,896 $88,798
258 of 271
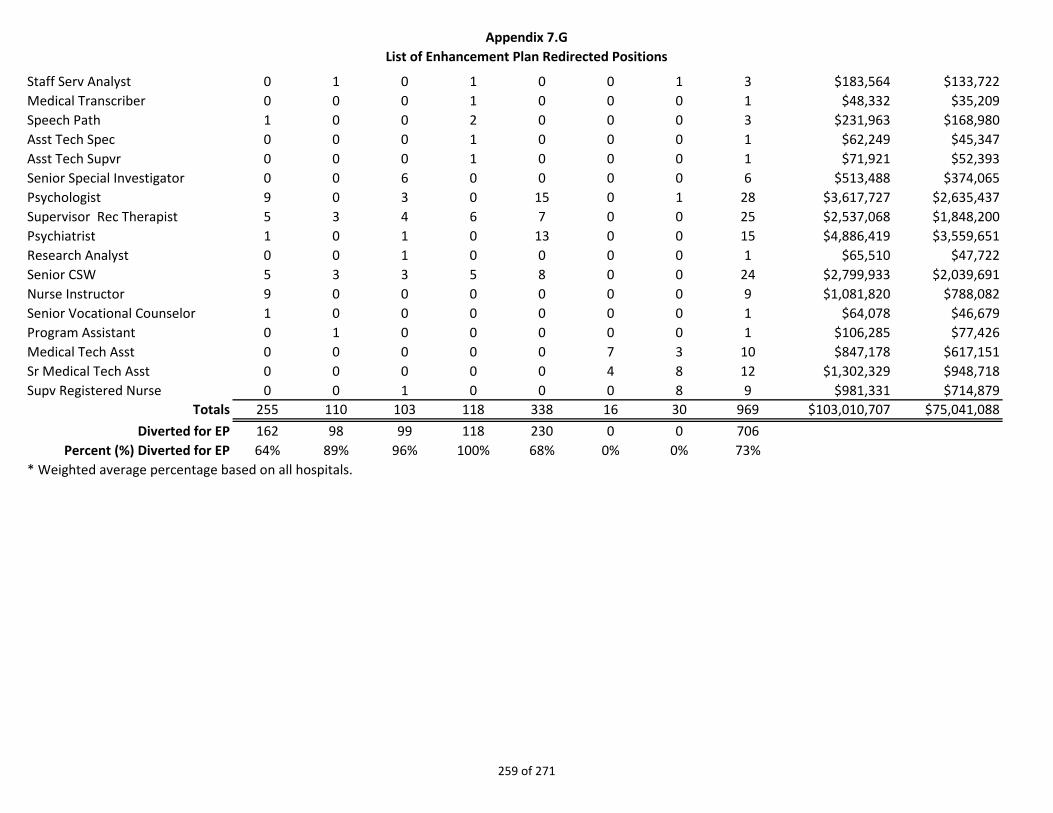
Appendix 7.G
List of Enhancement Plan Redirected Positions
Staff Serv Analyst 0 1 0 1 0 0 1 3 $183,564 $133,722
Medical Transcriber 0 0 0 1 0 0 0 1 $48,332 $35,209
Speech Path 1 0 0 2 0 0 0 3 $231,963 $168,980
Asst Tech Spec 0 0 0 1 0 0 0 1 $62,249 $45,347
Asst Tech Supvr 0 0 0 1 0 0 0 1 $71,921 $52,393
Senior Special Investigator 0 0 6 0 0 0 0 6 $513,488 $374,065
Psychologist 9 0 3 0 15 0 1 28 $3,617,727 $2,635,437
Supervisor Rec Therapist 5 3 4 6 7 0 0 25 $2,537,068 $1,848,200
Psychiatrist 1 0 1 0 13 0 0 15 $4,886,419 $3,559,651
Research Analyst 0 0 1 0 0 0 0 1 $65,510 $47,722
Senior CSW 5 3 3 5 8 0 0 24 $2,799,933 $2,039,691
Nurse Instructor 9 0 0 0 0 0 0 9 $1,081,820 $788,082
Senior Vocational Counselor 1 0 0 0 0 0 0 1 $64,078 $46,679
Program Assistant 0 1 0 0 0 0 0 1 $106,285 $77,426
Medical Tech Asst 0 0 0 0 0 7 3 10 $847,178 $617,151
Sr Medical Tech Asst 0 0 0 0 0 4 8 12 $1,302,329 $948,718
Supv Registered Nurse 0 0 1 0 0 0 8 9 $981,331 $714,879
Totals 255 110 103 118 338 16 30 969 $103,010,707 $75,041,088
Diverted for EP 162 98 99 118 230 0 0 706
Percent (%) Diverted for EP 64% 89% 96% 100% 68% 0% 0% 73%
* Weighted average percentage based on all hospitals.
259 of 271

Appendix 7.H
Temporary Help, Overtime, Worker's Comp, and Registry
ASH CSH MSH PSH NSH SVPP VPP TOTAL
Category FY
(033) Temp. Help
5/6 1,773,774 0 2,844,754 8,003,877 306,605 0 0 12,929,010
6/7 2,177,705 0 2,818,593 13,449,274 545,809 0 0 18,991,381
7/8 3,281,299 0 3,483,377 9,892,719 222,599 0 0 16,879,994
8/9 3,703,998 0 3,771,370 11,066,612 479,115 0 0 19,021,095
9/10 4,740,460 0 4,259,810 10,397,149 245,790 0 0 19,643,209
10/11 3,971,184 6,133,146 9,053,979 310,892 0 0 19,469,201
11/12 3,722,371 966,715 6,383,171 9,322,488 339,310 0 0 20,734,055
Sub-total Temp. Help 23,370,791 966,715 29,694,221 71,186,098 2,450,120 0 0 127,667,945
(083) Overtime
5/6 12,456,224 942,137 10,125,129 14,813,834 15,687,106 882,351 3,742,342 58,649,123
6/7 12,580,119 2,405,155 14,310,578 17,704,240 18,166,722 2,554,285 4,731,912 72,453,011
7/8 9,900,775 4,964,453 14,568,193 23,470,140 19,803,669 3,989,276 6,482,580 83,179,086
8/9 9,671,820 6,756,435 11,639,340 24,589,615 18,855,936 3,571,979 5,988,037 81,073,162
9/10 10,810,278 10,415,434 14,194,073 30,912,430 24,838,304 4,369,895 5,817,835 101,358,249
10/11 15,234,363 10,490,986 13,552,032 31,800,954 26,156,170 5,879,132 6,387,904 109,501,54111/12 13,902,492 10,785,101 18,323,120 31,915,621 28,613,993 7,501,572 6,929,325 117,971,224
Sub-total Overtime 84,556,071 46,759,701 96,712,465 175,206,834 152,121,900 28,748,490 40,079,935 624,185,396
(125) Worker's Comp.
5/6 4,736,946 67,224 5,261,617 4,494,820 4,842,092 76,475 677,236 20,156,410
6/7 5,311,765 315,292 5,657,734 4,631,334 4,407,046 83,234 585,189 20,991,594
7/8 4,513,640 551,385 6,115,818 4,440,415 4,170,717 99,515 669,506 20,560,996
8/9 5,147,556 502,754 4,687,882 4,454,913 5,102,279 235,624 497,260 20,628,268
9/10 5,509,674 65,266 435,077 1,658,924 4,782,802 333,113 158,721 12,943,577
10/11 6,767,291 2,002,452 6,358,383 5,928,479 5,202,781 623,058 461,841 27,344,285
11/12 6,764,960 2,062,526 6,673,039 6,161,589 4,942,721 149,966 488,954 27,243,755
Sub-total Worker's Comp. 38,751,832 5,566,899 35,189,550 31,770,474 33,450,438 1,600,985 3,538,707 149,868,885
260 of 271

Appendix 7.H
Temporary Help, Overtime, Worker's Comp, and Registry
Personal Svcs/Registry
5/6 1,316,339 413,465 488,042 188,115 0 0 0 2,405,961
6/7 1,289,014 0 587,341 158,879 243,567 0 0 2,278,801
7/8 23,257,558 7,692,693 708,257 969,441 6,190,722 0 0 38,818,671
8/9 19,921,527 4,784,099 551,463 957,192 2,825,117 0 0 29,039,398
9/10 17,576,980 14,097,497 385,366 158,465 434,727 0 0 32,653,035
10/11 16,064,998 16,642,247 517,252 367,946 1,879,207 0 0 35,471,650
11/12 N/A N/A N/A N/A N/A N/A N/A N/A
Sub-total Registry 79,426,416 43,630,001 3,237,721 2,800,038 11,573,340 0 0 140,667,516
261 of 271

Appendix 7.I
262 of 271
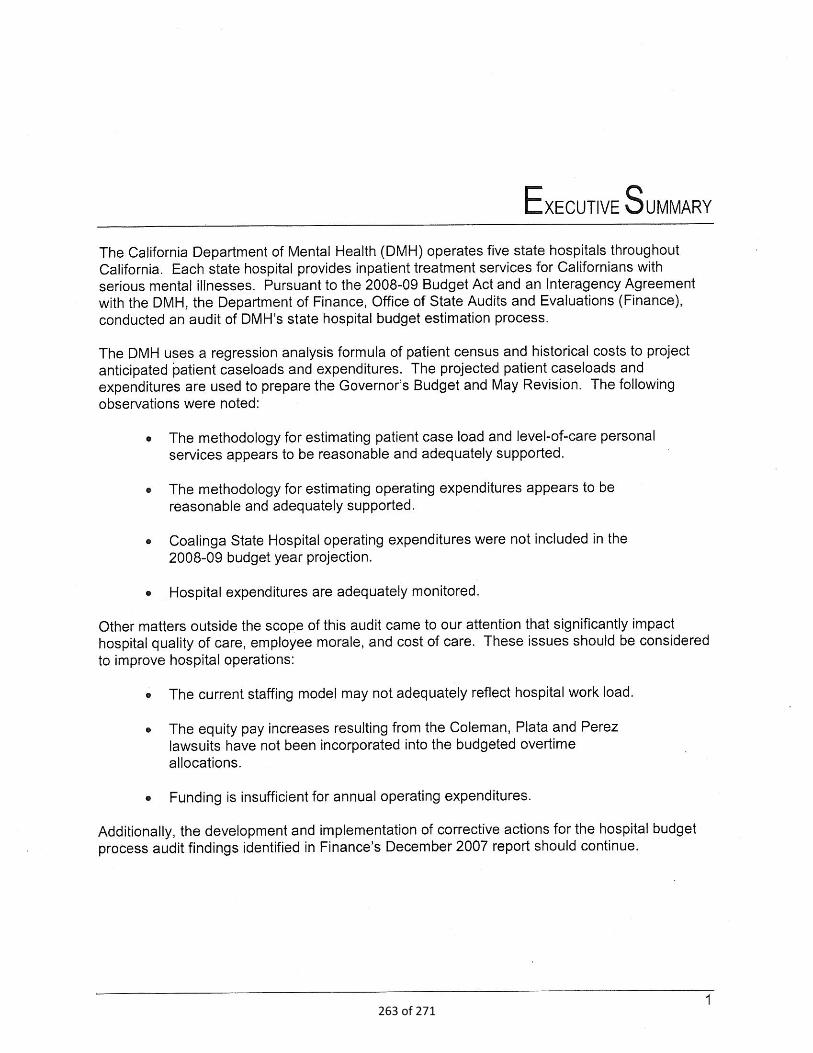
263 of 271

264 of 271
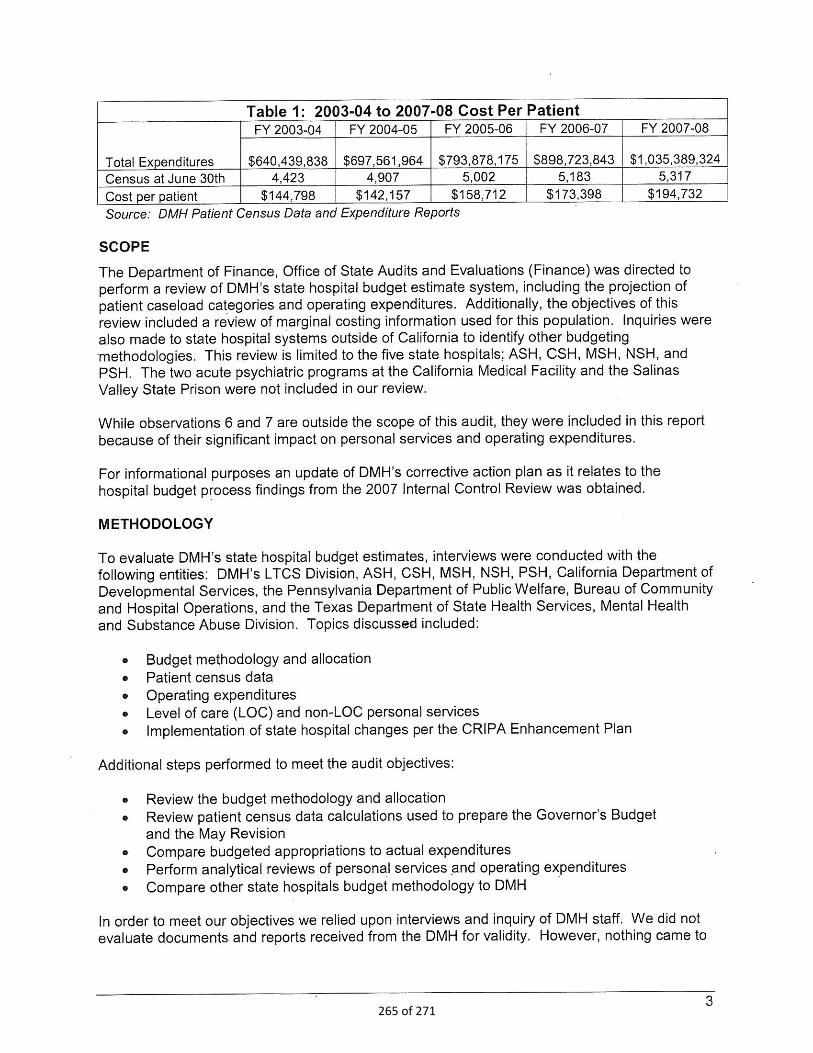
265 of 271

266 of 271
Appendix 8.A: 2010-11 Deficiency in State Operations 4440-001-0001 is in deficit by a total of $9.4 million in 2010-11 in programs 20 (Long Term Care) and 35 (Admin) combined. In contrast, program 10 has a surplus of $14.2 million. Other federal and special funds also are in deficit by a total of $576,870. In order to cure and close properly, we need:
1. Permission from DOF to either cancel BR #4 or process a new BR to increase reimbursement authority in 4440-001-0001 by $4,000,000 to more fully reflect all Medi-Cal reimbursements received from DHCS. (The other half of the adjustment would be to program 10.)
Authority: Control Section 28.50 The reimbursement schedule was reduced in April 2011 by $4 million to “generate cash for payroll” and also reflect estimated reimbursement revenue. Actual revenue (determined by rates and number of claims) came in higher than their estimates. Total unscheduled reimbursements was $4,326,259
2. Permission from DOF to move $8,000,000 million in expenditure authority from program 10 to program 20.
Authority: 4440-001-0001 provision 2 Program 20 expenses exceeded authority due to increased SOCP (Sex Offender Commitment Program) evaluation workload generated by CDCR. Claims are still coming in.
3. Permission from DOF to move $2,500,000 in expenditure authority from
program 10 to program 35 in Item 4440-001-0001. (Corresponding change to distributed Admin)
Authority: C.S. 26.00 Program 35 expenses exceeded authority. When a 2008-09 BCP was backed out of the change book system, there was a $1.9 million error in the Admin schedule that DMH was told by DOF to live with but DMH did not.
4. Report to DOF that expenditures for 2 federal grants exceeded authority
by $97,167 in 4441-001-0890 and were charged to 4440-001-0001 program 10. PATH and SAMSHA are the federal grants (the grants did not exceed budget authority)
267 of 271

5. Report to DOF that expenditures in the L&C Fund 4440-001-3099
exceeded authority by $479,703, and were moved to 4440-001-0001 program 10.
Fund 3099 collects fee revenue for state mandated licensing functions in Mental Health Rehab Centers and Psychiatric Health Facilities.
In summary, if DOF approves the above, DMH would
Ensure BR #4 is cancelled or write and process new BR to Increase program 10 and reimbursement authority by $4,000,000
Correct BR #2 – only one leg was posted by SCO
Reverse the $5.7 million in charges to the MHSA Fund
Move $16,475 in additional expenditures from fund 3099 to program 10
Reverse the $8.3 million in expenditures charged to program 10 and move them back to program 20 where they
Move $8.0 million in expenditure authority from program 10 to program 20
Reverse the $2.35 million in expenditures charged to program 10 and move them back to program 35 where they belong.
Prepare a Section 26.00 request to move $2.5 million in authority from program 10 to program 35. Distribute Admin at a higher level
268 of 271

ASH BOILER #1 REACTIVATION 2004 $350,000
ASH PERIMETER PROPERTY FENCE 2006 $72,450
ASH WASTEWATER TREATMENT CONNECTION 2007 $256,556
ASH GYM HVAC SYSTEM 2007 $133,750
ASH INTERIOR PAINT,Units 12,13,14,15,21,22,23,25, and NTA 2007 $212,118
ASH MUSIC CENTER VISUAL ALARM SYSTEM 2007 $13,482
ASH POTABLE WATER MAIN BOOSTER PUMP SYSTEM 2008 $304,950
ASH EXTERIOR PAINT, Main Ct. Yd., Parking Lot Markings, 2008 $196,799
ASH APARTMENT STAIRS 2008 $142,310
ASH HVAC CONTROL UPGRADE - PHASE 2 2008 $149,800
ASH ANALYZE SECURITY ALARM SYSTEM 2008 $37,450
ASH REPAIRS OF DINING ROOMS AND SCULLERIES 2009 $396,700
ASH 258 ALARM UPGRADE 2009 $281,410
ASH ROOF COATING (PHASE 1) 2009 $557,074
ASH 10,000 GALLON ABOVE GROUND DIESEL TANK 2010 $192,521
ASH BOILER CATALYTIC CONVERTOS 2010 $306,000
ASH SALT PIT EXPANSION 2011 $47,285
ASH ELECTRIC BACKBONE HV UPGRADE (PHASE 1) 2011 $229,900
ASH ELECTRIC BACKBONE HV UPGRADE (PHASE 2) 2011 $225,500
ASH PLANT OPS FIRE PREVENTION SPRINKLER REPLACE 2011 $52,800
ASH FIRE ALARM UPGRADE PHASE V 2012 $160,500
ASH SANITARY SEWER LIN CLEANING 2012 $21,400
ASH RELINE DOMESTIC HOT WATER STORAGE TANK 2012 $17,617
ASH FIRE ALARM UPGRADE PHASE VI 2013 $107,500
ASH FIRE ALARM UPGRADE PHASE VII 2013 $162,640
$4,628,512
CSH UNDERGROUND HYDRONIC LEAK REPAIR #1 2007 $24,261
CSH UNDERGROUND HYDRONIC LEAK REPAIR #2 & #3 2008 $57,593
CSH UNDERGROUND HYDRONIC LEAK REPAIR #4 2010 $29,965
CSH UNDERGROUND HYDRONIC LEAK REPAIR #5 EXPLORATORY 2010 $7,352
CSH UNDERGROUND HYDRONIC LEAK REPAIR #6 2010/2011 $96,217
CSH UNDERGROUND HYDRONIC LEAK REPAIR #7 2011 $42,456
CSH UNDERGROUND HYDRONIC LEAK REPAIR #8 2011 $26,162
$284,005
MSH CTE BLDG AIR HANDLER PIPING REPLACEMENT 2007 $392,000
MSH CTW BLDG AIR HANDLER PIPING REPLACEMENT 2007 $392,000
MSH HOSPITALWIDE DUCT CLEANING 2007 $364,000
MSH HOSPITALWIDE RESTROOM PARTITION/TOILET PAPER DISPENSERS 2006 $267,000
MSH HVAC SYSTEM REPAIRS 2005 $395,000
MSH REPAIR AIR HANDLERS 2002 $237,000
MSH REPLACE ROOF PLANT OPS 2002 $886,000
MSH SNF BLDG AIR HANDLER PIPING REPLACEMENT 2007 $93,000
MSH HOSPITAL SOFTENER EQUIPMENT REPAIR 2008 $259,000
MSH CTE FENCE ALARM & VIDEO SURVEILLANCE SYS UPGRADE 2011 $268,000
MSH ASBESTOS ABATEMENT & MODIFICATIONS IN BLDG 301 2011 $286,000
MSH REPAIR CTE PASSENGER ELEVATOR #3 2011 $169,000
MSH 301 EMERGENCY BACKUP GENERATOR SYSTEM 2011 $259,000
MSH NORWALK PERIMETER FENCE 2011 $288,000
MSH ADMINISTRATION BLDG DUCT CLEANING 2009 $114,000
MSH UNITS READING LIGHTS UPGRADE 2006 $255,000
MSH UPGRADE NEW ADMIN BLDG EMERGENCY CIRCUIT 2006 $176,000
MSH 4TH STREET STEAMCONDENSATE PIPE REPLACEMENT 2008 $368,000
MSH CTW REHAB ROOF REPLACEMENT 2005 $82,000
MSH DEMOLISH OLD COMMUNITOR 2001 $209,000
ESTIMATE
DMH STATE HOSPITALS
UNFUNDED SPECIAL REPAIRS
YEAR
SUBMITTED
CSH SUBTOTAL1
ASH SUBTOTAL
PROJECT TITLEHOSP
269 of 271

ESTIMATEYEAR
SUBMITTEDPROJECT TITLEHOSP
MSH REPLACEMENT OF ASBESTOS COATED AWNING COVERS 2009 $66,000
MSH NORTH CIRCLE DOMESTIC WATER LOOP INSTALLATION 2008 $129,000
MSH PLACE ADEQUATE TREES ON PATIOS 2007 $360,000
MSH REFACING MED ROOM, NURSES STATION & LAUNDRY ROOM CABINETS 2005 $208,000
MSH REPAIR HOSPITAL CAMPUS ROADS 2007 $116,000
MSH ROAD REPAIRS -CIRCLE/ADMIN LOT 1998 $60,443
MSH TREE TRIMMING 2006 $44,000
MSH REFURBISH CTW UNIT 402 2011 $259,000
MSH ROAD IMPROVEMENT (NORTH CIRCLE TO SOUTH CIRCLE) 2009 $71,000
MSH SIDEWALK REPLACMENT & RENOVATION (HOSPITALWIDE) 2009 $61,000
MSH 300 BUILDINGS HVAC REPAIRS 2006 $310,000
MSH PLANT OPERATIONS COMPOUND & NINTH STREET REPR 2003 $384,000
MSH REPAIR RESIDENCE #20 EXTERIOR 2007 $92,000
MSH SLURRY SEAL ROADS 1999 $223,182
MSH BARBER/BEAUTY BUILDING TILE ABATEMENT 2001 $39,000
MSH EMPLOYEE BLDG. #2 REPAIRS 2000 $201,000
MSH NORWALK PLANTER RENOVATION 2003 $48,000
MSH REPAIR DETERIORATED CTE/CTW BRICK FAÇADE 2005 $292,000
MSH REPAIR PLANT OPERATIONS COMPOUND 1999 $51,852
MSH REPAIR HOSPITAL RESIDENCES ROOFS 2008 $83,000
MSH TREE TRIMMING 2009 $58,000
MSH REPAIR & LANDSCAPE BLOOMFIELD SECTION 2007 $186,000
MSH 200 BUILDING ASBESTOS ABATEMENT & FLOOR REPAIR 2008 $128,000
$9,229,477
NSH REPLACE SEWER MAIN LATERALS 2004 $73,000
NSH REPAIR ROADS 2004 $56,000
NSH REPLACE FLOOR COVERINGS 2004 $59,000
NSH REPLACE LAWN IRRIGATION SYSTEMS 2004 $71,000
NSH REPLACE SEWER MAIN LATERALS 2005 $27,000
NSH REPAIR ROADS 2005 $18,000
NSH REPAVE COURTYARDS 2005 $34,000
NSH REPLACE FLOOR COVERINGS 2005 $44,000
NSH REPLACE ROOF 2003 $116,000
NSH REPLACE EXTERIOR WINDOWS 2006 $163,000
NSH REPAIR SEWER LINE LATERALS 2006 $67,000
NSH REPLACE MAIN WATER VALVES 2006 $69,000
NSH REPLACE T-2 COURTYARDS 2006 $30,000
NSH REPLACE SINK COUNTERTOPS 2007 $68,000
NSH REPLACE BED LIGHTS 2007 $58,000
NSH REPLACE LOCKS AND CABINETS 2007 $339,000
NSH REPLACE SEWER MAIN LATERALS 2007 $68,000
NSH REPLACE SIDEWALKS AND CURBS 2007 $69,000
NSH REPAIR ROADS 2007 $71,000
NSH REPAIR REFRIGERATION SYSTEMS 2007 $53,000
NSH REPLACE FIBER OPTIC CABLE 2007 $137,000
NSH REPLACE BED LIGHTS 2008 $47,000
NSH REPLACE SWITCHGEAR BREAKERS 2008 $79,000
NSH REPLACE HEATING COILS 2008 $120,000
NSH REPAIR SEWER MAINS 2008 $30,000
NSH REPLACE LOCKS 2008 $55,000
NSH REPLACE IRRIGATION SYSTEM 2008 $25,000
NSH REPLACE STORM DRAINS 2008 $89,000
NSH REPLACE MAIN TRANSFORMERS 2009 $89,000
NSH REPLACE MAIN WATER VALVES 2009 $66,000
NSH REPLACE FLOOR COVERING 2009 $54,000
NSH REPLACE SINK COUNTERTOPS 2009 $74,000
NSH EXTERIOR PAINTING 2009 $99,000
MSH SUBTOTAL
270 of 271

ESTIMATEYEAR
SUBMITTEDPROJECT TITLEHOSP
NSH REPLACE ROOFS 2009 $208,000
NSH REPLACE EXTERIOR WINDOWS 2009 $206,000
NSH REPLACE SWITCHGEAR BREAKERS 2009 $84,000
NSH REPLACE LOCKS 2009 $68,000
NSH REPAIR ROADS 2009 $68,000
NSH REPAIR COURTYARD PAVING 2009 $33,000
NSH REPLACE EVAPORATIVE COOLERS 2009 $216,000
NSH REPLACE EVAPORATIVE COOLERS 2007 $145,000
NSH REPLACE ROOFS-BLDG 164 2010 $190,000
NSH REPLACE MAIN WATER VALVES 2010 $66,000
NSH REPLACE EXTERIOR WINDOWS 2010 $37,000
NSH REPLACE ROADS 2010 $77,000
NSH REPLACE SINK COUNTERTOPS 2010 $79,000
NSH RECONDITION ELEVATORS 2010 $128,000
NSH REPLACE COOLING COILS 2010 $94,000
NSH REPAIR SIDEWALKS AND CURBS 2010 $84,000
NSH REPLACE LOCKS 2010 $84,000
NSH REPAIR SEWER MAIN LATERALS 2010 $73,000
NSH REPLACE REFRIGERATION SYSTEMS 2010 $64,000
NSH REPAIR ELEVATOR - BLDG 199 2008 $135,000
NSH SUBTOTAL $4,656,000
PSH REPLACE HVAC - AUDITORIUM 2000 $118,860
PSH REINSULATE 12 STRUCTURES 2004 $63,672
PSH ABATEMENT & EXTERIOR PAINTING - U/O/P BUILDINGS 2007 $250,237
PSH ABATEMENT AND EXTERIOR PAINT - 70 BUILDING 2008 $345,052
PSH ABATEMENT AND EXTERIOR PAINT - 30 BUILDING 2008 $345,052
PSH REPLACE COURTYARD AWNINGS - 70 BUILDING 2007 $345,218
PSH EXTERIOR PAINTING - 7 RESIDENCES 2006 $102,594
PSH EXTERIOR PAINT-RESIDENCES 1 & 2, PLANT 2004 $139,202
PSH EXTERIOR PAINT-UPHOL/AUDITORIUM 2001 $44,952
PSH REPLACE PULL BOXES 1997 $233,863
PSH INTERIOR PAINT - MAIN KITCHEN 2000 $66,552
PSH ABATEMENT & EXTERIOR PAINTING - R/M BUILDINGS 2007 $379,535
PSH RESURFACE/REPAIR ROADS- PLANT OPS/MOTOR POOL 2008 $800,856
PSH DUCTING CLEANING - 8 STRUCTURES 2010 $86,523
PSH RESURFACE ROADS - N BLDG. 2010 $275,538
PSH O & P HVAC 2010 $350,000
PSH SUBTOTAL $3,947,706
ALL HOSPITALS -- GRAND TOTAL $22,745,700
1 CSH Repairs are the result of faulty underground pipe installation during facility construction. These costs are repair costs to
date. This is not a scheduled project, but repairs that become necessary as leaks are discovered. This system provides
heating and hot water to all occurpied areas of the facility.
271 of 271