lisbon port expansion
DESCRIPTION
Economic and financial assessment on an hipotetical Lisbon port expansion, somewhat similar to the one to be made in Alcantara Terminal.TRANSCRIPT
1
2009
Francisco Furtado
Pedro Simões
Raul Pires
Lisbon Port Expansion
ii
Table of Contents
1. Introduction ............................................................................................................................ 1
1.1. Report structure ................................................................................................................... 1
1.2. Our role ................................................................................................................................ 1
2. Port sector overview ............................................................................................................... 2
3. Assumptions ............................................................................................................................ 3
3.1. Location of the port ............................................................................................................. 3
3.2. PPP proposition .................................................................................................................... 5
4. Planning, activities and resource allocation ........................................................................... 6
4.1. List of activities .................................................................................................................... 6
4.2. Gantt chart ........................................................................................................................... 8
4.3. Resources, Costs and Durations......................................................................................... 11
4.3.1. Tendering Process ....................................................................................................... 11
4.3.2. Construction ................................................................................................................ 13
4.3.3. Operations and Maintenance ..................................................................................... 16
4.3.4. Observations ............................................................................................................... 17
5. Finance/Economical assessment .......................................................................................... 18
5.1. Total Costs .......................................................................................................................... 19
5.2. Base case, fixed TEU price approach ................................................................................. 20
5.3. Variable TEU price approach (scenarios A, B and C) .......................................................... 21
5.4. NPV variation with demand ............................................................................................... 22
5.5. Observations ...................................................................................................................... 24
6. Risk Assessment .................................................................................................................... 24
6.1. The risk-sharing contract ................................................................................................... 24
6.2. Risk identification ............................................................................................................... 24
6.2.5. Planning ...................................................................................................................... 26

iii
6.2.6. Design and construction ............................................................................................. 26
6.2.7. Licenses, expropriation and environmental risk ......................................................... 27
6.2.8. Accessibility ................................................................................................................. 28
6.2.9. Maintenance and repairs ............................................................................................ 28
6.2.10. Technological risk ...................................................................................................... 28
6.2.11. Demand and market competition ............................................................................ 29
6.2.12. Financial .................................................................................................................... 29
6.2.13. Legal .......................................................................................................................... 30
6.2.14. Political and unilateral modification of contract ...................................................... 30
6.2.15. Force majeure ........................................................................................................... 31
6.3. Other risks .......................................................................................................................... 31
7. Conclusions ........................................................................................................................... 32
8. Bibliography .......................................................................................................................... 35
8.1. Sites .................................................................................................................................... 35
8.2. Papers ................................................................................................................................ 35
1
1. Introduction
The present work, in the domain of the discipline of Project Management and Large-Scale
Integration, outlines the many aspects involved in the planning process, since the tendering
process until the end of the concession period, to develop the new Lisbon Seaport Terminal.
We chose the seaport sector due to its (unnoticed) importance in worldwide economy and,
inevitably, the Portuguese economy.
1.1. Report structure
We start by giving a brief overview of the port sector and its importance in the worldwide
economy followed by a description of our role in the whole process and the assumptions that
we did. We then describe all the planning steps involved by identifying the comprised activities,
resources allocation (that we get to great detail in some activities, but not all), deadlines and
milestones in the tendering, construction, operation and maintenance phases of the project.
Next, we determine the economic/financial viability of the project, analyzing the cash flows, the
net present value (NPV), internal rate of return and breakeven point of the whole life cycle of
the project. We also conduct a sensibility analysis on the obtained results. Taking all this
information in mind, we present the risks involved in a project of this dimension and afterwards
we draw our conclusions. All this planning and management were performed using the
Microsoft Excel and Microsoft Project software.
1.2. Our role
We had to opt on what would be our role in this process and so we decided to act as a
concessionaire. Considering the administrative chain, we are in third place, after the State, and
after the Port Authority (PA). Basically, we are a service provider (under a contract) of the PA.

2
2. Port sector overview
According to Rodrigue et al. (2006), about 96% of the world trade is carried by sea, making
shipping one of the main pillars of globalization. In fact, maritime transportation is the only
viable transport mode between a large number of the world’s destinations and, even when
alternative modes of transportation are available, it is the one with the lowest cost and CO2
emissions per moved tone (Carvalho, 2007). Seaports, as main elements of the maritime
transport chain are critical for its efficiency. As it is often said, “seaports are important because
they allow countries (and regions) to trade”. This saying emphasizes one (probably the most!)
important reason for the existence of ports. However, it should not be forgotten that additional
dimensions, such as national defence and cohesion, touristic utility and passengers’
transportation exist and must be considered in any analysis.
The importance of this sector in world economy broadly incentivises the analysis of this
sector. Moreover, our history through naval entrepreneurship (thanks to their naval
achievements in the 15th
and 16th
centuries) highlights the utility of this study. First, the
geographic position allows Portuguese Ports to gather additional cargo volumes through the
creation of turntable hub terminals as an alternative to the Northern European Ports (Hamburg
– Le Havre range) in handling the ever increasing flow of seagoing cargo that comes in and out
of the European Continent. Second, Portuguese ports can also benefit from the development of
Short Sea Shipping networks in the European Union. With the inclusion of the port systems in
the Trans-European Networks there is a growing interest in the promotion of a modal shifting
from land to sea transportation. This is so because there is significant congestion in some land
trade routes such as the Pyrenees crossing. Increasing Short Sea Shipping was the designated
solution towards alleviating traffic pressure over the road infrastructure and simultaneously
benefit from environmental gains. Considering the volume of intra-EU trade in the total imports
and exports in small economies like Portugal (76.6% of exports and 75.4% of imports have EU
provenience) (AICEP, 2008) the caption of this maritime cargo can be of crucial importance for
port development. In addition, the countries have insular territories which increase the
3
importance of the port sector through the maintenance of national cohesion and the
promotion of internal trade between the main land and the insular regions.
Moreover, in a globalised competitive environment shipping lines can choose from more
than one port for their door-to-door cargo movements so that each port faces the permanent
risk of losing its customer base (Wang et al., 2005). This created higher inter port competition
3. Assumptions
3.1. Location of the port
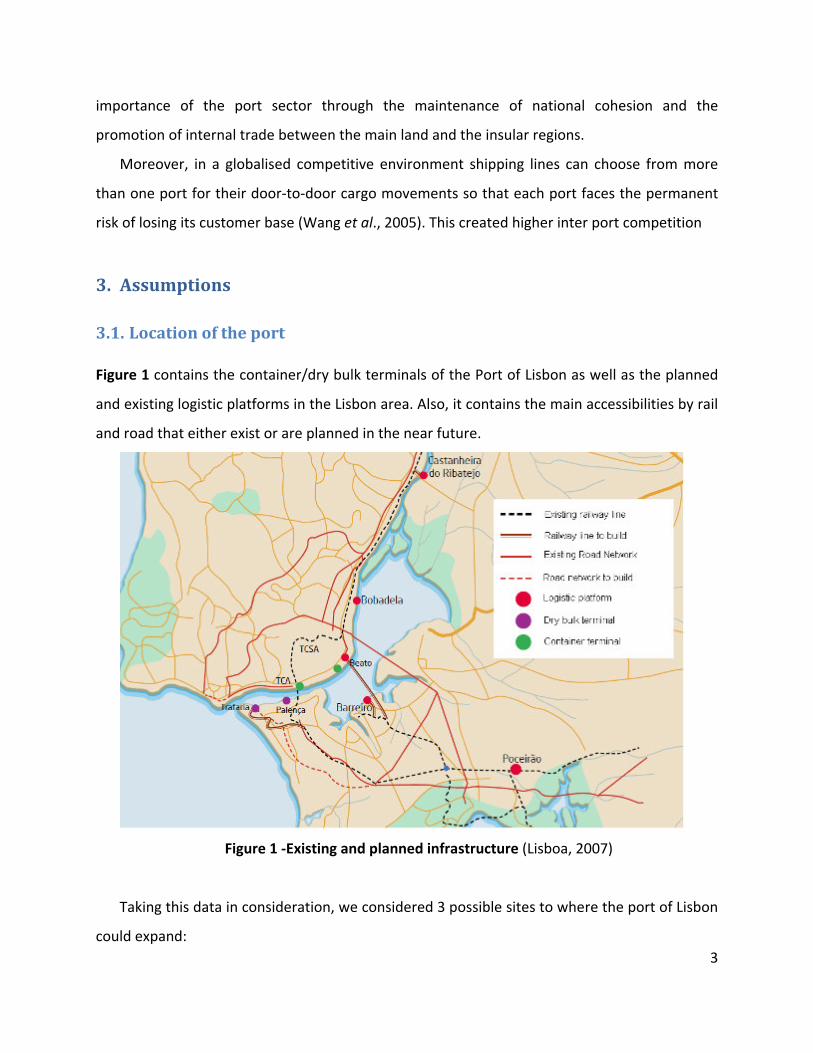
Figure 1 contains the container/dry bulk terminals of the Port of Lisbon as well as the planned
and existing logistic platforms in the Lisbon area. Also, it contains the main accessibilities by rail
and road that either exist or are planned in the near future.
Figure 1 -Existing and planned infrastructure (Lisboa, 2007)
Taking this data in consideration, we considered 3 possible sites to where the port of Lisbon
could expand:
4
• Option 1 – Old Lisnave Shipyard. This is an old shipyard that was owned by Lisnave and
that was abandoned in 2000. It has an infrastructure in place but main concern with this
location is related with the accessibilities of the port.
• Option 2 – Barreiro. This location is on the old CUF naval yard. This site has, like Option
1, an existing infrastructure in place. There are strong environmental aspects related
with the chemical plants and warehouses that exist in the site. This site has the
advantage of being located close to the future 3rd
bridge over the river, which will have
rail connection besides road, and also, a good advantage is the fact that is located near
the Barreiro logistic platform.
• Option 3 – Algés (Doca Pesca). This location also has some infrastructure in place and
the main advantage is its proximity to the sea also the fact that it can take advantage of
the existing accessibilities.
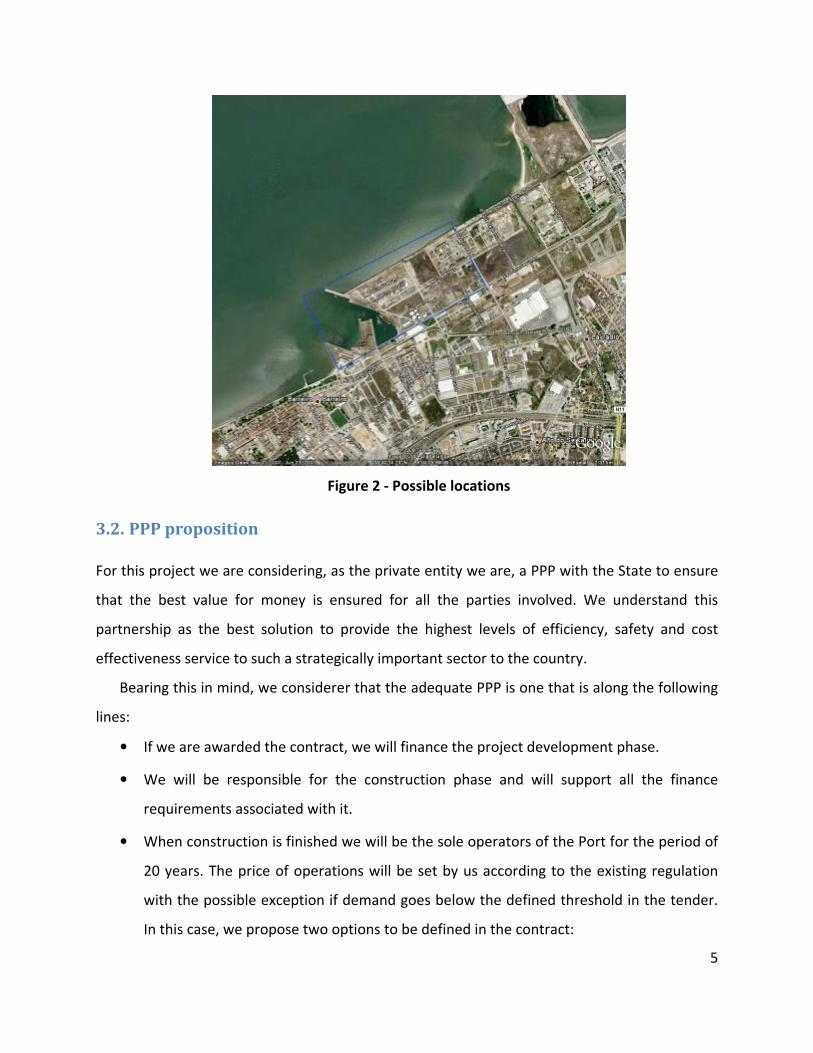
Given these scenarios, we are assuming that the Barreiro option was the one chosen by the
government and therefore our analysis is done based on this location. As it was said before, it
has the advantages of good future accessibilities as it is close to the new planned 3rd
bridge
(which includes road and rail) and also has the Barreiro logistic platform nearby. The fact that
also has some environmental benefits associated to it, i.e., the cleaning of old chemical plants,
is also considered an advantage in terms of revitalizing that area. Although it has some
infrastructure in place we are assuming that it will have to be removed and rebuilt. Figure 2
gives a closer look on the location.
5
Figure 2 - Possible locations
3.2. PPP proposition
For this project we are considering, as the private entity we are, a PPP with the State to ensure
that the best value for money is ensured for all the parties involved. We understand this
partnership as the best solution to provide the highest levels of efficiency, safety and cost
effectiveness service to such a strategically important sector to the country.
Bearing this in mind, we considerer that the adequate PPP is one that is along the following
lines:
• If we are awarded the contract, we will finance the project development phase.
• We will be responsible for the construction phase and will support all the finance
requirements associated with it.
• When construction is finished we will be the sole operators of the Port for the period of
20 years. The price of operations will be set by us according to the existing regulation
with the possible exception if demand goes below the defined threshold in the tender.
In this case, we propose two options to be defined in the contract:
6
o We will be able to defined the prices for the operations without any restrictions
(except those imposed by the market)
or
o The State will, in the form of subsidies, cover the difference of the existing
demand to the predicted threshold.
• Accessibilities connecting the new port with the highway network, rail and logistics
platforms will be financed by State and constructed by the State itself. The accessibilities
will be defined in the project in conjunction with the State.
• Dredging operations will be done and financed by State. Other maintenance operations
related with port operations will be done by us.
• It is our contractual responsibility to maintain a level of service regarding port
operations defined in the tender proposal.
• After 20 year concession period, there will be a new tendering. If maintain the defined
level of service of the tender we will be awarded the new concession, otherwise we will
compete with other operators.
4. Planning, activities and resource allocation
4.1. List of activities
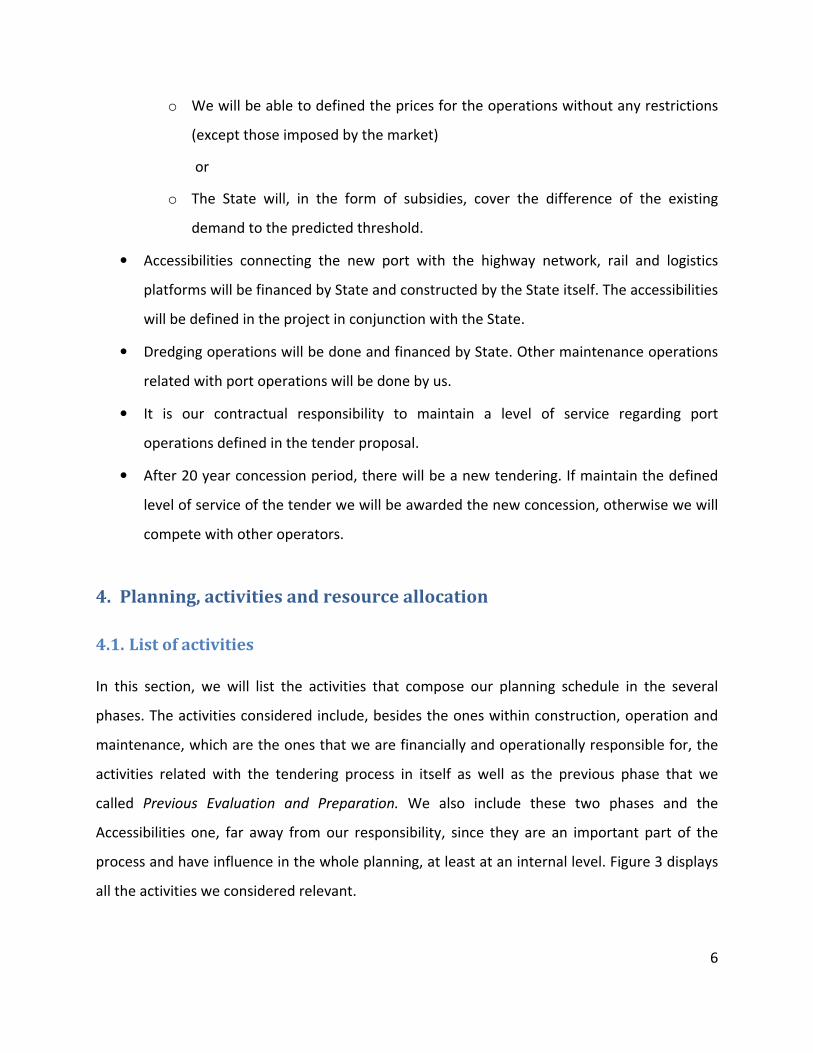
In this section, we will list the activities that compose our planning schedule in the several
phases. The activities considered include, besides the ones within construction, operation and
maintenance, which are the ones that we are financially and operationally responsible for, the
activities related with the tendering process in itself as well as the previous phase that we
called Previous Evaluation and Preparation. We also include these two phases and the
Accessibilities one, far away from our responsibility, since they are an important part of the
process and have influence in the whole planning, at least at an internal level. Figure 3 displays
all the activities we considered relevant.
7
Figure 3 - List of Activities
8
The precedence of the activities is very straightforward and self explanatory and the majority of
them respect the Finish-to-Start precedence. The general phases (Tendering, Construction and
Operations & Management) can only start after each of the previous one has ended. For a
better financial performance all activities (this applies more to the construction phase were not
all precedence’s are FS) start as late as possible. Still these poses some issues and a slack should
be considered since the duration of activities is of a probabilistic nature and not deterministic,
and with no slacks we have a high risk of not complying with the defined deadlines.

9
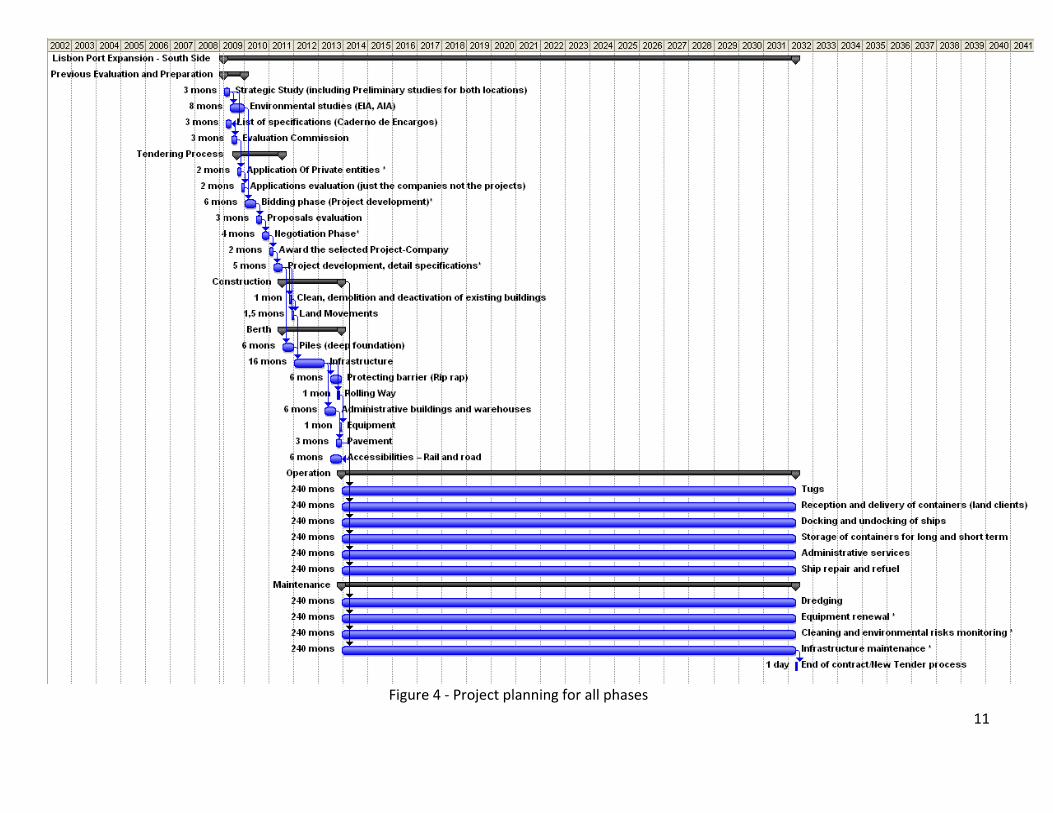
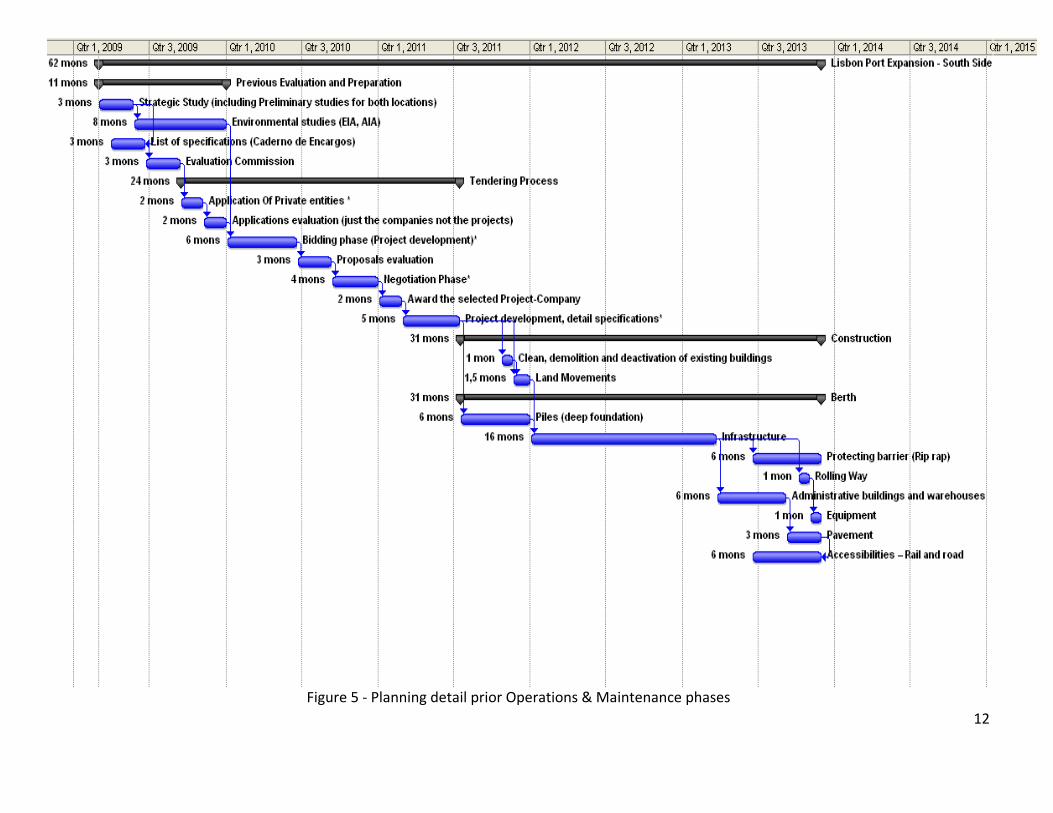
4.2. Gantt chart
Figure 4 and

10
Figure 5 display our Gantt chart. The first figure displays the all planning deadlines and
activities, including the 20 years operation and maintenance. The second figure displays the
activities involved in the phases prior to the operation and maintenance one (which basically
has all the activities occurring at the same time for the 240 months), providing this way a more
clear understanding on how they relate to each other.
11
Figure 4 - Project planning for all phases
12
Figure 5 - Planning detail prior Operations & Maintenance phases

13
4.3. Resources, Costs and Durations
After defining the Activities involved in the implementation of our Project, setting their
precedence relations and the required deadlines, we need to allocate resources to the activities
we are responsible for. We have deadlines to meet at the minimum possible cost to assure the
Project Financial viability, with this in mind we will determine the best possible resource
allocation and decide what activities we should outsource or directly manage.
We are dealing with a PPP, and it will be the Private side to Design, Finance, Construct and
Operate the new Terminal. So almost all activities after the Tendering Process will be our
responsibility, with the exception of the Accessibilities for which the state is responsible and
Dredging that is the responsibility of the Port Authority (PA), although we will pay to the PA a
share of the Dredging costs.
4.3.1. Tendering Process
In the tendering process we are responsible for the fallowing activities:
• Application Of Private entities;
• Bidding phase (Project development);
• Negotiation Phase;
• Project development, detail specifications.
This is a determinant phase of the project. Wining the tendering and presenting the best
option to the State is a sine qua non condition to implement the all Project, but besides that the
Finance and Design options taken at this stage will frame all the subsequent project
management and viability. It is a delicate phase were both confidentiality and technical
proficiency are key. So it was the shareholders options to:
• Have a “in house” team responsible for all the steps of this phase and have it working on
the Project from the beginning;
• Outsource only very specialized projects/studies.
So the resources employed are presented in the following table:
14
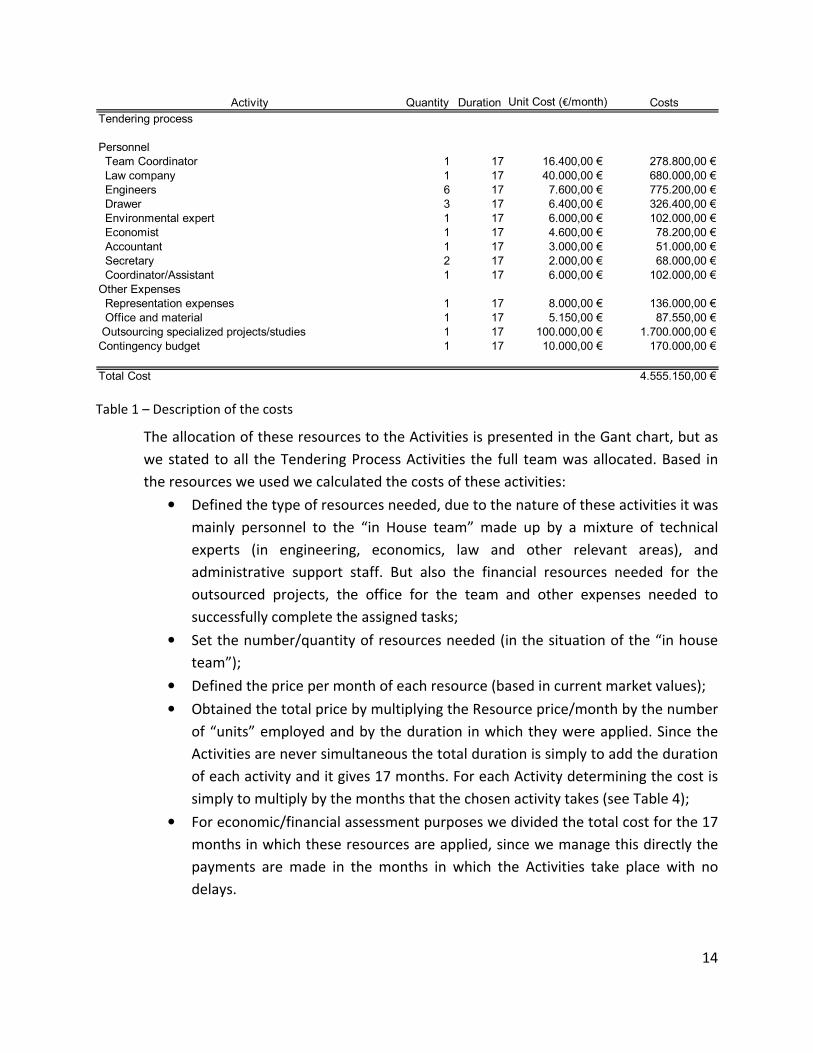
Activity Quantity Duration Unit Cost (€/month) Costs
Tendering process
Personnel
Team Coordinator 1 17 16.400,00 € 278.800,00 €
Law company 1 17 40.000,00 € 680.000,00 €
Engineers 6 17 7.600,00 € 775.200,00 €
Drawer 3 17 6.400,00 € 326.400,00 €
Environmental expert 1 17 6.000,00 € 102.000,00 €
Economist 1 17 4.600,00 € 78.200,00 €
Accountant 1 17 3.000,00 € 51.000,00 €
Secretary 2 17 2.000,00 € 68.000,00 €
Coordinator/Assistant 1 17 6.000,00 € 102.000,00 €
Other Expenses
Representation expenses 1 17 8.000,00 € 136.000,00 €
Office and material 1 17 5.150,00 € 87.550,00 €
Outsourcing specialized projects/studies 1 17 100.000,00 € 1.700.000,00 €
Contingency budget 1 17 10.000,00 € 170.000,00 €
Total Cost 4.555.150,00 €
Table 1 – Description of the costs
The allocation of these resources to the Activities is presented in the Gant chart, but as
we stated to all the Tendering Process Activities the full team was allocated. Based in
the resources we used we calculated the costs of these activities:
• Defined the type of resources needed, due to the nature of these activities it was
mainly personnel to the “in House team” made up by a mixture of technical
experts (in engineering, economics, law and other relevant areas), and
administrative support staff. But also the financial resources needed for the
outsourced projects, the office for the team and other expenses needed to
successfully complete the assigned tasks;
• Set the number/quantity of resources needed (in the situation of the “in house
team”);
• Defined the price per month of each resource (based in current market values);
• Obtained the total price by multiplying the Resource price/month by the number
of “units” employed and by the duration in which they were applied. Since the
Activities are never simultaneous the total duration is simply to add the duration
of each activity and it gives 17 months. For each Activity determining the cost is
simply to multiply by the months that the chosen activity takes (see Table 4);
• For economic/financial assessment purposes we divided the total cost for the 17
months in which these resources are applied, since we manage this directly the
payments are made in the months in which the Activities take place with no
delays.
15
As can be seen in the Gant Chart these activities are not immediately subsequent so there lies
the problem of what to do with the team in the intervals between activities (when the state is
evaluating the proposals for instance). During that time the costs of the team are not allocated
to this project and the personnel (while still fallowing this specific Project) are assigned to other
priorities, returning full time when a new Activity in this venture starts.
For this nature of work and resources it´s not possible (or it´s very difficult) to assign
productivities, so the type and number of personnel assigned to the Tendering Process is made
based on experience and taking in account the skills of each individual.
4.3.2. Construction
The Construction Activities of our responsibility (all except the accessibilities) are the following:
• Clean, demolition and deactivation of existing buildings;
• Land Movements;
• Berth:
o Piles (deep foundation);
o Infrastructure;
o Protecting barrier (Rip rap);
• Rolling Way;
• Administrative buildings and warehouses;
• Equipment;
• Pavement.
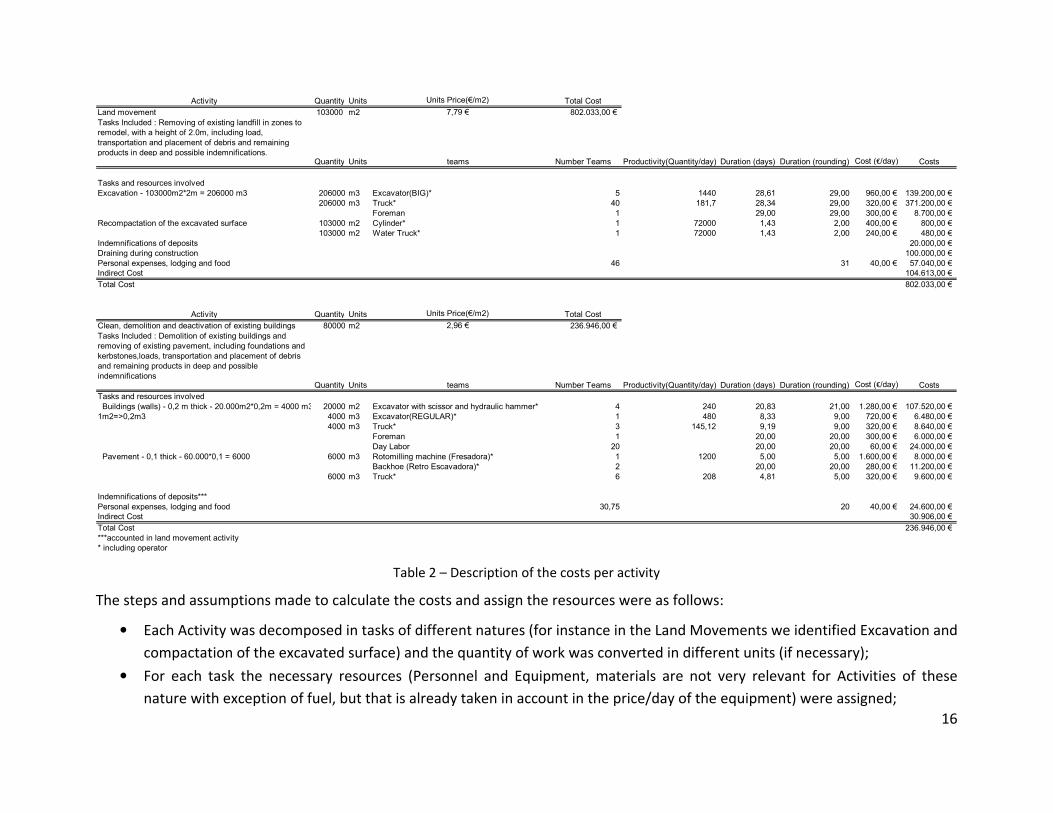
The decision was taken of subcontract all the activities with exception of the first two,
Cleaning and Land Movements which will be directly managed. For these Activities we will
detail the resource allocation and costs calculation as showed in the next table (as we have
already stated the duration was fixed in reasonable limits and the resources should be assign to
meet those deadlines at a minimum cost):
16
Activity Quantity Units Units Price(€/m2) Total Cost
Land movement 103000 m2 7,79 € 802.033,00 €
Tasks Included : Removing of existing landfill in zones to
remodel, with a height of 2.0m, including load,
transportation and placement of debris and remaining
products in deep and possible indemnifications.Quantity Units teams Number Teams Productivity(Quantity/day) Duration (days) Duration (rounding) Cost (€/day) Costs
Tasks and resources involved
Excavation - 103000m2*2m = 206000 m3 206000 m3 Excavator(BIG)* 5 1440 28,61 29,00 960,00 € 139.200,00 €
206000 m3 Truck* 40 181,7 28,34 29,00 320,00 € 371.200,00 €
Foreman 1 29,00 29,00 300,00 € 8.700,00 €
Recompactation of the excavated surface 103000 m2 Cylinder* 1 72000 1,43 2,00 400,00 € 800,00 €
103000 m2 Water Truck* 1 72000 1,43 2,00 240,00 € 480,00 €
Indemnifications of deposits 20.000,00 €
Draining during construction 100.000,00 €
Personal expenses, lodging and food 46 31 40,00 € 57.040,00 €
Indirect Cost 104.613,00 €
Total Cost 802.033,00 €
Activity Quantity Units Units Price(€/m2) Total Cost
Clean, demolition and deactivation of existing buildings 80000 m2 2,96 € 236.946,00 €
Tasks Included : Demolition of existing buildings and
removing of existing pavement, including foundations and
kerbstones,loads, transportation and placement of debris
and remaining products in deep and possible
indemnificationsQuantity Units teams Number Teams Productivity(Quantity/day) Duration (days) Duration (rounding) Cost (€/day) Costs
Tasks and resources involved
Buildings (walls) - 0,2 m thick - 20.000m2*0,2m = 4000 m3 20000 m2 Excavator with scissor and hydraulic hammer* 4 240 20,83 21,00 1.280,00 € 107.520,00 €
1m2=>0,2m3 4000 m3 Excavator(REGULAR)* 1 480 8,33 9,00 720,00 € 6.480,00 €
4000 m3 Truck* 3 145,12 9,19 9,00 320,00 € 8.640,00 €
Foreman 1 20,00 20,00 300,00 € 6.000,00 €
Day Labor 20 20,00 20,00 60,00 € 24.000,00 €
Pavement - 0,1 thick - 60.000*0,1 = 6000 6000 m3 Rotomilling machine (Fresadora)* 1 1200 5,00 5,00 1.600,00 € 8.000,00 €
Backhoe (Retro Escavadora)* 2 20,00 20,00 280,00 € 11.200,00 €
6000 m3 Truck* 6 208 4,81 5,00 320,00 € 9.600,00 €
Indemnifications of deposits***
Personal expenses, lodging and food 30,75 20 40,00 € 24.600,00 €
Indirect Cost 30.906,00 €
Total Cost 236.946,00 €
***accounted in land movement activity
* including operator
Table 2 – Description of the costs per activity
The steps and assumptions made to calculate the costs and assign the resources were as follows:
• Each Activity was decomposed in tasks of different natures (for instance in the Land Movements we identified Excavation and
compactation of the excavated surface) and the quantity of work was converted in different units (if necessary);
• For each task the necessary resources (Personnel and Equipment, materials are not very relevant for Activities of these
nature with exception of fuel, but that is already taken in account in the price/day of the equipment) were assigned;
17
• The productivity of the resources was calculated taking in account the conditions of the
work, equipment and labour. For instance, for the Excavation task in the land
movements Activity:
o We know that a medium-large excavator (like a Komatsu PC350) can excavate
about 180m3 in one hour (the bucket useful capacity is about 1m
3 an it takes
about 20 sec to deliver a bucket load to a truck), we assumed 8h work days, so
for a day the productivity is 1,440m3. Then we determined how much such
excavators we needed to complete the work (206,000m3) in the given deadline
(1.5 months, or 30 week days);
o After knowing how many Excavators we need we determined how many trucks
we should have to assure continuous work for the excavators. The productivity
of a truck was calculated assuming that each truck as a capacity of about 13m3,
and that for each load it as to wait that the excavator fills his load and them he
must make the trip to the land/debris depot and come back. So he carries 13m3
in 13*20sec= 0.0722 hours (time necessary for the excavator to load one truck)
and assuming that the depot is 15 min away he takes 0.5722 hours to carry the
13m3. In an hour he “produces” 22.72 m3, what gives us the value in the above
table of 181.7m3per day. Than we adjust the number of trucks so that the
Excavators are never idle;
o The Foreman in necessary, and should be taken in account to calculate the costs,
but his “production” is to assure that the above Productivities are indeed
complied;
• The costs of the equipment were deduced from the cost per hour of these kinds of
equipment in the market that already includes the price of the Operator, fuel and
maintenance. For instance we assumed a price of 120€/h for a big excavator; 40€/h for
a Truck and 30€/h for a Backhoe1 and so on. These are average prices in the market;
• The same procedure was followed for the other tasks and equipments2;
• Having the duration, the quantity of resources employed and their cost per day we
simply have to multiply to obtain the costs;
• Besides these we also have to include other kinds of costs, the lodging for the workers,
the indirect costs (we assumed a 15% figure) , payment for the depot and for the
excavation task in the Land Movement the costs associated with draining for
constructive purposes;
1 Retro-Escavadora 2 See the Excel file to see all the values
18
• Adding all we have the price for each Activity and can also calculate the Price per Unit,
for instance 2.96€/m2 for Cleaning and Demolition;
• Since these activities are managed directly we pay them in the month they are
completed and with no delay.
For the Sub Contracted activities we apply only a monitoring team, whose cost is distributed by
all the Activities (Indirect Cost). The cost and duration for these activities was based in other
similar Constructions costs and durations for those activities, namely the new Alcântara
Terminal of the Port of Lisbon (prices).
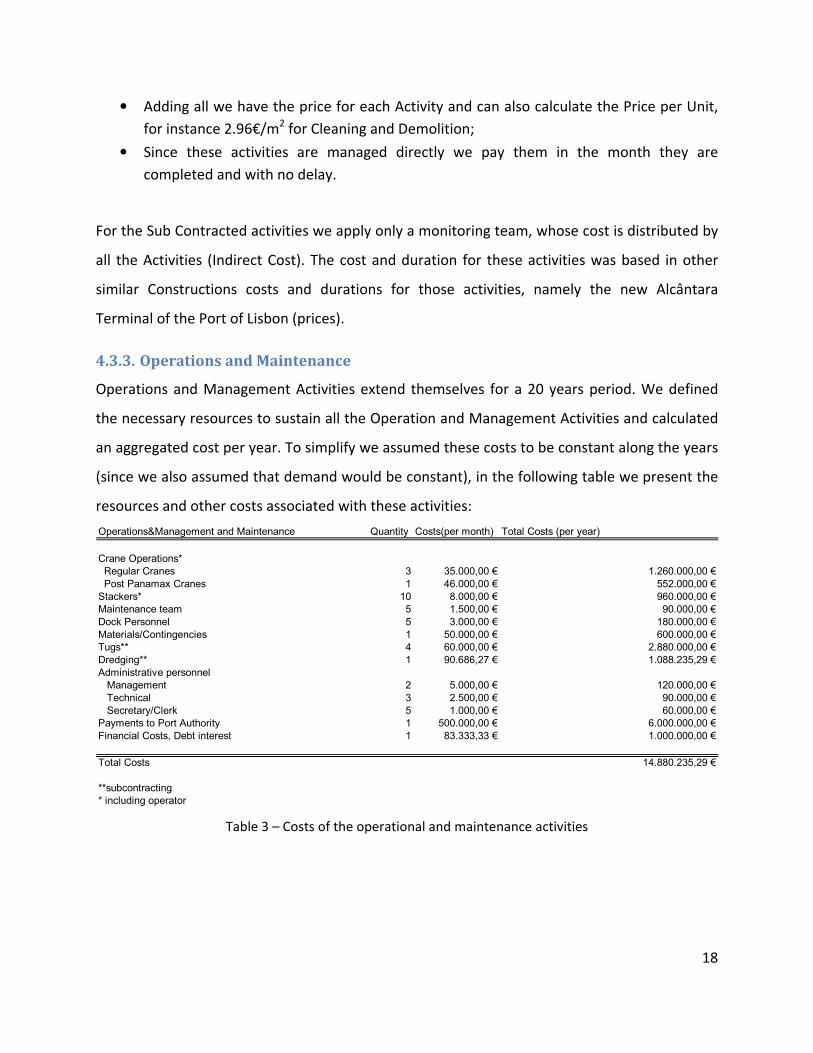
4.3.3. Operations and Maintenance
Operations and Management Activities extend themselves for a 20 years period. We defined
the necessary resources to sustain all the Operation and Management Activities and calculated
an aggregated cost per year. To simplify we assumed these costs to be constant along the years
(since we also assumed that demand would be constant), in the following table we present the
resources and other costs associated with these activities:
Operations&Management and Maintenance Quantity Costs(per month) Total Costs (per year)
Crane Operations*
Regular Cranes 3 35.000,00 € 1.260.000,00 €
Post Panamax Cranes 1 46.000,00 € 552.000,00 €
Stackers* 10 8.000,00 € 960.000,00 €
Maintenance team 5 1.500,00 € 90.000,00 €
Dock Personnel 5 3.000,00 € 180.000,00 €
Materials/Contingencies 1 50.000,00 € 600.000,00 €
Tugs** 4 60.000,00 € 2.880.000,00 €
Dredging** 1 90.686,27 € 1.088.235,29 €
Administrative personnel
Management 2 5.000,00 € 120.000,00 €
Technical 3 2.500,00 € 90.000,00 €
Secretary/Clerk 5 1.000,00 € 60.000,00 €
Payments to Port Authority 1 500.000,00 € 6.000.000,00 €
Financial Costs, Debt interest 1 83.333,33 € 1.000.000,00 €
Total Costs 14.880.235,29 €
**subcontracting
* including operator
Table 3 – Costs of the operational and maintenance activities

19
Like for the previous Activities the costs were determined based in current market values. We
should note that we assumed that payments to the State would be fixed3 (a lump sum each
year), and that dredging4 will take place all years (like we stated, although we are not
responsible for it must pay a share of this activity costs).
4.3.4. Observations
The load diagrams are showed in Annex I (Project file), and resource allocation to each Activity
can be seen in the Gantt Chart. All the quantities, prices and durations were checked taken into
account market values, related works in similar projects and the new Alcântara Terminal
project elements. The table below is a resume of our costs, in it we can also see in what period
they will occur. This is very important for the Economic/Financial assessment since it isn´t
simply how much you spend that matters, but also when they will occur (see Annex II, excel
file).
3 To be more accurate there should be a minimum payment per year, plus a value per container moved. 4 The cost for this was based in the expected costs of dragging for the Porto f Lisbon until 2042.

20
Activities Price Per Act Dead Line(periods)
Tendering Process Application Of Private entities 719.234,21 € 1 to 3
Bidding phase (Project development) 1.438.468,42 € 5 to 10
Negotiation Phase 958.978,95 € 13 to 16
Project development, detail specifications 1.438.468,42 € 18 to 23
Construction 109.538.979,00 € 51
Clean, demolition and deactivation of existing buildings 236.946,00 € 27
Land Movements 802.033,00 € 28
Berth 70.000.000,00 € 51
Piles (deep foundation) 17.000.000,00 € 28
Infrastructure 13.000.000,00 € 43
Protecting barrier (Rip rap) 40.000.000,00 € 51
Rolling Way 2.000.000,00 € 51
Administrative buildings and warehouses 10.000.000,00 € 48
Equipment* 16.500.000,00 € 51
Pavement 10.000.000,00 € 51
Operation**Tugs
Reception and delivery of containers (land clients)
Docking and undocking of ships
Storage of containers for long and short term
Administrative services
Complementary services
Ship repair and refuel
MaintenanceEquipment renewal
Cleaning and environmental risks monitoring
Infrastructure maintenance
Total 411.698.834,88 €
Notes: Only Activities For which we are Responsibles
* In Equipment we include the price of the cranes for the terminal (3 regular and 1 for post panamax ships)
**This cost is per year
297.604.705,88 € 52 to 291
4.555.150,00 €
Table 4 – Description of the costs of the all project
5. Finance/Economical assessment
As a private entity it is our objective to have an operation that will cover the investment and
also generate profit to our shareholders. With the evaluation performed in the previous section
regarding all the costs involved for the whole project, we now make an economic viability
assessment. Since the PPP agreement stipulates that we, as the private entity, finance the total
project, we now concentrate on studying the main source of revenue, which occurs during the
operations phase, of the project: the TEU’s loaded and unloaded from the ships. There are
several other services provided by us which consequently generate revenues, but to simplify

21
the calculations, we made our analysis solely based on the revenues generated by the TEU’s
movements in the port. We performed the following different analysis:
1. Base case, fixed price per TEU (based on a good market price, 128€), most likely
demand and with that calculate NPV for the concession period assuming a 8%
discount rate, the internal rate of return(IRR) and the breakeven point (payback
period).
2. Compose 3 different demand scenarios (A-high demand, B-medium and C-low) and
establish a fixed IRR of 8%. Then, determine the price per TEU to achieve this value.
3. With a discount rate of 8% and varying the demand, see the variation of the NPV.
Within these two approaches and in order to simulate the demand evolution during the
whole concession period, all the demands were not fixed for the 20 years of the operation but
instead we determined that it will have a fixed value for the first 4 years (start phase), then a
value from the 4th
to 10th
(1st
expansion phase) and finally a value from the 10th
to the 20th (
(2nd
expansion phase).
Next we will show information about the total costs projections for the project and
afterwards we will explain the 3 different approaches in more detail and present the results.
5.1. Total Costs
Performing the calculations, the total cost of the project is 411,698,834.88 €. This
corresponds to the costs of construction and tendering phases and 20 times (years) the
Operations/Maintenance costs.
Phase Costs €/month
Construction Costs 109.538.979,00 €
Tendering 4.555.150,00 € 239.744,74 €
Operations/Maintenance(per Year) 14.880.235,29 € 1.240.019,61 €
Total Costs 411.698.834,88 €
Table 5 - Total Costs of project
22
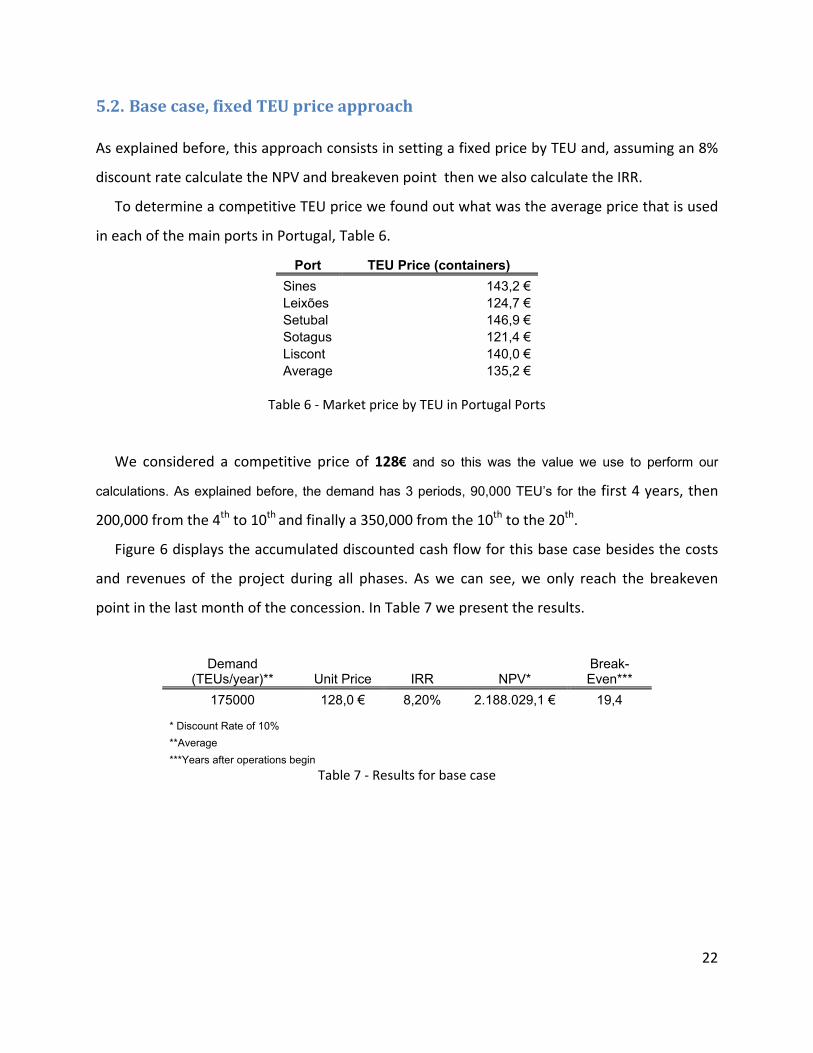
5.2. Base case, fixed TEU price approach
As explained before, this approach consists in setting a fixed price by TEU and, assuming an 8%
discount rate calculate the NPV and breakeven point then we also calculate the IRR.
To determine a competitive TEU price we found out what was the average price that is used
in each of the main ports in Portugal, Table 6.
Port TEU Price (containers)
Sines 143,2 €
Leixões 124,7 €
Setubal 146,9 €
Sotagus 121,4 €
Liscont 140,0 €
Average 135,2 €
Table 6 - Market price by TEU in Portugal Ports
We considered a competitive price of 128€ and so this was the value we use to perform our
calculations. As explained before, the demand has 3 periods, 90,000 TEU’s for the first 4 years, then
200,000 from the 4th
to 10th
and finally a 350,000 from the 10th
to the 20th
.
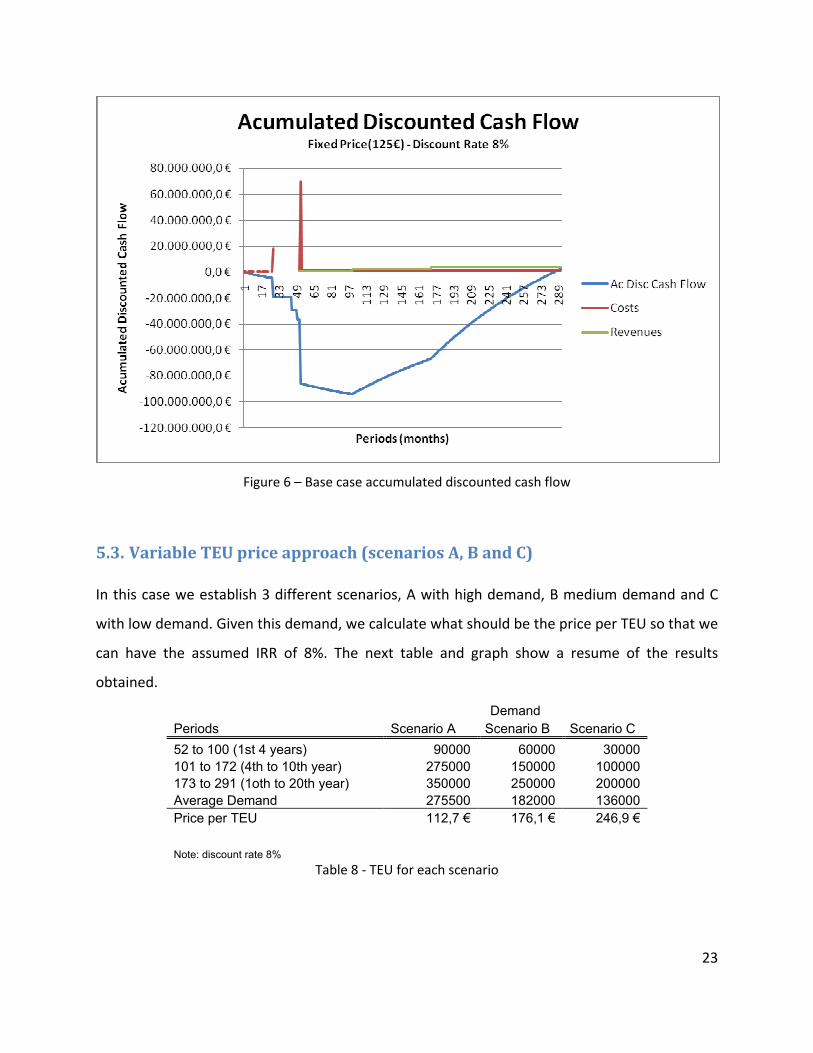
Figure 6 displays the accumulated discounted cash flow for this base case besides the costs
and revenues of the project during all phases. As we can see, we only reach the breakeven
point in the last month of the concession. In Table 7 we present the results.
Demand (TEUs/year)** Unit Price IRR NPV*
Break-Even***
175000 128,0 € 8,20% 2.188.029,1 € 19,4 * Discount Rate of 10%
**Average
***Years after operations begin
Table 7 - Results for base case
23
Figure 6 – Base case accumulated discounted cash flow
5.3. Variable TEU price approach (scenarios A, B and C)
In this case we establish 3 different scenarios, A with high demand, B medium demand and C
with low demand. Given this demand, we calculate what should be the price per TEU so that we
can have the assumed IRR of 8%. The next table and graph show a resume of the results
obtained.
Demand
Periods Scenario A Scenario B Scenario C
52 to 100 (1st 4 years) 90000 60000 30000
101 to 172 (4th to 10th year) 275000 150000 100000
173 to 291 (1oth to 20th year) 350000 250000 200000
Average Demand 275500 182000 136000
Price per TEU 112,7 € 176,1 € 246,9 €
Note: discount rate 8%
Table 8 - TEU for each scenario
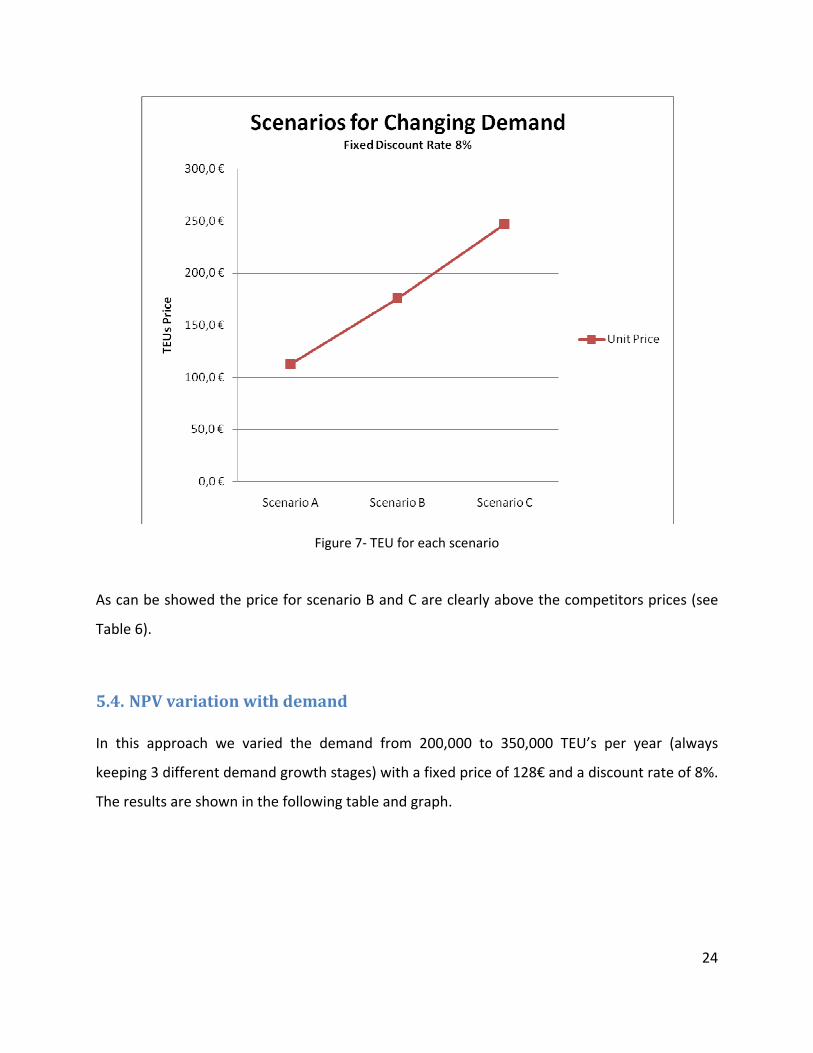
24
Figure 7- TEU for each scenario
As can be showed the price for scenario B and C are clearly above the competitors prices (see
Table 6).
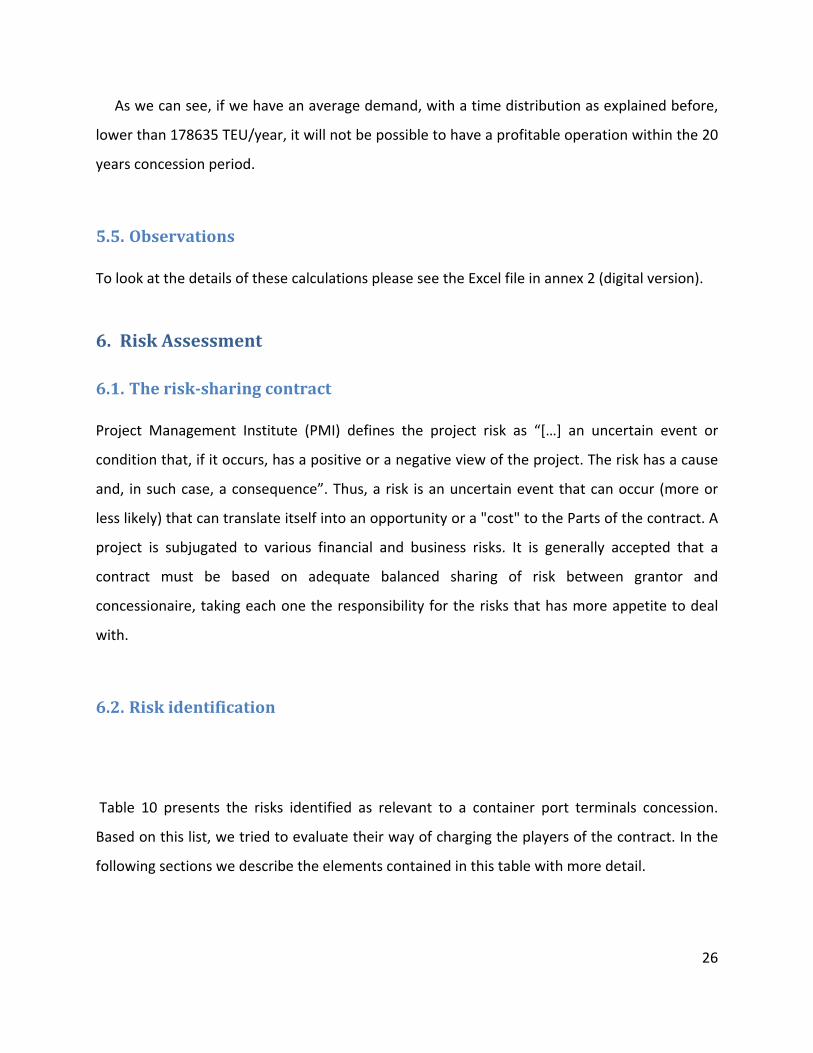
5.4. NPV variation with demand
In this approach we varied the demand from 200,000 to 350,000 TEU’s per year (always
keeping 3 different demand growth stages) with a fixed price of 128€ and a discount rate of 8%.
The results are shown in the following table and graph.

25
Demand(1st 4 years) Demand(from 4 to 10 years) Demand(last 10 years) Demand (average) NPV
116667 269231 350000 209103 33.335.097,5 €
113333 261538 340000 203128 26.798.477,7 €
110000 253846 330000 197154 20.261.858,0 €
106667 246154 320000 191179 13.725.238,2 €
103333 238462 310000 185205 7.188.618,4 €
100000 230769 300000 179231 651.998,6 €
96667 223077 290000 173256 -5.884.621,2 €
93333 215385 280000 167282 -12.421.241,0 €
90000 207692 270000 161308 -18.957.860,8 €
86667 200000 260000 155333 -25.494.480,6 €
83333 192308 250000 149359 -32.031.100,4 €
80000 184615 240000 143385 -38.567.720,2 €
76667 176923 230000 137410 -45.104.340,0 €
73333 169231 220000 131436 -51.640.959,8 €
70000 161538 210000 125462 -58.177.579,6 €
66667 153846 200000 119487 -64.714.199,4 €
Table 9 - NPV for: 8% DR, 128€/per TEU
Figure 8 - Graph for NPV for: 8% DR, 128€/per TEU
26
As we can see, if we have an average demand, with a time distribution as explained before,
lower than 178635 TEU/year, it will not be possible to have a profitable operation within the 20
years concession period.
5.5. Observations
To look at the details of these calculations please see the Excel file in annex 2 (digital version).
6. Risk Assessment
6.1. The risk-sharing contract
Project Management Institute (PMI) defines the project risk as “[…] an uncertain event or
condition that, if it occurs, has a positive or a negative view of the project. The risk has a cause
and, in such case, a consequence”. Thus, a risk is an uncertain event that can occur (more or
less likely) that can translate itself into an opportunity or a "cost" to the Parts of the contract. A
project is subjugated to various financial and business risks. It is generally accepted that a
contract must be based on adequate balanced sharing of risk between grantor and
concessionaire, taking each one the responsibility for the risks that has more appetite to deal
with.
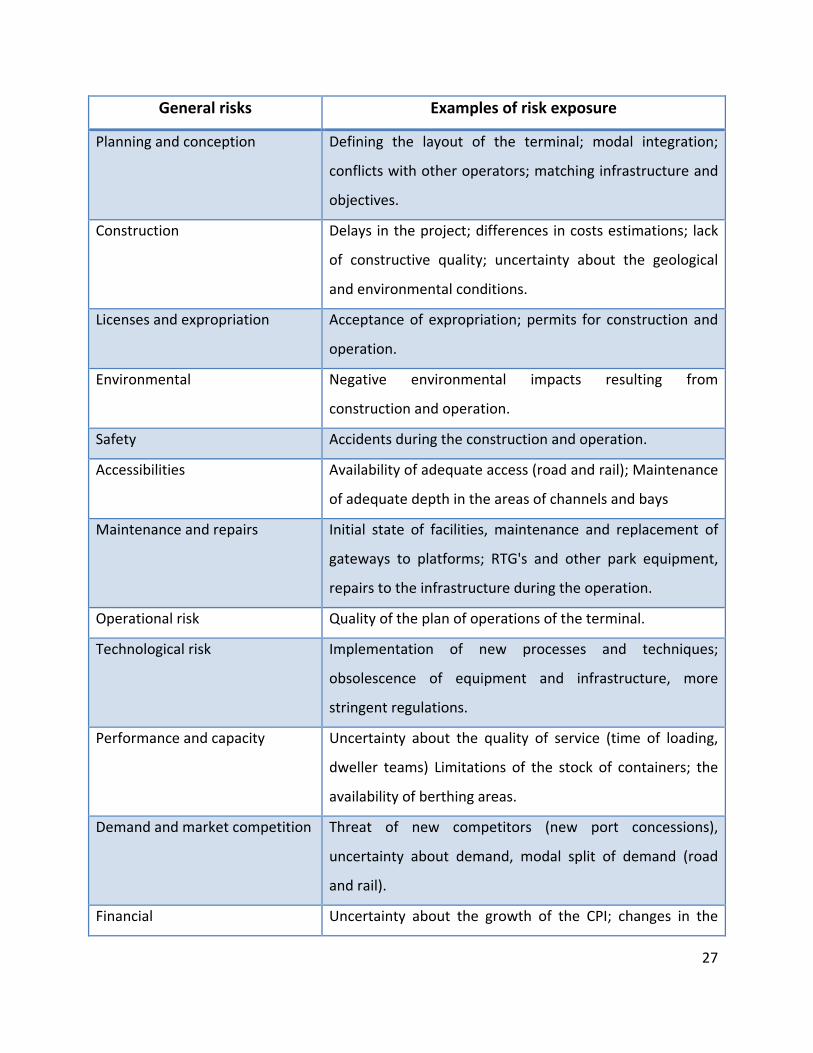
6.2. Risk identification
Table 10 presents the risks identified as relevant to a container port terminals concession.
Based on this list, we tried to evaluate their way of charging the players of the contract. In the
following sections we describe the elements contained in this table with more detail.
27
General risks Examples of risk exposure
Planning and conception Defining the layout of the terminal; modal integration;
conflicts with other operators; matching infrastructure and
objectives.
Construction
Delays in the project; differences in costs estimations; lack
of constructive quality; uncertainty about the geological
and environmental conditions.
Licenses and expropriation Acceptance of expropriation; permits for construction and
operation.
Environmental Negative environmental impacts resulting from
construction and operation.
Safety Accidents during the construction and operation.
Accessibilities
Availability of adequate access (road and rail); Maintenance
of adequate depth in the areas of channels and bays
Maintenance and repairs
Initial state of facilities, maintenance and replacement of
gateways to platforms; RTG's and other park equipment,
repairs to the infrastructure during the operation.
Operational risk Quality of the plan of operations of the terminal.
Technological risk Implementation of new processes and techniques;
obsolescence of equipment and infrastructure, more
stringent regulations.
Performance and capacity
Uncertainty about the quality of service (time of loading,
dweller teams) Limitations of the stock of containers; the
availability of berthing areas.
Demand and market competition Threat of new competitors (new port concessions),
uncertainty about demand, modal split of demand (road
and rail).
Financial Uncertainty about the growth of the CPI; changes in the

28
General risks Examples of risk exposure
financial burden and risk of insolvency partners.
Legal risk
Impact of new legislation on the cost structure of the
project and operations of the terminal.
Political risk and unilateral
modification of contract
Sudden changes to the plan that gives cause for economic
rebalancing. Changes in policies on public funding of ports;
change of government.
Force majeure Natural disasters; vandalism; war.
Table 10 - Key-risks identified in the container terminal operation
6.2.5. Planning
The decision to concession or not a new port terminal is typically a responsibility of the grantor,
being the amount of preparation of the concession contract. The definition of the model most
appropriate award should be based on the strategic vision of each port authority for the
development of its port, the level of demand recorded and assessment of potential
stakeholders. The expansion of already existing infrastructure can be the initiative of either the
port authority or from one of the existing operators; the risk can be shared between the
contracting parties or made individually by one. Any of these situations requires the conclusion
of a new dealership agreement or an addendum to the concession contract, which studied the
contracts do not constitute references to the terms of exploitation of these areas of possible
expansion. The contract may be set the conditions under which that expansion should be
addressed (e.g. saturation of the existing terminal).
6.2.6. Design and construction
Of the contracts examined, the majority requires the completion of works of improvement or
expansion of the terminal concessionaire. These may be smaller, as in Alcântara, which
provides the place (the dog) in the final coating of asphalt concrete embankment of the area
29
"or very large, as in Sines, where it is expressed "is the responsibility of the concessionaire to
build and develop the terminal XXI", which discriminated the different phases of construction
and their dates of availability. Thus, responsibility for execution of construction work is in the
dealer, and it charged all the risk. All contracts reviewed refer to the grantor (the Port
Administrations) responsible for maintaining accessibility to the sea berth to discharge, which
although it can be seen as a risk associated with construction will be discussed in the topic on
accessibility.
6.2.7. Licenses, expropriation and environmental risk
The general rule for licensing is done by the following: the Port Authority take responsibility for
issuing all licenses required within their area of jurisdiction, and the remainders in the
Concessionaire domain. Generally, the development of a proposed expansion/construction of a
port terminal require a number of licensing bodies outside the administration port, including
the caps with jurisdiction over the port in question, licensing and comrades of the ministry of
the environment.
At the environmental level, some contracts emphasize the responsibility of the
concessionaire on all the direct causes that might provoke environmental damages by
operating the concession. So, the environmental monitoring may be under the responsibility of
the concessionaire, using a monitoring plan established in the concession contract and the
development of locally contingency plans, in order to tackle environmental risks associated
with their activity. However, the role of the concessionaire is much more linked to prevention
and more monitoring than intervention in case of any pollutant discharge or other abnormal
occurrence. Its liability is restricted to the environmental risk that are directly attributable to
the business of cargo handling, which are generally less significant when compared with those
resulting from the cargo handling by sea.
For safety issues, commonly, the concessionaire is responsible for matters relating to the
enforcement of laws and port regulations in force about to fire and explosions, security in the
storage and cargo handling (dangerous or not) and security against theft and intrusion.

30
6.2.8. Accessibility
The security of access by land and by sea in a container terminal is essential for its viability. For
maritime accessibility, generally, the concessionaire is responsible for the maintenance of the
operating basin bottom and the dock of berthing of the terminal concessioned and the
channels of access, providing the maintenance dredging regularly.
If the access channels are common areas, it makes all sense that the responsibility for its
maintenance in proper conditions of navigability should be assured by the authority with
jurisdiction over that port, that is, the PA. The contract can, and should, establish a
interdependence relationship between the adequate availability of maritime access and the
operation of the terminal.
6.2.9. Maintenance and repairs
Since the operational responsibility of the container terminal is almost always in the
concessionaire domain, it stipulates that "the company will install the equipment needed to
operate the concession and the replacement of those who, by destruction, failure, wear or
technical obsolescence is appear inadequate for the purpose intended to ensure continuous
operation of the services. This obligation is extended, based on Decree-Law No. 324/94, all
goods which are the establishment, i.e. "the infrastructure, facilities and equipment used by the
grantor to the terminal and all it embodied or installed by Concessionaire. Grantor to it, as
already mentioned, the continued elevation of the channels of access and berth funds of the
terminal, and the land accessibilities (could be the responsibility of entities other than the
grantor) as well.
6.2.10. Technological risk
Technological risk is together with situations that, the emergence of new procedures for cargo
handling or increasing of requirements to provide the service, there is a need to restructure the
operational process or the equipment used, to avoid market losses or overruns. An excellent
example of technological risk is the increasing size of container ships, with the consequent need
31
for investment in terms of cargo handling equipment. It is necessary to also make a distinction
between technological change and ensuring operational efficiency, advocated by the principle
of better technology.
6.2.11. Demand and market competition
The risk associated with demand is by definition of the concession contract, if attributable to
the concessionaire. However, there are mechanisms to mitigate this risk, particularly through
the breakdown of fees payable to the grantor in terms of levels of demand recorded. For
example, in Setubal, the variable component of the fees payable, which is the number of
containers handled, has 3 bands, which correspond to different search figures collected by the
grantor. The same happens in Sines, where the annual fees, according to the number of TEUs
handled are also growing. For the concessionaire, this system allows the cost of granting relief
in case of reduction in demand or the start of operation of the terminal. The competition
between operators, but is wanted by authorities, is a source of great uncertainty for dealers,
given the volume of investment that the concessions and imbalances imply that the emergence
of new players can bring to the grant. Thus, it can be considered the contract a clause that
seeks to defend the concession of unexpected changes to the market that was considered in
Base Case of concession.
6.2.12. Financial
The funding necessary for the development of the outsourced activities is responsibility of the
concessionaire, by nature of the contract of concession contracts. The grantor is not subject to
any obligation, nor assumes any liability or risk with regard to funding for the development of
integrated activities in the concession. The concessionaire generally uses the funds from banks
or other financial institutions to accomplish the obligations arising from the concession
contract.
In ensuring the funding for the project generally is established an attachment on the
movable property of the concessionaire. However, this pledge requires the approval of the Port

32
Authority. Similarly, for the financial institutions involved will have a direct interest in the
project in case of default of the obligations of the Concessionaire and / or replace the
Concessionaire by another appropriate organization can be constituted pledge on the
concessionaire actions, as collateral for financing the project. In this situation, the consent of
the Grantor is required, since this opportunity to steep in of the donors (for the position of
dealer in case of default) is only possible if there is a document attached to the proposal that
certify the existence of a prior agreement between the grantor and the donors.
The sensitivity of economic-financial balance of the concession be affected by changes in
macroeconomic indicators is also safeguarded in contracts, as for payments to be made to the
grantor (the concession fees) is generally expected that they are updated based on values the
CPI recorded. Similarly, some contracts also stipulate that the tariff applied to the provision of
cargo handling, which requires the approval of the grantor, may be updated, regardless of this
approval, based on the annual change in prices: "if the grantor does not approve the draft
update of the charges made by the concessionaire, it will have the right to update the rates in
accordance with the CPI.
6.2.13. Legal
In few cases, contracts have reviewed references to the legal aspect. The provision differs from
the generally prescribed for the sector (general legislation in force) by the exclusion of
legislative and environmental components, which in the case of amendments to the particular
law also give rise to economic-financial rebalance of the concession. This situation also fits in
the domain of unilateral changes of contracts.
6.2.14. Political and unilateral modification of contract
In case of unilateral modification of the contract, the concessionaire can claim the economic-
financial balance of the concession. The effects of policies changes of state that are not
included in the base case assumptions of the concession and, in some way, interfere with the
operation of service, it will be the responsibility of the concessionaire.
33
6.2.15. Force majeure
In the definition of force majeure fits all "unforeseeable and irresistible event, outside the
Concessionaire and the effects of which will produce regardless of personal circumstances and
of the same (e.g., acts of war, terrorism, earthquakes and trade embargoes). The concession
contracts foresee the possibility of the grantor temporarily assumes the operation of services of
the concession, and, in this situation the period of concession is suspended. If the grantor does
not assume the control of the concession, the concessionaire is exonerated from the
responsibility for incompliance of the obligations arising from the contract that are affected by
the occurrence of force majeure.
The occurrence of force majeure results in the replacement of the economic-financial
balance of the concession, because of the unexpected loss that leads to the dealer. In case of
an insurable risk, the economic -financial balance for the excess of losses results from the
activation of the insurance.
6.3. Other risks
Until now, we did not develop any topic relating to operational risk and performance and
capacity they are closely associated with the operation of the terminal and, as such, are the
sole responsibility of the concessionaire. Regarding the risk of accidents during the construction
and operation (safety risk), this is exclusively within the concessionaire responsibility, in all that
respects to the terminal concessioned. They may, indeed, occur situations in which third parties
have also to take responsibility for mistakes or accidents arising from their work, such as the
case of freight forwarders in circulation within the terminal, the towing company or even pilots
service of the PA at the dock vessels or civil construction companies outsourced by the
concessionaire (In table 1 is summarized the risks allocation).
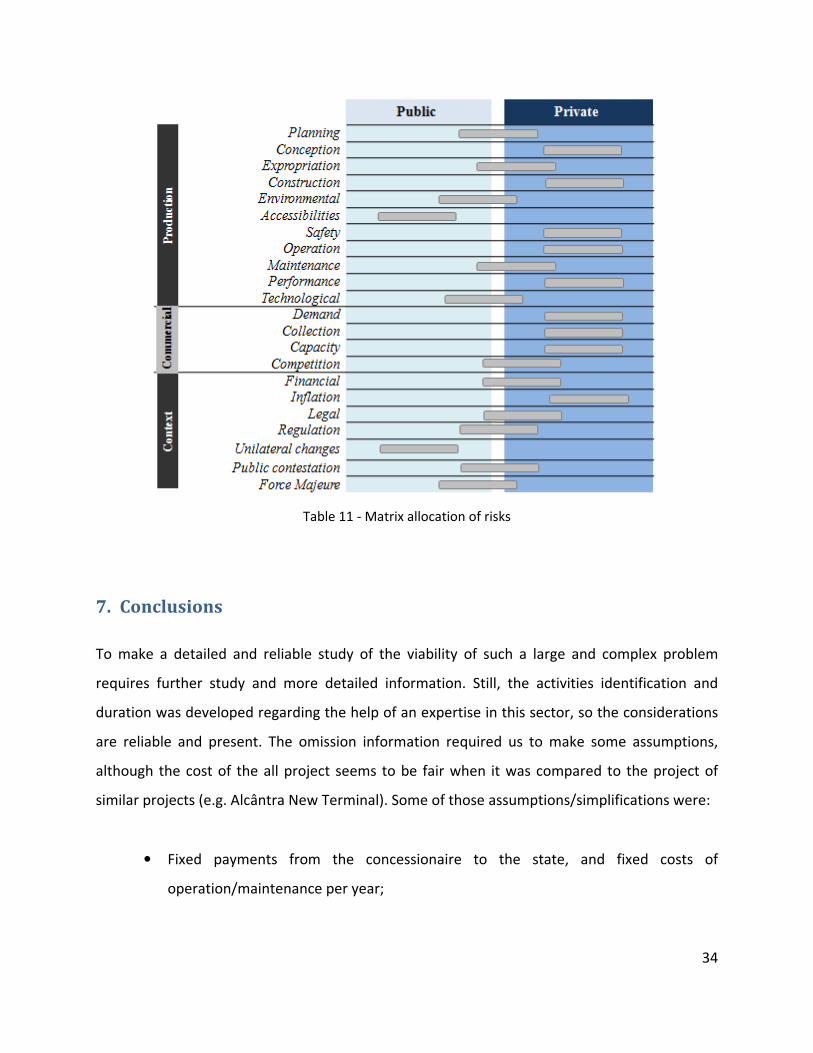
34
Table 11 - Matrix allocation of risks
7. Conclusions
To make a detailed and reliable study of the viability of such a large and complex problem
requires further study and more detailed information. Still, the activities identification and
duration was developed regarding the help of an expertise in this sector, so the considerations
are reliable and present. The omission information required us to make some assumptions,
although the cost of the all project seems to be fair when it was compared to the project of
similar projects (e.g. Alcântra New Terminal). Some of those assumptions/simplifications were:
• Fixed payments from the concessionaire to the state, and fixed costs of
operation/maintenance per year;
35
• Profits were reduced to a value per TEU moved when there are other sources of
income (like storing the containers…);
• Assuming an IRR of 8% for the project as a benchmark for part of our sensitivity
analysis required further justification;
• Demand estimates for the 20 year operation phase were split in three parts, early
beginning(first 4 years, with lower values), expansion period(from 4th
to 10th
year,
bigger values) and full maturity (last 10 years, with Port Terminal performing at his
maximum for the different scenarios);
• Values were based on experience in similar projects, still each site and project as its
own specificities, so a more focused analysis on the concrete investment to be made
is necessary.
But, even with this assumptions/simplifications the order of magnitude of the values shown
in this report are accurate. And with some sensibility analysis some conclusions can, and should
be done.
The amount of expected demand is key for determining the viability of this project, even
more then some eventual increase in cost of construction. Given the fact that this new terminal
will be set up in the middle of the biggest economic crisis in the last 60 years, and that a recent
terminal (Sines-Terminal XXI) is aggressively competing for the same (almost) market share it is
extremely risky to assume that demand will be high and maximum capacity will be reached. In
our base scenario the break-even point would only be reached in the end of the project, the
20th
year of operations… The IRR is 8,2%, what is a good value if the assumptions hold, but
allows very little buffer for risk and the NPV is 2.188.029,1 €, so the project is economically
viable, but it requires for a huge financial commitment (in period 105, 4 and ½ years after the
start of operations, the accumulated discounted cash flow is of -91.606.132,4 €!).
Fixing the IRR in 8%, at a price of 128€/TEU, and varying the demand we see that for an
average demand (across the three stages in the Terminal evolution) of less than 178635
TEU/year the NPV is negative. And with a medium and low demand scenario (B and C) the
36
required price/TEU to keep the project viable (at a 8% IRR) is much higher then what his
competitors do.
With a concession of 30, instead of 20 years the numbers would look better bet than this,
but uncertainty would be even higher about demand… So this is a Project that is viable for more
optimistic scenarios and that carries huge risks, in a nutshell it as a questionable robustness.
From the numbers we conclude that the choice of making this project cannot be made
exclusively taking in account the return it will provide, and any Private Partner that will be
brought in would only do so if it can count on sources of income other than the container
movement5. Since there is still capacity available in the Port of Setubal and Sines there is no
bottle neck on the rest of the economic sectors to have a Port, necessarily in the city of Lisbon,
with increased capacity.
Therefore this can only be justified as a national (at most regional) strategic choice, to make
the Port of Lisbon a big contender in the Iberian Market, bearing the above signaled risks and
associated costs. Thus now the question is if the Port of Lisbon is the place to make that bet? Is
there space to develop there a large logistical platform? Is there space to house nearby new
complementary Industries that take advantage of the Port proximity? Is it the place that offers
the best conditions to optimize efficiency and productivity in operations?
If the answer to this questions is yes than the expansion should go forward, if more suitable
places exist in the great Lisbon area they should be seriously be taken in account, namely the
Port of Setubal and Sines.
In a nutshell, the choice to make this investment must be made taken in account all the
regional/national economic strategy and the Ports (either Lisbon, Setubal, Sines, Portimão, or
even Leixões) big options/investments should be seen in the context of a system were all the
existing Ports are complementary instruments in a pursuit of a National purpose and not as
small feuds at the service of their own interests or third parties… At least in a situation like this
were the investment is only justifiable as a Strategic National/Regional objective.
5 Or even production port activities...

37
Final important remark as to do with cost flexibility, and overall infrastructure/operational
capability to be flexible in the face of shifting and unpredictable demand/technical trends. We
are in the beginning of a crisis with historic proportions and that should be taken in account.
Is it possible with low infrastructural investment to best manage the 20 Km water front at the
disposal of the Port of Lisbon? Can the already existing infrastructures be better managed
(maybe shifting some functionality from one zone of the Port to other?)? Can productivity and
capacity expand optimizing existing resources? Answering this last questions and implementing
the responses seams a best option for the Port of Lisbon than embarking in a high financial cost
enterprise with a high economic, and above that, financial risk.
8. Bibliography
8.1. Sites
Lisboa, P. (2007). Retrieved from http://www.portodelisboa.pt
http://www.portodelisboa.pt/portal/page/portal/PORTAL_PORTO_LISBOA/AUTORIDADE_PORT
UARIA/GOVERNO_SOCIEDADE/PLANO_ESTRATEGICO/PEDPL%20-
%20BROCHURA_Portugues.pdf
8.2. Papers
Rodrigue, J., Comtois, C. and Slack, B. (2006). The geography of transport systems. Routledge:
New York.
Carvalho, M. (2007). Performane Evaluation of Portuguese Seaports. MSc thesis, Instituto
Superior Técnico, Technical University of Lisbon, Portugal.
AICEP (2008): Statistical Bulletin – 2007, Agência para o Investimento e Comércio Externo de
Portugal, Lisbon.

38
Wang, T., K. Cullinane, and D. Song (2005): Container Port Production and Economic Efficiency,
Palgrave Macmillan, New York.