liquidity analysis and reportingeoplugin.commpartners.com/fms/liquidity analysis and...
TRANSCRIPT
Liquidity Analysis and Reporting
February 25, 2010
Quick | Convenient | Cost-Effective | Online Learning
Insert speaker logo here
www.fmsinc.org | 800-ASK-4FMS
Liquidity Analysis and Reporting
Jerry Boebel, CFAProfitStars
Quick | Convenient | Cost-Effective | Online Learning www.fmsinc.org | 800-ASK-4FMS
Objectives• Define liquidity
• Current trends
• Evaluate traditional liquidity analysis
• Consider a new approach
– Better liquidity and NIM management
– Meet changing examiner expectations
Liquidity Analysis and Reporting
February 25, 2010
Quick | Convenient | Cost-Effective | Online Learning www.fmsinc.org | 800-ASK-4FMS
Liquidity
• Essential to compensate for expected and unexpected balance sheet fluctuations and provide funds for growth
• Liquidity risk occurs when you are not able to obtain funds at the optimal price within a reasonable time period to meet obligations as they become due
Quick | Convenient | Cost-Effective | Online Learning www.fmsinc.org | 800-ASK-4FMS
Current Trends
• In Q2 2008, the securitization market froze
• Finance units that used to sell commercial paper to fund their lending started going after your deposits
• GMAC (now Ally Bank)
• ING
• Brokered deposits became more expensive (relative to asset yields)
Liquidity Analysis and Reporting
February 25, 2010
Quick | Convenient | Cost-Effective | Online Learning www.fmsinc.org | 800-ASK-4FMS
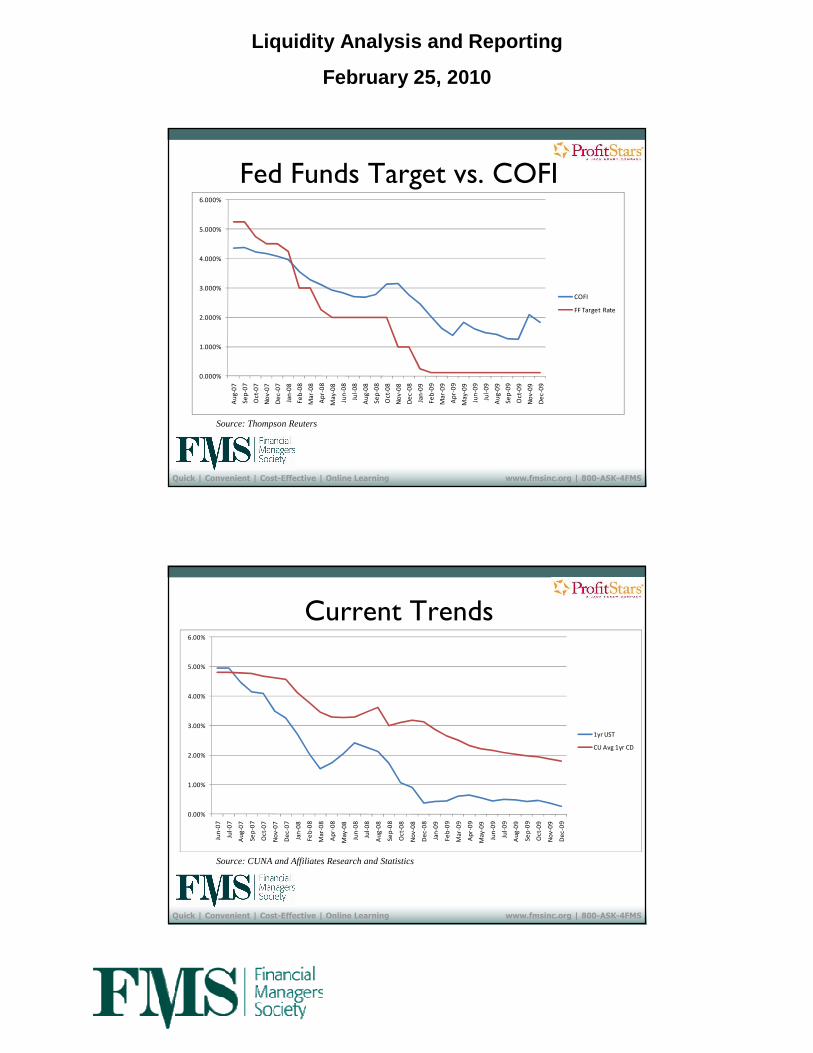
Fed Funds Target vs. COFI
Source: Thompson Reuters
0.000%
1.000%
2.000%
3.000%
4.000%
5.000%
6.000%
Au
g-0
7
Se
p-0
7
Oct-
07
No
v-0
7
De
c-0
7
Jan
-08
Fe
b-0
8
Ma
r-0
8
Ap
r-0
8
Ma
y-0
8
Jun
-08
Jul-
08
Au
g-0
8
Se
p-0
8
Oct-
08
No
v-0
8
De
c-0
8
Jan
-09
Fe
b-0
9
Ma
r-0
9
Ap
r-0
9
Ma
y-0
9
Jun
-09
Jul-
09
Au
g-0
9
Se
p-0
9
Oct-
09
No
v-0
9
De
c-0
9
COFI
FF Target Rate
Quick | Convenient | Cost-Effective | Online Learning www.fmsinc.org | 800-ASK-4FMS
Current Trends
Source: CUNA and Affiliates Research and Statistics
0.00%
1.00%
2.00%
3.00%
4.00%
5.00%
6.00%
Jun
-07
Jul-
07
Au
g-0
7
Se
p-0
7
Oc
t-0
7
No
v-0
7
De
c-0
7
Jan
-08
Fe
b-0
8
Ma
r-0
8
Ap
r-0
8
Ma
y-0
8
Jun
-08
Jul-
08
Au
g-0
8
Se
p-0
8
Oc
t-0
8
No
v-0
8
De
c-0
8
Jan
-09
Fe
b-0
9
Ma
r-0
9
Ap
r-0
9
Ma
y-0
9
Jun
-09
Jul-
09
Au
g-0
9
Se
p-0
9
Oc
t-0
9
No
v-0
9
De
c-0
9
1yr UST
CU Avg 1yr CD
Liquidity Analysis and Reporting
February 25, 2010
Quick | Convenient | Cost-Effective | Online Learning www.fmsinc.org | 800-ASK-4FMS
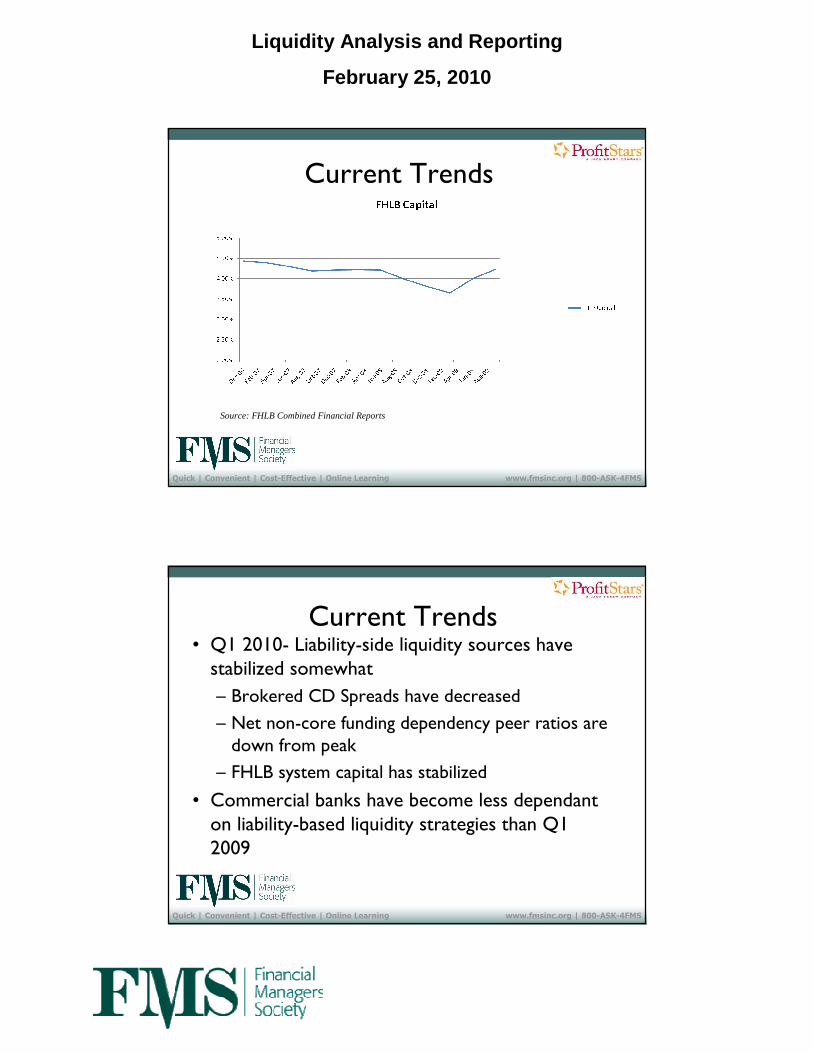
Current Trends
Source: FHLB Combined Financial Reports
Quick | Convenient | Cost-Effective | Online Learning www.fmsinc.org | 800-ASK-4FMS
Current Trends• Q1 2010- Liability-side liquidity sources have stabilized somewhat
– Brokered CD Spreads have decreased
– Net non-core funding dependency peer ratios are down from peak
– FHLB system capital has stabilized
• Commercial banks have become less dependant on liability-based liquidity strategies than Q1 2009
Liquidity Analysis and Reporting
February 25, 2010
Quick | Convenient | Cost-Effective | Online Learning www.fmsinc.org | 800-ASK-4FMS
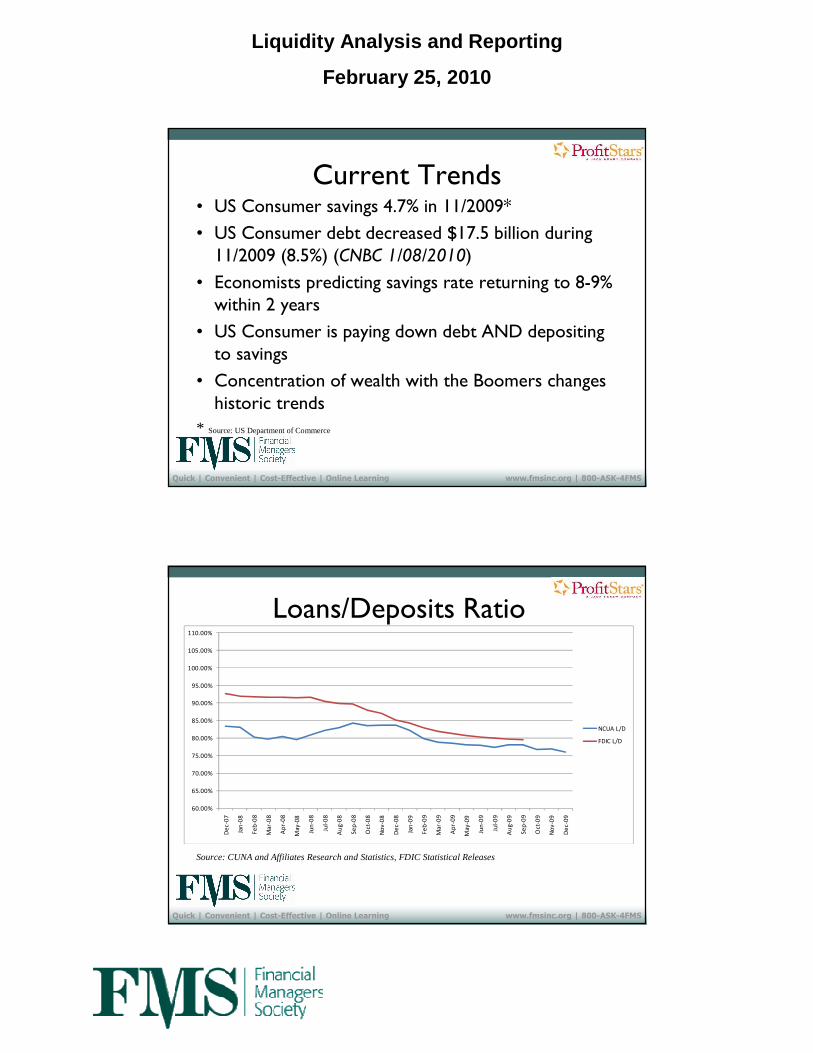
Current Trends• US Consumer savings 4.7% in 11/2009*
• US Consumer debt decreased $17.5 billion during 11/2009 (8.5%) (CNBC 1/08/2010)
• Economists predicting savings rate returning to 8-9% within 2 years
• US Consumer is paying down debt AND depositing to savings
• Concentration of wealth with the Boomers changes historic trends
* Source: US Department of Commerce
Quick | Convenient | Cost-Effective | Online Learning www.fmsinc.org | 800-ASK-4FMS
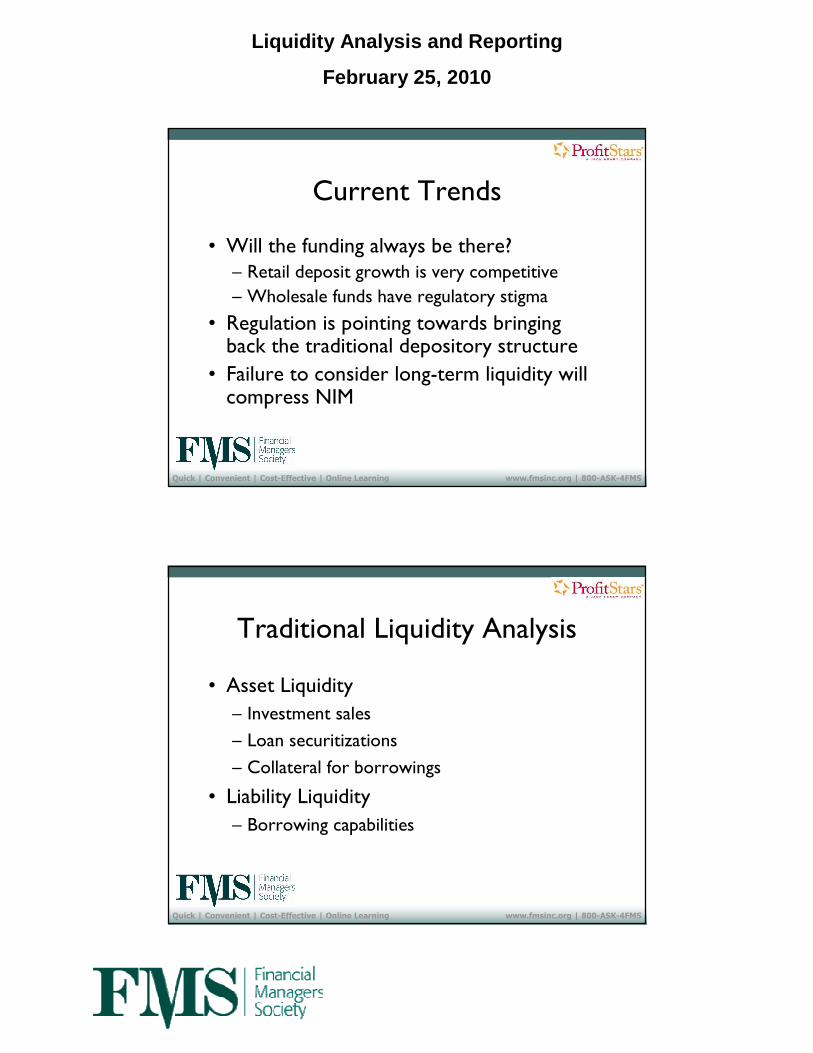
Loans/Deposits Ratio
Source: CUNA and Affiliates Research and Statistics, FDIC Statistical Releases
60.00%
65.00%
70.00%
75.00%
80.00%
85.00%
90.00%
95.00%
100.00%
105.00%
110.00%
De
c-0
7
Jan
-08
Fe
b-0
8
Ma
r-0
8
Ap
r-0
8
May
-08
Jun
-08
Jul-
08
Au
g-0
8
Se
p-0
8
Oct-
08
No
v-0
8
De
c-0
8
Jan
-09
Fe
b-0
9
Ma
r-0
9
Ap
r-0
9
May
-09
Jun
-09
Jul-
09
Au
g-0
9
Se
p-0
9
Oct-
09
No
v-0
9
De
c-0
9
NCUA L/D
FDIC L/D
Liquidity Analysis and Reporting
February 25, 2010
Quick | Convenient | Cost-Effective | Online Learning www.fmsinc.org | 800-ASK-4FMS
Current Trends
• Will the funding always be there?– Retail deposit growth is very competitive
– Wholesale funds have regulatory stigma
• Regulation is pointing towards bringing back the traditional depository structure
• Failure to consider long-term liquidity will compress NIM
Quick | Convenient | Cost-Effective | Online Learning www.fmsinc.org | 800-ASK-4FMS
Traditional Liquidity Analysis
• Asset Liquidity
– Investment sales
– Loan securitizations
– Collateral for borrowings
• Liability Liquidity
– Borrowing capabilities
Liquidity Analysis and Reporting
February 25, 2010
Quick | Convenient | Cost-Effective | Online Learning www.fmsinc.org | 800-ASK-4FMS
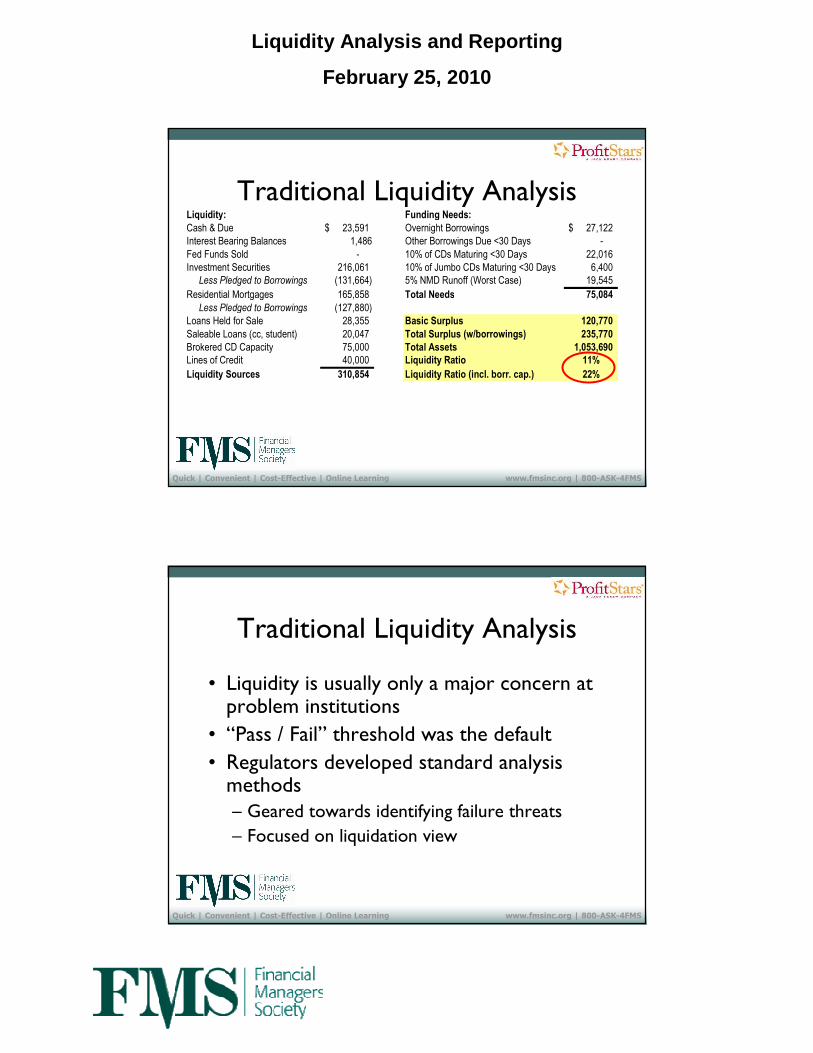
Liquidity: Funding Needs:
Cash & Due 23,591$ Overnight Borrowings 27,122$ Interest Bearing Balances 1,486 Other Borrowings Due <30 Days -
Fed Funds Sold - 10% of CDs Maturing <30 Days 22,016 Investment Securities 216,061 10% of Jumbo CDs Maturing <30 Days 6,400 Less Pledged to Borrowings (131,664) 5% NMD Runoff (Worst Case) 19,545
Residential Mortgages 165,858 Total Needs 75,084
Less Pledged to Borrowings (127,880) Loans Held for Sale 28,355 Basic Surplus 120,770
Saleable Loans (cc, student) 20,047 Total Surplus (w/borrowings) 235,770
Brokered CD Capacity 75,000 Total Assets 1,053,690
Lines of Credit 40,000 Liquidity Ratio 11%
Liquidity Sources 310,854 Liquidity Ratio (incl. borr. cap.) 22%
Traditional Liquidity Analysis
Quick | Convenient | Cost-Effective | Online Learning www.fmsinc.org | 800-ASK-4FMS
Traditional Liquidity Analysis
• Liquidity is usually only a major concern at problem institutions
• “Pass / Fail” threshold was the default
• Regulators developed standard analysis methods– Geared towards identifying failure threats
– Focused on liquidation view
Liquidity Analysis and Reporting
February 25, 2010
Quick | Convenient | Cost-Effective | Online Learning www.fmsinc.org | 800-ASK-4FMS
Traditional Liquidity Analysis
• Focus had historically been on static measures– Short-Term Assets to Short-Term Liabilities
– Pledged Securities to Total Securities
– Brokered Deposits to Deposits
– Core Deposits to Total Liabilities
– Net Loans and Leases to Deposits
– Net Loans and Leases to Total Assets
Quick | Convenient | Cost-Effective | Online Learning www.fmsinc.org | 800-ASK-4FMS
Current Liquidity Analysis
• Focus has evolved to evaluate broader measures and trends– Net Short-Term Non Core Funding Dependence
– Net Non-Core Funding Dependence Ratio
Liquidity Analysis and Reporting
February 25, 2010
Quick | Convenient | Cost-Effective | Online Learning www.fmsinc.org | 800-ASK-4FMS
Weaknesses of Traditional Analysis
• Static view
• Dated financials
• Does not account for:– Asset growth
– Deposit behavior
• No consideration of broader ALM impact
Quick | Convenient | Cost-Effective | Online Learning www.fmsinc.org | 800-ASK-4FMS
Improved Liquidity Analysis
• Approach liquidity measurement like IRR
• Incorporate strategic plan and budget
• Measure results for distinct time horizons
• Evaluate scenarios
– Interest rate changes may only be an element
– Consider best / worst / most likely
• Dynamic cash flows

Liquidity Analysis and Reporting
February 25, 2010
Quick | Convenient | Cost-Effective | Online Learning www.fmsinc.org | 800-ASK-4FMS
Step 1: Compile Realistic Numbers
• Separate internal liquidity sources from external sources– Makes it easier to do scenario testing– Examiners wish to focus on your internal capabilities
• Use your budget projections that are built into your ALM model
Quick | Convenient | Cost-Effective | Online Learning www.fmsinc.org | 800-ASK-4FMS
Step 1: Compile Realistic Numbers• Cash & Due is not completely liquid• Determine true asset sale/pledge values– Show at current market values– Haircuts often apply for pledging– Many loan types require time to liquidate
• Accurately reflect borrowing capacity– FHLB or Corporate CU lines should be questioned– FHLB-required stock purchases should be netted– Brokered deposits take several days to settle
Liquidity Analysis and Reporting
February 25, 2010
Quick | Convenient | Cost-Effective | Online Learning www.fmsinc.org | 800-ASK-4FMS
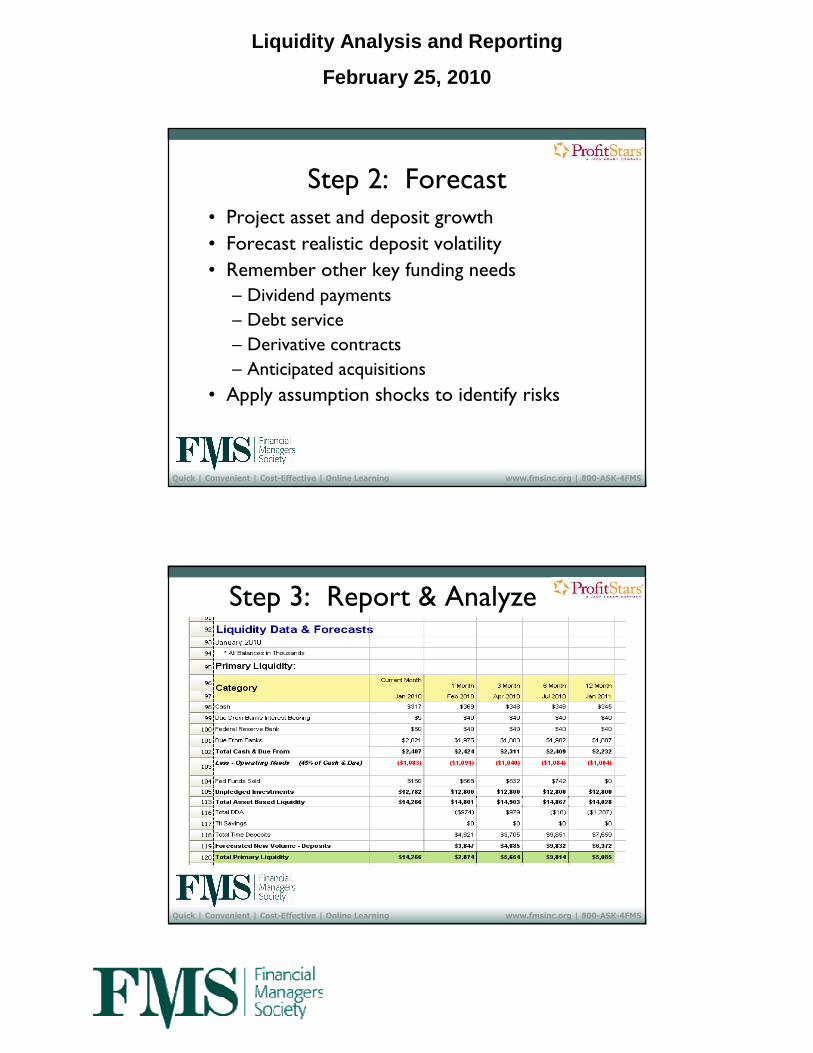
Step 2: Forecast• Project asset and deposit growth
• Forecast realistic deposit volatility
• Remember other key funding needs
– Dividend payments
– Debt service
– Derivative contracts
– Anticipated acquisitions
• Apply assumption shocks to identify risks
Quick | Convenient | Cost-Effective | Online Learning www.fmsinc.org | 800-ASK-4FMS
Step 3: Report & Analyze
Liquidity Analysis and Reporting
February 25, 2010
Quick | Convenient | Cost-Effective | Online Learning www.fmsinc.org | 800-ASK-4FMS
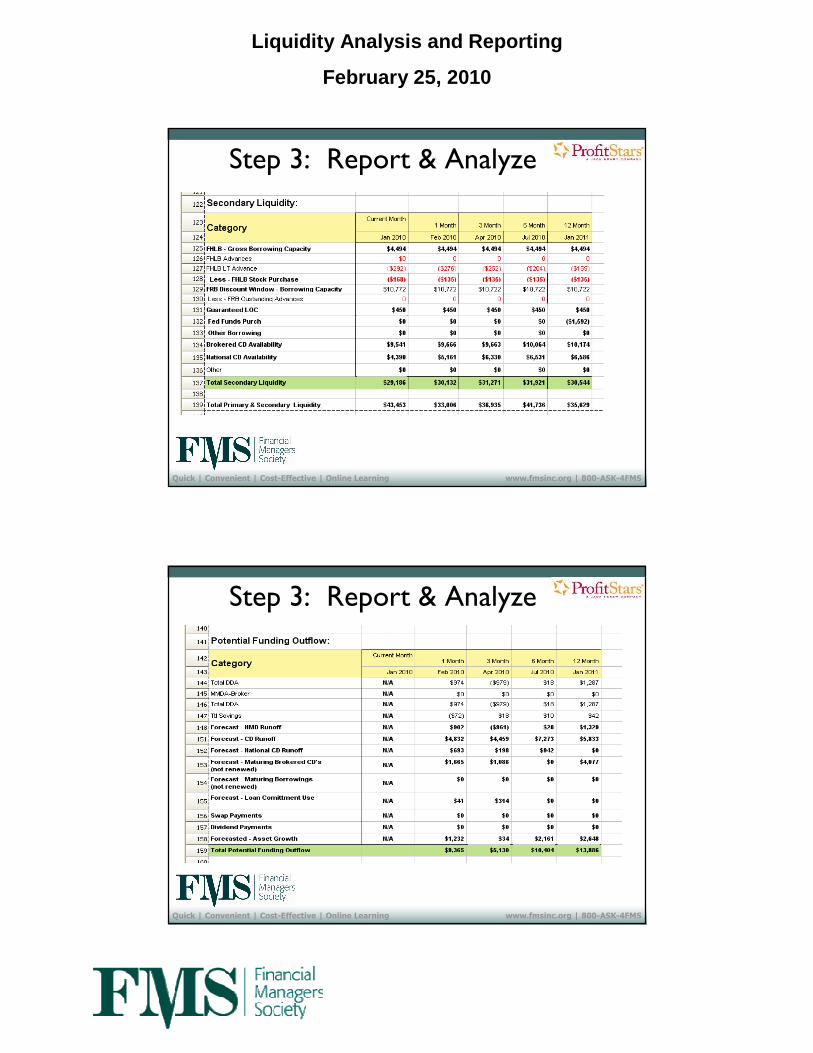
Step 3: Report & Analyze
Quick | Convenient | Cost-Effective | Online Learning www.fmsinc.org | 800-ASK-4FMS
Step 3: Report & Analyze
Liquidity Analysis and Reporting
February 25, 2010
Quick | Convenient | Cost-Effective | Online Learning www.fmsinc.org | 800-ASK-4FMS
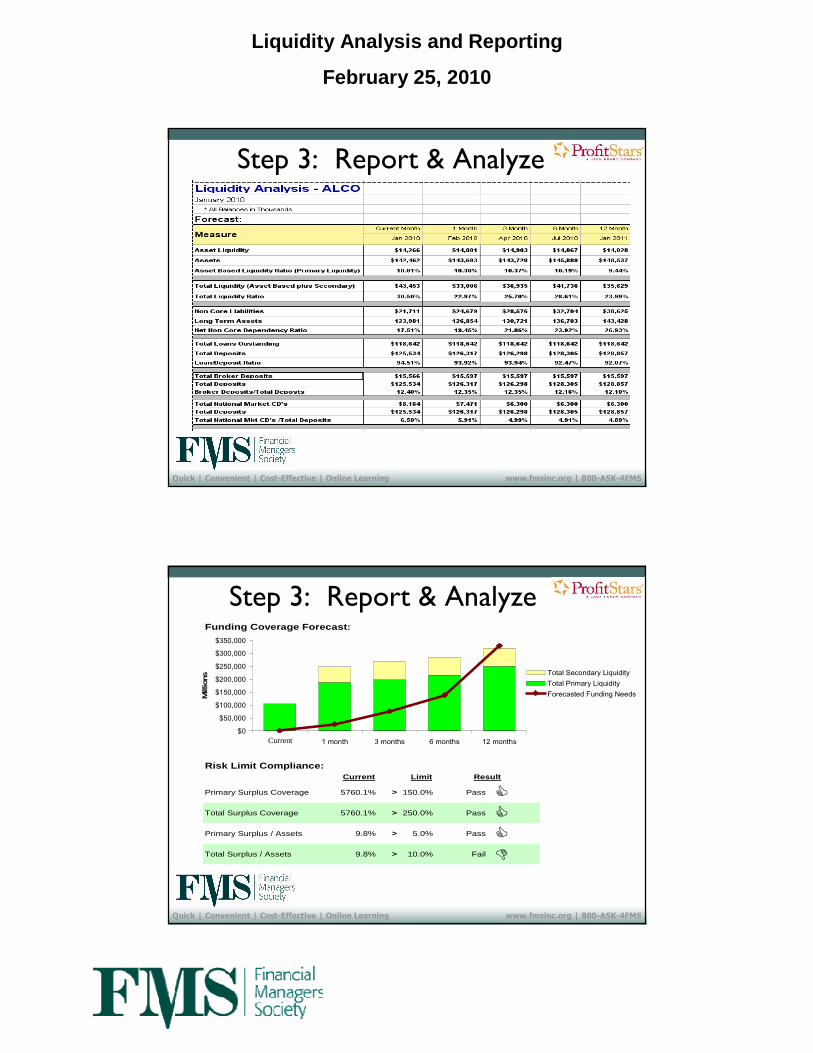
Step 3: Report & Analyze
Quick | Convenient | Cost-Effective | Online Learning www.fmsinc.org | 800-ASK-4FMS
Step 3: Report & AnalyzeFunding Coverage Forecast:
Risk Limit Compliance:Current Limit Result
Primary Surplus Coverage 5760.1% > 150.0% Pass �
Total Surplus Coverage 5760.1% > 250.0% Pass �
Primary Surplus / Assets 9.8% > 5.0% Pass �
Total Surplus / Assets 9.8% > 10.0% Fail �
$0
$50,000
$100,000
$150,000
$200,000
$250,000
$300,000
$350,000
09/30/04 1 month 3 months 6 months 12 months
Mill
ions Total Secondary Liquidity
Total Primary Liquidity
Forecasted Funding Needs
Current
Liquidity Analysis and Reporting
February 25, 2010
Quick | Convenient | Cost-Effective | Online Learning www.fmsinc.org | 800-ASK-4FMS
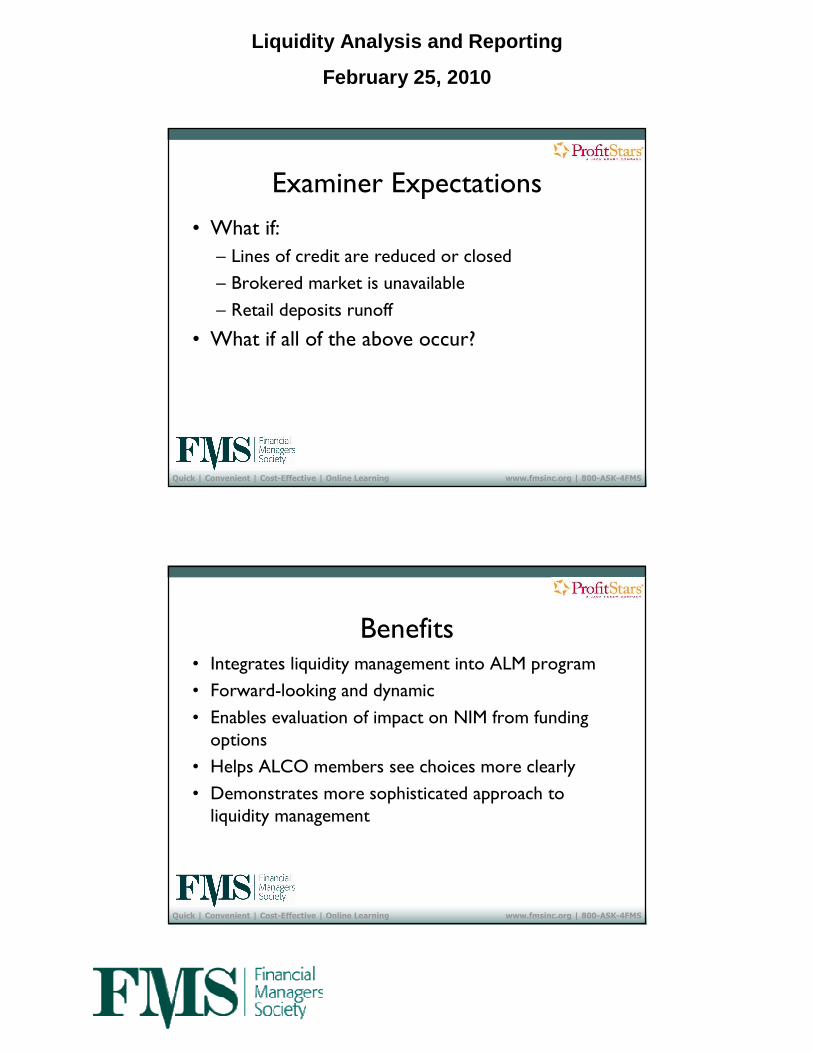
Examiner Expectations
• What if:
– Lines of credit are reduced or closed
– Brokered market is unavailable
– Retail deposits runoff
• What if all of the above occur?
Quick | Convenient | Cost-Effective | Online Learning www.fmsinc.org | 800-ASK-4FMS
Benefits• Integrates liquidity management into ALM program
• Forward-looking and dynamic
• Enables evaluation of impact on NIM from funding options
• Helps ALCO members see choices more clearly
• Demonstrates more sophisticated approach to liquidity management
Liquidity Analysis and Reporting
February 25, 2010
Quick | Convenient | Cost-Effective | Online Learning www.fmsinc.org | 800-ASK-4FMS
Resources Needed
• Reasonable budget process
– Includes input from functional areas
– Includes identification of key cash flow issues
• Effective forecasting model
Quick | Convenient | Cost-Effective | Online Learning www.fmsinc.org | 800-ASK-4FMS
Jerry Boebel, CFA
Profitstars (a Jack Henry Company)
800-356-9099
Liquidity Analysis and Reporting
February 25, 2010
Quick | Convenient | Cost-Effective | Online Learning www.fmsinc.org | 800-ASK-4FMS
The Financial Managers Society, Inc. is the only individual membership society exclusively devoted to serving the needs of finance & accounting professionals from financial institutions. Our more than 1,500 members are CFOs, controllers, CEOs, COOs, treasurers, investment officers and internal auditors from banks, thrifts and credit unions.
FMS offers career-enhancing education, targeted news and research, national leadership opportunities, a voice in shaping regulations and accounting principles and connections with other industry professionals.
MissionThe mission of the Financial Managers Society is to enhance the professional development of financial personnel within financial institutions.
The Society accomplishes this mission by: •Offering premier education and information to members and others within the financial services industry regarding accounting, financial management, regulatory, operational, auditing and other industry issues.
•Providing various forums for the exchange of information and practical applications.
•Articulating industry and member concerns to regulatory and accounting policy-setting bodies.
•Providing members with opportunities for technical, personal, and leadership growth and development.
About FMS