lipid peroxidation in vivo - diva portal
TRANSCRIPT

Comprehensive Summaries of Uppsala Dissertationsfrom the Faculty of Medicine 949
_____________________________ _____________________________
Lipid Peroxidation in vivo
Evaluation and Application of Methods for Measurement
BY
EVA SÖDERGREN
ACTA UNIVERSITATIS UPSALIENSISUPPSALA 2000

Dissertation for the degree of Doctor of Medical Science in Geriatrics - ClinicalNutrition presented at Uppsala University in 2000
ABSTRACTSödergren, E. 2000. Lipid peroxidation in vivo. Evaluation and application of methodsfor measurement. Acta Universitatis Upsaliensis. Comprehensive Summaries ofUppsala Dissertations from the Faculty of Medicine 949. 78 pp. Uppsala. ISBN91-554-4791-0.
Lipid peroxidation is thought to be an important factor in the pathophysiology of anumber of diseases and in the process of ageing, but its measurement in vivo has beendifficult. The aim of this thesis was to evaluate methods for measurement of lipidperoxidation in vivo that are suitable for clinical investigations, and to apply thesemethods in animal and human studies investigating basal conditions and situationsassociated with increased lipid peroxidation.
The ferrous oxidation in xylenol orange assay for quantification of total plasmalipid hydroperoxides was re-evaluated regarding sample handling and storage. It wasshown to be a useful tool for analyses of fresh but not stored plasma samples.
A methodology for measurement of the total amount (sum of free and esterified) ofan F2-isoprostane, 8-iso-prostaglandin F2α, in tissues using alkaline hydrolysis incombination with an existing radioimmunoassay was developed. High levels of8-iso-prostaglandin F2α in rat liver tissue were quantified by this technique both atbasal conditions and in an experimental model of increased lipid peroxidation inducedby carbon tetrachloride.
Supplementation with vitamin E to rats decreased both non-enzymatic andenzymatic lipid peroxidation as measured by 8-iso-prostaglandin F2α and a majorprostaglandin F2α metabolite. This was verified both in the urine at basal conditions,and in the urine and liver tissue after carbon tetrachloride induced lipid peroxidation.
In a randomised cross-over study in humans, a rapeseed oil-based diet with anincreased proportion of easily oxidised polyunsaturated fatty acids was compared to acontrol diet rich in saturated fats. The rapeseed oil-based diet did not seem to increasethe degree of lipid peroxidation in plasma and urine as measured by8-iso-prostaglandin F2α, hydroperoxides and malondialdehyde, presumably due to asufficient content of antioxidants in the rapeseed oil diet.
In conclusion, the simultaneous measurement of several biomarkers of lipidperoxidation is a promising approach for future studies investigating the possible roleof lipid peroxidation in vivo under basal conditions and in the pathology of diseases.
Keywords: lipid peroxidation, hydroperoxides, F2-isoprostanes, MDA, prostaglandins,measurement, carbon tetrachloride, vitamin E, dietary fat quality, rapeseed oil.
Eva Södergren, Department of Public Health and Caring Sciences, Section for Geriatrics/Clinical Nutrition Research, Uppsala University, Box 609, SE-751 25 Uppsala, Sweden© Eva Södergren 2000ISSN number 0282-7476ISBN number 91-554-4791-0Printed in Sweden by Tryck &Medier, Uppsala 2000

To Martin, my family and the memory of my father

PAPERS DISCUSSED
This thesis is based on the papers listed below, which are referred to in the textby their Roman numerals:
I. Södergren E, Nourooz-Zadeh J, Berglund L, Vessby B. Re-evaluation ofthe ferrous oxidation in xylenol orange assay for the measurement ofplasma lipid hydroperoxides.J Biochem Biophys Methods 1998; 37: 137-146.
II. Södergren E, Vessby B, Basu S. Radioimmunological measurement ofF2-isoprostanes after hydrolysis of lipids in tissues.Prostaglandins Leukot Essent Fatty acids 2000; 63: 33-36.
III. Södergren E, Cederberg J, Basu S, Vessby B. Vitamin E supplementationdecreases basal levels of F2-isoprostanes and prostaglandin F2α in rats.J Nutr 2000; 130: 10-14.
IV. Södergren E, Cederberg J, Vessby B. Basu S. Vitamin E reduces lipidperoxidation in experimental hepatotoxicity in rats.Submitted.
V. Södergren E, Gustafsson I-B, Basu S, Nourooz-Zadeh J, Nälsén C,Turpeinen A, Berglund L, Vessby B. A diet containing rapeseed oil-basedfats does not affect lipid peroxidation in humans.Submitted.
Reprints were made with the permission of the publishers.

CONTENTSABBREVIATIONS ____________________________________________________ 6INTRODUCTION ____________________________________________________ 7
Oxidation of lipids_________________________________________________ 7Free radicals, antioxidants and oxidative stress _________________________ 7Lipid peroxidation________________________________________________ 11Methods for measurement of non-enzymatic lipid peroxidation_____________ 14Methods for measurement of enzymatic lipid peroxidation ________________ 22Carbon tetrachloride induced lipid peroxidation_________________________ 22Lipid peroxidation, atherosclerosis and dietary fat quality _________________ 23
AIMS OF THE INVESTIGATIONS ______________________________________ 25MATERIALS AND METHODS _________________________________________ 26
Subjects and animals_____________________________________________ 26Experiments and interventions______________________________________ 26Blood, urine and tissue sampling ____________________________________ 28Measurement of clinical characteristics _______________________________ 29Hydrolysis and extraction of liver tissue_______________________________ 29Measurement of hydroperoxides ____________________________________ 30Measurement of F2-isoprostanes ____________________________________ 30Measurement of prostaglandin F2α metabolites _________________________ 31Measurement of malondialdehyde___________________________________ 32Measurement of antioxidants_______________________________________ 32Ethics _________________________________________________________ 33Statistics_______________________________________________________ 33
RESULTS _________________________________________________________ 35Paper I ________________________________________________________ 35Paper II _______________________________________________________ 37Paper III and IV _________________________________________________ 38Paper V _______________________________________________________ 41
DISCUSSION ______________________________________________________ 45Difficulties in assessment of lipid peroxidation__________________________ 45Comparison of different methods for lipid peroxidation measurements_______ 46Hydroperoxides as an indicator of lipid peroxidation _____________________ 48F2-isoprostanes as an indicator of lipid peroxidation _____________________ 50Possible link between oxidative injury and inflammation __________________ 53Dietary fat quality and oxidisability of different fatty acids _________________ 53Future perspectives ______________________________________________ 56
CONCLUSIONS ____________________________________________________ 58ACKNOWLEDGEMENTS _____________________________________________ 59REFERENCES _____________________________________________________ 61

6
ABBREVIATIONS
AOC antioxidative capacityBHT butylated hydroxytolueneBMI body mass indexCCl4 carbon tetrachlorideCHD coronary heart diseaseCI confidence intervalCOX cyclooxygenaseE% energy per centEIA enzyme immunoassayFOX2 ferrous oxidation in xylenol orange version 2GC gas chromatographyHDL high-density lipoprotein8-iso-PGF2α 8-iso-prostaglandin F2α
15-K-DH-PGF2α 15-keto-13,14-dihydro-prostaglandin F2αLDL low-density lipoproteinMDA malondialdehydeGC-MS gas chromatography-mass spectroscopyMUFA monounsaturated fatty acidPUFA polyunsaturated fatty acidRIA radioimmunoassaySAFA saturated fatty acidTBA thiobarbituric acidTBARS thiobarbituric acid reactive substancesVLDL very low-density lipoproteinXO xylenol orange

7
INTRODUCTION
Oxidation of lipids
Lipids is a heterogeneous group of compounds having several importantfunctions in the body such as being an efficient source of energy, constituents incell membranes and nerve tissues, thermal and electrical insulators and acting aslocal hormones etc. [1]. They are also important dietary constituents not onlybecause of their high-energy value but also because of the fat-soluble vitaminsand essential fatty acids that are contained in the fat of natural foods. Energy isproduced from lipids in the body when lipids are β-oxidised and oxygen isreduced to water in the respiratory chain by mitochondria in different tissues [1].About 85 to 90% of the oxygen consumed by humans is utilised by themitochondria for energy production, and the remaining 10 to 15% is used indirect chemical non-enzymatic reactions and by various oxidase and oxygenaseenzymes in the body [2, 3].
When lipids are oxidised without release of energy, unsaturated lipids go ranciddue to oxidative deterioration when they react directly with molecular oxygen[3-9]. This process is called lipid peroxidation and the insertion of an oxygenmolecule is catalysed by free radicals (non-enzymatic lipid peroxidation) orenzymes (enzymatic lipid peroxidation) [5, 7]. This type of lipid oxidation hasbeen recognised since antiquity as a problem in the storage of fats and oils, andperoxidation of lipids has long been studied by food chemists, polymer chemistsand even museum curators interested in the oxidative degradation of valuablepaintings. The mechanism of free radical-induced lipid peroxidation wasestablished in the 1940s by Farmer and his collaborators working at the researchlaboratories of the British Rubber Producers Association [3, 4]. Later in the1950s, the relevance of lipid peroxidation to biological systems and medicinebegan to be extensively explored.
Free radicals, antioxidants and oxidative stress
Free radicals and other reactive species
What is a free radical?A free radical may in simple terms be defined as an atom or molecule thatcontains one or more unpaired electrons and is capable of independent existence[5, 6, 10-13]. An unpaired electron is an electron that occupies an orbital alone

8 Introduction
(indicated in the text by •), but electrons usually associate in pairs in orbitals ofatoms and molecules. Free radicals are generally more reactive than non-radicalsdue to their unpaired electron, but different types of free radicals vary widely intheir reactivity [6, 10-13]. The oxygen molecule (O2) qualifies as a free radicalbecause it contains two unpaired electrons, but is not particularly reactive due toa special electron arrangement that makes the reactions with oxygen spinrestricted [5]. However, when oxygen is partly reduced, several differentreactive oxygen species, both radicals and non-radicals, may be produced [6, 10-13]. Examples of reactive oxygen species are hydroxyl radicals (OH•),superoxide anion radicals (O2
−•) and hydrogen peroxide (H2O2). The hydroxylradical is an extremely reactive free radical. It is very unstable and attacks alarge array of molecules in the nearby environment. Examples of other freeradicals are the two gaseous radicals nitric oxide (NO•) and nitrogen dioxide(NO2
•), the carbon-centred (R•), alkoxyl (RO•) and peroxyl radicals (ROO•)formed during peroxidation of lipids and the trichloromethyl radical (CCl3
•)formed by the metabolism of carbon tetrachloride (CCl4) in the liver.
Radical reactionsRadicals can react with other molecules in several ways [6, 10, 12, 13]. Whentwo free radicals meet, their unpaired electrons can form a shared electron pairin a covalent bond and both radicals are lost. When a radical gives one electronto, takes one electron from or simply adds on to a non-radical, that non-radicalbecomes a radical. Since most molecules present in living organisms are non-radicals, any free radical produced in the body will most likely react with a non-radical and generate a new radical. Hence, free radical reactions in vivo tend toproceed as chain reactions.
The Janus face of free radicalsFree radicals and various reactive oxygen species are continuously produced inthe body [6, 11-13]. They can be formed as a by-product in the mitochondrialrespiratory chain due to leakage of electrons from the electron transport chain orby reactions catalysed by transition metal ions such as iron and copper ions.They may also be derived from external sources such as cigarette smoke,radiation, UV light, pollution and from the metabolism of certain drugs. The freeradicals formed can react with DNA, proteins and lipids in the body and causeextensive oxidative damage [6, 11-13].
Free radicals are not only produced as an unwanted product; they are alsoformed deliberately in the body for useful purposes and have importantphysiological functions [6, 11-13]. A well-defined role for free radicals is whenactivated phagocytic cells (neutrophils, monocytes, macrophages andeosinophils) produce superoxide anion radicals and hydrogen peroxide as onemechanism to kill bacteria and fungi and to inactivate viruses [14]. In addition,

Introduction 9
free radicals are also produced by an array of enzymes e.g. pyruvatemetabolising enzymes, oxidases, carboxylases, hydroxylases, peroxidases, fruitripening enzymes and radical enzymes [3].
Methods for measurementFree radicals and other reactive species are difficult to detect and measure due totheir short lifetime [3, 15, 16]. One of the few techniques that detect freeradicals directly is electron spin resonance with spin trapping, which allows aradical to react with a trap molecule to give a more stable product to monitor[3, 4, 17-19]. Trapping methods have been proven very useful in vitro and inanimal studies, but their usefulness has been limited in human studies [3, 17,18]. An alternative to trapping methods are fingerprinting methods based on themeasurement of products of free radical-damaged DNA, proteins and lipids[3, 4].
Antioxidants
The function of antioxidantsOrganisms have evolved sophisticated antioxidant defence systems and repairsystems for protection against free radicals and free radical damages at differentsites [7, 11-13, 20-23]. There are a number of antioxidants present in the bodyand derived from the diet. Based on their location in the body, they can bedivided into intracellular and extracellular antioxidants [7, 11, 22].
Antioxidants in the body and from the dietSuperoxide dismutase, catalase and glutathione peroxidase are intracellularantioxidant enzymes that convert potential substrates (superoxide anion radicalsand hydrogen peroxide) to less reactive forms in the body [7, 11-13, 20-23].Several extracellular antioxidants such as proteins (transferrin, lactoferrin,albumin, ceruloplasmin) and urate prevent free radical reactions in the body bysequestering transition metal ions by chelation. Albumin, bilirubin and uratemay also scavenge free radicals directly [7, 11].
Antioxidants from dietary sources include lipid soluble vitamins such as vitaminE and carotenoids as well as the water-soluble vitamin C [7, 11-13, 20, 22, 23].Selenium from the diet is important for the functioning of the antioxidantenzyme glutathione peroxidase [7, 12, 13, 22]. The identification and study ofantioxidants from dietary sources is a fast expanding field of research andseveral other important antioxidants have been investigated such as flavonoidsand other plant phenolics, taurine and α-lipoic acid [23].

10 Introduction
Vitamin E inhibits lipid peroxidationVitamin E appears to be one of the most important free radical-scavengingantioxidants within membranes and lipoproteins [12, 21, 24, 25]. It is aneffective chain-breaking antioxidant that protects polyunsaturated lipids fromperoxidation by scavenging peroxyl radicals. When vitamin E acts as a chainbreaker, it donates a hydrogen atom to the free radical, gets oxidised itself andconverted to a radical. The resulting vitamin E radical is suggested to beregenerated to vitamin E by other antioxidants, primarily vitamin C [12, 21].The regeneration of vitamin E by other antioxidants is one part of the intricateco-operation that exists between different antioxidants in the antioxidant defencesystem. α-Tocopherol is the biologically most active form of vitamin E in vivo[26]. In supplementation studies, synthetic forms of vitamin E are often usedsuch as all-rac-α-tocopheryl acetate and all-rac-α-tocopheryl succinate. Richnatural sources of vitamin E are vegetable oils, nuts and whole grain and themain dietary intake derives from table margarines and vegetable oils.
Oxidative stress
DefinitionOxidative stress has been defined as a disturbance in the balance betweenantioxidants and prooxidants (free radicals and other reactive species), withincreased levels of prooxidants leading to potential damage [21, 27-29]. Thisimbalance can be an effect of depletion of endogenous antioxidants, low dietaryintake of antioxidants and/or increased formation of free radicals and otherreactive species.
Free radical damageOxidative damage to DNA, proteins and lipids can ultimately lead to outcomessuch as disorganisation, dysfunction and destruction of membranes, enzymesand proteins [10, 12, 21]. Specifically, peroxidation of membrane lipids maycause impairment of membrane function, decreased fluidity, inactivation ofmembrane-bound receptors and enzymes, increased permeability to ions andpossibly eventually membrane rupture [4, 7]. If the oxidative stress isparticularly severe, it can produce cell death [21, 30]. Death can occur bynecrosis, but in a number of cell types, such as neuronal cells, a mild oxidativestress can trigger the process of apoptosis, activating the intrinsic suicidepathway present within all cells [31, 32].
Free radicals and antioxidants in diseaseFree radical damages can accumulate over time and may thereby contribute tocell injury and development of human diseases. Free radicals have beenimplicated in the development of several diseases including atherosclerosis,diabetes, cancer, chronic inflammatory diseases and neurodegenerative diseases

Introduction 11
as well as in the process of ageing [3, 5, 33-37]. In most cases, free radicals arebelieved to be a component of the pathology of the disease and arise to a majoror minor extent as a consequence of the underlying disease.
The potential role of dietary antioxidants in prevention and treatment of thesediseases, especially atherosclerosis and cancer, have been extensively studiedduring the last two decades [38-45]. Epidemiological data indicate that a highintake of foods rich in antioxidant vitamins (mainly β-carotene, vitamin C andE) or high blood concentrations of antioxidant vitamins are associated with areduced risk for cardiovascular disease and cancer at several sites. Findings fromhuman intervention studies testing the potential of antioxidant supplementationare inconsistent and do not allow firm conclusions. Recommendations onantioxidant intakes for disease prevention must await evidence from furthercontrolled intervention trials, some currently under progress. However, based onthe available data, protection against oxidative damage seems to be best servedby a diet rich in a variety of antioxidants found in fruits and vegetables.Definitive evidence for the association between free radical generation anddevelopment of disease, and evidence for the efficiency of antioxidants indisease prevention have been difficult to obtain partly because of limitations andshortcomings with methods to assess oxidative stress in vivo [4, 42].
Lipid peroxidation
Non-enzymatic lipid peroxidation
Lipid peroxidation – a free radical fingerprinting methodLipid peroxidation is probably the most extensively investigated free radical-induced process [3-9]. One of the earliest descriptions of the different stages oflipid peroxidation was given in the late 1820s by de Saussure, who used asimple mercury manometer to study the uptake of oxygen by a layer of walnutoil on water (reviewed in [3]). Polyunsaturated fatty acids (PUFAs) areparticularly susceptible to peroxidation and once the process is initiated, itproceeds as a free radical-mediated chain reaction involving initiation,propagation and termination [7].
The lipid peroxidation chain reactionInitiation of lipid peroxidation is caused by attack of any species that hassufficient reactivity to abstract a hydrogen atom from a methylene group upon aPUFA [3-9] (Figure 1). Since a hydrogen atom in principle is a free radical witha single unpaired electron, its removal leaves behind an unpaired electron on thecarbon atom to which it was originally attached. The carbon-centred radical is

12 Introduction
Figure 1 Mechanism of non-enzymatic lipid peroxidation (modified from [7]).
PUFA
R•
Carbon-centredradical
R•
Conjugateddiene
ROO•
Peroxylradical O
O
Loss of H• to a free radical
Molecular rearrangement
Uptake of oxygen
Abstraction of a H• from anadjacent fatty acid
OO
H
ROOH
Hydro-peroxide
- H•
+ O2
+ H•

Introduction 13
stabilised by a molecular rearrangement to form a conjugated diene, followed byreaction with oxygen to give a peroxyl radical. Peroxyl radicals are capable ofabstracting a hydrogen atom from another adjacent fatty acid side-chain to forma lipid hydroperoxide, but can also combine with each other or attack membraneproteins. When the peroxyl radical abstracts a hydrogen atom from a fatty acid,the new carbon-centred radical can react with oxygen to form another peroxylradical, and so the propagation of the chain reaction of lipid peroxidation cancontinue. Hence, a single substrate radical may result in conversion of multiplefatty acid side chains into lipid hydroperoxides. The length of the propagationchain before termination depends on several factors e.g. the oxygenconcentration and the amount of chain-breaking antioxidants present.Hydroperoxides are fairly stable molecules, but their decomposition can bestimulated by high temperatures or by exposure to transition metal ions (iron andcopper ions). Decomposition of hydroperoxides generates a complex mixture ofsecondary lipid peroxidation products such as hydrocarbon gases (e.g. ethaneand penthane) and aldehydes (e.g. malondialdehyde (MDA) and4-hydroxynonenal).
The fatty acid structure determines the productAnother complexity of the lipid peroxidation process is that the initialabstraction of a hydrogen atom can occur at different points on the carbon chainof the fatty acid. Thus, peroxidation of arachidonic acid for example gives sixdifferent lipid hydroperoxides as well as cyclic peroxides and other productssuch as isoprostanes [3]. Further, the number of double bonds determines thesusceptibility of a fatty acid to peroxidation [46, 47]. PUFAs are readily attackedby free radicals and become oxidised into lipid hydroperoxides, whereassaturated fatty acids (SAFAs) with no double bonds and monounsaturated fattyacids (MUFAs) with one double bond are more resistant to peroxidation. Anadjacent double bond weakens the energy of attachment of the hydrogen atomspresent on the next carbon atom. Therefore, the greater the number of doublebonds in a fatty acid chain, the easier the removal of a hydrogen atom, that iswhy PUFAs are more susceptible to peroxidation.
Enzymatic lipid peroxidation
Cyclooxygenase and lipoxygenase catalyses lipid peroxidationThe peroxidation of PUFAs can proceed not only through non-enzymatic freeradical-induced pathways, but also through processes that are enzymaticallycatalysed [5, 7]. Enzymatic lipid peroxidation may be referred only to thegeneration of lipid hydroperoxides achieved by insertion of an oxygen moleculeat the active centre of an enzyme [5, 7]. Free radicals are probably importantintermediates in the enzymatically-catalysed reaction, but are localised to the

14 Introduction
active sites of the enzyme. Cyclooxygenase (COX) and lipoxygenase fulfil thedefinition for enzymatic lipid peroxidation when they catalyse the controlledperoxidation of various fatty acid substrates. The hydroperoxides andendoperoxides produced from enzymatic lipid peroxidation becomestereospecific and have important biological functions upon conversion to stableactive compounds. Both enzymes are involved in the formation of eicosanoids,which comprise a large and complex family of biologically active lipids derivedfrom PUFAs with 20 carbon atoms. Prostaglandins are formed by COX-catalysed peroxidation of arachidonic acid [48]. COX exists in at least twoisoforms [49-51]. COX-1 is present in cells under physiological conditions,whereas COX-2 is induced in macrophages, epithelial cells and fibroblasts byseveral inflammatory stimuli leading to release of prostaglandins [49-53].
Methods for measurement of non-enzymatic lipidperoxidation
A variety of methodsSince free radical-induced lipid peroxidation is a complex process and occurs inmultiple stages, there are many techniques available for the detection andmeasurement of lipid peroxidation products. Peroxidation of lipids can beassessed by measurement of the loss of unsaturated fatty acids, generation ofprimary peroxidation products or secondary degradation products [3, 4, 6-9, 54].Table 1 summarises various methods for lipid peroxidation measurements.
The approach to the detection of lipid peroxidation depends on whether thesample is a complex biological sample obtained in vivo, or if the sample is arelatively simple mixture obtained in vitro [8]. For clinical purposes, severalpractical considerations needs to be addressed such as storage of samples. Themost accurate assays of lipid peroxidation are the most chemically sophisticatedones, however, they also require extensive sample preparation and great care hasto be taken during sample handling and preparation to ensure that furtherperoxidation does not occur [4]. Possible confounding of lipid peroxidationproducts ingested from dietary sources needs also to be considered. Further, thechemical composition of the peroxidation products will depend on the fatty acidcomposition of the lipid substrate in question [4]. Consequently, selecting asingle test to monitor peroxidation can give misleading results [3, 6, 8]. Variousmethods can have distinct advantages or disadvantages under differentcircumstances and employing a combination of several techniques is thereforeprobably the best approach to measure non-enzymatic and enzymatic lipidperoxidation.

Introduction 15
Table 1. Methods used to detect and measure non-enzymatic lipidperoxidation (modified from [3, 4, 6]).
What is measured Method
Loss of substrateUnsaturated fatty acids GC / HPLCUptake of oxygen Oxygen electrode
Primary productsTotal lipid hydroperoxides FOX assay-Absorbance 550−600 nm [55, 56]
Iodide oxidation-Absorbance 358 nm [57-62]Glutathione peroxidase [63]Cyclooxygenase [64, 65]
Individual lipid hydroperoxides HPLC-chemiluminescence [66-69]GC-MS / HPLC
Conjugated dienes Absorbance 230−235 nm [70]HPLC-Absorbance 230−235 nm [71, 72]Second derivative spectroscopy [73]
Secondary degradation productsHydrocarbon gases GCTBARS/MDA TBA test-Absorbance 532−535 nm [74, 75]
TBA test-Flourescence [76]TBA test-HPLC-Absorbance 532−535 nm [77-79]TBA test-HPLC-Fluorescence [80, 81]
Aldehydes GC-MS / HPLC / Antibodies / FluorescenceF2-isoprostanes GC-MS [82-85]
Enzyme immunoassay [86, 87]Radioimmunoassay [88]
GC, gas chromatography; HPLC, high pressure/performance liquid chromatography; FOX,ferrous oxidation in xylenol orange; MS, mass spectroscopy; TBARS, thiobarbituric acidreactive substances; MDA, malondialdehyde and TBA, thiobarbituric acid.

16 Introduction
Conjugated dienes and the thiobarbituric acid testTwo of the most commonly used assays are based on the measurement ofthiobarbituric acid reactive substances (TBARSs) or MDA by the thiobarbituricacid (TBA) test and conjugated dienes. The methods have been widely adoptedsince they are rapid and simple to perform, but have also been criticised for theirlack of specificity.
Conjugated diene measurements for isolated lipids or lipoprotein fractionsConjugated diene structures with a double-single-double bond (-C=C-C=C-)arrangement absorb UV light in the wavelength range 230−235 nm and can thusbe detected by UV absorption spectrophotometry [4, 6, 73]. Conjugated dienemeasurements have successfully been used to study peroxidation in isolatedlipoprotein fractions by applying continuous monitoring of conjugated dieneformation during low density lipoprotein (LDL) oxidation to give an estimate ofthe susceptibility of the lipoprotein to oxidation [70, 89-91]. However, itsapplication in body fluids e.g. plasma samples has been associated with seriousconfounding factors [6, 73, 92]. Many other substances than conjugated dienessuch as haem proteins, purines and pyrimidines present in the plasma sampleabsorb light strongly at UV [3].
Greater sensitivity of this method can be achieved by extraction of the lipids intoorganic solvents, by combining HPLC with UV absorption or by applyingsecond-derivative spectroscopy [3, 71, 73]. However, when using HPLCseparation, most of the UV response in human serum was reported to consist ofa non-oxygen-containing conjugated isomer of linoleic acid, 9-cis,11-trans-octadecadienoic acid [72, 93]. Dairy products and meat from ruminants are themajor dietary sources of this conjugated linoleic acid isomer [94]. In humanserum and tissues it appears to be derived mainly from the diet [95, 96], but hasalso been shown to be produced by endogenous conversion of dietary trans fattyacids [97] as well as by bacterial metabolism in the human cervix [98] and bybacterial lung pathogens in vitro [99]. The free radical-induced production ofthis isomer is controversial and Thompson and Smith showed that the9-cis,11-trans-octadecadienoic acid was not found in the plasma of animalssubjected to oxidative stress [100]. Consequently it follows that application ofthe conjugated diene method in animal or human body fluids and tissues hasbeen questioned and needs careful consideration [6, 95, 98], but the method isstill useful for isolated lipid or lipoprotein fractions such as LDL.
The TBA test for TBARS and MDA measurementsThe TBA test is performed to measure the amount of MDA present in thesample. MDA is generated as a degradation product from peroxidised lipids[101] and as a side product of enzymatic metabolism of thromboxanes and

Introduction 17
prostaglandins [102, 103]. It has been shown to be formed from PUFAscontaining at least two double bonds [101], but has been proposed to be derivedmainly from fatty acids with three or more double bonds [104, 105]. The basisof the TBA methods is the reaction of MDA with TBA at low pH and hightemperature to form a coloured complex, the MDA-TBA complex, with anabsorption maximum at 532−535 nm that can be measured by visible absorptionspectrophotometry [74, 75]. The test works well in defined membrane systems(e.g. microsomes and liposomes), but its application to body fluids has produceda host of problems.
A major disadvantage of the TBA test is that it is non-specific and measuresmany parameters in addition to lipid peroxidation [79, 101, 105-108]. Asubstantial amount of the MDA detected may be generated from decompositionof lipid hydroperoxides during the acid heating stage of the TBA assay as anartefact [106, 109]. The amount of MDA formed is dependent on the lipidcontent of the sample, the amount of metal ion contamination in the reagents andantioxidants present in the sample. Addition of antioxidants such as butylatedhydroxytoluene (BHT) or EDTA to the sample before analysis is an approach tosuppress peroxidation during the test itself. Further, several other compounds(e.g. other aldehydes, carbohydrates, amino acids and bile pigments) react withTBA to form complexes that have absorption spectra overlapping that of theMDA-TBA complex [106, 110-112]. The specificity of the TBA assay isimproved by detecting the MDA-TBA complex with fluorescencespectrophotometry at 553 nm [76]. Another means to achieve improvedspecificity is to separate the MDA-TBA complex by HPLC from othercomponents absorbing at the same wavelength prior to the detection [77-79,113]. A further approach that has successfully increased specificity is tocombine HPLC separation with fluorescence detection [80, 81, 114]. UsingHPLC-based methods adapted to avoid many of the artefacts mentioned, theTBA test is still a useful ‘screening’ method to use for examination of lipidperoxidation in large number of biological samples and for detection ofperoxidation in defined systems in vitro [6].
Lipid hydroperoxides
Total or individual classes of lipid hydroperoxidesSeveral methods have been developed to measure lipid hydroperoxides inbiological samples [3, 4, 8, 115]. They can be divided into two categoriesdetecting either total or individual classes of lipid hydroperoxides and aregenerally dependent on the ability of hydroperoxides to oxidise other molecules.Total hydroperoxides are assayed using colorimetric, enzymatic orchemiluminescence (CL) techniques, while individual hydroperoxide classes are
18 Introduction
measured by HPLC-linked microperoxidase-catalysed isoluminolchemiluminescence techniques. A problem regarding hydroperoxidemeasurements is the wide range of reported levels when using these differentmethods. The amount of hydroperoxides present at a given time will depend notonly on the rate of initiation of peroxidation, but also on how quickly peroxidesare decomposed to give other products [3, 8, 115]. Critical characteristics of allthese assays are: (a) the influence of interfering factors, (b) the sensitivity of themethod and (c) the efficiency of the oxidation process by differenthydroperoxides [116].
HPLC-chemiluminescence based assaysDeterminations of individual classes of lipid hydroperoxides bychemiluminescence are often based on microperoxidase conversion ofhydroperoxides to alkoxyl radicals that reacts with isoluminol to produce lightemission [66-68, 117-119]. Samples are extracted and then separated withHPLC prior to the microperoxidase catalysed reaction. Using this assay, thepresence of cholesteryl ester hydroperoxides and phospholipid hydroperoxidescan be detected. Reported plasma levels of phospholipid hydroperoxides rangebetween 10 and 500 nmol/L [66-68] and cholesteryl ester hydroperoxides rangebetween 3 nmol/L [66, 117] and 920 nmol/L [92, 120]. Anotherchemiluminescence based method for detection of total lipid hydroperoxides isthe recently developed sophisticated ‘single photon counting’chemiluminescence method [69, 121]. The sample is added to a mixturecontaining luminol and the photon emission is recorded. It has been applied tohuman plasma and lipoprotein fractions and native plasma has been reported tocontain 1.5 to 5.5 µmol/L of total lipid hydroperoxides [69, 121].
The ferrous oxidation in xylenol orange assayTotal hydroperoxides may also be determined using the ferrous oxidation inxylenol orange (FOX) assay, which can be used for hydroperoxides present inthe aqueous (FOX1) and in the lipid (FOX2) phases [55, 56, 122]. The FOXmethod is based on the oxidation of ferrous (II) to ferric (III) ions byhydroperoxides under acidic conditions (1). Ferric ions are detected by UVabsorbance at 560 nm after reaction with the ferric ion indicator, xylenol orange(XO), generating a blue-purple complex with an absorbance maximum at550−600 nm (2).
(1) Fe2+ + hydroperoxides → Fe3+ alkoxyl radical + OH−
(2) Fe3+ XO → blue-purple complex (560 nm)
In the FOX2 assay, the signal is authenticated using TPP, which specificallyreduces lipid hydroperoxides. This procedure generates a proper control and ameans to assess lipid hydroperoxides without interference from non-lipid

Introduction 19
hydroperoxides [123]. Another advantage of this method is that no extractionstep is necessary [56]. Possible lipid peroxidation chain reactions due to thealkoxyl radicals generated in the ferrous oxidation step (1) are prevented byaddition of BHT to the FOX reagent. The assay is not influenced by diurnalvariations or fasting [123]. Vitamin C, E and urate do not interfere with the FOXassay under physiological concentrations; however, a high concentration ofvitamin C gives rise to a high background signal [122]. Samples collected inEDTA or DETAPAC (anticoagulants and metal-chelating agents) or plasmasamples with hemolysis can not be used since they interfere with the assay[122]. The FOX2 assay in conjugation with the selective hydroperoxide TPP hasbeen used to determine whole plasma lipid hydroperoxides in healthy volunteersand the concentrations range between 0.2 and 10.3 µmol/L [56, 123-126].Hydroperoxide levels have also been shown to be elevated in patients withdiabetes mellitus [123-126], after dialysis [127, 128] and after ischemia-reperfusion injury [129, 130].
The iodometric methodAnother colorimetric method for total hydroperoxide quantification, theiodometric method, is based on the ability of lipid hydroperoxides to oxidiseiodide (I−) to iodine (I2) [62]. Iodine can then be quantified by several methods.Continuous monitoring of UV absorption at or near 358 nm of the triiodide ion(I3
−) chromophore formed from iodine in the presence of excess of iodide isoften used [57, 59, 60]. Iodine can also be measured by UV absorbance at365 nm after incubation with a commercially available colour reagent [58]. Theiodine liberation method is one of the oldest and has been widely used in thefood industry for bulk lipids [3]. It can be applied to extracts of biologicalsamples provided that other oxidising agents are absent. Potential interferingfactors are oxygen, coloured materials absorbing at the same wavelength, lipidsand proteins that add iodine directly and hydrogen peroxide and proteinperoxides that oxidises iodide [3, 60, 62]. The method is extremely oxygensensitive, which can be prevented by removing oxygen from reagent solutions,by using anaerobic cuvettes and by adding cadmium ions to complex unreactediodide [62]. Reported levels of lipid hydroperoxides determined with thismethod in human plasma range from 2.1 to 45.7 µmol/L [60, 61].
Glutathione peroxidase and cyclooxygenase assaysGlutathione peroxidase and COX are two enzymes used for enzymatic detectionof total hydroperoxides. Glutathione peroxidase catalyses the oxidation ofreduced glutathione to oxidised glutathione by hydroperoxides [3, 4, 63].Oxidised glutathione can be determined directly by HPLC [63] or indirectly byconsumption of NADPH. Fatty acid hydroperoxides within membrane or LDLlipids can not be measured unless phospholipases are first used [3, 63]. Levels ofhydroperoxides in plasma have been reported to be approximately 1 µmol/L

20 Introduction
[63]. Stimulation of the activity of COX by hydroperoxides can be used tomeasure trace amounts of total hydroperoxides in body fluids [3, 4, 64, 65]. Theassay relates the presence of hydroperoxides to one of their potential biologicalactions, i.e. stimulation of eicosanoid synthesis. Reported plasma levels areabout 0.5 µmol/L [64].
F2-isoprostanes
F2-isoprostanes − a promising indicator of lipid peroxidation in vivoThe discovery of the isoprostanes as products of lipid peroxidation has been amajor advance in the ability to assess lipid peroxidation in vivo [3, 8, 9, 131-133]. The notion that prostaglandin-like compounds could be generated non-enzymatically by peroxidation of fatty acids was first demonstrated in vitro over20 years ago. It was not until in the early 1990s that a group of prostaglandinF2-like compounds, F2-isoprostanes, was reported to be formed in human plasmaby free radical-catalysed peroxidation of arachidonic acid [82].
Formation of F2-isoprostanesF2-isoprostanes are initially formed in situ from esterified arachidonic acid inphospholipids and are then released in the free form into the circulation,presumably by phospholipases [134]. The free form represents only one pool ofF2-isoprostanes formed in vivo and the total generation of F2-isoprostanes can bequantified after alkaline hydrolysis by measurement of the sum of free andesterified F2-isoprostanes. By quantification of total amounts of F2-isoprostanesin tissues it may be possible to investigate the location of oxidative injury indifferent diseases and to determine if some tissues are more prone to oxidationthan others under certain pathological conditions [132]. F2-isoprostanes arerapidly metabolised and excreted in the urine [135, 136]. UrinaryF2-isoprostanes or urinary metabolites of F2-isoprostanes are of particularinterest as indicators of oxidative injury because they offer a non-invasiveparameter that reflects the production of F2-isoprostanes over a period of time[132]. However, unmetabolised F2-isoprostanes in urine may be confounded bya contribution of local F2-isoprostane production in the kidney [133, 137]. Otherforms of isoprostanes can also be formed in the body and may be interesting todetect, for example F3-isoprostanes from eicosapentaenoic acid [138],F4-isoprostanes from docosahexaenoic acid [139], D2/E2-isoprostanes [140] andneuroprostanes [141].
8-Iso-prostaglandin F2α − a major F2-isoprostaneSeveral different isomers of F2-isoprostanes are formed (in total about 64) [3, 8,9, 131-133]. 8-Iso-prostaglandin F2α (8-iso-PGF2α) is one of the majorF2-isoprostanes formed in vivo [142, 143] and exhibits potent biological activity

Introduction 21
e.g. as a vasoconstrictor in both the kidney and lung in rats and rabbits [82, 144-146]. In platelets and monocytes in vitro, 8-iso-PGF2α has also been observed tobe a minor product of COX-dependent formation [84, 147]. However, later itwas concluded that this COX-dependent formation does not seem to contributesignificantly to urinary levels of 8-iso-PGF2α [148]. Further, levels of8-iso-PGF2α in normal human plasma and urine exceed the levels of COX-derived prostaglandins and thromboxanes by an order of magnitude [133, 137].Levels of 8-iso-PGF2α in human plasma and urine have also been shown to beunaffected by treatment with high doses of the COX inhibitors [82].
Detection of 8-iso-prostaglandin F2αSensitive gas chromatography-mass spectrometry (GC-MS) assays have beendescribed to measure 8-iso-PGF2α [82-85, 149] as well as enzymeimmunoassays (EIAs) and radioimmunoassays (RIAs) [86-88]. The originalmethod used for 8-iso-PGF2α measurements described by Morrow et al [82, 149]is based on GC-MC with negative ion chemical ionisation. Variousmodifications of this method have been developed [83-85]. The GC-MSmethods are highly sensitive and accurate, but also expensive and timeconsuming. Several immunoassays have therefore recently been developedincluding a commercially available EIA [86, 87] and a specific and sensitiveRIA [88]. A common problem is that related compounds may interfere inbinding to the antibody. The antibodies used have been tested for cross-reactivity with other major eicosanoids and isoprostanes, and the degree ofcross-reactivity has been shown to be low [88]. To be fully evaluated, however,the accuracy and reliability of these immunoassays needs to be further validatedagainst the GC-MS methods [132].
Levels of 8-iso-prostaglandin F2α in vivo8-Iso-PGF2α has been suggested as a potential biomarker of non-enzymatic lipidperoxidation and oxidative injury because it can be specifically and accuratelymeasured in normal biological samples, and the levels are increased underconditions of oxidative stress and modulated by antioxidants [133, 150].Detectable levels of 8-iso-PGF2α have been obtained in different body fluidsincluding blood, urine, bile, pericardial fluid, lung condensates andcerebrospinal fluid as well as in different tissues [133]. Urinary 8-iso-PGF2αexcretion is not confounded by diurnal variation [151] or the lipid content of thediet, i.e. by 8-iso-PGF2α from dietary sources [152, 153]. The levels of8-iso-PGF2α are increased in LDL by in vitro oxidative modification [154, 155].In animals, the levels of 8-iso-PGF2α are increased in models of oxidative stress[134, 156-165], increased with antioxidant deficiency [157, 166, 167] andreduced by dietary antioxidant supplementation [167-172]. Further, elevatedlevels of 8-iso-PGF2α in human body fluids have also been observed in severalconditions that are proposed to be associated with free radical induced oxidative

22 Introduction
injury in humans such as smoking [173, 174], diabetes mellitus [175, 176],vascular reperfusion [177, 178], hypercholesterolemia [179], atheroscleroticlesions [180, 181] and liver cirrhosis[182].
Methods for measurement of enzymatic lipid peroxidation
Enzymatically derived lipid peroxidation is measured by analyses ofeicosanoids, products of COX and lipoxygenase catalysed lipid peroxidation.Eicosanoids analyses are mainly performed by RIA, but may also be performedby bioassays or GC-MS based methods [183].
Prostaglandin F2αααα metabolitesEnzymatic oxidation of arachidonic acid via the COX pathway leads to theformation of prostaglandins [48]. A major metabolite of the primaryprostaglandin F2α, 15-keto-13,14-dihydro-prostaglandin F2α (15-K-DH-PGF2α),can be used as an indicator of inflammation and enzymatic lipid peroxidation viathe COX pathway [184]. In animal models of hepatotoxicity, endotoxaemia andreperfusion injury, 15-K-DH-PGF2α has been shown to be increased [161-165,184], as well as after supplementation with conjugated linoleic acid in humans[185]. The primary PGF2α increases also during physiological control ofluteolysis and parturition in various species [186, 187].
Carbon tetrachloride induced lipid peroxidation
Carbon tetrachloride was the first toxin from which it was shown that the injuryit produces was largely or entirely mediated by free radicals [3, 188, 189]. Lipidperoxidation induced by CCl4 is a commonly used experimental animal modelfor studying oxidative injury in biological systems [190, 191]. CytochromeP-450 enzymes are believed to metabolise CCl4 to trichloromethyl radicals thatcan initiate peroxidation of unsaturated fatty acids and start chain reactions oflipid peroxidation. The lipid-solubility of CCl4 allows it to cross membranes andto be distributed to all organs. However, the liver is the major target organ ofCCl4-induced toxicity owing to its high content of cytochrome P-450 enzymes.Several antioxidants are recognised to scavenge free radicals and may thereforeprevent propagation of the CCl4-induced lipid peroxidation process. Vitamin Eis a well-characterised chain-breaking antioxidant with the particular function ofpreventing lipid peroxidation in membrane systems [24, 25].

Introduction 23
The CCl4 model has been used to study responses in the levels ofF2-isoprostanes. Administration of CCl4 to rats increases levels of 8-iso-PGF2αin plasma, urine, bile and tissues [82, 156, 162, 192]. Elevated levels of8-iso-PGF2α in plasma increases even further in rats pre-treated withglutathione-depleting agents before CCl4 administration [156]. Dietary vitaminE supplementation has been shown to suppress levels of 8-iso-PGF2α in variousrat models other than CCl4 [167-172]. Whether vitamin E may also suppresselevated levels of 8-iso-PGF2α after CCl4 administration remains to beestablished.
Lipid peroxidation, atherosclerosis and dietary fat quality
Coronary heart disease (CHD) and other atherosclerotic diseases are the majorcause of death in the Western world today. Elevated serum levels of totalcholesterol, LDL cholesterol and an elevated ratio of LDL/HDL are establishedrisk factors for CHD [193-195]. There is considerable evidence that oxidisedlipoproteins play an important role in the development of atherosclerosis[196, 197]. The ‘oxidised LDL hypothesis’ suggests that oxidation of LDL byfree radicals and other reactive species leads to modification of lysine residueson apo B [198-200]. The modified LDL particles are not recognised by theendogenous LDL receptor and bind to scavenger receptors on macrophages. Thelack of down-regulation of the scavenger receptors allows continued uptake ofLDL by the macrophages, which then develop into foam cells and fatty streaks.Atherosclerotic lesions are classified as fatty streaks, fibrous plaques andcomplex lesions, and the development of fatty streaks is an early key event inthe initiation of the atherosclerotic lesion. Oxidatively modified LDL has anumber of additional potential characteristics that may also contribute to itsproatherogenic properties [197, 201]. The amounts of PUFAs and vitamin E inthe LDL particle are important factors that may influence the propensity foroxidation of LDL.
It is well established that a high dietary intake of SAFAs is associated with highlevels of total serum cholesterol and with an increased risk to develop CHD[202, 203]. On the contrary, epidemiological studies investigating the effects ofdietary MUFA and PUFA on the outcome of CHD have been less conclusive[203]. Several intervention studies have demonstrated that the lipoprotein profilecould be improved by substituting MUFA and PUFA for SAFA [204-207].However, intervention studies with PUFA-rich diets have also shown that thesusceptibility of lipoproteins to oxidation was increased and that very highintakes of PUFAs may carry non-favourable effects on the development ofatherosclerosis [208, 209]. The oxidisability of fatty acids is considered to be

24 Introduction
dependent on the degree of unsaturation [46, 47]. Therefore, dietaryrecommendations regarding fat intake and quality include a maximum level ofthe PUFA intake. Recent Nordic nutrition recommendations recommend a dietwith a fat content that should not exceed 30 energy per cent (E%), an intake ofSAFA of less than 10 E%, a PUFA intake of between 5-10 E% and the rest fromMUFA [210].
There has been a pronounced change in the type of edible fats used in manycountries, e.g. in northern Europe and Canada, with an increased consumption oflow erucic acid rapeseed oil-based fats [211]. This development may lead to anincreased dietary intake of MUFAs and PUFAs, especially α-linolenic acid(18:3 n-3). Several intervention studies with rapeseed oil-rich diets have shownfavourable effects on the blood lipid profile in healthy volunteers [204-207] andin hyperlipidemic patients [212-214], with reduced serum levels of total andLDL cholesterol and unchanged serum levels of triglycerides and HDLcholesterol. However, the same rapeseed oil-rich diet may also potentiallyincrease the degree of lipid peroxidation in the body, since rapeseed oil containsa considerable amount of easily oxidised PUFAs. However, rapeseed oil is alsorich in both α- and γ-tocopherol, and it is not yet established how a rapeseed oil-based diet might influence the balance between lipid peroxidation andantioxidants present for protection in vivo.

25
AIMS OF THE INVESTIGATIONS
The overall aim of this thesis was to evaluate some methods for measurement oflipid peroxidation in the body that are suitable for clinical investigations, and toapply these methods in animal and human studies investigating basal conditionsand situations associated with increased lipid peroxidation. The specific aimswere:
� to evaluate the effect of sample handling and storage conditions on thelevels of total lipid hydroperoxides in human plasma measured with theferrous oxidation in xylenol orange version 2 assay (paper I)
� to further develop a methodology for quantification of F2-isoprostanes intissues using alkaline hydrolysis of esterified F2-isoprostanes and anexisting radioimmunoassay for measurement of 8-iso-PGF2α, and to applythis methodology in a well known experimental model of carbontetrachloride-induced lipid peroxidation in rats (paper II)
� to investigate the effects of supplementation with the antioxidant vitamin Eon the basal levels of biomarkers of non-enzymatic and enzymatic lipidperoxidation in rats (paper III)
� to investigate the effects of supplementation with vitamin E on biomarkersof lipid peroxidation in an experimental model of carbon tetrachloride-induced lipid peroxidation in rats (paper IV)
� to compare the effects of a rapeseed oil-based diet with an increasedproportion of easily oxidised PUFAs with a control diet rich in SAFA onthe levels of biomarkers of in vivo lipid peroxidation in humans (paper V)

26
MATERIALS AND METHODS
Subjects and animals
Paper I: Thirty-two subjects (12 women, 20 men) were recruited from staff andfrom patients attending the metabolic unit at the Department of Geriatrics,Uppsala University Hospital, Sweden. Mean age was 52 ± 8 years (range 40-72years). The group of subjects consisted of healthy persons, patients with type 2diabetes mellitus and patients with other metabolic disorders (n = 12, 10, 10,respectively).
Paper II, Paper III and Paper IV: Male Sprague-Dawley rats were purchasedfrom B & K Universal, Sollentuna, Sweden. In paper II control rats (n = 4) andrats treated with CCl4 for different periods of time (n = 16, four time points withfour rats in each group) were used. Two groups with control (n = 6) and vitaminE-supplemented rats (n = 8) were used in paper III. In paper IV, two additionalgroups with CCl4-treated (n = 6) and vitamin E-supplemented CCl4-treated rats(n = 8) were combined with the control rats in paper III to minimise the animalsused. The rats had free access to water and food. They were subjected to a12 h light/12 h dark schedule.
Paper V: Nineteen healthy subjects (6 women, 13 men) with mean age 50 ± 8years and normal to moderately increased body weight and blood lipids wererecruited from local companies by means of poster advertisement. Eligible forthe study were men (30 to 65 years of age) and postmenopausal women(50 to 65 years of age) with serum cholesterol 5.4 to 8.0 mmol/L, serumtriglycerides 1.3 to 5.0 mmol/L, fasting blood glucose 3.0 to 6.5 mmol/L,diastolic blood pressure < 95 mmHg and body mass index (BMI) <30 kg/m2. Allsubjects were asked to abstain from dietary vitamin- and mineral supplementsand acetyl salicylic acid during the diet periods and to maintain their habituallife style during the study.
Experiments and interventions
Paper I: Blood samples were collected from a mixed group of healthyvolunteers and patients with metabolic disorders to obtain a wide range ofdetectable levels of plasma hydroperoxides.

Materials and methods 27
Paper II and IV: CCl4 was used to induce free radical-induced lipidperoxidation. Rats were gavaged with CCl4 (2.5 mL/kg body weight) and blood,urine and liver samples were collected at different time intervals after CCl4administration. In paper II, liver tissues were collected at 0, 1, 2, 4, 6 hours,whereas blood and urine samples were collected at 4 hours in paper IV.
Paper III and IV: All rats received powdered food prepared from commercialfood pellets (R36, Lactamin AB, Stockholm, Sweden) containing total lipids4%, protein 18.5%, carbohydrates 55.7% and fibre 3.5% and vitamin E at 63mg/kg for a period of three weeks. For vitamin E supplementation, all-rac-α-tocopheryl succinate (Merck, Darmstadt, Germany) was blended into thepowdered food at a concentration of 20 g/kg diet resulting in a calculated dailyintake of approximately 2 g/kg body weight.
Paper V: The study was designed to compare a rapeseed oil-based diet (RO)with an increased proportion of MUFAs and PUFAs, especially α-linolenic acid,and a control diet (SAT) with a high proportion of SAFAs. It was conductedwith a randomised cross-over design including two consecutive four-week dietperiods separated by a four-week washout period (Figure 2). Subjects wererandomised to start with either of the two diets and were blinded to the type ofdiet they were following.
Figure 2. Cross-over design of the study.
The test diets were planned to contain 37 E% fat, 12 E% protein and 50 E% ofcarbohydrates. The composition of the RO diet was composed according todietary recommendations [210], but with a fat content corresponding to theaverage intake of a Swedish population [215]. The control diet containedsaturated fat products instead of rapeseed oil-based fat products. The fat qualityof the two test diets (RO and SAT) was controlled by supplying fat products and
RO RO
SAT SAT
n=9
n=10
0 4 8 12Weeks

28 Materials and methods
food items based on the fats tested in combination with dietary advice to avoidfats from other dietary sources such as fatty dairy and meat products. Thesubjects met a nutritionist before and during the diet periods for dietary adviceand instructions on preparation of their diets to assure good adherence to thediet. Ten different lunch meals (five/week), wholemeal bread (three/day) andmuffins (one/day) prepared with the fats tested were supplied weekly, as well asfree amounts of cooking fat, table margarine (80% fat) and oil to use forcooking, spread and dressings. Double portions including the daily supply offood items and an approximated daily intake of supplied fat products wereprepared. Two energy levels, 9 MJ and 12 MJ, were prepared and the energyrequirement for each subject was approximated as 146 kJ/kg body weight. Thebody weight of the subjects was checked once a week to avoid weight changesand the energy level was adjusted together with dietary advice when needed.Dietary intake was monitored using three-day weighed food records(two weekdays and one weekend day) at five occasions, one at baseline and twoduring each diet period. The dietary food records were analysed by using thesoftware program Stor MATs 4.0 (Rudans Lättdata, Västerås, Sweden) based ona food data base from the Swedish National Food Administration (PC-Kost1996, SLV, Uppsala, Sweden). The compliance to the test diets was alsocontrolled by analyses of the fatty acid compositions in serum phospholipids andcholesterol esters before and after the diet periods.
Blood, urine and tissue sampling
Paper I and V: Venous blood samples were drawn in the morning after anovernight fast. No smoking or heavy physical activity was allowed in themorning before sample collection. The blood samples were immediately placedon ice. In paper I, the blood samples were collected into heparinised tubes. Tohalf of the plasma samples collected, BHT in methanol was added to a finalconcentration of 20 µmol/L. Fresh plasma samples were analysed within1 to 8 hours after sample collection and samples that were stored frozen wereanalysed after 6 and 60 weeks. In paper V, blood samples were collected intoserum tubes and heparin and dipotassium EDTA containing tubes. Heparinplasma was used for the analyses if nothing else is stated. Urinary samples werecollected during 24 hours and three consecutive days in a special aliquot cup(Daisho Co. Ltd., Osaka, Japan). Serum, plasma and urine samples were storedat –70°C within 1 hour after sample collection until analysis.
Paper II, III and IV: The rats were weighed and surgical anaesthesia wasinduced with ether. During laparotomy, liver tissue was collected and the ratswere killed by heart puncture. In paper III and IV, urine samples were collectedin petri dishes before the rats were weighed and blood samples were drawn from

Materials and methods 29
the abdominal aorta during ether anaesthesia. Blood samples were collected inheparinised glass tubes and plasma was prepared by centrifugation at 1930 × gfor 8 min. All samples were immediately stored at -20°C during the experimentand thereafter at -70°C until analysis.
Measurement of clinical characteristics
Paper I and V: Body weight was measured on a digital scale with an accuracy of0.1 kg and height was measured to the nearest cm. The BMI was calculated asthe ratio of body weight (kg) to height squared (m2). The fatty acid compositionin serum phospholipids, serum cholesterol esters and the supplied food itemswere determined by gas liquid chromatography as described earlier by Boberget al [216]. Very low-density lipoproteins, LDL, high-density lipoproteins(HDL) were isolated by a combination of preparative ultracentrifugation [217]and precipitation with a sodium phosphotungstate and magnesium chloridesolution [218]. Cholesterol and triglyceride concentrations in serum and theisolated lipoprotein fractions were measured by enzymatic methods using theIL Test Cholesterol Triander’s method 181618-10 and the IL Test TriglycerideEnzymatic-Colorimetric method 181610-60 in a Monarch 2000 centrifugalanalyser (Instrumentation Laboratories, Lexington, MA, USA). Theconcentrations of serum apolipoprotein (apo) A-1 and apo B were determined byimmunoturbidimetry (Orion Diagnostica, Espoo, Finland) in a Monarchapparatus. Lipoprotein (a) [Lp (a)] was measured by a Pharmacia apo (a) RIA(Pharmacia, Uppsala, Sweden). One unit/L of apo (a) corresponds to 0.7 mg/LLp (a). Serum free fatty acids (FFA) were analysed with an enzymaticcolorimetric method using a commercial kit (994-75409, Wako Chemical,Neuss, Germany) modified for use in a Monarch apparatus. Plasma glucoseconcentrations were measured in a Beckman Glucose analyser 2 (BeckmanInstruments, Fullerton, CA, USA). Plasma insulin concentrations weredetermined by an enzyme-linked immunosorbent assay performed in an ES 300automatic analyser (Boehringer Mannheim, Germany).
Hydrolysis and extraction of liver tissue
Paper II, III and IV: Liver samples were weighed, diluted with 3 volumes ofphosphate buffer and homogenised under cold conditions. The homogenate wascentrifuged at 1680 × g and 4°C for 10 min and the supernatant was stored at−70°C until further preparation within 1 week. The homogenate was firstsubjected to base hydrolysis by incubation with 3 volumes of 3 mol/L KOH at37°C for 60 min, before acidification to pH 3-4 with 2 mol/L HCl and extraction
30 Materials and methods
with 3 volumes of ethyl acetate. Extracted fractions were centrifuged at 1680 × gand 4°C for 10 min and the supernatant was evaporated under nitrogen. Sampleswere finally rediluted in less than 5% ethanol (total volume concentration) andphosphate buffer and stored at −70°C until analysis within 2 to 8 weeks.Hydrolysed and ethyl acetate extracted samples were used for quantification ofthe total amount of 8-iso-PGF2α (sum of free and esterified 8-iso-PGF2α),whereas levels of free (unesterified) 8-iso-PGF2α were measured after ethylacetate extraction only.
Measurement of hydroperoxides
Total plasma hydroperoxide concentrations were measured using the FOX2assay essentially as described by Nourooz-Zadeh et al [56] with minormodifications. The FOX2 reagent was prepared by dissolving 38 mg of XO and440 mg of BHT in 450 mL HPLC-grade methanol with stirring. Ammoniumferrous sulphate (49 mg) was quickly dissolved in 50 mL of 250 mmol/Lsulphuric acid and was added to the methanol solution. The final FOX2 reagentcomprised of 100 µmol/L XO, 4 mmol/L BHT, 25 mmol/L sulphuric acid and250 µmol/L ammonium ferrous sulphate in methanol (90 %, v/v). The extinctioncoefficient of the FOX2 reagent at 560 nm used was 3.86 × 10⁴ M−1cm−1. It wasroutinely checked in hydrogen peroxide solutions of known concentrations andextinction coefficients lower than 3.72 × 10⁴ M−1cm−1 were not accepted. Foreach plasma sample, 900 µL aliquots (quadruplicates) of plasma were incubated(30 minutes, 20-25°C) in 10 µL triphenylphosphine (10mmol/L) to removehydroperoxides and to generate a blank, and 900 µL aliquots (quadruplicates) ofplasma were incubated in 10 µL methanol to generate a test sample. Anotherincubation (30 minutes, 20-25°C) with the FOX2 reagent was performed. Aftercentrifugation at 2400 × g for 10 min with a swing-out rotor (HettichRotenta/RP centrifuge, Hettich-Zentrifugen, Tuttlingen, Germany), theabsorbance of the supernatants was determined at 560 nm in an Ultraspec 2000spectrophotometer (Amersham Pharmacia Biotech, Uppsala, Sweden). Thehydroperoxide concentration of each sample was calculated from the differenceof the absorbance of the blank and test samples.
Measurement of F2-isoprostanes
RadioimmunoassayPlasma, urine and liver samples were analysed for free and total (sum of freeand esterified) 8-iso-PGF2α using a newly developed RIA [88]. In brief, an

Materials and methods 31
antibody was raised in rabbits by immunisation with 8-iso-PGF2α coupled tobovine serum albumin at the carboxylic acid by the 1,1´-carbonyldiimmidazolemethod. The cross-reactivity of the antibody with 8-iso-15-keto-13,14-dihydro-PGF2α, 8-iso-PGF2β, PGF2α, 15-keto-PGF2α, 15-K-DH-PGF2α, TXB2,11β-PGF2α, 9β-PGF2α and 8-iso-PGF3α was 1.7, 9.8, 1.1, 0.01, 0.01, 0.1, 0.03,1.8 and 0.6%, respectively. The detection limit of the assay was about23 pmol/L. Unextracted plasma and urine samples were used in the assay formeasurement of free 8-iso-PGF2α concentrations. Urinary levels of free8-iso-PGF2α were adjusted for creatinine concentrations measured by acolorimetric assay using a IL test creatinine kit (181672-00) in a Monarch 2000centrifugal analyser (Instrumentation Laboratories, Lexington, MA, USA).Hydrolysed and extracted liver tissue preparations (as described above) wereused in the assay for quantification of free and total amounts of liver8-iso-PGF2α. In paper II, the levels were adjusted for protein content determinedby a colorimetric assay using a Bio-Rad Protein Kit (500-0002, Bio-RadLaboratories, Hercules, CA, USA).
Gas chromatography-mass spectrometry based methodPlasma samples were also analysed for total 8-iso-PGF2α using a solid-phaseextraction procedure and GC-MS as described by Nourooz-Zadeh et al [83].Briefly, the samples were incubated with 0.5 ml of aqueous KOH (1 mol/L) torelease esterified F2-isoprostanes by hydrolysis, pH of the sample was re-adjusted to pH 2 by adding 0.5 ml of HCl (1 mol/L) and PGF2α-d4 was added asthe internal standard. F2-isoprostanes were then isolated by solid-phaseextraction on a C18 cartridge and a NH4 cartridge. F2-isoprostanes aspentafluorobenzyl ester/trimethyl ether derivates were analysed by GC on aHewlett-Packard 5890 GC (Bracknell, UK) linked to a VG70SEQ MS (FisonsInstruments, Manchester, UK) using electron capture negative ion chemicalionisation (NICI) with ammonia reagent gas. Quantitative analysis was carriedout by selective ion monitoring (SIM) of the carboxylate anion [M−181]- atm/z 569 and 573 for the F2-isoprostanes and PGF2α-d4 (internal standard),respectively.
Measurement of prostaglandin F2αααα metabolites
Plasma and urine samples were analysed for a prostaglandin F2α metabolite,15-K-DH-PGF2α, using a newly developed RIA [184]. Briefly, an antibody wasraised in rabbits by immunisation with 15-K-DH-PGF2α coupled to bovineserum albumin at the carboxylic acid by the 1,1´-carbonyldiimmidazole method.The cross-reactivity of the antibody with PGF2α, 15-keto-PGF2α, PGE2,

32 Materials and methods
15-keto-13,14-dihydro-PGE2, 8-iso-15-keto-13,14-dihydro-PGF2α, 11β-PGF2α,9β-PGF2α, TXB2 and 8-iso-PGF3α was 0.02, 0.43, <0.001, 0.5, 1.7, <0.001,<0.001, <0.001 and 0.01%, respectively. The detection limit of the assay wasabout 45 pmol/L. Unextracted plasma and urine samples of were used in theassay. Levels of 15-K-DH-PGF2α in urine were adjusted for creatinineconcentration determined as described above.
Measurement of malondialdehyde
MDA levels in plasma samples were measured using HPLC with fluorescencedetection as described by Öhrvall et al [114] based on the methods of Wong et al[78] and Young and Trimble [80]. A TBA reaction was initiated by mixing 200µL of dipotassium EDTA plasma with 750 µL of phosphoric acid (0.15 mol/L),300 µL of water and 250 µL of TBA (42 mmol/L). The reaction mixture wasincubated in a boiling water bath for 60 min, cooled on ice and then neutralisedand precipitated by mixing 500 µl of the sample with 500 µl of a NaOH(1mol/L)-methanol solution (1:10, v/v). The MDA-TBA complex was separatedby injecting 20 µL of the sample on a HPLC column (Lichrospher 100 RP-18,250 x 4 mm). The mobile phase contained methanol-phosphate buffer(50 mmol/L) (2:3, v/v). Fluorescence was measured with an exitationwavelength of 532 nm and an emmission wavelength of 553 nm.
Measurement of antioxidants
TocopherolsSerum/plasma tocopherols were determined using HPLC with fluorescencedetection [219]. Serum/plasma (500 µL) was extracted with 500 µL of ethanolcontaining 0.05 g/L BHT and 2 mL of hexane. A 20-µL volume of supernatantwas injected into a HPLC column (LiChrospher 100 NH2, 250 x 4 mm).Fluorescence was measured with an excitation wavelength of 295 nm and anemission wavelength of 327 nm. In paper V, the levels of serum tocopherolswere adjusted for the sum of serum cholesterol and triglyceride concentrationsas suggested by Thurnham et al [220].
Antioxidative capacityPlasma antioxidative capacity (AOC) was measured by a chemiluminescenceassay by Whitehead et al [221] as described by Öhrvall et al [222]. The assay isbased on measurement of light emission when a chemiluminescent substrate,luminol, is oxidised by hydrogen peroxide in a reaction catalysed by horseradish

Materials and methods 33
peroxidase. Suppression of the light output by antioxidants is related to the AOCof the sample. The suppression was compared with the quenching activity oftrolox, a tocopherol-analogue, and the concentration was expressed as troloxequivalents. The light emission was measured in a luminometer (1251, BioOrbit,Turku, Finland). In paper III and IV, uricase was used to eliminate the uratecontent in the sample before the AOC was measured resulting in an AOC valuewithout the response from urate.
Ethics
The human and animal studies were approved by the Ethics Committee of theFaculty of Medicine at Uppsala University and all subjects gave their informedconsent before entering the study.
Statistics
Data are presented as means ± SD, except in paper V with results expressed asleast square means ± SD taking imbalance into account. All variables werecontinuous and on an interval scale. Variables with skewed distributionsaccording to Shapiro Wilk’s test (W < 0.95) [223] were log-transformed.Variables that were normally or log-normally distributed were tested withparametric methods and other variables were tested with non-parametric tests.All tests were two-tailed and P < 0.05 was regarded as statistically significant.The statistical analyses were performed using the statistical software packagesStata for Windows, version 4.0 (Stata Corporation, College Station, TX, USA)and JMP, version 3.2 (SAS Institute, Cary, NC, USA).
Associations between variables were examined with Pearson product-momentcorrelations or the non-parametric Spearman rank correlations. In paper I, theintra-assay SDs of the hydroperoxide measurements were calculated by poolingthe SDs of the quadruplicates obtained with and without TPP treatment for eachsample. One outlier (defined as deviating more than 3 SDs from the mean) wasnot used in the analyses of associations between variables. Agreements betweenhydroperoxide analyses of fresh and stored samples were also evaluated usingthe Bland-Altman method [224]. In paper II, differences between groups weretested using unpaired Student’s t-test with Bonferroni correction consideringfour comparisons between the groups. In paper IV, differences between the threegroups were first tested in an overall test using either analysis of variance or thenon-parametric Kruskal-Wallis test [225]. In case of a significant overall test,pair-wise comparisons were made using unpaired Student’s t-test or

34 Materials and methods
Mann-Whitney’s non-parametric test. In paper V, the analyses take into accountthe cross-over design of the experiment [226]. An analysis of variance modelwith factors for intervention sequence, subject and time was used. Valuesobtained after the two diets were compared with each other and with thebaseline value. A test for carry-over effect was performed and if this test wassignificant, only data from the first diet period was used for comparisons of thetwo diets. Differences between and within diets are presented with mean effectsand P values. For variables used to evaluate the primary aim, results are alsopresented with 95% confidence intervals (95% CIs) for the difference between,or for log-transformed variables for the ratio of (95% CI ratio) the effects of thetwo test diets.

35
RESULTS
Paper I
Evaluation of sample handling and storage conditions on plasma lipidhydroperoxidesIn clinical studies, analysis of samples that have been stored frozen and thawedis often a prerequisite for practical reasons. The FOX2 assay for measurement ofplasma lipid hydroperoxides was evaluated for its suitability for measurement offresh and stored plasma samples. Lipid hydroperoxides were analysed in plasmasamples from 32 healthy volunteers. Samples were analysed fresh and afterstorage for 6 and 60 weeks at –70°C with and without addition of the chainbreaking antioxidant BHT (Table 2).
Table 2. Hydroperoxide concentrations (µmol/L) in fresh and stored humanplasma samples.
Fresh Stored
6 weeks 60 weeks
(n = 30)+ BHT(n = 31) (n = 32)
+ BHT(n = 29) (n = 21)
Mean (SD) 8.35 (3.09) 8.59 (2.82) 6.00 (2.23) 5.93 (2.15) 6.43 (2.45)
Range 4.03 – 19.5 3.85 – 18.2 2.88 – 13.5 2.11 – 12.0 1.65 – 11.7
Intra-assay CV(%)
7.6 10.6 12.1 11.1 -
Inclusion of BHT immediately after sample collection had no effect on thelevels of hydroperoxides neither in samples analysed fresh nor after storage at–70°C for 6 weeks compared to samples without BHT addition (P = 0.14 andP = 0.62, respectively). There was a positive correlation betweenhydroperoxides in fresh samples with and without BHT (r = 0.89, P < 0.001) andin stored samples with and without BHT addition (r = 0.70, P < 0.001).

36 Results
Storage of samples at –70°C for 6 weeks without BHT was associated with largeindividual variations in the loss or formation of hydroperoxides. The changes inhydroperoxide levels after storage compared to samples analysed fresh rangedfrom a loss of 78% to an increase of 52%, with a mean change represented by ofa loss of 23% of the hydroperoxide content. The time period of storage(6 or 60 weeks) did not seem to affect the content of hydroperoxides and themean level of hydroperoxides in samples stored for 60 weeks was not differentwhen compared to samples stored for 6 weeks (P = 0.77). Intra-assaycoefficients of variation were <12%, with the lowest variation in fresh sampleswithout BHT addition (7.6%).
There were no significant correlations between hydroperoxide levels in freshand stored plasma samples in the presence or absence of BHT (r = 0.33, P = 0.09and r = 0.32, P = 0.09, respectively). The agreement between hydroperoxidesanalysed in fresh and stored samples were also analysed according to Bland-Altman [224], which supported the conclusions of a poor agreement with adifference in detectable levels of fresh and stored samples. The Bland-Altmananalysis showed (a) that there were wide limits of agreement between theanalyses of fresh and stored samples (−6.93 to 2.63 µmol/L), (b) that the levelsof hydroperoxides in fresh samples were higher than in stored samples with amean difference of −2.15 µmol/L (95% CI −3.08 to −1.22) (c) that the differencewas not dependent on the concentration since there was no linear associationbetween the differences and the mean (r = 0.24, P = 0.21).
Comparison of the levels of hydroperoxides with other indicators of lipidperoxidation and antioxidantsIn the same plasma samples, other indicators of lipid peroxidation (8-iso-PGF2αas measured by GC-MS and MDA) as well as biomarkers of antioxidants(α- and γ-tocopherol and AOC) were also detected and compared to each other(Table 3). The hydroperoxide levels from analysis of fresh plasma samples weresignificantly correlated with the levels of 8-iso-PGF2α, but were not correlatedwith any of the other indicators for lipid peroxidation or antioxidants. However,the levels of 8-iso-PGF2α and MDA were both inversely correlated with theconcentrations of lipid adjusted α-tocopherol.

Results 37
Table 3. Correlations of plasma levels of hydroperoxides in fresh samples(µmol/L) by other biomarkers of lipid peroxidation and antioxidants.
r P
8-iso-PGF2α (nmol/L) 0.41 0.028
MDA (µmol/L) −0.087 0.65
α-Tocopherol (µmol/L)a −0.25 0.20
γ-Tocopherol (µmol/L)a −0.22 0.26
α/γ-Tocopherol ratio 0.15 0.44
AOC (µmol trolox equivalents/L) −0.21 0.27
Urate (µmol/L) −0.32 0.095
AOC/urate −0.34 0.067
a Lipid adjusted by division with the sum of serum triglycerides and cholesterol.MDA = malondialdehyde, AOC = antioxidative capacity.
Paper II
Quantification of F2-isoprostanes in liver tissueAnalysis of total amounts (sum of free and esterified) of an F2-isoprostane,8-iso-PGF2α, allows a direct measurement of the extent of oxidative injury inkey tissues of interest. The total amount of 8-iso-PGF2α was analysed usingalkaline hydrolysis of tissue lipids and a specific RIA for measurement of8-iso-PGF2α. The methodology was evaluated in an experimental rat model ofCCl4-induced lipid peroxidation (Figure 3).
Basal levels of total 8-iso-PGF2α in hydrolysed liver tissue of control rats were6.5 times higher than the levels of free 8-iso-PGF2α. In rats treated with CCl4 toinduce lipid peroxidation, the dynamics of formation of free and esterified8-iso-PGF2α in the liver tissue differed. The maximum level of total 8-iso-PGF2αin liver tissue of rats treated with CCl4 was found at 2h after CCl4
administration. At this time point, the total 8-iso-PGF2α level was almost13 times higher than the free 8-iso-PGF2α level. The generation of free 8-iso-

38 Results
PGF2α in liver tissue of CCl4-treated rats was increasing continuously after CCl4administration with the highest detectable level at the last time-point at 6h.
0 1 2 4 60
500
1000
1500
2000free
total
Time (h)
Figure 3. Levels of free and total 8-iso-PGF2α in liver tissue at different timeintervals after carbon tetrachloride treatment (*P< 0.05 and **P <0.01 for difference from controls at 0 time).
Paper III and IV
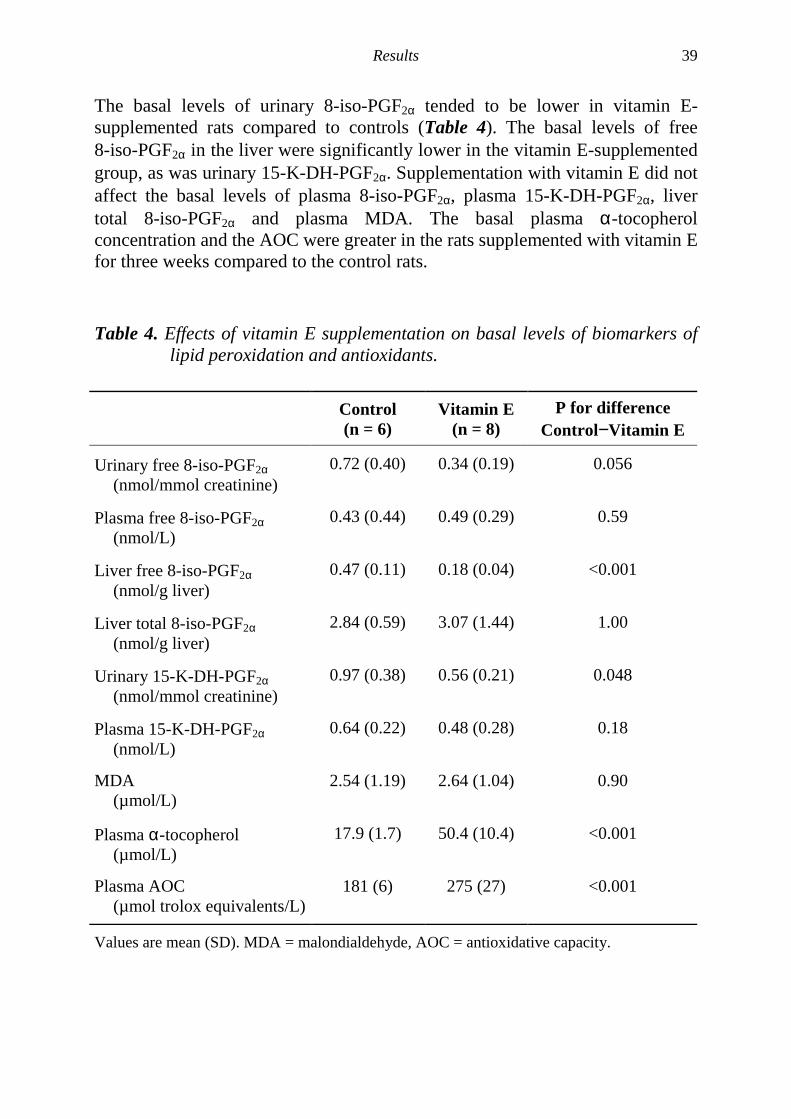
Vitamin E supplementation reduces both basal levels and carbontetrachloride induced levels of F2-isoprostanes and prostaglandin F2αααα in ratsThe effect of vitamin E supplementation on the basal levels (Paper III, Table 4)and CCl4-induced levels (Paper IV, Table 5) of both non-enzymatic andenzymatic lipid peroxidation was investigated. 8-Iso-PGF2α, a prostaglandin F2α
metabolite (15-K-DH-PGF2α), MDA and antioxidants were measured in controlrats and rats supplemented with vitamin E, rats treated with CCl4 and ratssupplemented with vitamin E prior to CCl4 treatment.
Results 39
The basal levels of urinary 8-iso-PGF2α tended to be lower in vitamin E-supplemented rats compared to controls (Table 4). The basal levels of free8-iso-PGF2α in the liver were significantly lower in the vitamin E-supplementedgroup, as was urinary 15-K-DH-PGF2α. Supplementation with vitamin E did notaffect the basal levels of plasma 8-iso-PGF2α, plasma 15-K-DH-PGF2α, livertotal 8-iso-PGF2α and plasma MDA. The basal plasma α-tocopherolconcentration and the AOC were greater in the rats supplemented with vitamin Efor three weeks compared to the control rats.
Table 4. Effects of vitamin E supplementation on basal levels of biomarkers oflipid peroxidation and antioxidants.
Control(n = 6)
Vitamin E(n = 8)
P for differenceControl−Vitamin E
Urinary free 8-iso-PGF2α(nmol/mmol creatinine)
0.72 (0.40) 0.34 (0.19) 0.056
Plasma free 8-iso-PGF2α(nmol/L)
0.43 (0.44) 0.49 (0.29) 0.59
Liver free 8-iso-PGF2α(nmol/g liver)
0.47 (0.11) 0.18 (0.04) <0.001
Liver total 8-iso-PGF2α(nmol/g liver)
2.84 (0.59) 3.07 (1.44) 1.00
Urinary 15-K-DH-PGF2α(nmol/mmol creatinine)
0.97 (0.38) 0.56 (0.21) 0.048
Plasma 15-K-DH-PGF2α(nmol/L)
0.64 (0.22) 0.48 (0.28) 0.18
MDA(µmol/L)
2.54 (1.19) 2.64 (1.04) 0.90
Plasma α-tocopherol(µmol/L)
17.9 (1.7) 50.4 (10.4) <0.001
Plasma AOC(µmol trolox equivalents/L)
181 (6) 275 (27) <0.001
Values are mean (SD). MDA = malondialdehyde, AOC = antioxidative capacity.

40 Results
CCl4 treatment alone resulted in significantly higher levels of plasma, urinaryand liver total 8-iso-PGF2α, and of plasma and urinary 15-K-DH-PGF2αcompared to the same controls as in paper III (Table 5). Rats supplemented withvitamin E prior to CCl4 treatment had significantly lower levels of urinary andliver 8-iso-PGF2α, urinary 15-K-DH-PGF2α and plasma MDA than rats treatedwith CCl4 alone. However, plasma 8-iso-PGF2α and plasma 15-K-DH-PGF2αwere not shown to be affected by vitamin E supplementation. Regardingantioxidants in the circulation, both α-tocopherol levels and the AOC in plasmawere greater in vitamin E-supplemented rats after CCl4 treatment whencompared to CCl4 treatment alone.
Table 5. Effects of vitamin E supplementation (VitE) on levels of biomarkers oflipid peroxidation and antioxidants in carbon tetrachloride (CCl4)induced lipid peroxidation.
Control(n = 6)
CCl4(n = 6)
VitE+CCl4(n = 8)
P for diffCCl4 −
VitE+CCl4
Urinary free 8-iso-PGF2α(nmol/mmol creatinine)
0.72 (0.40) 2.54 (0.94)** 1.57 (0.39)* 0.023
Plasma free 8-iso-PGF2α(nmol/L)
0.43 (0.44) 0.81 (0.27)* 0.53 (0.30) 0.13
Liver total 8-iso-PGF2α(nmol/g liver)
2.84 (0.59) 6.44 (1.05)** 2.44 (1.03) 0.002
Urinary 15-K-DH-PGF2α(nmol/mmol creatinine)
0.97 (0.38) 5.26 (3.53)*** 1.45 (0.77) 0.003
Plasma 15-K-DH-PGF2α(nmol/L)
0.64 (0.22) 2.45 (0.64)*** 2.04 (0.86)*** 0.28
MDA(µmol/L)
2.54 (1.19) 2.44 (0.65) 1.56 (0.47)* 0.014
Plasma α-tocopherol(µmol/L)
17.9 (1.7) 15.5 (2.6) 29.2 (5.6)*** <0.001
Plasma AOC(µmol troloxequivalents/L)
181 (6) 212 (18)* 292 (29)*** <0.001
Values are mean (SD). *P < 0.05, **P < 0.001 and ***P < 0.001 for difference from controls.MDA = malondialdehyde, AOC = antioxidative capacity.

Results 41
Paper V
A diet containing rapeseed oil-based fats does not increase lipidperoxidation in humans when compared to a diet rich in saturated fattyacidsTo investigate if a rapeseed oil-based diet, containing an increased proportion ofeasily oxidised PUFAs such as α-linolenic acid, may affect the degree of lipidperoxidation in vivo, a rapeseed oil-based diet (RO) was compared with acontrol diet (SAT) rich in saturated fat in a cross-over designed dietaryintervention study involving 19 subjects (6 women and 13 men).
No significant differences in plasma or urinary levels of free 8-iso-PGF2α wereobserved between the RO and SAT diets (95% CI ratios 0.94 to 1.46 and 0.91 to1.27, respectively)(Table 6). The 95% CI ratios for log transformed variables areconsidered significant if 1 is not included. The levels of plasma total8-iso-PGF2α(95% CI ratio 0.56 to 1.36), plasma MDA (95% CI ratio 0.98 to1.18) and plasma hydroperoxides (95% CI –0.81 to 0.86) did not differ betweenthe RO and SAT diets either.
Table 6. Biomarkers of lipid peroxidation in plasma and urine at baseline andafter the rapeseed oil-based diet (RO) and the saturated diet (SAT).
Baseline RO SAT P valuea
Plasma (n = 19)
Free 8-iso-PGF2α(pmol/L)
111 (59) 125 (70) 111 (63) 0.17
Total 8-iso-PGF2α(pmol/L)b
740 (530) 580 (640) 530 (340) 0.55
Hydroperoxides(µmol/L)
6.73 (1.59) 6.69 (1.92) 6.66 (2.63) 0.95
MDA(µmol/L)
0.69 (0.10) 0.66 (0.15) 0.61 (0.10)* 0.14
Urine (n = 17)
Free 8-iso-PGF2α(ng/mg creatinine)
− 3.31 (1.33) 3.10 (1.44) 0.39
Data are means (SD). a P values are for difference between the RO and SAT diets. b n = 14-17.* Indicates difference between test diet and baseline (* P < 0.05). MDA = malondialdehyde.

42 Results
A higher concentration of serum γ-tocopherol was detected after the RO dietcompared to the SAT diet (95 % CI ratio 1.62 to 2.18), whereas the serumα-tocopherol concentration (95 % CI ratio 0.98 to 1.09) and plasma AOC(95 % CI –6.8 to 54.8) did not differ between the two test diets (Table 7).
Table 7. Antioxidants in serum at baseline and after the rapeseed oil-baseddiet (RO) and the saturated diet (SAT).
Baseline RO SAT P valuea
α-Tocopherol(µmol/mmol)b
4.20 (0.64) 4.24 (0.45) 4.09 (0.36) 0.20
γ-Tocopherol(µmol/mmol)b
0.34 (0.14) 0.42 (0.09)** 0.23 (0.06)*** <0.001
AOC(µmol trolox equivalents/L)c
526.3 (87.5) 546.0 (93.6) 522.0 (89.8) 0.13
Data are means (SD); n = 19. a P values are for difference between the RO and SAT diets.b Lipid adjusted. c Without lipid adjustment. * Indicates difference between test diet andbaseline (** P < 0.01, *** P < 0.001). AOC = antioxidative capacity.
The goal to compare a rapeseed oil-based diet (RO) with a control diet (SAT)rich in saturated fats was achieved (Table 8). The diets were comparable in theircontent of macronutrients. The two test diets differed in the amount of SAFAs,MUFAs and PUFAs as well as α-linolenic acid. The daily vitamin E intake washigher during the RO diet compared to the SAT diet due to a naturally highvitamin E content in rapeseed oil (15.3 vs. 11.5 mg α-tocopherol equivalents,P < 0.001). All subjects completed both diet periods and were weight stableduring both diet periods. The dietary fat quality was reflected as expected in thefatty acid composition in serum phospholipids. Previously observed positiveeffects of RO diets on the blood lipid profile with lower serum cholesterol, LDLcholesterol, LDL/HDL ratio as well as lower serum concentration of apo B werealso verified after the RO diet compared to the SAT diet (Table 9).

Results 43
Table 8 Daily dietary intake during the rapeseed oil-based diet (RO) and thesaturated diet (SAT) calculated from two pooled 3-day weighed foodrecords.
Nutrients RO SAT P valuea
Energy (MJ) 8.9 ± 1.8 9.7 ± 2.1 0.070
Fat (E%) 35.9 ± 4.3 36.2 ± 3.7 0.70
SAFA (E%) 10.3 ± 1.7 17.6 ± 2.1 <0.001
MUFA (E%) 15.7 ± 2.3 10.9 ± 1.3 <0.001
PUFA (E%) 7.5 ± 1.0 4.6 ± 0.8 <0.001
18:2 n-6 (E%) 5.4 ± 0.7 4.0 ± 0.7 <0.001
18:3 n-3 (E%) 1.8 ± 0.3 0.4 ± 0.1 <0.001
Protein (E%) 14.8 ± 2.0 14.4 ± 2.0 0.19
Carbohydrates (E%) 47.3 ± 5.3 47.5 ± 4.1 0.86
Alcohol (E%) 2.0 ± 1.7 1.9 ± 1.9 0.57
Cholesterol (mg) 281 ± 98 364 ± 101 0.008
Dietary fibre (g) 17.1 ± 5.9 18.9 ± 6.4 0.11
Vitamin E (mg α-TE) 15.3 ± 2.8 11.5 ± 2.3 <0.001
Ascorbic acid (mg) 80 ± 43 87 ± 57 0.77
β-Carotene (mg) 2 ± 1 2 ± 1 0.36
Selenium (µg) 35 ± 8 36 ± 12 0.89
Data are means ± SD; n = 19. a P values are for difference between the RO and SAT diets. E%= percent of energy. α-TE = alfa-tocopherol equivalents.
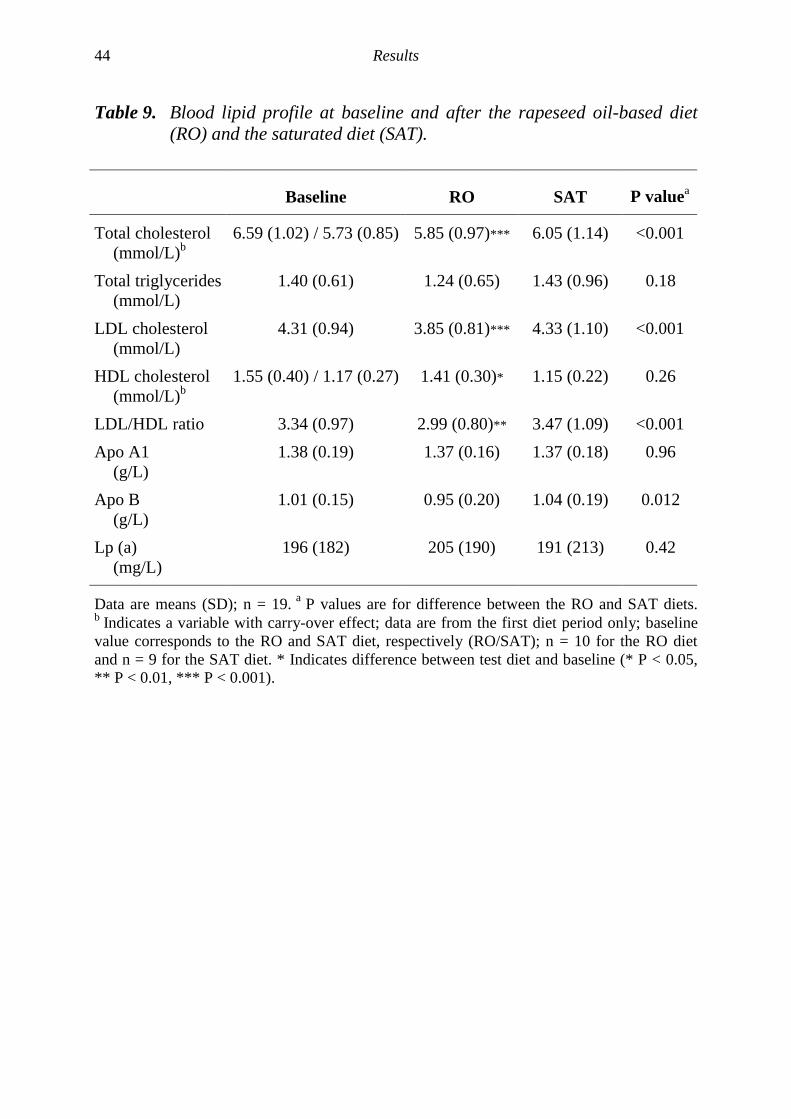
44 Results
Table 9. Blood lipid profile at baseline and after the rapeseed oil-based diet(RO) and the saturated diet (SAT).
Baseline RO SAT P valuea
Total cholesterol(mmol/L)b
6.59 (1.02) / 5.73 (0.85) 5.85 (0.97)*** 6.05 (1.14) <0.001
Total triglycerides(mmol/L)
1.40 (0.61) 1.24 (0.65) 1.43 (0.96) 0.18
LDL cholesterol(mmol/L)
4.31 (0.94) 3.85 (0.81)*** 4.33 (1.10) <0.001
HDL cholesterol(mmol/L)b
1.55 (0.40) / 1.17 (0.27) 1.41 (0.30)* 1.15 (0.22) 0.26
LDL/HDL ratio 3.34 (0.97) 2.99 (0.80)** 3.47 (1.09) <0.001Apo A1
(g/L)1.38 (0.19) 1.37 (0.16) 1.37 (0.18) 0.96
Apo B(g/L)
1.01 (0.15) 0.95 (0.20) 1.04 (0.19) 0.012
Lp (a)(mg/L)
196 (182) 205 (190) 191 (213) 0.42
Data are means (SD); n = 19. a P values are for difference between the RO and SAT diets.b Indicates a variable with carry-over effect; data are from the first diet period only; baselinevalue corresponds to the RO and SAT diet, respectively (RO/SAT); n = 10 for the RO dietand n = 9 for the SAT diet. * Indicates difference between test diet and baseline (* P < 0.05,** P < 0.01, *** P < 0.001).

45
DISCUSSION
Difficulties in assessment of lipid peroxidation
The scope of this thesisThe interest for oxidative stress in relation to the development of disease hasgained large attention during the last decades. Lipid peroxidation is an exampleof oxidative injury that has been extensively studied. It is thought to be animportant factor in the pathophysiology of a number of diseases and in theprocess of ageing, but its measurement in vivo has been difficult. The aim of thisthesis was to evaluate some methods for lipid peroxidation measurement in vivothat are suitable for clinical investigations, and to apply these methods underbasal conditions and in situations that are or may be associated with increasedlipid peroxidation in animals and humans.
In the papers included in this thesis we have used assays for the measurement ofF2-isoprostanes, hydroperoxides and MDA. The methods for analysis ofF2-isoprostanes by RIA and hydroperoxides by the FOX2 assay require noextraction step and are simple, sensitive and specific. MDA detected byfluorescence after HPLC separation is a widely adapted method and was usedfor comparison. As a complementary information, antioxidant status wasassessed by measurement of vitamin E and AOC.
The ideal methodFingerprinting methods based on the measurement of lipid peroxidationproducts are the methods most often used to measure free radical damage in vivo[3-9]. The ideal assay for in vivo measurements of lipid peroxidation should besensitive, reproducible, specific and based on a compound that is stable onstorage for long periods of time. It should also be applicable for measurementsof basal steady-state levels and increased levels due to oxidative stress. For theclinical situation and for routine purposes, it should also be simple, inexpensiveand non-invasive. Further, sample preparation should be avoided or be simple,since generation of artefacts during sample preparation is a common problem.Finally, the biomarker should not be confounded by dietary sources and otherinterfering factors.

46 Discussion
Strategy for choosing methodsToday there is no method that meets all these criteria discussed above. Inaddition, one major drawback for biochemists and clinicians is that most of themethods developed for measurement of lipid peroxidation damage in vitro arenot always applicable for in vivo situations [227]. It has been concluded thatchoosing a combination of different methods for both primary and secondarylipid peroxidation products may be the best approach to assess oxidative injuryin vivo. It is also important to specify the question raised and to choose suitablemethods to investigate the specific question. Often, there are conflicting anddiverging results reported in the literature. By the development of bettermethods this problem may be circumvented.
Mass spectrometry based methods are sensitive, specific and considered to bereliable [3]. However, they are also expensive, time consuming and requireswell skilled personnel. Thus, the use of other methods validated againstMS based methods may be an alternative approach. Validations may includeidentification of the compound measured with MS, comparison of detectablelevels in healthy volunteers and verification of responses found with MStechniques in different animal models using prooxidants and antioxidants(e.g. CCl4 and vitamin E).
Comparison of different methods for lipid peroxidationmeasurements
One interesting question regarding the methods for measurement of lipidperoxidation is how the responses obtained with different methods relate to eachother. Therefore, the relationships between the different methods used to assesslipid peroxidation in vivo were investigated in paper I, III, IV and V. There wasa significant correlation between the plasma levels of hydroperoxides analysedin fresh samples and 8-iso-PGF2α measured by GC-MS in paper I (r = 0.41,P = 0.028). When data from all animals in the control and treatment groups inpaper III and IV were combined (n = 28), no correlations were found betweenthe different methods used. In paper V, the different methods were comparedusing values obtained before the intervention started and there were nosignificant correlations between 8-iso-PGF2α, hydroperoxides and MDA.
Agreement between methods used in this thesis was also investigated aftersupplementation with conjugated linoleic acid, a situation previously shown tohave induced increased levels of urinary 8-iso-PGF2α as measured by RIA [185].Hydroperoxides in fresh plasma samples, MDA and 8-iso-PGF2α as measured byRIA were analysed in samples from a group of overweight middle-aged men

Discussion 47
with signs of the metabolic syndrome participating in a randomised controlledtrial with supplementation with conjugated linoleic acid (unpublished data).Plasma and urine samples were taken after 8 weeks of intervention from subjectsreceiving placebo capsules (n = 7), capsules with a mixture of two isomers ofconjugated linoleic acid (n = 7) and capsules with a 10-trans,12-cis isomer(n = 10). Plasma levels of total hydroperoxides analysed in fresh plasma sampleswere inversely correlated with the levels of plasma MDA (r = −0.64, P <0.05).Further, there was a trend for a positive correlation between plasma and urinarylevels of 8-iso-PGF2α measured with the RIA (r = 0.40, P = 0.057).
These results regarding 8-iso-PGF2α and MDA are in accordance withpreviously described results from an animal study in which the plasma levels of8-iso-PGF2α measured with the same RIA and MDA were not correlated [162].In contrast to the diverging results found in vivo, the levels of 8-iso-PGF2αcorrelated well with other indicators of lipid peroxidation such ashydroperoxides, TBARS and conjugated dienes in isolated LDL during copper-mediated oxidation [154] and rabbit aortic endothelial cell-mediated oxidation[142]. However, the in vitro situation with oxidation of LDL differs from thein vivo measurements in many aspects, e.g. many interfering factors are absentand the oxidation of LDL is relatively extreme, which may explain some of thedifferent results found in body fluids and in oxidised LDL.
On the contrary, when we investigated the relationships between the levels ofbiomarkers of lipid peroxidation and antioxidants, several strong inverserelationships were found in paper I, III, IV and V. The levels of 8-iso-PGF2αmeasured by GC-MS and MDA were both inversely correlated with the levels oflipid corrected α-tocopherol (r = −0.58, P < 0.001 and r = −0.40, P = 0.025,respectively) in paper I. In paper III and IV, the levels of urinary, free liver andtotal liver 8-iso-PGF2α as measured by RIA were inversely correlated with thelevels of α-tocopherol (r = −0.71, P < 0.001; r = −0.68, P < 0.001 and r = −0.40,P < 0.033, respectively). Free liver 8-iso-PGF2α measured by RIA and MDAwere also negatively correlated with the AOC value in paper III and IV(r = −0.74, P < 0.001 and r = −0.41, P = 0.030, respectively). In paper V, thehydroperoxide levels were inversely correlated with the α-tocopherol andγ-tocopherol concentrations (r = −0.60, P = 0.007 and r = −0.54, P = 0.016,respectively). The inverse correlations between circulating tocopherols andbiomarkers of lipid peroxidation are in agreement with the theory of oxidativestress with an imbalance between prooxidants and antioxidants. In addition,there was also a relationship between the free and total 8-iso-PGF2αconcentrations in the liver (r = 0.51, P < 0.01), as well as a trend for acorrelation between plasma and urinary levels of 8-iso-PGF2α (r = 0.43,P = 0.054) as measured by RIA in paper III and IV. However, the relationships

48 Discussion
between the levels of 8-iso-PGF2α in different compartments may becomplicated to interpret due to the differences in the kinetics of their formation.
In a broader perspective, another interesting question is whether biomarkers fordifferent targets of free radical attack are related to each other. In a study onhealthy human subjects, England et al concluded that the steady-state levels oflipid peroxidation as measured with 8-iso-PGF2α and oxidative DNA damage inplasma were not correlated [228].
The different responses between methods for lipid peroxidation assessmentin vivo may partly be explained by the fact that these methods reflect differentstages of the lipid peroxidation process. They may also derive their origin fromdifferent fatty acid substrates and consequently be affected by the fat quality ofthe diet. Another piece of explanation to the diverging responses could beunderestimations of correlations due to technical measurement errors. Further,the range of data investigated in each study may also affect the correlations. Acombination of correlations and the use of Bland-Altman analysis [224] maygenerally be preferred when comparing different methodologies for themeasurement of one specific lipid peroxidation product. These data support theidea that the best approach may be to use a combination of several methods forthe measurement of lipid peroxidation in vivo.
Hydroperoxides as an indicator of lipid peroxidation
Reported levels of total and individual classes of hydroperoxidesHydroperoxide assays are generally divided into two categories detecting eithertotal or individual classes of lipid hydroperoxides. Total plasma hydroperoxidelevels in healthy individuals using four distinct techniques with varyingcomplexity generate much the same answer. Total hydroperoxide levels havebeen estimated to be between 0.5 and 5.5 µmol/L [56, 60, 61, 69, 121, 123-125,229]. Using HPLC-chemiluminescence assays, plasma levels of differentindividual classes of hydroperoxides has been reported to vary considerably.Phospholipid hydroperoxides have been reported to range between 10 and500 nmol/L [67, 68, 92]. Cholesteryl ester hydroperoxides levels are reported tobe as low as 3 nmol/L [66, 117] or as high as 920 nmol/L [120].
Hydroperoxide levels in paper IIn paper I, we re-evaluated the FOX2 assay for the assessment of plasmahydroperoxides in fresh and stored samples. We recorded 8.35 ± 3.09 µmol/L oftotal hydroperoxides in fresh plasma samples from a group consisting of both
Discussion 49
healthy controls and patients with various metabolic disorders. There were nodifferences between the hydroperoxide levels in the control group, the diabetesgroup and the group with other metabolic disorders (8.47 ± 4.32 µmol/L,7.97 ± 2.03 µmol/L, 8.56 ± 2.16 µmol/L, respectively). Our values for thecontrols are slightly higher than previously reported levels in controls [56, 123-125, 229]. On the other hand, the control groups in previous studies were mainlycomprised of younger subjects, which may explain the higher hydroperoxidelevels detected in plasma in our control group. Hydroperoxide levels in thegroups with patients with diabetes and other metabolic disorders were inagreement with those reported for type 1- and type 2-diabetic subjects in earlierstudies [123-125].
Sample handling and stability of hydroperoxidesThe effects of sample handling and stability of hydroperoxides after freezingand thawing was the primary aim investigated in paper I. To our surprise, therewas no significant relationship between plasma hydroperoxides analysed infresh and stored plasma samples. There were large inter-individual differencesin the change of hydroperoxide content after storage, which are difficult toexplain. In most cases there was a loss of hydroperoxides after storage, but in afew cases an increase of hydroperoxides was observed. The loss ofhydroperoxides may be explained by decomposition to secondary lipidperoxidation products, and the increase may be due to a generation catalysed bytraces of transition metal ions. However, inclusion of BHT as a chain-breakingantioxidant had no effect on the content of hydroperoxides.
Information on the stability of hydroperoxides during storage from the literatureis sporadic. Our results are in line with an investigation reported by Holley andSlater on the stability of eicosatetraenoic acid hydroperoxide using an HPLC-chemiluminescence technique [92]. They found that this hydroperoxide wasstable for up to 2 weeks at –70°C and that there was a 53% loss of theeicosatetraenoic acid hydroperoxides when the samples were stored for onemonth, which was not affected by inclusion of BHT or desferal.
The generation or decomposition of products when freezing and thawingsamples may be an important factor to consider not only regardinghydroperoxide measurements. Storage in liquid nitrogen may provide additionalprotection. Also, critical consideration of traces of hemolysis is important,especially for measurements with the FOX2 method in which hemolysisinterferes with the assay. Different sample handling procedures could possiblyexplain some of the variations in the reported levels of individual classes ofhydroperoxides as measured with different techniques [66-68, 92, 117, 120].

50 Discussion
F2-isoprostanes as an indicator of lipid peroxidation
Quantification of 8-iso-PGF2αααα in tissueThere is a growing interest in quantification of tissue levels of 8-iso-PGF2α forinvestigations of the susceptibility of different tissues to oxidative stress. Thus,it is valuable to analyse the total amount of 8-iso-PGF2α present in tissues. Thetotal formation of 8-iso-PGF2α including both free and esterified 8-iso-PGF2α
can be quantified following release of the esterified 8-iso-PGF2α by alkalinehydrolysis of the tissue. Thus, the analysis of total amounts of 8-iso-PGF2α mayallow a direct measurement of the extent of oxidative injury in tissues ofinterest.
In paper II, we employed a methodology for hydrolysis of liver tissue to analysetotal 8-iso-PGF2α using a recently developed RIA [88]. After alkaline hydrolysisof the liver tissue, levels of total 8-iso-PGF2α were increased both in the basalstate and in an animal model of CCl4-induced lipid peroxidation compared to thelevels of free 8-iso-PGF2α. The levels of total 8-iso-PGF2α in the liver tissue ofcontrol rats were comparable to levels reported by Morrow and Roberts using aGC-MS technique [156].
8-Iso-PGF2αααα are generated in the esterified formIn the mammalian body, 8-iso-PGF2α is believed to be generated in the esterifiedform in tissue phospholipids and subsequently released into the circulation afterhydrolysis of the esterified 8-iso-PGF2α to the free form, presumably byphospholipases and other hydrolytic enzymes [134]. However, the nature ofthese enzymes responsible for the successive hydrolysis of esterified8-iso-PGF2α in vivo remains to be established. Endogenously formed8-iso-PGF2α is rapidly metabolised and efficiently excreted into the urine [135,136].
In paper II, liver tissue was collected at different intervals after CCl4 treatment.The maximum level of total 8-iso-PGF2α in the liver was found at 2h after CCl4
administration. The increase of total 8-iso-PGF2α in the liver preceded theappearance of free 8-iso-PGF2α in the circulation, since the liver is the maintarget organ of CCl4-induced lipid peroxidation. The pattern of CCl4-induced8-iso-PGF2α formation in the liver is in accordance with earlier reported patternsof CCl4-induced 8-iso-PGF2α formation in plasma and urine [162]. Levels offree 8-iso-PGF2α in the liver increased similarly as the levels of free 8-iso-PGF2αin the urine. These findings are in agreement with the findings reported byMorrow and Roberts [134, 156] and suggest that the free F2-isoprostanes arose

Discussion 51
from hydrolysis of peroxidised lipids. The proportions between free and total8-iso-PGF2α generated in this rat model of oxidative stress varied over time afterCCl4 administration and ranged from about 4 to 13 times higher total than freelevels. This indicates that the formation of esterified 8-iso-PGF2α and release offree 8-iso-PGF2α by phospholipases and hydrolytic enzymes during theexperiment is a dynamic process. The availability and activity of endogenousphospholipases and other hydrolytic enzymes that releases the esterified8-iso-PGF2α may thus vary over time, which can be a problem with regard tomeasuring tissue levels of total 8-iso-PGF2α.
F2-isoprostanes are increased by prooxidantsThe formation of 8-iso-PGF2α in plasma and urine have been shown to beincreased in rats after CCl4 administration as measured with a specific RIA[88, 184] and in a series of previous experimental animal studies usingmethodologies based on GC-MS [134, 156, 230]. In paper II and IV,significantly increased levels of plasma, urinary and liver 8-iso-PGF2α weredetected in CCl4-treated rats compared to controls. However, the increases afterCCl4 treatment were less pronounced than previously reported resultsirrespective of the method used [88, 134, 156, 162]. The smaller increases in theformation of 8-iso-PGF2α after CCl4 treatment in paper II and IV could possiblybe caused by less gastrointestinal absorption due to differences in the conditionsduring administration of CCl4 to the rats.
F2-isoprostanes are suppressed by antioxidantsOnly a few studies have investigated the effect of vitamin E on the formation ofF2-isoprostanes [166-168, 231]. Vitamin E supplementation was shown toreduce F2-isoprostane generation in apolipoprotein E-deficient mice [168] anddiabetic rats [167], whereas vitamin E deprivation has been related to increasedlevels of 8-iso-PGF2α [166, 231].
The antioxidant vitamin E is a chain-breaking antioxidant preventing lipidperoxidation in membranes by scavenging of free radicals [24]. Vitamin E maytherefore prevent propagation of the CCl4-induced lipid peroxidation processthrough this mechanism. However, information on whether vitamin E alsoaffects the inflammatory response through COX-mediated lipid peroxidationduring hepatotoxicity is lacking.
In paper III and IV, rats were supplemented with vitamin E in the diet and theeffects under normal conditions and after CCl4-induced lipid peroxidation wereinvestigated. In these studies, we used a high dose of vitamin E (2 g/kg body) to

52 Discussion
counteract the severe liver damage induced by CCl4 and the subsequent lipidperoxidation. The dose of vitamin E used in our study is in the upper range usedin various animal studies. Safety studies of vitamin E intake (reviewed in [232])reports that adverse effects were rarely observed with this dose in rats, and itwas concluded that there were no evidence for adverse toxic effects normutagenic, carcinogenic or teratogenic effects even at high doses of vitamin E.Control rats and vitamin E supplemented rats in this study both gained weight ata similar rate and there was no difference in the final body weight between thegroups. The antioxidative capacity and α-tocopherol level in plasma was greaterin the vitamin E supplemented rats than in controls. The basal levels of urinary8-iso-PGF2α and the levels after CCl4 treatment was lower in the vitamin Esupplemented rats. Vitamin E supplementation was also shown to suppress thebasal levels of free but not total 8-iso-PGF2α as compared to controls. The causefor these different effects of vitamin E on 8-iso-PGF2α levels in the liver isunclear. These results indicate that non-enzymatic lipid peroxidation at basalconditions and during experimental hepatic oxidative injury can be suppressedby dietary vitamin E supplementation in rats.
Metabolism of 8-iso-PGF2αααα −−−− plasma and urinary levelsIn paper III and IV, the basal levels and the CCl4-induced levels of 8-iso-PGF2αin the urine were reduced by dietary supplementation with vitamin E, but not inthe plasma. The main reason why plasma 8-iso-PGF2α was not suppressed byvitamin E supplementation is probably because the kinetics of formation andavailability of 8-iso-PGF2α are different in the plasma and urine. The half-life ofplasma 8-iso-PGF2α is very short and 8-iso-PGF2α metabolises rapidly and isefficiently excreted into the urine [136]. Urinary levels of 8-iso-PGF2α maytherefore reflect an earlier event of the biosynthesis and availability of8-iso-PGF2α in the body compared to plasma levels measured at the same time[136]. Consequently, plasma 8-iso-PGF2α levels are determined both by theirrate of formation and by their metabolism and urinary excretion, all of whichcould vary between individuals [228].
Depending on the situation that is investigated, the steady-state levels of abiomarker may be drastically increased for example in acute diseases or stressedtissues such as in myocardial infarction or severe burns, whereas the increasemay be less dramatic in chronic diseases such as atherosclerosis, diabetes andneurodegenerative diseases. When using 8-iso-PGF2α as a biomarker ofoxidative injury, evidence must be interpreted considering both the type ofoxidative injury and the metabolism of 8-iso-PGF2α.

Discussion 53
Possible link between oxidative injury and inflammation
The use of recently developed RIAs for the measurement of both 8-iso-PGF2α
and 15-K-DH-PGF2α is an interesting possibility for simultaneous measurementof non-enzymatic and enzymatic lipid peroxidation in vivo [88, 184]. Levels ofboth 8-iso-PGF2α and 15-K-DH-PGF2α in plasma and urine have been shown tobe increased in animal models of CCl4-induced hepatotoxicity [162],experimental septic shock [161, 163] and in reperfusion injury after cardiacarrest [165]. In the hepatotoxicity study [162], the oxidative injury, as measuredby 8-iso-PGF2α, was increased before an increase in the inflammatory response,as measured by 15-K-DH-PGF2α, could be seen. This result suggests that theCOX-dependent inflammatory response possibly could be a secondary effect ofoxidative injury and a conceivable link between inflammation and oxidativestress [162].
In paper III, it was shown that basal conditions in normal rats compared to ratsfed a vitamin E enriched diet differed. The basal levels of both urinary8-iso-PGF2α and 15-K-DH-PGF2α were lower after vitamin E supplementation.In paper IV, the plasma and urinary levels of both 8-iso-PGF2α and15-K-DH-PGF2α were also lower in vitamin E-supplemented rats treated withCCl4 as compared to rats treated with CCl4 alone. Thus, vitamin E was shown tohave a suppressive effect on both non-enzymatic and enzymatic lipidperoxidation.
Dietary fat quality and oxidisability of different fatty acids
The contribution of different fatty acids to biomarkers of lipid peroxidationThe susceptibility of fatty acids to oxidation is thought to be dependent on theirdegree of unsaturation [46, 47]. However, little is known about the contributionof individual fatty acids to each of the different biomarkers of lipid peroxidation[233]. Some biomarkers are formed specifically from individual fatty acids andthe formation of F2-isoprostanes from arachidonic acid is one such example.When micelles of different fatty acids were oxidised in vitro it was shown thatindividual fatty acids yield different profiles of oxidation markers [233]. Studiesconcerning the contribution of different fatty acids to the formation of MDA isanother example regarding the discussion about fatty acid substrates for differentbiomarkers. It has been suggested that MDA is formed mainly from fatty acidscontaining three or more double bonds [104, 105]. When various PUFAs wereoxidised completely in vitro, the yields of free MDA on a molar basis were 0.5%of linoleic acid, 4.5% of α-linolenic acid, 4.9% of γ-linolenic acid, 4.7% of

54 Discussion
arachidonic acid and 4.6% of docosahexaenoic acid [105]. The very low yield ofMDA from linoleic acid agrees with the proposal that MDA is mainly formedfrom PUFAs with three or more double bonds [104]. The findings regarding theinfluence of different fatty acid substrates on the response in differentbiomarkers of lipid peroxidation is another argument for the use of more thanone biomarker of lipid peroxidation in studies of lipid peroxidation in vivo.
Dietary fat quality and LDL oxidationThe fatty acid composition of the diet largely determines the fatty acidcomposition of plasma lipoproteins, which influences the rate and extent of LDLperoxidation [208]. Whereas SAFA- and MUFA-rich LDL particles are fairlyresistant to oxidation, PUFA-rich LDL particles are more susceptible to lipidperoxidation in vitro [234-236]. However, only a few studies have investigatedeffects of dietary fat quality on biomarkers of in vivo lipid peroxidation insteadof or in addition to in vitro oxidation of LDL particles, and an unansweredquestion is whether oxidation of LDL in vitro reflects relevant in vivo lipidperoxidation processes.
Does an increased consumption of rapeseed oil-based products lead toincreased lipid peroxidation in the body?Over the past two decades there has been an expansion of the production of low-erucic acid rapeseed oil (canola oil). Rapeseed oil is rich in unsaturated fattyacids and has been shown to have beneficial nutritional effects [204-207, 212-214], but little is known about the risk for an increased lipid peroxidation. Froma public health perspective it is important to investigate the effects of a diet withrapeseed oil-based fats and consequently an increased intake of MUFAs andPUFAs, especially α-linolenic acid, compared with a diet composed inaccordance with the reported intakes of fatty acids before rapeseed oil-basedproducts were introduced.
Some studies have investigated effects on biomarkers of lipid peroxidation afterintervention with diets containing a higher proportion of PUFA but a lowerproportion MUFA than the rapeseed oil-based diet used in paper V. In thesestudies, increases in plasma TBARS formation [237], urinary excretion ofF2-isoprostanes [238] and urinary TBARS levels [239] were found. Interventionstudies with n-3 fatty acid enriched diets have also shown increases of plasmaMDA levels [240-243], which could be prevented by increasing the intake ofvitamin E [240, 244].
In paper V, we compared a rapeseed oil-based diet with a control diet rich insaturated fats. There were no differences in the biomarkers of lipid peroxidation

Discussion 55
(8-iso-PGF2α, hydroperoxides and MDA) and antioxidants (tocopherols andAOC) except for increased levels of serum γ-tocopherol after the RO dietcompared to the SAT diet. The relatively narrow confidence intervals indicates asufficient power of this study to detect clinically significant differences.However, according to the results in paper I, there are large inter-individualvariations in the degree of loss or accumulation of plasma hydroperoxides afterstorage at –70°C. The analysis of hydroperoxides in paper V were performed onsamples that had been frozen at –70°C and these results should therefore beinterpreted cautiously. In conclusion, the results of the present study suggest thatthere is a balance between the content of antioxidants and PUFA in rapeseed oil-based fats when used in a natural mixed diet and that the amount of antioxidantsnaturally present is sufficient. The antioxidant content of the RO diet seemsenough to increase circulating concentrations of γ-tocopherol and thus topossibly contribute to the protection of unsaturated fatty acids from oxidation.
The influence of a natural mixed rapeseed oil-based diet on lipid peroxidationhas also been investigated in a study by Turpeinen et al [245]. There wasconsiderable disparity between in vitro and in vivo indicators of lipidperoxidation. Plasma levels of MDA and conjugated dienes and the amount ofTBARS and hydroperoxides in LDL were unchanged or slightly decreased,while the susceptibility of LDL to oxidation in vitro (lag time and time tomaximum oxidation) was increased. Our findings in paper V are line with thein vivo findings of Turpeinen et al [245].
The composition of the test diets in paper VIn paper V, the dietary intake was monitored by weighed dietary records. Thetwo test diets differed essentially in the E% of α-linolenic acid and in theamount of SAFA, MUFA and PUFA. The fat content of both test diets were inaccordance with the reported intakes from a Swedish population studyperformed a decade ago i.e. before rapeseed oil products were as widely used astoday [215]. The RO diet contained 1.8 E% of α-linolenic acid, which is similarto reported contents of α-linolenic acid in earlier studies investigating the effectsof rapeseed oil [207, 246]. The proportions of SAFA, MUFA and PUFA in theRO diet were generally in agreement with today’s dietary recommendations[210], but with a slightly higher intake of MUFAs due to the higher fat intake ofabout 36 E% compared to 30 E% as recommended. The content of α-linolenicacid in the SAT diet was 0.4 E%, which was in agreement with or somewhatlower than reported intakes from a recent Swedish population study [247]. Thefatty acid composition of the SAT diet was similar to the intake of SAFA,MUFA and PUFA reported in the Swedish population study from a decade ago[215].

56 Discussion
Beneficial effects of a rapeseed oil-based dietIn paper V, the estimated intake of vitamin E from the dietary records revealed agreater intake of vitamin E expressed as α-tocopherol equivalents (α-TE) duringthe RO diet compared to the SAT diet (15.3 and 11.5 mg α-TE per day). Thesedata correspond to 13.9 and 11.0 mg α-tocopherol and approximately 14.1 and5.6 mg γ-tocopherol per day during the RO and SAT diets, respectively. Theγ-tocopherol content was approximated from the difference of the intakeexpressed as α-TE and α-tocopherol, with the assumption that β- andδ-tocopherols do not contribute significantly to the amount of α-TE. Aconversion factor of 0.1 was used to calculated the approximated content ofγ-tocopherol from this difference. The level of γ-tocopherol analysed in serumwas higher after the RO diet compared to the SAT diet, whereas the serumα-tocopherol levels did not differ between the two diets. This leads to a lowerratio of α- to γ-tocopherol after the RO diet compared to the SAT diet. A lowγ-tocopherol concentration and a high α- to γ-tocopherol ratio have beenreported in patients with CHD [248, 249] and in a population with a highincidence of CHD [250]. These results suggest that a serum tocopherol profilewith low γ-tocopherol levels and a high α- to γ-tocopherol ratio may be anindicator of an increased risk for CHD, and that a rapeseed oil-rich diet may bebeneficial in helping to increase the levels of γ-tocopherol in the body. Further,the final results of the Lyon Diet Heart Study were recently reported andindicates that a Mediterranean diet rich in α-linolenic acid is beneficial insecondary prevention of CHD [251]. Surprisingly, data from the same study alsosuggest that the Mediterranean diet protects against CHD through mechanismsindependent of traditional CHD risk factors such as blood lipid profile, bloodpressure and smoking. The content of antioxidants and α-linolenic acid ofseveral plant foods in the Mediterranean diet have been suggested to be criticalmediators of the beneficial effects of this diet [251, 252]. These data furthersupport possible positive effects of rapeseed oil with its high content of vitaminE and α-linolenic acid in addition to documented positive effects on the bloodlipid profile [204-207, 212-214].
Future perspectives
The increased interest in the role of free radicals in the pathogenesis of a numberof human diseases has led to an increased need for techniques to measure freeradicals and their reactions in vivo. Oxidative injury can be assessed by themeasurement of products of lipid peroxidation, DNA oxidation and protein

Discussion 57
oxidation, and by measurement of depletion of antioxidants as a complementaryapproach. However, there are much to be learned about what steady-state levelsand increased levels of these biomarkers mean and how they should beinterpreted in relation to oxidative injury and the onset and progression of acuteand chronic disease processes. Regarding methods for measurement of lipidperoxidation, there are many arguments that lead us to conclude that no singlemethod is adequate by itself as an accurate indicator of lipid peroxidationin vivo, and that choosing a combination of suitable methods to try to answer aspecific question raised may be a better way to study lipid peroxidation.
Better techniques for the assessment of free radical damage will also help us tounderstand more about antioxidants and to evaluate the potential role ofantioxidants in the prevention of disease in future studies. The “antioxidantparadox” may represent an example of confusion due to inconsistent results.Epidemiological studies suggest a protective role of antioxidants, whereasintervention studies have not been able to support this finding. The discrepanciesbetween the results from epidemiological and intervention studies may beexplained by many factors. One factor might be the use of only disease outcomeas an end-point or just one single method to evaluate the effects of antioxidants.
Today we do not know enough to answer if there is a causal relationshipbetween plasma or tissue levels of antioxidants and chronic disease. Until moreknowledge is gathered, we need to continue focus on recommending anincreased intake of antioxidants from fruits and vegetables and other dietarysources. Few intervention trials have studied the antioxidant effects of dietsrather than vitamin supplements. Findings from a recent trial that altered fruit,vegetable and fat intake in healthy adults support the hypothesis that changingdietary patterns may decrease the risk of atherosclerosis by favourably alteringthe balance between oxidant defence and damage [253]. In addition,interventions with e.g. Brussels sprouts [254] and tomatoes [255] have beenshown to reduce oxidative DNA damage. The use of biomarkers of oxidativedamage has also been proposed as a way of identifying which diets and otherlifestyle factors could minimise oxidative damage and thus putatively delay theonset of chronic diseases.
Improved methods will help us in understanding the underlying mechanisms offree radical damage in the development of diseases. Recent research implicatesthat free radicals and antioxidants may be important in signal transduction andgene expression [256]. There are also possible genetic aspects in the wayindividuals may handle oxidative stress depending on differences in the levels ofendogenous antioxidants, rates of repair and uptake and processing ofantioxidants from dietary sources.

58
CONCLUSIONS
� The FOX2 assay is a useful tool for the measurement of totalhydroperoxides in fresh plasma samples but not in stored plasma samples.Analysis of fresh plasma samples avoids the problem with large inter-individual variations in the change of hydroperoxides after storage. Little isknown about the stability of individual classes of hydroperoxides duringstorage and further studies are required (paper I).
� A methodology based on alkaline hydrolysis of esterified F2-isoprostanesand a specific radioimmunoassay for the quantification of total amounts of8-iso-PGF2α was successfully applied on rat liver tissue. The methodologyfor measurement of total levels of 8-iso-PGF2α in tissues may be suitablefor future investigations of the location of oxidative injury in the body andpossibly also the susceptibility of different tissues to oxidative stress(paper II).
� Dietary supplementation with vitamin E was shown to decrease the levelsof both 8-iso-PGF2α and 15-K-DH-PGF2α at basal conditions and afterCCl4-induced oxidative injury in rats. Thus, vitamin E supplementationmay have an effect on both free radical-induced oxidative injury andcyclooxygenase-catalysed prostaglandin formation. The simultaneousmeasurement of 8-iso-PGF2α and 15-K-DH-PGF2α is a promising approachfor studies investigating the possible roles of lipid peroxidation undernormal conditions and in the pathology of various human diseases(paper III and IV).
� A rapeseed oil-rich diet does not seem to increase the degree of lipidperoxidation in the body compared to a diet rich in saturated fats. This ispossibly due to a sufficient content of antioxidants in the rapeseed oil dietto increase circulating concentrations of antioxidants that may protectunsaturated fatty acids from oxidation (paper V).
� The results of this thesis support the proposal that selection of acombination of methods for simultaneous measurement of severalbiomarkers of both primary and secondary lipid peroxidation products aswell as antioxidant levels is a promising approach for future studiesinvestigating the possible role of lipid peroxidation in vivo under basalconditions and in the pathology of disease.

59
ACKNOWLEDGEMENTS
This work was carried out at the Department of Public Health and CaringSciences, Section for Geriatrics / Clinical Nutrition Research at UppsalaUniversity, Sweden.
I wish to express my sincere gratitude to everyone who, in their own way, havehelped me to complete this thesis, with special thanks to:
Hans Lithell, head of the Section for Geriatrics, for his enthusiasm and forproviding a stimulating atmosphere.
My supervisors and mentorsBengt Vessby for giving me the opportunity to work in his Clinical NutritionResearch group and for experienced guidance into the scientific way of thinking.
Samar Basu for always sharing your creativity, knowledge and ideas and for allsupport and encouragement.
Inga-Britt Gustafsson for being a rich source of inspiration and for being myguide into thinking of food in practical terms.
Jaffar Nourooz-Zadeh for introducing me to the basics of lipid peroxidation andoxidative stress and for long discussions about science and life in general.
Margareta Öhrvall and Brita Karlström for being my mentors and helping meto make good decisions with a lot of good advice and words of wisdom.
My colleagues and co-workersAgneta Andersson, Anette Järvi, Annika Smedman, Cecilia Nälsén, JohannaHelmersson and Ulf Risérus for sharing the joy of being a PhD student inBengt’s group and for creating a pleasant atmosphere.
Jonas Cederberg and Anu Turpeinen for interesting and fruitful collaborationbetween our research groups.
Lars Berglund and Rawya Mohsen for being loyal lunch-mates and for skilledstatistical help.
Barbro Simu, Eva Sejby, Jan Hall and Siv Tengblad for sharing your warmhearts and for all the times you helped me out in the lab.

60 Acknowledgements
Marina Spoverud-Älvebratt for being an outstanding organiser and chef in theexperimental kitchen during the diet study.
All dieticians − Achraf, Agneta N, Britt, Erika, Helene, Marie L-N, Marie vP,Monika and Susanne for fun and inspiring discussions mostly about dietetic andnutritional matters.
All colleagues at the Section for Geriatrics − Ann-Christin, Anu, Arvo, Björn,Clas, Inger, Johan S, Johan Ä, Kristina B, Kristina D, Lena, Lennart, Liisa,Margareta F, Merike, Per-Erik, Richard for many good laughs over a cup ofcoffee and for creative and constructive inputs in scientific discussions.
All staff at the metabolic ward for taking excellent care of the study subjects.
All study subjects for taking part in our studies with enthusiasm and patience.
My friends and familySusanne Neuman-Ekehult for sharing the pleasure of long conversations aboutwhat is important in life and the problem of expensive telephone bills.
All my friends for filling my life with memorable fun moments and for puttingup with me when I kept going on about my research.
Solveig, Jan, Andreas and Peter Simonsson for all the relaxing weekends andholidays.
My mother, my brother Erik, my sister Anna-Karin, Kjell, Mattias and Danielfor giving me all the support I could ever have wished for.
The memory of my father, for always believing in me and for encouraging me tostudy at the University in the first place.
Martin for being there with limitless love.
This work was financially supported by the Foundation for Geriatric Research,Geriatrics Foundation, Loo and Hans Ostermans Foundation, Royal Society forScience Research Grants, School of Household Management Fund, SwedishCouncil for Forestry and Agricultural Research, Swedish Diabetes Foundation,Swedish Medical Research Council and Swedish Nutrition Foundation.

61
REFERENCES
1. Murray RK, Granner DK, Mayes PA, Rodwell VW. Harper´s biochemistry. 25th
ed. Stamford, Connecticut: Appleton & Lange; 2000.2. Gutteridge JM, Halliwell B. Antioxidants in nutrition, health, and disease.
Oxford: Oxford University Press; 1994.3. Halliwell B, Gutteridge JMC. Free radicals in biology and medicine. 3rd ed.
Oxford: Oxford University Press; 1999.4. Gutteridge JM, Halliwell B. The measurement and mechanism of lipid
peroxidation in biological systems. Trends Biochem Sci 1990;15:129-135.5. Halliwell B, Gutteridge JM. Role of free radicals and catalytic metal ions in
human disease: an overview. Methods Enzymol 1990;186:1-85.6. Halliwell B, Chirico S. Lipid peroxidation: its mechanism, measurement, and
significance. Am J Clin Nutr 1993;57:715S-724S.7. Gutteridge JM. Lipid peroxidation and antioxidants as biomarkers of tissue
damage. Clin Chem 1995;41:1819-1828.8. Moore K, Roberts LJ II. Measurement of lipid peroxidation. Free Radic Res
1998;28:659-671.9. De Zwart LL, Meerman JH, Commandeur JN, Vermeulen NP. Biomarkers of
free radical damage applications in experimental animals and in humans. FreeRadic Biol Med 1999;26:202-226.
10. Slater TF. Free-radical mechanisms in tissue injury. Biochem J 1984;222:1-15.11. Rice-Evans C, Burdon R. Free radical-lipid interactions and their pathological
consequences. Prog Lipid Res 1993;32:71-110.12. Halliwell B. Free radicals and antioxidants: a personal view. Nutr Rev
1994;52:253-265.13. Halliwell B, Murcia MA, Chirico S, Aruoma OI. Free radicals and antioxidants
in food and in vivo: what they do and how they work. Crit Rev Food Sci Nutr1995;35:7-20.
14. Curnutte JT, Babior BM. Chronic granulomatous disease. Adv Hum Genet1987;16:229-297.
15. Pryor WA. Oxy-radicals and related species: their formation, lifetimes, andreactions. Annu Rev Physiol 1986;48:657-667.
16. Cheeseman KH, Slater TF. An introduction to free radical biochemistry.Br Med Bull 1993;49:481-493.
17. Davies MJ. Applications of electron spin resonance spectroscopy to theidentification of radicals produced during lipid peroxidation. Chem Phys Lipids1987;44:149-173.

62 References
18. Chen G, Bray TM, Janzen EG, McCay PB. Excretion, metabolism and tissuedistribution of a spin trapping agent, α-phenyl-N-tert-butyl-nitrone (PBN) inrats. Free Radic Res Commun 1990;9:317-323.
19. Janzen EG. Spin trapping and associated vocabulary. Free Radic Res Commun1990;9:163-167.
20. Halliwell B. Oxidative stress, nutrition and health. Experimental strategies foroptimization of nutritional antioxidant intake in humans. Free Radic Res1996;25:57-74.
21. Halliwell B. Antioxidants and human disease: a general introduction. Nutr Rev1997;55:S44-49.
22. Chaudiere J, Ferrari-Iliou R. Intracellular antioxidants: from chemical tobiochemical mechanisms. Food Chem Toxicol 1999;37:949-962.
23. Gaté L, Paul J, Ba GN, Tew KD, Tapiero H. Oxidative stress induced inpathologies: the role of antioxidants. Biomed Pharmacother 1999;53:169-180.
24. Burton GW, Joyce A, Ingold KU. First proof that vitamin E is major lipid-soluble, chain-breaking antioxidant in human blood plasma. Lancet 1982;2:327.
25. Burton GW, Ingold KU. Vitamin E as an in vitro and in vivo antioxidant. AnnN Y Acad Sci 1989;570:7-22.
26. Kamal-Eldin A, Appelqvist LÅ. The chemistry and antioxidant properties oftocopherols and tocotrienols. Lipids 1996;31:671-701.
27. Sies H. Oxidative stress: introduction. London: Academic Press; 1991.28. Sies H. Oxidative stress: oxidants and antioxidants. Exp Physiol 1997;82:291-
295.29. Betteridge DJ. What is oxidative stress? Metabolism 2000;49:3-8.30. Dypbukt JM, Ankarcrona M, Burkitt M, Sjöholm A, Ström K, Orrenius S,
Nicotera P. Different prooxidant levels stimulate growth, trigger apoptosis, orproduce necrosis of insulin-secreting RINm5F cells. The role of intracellularpolyamines. J Biol Chem 1994;269:30553-30560.
31. Stoian I, Oros A, Moldoveanu E. Apoptosis and free radicals. Biochem MolMed 1996;59:93-97.
32. Hampton MB, Orrenius S. Dual regulation of caspase activity by hydrogenperoxide: implications for apoptosis. FEBS Lett 1997;414:552-556.
33. Southorn PA, Powis G. Free radicals in medicine. II. Involvement in humandisease. Mayo Clin Proc 1988;63:390-408.
34. Halliwell B, Gutteridge JM, Cross CE. Free radicals, antioxidants, and humandisease: Where are we now? J Lab Clin Med 1992;119:598-620.
35. Gutteridge JM. Free radicals in disease processes: a compilation of cause andconsequence. Free Radic Res Commun 1993;19:141-158.

References 63
36. Delanty N, Dichter MA. Oxidative injury in the nervous system. Acta NeurolScand 1998;98:145-153.
37. Sastre J, Pallardo FV, Garcia de la Asuncion J, Vina J. Mitochondria, oxidativestress and aging. Free Radic Res 2000;32:189-198.
38. Machlin LJ. Critical assessment of the epidemiological data concerning theimpact of antioxidant nutrients on cancer and cardiovascular disease. Crit RevFood Sci Nutr 1995;35:41-50.
39. Diplock AT, Charleux JL, Crozier-Willi G, Kok FJ, Rice-Evans C, RoberfroidM, Stahl W, Vina-Ribes J. Functional food science and defence against reactiveoxidative species. Br J Nutr 1998;80:S77-112.
40. Hercberg S, Galan P, Preziosi P, Alfarez MJ, Vazquez C. The potential role ofantioxidant vitamins in preventing cardiovascular diseases and cancers.Nutrition 1998;14:513-520.
41. Kelly FJ. Use of antioxidants in the prevention and treatment of disease.J Int Fed Clin Chem 1998;10:21-23.
42. Halliwell B. Establishing the significance and optimal intake of dietaryantioxidants: the biomarker concept. Nutr Rev 1999;57:104-113.
43. Lee IM. Antioxidant vitamins in the prevention of cancer. Proc Assoc AmPhysicians 1999;111:10-15.
44. Marchioli R. Antioxidant vitamins and prevention of cardiovascular disease:laboratory, epidemiological and clinical trial data. Pharmacol Res 1999;40:227-238.
45. McCall MR, Frei B. Can antioxidant vitamins maternally reduce oxidativedamage in humans? Free Radic Biol Med 1999;26:1034-1053.
46. Wagner BA, Buettner GR, Burns CP. Free radical-mediated lipid peroxidationin cells: oxidizability is a function of cell lipid bis-allylic hydrogen content.Biochemistry 1994;33:4449-4453.
47. Porter NA, Caldwell SE, Mills KA. Mechanisms of free radical oxidation ofunsaturated lipids. Lipids 1995;30:277-290.
48. Samuelsson B, Granström E, Green K, Hamberg M, Hammarström S.Prostaglandins. Annu Rev Biochem 1975;44:669-695.
49. Mitchell JA, Akarasereenont P, Thiemermann C, Flower RJ, Vane JR.Selectivity of nonsteroidal antiinflammatory drugs as inhibitors of constitutiveand inducible cyclooxygenase. Proc Natl Acad Sci U S A 1993;90:11693-11697.
50. Vane J. Towards a better aspirin. Nature 1994;367:215-216.51. Vane JR, Botting RM. A better understanding of anti-inflammatory drugs based
on isoforms of cyclooxygenase (COX-1 and COX-2). Adv ProstaglandinThromboxane Leukot Res 1995;23:41-48.

64 References
52. Fu JY, Masferrer JL, Seibert K, Raz A, Needleman P. The induction andsuppression of prostaglandin H2 synthase (cyclooxygenase) in humanmonocytes. J Biol Chem 1990;265:16737-16740.
53. Xie WL, Chipman JG, Robertson DL, Erikson RL, Simmons DL. Expression ofa mitogen-responsive gene encoding prostaglandin synthase is regulated bymRNA splicing. Proc Natl Acad Sci U S A 1991;88:2692-2696.
54. Slater TF. Overview of methods used for detecting lipid peroxidation. MethodsEnzymol 1984;105:283-293.
55. Wolff SP. Ferrous ion oxidation in presence of ferric ion indicator xyloenolorange for measurement of hydroperoxides. Methods Enzymol 1994;233:182-189.
56. Nourooz-Zadeh J, Tajaddini-Sarmadi J, Wolff SP. Measurement of plasmahydroperoxide concentrations by the ferrous oxidation-xylenol orange assay inconjunction with triphenylphosphine. Anal Biochem 1994;220:403-409.
57. Hicks M, Gebicki JM. A spectrophotometric method for the determination oflipid hydroperoxides. Anal Biochem 1979;99:249-253.
58. El-Saadani M, Esterbauer H, El-Sayed M, Goher M, Nassar AY, Jurgens G. Aspectrophotometric assay for lipid peroxides in serum lipoproteins using acommercially available reagent. J Lipid Res 1989;30:627-630.
59. Gebicki JM, Guille J. Spectrophotometric and high-performancechromatographic assays of hydroperoxides by the iodometric technique. AnalBiochem 1989;176:360-364.
60. Thomas SM, Jessup W, Gebicki JM, Dean RT. A continuous-flow automatedassay for iodometric estimation of hydroperoxides. Anal Biochem1989;176:353-359.
61. Cramer GL, Miller JF Jr., Pendleton RB, Lands WE. Iodometric measurementof lipid hydroperoxides in human plasma. Anal Biochem 1991;193:204-211.
62. Jessup W, Dean RT, Gebicki JM. Iodometric determination of hydroperoxidesin lipids and proteins. Methods Enzymol 1994;233:289-303.
63. O'Gara CY, Maddipati KR, Marnett LJ. A sensitive electrochemical method forquantitative hydroperoxide determination. Chem Res Toxicol 1989;2:295-300.
64. Marshall PJ, Warso MA, Lands WE. Selective microdetermination of lipidhydroperoxides. Anal Biochem 1985;145:192-199.
65. Kulmacz RJ, Miller JF, Jr., Pendleton RB, Lands WE. Cyclooxygenaseinitiation assay for hydroperoxides. Methods Enzymol 1990;186:431-438.
66. Yamamoto Y, Brodsky MH, Baker JC, Ames BN. Detection andcharacterization of lipid hydroperoxides at picomole levels by high-performance liquid chromatography. Anal Biochem 1987;160:7-13.
References 65
67. Frei B, Yamamoto Y, Niclas D, Ames BN. Evaluation of an isoluminolchemiluminescence assay for the detection of hydroperoxides in human bloodplasma. Anal Biochem 1988;175:120-130.
68. Miyazawa T. Determination of phospholipid hydroperoxides in human bloodplasma by a chemiluminescence-HPLC assay. Free Radic Biol Med1989;7:209-217.
69. Zamburlini A, Maiorino M, Barbera P, Roveri A, Ursini F. Direct measurementby single photon counting of lipid hydroperoxides in human plasma andlipoproteins. Anal Biochem 1995;232:107-113.
70. Esterbauer H, Striegl G, Puhl H, Rotheneder M. Continuous monitoring of invitro oxidation of human low density lipoprotein. Free Radic Res Commun1989;6:67-75.
71. Iversen SA, Cawood P, Dormandy TL. A method for the measurement of adiene-conjugated derivative of linoleic acid, 18:2(9,11), in serum phospholipid,and possible origins. Ann Clin Biochem 1985;22:137-140.
72. Dormandy TL, Wickens DG. The experimental and clinical pathology of dieneconjugation. Chem Phys Lipids 1987;45:353-364.
73. Corongiu FP, Banni S. Detection of conjugated dienes by second derivativeultraviolet spectrophotometry. Methods Enzymol 1994;233:303-310.
74. Sinnhuber RO, Yu TC. 2-Thiobarbituric acid method for the measurement ofrancidity in fishery products: II. the quantitative determination ofmalondialdehyde. Food Tech 1957;12:9-12.
75. Ottolenghi A. 2-Thiobarbituric acid (TBA) method. Arch Biochem Biophys1959;77:355
76. Yagi K. Assay for blood plasma or serum. Methods Enzymol 1984;105:328-331.
77. Bird RP, Hung SS, Hadley M, Draper HH. Determination of malonaldehyde inbiological materials by high-pressure liquid chromatography. Anal Biochem1983;128:240-244.
78. Wong SH, Knight JA, Hopfer SM, Zaharia O, Leach CN Jr., Sunderman FW,Jr. Lipoperoxides in plasma as measured by liquid-chromatographic separationof malondialdehyde-thiobarbituric acid adduct. Clin Chem 1987;33:214-220.
79. Chirico S. High-performance liquid chromatography-based thiobarbituric acidtests. Methods Enzymol 1994;233:314-318.
80. Young IS, Trimble ER. Measurement of malondialdehyde in plasma by highperformance liquid chromatography with fluorimetric detection. Ann ClinBiochem 1991;28:504-508.
81. Fukunaga K, Suzuki T, Takama K. Highly sensitive high-performance liquidchromatography for the measurement of malondialdehyde in biologicalsamples. J Chromatogr 1993;621:77-81.

66 References
82. Morrow JD, Hill KE, Burk RF, Nammour TM, Badr KF, Roberts LJ II. A seriesof prostaglandin F2-like compounds are produced in vivo in humans by a non-cyclooxygenase, free radical-catalyzed mechanism. Proc Natl Acad Sci U S A1990;87:9383-9387.
83. Nourooz-Zadeh J, Gopaul NK, Barrow S, Mallet AI, Änggård EE. Analysis ofF2-isoprostanes as indicators of non-enzymatic lipid peroxidation in vivo by gaschromatography-mass spectrometry: development of a solid-phase extractionprocedure. J Chromatogr B Biomed Appl 1995;667:199-208.
84. Pratico D, Lawson JA, FitzGerald GA. Cyclooxygenase-dependent formation ofthe isoprostane, 8-epi prostaglandin F2. J Biol Chem 1995;270:9800-9808.
85. Bachi A, Zuccato E, Baraldi M, Fanelli R, Chiabrando C. Measurement ofurinary 8-Epi-prostaglandin F2α, a novel index of lipid peroxidation in vivo, byimmunoaffinity extraction/gas chromatography-mass spectrometry. Basal levelsin smokers and nonsmokers. Free Radic Biol Med 1996;20:619-624.
86. Wang Z, Ciabattoni G, Creminon C, Lawson J, Fitzgerald GA, Patrono C,Maclouf J. Immunological characterization of urinary 8-epi-prostaglandin F2αexcretion in man. J Pharmacol Exp Ther 1995;275:94-100.
87. Hoffman SW, Roof RL, Stein DG. A reliable and sensitive enzymeimmunoassay method for measuring 8-isoprostaglandin F2α: a marker for lipidperoxidation after experimental brain injury. J Neurosci Methods 1996;68:133-136.
88. Basu S. Radioimmunoassay of 8-iso-prostaglandin F2α: an index for oxidativeinjury via free radical catalysed lipid peroxidation. Prostaglandins LeukotEssent Fatty Acids 1998;58:319-325.
89. Croft KD, Dimmitt SB, Moulton C, Beilin LJ. Low density lipoproteincomposition and oxidizability in coronary disease−apparent favourable effect ofbeta blockers. Atherosclerosis 1992;97:123-130.
90. Princen HM, van Poppel G, Vogelezang C, Buytenhek R, Kok FJ.Supplementation with vitamin E but not β-carotene in vivo protects low densitylipoprotein from lipid peroxidation in vitro. Effect of cigarette smoking.Arterioscler Thromb 1992;12:554-562.
91. Regnstrom J, Nilsson J, Tornvall P, Landou C, Hamsten A. Susceptibility tolow-density lipoprotein oxidation and coronary atherosclerosis in man. Lancet1992;339:1183-1186.
92. Holley AE, Slater TF. Measurement of lipid hydroperoxides in normal humanblood plasma using HPLC-chemiluminescence linked to a diode array detectorfor measuring conjugated dienes. Free Radic Res Commun 1991;15:51-63.
93. Iversen SA, Cawood P, Madigan MJ, Lawson AM, Dormandy TL.Identification of a diene conjugated component of human lipid as octadeca-9,11-dienoic acid. FEBS Lett 1984;171:320-324.

References 67
94. Chin SF, Liu W, Storkson JM, Ha YL, Pariza MW. Dietary sources ofconjugated dienoic isomers of linoleic acid, a newly recognised class ofanticarcinogens. J Food Comp Anal 1992;5:185-197.
95. Britton M, Fong C, Wickens D, Yudkin J. Diet as a source of phospholipidesterified 9,11-octadecadienoic acid in humans. Clin Sci 1992;83:97-101.
96. Jiang J, Wolk A, Vessby B. Relation between the intake of milk fat and theoccurrence of conjugated linoleic acid in human adipose tissue. Am J Clin Nutr1999;70:21-27.
97. Salminen I, Mutanen M, Jauhiainen M, Aro A. Dietary trans fatty acidsincrease conjugated linoleic acid levels in human serum. J Nutr Biochem1998;9:93-98.
98. Jack CI, Ridgway E, Jackson MJ, Hind CR. Serum octadeca-9,11 dienoicacid−an assay of free radical activity or a result of bacterial production? ClinChim Acta 1994;224:139-146.
99. Fairbank J, Ridgway L, Griffin J, Wickens D, Singer A, Dormandy TL.Octadeca-9-11-dienoic acid in diagnosis of cervical intraepithelial neoplasia.Lancet 1988;2:329-330.
100. Thompson S, Smith MT. Measurement of the diene conjugated form of linoleicacid in plasma by high performance liquid chromatography: a questionable non-invasive assay of free radical activity? Chem Biol Interact 1985;55:357-366.
101. Janero DR. Malondialdehyde and thiobarbituric acid-reactivity as diagnosticindices of lipid peroxidation and peroxidative tissue injury. Free Radic BiolMed 1990;9:515-540.
102. McMillan RM, MacIntyre DE, Booth A, Gordon JL. Malonaldehyde formationin intact platelets is catalysed by thromboxane synthase. Biochem J1978;176:595-598.
103. Shimizu T, Kondo K, Hayaishi O. Role of prostaglandin endoperoxides in theserum thiobarbituric acid reaction. Arch Biochem Biophys 1981;206:271-276.
104. Pryor WA, Stanley JP, Blair E. Autoxidation of polyunsaturated fatty acids: II.A suggested mechanism for the formation of TBA-reactive materials fromprostaglandin-like endoperoxides. Lipids 1976;11:370-379.
105. Esterbauer H, Cheeseman KH. Determination of aldehydic lipid peroxidationproducts: malonaldehyde and 4-hydroxynonenal. Methods Enzymol1990;186:407-421.
106. Gutteridge JM. Aspects to consider when detecting and measuring lipidperoxidation. Free Radic Res Commun 1986;1:173-184.
107. Draper HH, Hadley M. Malondialdehyde determination as index of lipidperoxidation. Methods Enzymol 1990;186:421-431.
108. Draper HH, Squires EJ, Mahmoodi H, Wu J, Agarwal S, Hadley M. Acomparative evaluation of thiobarbituric acid methods for the determination of

68 References
malondialdehyde in biological materials. Free Radic Biol Med 1993;15:353-363.
109. Gutteridge JM, Quinlan GJ. Malondialdehyde formation from lipid peroxides inthe thiobarbituric acid test: the role of lipid radicals, iron salts, and metalchelators. J Appl Biochem 1983;5:293-299.
110. Gutteridge JM, Tickner TR. The thiobarbituric acid-reactivity of bile pigments.Biochem Med 1978;19:127-132.
111. Gutteridge JM. Thiobarbituric acid-reactivity following iron-dependent free-radical damage to amino acids and carbohydrates. FEBS Lett 1981;128:343-346.
112. Kosugi H, Kato T, Kikugawa K. Formation of yellow, orange, and red pigmentsin the reaction of alk-2-enals with 2-thiobarbituric acid. Anal Biochem1987;165:456-464.
113. Chirico S, Smith C, Marchant C, Mitchinson MJ, Halliwell B. Lipidperoxidation in hyperlipidaemic patients. A study of plasma using an HPLC-based thiobarbituric acid test. Free Radic Res Commun 1993;19:51-57.
114. Öhrvall M, Tengblad S, Ekstrand B, Siegbahn A, Vessby B. Malondialdehydeconcentration in plasma is inversely correlated to the proportion of linoleic acidin serum lipoprotein lipids. Atherosclerosis 1994;108:103-110.
115. Pryor WA, Castle L. Chemical methods for the detection of lipidhydroperoxides. Methods Enzymol 1984;105:293-299.
116. Nourooz-Zadeh J, Tajaddini-Sarmadi J, Ling KL, Wolff SP. Low-densitylipoprotein is the major carrier of lipid hydroperoxides in plasma. Relevance todetermination of total plasma lipid hydroperoxide concentrations. Biochem J1996;313:781-786.
117. Yamamoto Y, Niki E. Presence of cholesteryl ester hydroperoxide in humanblood plasma. Biochem Biophys Res Commun 1989;165:988-993.
118. Miyazawa T, Fujimoto K, Suzuki T, Yasuda K. Determination of phospholipidhydroperoxides using luminol chemiluminescence−high-performance liquidchromatography. Methods Enzymol 1994;233:324-332.
119. Yamamoto Y. Chemiluminescence-based high-performance liquidchromatography assay of lipid hydroperoxides. Methods Enzymol1994;233:319-324.
120. Coghlan JG, Flitter WD, Holley AE, Norell M, Mitchell AG, Ilsley CD, SlaterTF. Detection of free radicals and cholesterol hydroperoxides in blood takenfrom the coronary sinus of man during percutaneous transluminal coronaryangioplasty. Free Radic Res Commun 1991;14:409-417.
121. Zamburlini A, Maiorino M, Barbera P, Pastorino AM, Roveri A, Cominacini L,Ursini F. Measurement of lipid hydroperoxides in plasma lipoproteins by a newhighly-sensitive 'single photon counting' luminometer. Biochim Biophys Acta1995;1256:233-240.

References 69
122. Nourooz-Zadeh J. Ferrous ion oxidation in presence of xylenol orange fordetection of lipid hydroperoxides in plasma. Methods Enzymol 1999;300:58-62.
123. Nourooz-Zadeh J, Tajaddini-Sarmadi J, McCarthy S, Betteridge DJ, Wolff SP.Elevated levels of authentic plasma hydroperoxides in NIDDM. Diabetes1995;44:1054-1058.
124. Nourooz-Zadeh J, Rahimi A, Tajaddini-Sarmadi J, Tritschler H, Rosen P,Halliwell B, Betteridge DJ. Relationships between plasma measures ofoxidative stress and metabolic control in NIDDM. Diabetologia 1997;40:647-653.
125. Santini SA, Marra G, Giardina B, Cotroneo P, Mordente A, Martorana GE,Manto A, Ghirlanda G. Defective plasma antioxidant defenses and enhancedsusceptibility to lipid peroxidation in uncomplicated IDDM. Diabetes1997;46:1853-1858.
126. Nuttall SL, Dunne F, Kendall MJ, Martin U. Age-independent oxidative stressin elderly patients with non-insulin-dependent diabetes mellitus. QJM1999;92:33-38.
127. Epperlein MM, Nourooz-Zadeh J, Jayasena SD, Hothersall JS, Noronha-DutraA, Neild GH. Nature and biological significance of free radicals generatedduring bicarbonate hemodialysis. J Am Soc Nephrol 1998;9:457-463.
128. Nourooz-Zadeh J. Effect of dialysis on oxidative stress in uraemia. Redox Rep1999;4:17-22.
129. Buffon A, Santini SA, Ramazzotti V, Rigattieri S, Liuzzo G, Biasucci LM, CreaF, Giardina B, Maseri A. Large, sustained cardiac lipid peroxidation andreduced antioxidant capacity in the coronary circulation after brief episodes ofmyocardial ischemia. J Am Coll Cardiol 2000;35:633-639.
130. Rigattieri S, Buffon A, Ramazzotti V, Mordente A, Crea F, Maseri A, GiardinaB, Santini SA. Oxidative stress in ischemia-reperfusion injury: assessment bythree independent biochemical markers. Ital Heart J 2000;1:68-72.
131. Lawson JA, Rokach J, FitzGerald GA. Isoprostanes; formation, analysis and useas indices of lipid peroxidation in vivo. J Biol Chem 1999;274:24441-24444.
132. Morrow JD, Roberts LJ II. Mass spectrometric quantification of F2-isoprostanesin biological fluids and tissues as measure of oxidant stress. Methods Enzymol1999;300:3-12.
133. Roberts LJ II, Morrow JD. Measurement of F2-isoprostanes as an index ofoxidative stress in vivo. Free Radic Biol Med 2000;28:505-513.
134. Morrow JD, Awad JA, Boss HJ, Blair IA, Roberts LJ II. Non-cyclooxygenase-derived prostanoids (F2-isoprostanes) are formed in situ on phospholipids. ProcNatl Acad Sci U S A 1992;89:10721-10725.

70 References
135. Awad JA, Morrow JD, Takahashi K, Roberts LJ II. Identification of non-cyclooxygenase-derived prostanoid (F2- isoprostane) metabolites in humanurine and plasma. J Biol Chem 1993;268:4161-4169.
136. Basu S. Metabolism of 8-iso-prostaglandin F2α. FEBS Lett 1998;428:32-36.137. Morrow JD, Roberts LJ II. The isoprostanes. Current knowledge and directions
for future research. Biochem Pharmacol 1996;51:1-9.138. Nourooz-Zadeh J, Halliwell B, Änggård EE. Evidence for the formation of
F3-isoprostanes during peroxidation of eicosapentaenoic acid. Biochem BiophysRes Commun 1997;236:467-472.
139. Nourooz-Zadeh J, Liu EH, Änggård E, Halliwell B. F4-isoprostanes: a novelclass of prostanoids formed during peroxidation of docosahexaenoic acid(DHA). Biochem Biophys Res Commun 1998;242:338-344.
140. Morrow JD, Minton TA, Mukundan CR, Campbell MD, Zackert WE, DanielVC, Badr KF, Blair IA, Roberts LJ II. Free radical-induced generation ofisoprostanes in vivo. Evidence for the formation of D-ring and E-ringisoprostanes. J Biol Chem 1994;269:4317-4326.
141. Roberts LJ II, Montine TJ, Markesbery WR, Tapper AR, Hardy P, Chemtob S,Dettbarn WD, Morrow JD. Formation of isoprostane-like compounds(neuroprostanes) in vivo from docosahexaenoic acid. J Biol Chem1998;273:13605-13612.
142. Gopaul NK, Nourooz-Zadeh J, Mallet AI, Änggård EE. Formation ofF2-isoprostanes during aortic endothelial cell-mediated oxidation of low densitylipoprotein. FEBS Lett 1994;348:297-300.
143. Morrow JD, Minton TA, Badr KF, Roberts LJ II. Evidence that theF2-isoprostane, 8-epi-prostaglandin F2α, is formed in vivo. Biochim BiophysActa 1994;1210:244-248.
144. Banerjee M, Kang KH, Morrow JD, Roberts LJ II, Newman JH. Effects of anovel prostaglandin, 8-epi-PGF2α, in rabbit lung in situ. Am J Physiol1992;263:H660-663.
145. Takahashi K, Nammour TM, Fukunaga M, Ebert J, Morrow JD, Roberts LJ II,Hoover RL, Badr KF. Glomerular actions of a free radical-generated novelprostaglandin, 8-epi-prostaglandin F2α, in the rat. Evidence for interaction withthromboxane A2 receptors. J Clin Invest 1992;90:136-141.
146. Kang KH, Morrow JD, Roberts LJ II, Newman JH, Banerjee M. Airway andvascular effects of 8-epi-prostaglandin F2α in isolated perfused rat lung. J ApplPhysiol 1993;74:460-465.
147. Pratico D, FitzGerald GA. Generation of 8-epiprostaglandin F2α by humanmonocytes. Discriminate production by reactive oxygen species andprostaglandin endoperoxide synthase-2. J Biol Chem 1996;271:8919-8924.

References 71
148. Pratico D, Barry OP, Lawson JA, Adiyaman M, Hwang SW, Khanapure SP,Iuliano L, Rokach J, FitzGerald GA. IPF2α-I: an index of lipid peroxidation inhumans. Proc Natl Acad Sci U S A 1998;95:3449-3454.
149. Morrow JD, Harris TM, Roberts LJ II. Noncyclooxygenase oxidative formationof a series of novel prostaglandins: analytical ramifications for measurement ofeicosanoids. Anal Biochem 1990;184:1-10.
150. Nourooz-Zadeh J. Gas chromatography-mass spectrometry assay formeasurement of plasma isoprostanes. Methods Enzymol 1999;300:13-17.
151. Helmersson J, Basu S. F2-isoprostane excretion rate and diurnal variation inhuman urine. Prostaglandins Leukot Essent Fatty Acids 1999;61:203-205.
152. Richelle M, Turini ME, Guidoux R, Tavazzi I, Metairon S, Fay LB. Urinaryisoprostane excretion is not confounded by the lipid content of the diet. FEBSLett 1999;459:259-262.
153. Gopaul NK, Halliwell B, Änggård EE. Measurement of plasma F2-isoprostanesas an index of lipid peroxidation does not appear to be confounded by diet. FreeRadic Res 2000;33:115-127.
154. Gopaul NK, Nourooz-Zadeh J, Mallet AI, Änggård EE. Formation of PGF2-isoprostanes during the oxidative modification of low density lipoprotein.Biochem Biophys Res Commun 1994;200:338-343.
155. Lynch SM, Morrow JD, Roberts LJ II, Frei B. Formation of non-cyclooxygenase-derived prostanoids (F2-isoprostanes) in plasma and lowdensity lipoprotein exposed to oxidative stress in vitro. J Clin Invest1994;93:998-1004.
156. Morrow JD, Awad JA, Kato T, Takahashi K, Badr KF, Roberts LJ II, Burk RF.Formation of novel non-cyclooxygenase-derived prostanoids (F2-isoprostanes)in carbon tetrachloride hepatotoxicity. An animal model of lipid peroxidation. JClin Invest 1992;90:2502-2507.
157. Awad JA, Burk RF, Roberts LJ II. Effect of selenium deficiency andglutathione-modulating agents on diquat toxicity and lipid peroxidation in rats.J Pharmacol Exp Ther 1994;270:858-864.
158. Mathews WR, Guido DM, Fisher MA, Jaeschke H. Lipid peroxidation asmolecular mechanism of liver cell injury during reperfusion after ischemia. FreeRadic Biol Med 1994;16:763-770.
159. Nanji AA, Khwaja S, Tahan SR, Sadrzadeh SM. Plasma levels of a novelnoncyclooxygenase-derived prostanoid (8-isoprostane) correlate with severityof liver injury in experimental alcoholic liver disease. J Pharmacol Exp Ther1994;269:1280-1285.
160. Burk RF, Hill KE, Awad JA, Morrow JD, Kato T, Cockell KA, Lyons PR.Pathogenesis of diquat-induced liver necrosis in selenium-deficient rats:assessment of the roles of lipid peroxidation and selenoprotein P. Hepatology1995;21:561-569.

72 References
161. Basu S, Eriksson M. Oxidative injury and survival during endotoxemia. FEBSLett 1998;438:159-160.
162. Basu S. Oxidative injury induced cyclooxygenase activation in experimentalhepatotoxicity. Biochem Biophys Res Commun 1999;254:764-767.
163. Basu S, Eriksson M. Lipid peroxidation induced by an early inflammatoryresponse in endotoxiaemia. Acta Anaesthesiol Scand 2000;44:17-23.
164. Basu S, Eriksson M. Vitamin E in relation to lipid peroxidation in experimentalseptic shock [In Process Citation]. Prostaglandins Leukot Essent Fatty Acids2000;62:195-199.
165. Basu S, Nozari A, Liu XL, Rubertsson S, Wiklund L. Development of a novelbiomarker of free radical damage in reperfusion injury after cardiac arrest.FEBS Lett 2000;470:1-6.
166. Nanji AA, Khwaja S, Sadrzadeh SM. Eicosanoid production in experimentalalcoholic liver disease is related to vitamin E levels and lipid peroxidation. MolCell Biochem 1994;140:85-89.
167. Palmer AM, Thomas CR, Gopaul N, Dhir S, Änggård EE, Poston L, Tribe RM.Dietary antioxidant supplementation reduces lipid peroxidation but impairsvascular function in small mesenteric arteries of the streptozotocin-diabetic rat.Diabetologia 1998;41:148-156.
168. Pratico D, Tangirala RK, Rader DJ, Rokach J, FitzGerald GA. Vitamin Esuppresses isoprostane generation in vivo and reduces atherosclerosis in ApoE-deficient mice. Nat Med 1998;4:1189-1192.
169. Reckelhoff JF, Kanji V, Racusen LC, Schmidt AM, Yan SD, Marrow J, RobertsLJ II, Salahudeen AK. Vitamin E ameliorates enhanced renal lipid peroxidationand accumulation of F2-isoprostanes in aging kidneys. Am J Physiol1998;274:R767-774.
170. Kanji VK, Wang C, Salahudeen AK. Vitamin E suppresses cyclosporine A-induced increase in the urinary excretion of arachidonic acid metabolitesincluding F2-isoprostanes in the rat model. Transplant Proc 1999;31:1724-1728.
171. Laight DW, Desai KM, Gopaul NK, Änggård EE, Carrier MJ. F2-isoprostaneevidence of oxidant stress in the insulin resistant, obese Zucker rat: effects ofvitamin E. Eur J Pharmacol 1999;377:89-92.
172. Salahudeen A, Nawaz M, Poovala V, Kanji V, Wang C, Morrow J, Roberts LJII. Cold storage induces time-dependent F2-isoprostane formation in renaltubular cells and rat kidneys. Kidney Int 1999;55:1759-1762.
173. Morrow JD, Frei B, Longmire AW, Gaziano JM, Lynch SM, Shyr Y, StraussWE, Oates JA, Roberts LJ II. Increase in circulating products of lipidperoxidation (F2-isoprostanes) in smokers. Smoking as a cause of oxidativedamage. N Engl J Med 1995;332:1198-1203.
174. Reilly M, Delanty N, Lawson JA, FitzGerald GA. Modulation of oxidant stressin vivo in chronic cigarette smokers. Circulation 1996;94:19-25.

References 73
175. Gopaul NK, Änggård EE, Mallet AI, Betteridge DJ, Wolff SP, Nourooz-ZadehJ. Plasma 8-epi-PGF2α levels are elevated in individuals with non- insulindependent diabetes mellitus. FEBS Lett 1995;368:225-229.
176. Davi G, Ciabattoni G, Consoli A, Mezzetti A, Falco A, Santarone S, Pennese E,Vitacolonna E, Bucciarelli T, Costantini F, Capani F, Patrono C. In vivoformation of 8-iso-prostaglandin F2α and platelet activation in diabetes mellitus:effects of improved metabolic control and vitamin E supplementation.Circulation 1999;99:224-229.
177. Delanty N, Reilly MP, Pratico D, Lawson JA, McCarthy JF, Wood AE, OhnishiST, Fitzgerald DJ, FitzGerald GA. 8-epi PGF2α generation during coronaryreperfusion. A potential quantitative marker of oxidant stress in vivo.Circulation 1997;95:2492-2499.
178. Reilly MP, Delanty N, Roy L, Rokach J, Callaghan PO, Crean P, Lawson JA,FitzGerald GA. Increased formation of the isoprostanes IPF2α-I and8-epi-prostaglandin F2α in acute coronary angioplasty: evidence for oxidantstress during coronary reperfusion in humans. Circulation 1997;96:3314-3320.
179. Davi G, Alessandrini P, Mezzetti A, Minotti G, Bucciarelli T, Costantini F,Cipollone F, Bon GB, Ciabattoni G, Patrono C. In vivo formation of8-Epi-prostaglandin F2α is increased in hypercholesterolemia. ArteriosclerThromb Vasc Biol 1997;17:3230-3235.
180. Gniwotta C, Morrow JD, Roberts LJ II, Kuhn H. Prostaglandin F2-likecompounds, F2-isoprostanes, are present in increased amounts in humanatherosclerotic lesions. Arterioscler Thromb Vasc Biol 1997;17:3236-3241.
181. Pratico D, Iuliano L, Mauriello A, Spagnoli L, Lawson JA, Rokach J, MacloufJ, Violi F, FitzGerald GA. Localization of distinct F2-isoprostanes in humanatherosclerotic lesions. J Clin Invest 1997;100:2028-2034.
182. Pratico D, Iuliano L, Basili S, Ferro D, Camastra C, Cordova C, FitzGerald GA,Violi F. Enhanced lipid peroxidation in hepatic cirrhosis. J Investig Med1998;46:51-57.
183. Salmon JA. Measurement of eicosanoids by bioassay and radioimmunoassay.Br Med Bull 1983;39:227-231.
184. Basu S. Radioimmunoassay of 15-keto-13,14-dihydro-prostaglandin F2α: anindex for inflammation via cyclooxygenase catalysed lipid peroxidation.Prostaglandins Leukot Essent Fatty Acids 1998;58:347-352.
185. Basu S, Smedman A, Vessby B. Conjugated linoleic acid induces lipidperoxidation in humans. FEBS Lett 2000;468:33-36.
186. Basu S, Kindahl H. Development of a continuous blood collection techniqueand a detailed study of prostaglandin F2α release during luteolysis and earlypregnancy in heifers. J Vet Med A 1987;34:487-500.

74 References
187. Basu S, Kindahl H, Harvey D, Betteridge KJ. Metabolites of PGF2α in bloodplasma and urine as parameters of PGF2α release in cattle. Acta Vet Scand1987;28:409-420.
188. Brent JA, Rumack BH. Role of free radicals in toxic hepatic injury. II. Are freeradicals the cause of toxin-induced liver injury? J Toxicol Clin Toxicol1993;31:173-196.
189. McGregor D, Lang M. Carbon tetrachloride: genetic effects and other modes ofaction. Mutat Res 1996;366:181-195.
190. Poli G, Albano E, Dianzani MU. The role of lipid peroxidation in liver damage.Chem Phys Lipids 1987;45:117-142.
191. Recknagel RO, Glende EA, Jr., Dolak JA, Waller RL. Mechanisms of carbontetrachloride toxicity. Pharmacol Ther 1989;43:139-154.
192. Awad JA, Morrow JD. Excretion of F2-isoprostanes in bile: a novel index ofhepatic lipid peroxidation. Hepatology 1995;22:962-968.
193. Martin MJ, Hulley SB, Browner WS, Kuller LH, Wentworth D. Serumcholesterol, blood pressure, and mortality: implications from a cohort of361,662 men. Lancet 1986;2:933-936.
194. Kromhout D, Menotti A, Bloemberg B, Aravanis C, Blackburn H, Buzina R,Dontas AS, Fidanza F, Giampaoli S, Jansen A, et al. Dietary saturated and transfatty acids and cholesterol and 25-year mortality from coronary heart disease:the Seven Countries Study. Prev Med 1995;24:308-315.
195. Posner BM, Cobb JL, Belanger AJ, Cupples LA, D'Agostino RB, Stokes Jd.Dietary lipid predictors of coronary heart disease in men. The FraminghamStudy. Arch Intern Med 1991;151:1181-1187.
196. Steinberg D. Oxidative modification of LDL and atherogenesis. Circulation1997;95:1062-1071.
197. Yla-Herttuala S. Is oxidized low-density lipoprotein present in vivo? Curr OpinLipidol 1998;9:337-344.
198. Steinberg D, Parthasarathy S, Carew TE, Khoo JC, Witztum JL. Beyondcholesterol. Modifications of low-density lipoprotein that increase itsatherogenicity. N Engl J Med 1989;320:915-924.
199. Witztum JL, Steinberg D. Role of oxidized low density lipoprotein inatherogenesis. J Clin Invest 1991;88:1785-1792.
200. Esterbauer H, Gebicki J, Puhl H, Jurgens G. The role of lipid peroxidation andantioxidants in oxidative modification of LDL. Free Radic Biol Med1992;13:341-390.
201. Steinberg D. Low density lipoprotein oxidation and its pathobiologicalsignificance. J Biol Chem 1997;272:20963-20966.

References 75
202. Mensink RP, Katan MB. Effect of dietary fatty acids on serum lipids andlipoproteins. A meta-analysis of 27 trials. Arterioscler Thromb 1992;12:911-919.
203. Caggiula AW, Mustad VA. Effects of dietary fat and fatty acids on coronaryartery disease risk and total and lipoprotein cholesterol concentrations:epidemiologic studies. Am J Clin Nutr 1997;65:1597S-1610S.
204. McDonald BE, Gerrard JM, Bruce VM, Corner EJ. Comparison of the effect ofcanola oil and sunflower oil on plasma lipids and lipoproteins and on in vivothromboxane A2 and prostacyclin production in healthy young men. Am J ClinNutr 1989;50:1382-1388.
205. Wardlaw GM, Snook JT, Lin MC, Puangco MA, Kwon JS. Serum lipid andapolipoprotein concentrations in healthy men on diets enriched in either canolaoil or safflower oil. Am J Clin Nutr 1991;54:104-110.
206. Valsta LM, Jauhiainen M, Aro A, Katan MB, Mutanen M. Effects of amonounsaturated rapeseed oil and a polyunsaturated sunflower oil diet onlipoprotein levels in humans. Arterioscler Thromb 1992;12:50-57.
207. Nydahl M, Gustafsson IB, Öhrvall M, Vessby B. Similar serum lipoproteincholesterol concentrations in healthy subjects on diets enriched with rapeseedand with sunflower oil. Eur J Clin Nutr 1994;48:128-137.
208. Tsimikas S, Reaven PD. The role of dietary fatty acids in lipoprotein oxidationand atherosclerosis. Curr Opin Lipidol 1998;9:301-307.
209. Eritsland J. Safety considerations of polyunsaturated fatty acids. Am J Clin Nutr2000;71:197S-201S.
210. Sandström B, Lyhne N, Pedersen JI, Aro A, Thorsdóttir I, Becker W. NordicNutrition Recommendations. Scand J Nutr/Näringsforskning 1996;40:161-165.
211. Sanders TA. Polyunsaturated fatty acids in the food chain in Europe. Am J ClinNutr 2000;71:176S-178S.
212. Lichtenstein AH, Ausman LM, Carrasco W, Jenner JL, Gualtieri LJ, GoldinBR, Ordovas JM, Schaefer EJ. Effects of canola, corn, and olive oils on fastingand postprandial plasma lipoproteins in humans as part of a NationalCholesterol Education Program Step 2 diet. Arterioscler Thromb 1993;13:1533-1542.
213. Gustafsson IB, Vessby B, Öhrvall M, Nydahl M. A diet rich inmonounsaturated rapeseed oil reduces the lipoprotein cholesterol concentrationand increases the relative content of n-3 fatty acids in serum in hyperlipidemicsubjects. Am J Clin Nutr 1994;59:667-674.
214. Nydahl M, Gustafsson IB, Öhrvall M, Vessby B. Similar effects of rapeseed oil(canola oil) and olive oil in a lipid-lowering diet for patients withhyperlipoproteinemia. J Am Coll Nutr 1995;14:643-651.
215. Becker W. Dietary guidelines and patterns of food and nutrient intake inSweden. Br J Nutr 1999;81:S113-S117.

76 References
216. Boberg M, Croon LB, Gustafsson IB, Vessby B. Platelet fatty acid compositionin relation to fatty acid composition in plasma and to serum lipoprotein lipids inhealthy subjects with special reference to the linoleic acid pathway. Clin Sci1985;68:581-587.
217. Havel RJ, Eder HA, Bragdon JH. The determination and chemical compositionof ultracentrifugically separated lipoproteins in human serum. J Clin Invest1955;34:1345-1353.
218. Seigler L, Wu WT. Separation of serum high-density lipoprotein for cholesteroldetermination: ultracentrifugation vs precipitation with sodiumphosphotungstate and magnesium chloride. Clin Chem 1981;27:838-841.
219. Öhrvall M, Tengblad S, Vessby B. Lower tocopherol serum levels in subjectswith abdominal adiposity. J Intern Med 1993;234:53-60.
220. Thurnham DI, Davies JA, Crump BJ, Situnayake RD, Davis M. The use ofdifferent lipids to express serum tocopherol: lipid ratios for the measurement ofvitamin E status. Ann Clin Biochem 1986;23:514-520.
221. Whitehead TP, Thorpe GHG, Maxwell SRJ. Enhanced chemiluminescent assayfor antioxidant capacity in fluids. Anal Chim Acta 1992;266:265-277.
222. Öhrvall M, Nälsén C, Vessby B. Vitamin E improves the antioxidative capacitybut not the insulin sensitivity in elderly men. Nutr Metab Cardiovasc Dis1997;9-15.
223. Royston P. Estimating departure from normality. Statist Med 1991;10:1283-1293.
224. Bland JM, Altman DG. Statistical methods for assessing agreement betweentwo methods of clinical measurement. Lancet 1986;1:307-310.
225. Morris DF. Multivariate statistical methods. New York: McGraw-Hill; 1976.226. Jones B, Kenward MG. Monographs on statistics and applied probability 34:
Design and analysis of cross-over trials. London: Chapman and Hall; 1989.227. Esterbauer H. Estimation of peroxidative damage. A critical review. Pathol Biol
(Paris) 1996;44:25-28.228. England T, Beatty E, Rehman A, Nourooz-Zadeh J, Pereira P, O'Reilly J,
Wiseman H, Geissler C, Halliwell B. The steady-state levels of oxidative DNAdamage and of lipid peroxidation (F2-isoprostanes) are not correlated in healthyhuman subjects. Free Radic Res 2000;32:355-362.
229. Nuttall SL, Martin U, Sinclair AJ, Kendall MJ. Glutathione: in sickness and inhealth. Lancet 1998;351:645-646.
230. Aleynik SI, Leo MA, Ma X, Aleynik MK, Lieber CS.Polyenylphosphatidylcholine prevents carbon tetrachloride-induced lipidperoxidation while it attenuates liver fibrosis. J Hepatol 1997;27:554-561.

References 77
231. Awad JA, Morrow JD, Hill KE, Roberts LJ II, Burk RF. Detection andlocalization of lipid peroxidation in selenium- and vitamin E-deficient rats usingF2-isoprostanes. J Nutr 1994;124:810-816.
232. Kappus H, Diplock AT. Tolerance and safety of vitamin E: a toxicologicalposition report. Free Radic Biol Med 1992;13:55-74.
233. Visioli F, Colombo C, Galli C. Oxidation of individual fatty acids yieldsdifferent profiles of oxidation markers. Biochem Biophys Res Commun1998;245:487-489.
234. Bonanome A, Pagnan A, Biffanti S, Opportuno A, Sorgato F, Dorella M,Maiorino M, Ursini F. Effect of dietary monounsaturated and polyunsaturatedfatty acids on the susceptibility of plasma low density lipoproteins to oxidativemodification. Arterioscler Thromb 1992;12:529-533.
235. Abbey M, Belling GB, Noakes M, Hirata F, Nestel PJ. Oxidation of low-densitylipoproteins: intraindividual variability and the effect of dietary linoleatesupplementation. Am J Clin Nutr 1993;57:391-398.
236. Reaven P, Parthasarathy S, Grasse BJ, Miller E, Steinberg D, Witztum JL.Effects of oleate-rich and linoleate-rich diets on the susceptibility of low densitylipoprotein to oxidative modification in mildly hypercholesterolemic subjects.J Clin Invest 1993;91:668-676.
237. Berry EM, Eisenberg S, Haratz D, Friedlander Y, Norman Y, Kaufmann NA,Stein Y. Effects of diets rich in monounsaturated fatty acids on plasmalipoproteins−the Jerusalem Nutrition Study: high MUFAs vs high PUFAs. Am JClin Nutr 1991;53:899-907.
238. Turpeinen AM, Basu S, Mutanen M. A high linoleic acid diet increasesoxidative stress in vivo and affects nitric oxide metabolism in humans.Prostaglandins Leukot Essent Fatty Acids 1998;59:229-233.
239. Jenkinson A, Franklin MF, Wahle K, Duthie GG. Dietary intakes ofpolyunsaturated fatty acids and indices of oxidative stress in human volunteers.Eur J Clin Nutr 1999;53:523-528.
240. Nair PP, Judd JT, Berlin E, Taylor PR, Shami S, Sainz E, Bhagavan HN.Dietary fish oil-induced changes in the distribution of α-tocopherol, retinol, andβ-carotene in plasma, red blood cells, and platelets: modulation by vitamin E.Am J Clin Nutr 1993;58:98-102.
241. Gustafsson I, Öhrvall M, Ekstrand B, Vessby B. Moderate amounts of n-3 fattyacid enriched seafood products are effective in lowering serum triglycerides andblood pressure in healthy subjects. J Hum Nutr Diet 1996;9:135-145.
242. Allard JP, Kurian R, Aghdassi E, Muggli R, Royall D. Lipid peroxidationduring n-3 fatty acid and vitamin E supplementation in humans. Lipids1997;32:535-541.
243. Foulon T, Richard MJ, Payen N, Bourrain JL, Beani JC, Laporte F, Hadjian A.Effects of fish oil fatty acids on plasma lipids and lipoproteins and oxidant-

78 References
antioxidant imbalance in healthy subjects. Scand J Clin Lab Invest1999;59:239-248.
244. Gustafsson I, Öhrvall M, Ekstrand B, Vessby B. No effects on insulinsensitivity but diverging effects on serum free fatty acid concentrations byaddition of seafood products containing either n-3 or n-6 fatty acids. NutrMetab Cardiovasc Dis 1998;8:145-153.
245. Turpeinen AM, Alfthan G, Valsta L, Hietanen E, Salonen JT, Schunk H,Nyyssonen K, Mutanen M. Plasma and lipoprotein lipid peroxidation in humanson sunflower and rapeseed oil diets. Lipids 1995;30:485-492.
246. Valsta LM, Salminen I, Aro A, Mutanen M. Alpha-linolenic acid in rapeseed oilpartly compensates for the effect of fish restriction on plasma long chain n-3fatty acids. Eur J Clin Nutr 1996;50:229-235.
247. Becker W. Svenskarna äter nyttigare - allt fler väljer grönt (in Swedish). Vårföda 1999;1:24-27.
248. Öhrvall M, Sundlöf G, Vessby B. Gamma, but not alpha, tocopherol levels inserum are reduced in coronary heart disease patients. J Intern Med1996;239:111-117.
249. Kontush A, Spranger T, Reich A, Baum K, Beisiegel U. Lipophilic antioxidantsin blood plasma as markers of atherosclerosis: the role of α-carotene andγ-tocopherol. Atherosclerosis 1999;144:117-122.
250. Kristenson M, Zieden B, Kucinskiene Z, Elinder LS, Bergdahl B, Elwing B,Abaravicius A, Razinkoviene L, Calkauskas H, Olsson AG. Antioxidant stateand mortality from coronary heart disease in Lithuanian and Swedish men:concomitant cross sectional study of men aged 50. BMJ 1997;314:629-633.
251. De Lorgeril M, Salen P, Martin JL, Monjaud I, Delaye J, Mamelle N.Mediterranean diet, traditional risk factors, and the rate of cardiovascularcomplications after myocardial infarction: final report of the Lyon Diet HeartStudy. Circulation 1999;99:779-785.
252. Trichopoulou A, Vasilopoulou E, Lagiou A. Mediterranean diet and coronaryheart disease: are antioxidants critical? Nutr Rev 1999;57:253-255.
253. Jacob RA. Evidence that diet modification reduces in vivo oxidant damage.Nutr Rev 1999;57:255-258.
254. Verhagen H, Poulsen HE, Loft S, van Poppel G, Willems MI, van Bladeren PJ.Reduction of oxidative DNA-damage in humans by brussels sprouts.Carcinogenesis 1995;16:969-970.
255. Rehman A, Bourne LC, Halliwell B, Rice-Evans CA. Tomato consumptionmodulates oxidative DNA damage in humans. Biochem Biophys Res Commun1999;262:828-831.
256. Palmer HJ, Paulson KE. Reactive oxygen species and antioxidants in signaltransduction and gene expression. Nutr Rev 1997;55:353-361.