linking motor-related brain potentials and velocity...
TRANSCRIPT

ORIGINAL RESEARCH ARTICLEpublished: 29 April 2014
doi: 10.3389/fnhum.2014.00271
Linking motor-related brain potentials and velocity profilesin multi-joint arm reaching movementsJulià L. Amengual1*, Josep Marco-Pallarés1,2, Carles Grau3, Thomas F. Münte4 and
Antoni Rodríguez-Fornells1,2,5
1 Cognition and Brain Plasticity Unit, Department of Basic Psychology, University of Barcelona, Barcelona, Spain2 Bellvitge Biomedical Research Institute (IDIBELL), Hospitalet de Llobregat, Spain3 Neurodynamic Laboratory, Department of Psychiatry and Clinical Psychobiology, Universitat de Barcelona, Barcelona, Spain4 Department of Neurology, University of Lübeck, Lübeck, Germany5 Institució Catalana de Recerca i Estudis Avançats, Barcelona, Spain
Edited by:
Klaus Gramann, Berlin Institute ofTechnology, Germany
Reviewed by:
Hirokazu Tanaka, Japan AdvancedInstitute of Science and Technology,JapanFranck Vidal, Aix-MarseilleUniversité, France
*Correspondence:
Julià L. Amengual, Cognition andBrain Plasticity Unit, Department ofBasic Psychology (CampusBellvitge), University of Barcelona,C/Feixa Llarga S/N 08107, Hospitaletde Llobregat, Barcelona, Spaine-mail: [email protected]
The study of the movement related brain potentials (MRPBs) needs accurate technicalapproaches to disentangle the specific patterns of bran activity during the preparation andexecution of movements. During the last forty years, synchronizing the electromyographicactivation (EMG) of the muscle with electrophysiological recordings (EEG) has beencommonly ussed for these purposes. However, new clinical approaches in the study ofmotor diseases and rehabilitation suggest the demand of new paradigms that might gofurther into the study of the brain activity associated with the kinematics of movements.As a response to this call, we have used a 3-D hand-tracking system with the aim torecord continuously the position of an ultrasonic sender attached to the hand duringthe performance of multi-joint self-paced movements. We synchronized time-series ofposition and velocity of the sender with the EEG recordings, obtaining specific patterns ofbrain activity as a function of the fluctuations of the kinematics during natural movementperformance. Additionally, the distribution of the brain activity during the preparation andexecution phases of movements was similar that reported previously using the EMG,suggesting the validity of our technique. We claim that this paradigm could be usable inpatients because of its simplicity and the potential knowledge that can be extracted fromclinical protocols.
Keywords: motor related brain potentials, 3-D movement analyser, time-series analysis, kinematics, self-paced
movement, motor activity
INTRODUCTIONOver the lasts 40 years, the electrophysiological brain activity(EEG) associated with the preparation and execution of move-ments has been widely described. The Bereitschaftspotential (BP)(Kornhuber and Deecke, 1965), also termed readiness poten-tial, is a slow negativity starting 1.5–2 s before the onset of themovement that shows a wide scalp distribution being maximalover centro-parietal regions. In addition to the BP itself, a set ofcomponents related with to the preparation and the executionof movements has been identified, being known as movement-related brain potentials (MRBPs) (see Shibasaki and Hallett, 2006,for a review). Furthermore, during the preparation and executionof voluntary movements, a characteristic modulation of the oscil-latory brain activity power within the beta (17–24 Hz) and themu (8–13 Hz) bands has been largely described (Pfurtscheller andAranibar, 1977, 1979; Pfurtscheller et al., 2003; Jurkiewicz et al.,2006).
In order to give a more fine-grained characterization of theneural sources of these potentials and the associated oscillatorybrain activity, several studies have used the Laplacian transformedactivity of the EEG obtaining the current source density (CSD)waveforms (Nunez, 2002; Carbonnell et al., 2004; Kayser et al.,2010; Meckler et al., 2010; Tenke and Kayser, 2012). This method
allows evaluating the topographical distribution of the brainactivity in terms of current sources and sinks through the scalp(Kayser and Tenke, 2006). The maps of activity generated by theseCSD waveforms are sensitive to high spatial frequency changes oflocal cortical potentials due to reduced volume conduction formdistant sources (Le et al., 1994). Additionally, it minimizes smear-ing effects as caused by the tissue transmission distortion (Perrinet al., 1989) and other possible artifacts (Kayser and Tenke, 2006).Particularly, it has been proposed that this transformation is espe-cially useful in localizing the sources of activity in sensorimotortasks (Tenke and Kayser, 2012).
Classical paradigms designed to study these MRBPs use thesurface electromyographic (EMG) signal originated by one mus-cle or group of muscles recorded simultaneously to the EEG tomeasure the activation of these muscles while subjects repeatmovements at self-pace rates (Cui et al., 1999; Ohara et al., 2006).This technique allows the identification of the movement onsetas a rebound in the EMG signal, allowing to off-line epoch theEEG time-locked to the onset of each movement and the posterioraveraging of these epochs. Additionally, this signal provides use-ful information about the strength of the muscular contraction,allowing the characterization of the components of the MRBPs asa function of the kinetic parameters of movement. However, only
Frontiers in Human Neuroscience www.frontiersin.org April 2014 | Volume 8 | Article 271 | 1
HUMAN NEUROSCIENCE

Amengual et al. MRBPs related to the kinematic of self-paced movements
a few studies have focused on the association between these com-ponents with kinematic properties of movement (e.g., position,velocity and acceleration). Slobounov et al. (2000) reported anincrease in the amplitude of the late component of the BP (theso-called late BP Shibasaki and Hallett, 2006) when the max-imum degree of the index finger extension was achieved. In apioneering study Kirsch et al. (2010) reported a positive corre-lation between the amplitude of the BP and both velocity anddistance during the execution of goal-directed movements. Inaddition, they found that an increase of the target distance and themovement time were associated with the smoothness of the time-course of the BP. To this aim, these authors used a goal-directedmovement paradigm and measured the movement performanceusing a 3D hand-tracking system to identify the movement onsetinstead of using the classical EMG signal. This procedure allowedthem to establish a relationship between the internal forces ofthe movement (i.e., kinetics) and the external motion param-eters as position and velocity (i.e., kinematics) to the electricalbrain activity. Other studies have used the time series of velocitycoupled with the EEG signal in order to develop brain computerinterface (BCI) methods. In an outstanding study, Bradberry et al.(2010) estimated the trajectories of self-paced reaching move-ments by extracting associated patterns of EEG activity. They useda 3D tracking system to continuously extract the hand velocitycoupled with the EEG signal and estimated the sources of brainactivity that were more strongly involved in encoding the handvelocity using sLORETA. However, no studies to present haveestablished a direct relationship between changes in the pattern ofvelocity during movement performance and the associated EEGactivity at each stage of the movement.
We aimed to investigate the cross-relationship between thefluctuations of the velocity during the execution of natural self-paced movements and the concomitant EEG activity. Self-pacedmovements have the property of being self-initiated, that is, trig-gered by the internal decision of the subject instead of beingexternally triggered. In the present study we designed a paradigmthat required participants to reach a target positioned at a givenexact location using both arms through multi-joint arm reach-ing movements. During the task, the 3D spatial position ofan ultrasound marker located on the hand was recorded usinga hand-tracking system, thus obtaining the time series of theposition of this marker. We synchronized this signal with thatobtained from the EEG recordings with two different aims. First,we wanted to establish the onset of each movement using thederived time series of the spatial position (that is, the time seriesof velocity), which permitted epoching the EEG time-locked tothis time-point as similarly done in previous studies with theEMG signal (Cui et al., 1999; Ohara et al., 2006). Second, weaimed to directly compare the time series of the velocity of thesender with the components of the MRBPs and their CSD trans-formed signal, determining a point-to-point relationship betweenthe different phases of the movement execution and the concomi-tant brain activity. To our knowledge, no previous studies haveaddressed this issue, and we hypothesize that this novel mannerto work with these components would allow finding patterns ofneural and oscillatory activity related to variations of the velocityduring movement performance. Finding similar results to those
reported in studies using the EMG as movement-related signalwould indicate the validity of this technique to study movementrelated brain activity. Also, because of the simplicity of our experi-mental design, our study highlights the potential of examining thebrain activity associated with movement using the hand-trackingsystem in clinical protocols.
MATERIALS AND METHODSPARTICIPANTSFifteen right-handed healthy volunteers participated in thisexperiment (8 women, mean age 26.51 ± 3.42 years). All partici-pants were drug free and had no history of neurological diseases.They all gave written informed consent and were paid for theirparticipation in the study. The study was approved by the ethicscommittee of the University of Barcelona and was conductedaccording to the Helsinki Declaration.
EXPERIMENTAL PROCEDUREParticipants sat in a comfortable chair. They rested their handon the table surface, about 10 cm from the edge, with the indexfinger in extended position. They were asked to perform self-paced pointing movements reaching a white target plate located20 cm in front of the starting point with their extended index fin-ger (Figure 1). These movements consisted in elbow extensions,which might additionally involve other components as shoulderextension (see Figure 1B). Therefore, we will refer to these move-ments as multi-join reaching movements. The trajectory of thesemovements was parabolic-shaped, i.e., they were not to drag thearm on the table to achieve the target, and they had to performthe backward movement to the initial position as soon as the tar-get was reached. Thus, movements were performed with a verysharp onset, starting out from muscular relaxation.
Importantly, no external cue was used to trigger the intentionof the movement, so that subjects performed each movement ontheir own. They were asked to allow an interval of 7–10 s betweeneach movement. In order to avoid horizontal eyes movement arti-facts, subjects were instructed to fixate their gaze to the targetcue during the whole task and not to blink from about 3 s beforemovement onset to around 4 s after completion of the movement.At the beginning of the experimental session, at least 10 practicetrials were performed in order to check and to adjust the fre-quency of execution of the movements, as well as to avoid anykind of rhythmicity on the performance and blinking. Special carewas taken so that the subjects sat upright during this task, andthey were instructed before and during the task about to minimizehead movements.
The experimental design consisted in four blocks of move-ments (10 min per block), each performed with a single arm andtwo blocks per arm. Arms were alternated (right-left-right-leftand vice versa) and the order of alternation was counterbalancedby subjects.
HAND-TRACKING SYSTEM AND ANALYSISA computerized hand-tracking system (CMS-30P, Zebris, Isny,Germany) was used to continuously record the three-dimensionalspatial position of an ultrasound marker attached to the metacar-pophalangeal joint of the index finger (Figure 1A). Data were
Frontiers in Human Neuroscience www.frontiersin.org April 2014 | Volume 8 | Article 271 | 2

Amengual et al. MRBPs related to the kinematic of self-paced movements
FIGURE 1 | (A) Configuration of the experimental setup. Parcitipants sat in aconfortable position in front of a table. An ultrasonic sender was located on theindex finger of the active hand. A 3-D movement analyzer recorded the positionof the sender during self-paced movements to the target position (red arrow).(B) Time-line of one representative trial. Each picture corresponds to differenttime points during movement (preparation, achievement of the maximum
height and reaching the target). Movements were performed as multi-joint armreaching through elbow-extensions. (C) Three-dimensional representation ofthe averaged time series of all movements performed by one representativeparticipant. (D) Projections over the three planes are represented. Continuousblack lines correspond to the forward movement, whereas black dashed linescorrespond to the backward movement towards the initial position.
sampled at 66 Hz and analyzed with an in-house script usingMatLab 7.5 (Mathworks Inc., Natick, MA). The recorded timeseries of the trajectory of the hand movements were filteredoffline using a moving average filter (10 data points) in orderto reduce the number of signal artifacts produced by spuriousmovements during performance. Each data sample consisted inthree coordinates (components) that were used for the three-dimensional reconstruction of the trajectory of each movement(Figures 1C and D).
For each component of the time series of the trajectory, wecomputed off-line the time series of the velocity through numer-ical differentiation (Hermsdörfer et al., 2003). Typically, in eachtrajectory, the velocity increased up to a maximum and thendecreased again until a local minimum when the target wasreached (forward movement). Afterwards, an increase of negativevelocity indicated the hand going back movement to the startingposition (backward movement).
For each movement, the onset of the forward movement wasdefined as the first data point which longitudinal component(y-axis, Figure 1D) accomplished three conditions: (i) it shouldexceed a threshold of velocity of 8 mm/s, (ii) it should be dis-placed at least 5 mm from the initial position, and (iii) no otherin the following 20 points of the time series of velocity (thatcorresponding approximately to 300 ms) should cross-back thezero-line.
For each movement trajectory and for each hand, severalparameters of the performance were considered. Movement timeindicated the time invested in reaching the target position. Thepeak velocity was considered as the maximum value that thevelocity achieved during the movement time. As described inHermsdörfer et al. (2003), the percentage of acceleration timewas calculated as the percentage of the whole movement timein which the peak velocity was achieved. The maximum heightachieved during the movement time was also determined, as well
as the percentage of acceleration time for the height. Finally,the time elapsed between two consecutive movement onsets wascalculated.
To test differences between left/right movements performance,paired t-test were applied separately for each parameter describedabove. To analyze the similarity of these parameters betweenleft/right movements, we used the Pearson correlation for eachparameter. For the t-tests and the Pearson correlations, the signif-icance level was set at p = 0.05.
EEG DATA ACQUISITIONThe EEG signal was recorded continuously (bandpass-filtered0.01–250 Hz; A/D rate 500 Hz) with a Brainvision system(BrainProducts, Munich, Germany), and analyzed offline usingthe EEGLAB toolbox (Delorme and Makeig, 2004). An electrodecap was used to record EEG from 29 Ag/AgCl electrodes (Fp1/2,F3/4, C3/4, P3/4, O1/2, F7/8, T3/4, T5/6, Fz, Cz, Pz, FC1/2,FC5/6, CP1/2, CP5/6, PO1/2) using the extended 10–20 system(Jasper, 1958). An external electrode placed on the right ocularcanthus was used as reference. The ground electrode was placedon FCz. A VEOG electrode was placed 1 cm below the right eyeto detect vertical eye movements, and two additional electrodeswere placed on each mastoid, all them recorded against the refer-ence electrode. All impedances were kept below 5 k�. Data werebandpass-filtered offline between 0.01 and 45 Hz. Eye-movementartifacts were removed using a second-order blind identification(SOBI) technique (Joyce et al., 2004). EEG data were re-referencedoffline to the algebraic summation of both mastoids.
EEG-TRACKING SYSTEM SYNCHRONIZATIONThe synchronization between the EEG signal and the hand-tracking system was performed to allow the time-to-time corre-spondence between both time series (ERPs and trajectories). Tothis end, we used a PC computer with the software Presentation
Frontiers in Human Neuroscience www.frontiersin.org April 2014 | Volume 8 | Article 271 | 3

Amengual et al. MRBPs related to the kinematic of self-paced movements
(Neurobehavioral Systems, Albany, CA) that served for simul-taneously sending a 5 V electrical squared-wave to both thehand-tracking system and the EEG recorder before each blockof movements. We used an in-house-made cable for trigger-outthis electric signal through a parallel port and to trigger it in tothe tracking system in one side (through a parallel port) and to theEEG recording (through a serial port) in the other side. When theelectric squared-wave was received, the continuous recording ofthe position of the ultrasound sender started. The mark appear-ing in the EEG recording at this time was later used offline as asynchronization marker between the recordings from the trackingsystem and the EEG.
EEG SIGNAL ANALYSISSingle-trial EEG data epochs were extracted from the continuousEEG and used for averaging. Epochs were time-locked to the onsetof the movement defined using the time series acquired with thehand-tracking system. Each epoch was 7 s long, taking 3 s beforeand 4 s after the movement onset. The baseline was determined asthe average activity in the −2250 to −2000 ms interval precedingeach onset. Trials exceeding ±200 μV were rejected. For each par-ticipant, at least 100 free-of-artifacts trials were obtained for eacharm. The averaged ERPs were transformed into reference-freeCSD waveforms using the spherical spline surface Laplacian algo-rithm (using 4th degree-Legendre polynomials and a smoothingcoefficient of 10−5) reported by Perrin et al. (1989). The CSDwaveforms were computed for each original ERP waveform usinga CSD toolbox for MatLab (Kayser and Tenke, 2006).
Time-frequency analysis was performed convolving single-trial data from both ERPs and CSD waveforms with a complexMorlet wavelet (Tallon-Baudry et al., 1997). The frequencies stud-ied ranged from 1 to 40 Hz, with a linear increase of 1 Hz. Thetime-varying energy was computed for each trial and averagedseparately for each subject. The percentage change with respectto a baseline set 2250–2000 ms before the movement onset wasextracted and averaged. Percentage of power decrease (ERD) orincrease (ERS) of the mu (8–13 Hz) and beta band (17–24 Hz)with respect to baseline were calculated, since these are the mostcommonly studied in motor tasks (Neuper et al., 2006).
An initial analysis was performed to ensure that the topo-graphic distribution of the ERPs and ERD/ERS were the same forleft and right arm movements (See Supplementary material fora further description of the analysis). After demonstrating this,data for left and right arm movements were merged. To maintainthe laterality effects, the signal acquired from channels located onthe left and right hemisphere were switched for left arm move-ments. This procedure allowed us to consider all movements asright hand movements.
The statistical analysis was aimed to study specific scalpdistributions of the activity during the different phases of themovement based in the velocity time series behavior duringthe movement performance. We identified the time-windows ofinterest based on the kinematics of the movement (see definitionof these intervals in the Results section). We analyzed differenceson the scalp distribution of the activity for each time-windowof interest. We divided the set of electrodes into nine differ-ent regions: anterior-left (F7, F3, and FC5), anterior-medial (Fz,
FC1, and FC2), anterior-right (F4, F8, and FC6), central-left (C3,T3, and CP5), central-medial (Cz, CP1, and CP2), central-right(C4, T4, and CP6), posterior-left (P3, T5, and O1), posterior-medial (Pz, PO1, and PO2) and posterior-right (P4, T6, andO2). First, we conducted an analysis of variance (ANOVA) withfactors TIME-COURSE (each time window selected from kine-matic data of the movement) × ANTEROPOSTERIOR (anteriorregions vs. central regions vs. posterior regions) × LATERALITY(left regions vs. medial regions vs. right regions) to ensure distri-butional differences between the different times-windows. Thisclustering was considered in order to reduce the number ofdegrees of freedom in the statistical analysis (See Figures S1–S3 inSupplementary Material for illustration of the average-waveformscorresponding to each of these clusters for the ERPs, mu and betapower bands). Second, we conducted an ANOVA for each time-course with factors ANTEROPOSTERIOR and LATERALITY, toinvestigate the distribution of the activity within each time inter-val. When appropriate, the Greenhouse-Geisser correction wasused. In all analyses, the level of significance was set at p = 0.05.
RESULTSBEHAVIORAL ANALYSISAll movements showed a bell-shaped velocity profiles with respectthe longitudinal edge. Figure 1C shows the three-dimensionalreconstruction of the trajectory of one movement. The recordedkinematic parameters presented the standard characteristics ofpointing movements in both arms, that is, single-positive andnegative peaks on the velocity and single positive peaks on thedisplacement (Figure 2, middle).
We did not find differences between right and left movementsin movement time [t(14) = −0.9, p > 0.1], maximum altitude[t(14) = 0.5, p > 0.1], percentage of acceleration time [t(14) =0.93, p > 0.1] and percentage of the acceleration time for thealtitude [t(14) = 1.46, p > 0.1]. Only a slight but non-significantdifference in maximum velocity [t(14) = −1.9, p = 0.08] wasfound, being left movements slightly faster than right movements.Furthermore, the number of movements performed for bothhands was similar [t(14) = 0.58, p > 0.1]. Indeed, the elapsedtime between two consecutive forward movement onsets (mean±SD) was 8.4 s ± 2.7 for the right arm movements and 8.6 s ± 2.3for the left arm movements. Movement time (r = 0.96, p < 0.01),maximum velocity (r = 0.73, p < 0.01), maximum altitude (r =0.62, p < 0.01) and the latency of the peak of maximum veloc-ity relative of the movement time (r = 0.85, p < 0.01) were allstrongly correlated for left and right movements. By contrast,the latency of the peak of the maximum altitude relative to themovement time did not show a significant correlation betweenhands (r = 0.4, p > 0.1). For further details about the behavioralperformance, see Table S1 in Supplementary material.
ELECTROPHYSIOLOGICAL DATAThe statistical analysis did not reveal differences on the distribu-tion as a function of the active hand and we merged the epochscorresponding to the neural activity obtained during left and rightarm movements (See Supplementary material for details of thisanalysis). Figure 2 shows the waveforms extracted from the grandmean ERPs and CSD over the contralateral, ipsilateral and medial
Frontiers in Human Neuroscience www.frontiersin.org April 2014 | Volume 8 | Article 271 | 4
Amengual et al. MRBPs related to the kinematic of self-paced movements
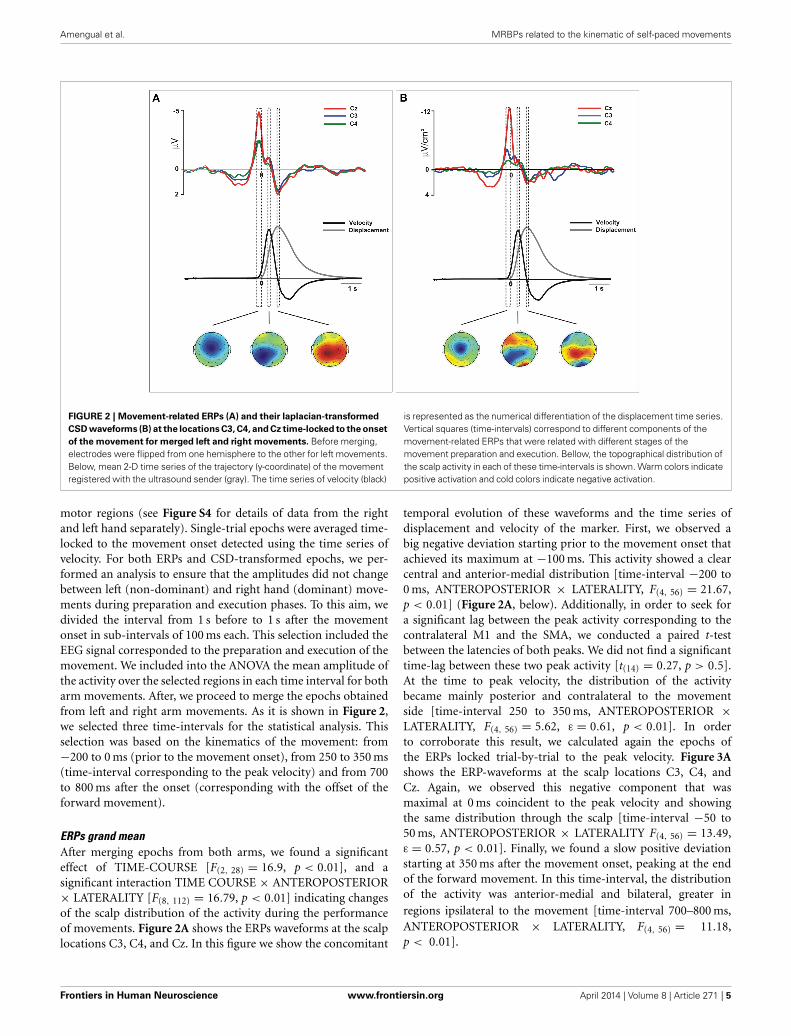
FIGURE 2 | Movement-related ERPs (A) and their laplacian-transformed
CSD waveforms (B) at the locations C3, C4, and Cz time-locked to the onset
of the movement for merged left and right movements. Before merging,electrodes were flipped from one hemisphere to the other for left movements.Below, mean 2-D time series of the trajectory (y-coordinate) of the movementregistered with the ultrasound sender (gray). The time series of velocity (black)
is represented as the numerical differentiation of the displacement time series.Vertical squares (time-intervals) correspond to different components of themovement-related ERPs that were related with different stages of themovement preparation and execution. Bellow, the topographical distribution ofthe scalp activity in each of these time-intervals is shown. Warm colors indicatepositive activation and cold colors indicate negative activation.
motor regions (see Figure S4 for details of data from the rightand left hand separately). Single-trial epochs were averaged time-locked to the movement onset detected using the time series ofvelocity. For both ERPs and CSD-transformed epochs, we per-formed an analysis to ensure that the amplitudes did not changebetween left (non-dominant) and right hand (dominant) move-ments during preparation and execution phases. To this aim, wedivided the interval from 1 s before to 1 s after the movementonset in sub-intervals of 100 ms each. This selection included theEEG signal corresponded to the preparation and execution of themovement. We included into the ANOVA the mean amplitude ofthe activity over the selected regions in each time interval for botharm movements. After, we proceed to merge the epochs obtainedfrom left and right arm movements. As it is shown in Figure 2,we selected three time-intervals for the statistical analysis. Thisselection was based on the kinematics of the movement: from−200 to 0 ms (prior to the movement onset), from 250 to 350 ms(time-interval corresponding to the peak velocity) and from 700to 800 ms after the onset (corresponding with the offset of theforward movement).
ERPs grand meanAfter merging epochs from both arms, we found a significanteffect of TIME-COURSE [F(2, 28) = 16.9, p < 0.01], and asignificant interaction TIME COURSE × ANTEROPOSTERIOR× LATERALITY [F(8, 112) = 16.79, p < 0.01] indicating changesof the scalp distribution of the activity during the performanceof movements. Figure 2A shows the ERPs waveforms at the scalplocations C3, C4, and Cz. In this figure we show the concomitant
temporal evolution of these waveforms and the time series ofdisplacement and velocity of the marker. First, we observed abig negative deviation starting prior to the movement onset thatachieved its maximum at −100 ms. This activity showed a clearcentral and anterior-medial distribution [time-interval −200 to0 ms, ANTEROPOSTERIOR × LATERALITY, F(4, 56) = 21.67,p < 0.01] (Figure 2A, below). Additionally, in order to seek fora significant lag between the peak activity corresponding to thecontralateral M1 and the SMA, we conducted a paired t-testbetween the latencies of both peaks. We did not find a significanttime-lag between these two peak activity [t(14) = 0.27, p > 0.5].At the time to peak velocity, the distribution of the activitybecame mainly posterior and contralateral to the movementside [time-interval 250 to 350 ms, ANTEROPOSTERIOR ×LATERALITY, F(4, 56) = 5.62, ε = 0.61, p < 0.01]. In orderto corroborate this result, we calculated again the epochs ofthe ERPs locked trial-by-trial to the peak velocity. Figure 3Ashows the ERP-waveforms at the scalp locations C3, C4, andCz. Again, we observed this negative component that wasmaximal at 0 ms coincident to the peak velocity and showingthe same distribution through the scalp [time-interval −50 to50 ms, ANTEROPOSTERIOR × LATERALITY F(4, 56) = 13.49,ε = 0.57, p < 0.01]. Finally, we found a slow positive deviationstarting at 350 ms after the movement onset, peaking at the endof the forward movement. In this time-interval, the distributionof the activity was anterior-medial and bilateral, greater inregions ipsilateral to the movement [time-interval 700–800 ms,ANTEROPOSTERIOR × LATERALITY, F(4, 56) = 11.18,p < 0.01].
Frontiers in Human Neuroscience www.frontiersin.org April 2014 | Volume 8 | Article 271 | 5

Amengual et al. MRBPs related to the kinematic of self-paced movements
FIGURE 3 | Movement-related ERPs (A) and their laplacian-transformed
CSD waveforms (B) at the locations C3, C4, and Cz time-locked to the
peak-velocity. Before merging, electrodes were flipped from onehemisphere to the other for left movements. Below, mean 2-D time seriesof the trajectory (y-coordinate) of the movement registered with theultrasound sender (gray). The time series of velocity (black) is represented
as the numerical differentiation of the displacement time series. Verticalsquare include the time-interval (centered at the 0) that corresponds to thetopographic representation. Warm colors indicate positive activation andcold colors indicate negative activation. To note, there is a clear degree ofsimilarity between the component (−50 to 50 ms) and its distribution thanthe observed in Figure 2.
CSD grand meanAfter merging data, we found differences of distribution of theCSD-transformed activity over the whole scalp between thesethree time-courses [TIME-COURSE × ANTEROPOSTERIOR× LATERALITY, F(4, 56) = 4.65, p < 0.01]. A first negative com-ponent was found starting 1000 ms before the movement onset,being maximal around −100 ms. This activity was prominentlydistributed in centro-medial regions [time-interval −200 to0 ms, ANTEROPOSTERIOR × LATERALITY, F(4, 56) = 32.45,p < 0.01], as it is shown in Figure 2B. Similarly as we didfor the ERPs grand mean analysis, we sought for significantdifferences in the peak latencies between contralateral M1and the SMA. Again, we did not find a significant time-lagbetween these activities [t(14) = 0.58, p > 0.5]. Coincidentto the peak velocity, we found a sink distributed over theposterior region, contralateral to the movement side. Inaddition, a current source distributed in frontal regions wasobserved at this time, more prominent over the contralateralregions [time-interval 250–350 ms, ANTEROPOSTERIOR× LATERALITY, F(4, 56) = 11.64, p < 0.01]. When lock-ing the epochs trial-by-trial to the peak velocity, we foundsimilar CSD-waveforms at the locations C3, C4, and Czas observed locking the activity to the movement onset,as well as the scalp distribution [ANTEROPOSTERIOR ×LATERALITY, F(4, 56) = 11.9, p < 0.01] (see Figure 3B).Finally, at the end of the forward movement, we found a sourcedistributed in post-central bilateral regions, more prominentover regions contralateral to the side of the movement [time-interval 700–800 ms, ANTEROPOSTERIOR × LATERALITY,F(4, 56) = 14.6, p < 0.01].
TIME FREQUENCY-ANALYSISSimilarly to the ERPs and CSD waveforms, we merged the epochscorresponding to the oscillatory brain activity obtained from leftand right arm movements (See Supplementary material for thedescription of this procedure). Figures 4, 5 show the mu- andbeta-ERD/S at locations C3, C4, and Cz locked to the move-ment onset (see Figures S5, S6 for details of data from the rightand left hand separately). In both power-bands we found a largedesynchronization over the contralateral, ipsilateral and centralmotor areas, starting around 1500 ms before the movement onset,lasting until 2000 s after the movement onset. In addition, apost-movement synchronization in both power bands was foundstarting 2300 ms after the movement onset. This synchronizationwas extended in regions contralateral to the side of the movement,more prominently in the mu-band (see Figure 4).
In addition to the intervals considered in the statistical analysisof the ERPs, we included two other intervals corresponding to theearly preparation of the movement (−1000 to −800 ms) and theend of the whole movement (3200–3400 ms).
Time-frequency derived from ERPsThe analysis of the mu-band extracted from the mergeddata indicated different and specific spatial distributions ineach time-interval [TIME-COURSE × ANTEROPOSTERIOR ×LATERALITY F(6, 84) = 4.14, p < 0.01]. During the prepara-tion of the movement, the mu-ERD showed a clear distri-bution over posterior regions contralateral to the movementside [time-interval −1000 to −800 ms, ANTEROPOSTERIOR ×LATERALITY, F(4, 56) = 3.97, p < 0.01] (Figure 4A). From theonset of the movement until reaching the target location, the
Frontiers in Human Neuroscience www.frontiersin.org April 2014 | Volume 8 | Article 271 | 6

Amengual et al. MRBPs related to the kinematic of self-paced movements
FIGURE 4 | Grand average traces of mu (8–13 Hz) ERD/ERS extracted
from voltage (A) and CSD-transformed signal (B) for electrodes C3, C4,
and Cz time-locked to the onset of the movement. Values are inpercentages of the base-line period (−2250 to −2000 ms). Before merging,electrodes were flipped from one hemisphere to the other for leftmovements. Below, mean 2-D time series of the trajectory (y-coordinate) ofthe movement registered with the ultrasound sender (gray). The time series
of velocity (black) is represented as the numerical differentiation of thedisplacement time series. Vertical squares (time-intervals) correspond todifferent components of the ERD/S that were related with different stages ofthe movement preparation and execution. Bellow, the topographicaldistribution of the power synchronization and desynchronization is shown.Warm colors indicate increases of synchronization and cold colors indicateincreases of desynchronization.
mu-ERD was distributed mainly over posterior and bilateralregions [time intervals from −200 to 0 ms, from −250 to 350 and700 to 800 ms, ANTEROPOSTERIOR, F(2, 28) > 17.7, p < 0.01in all intervals]. At the end of the whole movement, a clear mu-ERS arose in regions contralateral to the movement side [time-interval 3200–3400 ms, ANTEROPOSTERIOR × LATERALITY,F(4, 56) = 3.58, p < 0.05].
The power mu-band extracted from the CSD transformed dataalso showed specific spatial distributions in each time-interval[TIME-COURSE × ANTEROPOSTERIOR × LATERALITY,F(6, 84) = 5.005, p < 0.01]. The mu-ERD obtained from thesedata showed a distribution over the posterior contralat-eral regions, similarly to that obtained from voltage signal[time-interval −1000 to −800 ms, ANTEROPOSTERIOR ×LATERALITY, F(4, 56) = 2.86, p < 0.05]. Differently, however,the topographical distribution revealed a more enclosed activ-ity within these regions that the observed from voltage data(Figure 4B, bottom). Again, no differences on the distribu-tion of the mu-ERD were found in time intervals cover-ing the onset, the peak velocity and the end of the forwardmovement [time intervals from −200 to 0 ms, from −250 to350 and 700 to 800 ms, ANTEROPOSTERIOR, F(2, 28) > 6.07,p < 0.01 in all intervals]. Similarly to the mu-band powerobtained from the voltage signal, we found a clear ERS overcentral and contralateral to the movement side [time-interval
3200–3400 ms, ANTEROPOSTERIOR × LATERALITY F(4, 56) =2.78, p < 0.05], more localized over contralateral motor regions(see Figure 4B, bottom). For the beta band, we did not finda significant effect of TIME-COURSE [F(3, 42) = 0.52, p > 0.1]in the merged data. However, we found significant interac-tions of TIME-COURSE × LATERALITY [F(6, 84) = 3.16, ε =0.61, p < 0.05] and TIME-COURSE × ANTEROPOSTERIOR[F(6, 84) = 2.41, p < 0.05 ] suggesting certain specificity of thedistribution of the oscillatory beta power activity as a func-tion of the time-intervals. During the preparation of the move-ment, the beta-ERD was distributed prominently over centraland contralateral regions (see Figure 5A) [time-interval −1000to −800 ms, ANTEROPOSTERIOR × LATERALITY, F(4, 56) =2.74, p < 0.05] that became larger at bilateral and medio-centralregions during the onset of the movement [time-interval −200to 0 ms, ANTEROPOSTERIOR × LATERALITY, F(4, 56) = 3.07,p < 0.05]. At the peak velocity, we did not find a clear distributionof the ERD [time-interval 250–350 ms, ANTEROPOSTERIOR ×LATERALITY, F(4, 56) = 1.93, p > 0.1]. However, data showeda large beta-ERD over central and medial regions [time-interval 250–350 ms, ANTEROPOSTERIOR, F(2, 28) = 4.2, p <
0.05; LATERALITY, F(2, 28) = 6.67, p < 0.05]. We found alarger desynchronization over centromedial regions at theend of the forward movement [time-interval 700–800 ms,ANTEROPOSTERIOR × LATERALITY, F(4, 56) = 2.99, ε =
Frontiers in Human Neuroscience www.frontiersin.org April 2014 | Volume 8 | Article 271 | 7
Amengual et al. MRBPs related to the kinematic of self-paced movements
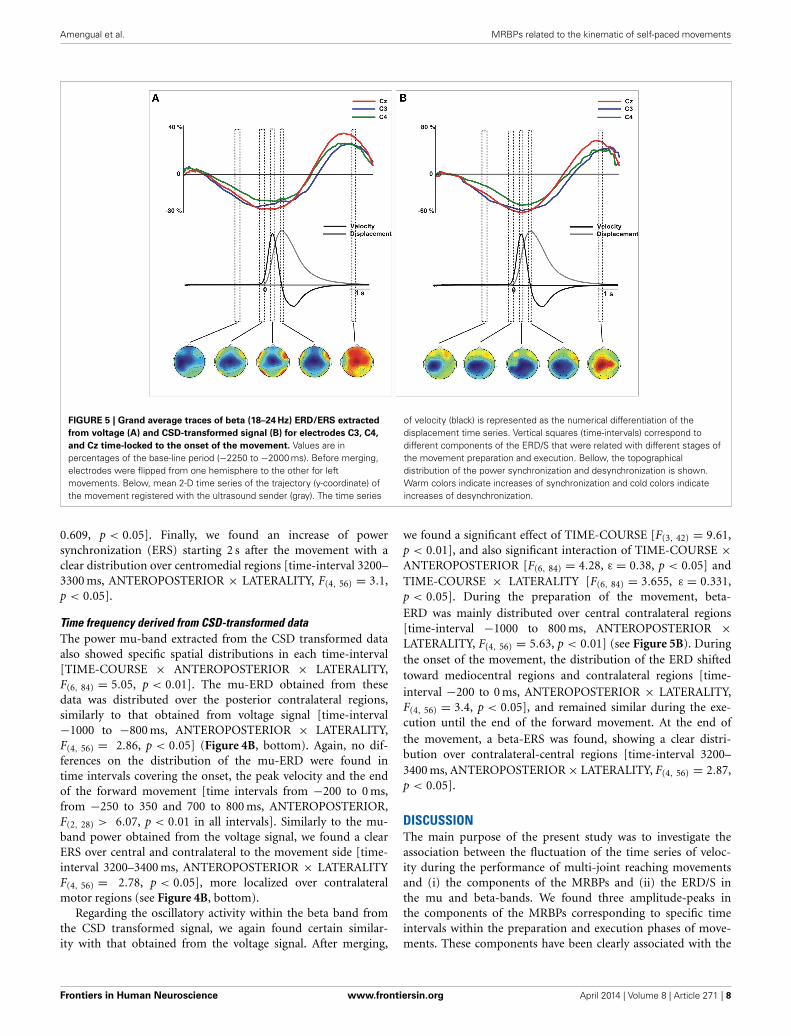
FIGURE 5 | Grand average traces of beta (18–24 Hz) ERD/ERS extracted
from voltage (A) and CSD-transformed signal (B) for electrodes C3, C4,
and Cz time-locked to the onset of the movement. Values are inpercentages of the base-line period (−2250 to −2000 ms). Before merging,electrodes were flipped from one hemisphere to the other for leftmovements. Below, mean 2-D time series of the trajectory (y-coordinate) ofthe movement registered with the ultrasound sender (gray). The time series
of velocity (black) is represented as the numerical differentiation of thedisplacement time series. Vertical squares (time-intervals) correspond todifferent components of the ERD/S that were related with different stages ofthe movement preparation and execution. Bellow, the topographicaldistribution of the power synchronization and desynchronization is shown.Warm colors indicate increases of synchronization and cold colors indicateincreases of desynchronization.
0.609, p < 0.05]. Finally, we found an increase of powersynchronization (ERS) starting 2 s after the movement with aclear distribution over centromedial regions [time-interval 3200–3300 ms, ANTEROPOSTERIOR × LATERALITY, F(4, 56) = 3.1,p < 0.05].
Time frequency derived from CSD-transformed dataThe power mu-band extracted from the CSD transformed dataalso showed specific spatial distributions in each time-interval[TIME-COURSE × ANTEROPOSTERIOR × LATERALITY,F(6, 84) = 5.05, p < 0.01]. The mu-ERD obtained from thesedata was distributed over the posterior contralateral regions,similarly to that obtained from voltage signal [time-interval−1000 to −800 ms, ANTEROPOSTERIOR × LATERALITY,F(4, 56) = 2.86, p < 0.05] (Figure 4B, bottom). Again, no dif-ferences on the distribution of the mu-ERD were found intime intervals covering the onset, the peak velocity and the endof the forward movement [time intervals from −200 to 0 ms,from −250 to 350 and 700 to 800 ms, ANTEROPOSTERIOR,F(2, 28) > 6.07, p < 0.01 in all intervals]. Similarly to the mu-band power obtained from the voltage signal, we found a clearERS over central and contralateral to the movement side [time-interval 3200–3400 ms, ANTEROPOSTERIOR × LATERALITYF(4, 56) = 2.78, p < 0.05], more localized over contralateralmotor regions (see Figure 4B, bottom).
Regarding the oscillatory activity within the beta band fromthe CSD transformed signal, we again found certain similar-ity with that obtained from the voltage signal. After merging,
we found a significant effect of TIME-COURSE [F(3, 42) = 9.61,p < 0.01], and also significant interaction of TIME-COURSE ×ANTEROPOSTERIOR [F(6, 84) = 4.28, ε = 0.38, p < 0.05] andTIME-COURSE × LATERALITY [F(6, 84) = 3.655, ε = 0.331,p < 0.05]. During the preparation of the movement, beta-ERD was mainly distributed over central contralateral regions[time-interval −1000 to 800 ms, ANTEROPOSTERIOR ×LATERALITY, F(4, 56) = 5.63, p < 0.01] (see Figure 5B). Duringthe onset of the movement, the distribution of the ERD shiftedtoward mediocentral regions and contralateral regions [time-interval −200 to 0 ms, ANTEROPOSTERIOR × LATERALITY,F(4, 56) = 3.4, p < 0.05], and remained similar during the exe-cution until the end of the forward movement. At the end ofthe movement, a beta-ERS was found, showing a clear distri-bution over contralateral-central regions [time-interval 3200–3400 ms, ANTEROPOSTERIOR × LATERALITY, F(4, 56) = 2.87,p < 0.05].
DISCUSSIONThe main purpose of the present study was to investigate theassociation between the fluctuation of the time series of veloc-ity during the performance of multi-joint reaching movementsand (i) the components of the MRBPs and (ii) the ERD/S inthe mu and beta-bands. We found three amplitude-peaks inthe components of the MRBPs corresponding to specific timeintervals within the preparation and execution phases of move-ments. These components have been clearly associated with the
Frontiers in Human Neuroscience www.frontiersin.org April 2014 | Volume 8 | Article 271 | 8

Amengual et al. MRBPs related to the kinematic of self-paced movements
dynamics of the time series of velocity obtained from the trajec-tories of the movements recorded with a hand-tracking system.We show a novel approach to investigate the components of themovement-related brain activity brain activity of multi-joint self-paced movements as a function of the changes of the velocitypattern during their performance.
BEHAVIORAL DATAThe analysis of movement trajectories showed the standard char-acteristics of pointing movements in both arms (Kirsch et al.,2010). With regard to the time series of velocity, a first posi-tive peak after the movement onset indicated the peak velocityduring the forward movement. Following, a negative peak cor-responded to the peak velocity during the backward movement.Interestingly, behavioral parameters showed a high degree of sim-ilarity between right (dominant) and left (non-dominant) handmovement. This seems to be contradictory as the performance ofboth hands should differ as a consequence of the function later-alization (Lavrysen et al., 2012). There are a considerable numberof studies suggesting that right arm advantages (in right-handers)might exist for kinematic parameters such as movement veloc-ity and movement time (Hoffmann, 1994; Elliott et al., 1995;Sainburg and Kalakanis, 2000). Sainburg and Kalakanis (2000)found differences in the magnitude of the left/right shoulder mus-cle torque during reaching movements, indicating that controlof both limbs might be underlined by different neural sources.Nevertheless, more recent studies support the idea that differencesbetween the dominant and non-dominant sides arise in otheraspects of motor performance than purely kinematics (Sainburg,2002; Wang and Sainburg, 2007), such as the strength at the ini-tiation of the movement or the selected strategy to achieve thetarget. Our findings seem to point in this direction, given that ourmeasurements explain kinematic characteristics of the movementrather than other qualitative parameters (e.g., the median devia-tion of movement path) which are dependent of the handednessof the subject. Nonetheless, the acquisition of the time series ofposition at more locations of the arm, such as the shoulder of thefore-arm, would definitively allow a more fine-grained compar-ison of kinematic properties of left/right movements. Therefore,we should remain speculative about this concern.
ELECTROPHYSIOLOGICAL RECORDINGSMost of the studies of MRBPs have used the EMG activityacquired with attached skin electrodes to identify the move-ment onset in absence of an external trigger (Deecke et al., 1969,1980; Berardelli et al., 1996; Mackinnon and Rothwell, 2000). Inour paradigm we used the signal recorded from the ultrasoundmarker to determine the movement onset using a velocity thresh-old. The use of ultrasonic signal to categorize trials in functionof the velocity has been previously used to study the sensitivity ofevoked brain activity to the range of motion in rapid goal-directedmovements (Kirsch and Hennighausen, 2010; Kirsch et al., 2010),as well as synchronize the EEG signal to the movement onset forextracting the epochs (Bradberry et al., 2010). However, this isthe first time that both time series (trajectory-based and EEG)are analyzed together with the aim to find associations between
the characteristics of the MRBPs-components and the kinematicsduring the performance of natural movements.
The MRBPs during the multi-joint outback movementsshowed, for both voltage and CSD waveforms, a series of deflec-tions that have been reported previously as accompanying ballis-tic movements (Berardelli et al., 1996; Babiloni et al., 1999; Cuiet al., 1999). As a novelty, we establish a point to point asso-ciation between the time series of velocity of movements andspecific components of the MRBPs during movement perfor-mance. First, we observe a negative component that peaks at fewtens of milliseconds prior to the onset that might correspond tothe late-BP (Shibasaki and Hallett, 2006). Previous studies havereported the recruitment of the supplementary motor area (SMA)during the preparation of the movement, as well as the involve-ment of the contralateral primary motor regions immediatelybefore the onset using different techniques such as EEG (Deeckeet al., 1980; Cui et al., 1999; Ohara et al., 2006), event-relatedfunctional magnetic resonance imaging (Cunnington et al., 2003,2005) and magnetoencephalography (MEG) (Cheyne et al., 1991;Nagamine et al., 1996; Erdler et al., 2000). As expected from thesestudies, our data reveal a prominent activation of fronto-centralregions during the late-BP which would indicate the recruitmentof the SMA. Another possible explanation for the increase of theactivity in the SMA is associated to the role of this area in timeestimation. Indeed, in this task we asked participants to wait aconcrete period of time (7–10 s) between two consecutive move-ments. Several studies pointed the role of SMA in the attentionalmodulation of the time estimation (Coull et al., 2004; Schwartzeet al., 2012). This possible explanation could not be ruled-out inthis study. However, the SMA activation that we observed is verysimilar in distribution and latency to that observed in other stud-ies using the same kind of paradigms involving self-paced motorprograms (see Shibasaki and Hallett, 2006, for review) which isconsidered to be motor-related. To note, we found that the SMAactivity did not precede the activity of the contralateral M1 aswould be expected taking into account the hierarchical organiza-tion of the motor system, as suggested in previous studies (Vidalet al., 2003). This time-lag between these activities has been clearlyobserved in tasks involving response-choice (see Carbonnell et al.,2004). However, the task here described consists in the repeti-tion of movements that are identically performed along the wholetask, which might reduce the hierarchical flow of activity withinthe motor system. This could explain the apparent coincidencein time of these peaks of activity corresponding with these twostructures.
A second selected stage of the movement corresponds to thepeak velocity. In this period, a second negative component wasobserved, being maximal over parietal areas contralateral to themovement onset. We confirmed this finding epoching the MRBPsto this time point, which showed a similar behavior. Therefore,it seems that this activation might indicate a neural substrate ofthe encoding of the kinematics of movements. Such activity isin agreement with previous studies that reported increments ofactivity over the posterior parietal cortex (PPC) in sensorimotorprocesses during visuomotor reaching movements (Reichenbachet al., 2014). However, to our knowledge, we report by first time aclear relationship between this neural activity and the kinematics
Frontiers in Human Neuroscience www.frontiersin.org April 2014 | Volume 8 | Article 271 | 9
Amengual et al. MRBPs related to the kinematic of self-paced movements
of the movement, concretely the achievement of the peak velocity.This result shows the active role of the PPC, not only in encod-ing the afferent input from the sensory system, but also in otherprocesses related with monitoring the kinematics of the move-ment. In a very brilliant study, Bourguignon et al. (2012) reportedevidences from MEG about the pivotal role of the left posteriorparietal cortex in the integration of sensorimotor features of limbkinematics, which might agree with the enrolment of this area inprocessing velocity changes during movement performance.
Finally, a large positive activation arises on both motor corticeswhen the target is achieved, mainly distributed over contralat-eral parieto-central regions. Few studies have provided evidenceof changes in corticospinal excitability accompanying voluntaryrelaxation of a muscle. Transcranial magnetic stimulation stud-ies have reported a decreased motor evoked potentials (MEP) inthe contracting muscle related with the decrease of the EMG sig-nal from the same muscle at the offset of movements (Waldvogelet al., 2000). In addition, positive motor-related movementpotential has been defined as an inhibitory process, which is inagreement with our findings.
EVENT-RELATED SYNCHRONIZATION/DESYNCHRONIZATIONIn addition to ERPs, we investigated whether the activity and thescalp distribution of the ERD/S in the mu and beta bands werealso related with kinematic properties of the movement. Duringthe preparation and the execution of movements, we found thesame pattern of synchronization and desynchronization in bothbands as reported previously (Pfurtscheller and Aranibar, 1977,1979; Pfurtscheller et al., 1996; Stancák Jr and Pfurtscheller, 1997;Alegre et al., 2003, 2004a,b). This oscillatory activity has beenlargely considered an indicator of neural activation during motortasks (Salmelin et al., 1995). However, we did not find any specificdistribution of this ERD associated with to the kinematics of themovement as we found with the MRBPs. It has been suggestedthat the sources of MRBPs and those related to the oscillatorybrain activity may have different roles during movement execu-tion. In such case, our findings would support this hypothesis. Ofinterest, we found a certain overlapping in these results when westudied the oscillatory brain activity of the voltage and the CSD.Notably, however, the CSD maps evidenced a superior perfor-mance localizing the scalp regions with the maximal activationin both mu and beta power activity. This is consequence of theLaplacian transformation appliying a spatial high-pass filtering,which avoids the contribution of spurious remote activities incalculating the sources (Tenke and Kayser, 2012).
CLINICAL APPLICATIONSAn important aspect of this study is the use of a hand-trackerto extract the kinematic aspects of movement performance. Thismethod establishes a potential tool to study the evolution of theEEG related to the intrinsic properties of the movement perfor-mance. In our view, this approach could be useful in clinicalstudies. Indeed, hand-trackers are used to evaluate several clini-cal scores of the quality of movement in patients suffering fromstroke consequences (Hermsdörfer and Goldenberg, 2002) andfocal dystonia (Berardelli et al., 1996; Ruiz et al., 2011). We believethat the application of this experimental setup would help to
disentangle specific patterns of brain activity associated to thebehavioral outcome of movements. Furthermore, longitudinalstudies could also benefit from this method, allowing the studyof changes in brain activity and performance due rehabilitativeinterventions (Amengual et al., 2012; Grau-Sánchez et al., 2013).
Particularly, EMG is very sensitive to spurious activity thatrecords from skin and it is inevitably contaminated by artifactsespecially in clinical studies (Olier et al., 2011). This undesirableactivity may alter the interpretation of the EMG signal when relat-ing muscular activation to movements (De Luca et al., 2010; Olieret al., 2011). In addition, besides the valuable physiological infor-mation that EMG signal provides, specific kinematic propertiesof the movement are missed. Instead, signal recorded from ultra-sonic markers allows a better understanding of the kinematics ofmovement and an easier detection of movement changes thanusing EMG. However, more cross-modal studies are needed tocompare and validate both signals.
LIMITATIONS OF THIS STUDYThis study shows a set of limitations that will be discussed in thissection. First, we only used a single marker of the hand-trackingsystem to register the position of the hand during the perfor-mance of movements. Although this montage was fair enoughto extract the time series of the velocity and to identify asso-ciations between brain activity and kinematics, more markersattached to different locations on the arm, such as the shoul-der and the forearm, would provide finer information about thedynamics of joint-muscles during movements and their relationwith the EEG activity (Wang and Sainburg, 2007). This additionalinformation could be helpful to confirm the left/right similari-ties that we found in the kinematic parameters included in ourbehavioral analysis. A second caveat of this study is the limitedtemporal resolution of the hand-tracking system (66 Hz) com-pared to the sampling rate of the EEG signal (250 Hz). Suchdifference in the frequency of acquisition of these signals mightresult in a reduced accuracy when locking the MRBPs to theresponse onset compared to more standardized methods usingthe EMG signal. However, providing an improved method forlocking EEG to the movement onset than those EMG-based wasbeyond the scope of our study. Instead, we aimed to propose thismethod as a different manner to look at these motor potentials,as they allow direct comparison between the changes of brainelectrical activity and the kinematics during movement execu-tion, which has not been previously described. Indeed, to ruleout that such inaccuracy locking the EEG to the motion sig-nal might have caused a significant variability in our data thatcould explain the component found at the time period of thepeak velocity, we extracted the ERPs locked to this time pointin a subsequent analysis obtaining exactly the same pattern ofactivity. Therefore, this method seems reliable enough to studythe motor related brain activity associated with the kinematicsof movement performance. Future studies should address thisissue including the recording of the EMG activity in the sameexperimental setup reported here. This would allow to comparethe ERPs extracted by both locking methods (EMG and hand-tracking system), as well as obtaining a quantitative value of theinaccuracy acquired with the method that we report. A third
Frontiers in Human Neuroscience www.frontiersin.org April 2014 | Volume 8 | Article 271 | 10

Amengual et al. MRBPs related to the kinematic of self-paced movements
limitation of this study is the reduced number of electrode loca-tions for the EEG recordings, which may represent an impactfor an optimal estimation of the Laplacian transformation of theEEG signal (Yao and Dewald, 2005). However, CSD waveformsextracted with similar algorithms based in spline interpolationhave been previously used with the same number of electrodesor even fewer (Carbonnell et al., 2004; Tandonnet et al., 2005;Meckler et al., 2010). Another limitation regarding the applica-tion of the Laplacian transformation of the EEG signal concernsto the mean inter-electrode distance of our montage (∼5 cm).Early reports suggest that the accuracy of cortical source local-ization methods decreases as a function of the distance betweenelectrodes considered in the model (Law et al., 1993). However,Giard et al. (2013) suggest that the optimal number of electrodeswould range between 30 and 50 in order to avoid errors betweenthe theroretical and real electrode position (that is sensitive tothe number of electrodes). In this sense, our montage consists in29 electrode positions, barely below the threshold defined Giardet al. (2013). Yet, CSD-waveforms are considered a sound methodto extract the neural sources in sensorimotor tasks (Tenke andKayser, 2012), and a low number of electrodes might not affectthe reliability of our findings (Ohara et al., 2006).
ACKNOWLEDGMENTSWe are very grateful to Dr. Toni Cunillera for his technical assis-tance in synchronizing the EEG amplifier and the hand-trackingsystem. Different institutions and grants have supported thispresent work. Julià L. Amengual has been supported by theMinistry of Education and Science of the Spanish Government,within the Research Formation Program (SEJ2006-13996). JosepMarco-Pallarés is supported a Spanish Research Grant (MICINN,PSI2012-37472). Thomas F. Münte is supported by the DFG andBMBF. This project has been supported by a Spanish ResearchGrant (MICINN, PSI2011-29219) awarded to Antoni Rodríguez-Fornells.
SUPPLEMENTARY MATERIALThe Supplementary Material for this article can be foundonline at: http://www.frontiersin.org/journal/10.3389/fnhum.
2014.00271/abstract
Figure S1 | ERPs (A) and CSD-transformed waveforms (B) at the clustered
locations over the scalp, time-locked to the onset of the movement. The
activity corresponding to the merged left and right movements is shown.
Before merging, regions were flipped from one hemisphere to the other
for left movements. FL, frontal left; FM, frontal medial; FR, frontal right;
CL, central left; CM, central medial; CR, central right; PL, posterior left;
PM, posterior medial; PR, posterior right.
Figure S2 | Mu-ERD/ERS (8–13 Hz) extracted from voltage (A) and
CSD-transformed waveforms (B) at the clustered locations over the scalp,
time-locked to the onset of the movement. The activity corresponding to
the merged left and right movements is shown. Before merging, regions
were flipped from one hemisphere to the other for left movements. FL,
frontal left; FM, frontal medial; FR, frontal right; CL, central left; CM,
central medial; CR, central right; PL, posterior left; PM, posterior medial;
PR, posterior right.
Figure S3 | Beta-ERD/ERS (18–24 Hz) extracted from voltage (A) and
CSD-transformed waveforms (B) at the clustered locations over the scalp,
time-locked to the onset of the movement. The activity corresponding to
the merged left and right movements is shown. Before merging, regions
were flipped from one hemisphere to the other for left movements. FL,
frontal left; FM, frontal medial; FR, frontal right; CL, central left; CM,
central medial; CR, central right; PL, posterior left; PM, posterior medial;
PR, posterior right.
Figure S4 | Movement-related ERPs (A) and their laplacian-transformed
CSD waveforms (B) at the locations C3, C4, and Cz time-locked to the
onset of the movement separately for left and right movements. Below,
mean 2-D time series of the trajectory (y-coordinate) of the movement
registered with the ultrasound sender (gray). The time series of velocity
(black) is represented as the numerical differentiation of the displacement
time series. Vertical squares (time-intervals) correspond to different
components of the movement-related ERPs that were related with
different stages of the movement preparation and execution. Bellow, the
topographical distribution of the scalp activity in each of these
time-intervals is shown. Warm colors indicate positive activation and cold
colors indicate negative activation.
Figure S5 | Grand average traces of mu (8–13 Hz) ERD/ERS extracted from
voltage (A) and CSD-transformed signal (B) for electrodes C3, C4, and Cz
time-locked to the onset of the movement separately for left and right
movements. Values are in percentages of the base-line period (−2250 to
−2000 ms). Below, mean 2-D time series of the trajectory (y-coordinate)
of the movement registered with the ultrasound sender (gray). The time
series of velocity (black) is represented as the numerical differentiation of
the displacement time series. Vertical squares (time-intervals) correspond
to different components of the ERD/S that were related with different
stages of the movement preparation and execution. Bellow, the
topographical distribution of the power synchronization and
desynchronization is shown. Warm colors indicate increases of
synchronization and cold colors indicate increases of desynchronization.
Figure S6 | Grand average traces of beta (18–24 Hz) ERD/ERS extracted
from voltage (A) and CSD-transformed signal (B) for electrodes C3, C4, and
Cz time-locked to the onset of the movement separately for left and right
movements. Values are in percentages of the base-line period (−2250
to −2000 ms). Below, mean 2-D time series of the trajectory (y-coordinate)
of the movement registered with the ultrasound sender (gray). The time
series of velocity (black) is represented as the numerical differentiation of
the displacement time series. Vertical squares (time-intervals) correspond
to different components of the ERD/S that were related with different
stages of the movement preparation and execution. Bellow, the
topographical distribution of the power synchronization and
desynchronization is shown. Warm colors indicate increases of
synchronization and cold colors indicate increases of desynchronization.
REFERENCESAlegre, M., Gurtubay, I. G., Labarga, A., Iriarte, J., Malanda, A., and Artieda, J.
(2004a). Alpha and beta oscillatory activity during a sequence of two move-ments. Clin. Neurophysiol. 115, 124–130. doi: 10.1016/S1388-2457(03)00311-0
Alegre, M., Gurtubay, I. G., Labarga, A., Iriarte, J., Valencia, M., and Artieda, J.(2004b). Frontal and central oscillatory changes related to different aspects ofthe motor process: a study in go/no-go paradigms. Exp. Brain Res. 159, 14–22.doi: 10.1007/s00221-004-1928-8
Alegre, M., Labarga, A., Gurtubay, I., Iriarte, J., Malanda, A., and Artieda, J. (2003).Movement-related changes in cortical oscillatory activity in ballistic, sustainedand negative movements. Exp. Brain Res. 148, 17–25. doi: 10.1007/s00221-002-1255-x
Amengual, J. L., Rojo, N., Veciana De Las Heras, M., Marco-Pallarés, J., Grau,J., Schneider, S., et al. (2012). Sensorimotor plasticity after musical-supported
Frontiers in Human Neuroscience www.frontiersin.org April 2014 | Volume 8 | Article 271 | 11
Amengual et al. MRBPs related to the kinematic of self-paced movements
therapy in chronic stroke patients revealed by transcranial magnetic stimula-tion. PLoS ONE 8:e61883. doi: 10.1371/journal.pone.0061883
Babiloni, C., Carducci, F., Cincotti, F., Rossini, P. M., Neuper, C., Pfurtscheller,G., et al. (1999). Human movement-related potentials vs. desynchronization ofEEG alpha rhythm: a high-resolution EEG study. Neuroimage 10, 658–665. doi:10.1006/nimg.1999.0504
Berardelli, A., Hallett, M., Rothwell, J. C., Agostino, R., Manfredi, M., Thompson,P. D., et al. (1996). Single-joint rapid arm movements in normal sub-jects and in patients with motor disorders. Brain 119, 661–674. doi:10.1093/brain/119.2.661
Bourguignon, M., Jousmäki, V., Op De Beeck, M., Van Bogaert, P., Goldman,S., and De Tiège, X. (2012). Neuronal network coherent with hand kinemat-ics during fast repetitive hand movements. Neuroimage 59, 1684–1691. doi:10.1016/j.neuroimage.2011.09.022
Bradberry, T. J., Gentili, R. J., and Contreras-Vidal, J. L. (2010). Reconstructingthree-dimensional hand movements from noninvasive electroencephalo-graphic signals. J. Neurosci. 30, 3432–3437. doi: 10.1523/JNEUROSCI.6107-09.2010
Carbonnell, L., Hasbroucq, T., Grapperon, J., and Vidal, F. (2004). Responseselection and motor areas: a behavioural and electrophysiological study. Clin.Neurophysiol. 115, 2164–2174. doi: 10.1016/j.clinph.2004.04.012
Cheyne, D., Kristeva, R., and Deecke, L. (1991). The use ofMagnetoencephalography (MEG) in the study of movement-related brain activity in humans. Int. J. Psychophysiol. 11, 17. doi:10.1016/0167-8760(91)90086-D
Coull, J. T., Vidal, F., Nazarian, B., and Macar, F. (2004). Functional anatomy ofthe attentional modulation of time estimation. Science 303, 1506–1508. doi:10.1126/science.1091573
Cui, R. Q., Huter, D., Lang, W., and Deecke, L. (1999). Neuroimage of volun-tary movement: topography of the bereitschaftspotential, a 64-channel DCcurrent source density study. Neuroimage 9, 124–134. doi: 10.1006/nimg.1998.0388
Cunnington, R., Windischberger, C., Deecke, L. D., and Moser, E. (2003). Thepreparation and readiness for voluntary movement: a high-field event-relatedfMRI study of the Bereitschafts-BOLD response. Neuroimage 20, 404–412. doi:10.1016/S1053-8119(03)00291-X
Cunnington, R., Windischberger, C., and Moser, E. (2005). Premovement activityof the pre-supplementary motor area and the readiness for action: studies oftime-resolved event-related functional MRI. Hum. Mov. Sci. 24, 644–656 doi:10.1016/j.humov.2005.10.001
Deecke, L., Eisinger, H., and Kornhuber, H. H. (1980). “Comparison of bere-itschaftspotential, pre-motion positivity and motor potential preceding vol-untary flexion and extension movements in man,” in Prog. Brain Res. eds.H. H. Kornhuber and L. Deecke (Elsevier), 171–176. doi: 10.1016/S0079-6123(08)61621-0
Deecke, L., Scheid, P., and Kornhuber, H. (1969). Distribution of readiness poten-tial, pre-motion positivity, and motor potential of the human cerebral cor-tex preceding voluntary finger movements. Exp. Brain Res. 7, 158–168. doi:10.1007/BF00235441
Delorme, A., and Makeig, S. (2004). EEGLAB: an open source toolbox for anal-ysis of single-trial EEG dynamics including independent component analysis.J. Neurosci. Methods 134, 9–21. doi: 10.1016/j.jneumeth.2003.10.009
De Luca, C. J., Gilmore, L. D., Kuznetsov, M., and Roy, S. H. (2010). Filtering thesurface EMG signal: movement artifact and baseline noise contamination. J.Biomech. 43, 1573–1579. doi: 10.1016/j.jbiomech.2010.01.027
Elliott, D., Lyons, J., Chua, R., Goodman, D., and Carson, R. G. (1995). The influ-ence of target perturbation on manual aiming asymmetries in right-handers.Cortex 31, 685–697. doi: 10.1016/S0010-9452(13)80020-2
Erdler, M., Beisteiner, R., Mayer, D., Kaindl, T., Edward, V., Windischberger,C., et al. (2000). Supplementary motor area activation preceding voluntarymovement is detectable with a whole-scalp magnetoencephalography system.Neuroimage 11, 697–707. doi: 10.1006/nimg.2000.0579
Giard, M. H., Besle, J., Aguera, P. E., Gomot, M., and Bertrand., O. (2013). Scalpcurrent density mapping in the analysis of mismatch negativity paradigms.Brain Topogr. doi: 10.1007/s10548-013-0324-8. [Epub ahead of print].
Grau-Sánchez, J., Amengual, J. L., Rojo, N., Veciana De Las Heras, M., Montero, J.,Rubio, F., et al. (2013). Plasticity in the sensorimotor cortex induced by Music-supported therapy in stroke patients: a TMS study. Front. Hum. Neurosci. 7:494.doi: 10.3389/fnhum.2013.00494
Hermsdörfer, J., Blankenfeld, H., and Goldenberg, G. (2003). The dependence ofipsilesional aiming deficits on task demands, lesioned hemisphere, and apraxia.Neuropsychologia 41, 1628–1643. doi: 10.1016/S0028-3932(03)00097-6
Hermsdörfer, J., and Goldenberg, G. (2002). Ipsilesional deficits dur-ing fast diadochokinetic hand movements following unilateral braindamage. Neuropsychologia 40, 2100–2115. doi: 10.1016/S0028-3932(02)00048-9
Hoffmann, E. R. (1994). Movement times of right and left handers using pre-ferred and non-preferred hands. Proc. Hum. Factors Ergon. Soc. Annu. Meet. 38,500–505. doi: 10.1177/154193129403800909
Jasper, H. H. (1958). The ten-twenty electrode system of the InternationalFederation. Electroencephalogr. Clin. Neurophysiol. 10, 367–380.
Joyce, C. A., Gorodnitsky, I. F., and Kutas, M. (2004). Automatic removalof eye movement and blink artifacts from EEG data using blind compo-nent separation. Psychophysiology 41, 313–325. doi: 10.1111/j.1469-8986.2003.00141.x
Jurkiewicz, M. T., Gaetz, W. C., Bostan, A. C., and Cheyne, D. (2006).Post-movement beta rebound is generated in motor cortex: evi-dence from neuromagnetic recordings. Neuroimage 32, 1281–1289. doi:10.1016/j.neuroimage.2006.06.005
Kayser, C., Logothetis, N. K., and Panzeri, S. (2010). Visual enhancement ofthe information representation in auditory cortex. Curr. Biol. 20, 19–24. doi:10.1016/j.cub.2009.10.068
Kayser, J. R., and Tenke, C. E. (2006). Principal components analysis of Laplacianwaveforms as a generic method for identifying ERP generator patterns: II.Adequacy of low-density estimates. Clin. Neurophysiol. 117, 369–380. doi:10.1016/j.clinph.2005.08.033
Kirsch, W., and Hennighausen, E. (2010). ERP correlates of linear hand move-ments: distance dependent changes. Clin. Neurophysiol. 121, 1285–1292. doi:10.1016/j.clinph.2010.02.151
Kirsch, W., Hennighausen, E., and Rösler, F. (2010). ERP correlates of linear handmovements in a motor reproduction task. Psychophysiology 47, 486–500. doi:10.1111/j.1469-8986.2009.00952.x
Kornhuber, H. H., and Deecke, L. (1965). Hirnpotentialänderungenbei Willkürbewegungen und passiven Bewegungen des Menschen:Bereitschaftspotential und reafferente Potentiale. Pflügers Arch. 284, 1–17.doi: 10.1007/BF00412364
Lavrysen, A., Heremans, E., Peeters, R., Wenderoth, N., Feys, P., Swinnen, S.P., et al. (2012). Hemispheric asymmetries in goal-directed hand move-ments are independent of hand preference. Neuroimage 62, 1815–1824. doi:10.1016/j.neuroimage.2012.05.033
Law, S. K., Nunez, P. L., and Wijesinghe, K. S. (1993). High-Resolution EEG UsingSpline Generated Surface Laplacians on Spherical and Ellipsoidal Surfaces. IEEETrans. Biomed. Eng. 10, 145–153.
Le, J., Menon, V., and Gevins, A. (1994). Local estimate of surface Laplacianderivation on a realistically shaped scalp surface and its performance on noisydata. Electroencephalogr. Clin. Neurophysiol. 92, 433–441. doi: 10.1016/0168-5597(94)90021-3
Mackinnon, C. D., and Rothwell, J. C. (2000). Time-varying changes in cor-ticospinal excitability accompanying the triphasic EMG pattern in humans.J. Physiol. 528, 633–645. doi: 10.1111/j.1469-7793.2000.00633.x
Meckler, C. D., Allain, S., Carbonnell, L., Hasbroucq, T., Burle, B., and Vidal, F.(2010). Motor inhibition and response expectancy: a Laplacian ERP study. Biol.Psychol. 85, 386–392. doi: 10.1016/j.biopsycho.2010.08.011
Nagamine, T., Kajola, M., Salmelin, R., Shibasaki, H., and Hari, R. (1996).Movement-related slow cortical magnetic fields and changes of spontaneousMEG- and EEG-brain rhythms. Electroencephalogr. Clin. Neurophysiol. 99,274–286. doi: 10.1016/0013-4694(96)95154-8
Neuper, C., Wörtz, M., and Pfurtscheller, G. (2006). “ERD/ERS patterns reflect-ing sensorimotor activation and deactivation,” in Progress in Brain Research,eds N. Christa and K. Wolfgang (Elsevier), 211–222. doi: 10.1016/S0079-6123(06)59014-4
Nunez, P. L. (2002). “Electroencephalography (EEG),” in Encyclopedia of theHuman Brain, ed V. S. Ramachandran (New York, NY: Academic Press),169–179.
Ohara, S., Ikeda, A., Matsuhashi, M., Satow, T., Kunieda, T., Mikuni, N.,et al. (2006). Bereitschaftspotentials recorded from the lateral part ofthe superior frontal gyrus in humans. Neurosci. Lett. 399, 1–5. doi:10.1016/j.neulet.2005.06.062
Frontiers in Human Neuroscience www.frontiersin.org April 2014 | Volume 8 | Article 271 | 12

Amengual et al. MRBPs related to the kinematic of self-paced movements
Olier, I., Amengual, J. L., and Vellido, A. (2011). A variational Bayesianapproach for the robust analysis of the cortical silent period from EMGrecordings of brain stroke patients. Neurocomputer 74, 1301–1314. doi:10.1016/j.neucom.2010.12.006
Perrin, F., Pernier, J., Bertrand, O., and Echallier, J. F. (1989). Spherical splinesfor scalp potential and current density mapping. Electroencephalogr. Clin.Neurophysiol. 72, 184–187. doi: 10.1016/0013-4694(89)90180-6
Pfurtscheller, G., and Aranibar, A. (1977). Event related cortical desynchroniza-tion detected by power measurements of scalp EEG. Electroencephalogr. Clin.Neurophysiol. 42, 817–826. doi: 10.1016/0013-4694(77)90235-8
Pfurtscheller, G., and Aranibar, A. (1979). Evaluation of event-relateddesynchronization (ERD) preceding and following voluntary self-pacedmovement. Electroencephalogr. Clin. Neurophysiol. 46, 138–146. doi:10.1016/0013-4694(79)90063-4
Pfurtscheller, G., Graimann, B., Huggins, J. E., Levine, S. P., and Schuh,L. A. (2003). Spatiotemporal patterns of beta desynchronization andgamma synchronization in corticographic data during self-paced move-ment. Clin. Neurophysiol. 114, 1226–1236. doi: 10.1016/S1388-2457(03)00067-1
Pfurtscheller, G., Stancák, A. Jr., and Neuper, C. (1996). Post-movement betasynchronization. A correlate of an idling motor area? Electroencephalogr. Clin.Neurophysiol. 98, 281–293. doi: 10.1016/0013-4694(95)00258-8
Reichenbach, A., Thielscher, A., Peer, A., Bülthoff, H. H., and Bresciani, J.-P.(2014). A key region in the human parietal cortex for processing propriocep-tive hand feedback during reaching movements. Neuroimage 84, 615–625. doi:10.1016/j.neuroimage.2013.09.024
Ruiz, N. H., Ströbing, F., Jabusch, H.-C., and Altenmüller, E. (2011). EEGoscillatory patterns are associated with error prediction during music perfor-mance and are altered in musician’s dystonia. Neuroimage 55, 1791–1803. doi:10.1016/j.neuroimage.2010.12.050
Sainburg, R. L. (2002). Evidence for a dynamic-dominance hypothesis of handed-ness. Exp. Brain Res. 142, 241–258. doi: 10.1007/s00221-001-0913-8
Sainburg, R. L., and Kalakanis, D. (2000). Differences in control of limb dynam-ics during dominant and nondominant arm reaching. J. Neurophysiol. 83,2661–2675.
Salmelin, R., Hämäläinen, M., Kajola, M., and Hari, R. (1995). Functional segrega-tion of movement-related rhythmic activity in the human brain. Neuroimage 2,237–243. doi: 10.1006/nimg.1995.1031
Schwartze, M., Rothermich, K., and Kotz, S. A. (2012). Functional dissociation ofpre-SMA and SMA-proper in temporal processing. Neuroimage 60, 290–298.doi: 10.1016/j.neuroimage.2011.11.089
Shibasaki, H., and Hallett, M. (2006). What is the Bereitschaftspotential? Clin.Neurophysiol. 117, 2341–2356. doi: 10.1016/j.clinph.2006.04.025
Slobounov, S., Rearick, M., and Chiang, H. (2000). EEG correlates of fin-ger movements as a function of range of motion and pre-loading
conditions. Clin. Neurophysiol. 111, 1997–2007. doi: 10.1016/S1388-2457(00)00432-6
Stancák, A. Jr., and Pfurtscheller, G. (1997). Effects of handedness on movement-related changes of central beta rhythms. J. Clin. Neurophysiol. 14, 419–428. doi:10.1097/00004691-199709000-00008
Tallon-Baudry, C., Bertrand, O., Delpuech, C., and Pernier, J. (1997). Oscillatorygamma-band (30–70 Hz) activity induced by a visual search task in humans.J. Neurosci. 17, 722–734.
Tandonnet, C., Burle, B., Hasbroucq, T., and Vidal, F. (2005). Spatialenhancement of EEG traces by surface Laplacian estimation: comparisonbetween local and global methods. Clin. Neurophysiol. 116, 18–24. doi:10.1016/j.clinph.2004.07.021
Tenke, C. E., and Kayser, J. R. (2012). Generator localization by current sourcedensity (CSD): implications of volume conduction and field closure atintracranial and scalp resolutions. Clin. Neurophysiol. 123, 2328–2345. doi:10.1016/j.clinph.2012.06.005
Vidal, F., Grapperon, J., Bonnet, M., and Hasbroucq, T. (2003). The natureof unilateral motor commands in between-hand choice tasks as revealed bysurface Laplacian stimation. Psychophisiology 40, 796–805. doi: 10.1111/1469-8986.00080
Waldvogel, D., Van Gelderen, P., Muellbacher, W., Ziemann, U., Immisch, I., andHallett, M. (2000). The relative metabolic demand of inhibition and excitation.Nature 406, 995–998. doi: 10.1038/35023171
Wang, J., and Sainburg, R. (2007). The dominant and nondominant arms are spe-cialized for stabilizing different features of task performance. Exp. Brain Res.178, 565–570. doi: 10.1007/s00221-007-0936-x
Yao, J., and Dewald, J. P. A. (2005). Evaluation of different cortical source local-ization methods using simulated and experimental EEG data. Neuroimage 25,369–382. doi: 10.1016/j.neuroimage.2004.11.036
Conflict of Interest Statement: The authors declare that the research was con-ducted in the absence of any commercial or financial relationships that could beconstrued as a potential conflict of interest.
Received: 22 October 2013; accepted: 11 April 2014; published online: 29 April 2014.Citation: Amengual JL, Marco-Pallarés J, Grau C, Münte TF and Rodríguez-Fornells A(2014) Linking motor-related brain potentials and velocity profiles in multi-joint armreaching movements. Front. Hum. Neurosci. 8:271. doi: 10.3389/fnhum.2014.00271This article was submitted to the journal Frontiers in Human Neuroscience.Copyright © 2014 Amengual, Marco-Pallarés, Grau, Münte and Rodríguez-Fornells.This is an open-access article distributed under the terms of the Creative CommonsAttribution License (CC BY). The use, distribution or reproduction in other forums ispermitted, provided the original author(s) or licensor are credited and that the originalpublication in this journal is cited, in accordance with accepted academic practice. Nouse, distribution or reproduction is permitted which does not comply with these terms.
Frontiers in Human Neuroscience www.frontiersin.org April 2014 | Volume 8 | Article 271 | 13