linkedin q1 2016 earnings call
TRANSCRIPT

Q1’16 ResultsApril 2016

Safe harbor
2
“Safe Harbor” statement under the Private Securities Litigation Reform Act of 1995: This presentation and the accompanying conference call contain forward-looking statements about our products, including our investments in products, technology and other key strategic areas, certain non-financial metrics, such as member growth and engagement, and our expected financial metrics such as revenue, adjusted EBITDA, non-GAAP EPS, depreciation and amortization, stock-based compensation and fully-diluted weighted shares for the second quarter of 2016 and the full fiscal year 2016. The achievement of the matters covered by such forward-looking statements involves risks, uncertainties and assumptions. If any of these risks or uncertainties materialize or if any of the assumptions prove incorrect, the company’s results could differ materially from the results expressed or implied by the forward-looking statements the company makes.
The risks and uncertainties referred to above include - but are not limited to - our core value of putting members first, which may conflict with the short-term interests of the business; engagement of our members; the price volatility of our Class A common stock; general economic conditions; expectations regarding the return on our strategic investments; execution of our plans and strategies, including with respect to mobile products and features and expansion into new areas and businesses; security measures and the risk that they may not be sufficient to secure our member data adequately or that we are subject to attacks that degrade or deny the ability of members to access our solutions; expectations regarding our ability to timely and effectively scale and adapt existing technology and network infrastructure to ensure that our solutions are accessible at all times with short or no perceptible load times; our ability to maintain our rate of revenue growth and manage our expenses and investment plans; our ability to accurately track our key metrics internally; members and customers curtailing or ceasing to use our solutions; privacy, security and data transfer concerns, as well as changes in regulations, which could impact our ability to serve our members or curtail our monetization efforts; litigation and regulatory issues; increasing competition; our ability to manage our growth; our international operations; our ability to recruit and retain our employees; the application of U.S. and international tax laws on our tax structure and any changes to such tax laws; acquisitions we have made or may make in the future; and the dual class structure of our Class A common stock.
Further information on these and other factors that could affect the company’s financial results is included in filings it makes with the Securities and Exchange Commission from time to time, including the section entitled “Risk Factors” in the company’s Annual Report on Form 10-K for the year ended December 31, 2015, and additional information will also be set forth in our Form 10-Q that will be filed for the quarter ended March 31, 2016, which should be read in conjunction with these financial results. These documents are or will be available on the SEC Filings section of the Investor Relations page of the company's website at http://investors.linkedin.com/. All information provided in this presentation is as of April 28, 2016, and LinkedIn undertakes no duty to update this information.

Stay connected and informed
Work smarter
LinkedIn value propositions
3
Advance my career

Member value metrics
4
Members (mn)1 Unique visiting members (mn)2
Q1’
12Q
2’12
Q3’
12Q
4’12
Q1’
13Q
2’13
Q3’
13Q
4’13
Q1’
14Q
2’14
Q3'
14Q
4'14
Q1'
15Q
2'15
Q3'
15Q
4'15
Q1'
16
433414
396380
364347
332313
296277
259238
218202
187174
161
Q1’
12
Q2’
12
Q3’
12
Q4’
12
Q1’
13
Q2’
13
Q3’
13
Q4’
13
Q1’
14
Q2'
14
Q3'
14
Q4'
14
Q1'
15
Q2'
15
Q3'
15
Q4'
15
Q1'
16
106
1001009797
9390
8482
767875
65
58
525150
Q1’
12
Q2’
12
Q3’
12
Q4’
12
Q1’
13
Q2’
13
Q3’
13
Q4’
13
Q1’
14
Q2'
14
Q3'
14
Q4'
14
Q1'
15
Q2'
15
Q3'
15
Q4'
15
Q1'
16
45
3738
3534
3028
2526
222221
18
151312
11
Member page views (bn)3
1 as of quarter end | 2 monthly average during the quarter | 3 total during the quarter

Q1’
12
Q2’
12
Q3’
12
Q4’
12
Q1’
13
Q2’
13
Q3’
13
Q4’
13
Q1’
14
Q2’
14
Q3'
14
Q4'
14
Q1'
15
Q2'
15
Q3'
15
Q4'
15
Q1'
16
$861$862
$780
$712
$638$643
$568$534
$473$447
$393$364
$325$304$252
$228$188
0%
20%
40%
60%
80%
100%
120%
140%
160%
Revenue
% Y/YNet revenue ($mn)
5

Q1’
12
Q2’
12
Q3’
12
Q4’
12
Q1’
13
Q2’
13
Q3’
13
Q4’
13
Q1’
14
Q2'
14
Q3'
14
Q4'
14
Q1'
15
Q2'
15
Q3'
15
Q4'
15
Q1'
16
$222
$249
$208
$163$160
$179
$151$145
$117$111
$93$89$83$79
$56$50$38
Adjusted EBITDA1
0%
10%
20%
30%
40%
% of revenueAdj EBITDA ($mn)
61 Adjusted EBITDA is a Non-GAAP financial measure. For a reconciliation of Adjusted EBITDA to net income (loss) please see slide 7. The presentation of this financial information is not intended to be considered in isolation or as
a substitute for, or superior to, the financial information prepared and presented in accordance with US GAAP .
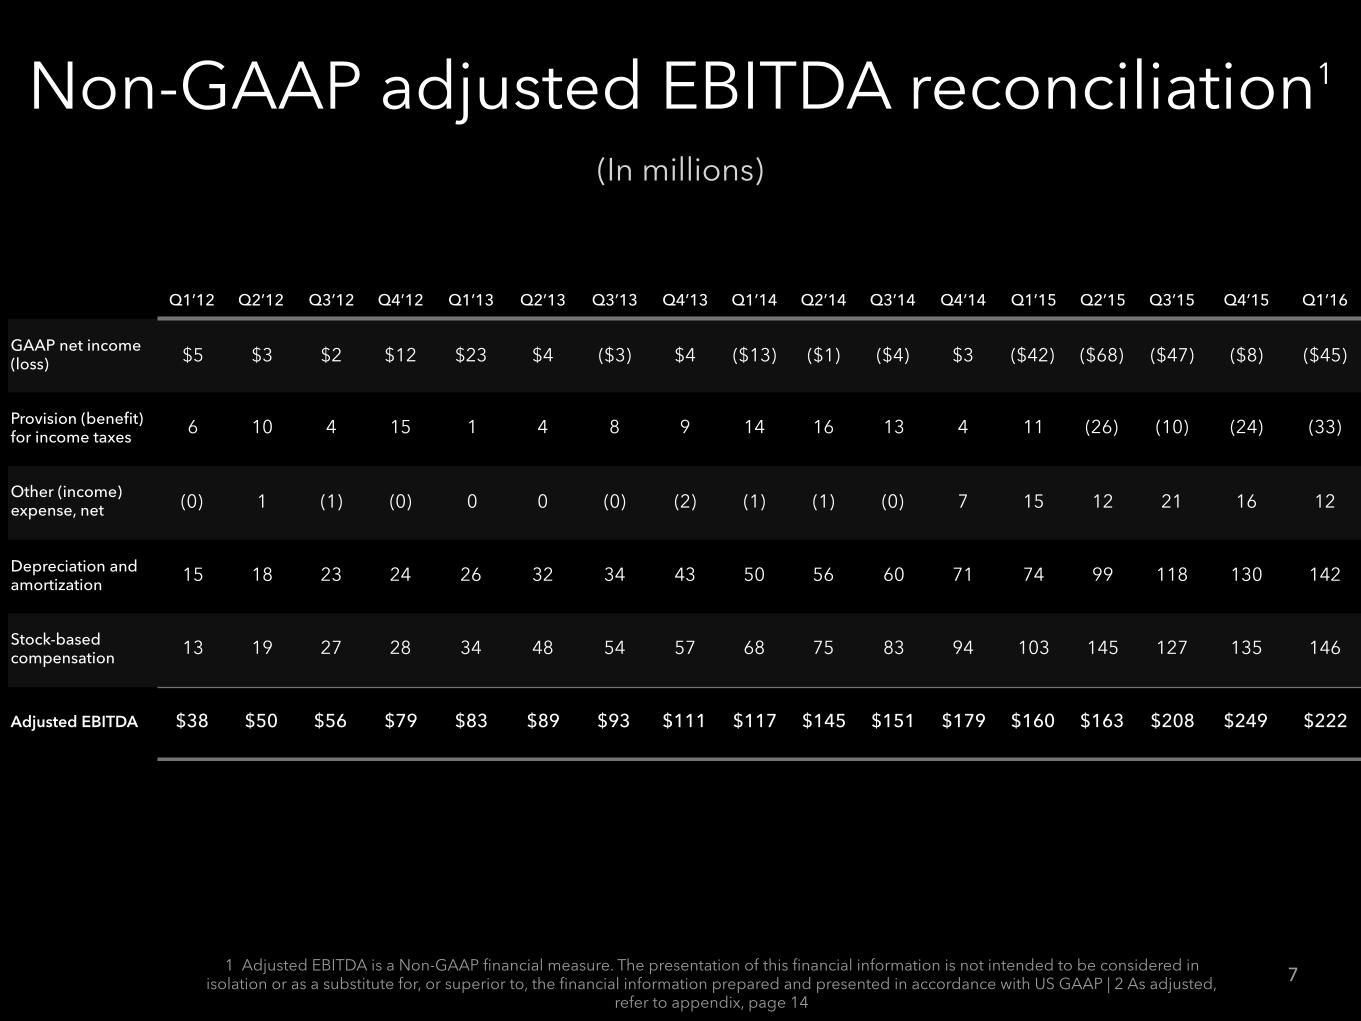
Non-GAAP adjusted EBITDA reconciliation1
Q1’12 Q2’12 Q3’12 Q4’12 Q1’13 Q2’13 Q3’13 Q4’13 Q1’14 Q2’14 Q3’14 Q4’14 Q1’15 Q2’15 Q3’15 Q4’15 Q1’16
GAAP net income (loss) $5 $3 $2 $12 $23 $4 ($3) $4 ($13) ($1) ($4) $3 ($42) ($68) ($47) ($8) ($45)
Provision (benefit) for income taxes 6 10 4 15 1 4 8 9 14 16 13 4 11 (26) (10) (24) (33)
Other (income) expense, net (0) 1 (1) (0) 0 0 (0) (2) (1) (1) (0) 7 15 12 21 16 12
Depreciation and amortization 15 18 23 24 26 32 34 43 50 56 60 71 74 99 118 130 142
Stock-based compensation 13 19 27 28 34 48 54 57 68 75 83 94 103 145 127 135 146
Adjusted EBITDA $38 $50 $56 $79 $83 $89 $93 $111 $117 $145 $151 $179 $160 $163 $208 $249 $222
7
(In millions)
1 Adjusted EBITDA is a Non-GAAP financial measure. The presentation of this financial information is not intended to be considered in isolation or as a substitute for, or superior to, the financial information prepared and presented in accordance with US GAAP | 2 As adjusted,
refer to appendix, page 14
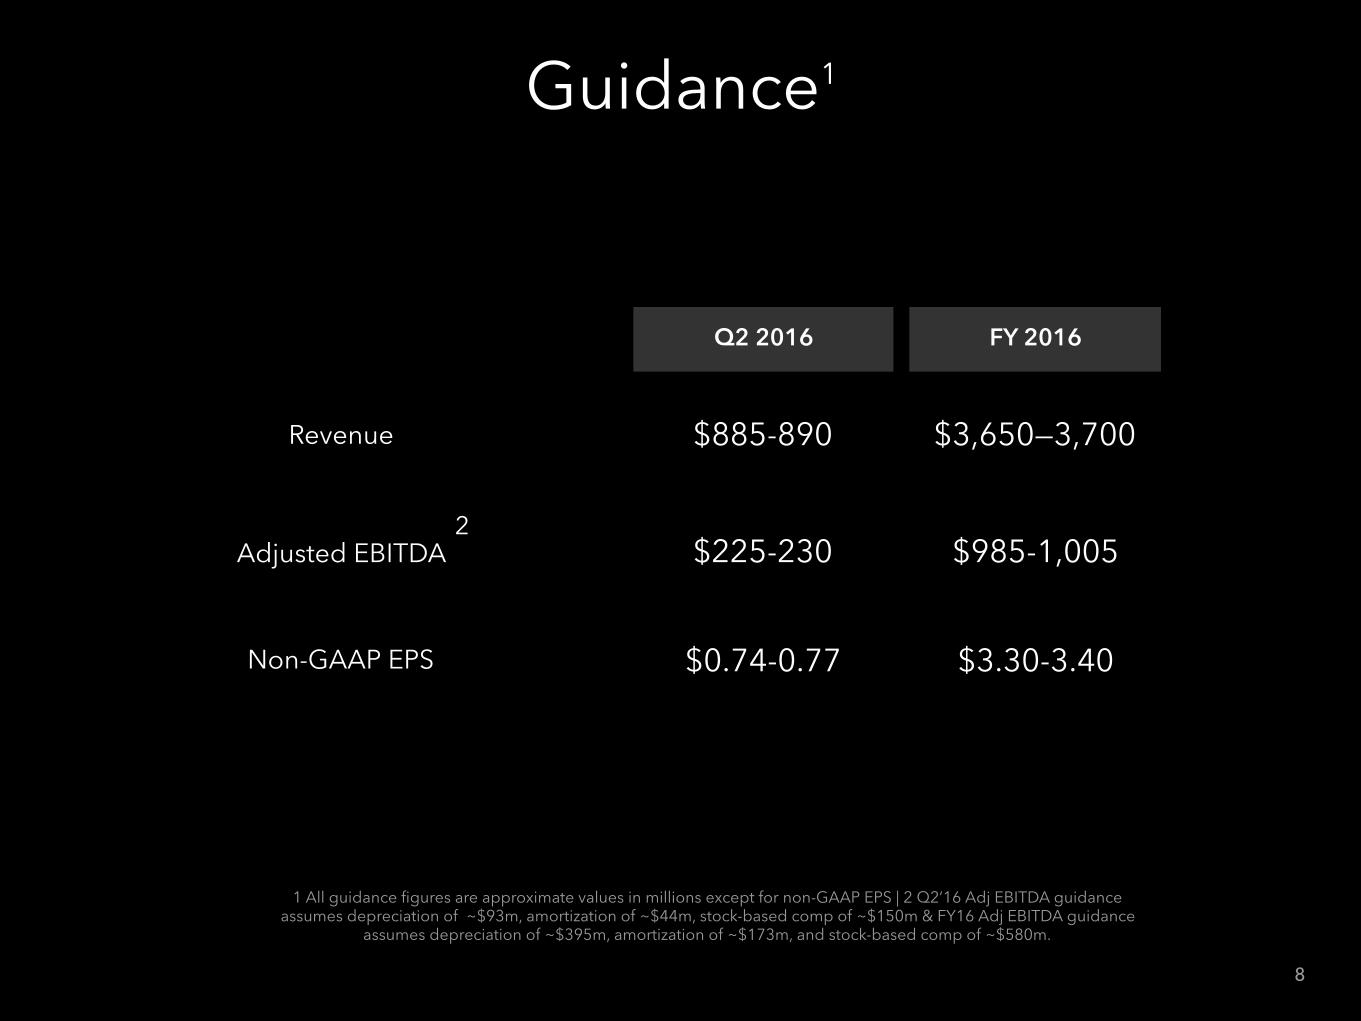
Guidance1
Q2 2016 FY 2016
Revenue $885-890 $3,650—3,700
Adjusted EBITDA $225-230 $985-1,005
Non-GAAP EPS $0.74-0.77 $3.30-3.40
1 All guidance figures are approximate values in millions except for non-GAAP EPS | 2 Q2’16 Adj EBITDA guidance assumes depreciation of ~$93m, amortization of ~$44m, stock-based comp of ~$150m & FY16 Adj EBITDA guidance
assumes depreciation of ~$395m, amortization of ~$173m, and stock-based comp of ~$580m.
8
2

Appendix
s 9

FY 2016Q1'14 Q2'14 Q3'14 Q4'14 Q1'15 Q2'15 Q3'15 Q4'15 Q1'16 FY13 FY14 FY15
COMPANY METRICSMembers (MM) 296 313 332 347 364 380 396 414 433 277 347 414
% y/y 36% 32% 28% 25% 23% 21% 20% 19% 19% 37% 25% 19%Unique Visiting Members (MM) 82 84 90 93 97 97 100 100 106 73 87 98
% y/y 26% 13% 16% 23% 18% 16% 11% 7% 9% 38% 19% 13%Mobile Unique Visiting Members (MM) 35 38 42 45 49 51 55 57 61 27 40 53
% y/y 73% 46% 45% 46% 38% 35% 30% 26% 25% 116% 51% 32%% of total unique visiting members 43% 45% 47% 49% 50% 52% 55% 57% 58% 36% 46% 54%
Member Page Views (BN) 26 25 28 30 34 35 38 37 45 83 109 143% y/y 43% 22% 28% 34% 30% 37% 33% 26% 34% 63% 31% 31%
REVENUE MIX BY PRODUCTNet Revenue ($MM) 473 534 568 643 638 712 780 862 861 1,529 2,219 2,991
% y/y 46% 47% 45% 44% 35% 33% 37% 34% 35% 57% 45% 35%Talent Solutions 292 322 345 369 396 443 502 535 558 910 1,328 1,877
% y/y 50% 49% 45% 41% 36% 38% 46% 45% 41% 67% 46% 41% Hiring 292 322 345 369 396 426 461 487 502 910 1,328 1,770
% y/y 50% 49% 45% 41% 36% 32% 34% 32% 27% 67% 46% 33% Learning & Development – – – – – 18 41 49 55 – – 107
% y/y n/a n/a n/a n/a n/a n/a n/a n/a n/a n/a n/a n/aMarketing Solutions 86 106 109 153 119 140 140 183 154 312 455 581
% y/y 33% 44% 45% 56% 38% 32% 28% 20% 29% 33% 46% 28%Premium Subscriptions 96 105 114 121 122 128 138 144 149 307 437 532
% y/y 46% 44% 43% 38% 28% 22% 21% 19% 22% 61% 42% 22% Percent of Total: Talent Solutions 62% 60% 61% 57% 62% 62% 64% 62% 65% 60% 60% 63% Marketing Solutions 18% 20% 19% 24% 19% 20% 18% 21% 18% 20% 20% 19% Premium Subscriptions 20% 20% 20% 19% 19% 18% 18% 17% 17% 20% 20% 18% REVENUE MIX BY GEOGRAPHYNet Revenue ($MM) 473 534 568 643 638 712 780 862 861 1,529 2,219 2,991
% y/y 46% 47% 45% 44% 35% 33% 37% 34% 35% 57% 45% 35%US 285 318 343 388 389 445 484 528 526 942 1,334 1,846
% y/y 41% 42% 40% 43% 37% 40% 41% 36% 35% 52% 42% 38%EMEA 118 135 140 162 157 169 187 218 218 358 555 730
% y/y 57% 59% 55% 50% 33% 25% 34% 34% 39% 65% 55% 32%APAC 39 46 49 54 54 59 65 70 71 119 187 247
% y/y 61% 64% 60% 49% 40% 28% 32% 30% 32% 71% 58% 32%Other Americas 32 36 37 39 38 40 44 47 45 110 143 168
% y/y 32% 32% 35% 24% 19% 12% 19% 19% 19% 66% 31% 17% Percent of Total: US 60% 60% 60% 60% 61% 62% 62% 61% 61% 62% 60% 62% International 40% 40% 40% 40% 39% 38% 38% 39% 39% 38% 40% 38%
EMEA 25% 25% 25% 25% 25% 24% 24% 25% 25% 23% 25% 24% APAC 8% 9% 9% 8% 8% 8% 8% 8% 8% 8% 8% 8% Other Americas 7% 7% 6% 6% 6% 6% 6% 5% 5% 7% 6% 6%
FY 2014 FY 2015 Full Year

FY 2016Q1'14 Q2'14 Q3'14 Q4'14 Q1'15 Q2'15 Q3'15 Q4'15 Q1'16 FY13 FY14 FY15
REVENUE MIX BY GEOGRAPHY, BY PRODUCTNet Revenue ($MM) 473 534 568 643 638 712 780 862 861 1,529 2,219 2,991
% y/y 46% 47% 45% 44% 35% 33% 37% 34% 35% 57% 45% 35%US Revenue 285 318 343 388 389 445 484 528 526 942 1,334 1,846 Talent Solutions 180 198 209 223 241 278 310 329 342 583 810 1,157
% y/y 43% 41% 37% 36% 33% 40% 49% 48% 42% 58% 39% 43% Marketing Solutions 49 59 69 95 77 92 93 115 98 180 272 377
% y/y 30% 44% 50% 72% 58% 55% 36% 21% 27% 30% 51% 39% Premium Subscriptions 55 61 66 71 71 75 81 84 87 179 252 311
% y/y 47% 42% 39% 37% 28% 24% 23% 19% 22% 60% 41% 23%International Revenue 188 216 225 255 248 267 295 334 334 586 885 1,145 Talent Solutions 111 124 136 147 156 166 192 207 216 327 518 720
% y/y 63% 63% 59% 51% 40% 33% 41% 41% 39% 85% 58% 39% Marketing Solutions 37 47 40 58 42 48 46 68 56 132 182 204
% y/y 37% 45% 36% 36% 13% 3% 14% 17% 34% 36% 38% 12% Premium Subscriptions 40 45 49 51 51 53 57 60 62 127 184 221
% y/y 44% 47% 49% 39% 27% 19% 17% 18% 22% 62% 45% 20% REVENUE MIX BY CHANNEL Net Revenue ($MM) 473 534 568 643 638 712 780 862 861 1,529 2,219 2,991
% y/y 46% 47% 45% 44% 35% 33% 37% 34% 35% 57% 45% 35%Field Sales 275 319 342 414 393 440 480 551 536 891 1,350 1,865
% y/y 50% 52% 50% 53% 43% 38% 40% 33% 36% 61% 51% 38%Online Sales 198 215 227 230 244 271 300 311 325 637 869 1,126
% y/y 41% 39% 37% 30% 23% 26% 32% 35% 33% 52% 36% 30% Percent of Total: Field Sales 58% 60% 60% 64% 62% 62% 62% 64% 62% 58% 61% 62% Online Sales 42% 40% 40% 36% 38% 38% 38% 36% 38% 42% 39% 38% GAAP P&L ($MM) Net revenue 473 534 568 643 638 712 780 862 861 1,529 2,219 2,991
Cost of revenue 62 70 75 87 88 100 111 119 118 203 294 419Sales & marketing 167 184 199 224 230 261 265 292 302 522 774 1,048Product development 121 129 137 150 166 190 203 217 238 396 536 776General & administrative 75 81 89 97 97 142 119 120 128 226 341 479Depreciation & amortization 50 56 60 71 74 99 118 130 142 135 237 420
Income (loss) from operations (1) 14 9 14 (17) (81) (37) (16) (66) 48 36 (151)Other income (expense), net 1 1 0 (7) (15) (12) (21) (16) (12) 1 (5) (64)Provision (benefit) for income taxes 14 16 13 4 11 (26) (10) (24) (33) 22 47 (50)
Net income (loss) (13) (1) (4) 3 (42) (68) (47) (8) (45) 27 (15) (165)Accretion of redeemable noncontrolling interest (0) (0) (0) (0) (0) (0) (1) (1) (1) – (0) (1)
Net income (loss) attributable to commonstockholders (13) (1) (4) 3 (43) (68) (47) (8) (46) 27 (16) (166)
Basic shares outstanding (MM) 121 122 123 125 125 128 131 132 133 114 123 129Diluted shares outstanding (MM) 121 122 123 127 125 128 131 132 133 119 123 129 Basic GAAP EPS attributable to common stockholders ($0.11) ($0.01) ($0.03) $0.02 ($0.34) ($0.53) ($0.36) ($0.06) ($0.35) $0.24 ($0.13) ($1.29)
Diluted GAAP EPS attributable to common stockholders ($0.11) ($0.01) ($0.03) $0.02 ($0.34) ($0.53) ($0.36) ($0.06) ($0.35) $0.23 ($0.13) ($1.29)
FY 2014 FY 2015 Full Year
FY 2016Q1'14 Q2'14 Q3'14 Q4'14 Q1'15 Q2'15 Q3'15 Q4'15 Q1'16 FY13 FY14 FY15
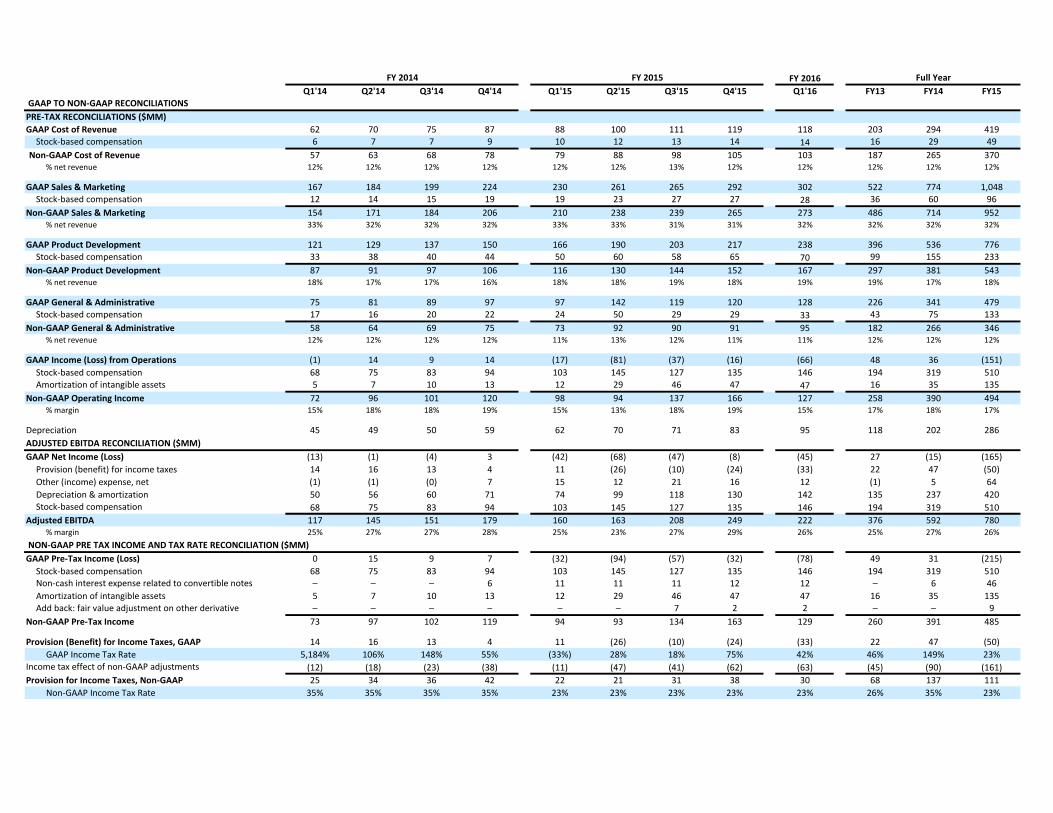
GAAP TO NON-GAAP RECONCILIATIONS PRE-TAX RECONCILIATIONS ($MM)GAAP Cost of Revenue 62 70 75 87 88 100 111 119 118 203 294 419
Stock-based compensation 6 7 7 9 10 12 13 14 14 16 29 49Non-GAAP Cost of Revenue 57 63 68 78 79 88 98 105 103 187 265 370
% net revenue 12% 12% 12% 12% 12% 12% 13% 12% 12% 12% 12% 12%
GAAP Sales & Marketing 167 184 199 224 230 261 265 292 302 522 774 1,048Stock-based compensation 12 14 15 19 19 23 27 27 28 36 60 96
Non-GAAP Sales & Marketing 154 171 184 206 210 238 239 265 273 486 714 952% net revenue 33% 32% 32% 32% 33% 33% 31% 31% 32% 32% 32% 32%
GAAP Product Development 121 129 137 150 166 190 203 217 238 396 536 776Stock-based compensation 33 38 40 44 50 60 58 65 70 99 155 233
Non-GAAP Product Development 87 91 97 106 116 130 144 152 167 297 381 543% net revenue 18% 17% 17% 16% 18% 18% 19% 18% 19% 19% 17% 18%
GAAP General & Administrative 75 81 89 97 97 142 119 120 128 226 341 479Stock-based compensation 17 16 20 22 24 50 29 29 33 43 75 133
Non-GAAP General & Administrative 58 64 69 75 73 92 90 91 95 182 266 346% net revenue 12% 12% 12% 12% 11% 13% 12% 11% 11% 12% 12% 12%
GAAP Income (Loss) from Operations (1) 14 9 14 (17) (81) (37) (16) (66) 48 36 (151)Stock-based compensation 68 75 83 94 103 145 127 135 146 194 319 510Amortization of intangible assets 5 7 10 13 12 29 46 47 47 16 35 135
Non-GAAP Operating Income 72 96 101 120 98 94 137 166 127 258 390 494% margin 15% 18% 18% 19% 15% 13% 18% 19% 15% 17% 18% 17%
Depreciation 45 49 50 59 62 70 71 83 95 118 202 286ADJUSTED EBITDA RECONCILIATION ($MM) GAAP Net Income (Loss) (13) (1) (4) 3 (42) (68) (47) (8) (45) 27 (15) (165)
Provision (benefit) for income taxes 14 16 13 4 11 (26) (10) (24) (33) 22 47 (50)Other (income) expense, net (1) (1) (0) 7 15 12 21 16 12 (1) 5 64Depreciation & amortization 50 56 60 71 74 99 118 130 142 135 237 420Stock-based compensation 68 75 83 94 103 145 127 135 146 194 319 510
Adjusted EBITDA 117 145 151 179 160 163 208 249 222 376 592 780% margin 25% 27% 27% 28% 25% 23% 27% 29% 26% 25% 27% 26%
NON-GAAP PRE TAX INCOME AND TAX RATE RECONCILIATION ($MM) GAAP Pre-Tax Income (Loss) 0 15 9 7 (32) (94) (57) (32) (78) 49 31 (215)
Stock-based compensation 68 75 83 94 103 145 127 135 146 194 319 510Non-cash interest expense related to convertible notes – – – 6 11 11 11 12 12 – 6 46Amortization of intangible assets 5 7 10 13 12 29 46 47 47 16 35 135Add back: fair value adjustment on other derivative – – – – – – 7 2 2 – – 9
Non-GAAP Pre-Tax Income 73 97 102 119 94 93 134 163 129 260 391 485
Provision (Benefit) for Income Taxes, GAAP 14 16 13 4 11 (26) (10) (24) (33) 22 47 (50)GAAP Income Tax Rate 5,184% 106% 148% 55% (33%) 28% 18% 75% 42% 46% 149% 23%
Income tax effect of non-GAAP adjustments (12) (18) (23) (38) (11) (47) (41) (62) (63) (45) (90) (161)Provision for Income Taxes, Non-GAAP 25 34 36 42 22 21 31 38 30 68 137 111
Non-GAAP Income Tax Rate 35% 35% 35% 35% 23% 23% 23% 23% 23% 26% 35% 23%
FY 2014 FY 2015 Full Year

FY 2016Q1'14 Q2'14 Q3'14 Q4'14 Q1'15 Q2'15 Q3'15 Q4'15 Q1'16 FY13 FY14 FY15
NON-GAAP NET INCOME RECONCILIATION ($MM) GAAP Net Income (Loss) Attributable to Common Stockholders (13) (1) (4) 3 (43) (68) (47) (8) (46) 27 (16) (166)
Stock-based compensation 68 75 83 94 103 145 127 135 146 194 319 510Non-cash interest expense related to convertible notes – – – 6 11 11 11 12 12 – 6 46Amortization of intangible assets 5 7 10 13 12 29 46 47 47 16 35 135Accretion of redeemable noncontrolling interest 0 0 0 0 0 0 1 1 1 – 0 1Fair value adjustment on other derivative – – – – – – 7 2 2 – – 9Income tax effect of non-GAAP adjustments (12) (18) (23) (38) (11) (47) (41) (62) (63) (45) (90) (161)
Non-GAAP Net Income 47 63 66 77 73 71 103 126 99 192 254 373% margin 10% 12% 12% 12% 11% 10% 13% 15% 12% 13% 11% 12%
NON-GAAP SHARE COUNT RECONCILIATION (MM) GAAP basic shares outstanding 121 122 123 125 125 128 131 132 133 114 123 129Non-GAAP basic shares outstanding 121 122 123 125 125 128 131 132 133 114 123 129
GAAP diluted shares outstanding 121 122 123 127 125 128 131 132 133 119 123 129Dilutive shares under treasury stock method 4 3 3 – 3 2 2 2 1 – 3 2
Non-GAAP diluted shares outstanding 125 125 126 127 128 130 133 134 134 119 126 131
NON-GAAP EPS Basic Non-GAAP EPS $0.39 $0.52 $0.54 $0.62 $0.58 $0.56 $0.79 $0.96 $0.75 $1.69 $2.07 $2.89Diluted Non-GAAP EPS $0.38 $0.51 $0.52 $0.61 $0.57 $0.55 $0.78 $0.94 $0.74 $1.61 $2.02 $2.84
BALANCE SHEET ($MM)Cash, cash equivalents & marketable securities 2,306 2,367 2,264 3,443 3,530 3,033 3,089 3,119 3,160 2,329 3,443 3,119Property and equipment, net 407 476 557 741 755 793 906 1,047 1,139 362 741 1,047Working capital 2,078 2,134 2,026 3,239 3,342 2,740 2,771 2,747 2,762 2,113 3,239 2,747Total assets 3,562 3,721 3,906 5,427 5,538 6,557 6,717 7,011 7,209 3,353 5,427 7,011Total deferred revenue (short-term and long-term) 480 481 464 522 586 633 625 714 792 392 522 714Total stockholder's equity 2,761 2,875 2,995 3,325 3,416 4,193 4,292 4,469 4,612 2,629 3,325 4,469 CASH FLOW STATEMENT ($MM) Cash flows provided by operating activities 129 128 181 130 165 226 240 177 252 436 569 807Purchases of property and equipment 89 96 121 242 90 72 167 178 177 278 548 507Free Cash Flow 40 32 61 (111) 75 153 73 (1) 75 158 21 300
Cash flows provided by (used in) investing activities (448) (33) (320) (1,493) 371 (799) (57) (307) (41) (1,358) (2,293) (792)Cash flows provided by financing activities 24 40 25 1,300 27 3 1 46 0 1,454 1,388 78 TOTAL HEADCOUNT Total Headcount 5,416 5,758 6,442 6,897 7,633 8,735 9,273 9,372 9,732 5,045 6,897 9,372
% y/y 43% 36% 34% 37% 41% 52% 44% 36% 27% 46% 37% 36%
FY 2014 FY 2015 Full Year

Non-GAAP Financial Measures
Accretion of redeemable noncontrolling interest. The accretion of redeemable noncontrolling interest represents the accretion of the Company's redeemable noncontrolling interest to its redemption value. The Company excludes the accretion because it is non-cash in nature and because the Company believes that the non-GAAP financial measures excluding this item provide meaningful supplemental information regarding operating performance. In addition, excluding this item from the non-GAAP financial measures facilitates comparisons to historical operating results and comparisons to peer operating results.
Fair value adjustment on other derivative. These adjustments represent the changes in fair value of the cash settlement feature for the preferred shares in the Company's joint venture. The Company excludes these fair value adjustments because they are non-cash in nature and the Company believes that the non-GAAP financial measures excluding this item provide meaningful supplemental information regarding operating performance. In addition, excluding this item from the non-GAAP financial measures facilitates comparisons to historical operating results and comparisons to peer operating results.
Income tax effects and adjustments. The Company adjusts non-GAAP net income by considering the income tax effects of excluding items such as stock-based compensation and the amortization of acquired intangible assets. Beginning in the first quarter of 2014, the Company has implemented a static non-GAAP tax rate for evaluating its operating performance as well as for planning and forecasting purposes. This projected 10-year weighted average non-GAAP tax rate eliminates the effects of non-recurring and period specific items, which can vary in size and frequency and does not necessarily reflect the company's long-term operations. Historically, the Company computed a non-GAAP tax rate based on non-GAAP pre-tax income on a quarterly basis. Based on the Company's current forecast, a tax rate of 23% has been applied to its non-GAAP financial results for the current period. This rate will be adjusted annually, if necessary. The Company believes that adjusting for these income tax effects and adjustments provides additional transparency to the overall or “after tax” effects of excluding these items from its non-GAAP net income.
Dilutive shares under the treasury stock method. During periods with a net loss, the Company excluded certain potential common shares from its GAAP diluted shares because their effect would have been anti-dilutive. On a non-GAAP basis, these shares would have been dilutive. As a result, the Company has included the impact of these shares in the calculation of its non-GAAP diluted net income per share under the treasury stock method.
For more information on the non-GAAP financial measures, please see the “GAAP to Non-GAAP Reconciliations” in the table above. These reconciliations have more details on the US GAAP financial measures that are most directly comparable to non-GAAP financial measures and the related reconciliations between these financial measures.
LinkedIn Corporation and its subsidiaries, (the “Company”), provides this supplement to assist investors in evaluating the Company’s financial and operating metrics. The Company suggests that the notes to this supplement be read in conjunction with the financial tables. The Company intends to update the financial supplement on a quarterly basis.
To supplement its condensed consolidated financial statements, which are prepared and presented in accordance with US GAAP, the Company uses non-GAAP financial measures: adjusted EBITDA, non-GAAP net income, and non-GAAP diluted EPS (collectively the “non-GAAP financial measures”). The presentation of this financial information is not intended to be considered in isolation or as a substitute for, or superior to, the financial information prepared and presented in accordance with US GAAP. The Company uses these non-GAAP financial measures for financial and operational decision making and as a means to evaluate period-to-period comparisons. The Company believes that they provide useful information about operating results, enhance the overall understanding of past financial performance and future prospects, and allow for greater transparency with respect to key metrics used by management in its financial and operational decision making.
The Company excludes the following items from one or more of its non-GAAP measures:
Stock-based compensation. The Company excludes stock-based compensation because it is non-cash in nature and because the Company believes that the non-GAAP financial measures excluding this item provide meaningful supplemental information regarding operational performance and liquidity. The Company further believes this measure is useful to investors in that it allows for greater transparency to certain line items in its financial statements and facilitates comparisons to peer operating results.
Non-cash interest expense related to convertible senior notes. In November 2014, the Company issued $1.3 billion aggregate principal amount of 0.50% convertible senior notes. In accordance with GAAP, the Company separately accounted for the value of the conversion feature as a debt discount, which is amortized in a manner that reflects the Company’s non-convertible debt borrowing rate. Accordingly, the Company recognizes imputed interest expense on its convertible senior notes of approximately 4.7% in its statement of operations. The Company excludes the difference between the imputed interest expense and coupon interest expense, net of any capitalized interest, because it is non-cash in nature and because the Company believes that the non-GAAP financial measures excluding this item provide meaningful supplemental information regarding operational performance and liquidity. In addition, excluding this item from the non-GAAP measures facilitates comparisons to historical operating results and comparisons to peer operating results.
Amortization of acquired intangible assets. The Company excludes amortization of acquired intangible assets because it is non-cash in nature and because the Company believes that the non-GAAP financial measures excluding this item provide meaningful supplemental information regarding operational performance and liquidity. In addition, excluding this item from the non-GAAP measures facilitates comparisons to historical operating results and comparisons to peer operating results.

©2015 LinkedIn Corporation. All Rights Reserved.