lineking: crowdsourced line wait-time estimation using smartphones
TRANSCRIPT

LineKing: Crowdsourced Line Wait-TimeEstimation using Smartphones
Muhammed Fatih Bulut1, Yavuz Selim Yilmaz1, Murat Demirbas1,Nilgun Ferhatosmanoglu2, Hakan Ferhatosmanoglu3
1 University at Buffalo, SUNY, Buffalo, NY 14260, USA{mbulut,yavuzsel,demirbas}@buffalo.edu
2 THK University, Ankara 06790, [email protected]
3 Bilkent University, Ankara 06800, [email protected]
Abstract. This paper describes the design, implementation and deploy-ment of LineKing (LK), a crowdsourced line wait-time monitoring ser-vice. LK consists of a smartphone component (that provides automatic,energy-efficient, and accurate wait-time detection), and a cloud backend(that uses the collected data to provide accurate wait-time estimation).LK is used on a daily basis by hundreds of users to monitor the wait-timesof a coffee shop in our university campus. The novel wait-time estimationalgorithms deployed at the cloud backend provide mean absolute errorsof less than 2-3 minutes.
Key words: Crowdsourced sensing, Smartphone applications, Wait-time estimation
1 Introduction
Long and unpredictable line lengths at coffee shops, grocery stores, DMVs, andbanks are inconveniences of city life. A webservice that provides real-time es-timation of line wait-times would help us make informed choices and improvethe quality of our lives. While a line wait-time estimation service may first beregarded as a toy or luxury, it is worth recalling that webservices that we nowcategorize as necessities (e.g., maps, online shopping, social networks, and mobileinternet) have also been perceived as similar initially. Moreover, understandingwaiting line has benefits beyond improving the end-user experience because thishas been a long standing problem in the operations research area.
Our method to address the line wait-time detection problem is crowdsensingwith smartphones. In the very first prototype of our service, we asked usersto manually provide line wait-times when they are waiting in line and tried toserve other users with the data input by these. We quickly noticed that thisis an extra work for the users and the data arriving from the volunteers is tooscarce to serve good results to the queriers. In the later versions of our service,we automated the line wait-time detection by using the localization capabilitiesof the smartphones in an energy-efficient manner, which we detail in this paper.

2 Muhammed Fatih Bulut et al.
Line wait-time detection is, however, only one part of the problem. We foundthat even when our automated line wait-time detection component is returningdozens of readings daily, these readings are still too sparse and non-uniform toprovide accurate answers to real-time queries about line wait-times. To addressthis problem we applied statistical techniques (heuristic regression, exponentialsmoothing and Holt-Winters method) to the line wait-time data we collect. Thisallowed us to learn patterns from the current and historical data to provideaccurate responses to queries.
Our contributions are as follows:
1. We designed, implemented, and deployed a crowdsourced line wait-time esti-mation system called LineKing (LK). Our LK apps 1 for Android and iPhoneplatforms are downloaded by more than 1000 users in our university, and areused on a daily basis by hundreds of users to monitor the line wait-timesof a coffee shop in the student union of our university. To the best of ourknowledge, LK is the first crowdsourced line wait-time estimation service.
2. As part of LK, we implemented a fully automatic, energy-efficient, and ac-curate wait-time detection component on Android and iOS platforms. Thiscomponent uses new domain specific optimizations to achieve better accu-racy and performance.
3. For the wait-time estimation problem, we introduced a novel solution basedon a constrained nearest-neighbor search in a multi-dimensional space. Then,we improved it by adapting two statistical time-series forecasting meth-ods, namely exponential smoothing and Holt Winters, and demonstratedthe strengths and weaknesses of these solutions.
4. We collected and analyzed several months of line wait-time data, which canbe basis for other work on similar topics. To extend on our current work,we also discuss the challenges and opportunities for scaling LK to onlinemonitoring of line wait-times over many venues across the world.
Outline of the rest of the paper. We discuss related work next anddescribe the model and limitations of our deployment in Section 3. We presentthe line wait-time detection component of LK in Section 4 and the line wait-time estimation component in Section 5. Section 6 presents the results from ourdeployment and experiments. In section 7, we discuss techniques to scale LK toother coffee shops and franchises.
2 Related Work
2.1 Smartphone sensing
The increasing computational power and sensor capabilities of the smartphonesresulted in increasing interest on smartphone sensing [16, 9]. In TagSense [21],authors leverage camera, compass, accelerometer and GPS sensors of the phones
1 http://ubicomp.cse.buffalo.edu/ubupdates
LineKing: Crowdsourced Line Wait-Time Estimation using Smartphones 3
to provide an image tagging system. In [2], Bao and Choudhury introduce MoVithat employs smartphones to enable collaborative sensing using videos for rec-ognizing socially interesting events. In [20] Miluzzo et al. utilize smartphonesensors to infer user’s status and share on Facebook.
A significant portion of smartphone sensing focuses on location-sensing whereboth localization and power-aware sensing are explored. In [4], authors examinethe human localization in a building using smartphone sensors and randomlyplaced audio beacons in the building. In [22], authors identify four factors thatwaste energy: static use of location sensing mechanism, absence of use of othersensors, lack of cooperation among applications, and finally ignoring batterylevel while sensing. The paper analyzes aforementioned factors and proposesa middleware location sensing framework which adaptively a) toggles betweenGPS and network based on the accuracy of the providers, b) suppresses the useof location updates based on the context (i.e. user is stationary or moving), c)piggybacks on other applications’ location sensing mechanism and d) changesparameters of location updates based on the battery-level. However, that workdoes not focus on region monitoring and does not take distance into account asa factor for selecting the mode for providing localization. In LK we use distancefrom the point of interest for toggling the mode for providing the localization.
2.2 Line wait-time estimation
Line wait-time estimation has been explored mostly in the context of QueueTheory [5, 17]. Those works assume that examiners have full knowledge of theparameters, i.e. queue discipline, arrival rate, service rate etc. However, in ourproblem we only have wait-times and the associated timestamps. So queueingtheory is not easily applicable for our problem.
Line wait-time estimation is related to some problems in general time seriestheory where the task is to forecast future data using the previous ones. Numberof different techniques have been proposed in the literature ranging from ad hocmethods (i.e. moving average, exponential smoothing) to complex model-basedapproaches which take trend and seasonality into accounts (i.e. Decomposition,Holt-Winters, ARIMA) [7, 19, 12]. A major challenge is that general time se-ries analysis depend on data that is uniformly distributed along time. However,our application has non-uniform and initially sparse data that introduce newchallenges.
3 Model and Assumptions
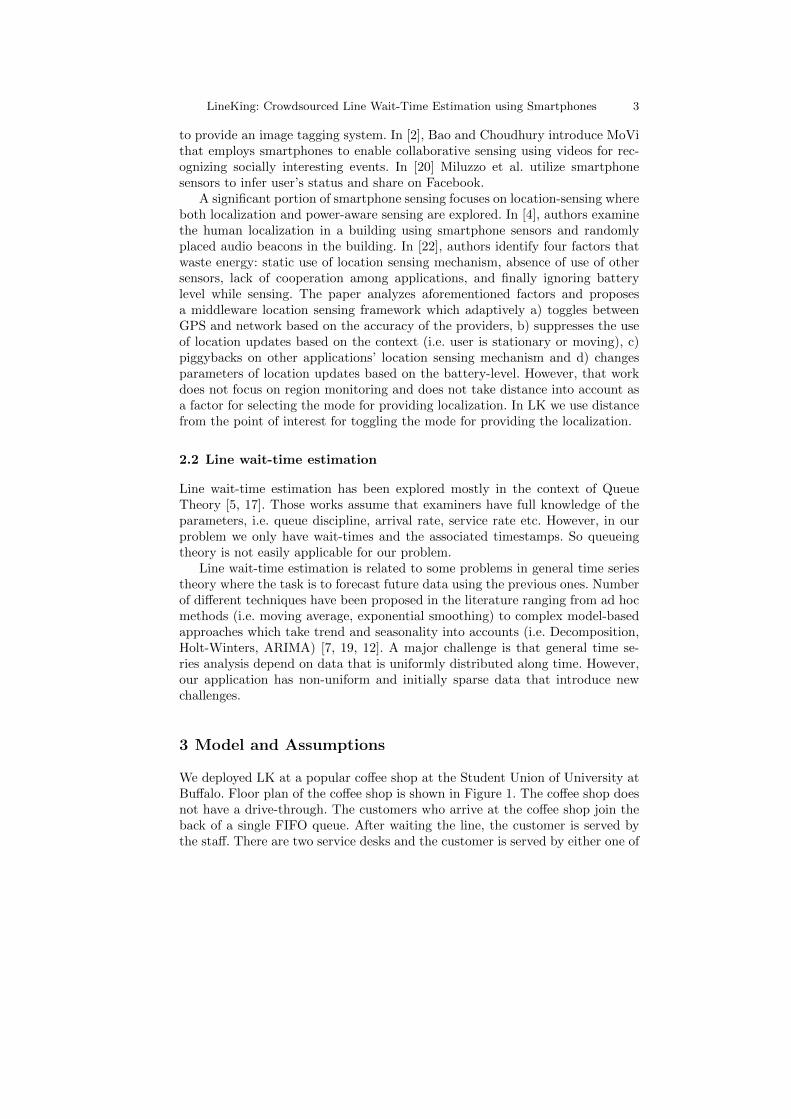
We deployed LK at a popular coffee shop at the Student Union of University atBuffalo. Floor plan of the coffee shop is shown in Figure 1. The coffee shop doesnot have a drive-through. The customers who arrive at the coffee shop join theback of a single FIFO queue. After waiting the line, the customer is served bythe staff. There are two service desks and the customer is served by either one of
4 Muhammed Fatih Bulut et al.
them. (During low traffic times one of the service desk may close temporarily andonly a single service desk is used.) Customers who are served usually leave thecoffee shop immediately. However there are some Student Union tables near theservice desks and some customers sit there after picking up their coffees. Thereis a Wi-Fi Access Point (WAP) on the nearby wall of the line to serve customer’sneed for internet access. The WAP has a range of approximately 50 meters. Ourdetection system utilizes BSSID of the WAP for wait-time detection.
Fig. 1. Coffee Shop Floor Plan
LK aims to estimate the total wait-time of a customer, and does not aimto calculate neither the line length nor the service time. Moreover, our wait-time detection component on the smartphones cannot differentiate between theseated customers and the customers who wait in the line. Therefore, there aretwo sources of false-positives in our system: 1) a customer who seats after beingserved, and 2) a customer who takes a look at the coffee shop without waiting inthe line. To get a sense of how the wait-time changes over the time, we physicallyobserved the coffee shop continuously for one week. Our observations show thatthe wait-times almost never fall below 2 minutes (i.e. min. service time) andabove 20 minutes. We use this information to eliminate false-positives. Althoughsome false-positives are eliminated this way, customers who sit between 2-to-20minutes still insert false-positives. Based on our observation sitting customersare the minority with respect to all customers, and our data-analysis techniquesmanage to filter their data as noise (see Section 5). Later, in Section 7, weexplain a way of differentiating seated customers from others to further increasethe accuracy of our detection component.
The wait-time detection component on the smartphones can only detect thetotal wait-time a customer spent in the coffee shop, hence, many parametersremain unknown, such as arrival rate, service rate, service time. This preventsus from having a complete understanding of the line’s operational model and
LineKing: Crowdsourced Line Wait-Time Estimation using Smartphones 5
introduce many challenges that need to be addressed in wait-time estimationcomponent.
[Start/Stop)monitoring])
Web)Service)(Apache)HTTP))
Pre;processor)
Model)Builder)
[JSON)Data])
[data])
[raw)data])
Controller)
WiFiSense) LocaJonSense)
[Start/Stop)monitoring]) [results])[results])
Phone)State)Receiver) Uploader)SQLite)
Database)
[state)is)changed]) [start)uploading])
MySQL)Database)
Wait;Jme)Forecaster) [data])[data])
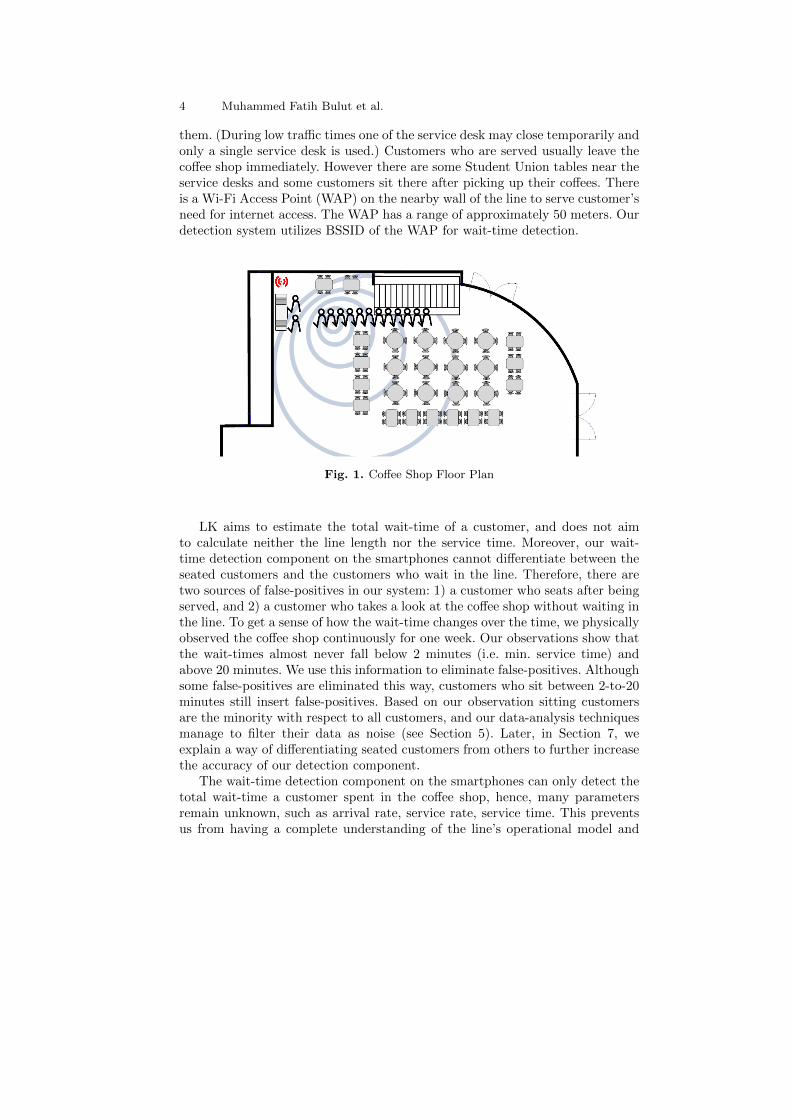
Fig. 2. Overall system architecture. Left: smartphone architecture for wait time de-tection. Right: cloud architecture for wait time estimation.
4 Smartphone Design
The overall architecture of the system is shown in Figure 2. LK consists oftwo main components: the client-side component on the smartphone, and theserver-side component on the cloud. In this section, we present the client-sidecomponent on the smartphone. The server-side component is explained in thenext section.
The client-side component includes a controller and three subcomponents:Phone-State-Receiver, Wait-Time-Detection (LocationSense+WiFiSense), andData-Uploader. The controller is responsible for managing and handling theinteractions between these subcomponents. We explain each subcomponent indetail next.
Remark: In the following sections, we describe the smartphone componentdesigned for the Android Operating System [1]. Due to the development limita-tions that iOS imposes, some of the features below are not available for iOS [11].We will refer to such features in the text to distinguish those parts.
4.1 Phone state receiver
This component serves as a notification center for the application. Android pro-vides a notification service to let apps know about various events occurring on thedevice, such as Boot, Reboot, Proximity Alert, Wi-Fi Signal Strength Changeetc. iOS also has similar functionalities such as Significant Location Change ac-tion. These notifications enable apps to take action based on relevant events.

6 Muhammed Fatih Bulut et al.
We exploit this notification service in order to improve the wait-time-detectionsubsystem.
The Phone-State-Receiver subsystem has three different receivers which areBoot Receiver, Wi-Fi State Receiver and Proximity Alert Receiver. In Android,receivers work as follows: First, each receiver registers itself to listen specificevents occurring on the device. Whenever the registered action happens, theoperating system broadcasts a special object, i.e. an Intent, and delivers theevent specific information to all registered receivers. We utilize this mechanismto monitor various relevant events for our application. For example, the Wi-FiState Receiver gets notified when the state of the Wi-Fi connection is changed:So if the user turns the Wi-Fi off, this receiver fires at the Controller to stopthe Wi-Fi Tracking Service if it is running. Another example is the ProximityAlert Receiver which notifies our app of entering and exiting the coffee shop. Weexplain this alert in detail next.
How does proximity alert work?Proximity alert is a service provided by the Android OS (Region Monitoring foriOS is also present) that periodically checks the location of the device and firesalerts for the entering and exiting events for a specified geo-fenced region. Theprogrammer can set the proximity alert by providing a location (i.e., latitude andlongitude) and a radius, which represents a circle around the location. On theother hand, the device also has a location and its location has an accuracy. Hence,while one circle denotes the geo-fence that the application tracks, another circledenotes the device’s location. When these two circles intersect entered event isfired, and when they are separated exited event is fired.
A natural way to detect wait-time is to set proximity alert for the coffeeshop and use entered and exited events to get notified. However, continuoususe of proximity alert drains the battery quickly. Figure 3 shows the batteryconsumption of an Android device which registers for only one location comparedto another Android device with no proximity alert. Even if we don’t move thedevice (same location), the former drained the battery in 18 hours compared toalmost 75% remaining battery level on the latter device.
Due to the costs of proximity alert (especially in Android), we do not useproximity alert directly. As we explain in the next section, our system sets aproximity alert only if the user is close to the targeted location. Otherwise, oursystem adaptively checks if the user is making progress towards the coffee shopby monitoring the distance.
4.2 Wait-time detection
The wait-time detection subsystem uses the device location and the BSSID of theWi-Fi Access Point (WAP) to detect the user’s presence at the coffee shop. Dueto the high energy cost of continuous sensing, we adopt a hint-based approachto initiate sensing. We utilize the following two hints: First, we assume that if auser opens the app to check the line wait-time, then she is a potential candidateto visit the coffee shop soon. Second, we utilize the user’s coarse-grained location

LineKing: Crowdsourced Line Wait-Time Estimation using Smartphones 7
0 5 10 15 20
020
4060
80100
Time (hour)
Bat
tery
Per
cent
age
Fig. 3. The effect of using proximity alert continuously. The dashed line representsthe battery level of a device which registers for one proximity alert, and the solid linerepresents a device which registers for none.
and start/stop monitoring if the user is close to the coffee shops. By using thesetwo hints LK achieves energy-efficient monitoring.
LK employs two alternative methods to detect the wait-time at a coffee shop:Location-sensing and WiFi-sensing. Both methods are orthogonal and returnresults with similar accuracies, which makes the two methods replaceable. If thecoffee shop does not have a WAP (or the WAP is not learned/validated yet),then the Location-sensing can be used. If the coffee shop is inside a big mallwhere the Location-sensing does not work accurately, then the WiFi-sensing ismore advantageous. In our deployment we used both methods, and we provideresults from both in the experiments section. We describe these two techniquesnext.
Location-sensing Once the smartphone component has a hint that the usermay go to a coffee shop, it dispatches a new job and starts monitoring the user’slocation. First the distance between the coffee shop and user’s current locationis calculated. If the user is close enough (i.e. R < 100 meters) to the targetedlocation, then the app sets a proximity alert to detect the timestamp of enteringto and leaving from the coffee shop. However, if the user is not close enough(R >= 100 meters), then the app schedules an alarm to check the locationagain on the estimated arrival time of the user. The estimated arrival time iscalculated based on the user’s current speed and her distance to the coffee shop.Before scheduling further alerts, our app expects user to make some progresstowards the coffee shop. If the user does not make any progress towards thetargeted location n consequtive times, then the job is cancelled. If there is aprogress towards the targeted location, then the proximity alert lets our app

8 Muhammed Fatih Bulut et al.
know at time t1 where user enters to and at time t2 where user leaves fromthe coffee shop. Having these two timestamps, wait-time is just the difference oft2 − t1 − ε where ε is the mean error which is accounted for the accuracy of thismethod (around 1.5 minutes).
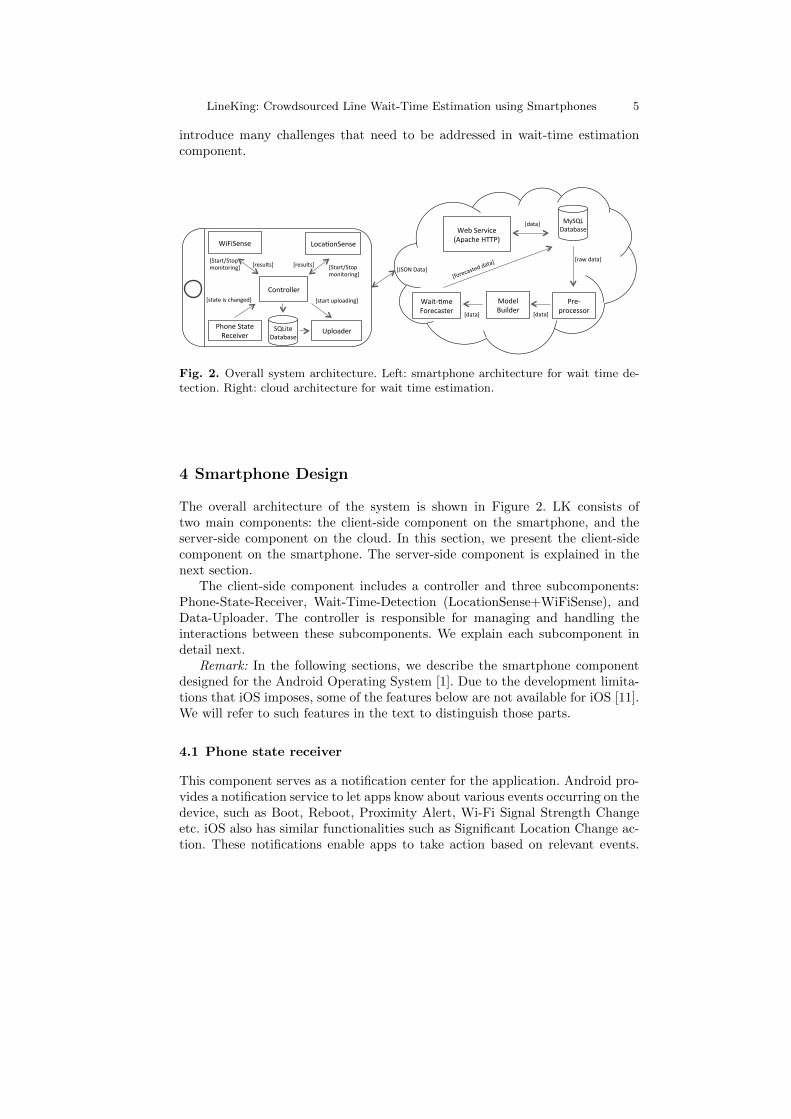
Location provider selection in smartphones:Smartphones provide various ways to obtain user’s location. GPS, cell towers,and WAPs are the main ones. Aside from these, there are two other mechanismto learn location: last-known location and passive location learning—a way ofgetting location whenever another application requests it. The location providedby these methods has its accuracy and timestamp on it. In Android, an applica-tion for tracking the location is free to choose among these methods. However,given the different sensing costs of these methods in terms of energy and time,we use a dynamic and adaptive selection of the location providers.
Since we are interested in the user’s proximity to the coffee shop, distance isan important parameter for our system. Hence, using the user’s distance fromthe targeted location, our app dynamically selects to use cell tower, WAP or GPSas a provider (see Figure 4). Android combines and uses cell tower and WAPlocations as the network location and differentiate it from the GPS location. InAndroid, our app first looks for the last-known location and calculate the user’sdistance by taking accuracy and timestamp of the location into account. If theCoffee Shop is very far away or the location is recent and accurate, then weuse the last-known location. Otherwise, we take the network location which ingeneral has a better accuracy. If it doesn’t satisfy the requirements too, thenwe take a more conservative approach and learn the location from GPS whichin general has a good accuracy of 10 meters. Note that last-known locationand network location is mostly available and they are not costly in terms ofthe battery. On the other hand GPS is costly and can easily drain the device’sbattery if over-used.
Wi-Fi sensing Our second method for wait-time detection is to leverage theWAP in the coffee shop. Nowadays, most of the coffee shops have Wi-Fi toprovide their customers easy and fast access to internet. Moreover, these WAPsgenerate beacons to broadcast their existence within the radius of 50-100 meters.And each beacon associates with a unique BSSID.
Once our system has a hint that the user will potentially visit the coffeeshop, it then starts to monitor Wi-Fi beacons periodically to detect enteringto and exiting from the targeted location. With the help of scanning abilityof WAPs without connecting to them (provided on the Android platform), oursystem tracks Wi-Fi beacons easily with little energy consumption. Having theWi-Fi scan results available, wait-time calculation is just the process of takingdifference of t2 − t1 − ε where t1 is the time we start and t2 is the time when westop to see Wi-Fi beacons of the WAP. Note that ε is the mean error for thismethod (around 1 minutes, accounting for the scanning period).
LineKing: Crowdsourced Line Wait-Time Estimation using Smartphones 9
Use$last(known$loca.on$
Started$
Use$Network$Provider$(Cell$Tower$
+$AP)$
Use$GPS$
Finished$
Loca.on$of$the$Coffee$Shop$[la.tude,$longitude]$
Recent,$Accurate$$
or$$distance$>>$threshold$
Recent,$Accurate,$
or$$distance$>>$threshold$
GPS$available,$accuracy$(>$good$
YES$
YES$
YES$
NO$
NO$
Restart$process$aOer$some$.me$
NO$
Fig. 4. Selecting among location providers
4.3 Data uploader
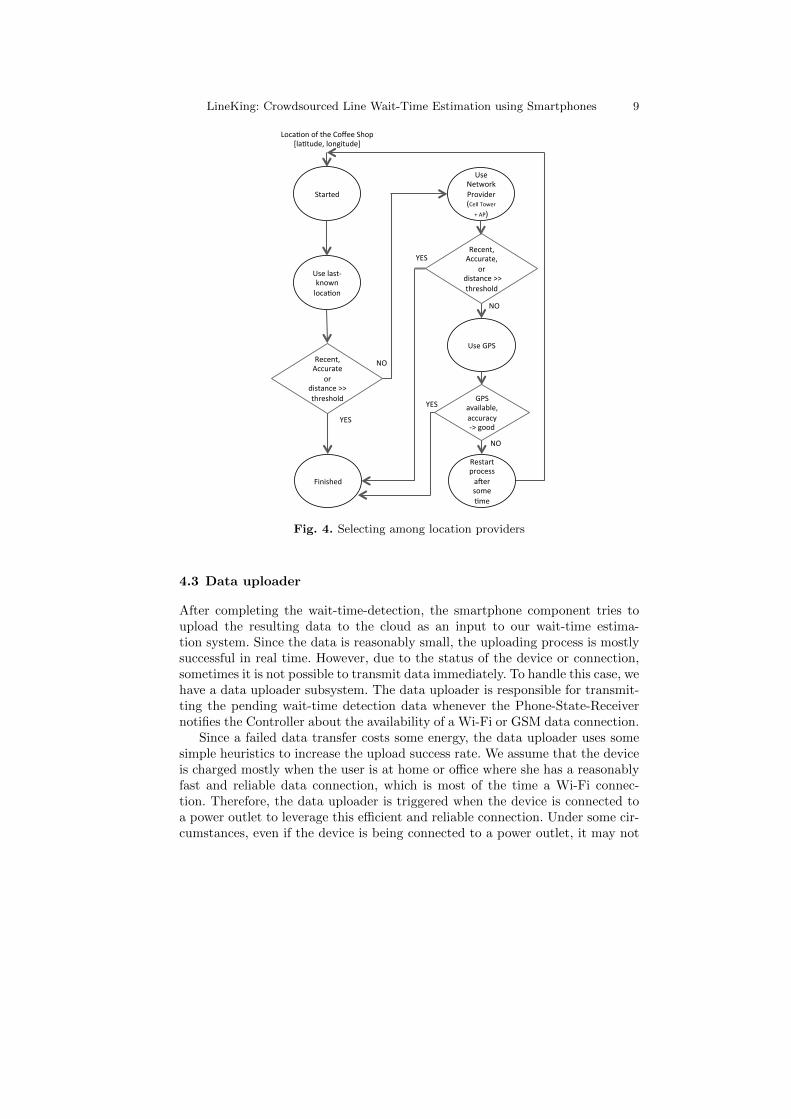
After completing the wait-time-detection, the smartphone component tries toupload the resulting data to the cloud as an input to our wait-time estima-tion system. Since the data is reasonably small, the uploading process is mostlysuccessful in real time. However, due to the status of the device or connection,sometimes it is not possible to transmit data immediately. To handle this case, wehave a data uploader subsystem. The data uploader is responsible for transmit-ting the pending wait-time detection data whenever the Phone-State-Receivernotifies the Controller about the availability of a Wi-Fi or GSM data connection.
Since a failed data transfer costs some energy, the data uploader uses somesimple heuristics to increase the upload success rate. We assume that the deviceis charged mostly when the user is at home or office where she has a reasonablyfast and reliable data connection, which is most of the time a Wi-Fi connec-tion. Therefore, the data uploader is triggered when the device is connected toa power outlet to leverage this efficient and reliable connection. Under some cir-cumstances, even if the device is being connected to a power outlet, it may not

10 Muhammed Fatih Bulut et al.
have such data connection available. If so, then the data uploader periodically(once an hour) checks for a data connection.
Data uploader stores the pending transfers inside a database that resides onthe device. The data is sent to server as a JSON object using HTTP POST.Once the data is successfully sent, which is confirmed by a response from theserver side, then the Data uploader clears up the database in order to save somestorage on the device.
5 Wait-Time Estimation
In this section, we present the wait-time estimation component of LK. Thiscomponent resides on the server-side (hosted on AWS EC2 cloud for scalabil-ity) and consists of four main components: Web service, Pre-processor, Model-builder and Wait-time forecaster. The web service serves as the interface betweensmartphones and the back-end. It accepts wait-times collected from the smart-phones and provides wait-time estimations for the querying smartphones. Datacollected from web service is fed into the pre-processing module which is respon-sible mainly for removing outliers and smoothing the data. After pre-processing,model builder builds a model from all the collected data. Lastly, the wait-timeforecaster module uses the model and estimates the future wait-times. Below wedescribe the data that we use for analysis, then we explain wait-time estimationin details.
Data: For our analysis, we used the 8 weeks of collected data (CD) between2012-02-27 and 2012-04-29 from 8am to 5pm 2. CD consists of the wait-timedetections that the LK app on the smartphones generated and transferred tothe back-end. This data is non-uniformly distributed along time, and is initiallysparse over the period it has been collected. The sparseness of the data graduallydecreases as the popularity of the application increases.
The raw CD contains outliers due to false-positives: some customers sit inthe coffee shop after being served, and some leave the coffee shop without beingserved. Thus, CD needs smoothing and outlier removal methods to filter outthe samples that do not provide direct information of wait-times. We utilizedistance-based outlier detection method defined in [14] to enable more accuratemodeling. Also, during preprocessing, we remove wait-times that are smallerthan 2 minutes (which is less than the observed min. service time) and largerthan 20 minutes (which is larger than the observed max. wait-time). As a resultthere are total of 1782 data points in our CD dataset.
Separate from CD, we also manually collected one week of Observed Data(OD) by physically observing and noting the wait-time in the coffee shop. ODconsists of wait-time data collected with equal intervals (every 10 minutes) be-tween 8am-5pm, and provides an accurate state of the line wait-times (withoutfalse-positives) for that week. Of course it is tedious to collect OD, and we can-not expect to obtain OD for all the businesses added to LK. Since we want our
2 A week is excluded due to spring break
LineKing: Crowdsourced Line Wait-Time Estimation using Smartphones 11
LK service to be scalable and bootstrap itself from the beginning, the wait-timeestimation techniques we developed do not rely on OD. We use OD only toobserve how wait-times changes along the time and to extract max. and min.wait-times.
Wait-time estimation problem: The problem is to estimate the linewait-time for any arriving query by using CD. Although the queries can be foranytime (past, now, future); we expect real-time querying for the current time(e.g., 5-10 minutes in to the future) to be most useful. Hence, the wait-timeestimation models need to access the most up-to-date information in CD. Wait-times usually depend on i) the time of the day, ii) weekday vs. weekend, and iii)seasonality depending on the nature of the business. For our specific coffee shop,there is less traffic in off-school days and weekends, and slightly more traffic incertain times of a day. An estimation method should capture all of these variablesaccurately.
The theory of time-series estimation has been usually based on regular uni-form time-series that contain enough samples. In our case, the data is neithercomplete nor uniform. Therefore, a general theory of time-series is not directlyapplicable on CD. However, as the popularity of the application increases andby employing techniques for filling missing data, we can overcome this challengeand build robust models to estimate wait-times. To achieve this, we developedtwo estimation approaches. Our two estimation approaches represent a spec-trum from a fast heuristic to a time-series model. Both approaches are designedto handle insufficient data and adapt/improve as more data is collected.
Our first approach is a Nearest neighbor estimation (NNE) based on con-strained nearest-neighbor search in a multi-dimensional space. This approachis dynamic and works well with non-uniform and sparse CD. In the second ap-proach, we improve NNE by building time-series model on CD using the previoushistory of wait-times. We show that both approaches provide considerably ac-curate estimations.
In Section 5.1 we explain our nearest neighbor estimation technique. In Sec-tion 5.2, we present the model-based time series estimation and finally in Sec-tion 5.3, we compare the estimation (forecasting) capabilities of the mechanisms.
Evaluation: We evaluate the approaches using their resulting Mean Abso-lute Error (MAE). Given a set of n wait-times: y1, y2, ..., yn and their estimatedvalues: f1, f2, ..., fn, MAE is defined in Equation 1.
MAE =1
n
n∑i=1
|fi − yi| (1)
5.1 NNE: Nearest neighbor estimation
The main idea in this method is to predict the queried values using the previoushistory of wait-times based on their similarity of values. To this end we iden-tify k nearest neighbor points (k-NN) for the query, where similarity is definedwith respect to the estimation potential. The key here is to design a similarity(neighborness) function that optimizes the estimation error for the query.
12 Muhammed Fatih Bulut et al.
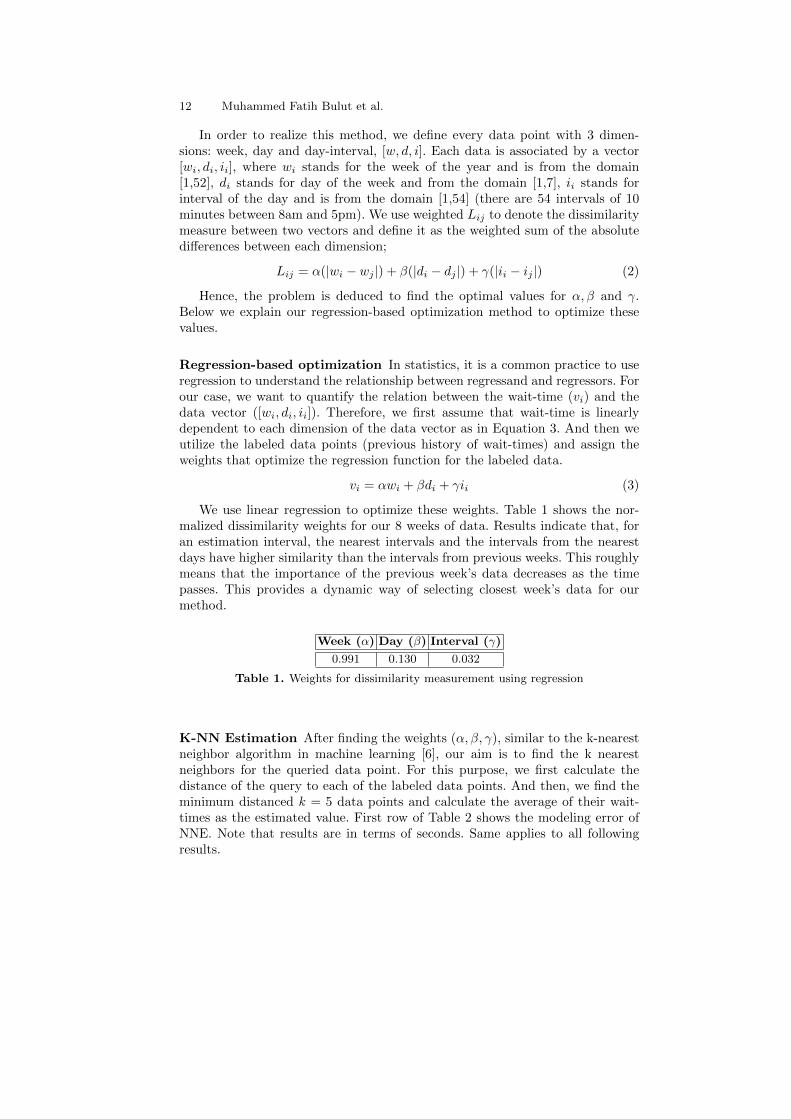
In order to realize this method, we define every data point with 3 dimen-sions: week, day and day-interval, [w, d, i]. Each data is associated by a vector[wi, di, ii], where wi stands for the week of the year and is from the domain[1,52], di stands for day of the week and from the domain [1,7], ii stands forinterval of the day and is from the domain [1,54] (there are 54 intervals of 10minutes between 8am and 5pm). We use weighted Lij to denote the dissimilaritymeasure between two vectors and define it as the weighted sum of the absolutedifferences between each dimension;
Lij = α(|wi − wj |) + β(|di − dj |) + γ(|ii − ij |) (2)
Hence, the problem is deduced to find the optimal values for α, β and γ.Below we explain our regression-based optimization method to optimize thesevalues.
Regression-based optimization In statistics, it is a common practice to useregression to understand the relationship between regressand and regressors. Forour case, we want to quantify the relation between the wait-time (vi) and thedata vector ([wi, di, ii]). Therefore, we first assume that wait-time is linearlydependent to each dimension of the data vector as in Equation 3. And then weutilize the labeled data points (previous history of wait-times) and assign theweights that optimize the regression function for the labeled data.
vi = αwi + βdi + γii (3)
We use linear regression to optimize these weights. Table 1 shows the nor-malized dissimilarity weights for our 8 weeks of data. Results indicate that, foran estimation interval, the nearest intervals and the intervals from the nearestdays have higher similarity than the intervals from previous weeks. This roughlymeans that the importance of the previous week’s data decreases as the timepasses. This provides a dynamic way of selecting closest week’s data for ourmethod.
Week (α) Day (β) Interval (γ)
0.991 0.130 0.032
Table 1. Weights for dissimilarity measurement using regression
K-NN Estimation After finding the weights (α, β, γ), similar to the k-nearestneighbor algorithm in machine learning [6], our aim is to find the k nearestneighbors for the queried data point. For this purpose, we first calculate thedistance of the query to each of the labeled data points. And then, we find theminimum distanced k = 5 data points and calculate the average of their wait-times as the estimated value. First row of Table 2 shows the modeling error ofNNE. Note that results are in terms of seconds. Same applies to all followingresults.

LineKing: Crowdsourced Line Wait-Time Estimation using Smartphones 13
Model MAE
NNE 234
Exp. Smoothing 34
Holt Winters 55
Table 2. Modeling error for the models
5.2 Model-based estimation
In this section, we explain how we apply time series theory to wait-time esti-mation problem as an improvement to our NNE method. As we stated earlier,time series analysis usually depends on uniform and equally spaced data. How-ever, CD does not fully convey these features. Besides it has outliers that makesmodeling more difficult. In this section, we present solutions to overcome theseshortcomings on CD. We first present how we generate uniform, equally-spacedtime series data which we call enhanced collected data (e-CD). Second, we pro-vide the analysis of e-CD. Finally, we fit the data to the time series forecastingmodels and provide results to evaluate their performance while comparing withour previous approach.
Missing data problem on CD In a typical data collection process, missingdata can occur for a variety of reasons including system failures, communicationfailures etc. In our case, we have missing data because in some intervals eitherthere was no users using our app in the coffee shop or the existing users wereunable to upload detected wait-times to our server yet. Although, we expectthese behaviors to minimize as more users use our app, until then we need tohandle these missing data and provide accurate wait-time estimation.
There are variety of ways to handle missing data; imputation, partial dele-tion, interpolation and regression are just some of the methods [18]. We adopt aregression-based estimation for filling and constructing equally-spaced (10 min-utes of intervals) data. Specifically, we adopt our nearest neighbor estimation(NNE) method that we defined in the previous section for handling missingdata. Since we cover most of the details of the method in previous section, wewill not repeat the same phenomena here. Basically, we fill the missing intervalusing the resulting regression model which is constructed by using previous his-tory of wait-times up to the queried interval. For the intervals that already havedata, we simply take the average of the collected data as the representative ofthat interval. In order to deal with outliers we apply a two-sided moving averagesmoothing to the data. After these processes we finally constructed equally-spaced (10 minutes), uniform time series; e-CD.
Analysis of e-CD In this section we analyze the enhanced collected data (e-CD) in details. This would enlighten our selection of forecasting models in thenext section. Figure 5(a) and (b) illustrate some statistical diagnostics of timeseries. The bell-shaped histogram plot and the wait-times being close to thestraight line in the normal probability plot (although a little bit skewed left

14 Muhammed Fatih Bulut et al.
for the higher values) indicate that the wait-times follow a normal distribution.Note that time-series models are more suitable for normally distributed dataand e-CD exhibits this behavior [3].
Traditionally, time-series data considered to be composed of trend, seasonal-ity, cyclical fluctuation and the random effect. Figure 5(c) and (d) shows trendand seasonal components of e-CD. As can be seen from the Figure 5(c), thereis an increasing trend for the wait-time which we believe due to the approach-ing summer. Figure 5(d) shows the seasonality component of e-CD. It clearlyexhibits seasonality and validate the selection of a model which has seasonalitycomponent.
200 400 600 800
0.000
0.002
0.004
Histogram of time-series
Wait-time (sec.)
Density
-3 -2 -1 0 1 2 3
200
400
600
800
Normal Q-Q Plot
Theoretical Quantiles
Sam
ple
Qua
ntile
s
2 4 6 8
420
460
500
Trend
Week
Wai
t-tim
e (s
ec.)
2 4 6 8
0.8
0.9
1.0
1.1
1.2
Seasonality
Week
Fig. 5. Statistical plots of e-CD. (a) Histogram of wait-times (b) Normal Q-Q Plot (c)Trend component of time series (d) Seasonality component of time series
Modeling e-CD As explained in the previous section, e-CD exhibits trend andseasonality which motivate us to use a model which takes these into accounts.In addition, it should be as light-weight as possible and can be incrementallyupdated as more data comes. This encourages us to use Holt-Winters forecastingmethod which is a widely used time-series forecasting model based on exponen-tial smoothing [10]. We experimentally select multiplicative seasonal model and
LineKing: Crowdsourced Line Wait-Time Estimation using Smartphones 15
choose data(αhw), trend(βhw) and seasonal(γhw) smoothing factors dynamicallyas more data comes. We’ve also considered other forecasting methods such asARIMA (Autoregressive integrated moving average) and exponential smooth-ing. However, we observed that ARIMA incurs significant computational costs,and therefore we opt-out it and compare Holt Winters with the ad hoc expo-nential smoothing. Second and third rows of Table 2 shows the modeling errorof Holt Winters and exponential smoothing. It is clear that the both models fitsperfectly to our e-CD in comparison to our initial NNE method.
5.3 Comparison of Models
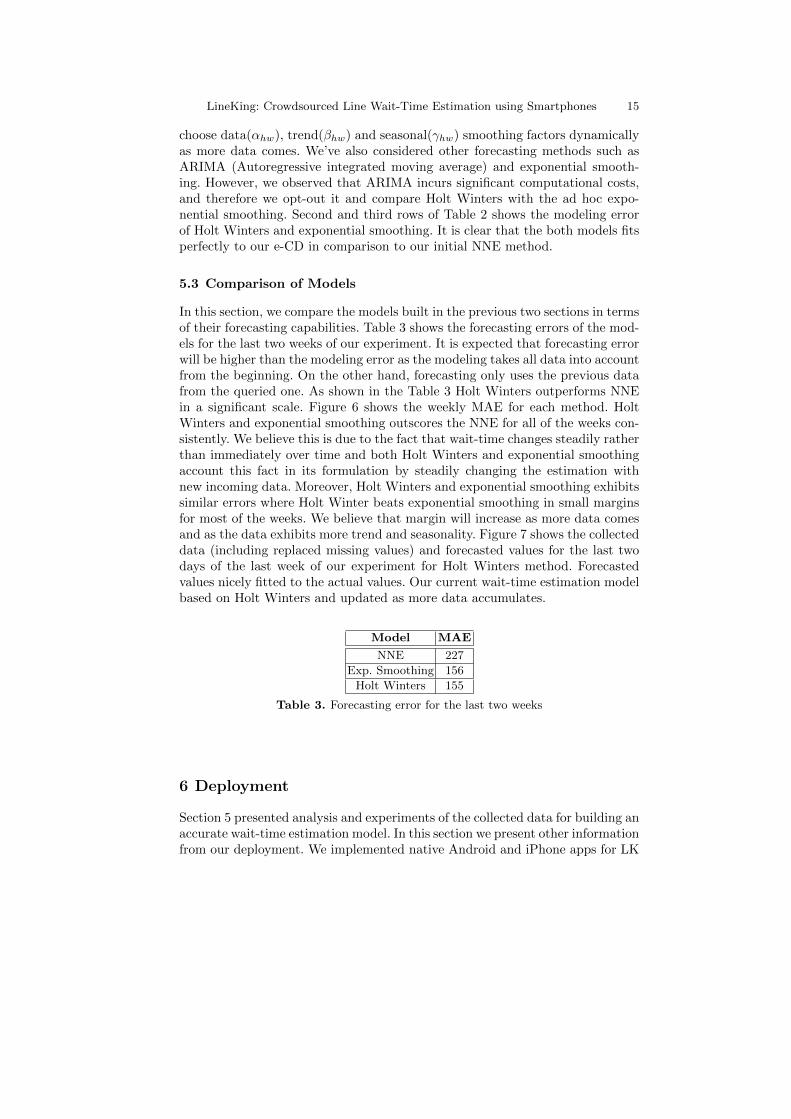
In this section, we compare the models built in the previous two sections in termsof their forecasting capabilities. Table 3 shows the forecasting errors of the mod-els for the last two weeks of our experiment. It is expected that forecasting errorwill be higher than the modeling error as the modeling takes all data into accountfrom the beginning. On the other hand, forecasting only uses the previous datafrom the queried one. As shown in the Table 3 Holt Winters outperforms NNEin a significant scale. Figure 6 shows the weekly MAE for each method. HoltWinters and exponential smoothing outscores the NNE for all of the weeks con-sistently. We believe this is due to the fact that wait-time changes steadily ratherthan immediately over time and both Holt Winters and exponential smoothingaccount this fact in its formulation by steadily changing the estimation withnew incoming data. Moreover, Holt Winters and exponential smoothing exhibitssimilar errors where Holt Winter beats exponential smoothing in small marginsfor most of the weeks. We believe that margin will increase as more data comesand as the data exhibits more trend and seasonality. Figure 7 shows the collecteddata (including replaced missing values) and forecasted values for the last twodays of the last week of our experiment for Holt Winters method. Forecastedvalues nicely fitted to the actual values. Our current wait-time estimation modelbased on Holt Winters and updated as more data accumulates.
Model MAE
NNE 227
Exp. Smoothing 156
Holt Winters 155
Table 3. Forecasting error for the last two weeks
6 Deployment
Section 5 presented analysis and experiments of the collected data for building anaccurate wait-time estimation model. In this section we present other informationfrom our deployment. We implemented native Android and iPhone apps for LK

16 Muhammed Fatih Bulut et al.
2 3 4 5 6 7 8
100
150
200
250
Week
Mea
n A
bsol
ue E
rror
(sec
.)
NNE Exp. S. Holt-Winters
Fig. 6. Weekly forecasting errors for models
0 20 40 60 80 100
200
400
600
800
1000
1200
Time Index
Wai
t-tim
e (s
ec.)
Collected data Forecasted data
Fig. 7. Collected vs. forecasted data for the last two days of the last week for HoltWinters method. Time Index spans 10 minutes of interval between 8am and 5pm fortwo days.
and made this available at the corresponding appstores for free. While Androidapp is written in Java using Eclipse and Android SDK, iPhone app is writtenin Objective-C using Xcode and iOS SDK. For the sake of scalability, we hostedback-end at AWS EC2. A screenshot of the application is shown in Figure 8. Itshows the current wait-time and a graph showcasing the past (left) and future(right) estimates of wait-times. We advertised LK through handing out fliers

LineKing: Crowdsourced Line Wait-Time Estimation using Smartphones 17
and putting ads on Facebook pages of various Student Clubs. As of writing thispaper, LK was downloaded by more than 1000 users in our campus. We receivedlots of positive feedbacks about the accuracy of estimation from the users.
Fig. 8. A screenshot from Android app
Since the iOS platform does not provide a lot of development flexibility, wewere unable to implement Wi-Fi sensing for wait-time detection and ended-upusing only the location-sensing based solution on the iPhone platform. This wasnot an issue for the Android platform and both Wi-Fi sensing and location-sensing solutions are fully implemented on the Android. On the other hand, wefound that the iOS platform had its own advantages: it was easier to implementa robust location-sensing on the iPhone than on the Android platform.
As we explained in Section 4, LK receives wait-time detection from twosources of information, i.e. location and WAP. Our 8 weeks of CD show that65% of incoming data is received from location-sensing (iPhone + Android),and the remaining 35% is received from Wi-Fi based sensing (only Android).Figure 9 shows the number of data points for the weeks we used for analysis,except that data is not preprocessed and it is for all day.
7 Discussion
While we presented LK’s deployment for one coffee shop, we believe LK’s de-ployment can be extended for other coffee-shops and businesses such as PostOffices, Banks and DMVs. To add a new business to the LK, we only require

18 Muhammed Fatih Bulut et al.
1 2 3 4 5 6 7 8 9
Week
No.
of D
ata
Poi
nts
0100200300400500600
Fig. 9. Incoming number of data points (for all day). Week 3 is spring break andexcluded from the wait-time analysis.
the geographical locations, i.e. latitude and longitude, of the business. After abusiness is added, LK immediately starts receiving line wait-time data from theusers visiting that business. Depending on the number of LK users visiting thebusiness, it may take time for LK to construct a model and start providing accu-rate wait-time estimations for the business. To speed up this process, a businessadded to LK may manually provide wait times for a week, or offer promotionsand coupons for users who install the LK app and check-in frequently. Below,we include more details on how to scale LK to a large set of locations.
7.1 Automated learning of BSSID
In our reported deployment we manually learned the BSSID of the WAP in thecoffee shop. However, in order to scale LK to other locations quickly, we canautomate this process as follows. Initially when the BSSID of the WAP in abusiness is still unknown, LK relies on just the Location sensing mechanism forwait-time detection. During this phase, LK app instances scan for the availableWAPs in that business location and upload these to the LK servers. Learning andvalidating the BSSID of a business involves recurring observations of the sameBSSID by different users at different times. After the BSSID of the business islearned, LK starts accepting line wait-time detections from that business viaWAP as well. This increases the data collected from that business and shortensthe period for constructing an accurate wait-estimation model.
7.2 Integrating LK with social networks
We plan to use social network services and APIs to quickly scale LK for line wait-time monitoring of businesses nationwide and worldwide. For example, we will

LineKing: Crowdsourced Line Wait-Time Estimation using Smartphones 19
obtain the geographical locations of new businesses to add to LK by using theFoursquare [8] Venue API (which does not even require a login to Foursquare).We also plan to integrate/embed LK as an extension to the existing popularlocation-based services such as Facebook, Foursquare and Google Places.
7.3 Improving wait-time detection
As we explained in previous sections, wait-time detection component of LK can-not differentiate between seated customers and the customers waiting in line. Inour deployment, majority of the customers leave the coffee shop immediately,therefore, false-positives do not constitute a problem. However, until enoughuser base is formed, it is possible that wait-time estimation at new businessesmight suffer from these false-positives. In order to eliminate these false-positivesin wait-time detection, we will try to distinguish between seated customers andwaiting customers by employing the state-of-the-art activity recognition tech-niques [15, 13]. These techniques use the accelerometers in the smartphones todifferentiate between different behaviors, including sitting and standing.
8 Conclusion
We described the design, implementation and deployment of LK, a crowdsourcedline wait-time monitoring service. LK consists of two main parts: smartphone andcloud back-end components. Smartphone component provides automatic, energyefficient and accurate wait-time detection by using domain specific optimizationsfor both Android and iOS. And cloud back-end provides accurate wait-time es-timation based on collected data from smartphones. In wait-time estimation,we introduced a novel solution based on a constrained nearest-neighbor searchin a multi-dimensional space. We then improve it by adapting two time-seriesforecasting methods namely exponential smoothing and Holt Winters. Our ex-periments show that, we managed to reduce the mean absolute error of ourservice to be less than 2-3 minutes. In our future work, we will add new busi-nesses to LK and try to scale our wait-time estimation service to a nationwidedeployment.
References
1. Android SDK, http://developer.android.com.2. Xuan Bao and Romit Roy Choudhury. Movi: mobile phone based video highlights
via collaborative sensing. In Proceedings of the 8th international conference onMobile systems, applications, and services, MobiSys ’10, pages 357–370, New York,NY, USA, 2010. ACM.
3. Peter J Brockwell and Richard A Davis. Time series: theory and methods. Springer-Verlag New York, Inc., New York, NY, USA, 1986.
20 Muhammed Fatih Bulut et al.
4. Ionut Constandache, Xuan Bao, Martin Azizyan, and Romit Roy Choudhury. Didyou see bob?: human localization using mobile phones. In Proceedings of the six-teenth annual international conference on Mobile computing and networking, Mo-biCom ’10, pages 149–160, New York, NY, USA, 2010. ACM.
5. R. B. Cooper. Introduction to Queueing Theory. North-Holland, New York, NY,second edition, 1981.
6. B. V. Dasarathy. Nearest Neighbor (NN) Norms: NN Pattern Classification Tech-niques. IEEE Computer Society Press, Los Alamitos, CA, 1991.
7. Christos Faloutsos. Mining time series data. In SBBD, pages 4–5, 2005.8. Foursquare venues platform, https://developer.foursquare.com/overview/
venues.9. Raghu K. Ganti, Fan Ye, and Hui Lei. Mobile crowdsensing: Current state and
future challenges. IEEE Communications Magazine, 49(11):32–39, 2011.10. Charles C. Holt. Forecasting seasonals and trends by exponentially weighted mov-
ing averages. International Journal of Forecasting, 20(1):5–10, 2004.11. iOS SDK, https://developer.apple.com.12. Konstantinos Kalpakis, Dhiral Gada, and Vasundhara Puttagunta. Distance mea-
sures for effective clustering of arima time-series. In Proceedings of the 2001 IEEEInternational Conference on Data Mining, ICDM ’01, pages 273–280, Washington,DC, USA, 2001. IEEE Computer Society.
13. Matthew Keally, Gang Zhou, Guoliang Xing, Jianxin Wu, and Andrew Pyles. Pbn:towards practical activity recognition using smartphone-based body sensor net-works. In Proceedings of the 9th ACM Conference on Embedded Networked SensorSystems, SenSys ’11, pages 246–259, New York, NY, USA, 2011. ACM.
14. Edwin M. Knorr and Raymond T. Ng. A unified approach for mining outliers. InProceedings of the 1997 conference of the Centre for Advanced Studies on Collab-orative research, CASCON ’97, pages 11–. IBM Press, 1997.
15. Jennifer R. Kwapisz, Gary M. Weiss, and Samuel A. Moore. Activity recognitionusing cell phone accelerometers. SIGKDD Explor. Newsl., 12(2):74–82, March2011.
16. Nicholas D. Lane, Emiliano Miluzzo, Hong Lu, Daniel Peebles, Tanzeem Choud-hury, and Andrew T. Campbell. A survey of mobile phone sensing. Comm. Mag.,48:140–150, September 2010.
17. D V Lindley. The theory of queues with a single server. Mathematical Proceedingsof the Cambridge Philosophical Society, 48(02):277, 1952.
18. Roderick J A Little and Donald B Rubin. Statistical analysis with missing data.John Wiley & Sons, Inc., New York, NY, USA, 1986.
19. Oded Maimon and Lior Rokach, editors. Data Mining and Knowledge DiscoveryHandbook, 2nd ed. Springer, 2010.
20. Emiliano Miluzzo, Nicholas D. Lane, Shane B. Eisenman, and Andrew T. Camp-bell. Cenceme: injecting sensing presence into social networking applications. InProceedings of the 2nd European conference on Smart sensing and context, Eu-roSSC’07, pages 1–28, Berlin, Heidelberg, 2007. Springer-Verlag.
21. Chuan Qin, Xuan Bao, Romit Roy Choudhury, and Srihari Nelakuditi. Tagsense: asmartphone-based approach to automatic image tagging. In Proceedings of the 9thinternational conference on Mobile systems, applications, and services, MobiSys’11, pages 1–14, New York, NY, USA, 2011. ACM.
22. Zhenyun Zhuang, Kyu-Han Kim, and Jatinder Pal Singh. Improving energy effi-ciency of location sensing on smartphones. In Proceedings of the 8th internationalconference on Mobile systems, applications, and services, MobiSys ’10, pages 315–330, 2010.