line-1 hypomethylation in blood and tissue samples as an...
TRANSCRIPT

LINE-1 Hypomethylation in Blood and Tissue Samples asan Epigenetic Marker for Cancer Risk: A SystematicReview and Meta-AnalysisMartina Barchitta1, Annalisa Quattrocchi1, Andrea Maugeri1, Manlio Vinciguerra2,3*, Antonella Agodi1*
1 Department GF Ingrassia, University of Catania, Catania, Italy, 2 University College London, Institute for Liver and Digestive Health, Royal Free Campus, London, United
Kingdom, 3 Gastroenterology Unit, Department of Medical Sciences, IRCCS Casa Sollievo della Sofferenza, San Giovanni Rotondo, Italy
Abstract
Objective: A systematic review and a meta-analysis were carried out in order to summarize the current published studiesand to evaluate LINE-1 hypomethylation in blood and other tissues as an epigenetic marker for cancer risk.
Methods: A systematic literature search in the Medline database, using PubMed, was conducted for epidemiologicalstudies, published before March 2014. The random-effects model was used to estimate weighted mean differences (MDs)with 95% Confidence Intervals (CIs). Furthermore, subgroup analyses were conducted by sample type (tissue or bloodsamples), cancer types, and by assays used to measure global DNA methylation levels. The Cochrane software packageReview Manager 5.2 was used.
Results: A total of 19 unique articles on 6107 samples (2554 from cancer patients and 3553 control samples) were includedin the meta-analysis. LINE-1 methylation levels were significantly lower in cancer patients than in controls (MD: 26.40, 95%CI: 27.71, 25.09; p,0.001). The significant difference in methylation levels was confirmed in tissue samples (MD 27.55; 95%CI: 29.14, 265.95; p,0.001), but not in blood samples (MD: 20.26, 95% CI: 20.69, 0.17; p = 0.23). LINE-1 methylation levelswere significantly lower in colorectal and gastric cancer patients than in controls (MD: 28.33; 95% CI: 210.56, 26.10; p,0.001 and MD: 25.75; 95% CI: 27.75, 23.74; p,0.001) whereas, no significant difference was observed for hepatocellularcancer.
Conclusions: The present meta-analysis adds new evidence to the growing literature on the role of LINE-1 hypomethylationin human cancer and demonstrates that LINE-1 methylation levels were significantly lower in cancer patients than in controlsamples, especially in certain cancer types. This result was confirmed in tissue samples, both fresh/frozen or FFPE specimens,but not in blood. Further studies are needed to better clarify the role of LINE-1 methylation in specific subgroups,considering both cancer and sample type, and the methods of measurement.
Citation: Barchitta M, Quattrocchi A, Maugeri A, Vinciguerra M, Agodi A (2014) LINE-1 Hypomethylation in Blood and Tissue Samples as an Epigenetic Marker forCancer Risk: A Systematic Review and Meta-Analysis. PLoS ONE 9(10): e109478. doi:10.1371/journal.pone.0109478
Editor: Masaru Katoh, National Cancer Center, Japan
Received June 23, 2014; Accepted August 31, 2014; Published October 2, 2014
Copyright: � 2014 Barchitta et al. This is an open-access article distributed under the terms of the Creative Commons Attribution License, which permitsunrestricted use, distribution, and reproduction in any medium, provided the original author and source are credited.
Data Availability: The authors confirm that all data underlying the findings are fully available without restriction. All relevant data are within the paper and itsSupporting Information files.
Funding: The authors have no funding or support to report.
Competing Interests: Manlio Vinciguerra has served as a PLOS ONE Editorial Board member for three years. This does not alter the authors’ adherence to PLOSONE Editorial policies and criteria.
* Email: [email protected] (AA); [email protected] (MV)
Introduction
Epigenetic alterations, heritable DNA modifications that do not
involve changes in the DNA sequence, are associated with changes
in gene expression and are important in maintaining genomic
stability [1]. Among epigenetic mechanisms, DNA methylation is
the most commonly studied and involved in various biological
processes including cancer [2–5]. Global hypomethylation, an
overall genome-wide reduction in DNA methylation content, is
associated with genomic instability and an increased number of
mutational events [6]. Genomic DNA hypomethylation is likely to
result from demethylation in repetitive elements, which account
for about 55% of the human genome and determine gene
regulation and genomic stability [7,8]. Long Interspersed Nucle-
otide Element 1 (LINE-1) and Alu repetitive elements are major
constituents of interspersed DNA repeats. Due to their high
occurrence throughout the genome, methylation in repetitive
elements have been shown to correlate with global genomic DNA
methylation content and demethylation has been associated with
genome instability and chromosomal aberrations. Thus, LINE-1
and Alu have been used as global surrogate markers for estimating
the genomic DNA methylation level in cancer tissues [6,9–10] and
in peripheral blood leukocytes [11]. LINE-1 hypomethylation was
observed in several types of cancer [12–14] and was associated
with a poor prognosis [15]. In a meta-analysis [11], global DNA
hypomethylation in peripheral blood leukocytes was associated
with increased cancer risk. Another meta-analysis, investigating
genome-wide DNA methylation in peripheral blood DNA and
PLOS ONE | www.plosone.org 1 October 2014 | Volume 9 | Issue 10 | e109478

cancer risk, reports a significant inverse association between
genomic 5-methylcytosine levels and cancer risk, but no overall
risk association using surrogates for genomic methylation,
including methylation at the LINE-1 and Alu repetitive elements
was found [16]. The aim of the present study was to carry out a
more comprehensive systematic review and a meta-analysis in
order to summarize the current published studies and to evaluate
LINE-1 hypomethylation in blood and other tissues as an
epigenetic marker for cancer risk.
Methods
Search strategy and selection criteriaA systematic literature search in the Medline database, using
PubMed, was carried out for epidemiological studies, published
before March 2014, investigating the association between LINE-1
hypomethylation and cancer risk. The searches were limited to
studies written in English; abstracts and unpublished studies were
not included. Literature search was conducted independently by
two Authors. The following selection criteria were used to search
articles and abstracts: (‘‘cancer’’ or ‘‘tumor’’ or ‘‘carcinoma’’)
AND (‘‘LINE-1’’ or ‘‘Long Interspersed Element-1’’ or ‘‘global’’)
AND (‘‘hypomethylation’’ or ‘‘methylation’’). Moreover, the
reference lists from selected articles were checked to search for
further relevant studies. No studies were excluded a priori for
weakness of design or data quality. Articles were included in the
quantitative analysis only if they satisfied the following criteria: (1)
case-control or cohort study designs; and (2) studies that reported
mean values and standard deviations (SD) of DNA methylation
level in cancer patients and in control group. Furthermore
exclusion criteria were as follows: (1) the study reporting only
results as median of the methylation levels or through graphic
display, or 95% confidence intervals (CIs) with adjusted odds ratios
(OR) or relative risks for cancer risk in subjects with the lowest
level of global DNA methylation (tertile, quartile or decile)
compared to group with the highest level, (2) the study reporting
only gene-specific DNA methylation analysis, and (3) review
articles.
Where there were missing data or additional information were
required, study Authors were contacted by email.
The preferred reporting items for systematic reviews and meta-
analysis (PRISMA) guidelines for the conduct of meta-analysis
were followed [17].
Data collection and extractionTwo of the Authors independently reviewed all the eligible
studies and abstracted the following information in a standard
format: first Author’s last name, year of publication, country where
the study was performed, study design, cancer sites and types,
sample type, experimental methods to measure global DNA
methylation levels, number of cases and controls, mean values and
SD of global DNA methylation levels for each group and main
results.
Figure 1. Flow diagram of study selection.doi:10.1371/journal.pone.0109478.g001
Hypomethylation and Cancer: A Meta-Analysis
PLOS ONE | www.plosone.org 2 October 2014 | Volume 9 | Issue 10 | e109478

Ta
ble
1.
Stu
die
sin
clu
de
din
the
syst
em
atic
revi
ew
and
inth
em
eta
-an
alys
is.
Au
tho
r(Y
ea
r)C
ou
ntr
yS
tud
yd
esi
gn
Ca
nce
rty
pe
Sa
mp
lety
pe
Ass
ay
Nu
mb
er
of
case
s/co
ntr
ols
Me
an
(SD
)C
ase
sM
ea
n(S
D)
Co
ntr
ols
Re
sult
s
An
telo
(20
12
)a*
Arg
en
tin
aR
etr
osp
ect
ive
Co
lore
ctal
(Ear
lyO
nse
t)T
issu
eP
yro
seq
ue
nci
ng
18
5/3
25
6.6
(8.6
)7
5.5
(1.5
)Ea
rly-
on
set
CR
Ch
adsi
gn
ific
antl
ylo
we
rLI
NE-
1m
eth
ylat
ion
leve
lsth
anan
yo
the
rg
rou
p
An
telo
(20
12
)b*
Arg
en
tin
aR
etr
osp
ect
ive
Co
lore
ctal
(Lyn
chSy
nd
rom
e)
Tis
sue
Pyr
ose
qu
en
cin
g2
0/3
26
6.3
(4.5
)7
5.5
(1.5
)
An
telo
(20
12
)c*
Arg
en
tin
aR
etr
osp
ect
ive
Co
lore
ctal
(Old
er
On
set
spo
rad
icM
SI-h
igh
)T
issu
eP
yro
seq
ue
nci
ng
46
/32
67
.1(5
.5)
75
.5(1
.5)
An
telo
(20
12
)d*
Arg
en
tin
aR
etr
osp
ect
ive
Co
lore
ctal
(Old
er
On
set
spo
rad
icM
SS/M
SI-l
ow
)T
issu
eP
yro
seq
ue
nci
ng
89
/32
65
.1(6
.3)
75
.5(1
.5)
Ch
oi
(20
07
)*U
SAR
etr
osp
ect
ive
Ne
uro
en
do
crin
eT
issu
eP
yro
seq
ue
nci
ng
35
/35
68
.5(1
0.0
)8
0.0
(7.1
)LI
NE-
1m
eth
ylat
ion
leve
lsw
ere
sig
nif
ican
tly
low
er
inca
nce
rti
ssu
es
than
inn
orm
alad
jace
nt
tiss
ue
s
Das
kalo
s(2
00
9)*
UK
Re
tro
spe
ctiv
eLu
ng
Tis
sue
Pyr
ose
qu
en
cin
g4
8/4
85
4.3
6(1
0.5
2)
69
.56
(1.1
)LI
NE-
1m
eth
ylat
ion
leve
lsw
ere
sig
nif
ican
tly
low
er
inca
nce
rti
ssu
es
than
inn
orm
alad
jace
nt
tiss
ue
s
Este
cio
(20
07
)*U
SAR
etr
osp
ect
ive
Co
lore
ctal
and
vari
ou
sca
nce
rce
lllin
es
Tis
sue
Pyr
ose
qu
en
cin
g6
0/6
05
4.9
(1.1
)6
4.3
(0.5
)LI
NE-
1m
eth
ylat
ion
leve
lsw
ere
sig
nif
ican
tly
low
er
inca
nce
rti
ssu
es
than
inn
orm
alad
jace
nt
tiss
ue
s
Hu
r(2
01
4)*
Spai
nR
etr
osp
ect
ive
Co
lore
ctal
Tis
sue
Pyr
ose
qu
en
cin
g7
7/7
76
6.2
(5.3
)7
5.8
(3.1
0)
Co
mp
are
dw
ith
no
rmal
adja
cen
tm
uco
sa,
bo
thp
rim
ary
can
cer
and
me
tast
asis
tiss
ue
we
resi
gn
ific
antl
yh
ypo
me
thyl
ate
dat
LIN
E-1
ele
me
nts
Iwag
ami
(20
13
)*Ja
pan
Pro
spe
ctiv
eEs
op
hag
eal
Tis
sue
Pyr
ose
qu
en
cin
g5
0/5
06
3.3
(12
.7)
78
.8(6
.2)
LIN
E-1
me
thyl
atio
nle
vels
we
resi
gn
ific
antl
ylo
we
rin
can
cer
tiss
ue
sth
anin
no
rmal
adja
cen
tti
ssu
es
Lee
(20
08
)*Sw
ed
en
Re
tro
spe
ctiv
eT
hyr
oid
Tis
sue
Pyr
ose
qu
en
cin
g2
1/2
17
1.3
(2.6
)7
1.8
(3.4
)LI
NE-
1m
eth
ylat
ion
chan
ge
sar
en
ot
ob
serv
ed
be
twe
en
can
cer
and
no
rmal
tiss
ue
s
Lee
(20
11
)*So
uth
Ko
rea
Re
tro
spe
ctiv
eG
astr
icT
issu
eC
OB
RA
LIN
E-1
53
/53
40
.23
(0.9
2)
45
.94
(1.7
8)
LIN
E-1
me
thyl
atio
nle
vels
we
resi
gn
ific
antl
ylo
we
rin
can
cer
tiss
ue
sth
anin
no
rmal
adja
cen
tti
ssu
es
Mat
sun
oki
(20
12
)*Ja
pan
Re
tro
spe
ctiv
eC
olo
rect
alT
issu
eM
ult
ico
lorM
eth
yLig
ht
Ass
ay4
8/4
86
3.6
1(1
3.9
1)
62
.54
(14
)LI
NE-
1m
eth
ylat
ion
leve
lsw
ere
sig
nif
ican
tly
low
er
inca
nce
rti
ssu
es
than
inn
orm
alad
jace
nt
tiss
ue
s
Hypomethylation and Cancer: A Meta-Analysis
PLOS ONE | www.plosone.org 3 October 2014 | Volume 9 | Issue 10 | e109478

Ta
ble
1.
Co
nt.
Au
tho
r(Y
ea
r)C
ou
ntr
yS
tud
yd
esi
gn
Ca
nce
rty
pe
Sa
mp
lety
pe
Ass
ay
Nu
mb
er
of
case
s/co
ntr
ols
Me
an
(SD
)C
ase
sM
ea
n(S
D)
Co
ntr
ols
Re
sult
s
Pav
icic
(20
12
)a*
Fin
lan
dR
etr
osp
ect
ive
Co
lore
ctal
(Sp
ora
dic
MSS
)T
issu
eM
S-M
LPA
55
/55
85
(6)
93
(2)
LIN
E-1
me
thyl
atio
nle
vels
we
resi
gn
ific
antl
ylo
we
rin
can
cer
tiss
ue
sth
anin
no
rmal
adja
cen
tti
ssu
es
Pav
icic
(20
12
)b*
Fin
lan
dR
etr
osp
ect
ive
Co
lore
ctal
(Sp
ora
dic
MSI
)T
issu
eM
S-M
LPA
52
/52
87
(5)
91
(4)
LIN
E-1
me
thyl
atio
nle
vels
we
resi
gn
ific
antl
ylo
we
rin
can
cer
tiss
ue
sth
anin
no
rmal
adja
cen
tti
ssu
es
Pav
icic
(20
12
)c*
Fin
lan
dR
etr
osp
ect
ive
Co
lore
ctal
(Lyn
chSy
nd
rom
e)
Tis
sue
MS-
MLP
A4
3/4
38
4(6
)9
0(5
)LI
NE-
1m
eth
ylat
ion
leve
lsw
ere
sig
nif
ican
tly
low
er
inca
nce
rti
ssu
es
than
inn
orm
alad
jace
nt
tiss
ue
s
Pav
icic
(20
12
)d*
Fin
lan
dR
etr
osp
ect
ive
Co
lore
ctal
(FC
CX
)T
issu
eM
S-M
LPA
18
/18
80
(8)
84
(6)
LIN
E-1
me
thyl
atio
nle
vels
we
resi
gn
ific
antl
ylo
we
rin
can
cer
tiss
ue
sth
anin
no
rmal
adja
cen
tti
ssu
es
Pav
icic
(20
12
)e*
Fin
lan
dR
etr
osp
ect
ive
Gas
tric
(Sp
ora
dic
MSS
)T
issu
eM
S-M
LPA
34
/34
79
(12
)9
0(5
)LI
NE-
1m
eth
ylat
ion
leve
lsw
ere
sig
nif
ican
tly
low
er
inca
nce
rti
ssu
es
than
inn
orm
alad
jace
nt
tiss
ue
s
Pav
icic
(20
12
)f *Fi
nla
nd
Re
tro
spe
ctiv
eG
astr
ic(S
po
rad
icM
SI)
Tis
sue
MS-
MLP
A1
1/1
18
8(4
)9
0(4
)LI
NE-
1m
eth
ylat
ion
leve
lsw
ere
sig
nif
ican
tly
low
er
inca
nce
rti
ssu
es
than
inn
orm
alad
jace
nt
tiss
ue
s
Pav
icic
(20
12
)g*
Fin
lan
dR
etr
osp
ect
ive
Gas
tric
(Lyn
chSy
nd
rom
e)
Tis
sue
MS-
MLP
A1
3/1
38
6(5
)9
0(5
)LI
NE-
1m
eth
ylat
ion
leve
lsw
ere
sig
nif
ican
tly
low
er
inca
nce
rti
ssu
es
than
inn
orm
alad
jace
nt
tiss
ue
s
Pav
icic
(20
12
)h*
Fin
lan
dR
etr
osp
ect
ive
End
om
etr
ial
(Lyn
chSy
nd
rom
e)
Tis
sue
MS-
MLP
A5
0/5
08
8(7
)9
0(7
)LI
NE-
1m
eth
ylat
ion
leve
lsw
ere
sig
nif
ican
tly
low
er
inca
nce
rti
ssu
es
than
inn
orm
alad
jace
nt
tiss
ue
s
Shig
aki
(20
13
)*Ja
pan
Pro
spe
ctiv
eG
astr
icT
issu
eP
yro
seq
ue
nci
ng
74
/74
72
.3(1
0.1
)7
9.2
(5.6
)LI
NE-
1m
eth
ylat
ion
leve
lsw
ere
sig
nif
ican
tly
low
er
inca
nce
rti
ssu
es
than
inn
orm
alad
jace
nt
tiss
ue
s
Shu
ang
sho
ti(2
00
7)*
Th
aila
nd
Re
tro
spe
ctiv
eC
erv
ixu
teri
ne
Tis
sue
CO
BR
ALI
NE-
17
/15
35
.63
(7.3
2)
40
.6(8
.86
)LI
NE-
1m
eth
ylat
ion
leve
lsw
ere
sig
nif
ican
tly
low
er
inca
nce
rp
atie
nts
than
inh
eal
thy
sub
ject
s
Sub
bal
ekh
a(2
00
8)*
Th
aila
nd
Re
tro
spe
ctiv
eH
ead
and
Ne
ckO
ral
rin
ses
CO
BR
ALI
NE-
13
8/3
73
7.5
3(2
.61
)4
1.7
8(2
.84
)LI
NE-
1m
eth
ylat
ion
leve
lsw
ere
sig
nif
ican
tly
low
er
inca
nce
rp
atie
nts
than
inh
eal
thy
sub
ject
s
Hypomethylation and Cancer: A Meta-Analysis
PLOS ONE | www.plosone.org 4 October 2014 | Volume 9 | Issue 10 | e109478

Ta
ble
1.
Co
nt.
Au
tho
r(Y
ea
r)C
ou
ntr
yS
tud
yd
esi
gn
Ca
nce
rty
pe
Sa
mp
lety
pe
Ass
ay
Nu
mb
er
of
case
s/co
ntr
ols
Me
an
(SD
)C
ase
sM
ea
n(S
D)
Co
ntr
ols
Re
sult
s
Cas
h(2
01
2)*
Ch
ina
Re
tro
spe
ctiv
eB
lad
de
rB
loo
dP
yro
seq
ue
nci
ng
51
0/5
28
81
.86
(1.8
2)
81
.96
(1.8
9)
LIN
E-1
me
thyl
atio
nw
ere
com
par
able
inca
ses
and
con
tro
ls
Liao
(20
11
)*C
en
tral
and
eas
tern
Euro
pe
Re
tro
spe
ctiv
eR
en
alce
llB
loo
dP
yro
seq
ue
nci
ng
32
8/6
54
82
.13
(1.8
6)
81
.74
(1.9
8)
LIN
E-1
me
thyl
atio
nle
vels
we
resi
gn
ific
antl
yh
igh
er
inca
nce
rp
atie
nts
than
inh
eal
thy
sub
ject
s
Mir
abe
llo(2
01
0)*
USA
Re
tro
spe
ctiv
eT
est
icu
lar
Blo
od
Pyr
ose
qu
en
cin
g1
52
/25
57
9.1
(0.1
77
)7
9.3
(0.1
28
)T
he
rew
asn
osi
gn
ific
ant
dif
fere
nce
be
twe
en
LIN
E-1
me
thyl
atio
nle
vels
inca
ses
and
con
tro
ls
Ram
zy(2
01
1)*
Egyp
tR
etr
osp
ect
ive
He
pat
oce
llula
rB
loo
dC
OB
RA
LIN
E-1
50
/10
41
.86
(10
.06
)5
4.0
0(7
.82
)LI
NE-
1m
eth
ylat
ion
leve
lsw
ere
sig
nif
ican
tly
low
er
inca
nce
rp
atie
nts
than
inh
eal
thy
sub
ject
s
Tan
gki
jvan
ich
(20
07
)*T
hai
lan
dR
etr
osp
ect
ive
He
pat
oce
llula
rB
loo
dC
OB
RA
LIN
E-1
85
/30
46
.83
(7.7
4)
53
.45
(4.2
9)
LIN
E-1
me
thyl
atio
nle
vels
we
resi
gn
ific
antl
ylo
we
rin
can
cer
pat
ien
tsth
anin
he
alth
ysu
bje
cts
Wu
(20
12
)*T
aiw
anR
etr
osp
ect
ive
He
pat
oce
llula
rB
loo
dP
yro
seq
ue
nci
ng
30
2/1
25
07
6.2
(2.2
)7
6.2
(2.1
)T
he
rew
asn
osi
gn
ific
ant
dif
fere
nce
be
twe
en
LIN
E-1
me
thyl
atio
nle
vels
inca
ses
and
con
tro
ls
Bab
a(2
01
0)
USA
Pro
spe
ctiv
eC
olo
rect
alT
issu
eP
yro
seq
ue
nci
ng
86
9/N
AT
um
or
LIN
E-1
me
thyl
atio
nd
ata
ind
icat
ee
no
rmo
us
ep
ige
no
mic
div
ers
ity
of
ind
ivid
ual
colo
rect
alca
nce
rs
Bae
(20
12
)So
uth
Ko
rea
Pro
spe
ctiv
eG
astr
icT
issu
eP
yro
seq
ue
nci
ng
44
7(t
wo
sets
of
24
9an
d1
98
)/N
ALI
NE-
1h
ypo
me
thyl
atio
nis
ane
arly
eve
nt
inca
rcin
og
en
esi
san
dit
may
be
ap
rog
no
stic
ind
icat
or
ind
ep
en
de
nt
of
can
cer
stag
e
Bo
llati
(20
09
)It
aly
Re
tro
spe
ctiv
eM
ult
iple
Mye
lom
aB
on
em
arro
was
pir
ate
sP
yro
seq
ue
nci
ng
76
/11
Cas
es
sho
we
da
de
cre
ase
of
LIN
E-1
me
thyl
atio
nle
vels
com
par
ed
toco
ntr
ols
Ch
alit
chag
orn
(20
04
)T
hai
lan
dR
etr
osp
ect
ive
Gas
tric
Blo
od
CO
BR
ALI
NE-
11
7/1
7C
ase
ssh
ow
ed
ad
ecr
eas
eo
fLI
NE-
1m
eth
ylat
ion
leve
lsco
mp
are
dto
con
tro
ls
Ch
oi
(20
09
)U
SAR
etr
osp
ect
ive
Bre
ast
Blo
od
Pyr
ose
qu
en
cin
g1
9/1
8T
he
rew
asn
osi
gn
ific
ant
dif
fere
nce
be
twe
en
LIN
E-1
me
thyl
atio
nle
vels
inca
ses
and
con
tro
ls
Hypomethylation and Cancer: A Meta-Analysis
PLOS ONE | www.plosone.org 5 October 2014 | Volume 9 | Issue 10 | e109478

Ta
ble
1.
Co
nt.
Au
tho
r(Y
ea
r)C
ou
ntr
yS
tud
yd
esi
gn
Ca
nce
rty
pe
Sa
mp
lety
pe
Ass
ay
Nu
mb
er
of
case
s/co
ntr
ols
Me
an
(SD
)C
ase
sM
ea
n(S
D)
Co
ntr
ols
Re
sult
s
Dam
man
n(2
01
0)
Ge
rman
yR
etr
osp
ect
ive
Ova
rian
Tis
sue
QU
BR
A2
2/N
AH
igh
pre
vale
nce
of
LIN
E1h
ypo
me
thyl
atio
nth
rou
gh
ou
tal
ltu
mo
rst
age
s
Di
(20
11
)C
hin
aR
etr
osp
ect
ive
He
pat
oce
llula
rB
loo
dP
yro
seq
ue
nci
ng
31
5/3
56
Hyp
om
eth
ylat
ion
lead
toa
sig
nif
ican
t2
.6-f
old
incr
eas
ed
risk
for
HC
C
Fab
ris
(20
11
)It
aly
Re
tro
spe
ctiv
eC
hro
nic
lym
ph
ocy
tic
leu
kem
iaB
loo
dP
yro
seq
ue
nci
ng
77
/7LI
NE-
1m
eth
ylat
ion
leve
lsw
ere
sig
nif
ican
tly
low
er
inca
nce
rp
atie
nts
than
inh
eal
thy
sub
ject
s
Gao
(20
12
)C
hin
aR
etr
osp
ect
ive
Gas
tric
Blo
od
Pyr
ose
qu
en
cin
g1
92
/38
4T
he
rew
asn
osi
gn
ific
ant
dif
fere
nce
be
twe
en
LIN
E-1
me
thyl
atio
nle
vels
inca
ses
and
con
tro
ls
Gao
(20
13
)C
hin
aP
rosp
ect
ive
He
pat
oce
llula
rT
issu
eSe
qu
en
cin
gan
dR
eal
-tim
eq
PC
R2
43
/48
Hyp
om
eth
ylat
ion
of
LIN
E-1
was
asso
ciat
ed
wit
htu
mo
ur
pro
gre
ssio
n,
larg
er
tum
ou
rsi
ze,
hig
he
rre
curr
en
cera
tes,
wo
rse
tum
ou
rst
age
and
po
or
tum
ou
rd
iffe
ren
tiat
ion
Ge
li(2
00
8)
Swe
de
nR
etr
osp
ect
ive
Ph
eo
chro
mo
cyto
ma
and
Par
agan
glio
ma
Tis
sue
Pyr
ose
qu
en
cin
g5
5/N
AC
ase
ssh
ow
ed
ad
ecr
eas
eLI
NE-
1m
eth
ylat
ion
leve
lsco
mp
are
dw
ith
con
tro
ls
Hsi
un
g(2
00
7)
USA
Re
tro
spe
ctiv
eH
ead
and
Ne
ckB
loo
dC
OB
RA
LIN
E-1
27
8/5
26
Th
em
ed
ian
me
thyl
atio
nle
vel
inco
ntr
ols
was
slig
htl
yb
ut
sig
nif
ican
tly
hig
he
rth
anth
em
ed
ian
leve
lin
case
s.H
ypo
me
thyl
atio
nle
adto
asi
gn
ific
ant
1.6
-fo
ldin
cre
ase
dri
skfo
rd
ise
ase
Ho
u(2
01
0)
Po
lan
dR
etr
osp
ect
ive
Gas
tric
Blo
od
Pyr
ose
qu
en
cin
g3
02
/42
1C
ance
rri
skw
ash
igh
est
amo
ng
tho
sew
ith
low
est
leve
lo
fm
eth
ylat
ion
inLI
NE-
1re
lati
veto
tho
sew
ith
the
hig
he
stle
vels
,al
tho
ug
hth
etr
en
ds
we
ren
ot
stat
isti
cally
sig
nif
ican
t
Igar
ash
i(2
01
0)
Jap
anR
etr
osp
ect
ive
GIS
TT
issu
eP
yro
seq
ue
nci
ng
10
6/N
ALI
NE-
1h
ypo
me
thyl
atio
nco
rre
late
ssi
gn
ific
antl
yw
ith
the
agg
ress
ive
ne
sso
ftu
mo
rsan
dit
cou
ldb
ea
use
ful
mar
ker
for
risk
asse
ssm
en
t
Hypomethylation and Cancer: A Meta-Analysis
PLOS ONE | www.plosone.org 6 October 2014 | Volume 9 | Issue 10 | e109478
Ta
ble
1.
Co
nt.
Au
tho
r(Y
ea
r)C
ou
ntr
yS
tud
yd
esi
gn
Ca
nce
rty
pe
Sa
mp
lety
pe
Ass
ay
Nu
mb
er
of
case
s/co
ntr
ols
Me
an
(SD
)C
ase
sM
ea
n(S
D)
Co
ntr
ols
Re
sult
s
Kre
ime
r(2
01
3)
Ge
rman
yR
etr
osp
ect
ive
Bla
dd
er
Tis
sue
Pyr
ose
qu
en
cin
g2
3/1
2LI
NE-
1m
eth
ylat
ion
was
sig
nif
ican
tly
de
cre
ase
din
can
cers
com
par
ed
ton
orm
alti
ssu
es
wit
hst
riki
ng
dif
fere
nce
sin
the
irp
erc
en
tm
ed
ian
valu
es
Og
ino
(20
08
)U
SAP
rosp
ect
ive
Co
lore
ctal
Tis
sue
Pyr
ose
qu
en
cin
g6
43
/NA
LIN
E-1
hyp
om
eth
ylat
ion
was
line
arly
asso
ciat
ed
wit
ha
stat
isti
cally
sig
nif
ican
tin
cre
ase
inca
nce
r–
spe
cifi
cm
ort
alit
y
Ph
oka
ew
(20
08
)T
hai
lan
dR
etr
osp
ect
ive
He
adan
dN
eck
Tis
sue
CO
BR
ALI
NE-
11
1/1
2LI
NE-
1m
eth
ylat
ion
leve
lat
eac
hlo
cus
isd
iffe
ren
t,it
can
be
infl
ue
nce
dd
iffe
ren
tial
lyd
ep
en
din
go
nw
he
reth
ep
arti
cula
rse
qu
en
ces
are
loca
ted
inth
eg
en
om
e
Po
bso
ok
(20
11
)T
hai
lan
dR
etr
osp
ect
ive
He
adan
dN
eck
Var
iou
sC
OB
RA
LIN
E-1
90
/11
4LI
NE-
1p
arti
alm
eth
ylat
ion
rep
rese
nts
hyp
om
eth
ylat
ion
inn
orm
alce
llsb
ut
hyp
erm
eth
ylat
ion
inca
nce
rce
lls
Sait
o(2
01
0)
Jap
anR
etr
osp
ect
ive
Lun
gT
issu
eR
eal
-tim
eP
CR
37
9/3
33
LIN
E-1
me
thyl
atio
nle
vels
we
resi
gn
ific
antl
ylo
we
rin
can
cer
pat
ien
tsth
anin
he
alth
ysu
bje
cts
Sig
alo
tti
(20
11
)It
aly
Re
tro
spe
ctiv
eM
ela
no
ma
Tis
sue
Pyr
ose
qu
en
cin
g4
2/4
LIN
E-1
me
thyl
atio
nis
ide
nti
fie
das
am
ole
cula
rm
arke
ro
fp
rog
no
sis
Sun
ami
(20
11
)U
SAR
etr
osp
ect
ive
Co
lore
ctal
Tis
sue
AQ
AM
A-P
CR
11
7/1
17
LIN
E-1
hyp
om
eth
ylat
ion
was
sig
nif
ican
tly
gre
ate
rin
ade
no
ma
tiss
ue
com
par
ed
toit
sco
nti
gu
ou
sn
orm
ale
pit
he
lium
and
can
cer
me
sen
chym
alti
ssu
e
Tra
nke
nsc
hu
h(2
01
0)
Ge
rman
yR
etr
osp
ect
ive
FLC
Tis
sue
Pyr
ose
qu
en
cin
g2
5/1
5N
oe
vid
en
ceo
fg
lob
alh
ypo
me
thyl
atio
nw
asfo
un
d
Van
Ho
ese
l(2
01
2)
USA
Pro
spe
ctiv
eB
reas
tT
issu
eA
QA
MA
-PC
R1
29
/10
9LI
NE-
1h
ypo
me
thyl
atio
nis
ap
rog
no
stic
bio
mar
ker
of
po
or
ou
tco
me
Hypomethylation and Cancer: A Meta-Analysis
PLOS ONE | www.plosone.org 7 October 2014 | Volume 9 | Issue 10 | e109478

Ta
ble
1.
Co
nt.
Au
tho
r(Y
ea
r)C
ou
ntr
yS
tud
yd
esi
gn
Ca
nce
rty
pe
Sa
mp
lety
pe
Ass
ay
Nu
mb
er
of
case
s/co
ntr
ols
Me
an
(SD
)C
ase
sM
ea
n(S
D)
Co
ntr
ols
Re
sult
s
Wilh
elm
20
10
USA
Re
tro
spe
ctiv
eB
lad
de
rB
loo
dP
yro
seq
ue
nci
ng
28
5/4
65
Be
ing
inth
elo
we
stLI
NE1
me
thyl
atio
nd
eci
lew
asas
soci
ate
dw
ith
asi
gn
ific
ant
1.8
-fo
ldin
cre
ase
dri
sko
fca
nce
r
Wo
lff
(20
10
)U
SAR
etr
osp
ect
ive
Bla
dd
er
Tis
sue
Pyr
ose
qu
en
cin
g1
13
/63
Cas
es
sho
we
da
de
cre
ase
LIN
E-1
me
thyl
atio
nle
vels
com
par
ed
wit
hco
ntr
ols
Ye
gn
asu
bra
man
ian
(20
08
)U
SAR
etr
osp
ect
ive
Pro
stat
eT
issu
eC
OM
PA
RE
76
/24
Cas
es
sho
we
da
de
cre
ase
LIN
E-1
me
thyl
atio
nle
vels
com
par
ed
wit
hco
ntr
ols
Zh
u(2
01
1)
USA
Re
tro
spe
ctiv
eV
ario
us
Blo
od
Pyr
ose
qu
en
cin
g2
05
/48
7In
div
idu
als
wit
hlo
we
stLI
NE-
1m
eth
ylat
ion
leve
lsh
ada
sig
nif
ican
t4
.4-f
old
incr
eas
ed
inci
de
nce
of
lun
gca
nce
r.N
osi
gn
ific
ant
asso
ciat
ion
sw
ere
ob
serv
ed
for
oth
er
tum
ors
(*)
Stu
die
sin
clu
de
din
the
me
ta-a
nal
ysis
(N=
19
).A
QA
MA
-PC
R:
Ab
solu
teQ
uan
tita
tive
Ass
ess
me
nt
Of
Me
thyl
ate
dA
llele
sP
CR
,C
OB
RA
LIN
E-1
:C
om
bin
ed
Bis
ulf
ite
Re
stri
ctio
nA
nal
ysis
LIN
E-1
,C
OM
PA
RE:
Co
mb
inat
ion
Of
Me
thyl
ate
dD
NA
Pre
cip
itat
ion
An
dR
est
rict
ion
Enzy
me
dig
est
ion
,C
RC
:C
olo
rect
alC
ance
r,FC
CX
:Fa
mili
alC
olo
rect
alC
ance
rty
pe
X,
FLC
:Fi
bro
lam
ella
rC
arci
no
ma,
GIS
T:
Gas
tro
inte
stin
alSt
rom
alT
um
ors
,LI
NE-
1:
Lon
gIn
ters
pe
rse
dN
ucl
eo
tid
eEl
em
en
t1
,M
SI:
Mic
roSa
telli
teIn
stab
le,
MS-
MLP
A:
Me
thyl
atio
n-S
pe
cifi
cM
ult
iple
xLi
gat
ion
-de
pe
nd
en
tP
rob
eA
mp
lific
atio
n,
MSS
:M
icro
Sate
llite
Stab
le,
QU
BR
A:
Qu
anti
tati
veB
isu
lfit
eR
est
rict
ion
An
alys
is.
do
i:10
.13
71
/jo
urn
al.p
on
e.0
10
94
78
.t0
01
Hypomethylation and Cancer: A Meta-Analysis
PLOS ONE | www.plosone.org 8 October 2014 | Volume 9 | Issue 10 | e109478

Statistical AnalysisAll data were analyzed using the REVIEW MANAGER 5.2
software provided by the Cochrane Collaboration (http://ims.
cochrane.org/revman).
The random-effects model was used to estimate weighted mean
differences (MDs) with 95% CI [18] and thus, no adjustment for
environmental effects was taken into account. Furthermore,
subgroup analyses were conducted by sample type (tissue or blood
samples), by sample source (fresh tissue or formalin-fixed, paraffin-
embedded, FFPE tissue), by cancer types (colorectal, stomach,
hepatocellular), and by assays used to measure global DNA
methylation levels. Forest plots were generated to illustrate the
study-specific effect sizes along with a 95% CI. Heterogeneity
across studies, was measured using the Q-test based on the x2
statistic, considering significant statistical heterogeneity as p,0.1.
As Cochran’s test only indicates the presence of heterogeneity
and not its magnitude, we also reported the I2 statistic, which
estimates the percentage of outcome variability that can be
attributed to heterogeneity across studies. An I2 value of 0%
denotes no observed heterogeneity, whereas, 25% is ‘‘low’’, 50%
is ‘‘moderate’’ and 75% is ‘‘high’’ heterogeneity [19]. We also
estimated the between-study variance using tau-squared (t2)
statistic [20].
To determine the presence of publication bias, the symmetry of
the funnel plots in which mean differences were plotted against
their corresponding standard errors were assessed.
Figure 2. Forest plot of the mean difference of LINE-1 methylation levels between cancer and control groups in tissue and bloodsamples. Subgroup analysis based on sample type.doi:10.1371/journal.pone.0109478.g002
Hypomethylation and Cancer: A Meta-Analysis
PLOS ONE | www.plosone.org 9 October 2014 | Volume 9 | Issue 10 | e109478

Results
Data extractionThe detailed steps of the systematic review and meta-analysis
process are given as a PRISMA flow chart in Figure 1. A total of
324 articles were retrieved from the database, one article was
added through manual searching with reference list and thus 46
papers, published between 2004 and 2014, were included in the
systematic review and summarized in Table 1 by cancer site or
type.
Data characteristics and quality assessmentA total of 18 studies were from Asian countries (40%), 13 from
European countries (28%), 13 from USA (28%) and 1 from
Argentina and from Egypt (2%, each).
Thirty-eight retrospective longitudinal studies compared LINE-
1 methylation levels between cancer patients and healthy subjects
or normal adjacent tissues in cancer patients. Eight prospective
longitudinal studies analysed LINE-1 methylation levels in cohorts
of cancer patients, in relation to the life expectancy, the outcome
of the disease or the malignancy of the tumor, identifying the role
of LINE-1 hypomethylation as a biomarker of poor prognosis in
cancer patients [15,21–27].
In 41 studies LINE-1 methylation levels were evaluated both in
tumor and in healthy controls tissues, and in the remaining 5
studies only in cancer patients.
Overall, the studies detected LINE-1 methylation levels in
15332 samples: 8103 from cancer patients (4679 tissue samples,
3276 blood samples ,72 oral rinses and 76 bone marrow plasma
cells) and 7136 control samples (6277 from healthy subjects and
859 from normal adjacent tissues in cancer patients).
Regarding the experimental methods to measure LINE-1
methylation levels, the ‘‘gold standard’’ method, used in 63% of
studies, was the pyrosequencing of bisulphite converted DNA.
Furthermore, 9 studies used combined bisulphite restriction
analysis of LINE-1 (COBRA LINE-1) and 8 studies used other
methods, i.e. sequencing, real-time PCR, AQAMA PCR, COM-
PARE methylation assay, MulticolorMethyLight Assay and MS-
MLPA.
Figure 3. Forest plot of the mean difference of LINE-1 methylation levels between cancer and control groups in tissue samples.Subgroups analysis based on sample source.doi:10.1371/journal.pone.0109478.g003
Hypomethylation and Cancer: A Meta-Analysis
PLOS ONE | www.plosone.org 10 October 2014 | Volume 9 | Issue 10 | e109478
The most frequent tumor type in study was colorectal cancer
analyzed in eight studies [15,21,28–33], followed by seven studies
that evaluated methylation level in gastric cancer [23,27,32,34–
37], five in hepatocellular carcinoma [25,38–41], four in bladder
cancer [1,14,42,43] and head and neck carcinoma [10,44–46],
two in lung cancer [47,48] and breast cancer [24,49], and single
studies assessed methylation levels in renal cell cancer [50],
prostate cancer [51], neuroendocrine tumor [52], ovarian cancer
[53], thyroid cancer [54], esophageal cancer [26], cervix cancer
[55], endometrial cancer [32], skin melanoma [22], testicular
cancer [56], leukemia [57], multiple myeloma [58], paragangli-
oma [59], fibrolamellar carcinoma [60] and gastrointestinal [61].
Four studies evaluated methylation level in several cancer sites
[13,28,29,32]. With regard to the assay method, pyrosequencing
was used in 29 studies, followed by COBRA in 9 studies, Real-
Time PCR and AQAMA-PCR in 2 studies. MulticolorMethy-
Light Assay, MS-MLP, COMPARE and QUBRA were adopted
in single study each.
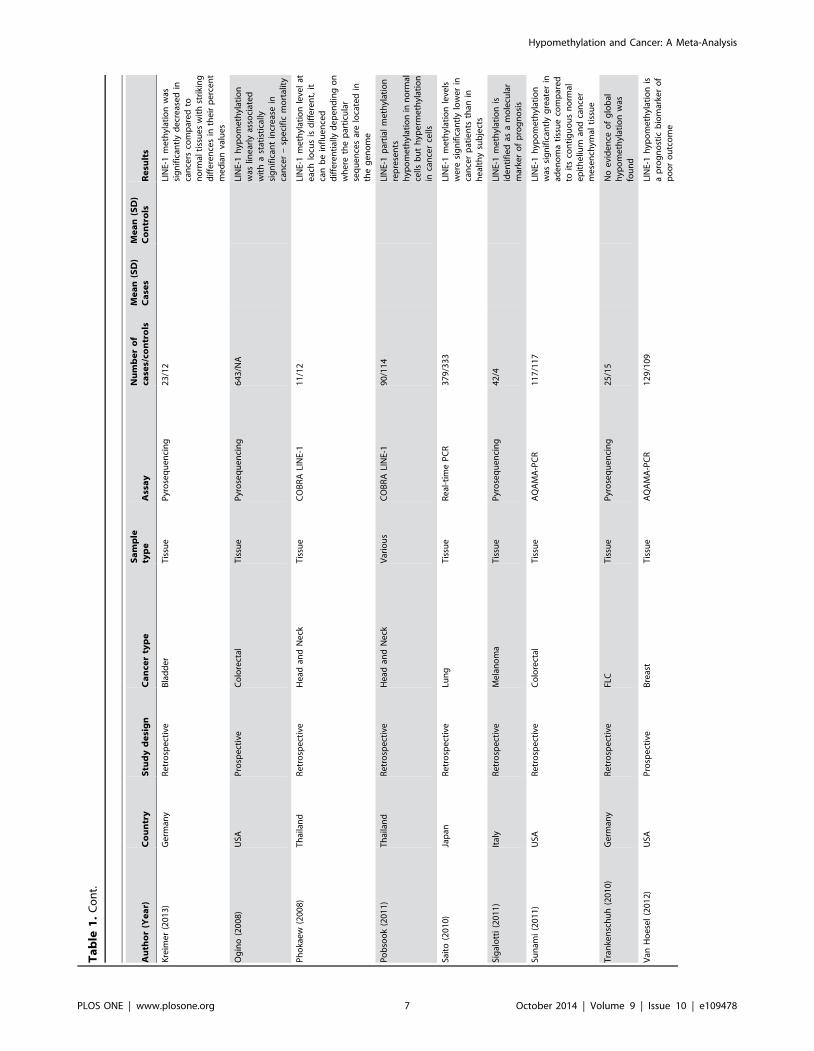
Meta-analysisOf the 46 selected papers, 14 reported means and SD of DNA
methylation levels. In addition, means and SDs were indepen-
dently calculated using data from 2 articles and, among Authors
contacted for missing data, 3 responded to the email requests and
data were added in the analysis [30,50,56]. Thus, 19 unique
articles were included in the quantitative analysis. Furthermore,
two papers by Antelo et al. [28] and by Pavicic et al. [32], reported
data from different cancer types and thus, they were separated in 4
and 8 sub-studies, respectively (Table 1).
A total of 6107 samples were included in the analysis: 2554 from
cancer patients (1127 tissue samples and 1427 blood samples) and
3553 control samples (2811 from healthy subjects and 742 from
normal adjacent tissues in cancer patients).
LINE-1 methylation levels were significantly lower in cancer
patients than in control samples (MD: 26.40, 95% CI: 27.71, 2
5.09; p,0.001). However, heterogeneity between studies was
significantly high (I2 = 99%) (Figure 2), thus, subgroup analysis
based on sample type (tissue or blood samples) was performed.
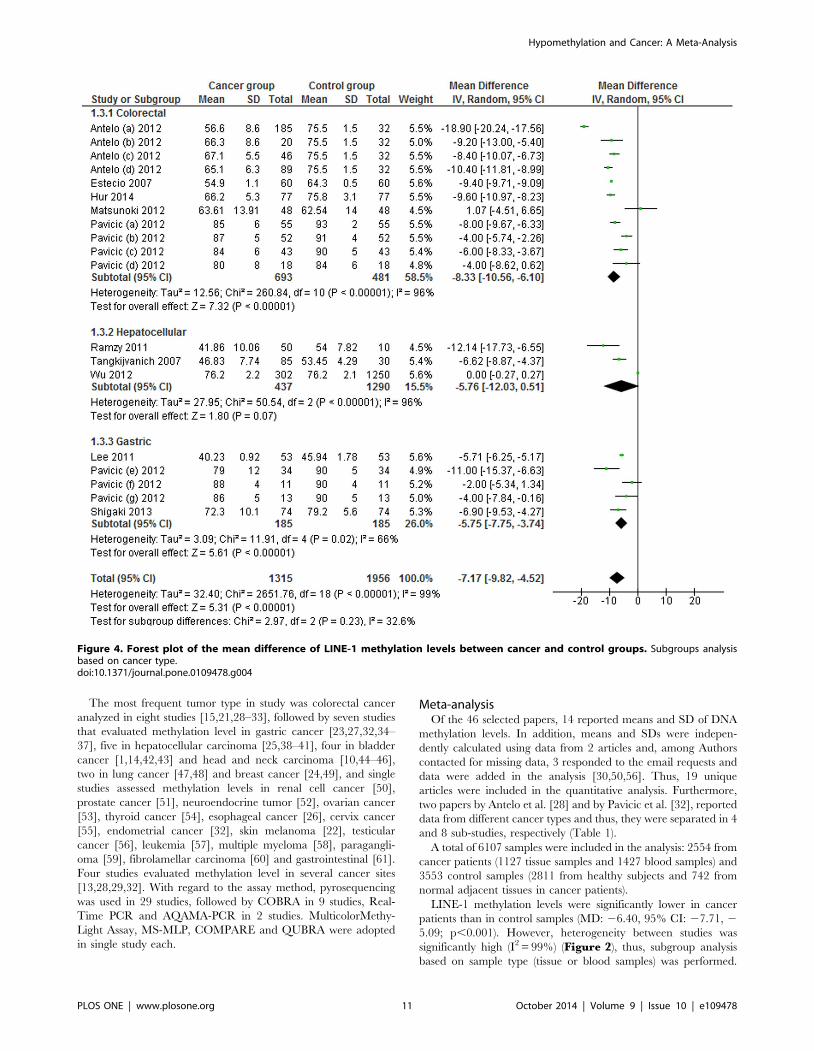
Figure 4. Forest plot of the mean difference of LINE-1 methylation levels between cancer and control groups. Subgroups analysisbased on cancer type.doi:10.1371/journal.pone.0109478.g004
Hypomethylation and Cancer: A Meta-Analysis
PLOS ONE | www.plosone.org 11 October 2014 | Volume 9 | Issue 10 | e109478

The significant difference in methylation levels was confirmed in
tissue samples (MD 27.55; 95% CI: 29.14, 265.95; p,0.001),
but not in blood samples (MD: 20.26, 95% CI: 20.69, 0.17;
p = 0.23).
A subgroup analysis by sample source was conducted. LINE-1
methylation levels were significantly lower in cancer patients than
in control samples in fresh and/or frozen tissue (MD 28.19; 95%
CI: 210.54, 25.84; p,0.001) and in FFPE tissue (MD: 26.96;
95% CI: 29.73, 24.20; p,0.001). Heterogeneity between studies,
in the two subgroups was significantly high (I2 = 98% and 96%
respectively) (Figure 3).
Furthermore, a subgroup analysis by specific cancer types, for
colorectal, hepatocellular and gastric cancer, was conducted.
LINE-1 methylation levels were significantly lower in colorectal
and gastric cancer patients than in control samples (MD: 28.33;
95% CI: 210.56, 26.10; p,0.001 and MD: 25.75; 95% CI: 2
7.75, 23.74; p,0.001). No difference of LINE-1 methylation
levels in blood leukocytes was observed for hepatocellular cancer
(MD: 25.76; 95% CI: 212.03, +0.51; p = 0.23). Heterogeneity
between studies, in colorectal and hepatocellular subgroups was
significantly high (I2 = 96%), and moderately high in the gastric
subgroups (I2 = 66%) (Figure 4).
A subgroup analysis by assays used to measure the methylation
levels, and particularly, between the two commonly used
techniques, pyrosequencing and COBRA LINE-1, was performed.
The MDs for pyrosequencing and COBRA LINE-1 subgroups
were -7.33 (95% CI: 29.06, 25.59; p,0.001) and 25.75 (95%
CI: 27.13, 24.37; p = 0.03), respectively. Heterogeneity between
studies and in the pyrosequencing subgroup was significantly high
(I2 = 100%), and moderately high in the COBRA subgroup
(I2 = 63%) (Figure 5).
A subgroup analysis by sample type, particularly tissue samples,
and assay method was conducted. The MDs in the subgroups of
studies which detected LINE-1 methylation levels in tissue samples
through pyrosequencing and COBRA LINE-1, were 210.42
(95% CI: 212.93, 27.91; p,0.001) and 25.12 (95% CI: 26.33,
23.91; p = 0.10), respectively. Heterogeneity between studies and
in the pyrosequencing subgroup was significantly high (I2 = 97%),
moderately high in COBRA LINE-1 subgroup (I2 = 56%)
(Figure 6). Stratification among studies which detected LINE-1
methylation in blood samples was not performed due to the
paucity of studies.
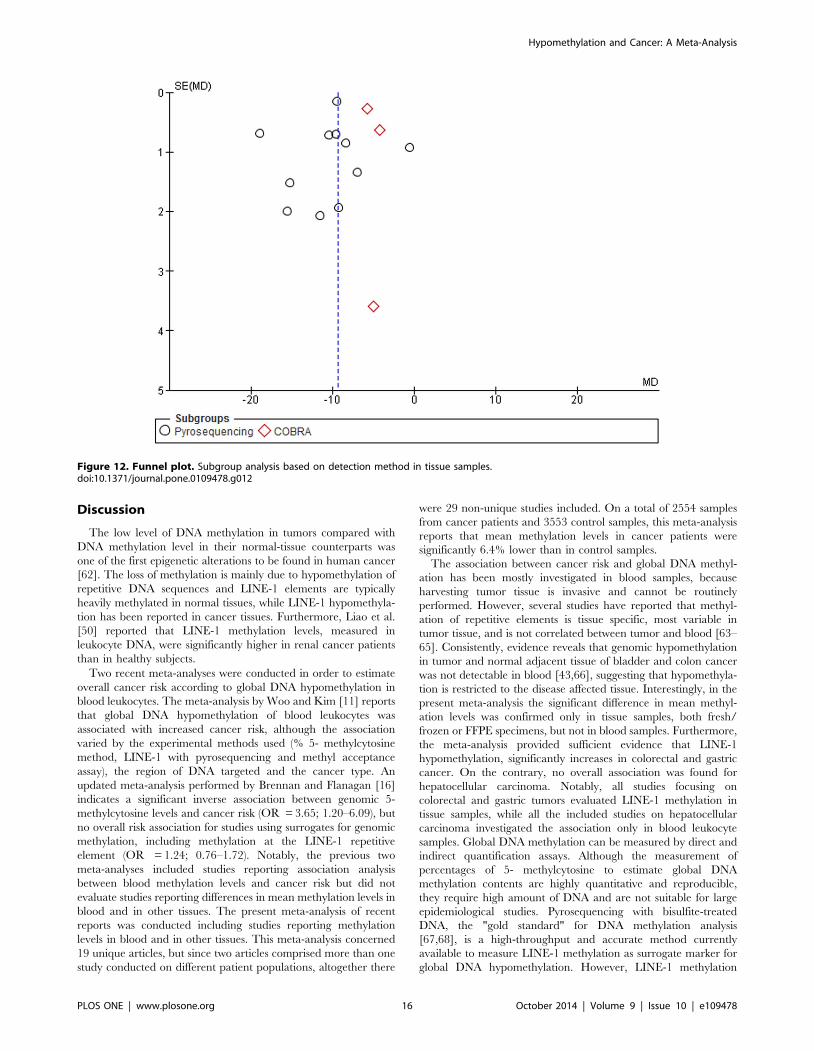
The funnel plots indicate small to moderate asymmetry,
suggesting that publication bias cannot be completely excluded
as a factor of influence on the present meta-analysis (Figures 7–12).
Figure 5. Forest plot of the mean difference of LINE-1 methylation levels between cancer and control groups. Subgroups analysisbased on method.doi:10.1371/journal.pone.0109478.g005
Hypomethylation and Cancer: A Meta-Analysis
PLOS ONE | www.plosone.org 12 October 2014 | Volume 9 | Issue 10 | e109478

Figure 6. Forest plot of the mean difference of LINE-1 methylation levels between cancer and control groups in tissue samples.Subgroups analysis based on method.doi:10.1371/journal.pone.0109478.g006
Figure 7. Funnel plot. Subgroup analysis based on sample type.doi:10.1371/journal.pone.0109478.g007
Hypomethylation and Cancer: A Meta-Analysis
PLOS ONE | www.plosone.org 13 October 2014 | Volume 9 | Issue 10 | e109478

Figure 8. Funnel plot. Subgroup analysis based on tissue specimen types. SE, standard error, MD, mean difference.doi:10.1371/journal.pone.0109478.g008
Figure 9. Funnel plot. Subgroup analysis based on cancer type in blood samples.doi:10.1371/journal.pone.0109478.g009
Hypomethylation and Cancer: A Meta-Analysis
PLOS ONE | www.plosone.org 14 October 2014 | Volume 9 | Issue 10 | e109478
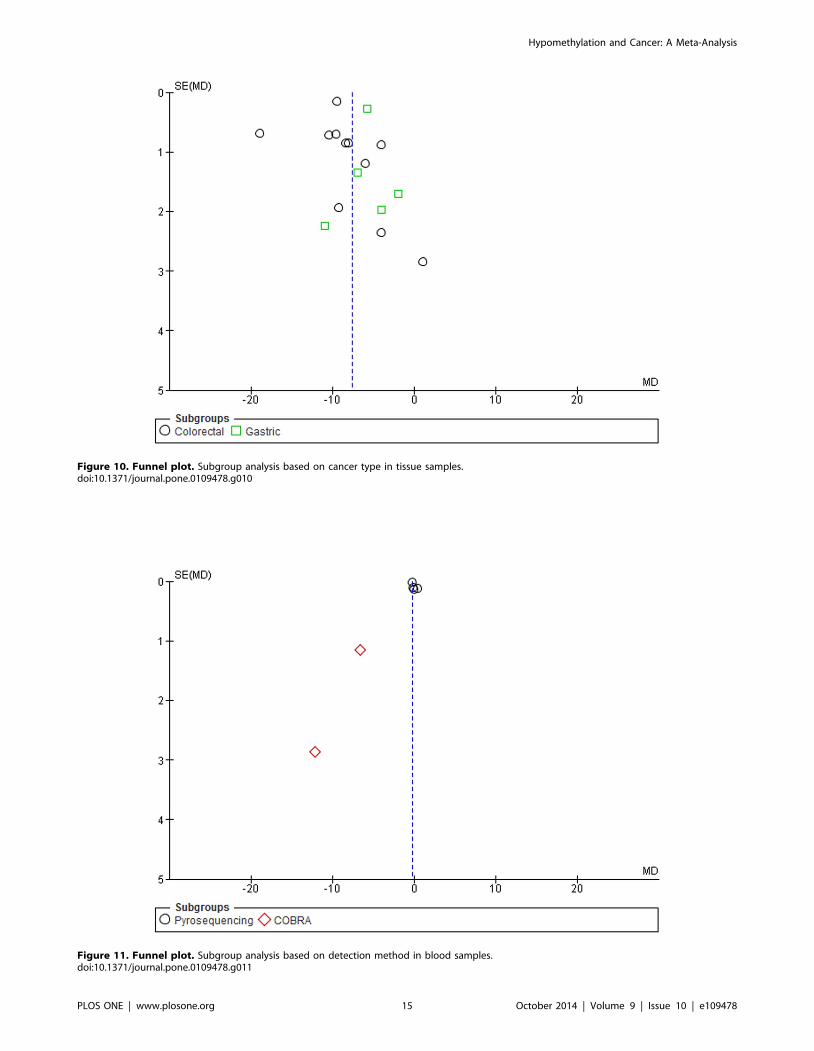
Figure 10. Funnel plot. Subgroup analysis based on cancer type in tissue samples.doi:10.1371/journal.pone.0109478.g010
Figure 11. Funnel plot. Subgroup analysis based on detection method in blood samples.doi:10.1371/journal.pone.0109478.g011
Hypomethylation and Cancer: A Meta-Analysis
PLOS ONE | www.plosone.org 15 October 2014 | Volume 9 | Issue 10 | e109478
Discussion
The low level of DNA methylation in tumors compared with
DNA methylation level in their normal-tissue counterparts was
one of the first epigenetic alterations to be found in human cancer
[62]. The loss of methylation is mainly due to hypomethylation of
repetitive DNA sequences and LINE-1 elements are typically
heavily methylated in normal tissues, while LINE-1 hypomethyla-
tion has been reported in cancer tissues. Furthermore, Liao et al.
[50] reported that LINE-1 methylation levels, measured in
leukocyte DNA, were significantly higher in renal cancer patients
than in healthy subjects.
Two recent meta-analyses were conducted in order to estimate
overall cancer risk according to global DNA hypomethylation in
blood leukocytes. The meta-analysis by Woo and Kim [11] reports
that global DNA hypomethylation of blood leukocytes was
associated with increased cancer risk, although the association
varied by the experimental methods used (% 5- methylcytosine
method, LINE-1 with pyrosequencing and methyl acceptance
assay), the region of DNA targeted and the cancer type. An
updated meta-analysis performed by Brennan and Flanagan [16]
indicates a significant inverse association between genomic 5-
methylcytosine levels and cancer risk (OR = 3.65; 1.20–6.09), but
no overall risk association for studies using surrogates for genomic
methylation, including methylation at the LINE-1 repetitive
element (OR = 1.24; 0.76–1.72). Notably, the previous two
meta-analyses included studies reporting association analysis
between blood methylation levels and cancer risk but did not
evaluate studies reporting differences in mean methylation levels in
blood and in other tissues. The present meta-analysis of recent
reports was conducted including studies reporting methylation
levels in blood and in other tissues. This meta-analysis concerned
19 unique articles, but since two articles comprised more than one
study conducted on different patient populations, altogether there
were 29 non-unique studies included. On a total of 2554 samples
from cancer patients and 3553 control samples, this meta-analysis
reports that mean methylation levels in cancer patients were
significantly 6.4% lower than in control samples.
The association between cancer risk and global DNA methyl-
ation has been mostly investigated in blood samples, because
harvesting tumor tissue is invasive and cannot be routinely
performed. However, several studies have reported that methyl-
ation of repetitive elements is tissue specific, most variable in
tumor tissue, and is not correlated between tumor and blood [63–
65]. Consistently, evidence reveals that genomic hypomethylation
in tumor and normal adjacent tissue of bladder and colon cancer
was not detectable in blood [43,66], suggesting that hypomethyla-
tion is restricted to the disease affected tissue. Interestingly, in the
present meta-analysis the significant difference in mean methyl-
ation levels was confirmed only in tissue samples, both fresh/
frozen or FFPE specimens, but not in blood samples. Furthermore,
the meta-analysis provided sufficient evidence that LINE-1
hypomethylation, significantly increases in colorectal and gastric
cancer. On the contrary, no overall association was found for
hepatocellular carcinoma. Notably, all studies focusing on
colorectal and gastric tumors evaluated LINE-1 methylation in
tissue samples, while all the included studies on hepatocellular
carcinoma investigated the association only in blood leukocyte
samples. Global DNA methylation can be measured by direct and
indirect quantification assays. Although the measurement of
percentages of 5- methylcytosine to estimate global DNA
methylation contents are highly quantitative and reproducible,
they require high amount of DNA and are not suitable for large
epidemiological studies. Pyrosequencing with bisulfite-treated
DNA, the "gold standard" for DNA methylation analysis
[67,68], is a high-throughput and accurate method currently
available to measure LINE-1 methylation as surrogate marker for
global DNA hypomethylation. However, LINE-1 methylation
Figure 12. Funnel plot. Subgroup analysis based on detection method in tissue samples.doi:10.1371/journal.pone.0109478.g012
Hypomethylation and Cancer: A Meta-Analysis
PLOS ONE | www.plosone.org 16 October 2014 | Volume 9 | Issue 10 | e109478
levels can vary depending on the target CpG sequence detected
[69], representing an important factor in the association study with
cancer risk. In the present meta-analysis, considering the two most
frequently used detection methods (pyrosequencing and COBRA
LINE-1) both subgroups report significantly lower LINE-1
methylation levels in cancer patients than in control samples,
although heterogeneity between studies was significantly high in
the pyrosequencing subgroup and moderately high in the COBRAsubgroup.
The main limitations of this meta-analysis are the small number
of studies included (n = 19) and the high heterogeneity across
studies. Although a random effects model was performed, in order
to take into account the high heterogeneity, the pooled estimates
should be interpreted with caution. To overcome this issue, pooled
estimates were calculated in more homogeneous subsets of studies
(subgroups analysis). In addition, the possible existence of a
publication bias was considered. Examination of funnel plots
showed small to moderate asymmetry, suggesting that publication
bias cannot be completely excluded and may have had at least a
moderate impact on the true effect size estimates. In fact, some
data, such as conference abstracts, non-English literature, unpub-
lished data and other inconsistent reports according to our
selection criteria were excluded. Furthermore, methylation-risk
association tend only to be reported if it reveals statistically
significant results, and if the authors deem analysis appropriate
[16].
Moreover, since most studies (83%) had a case-control design
large cohort studies are needed in order to clarify if global
hypomethylation is an early cancer-causing aberration or an effect
of carcinogenesis [11].
In conclusion, the present meta-analysis adds new evidence to
the growing literature on the role of LINE-1 hypomethylation in
human cancer and shows that LINE-1 methylation levels were
significantly lower in cancer patients than in controls, especially for
certain cancer types. This result was confirmed in tissue samples
but not in blood. Further studies are needed to better clarify the
role of LINE-1 methylation in specific subgroups, considering both
the cancer and sample type, and the methods of measurement.
Supporting Information
Checklist S1 PRISMA Checklist.
(DOC)
Checklist S2 Meta-analysis on Genetic AssociationStudies Checklist.
(DOC)
Acknowledgments
The Authors would like to thank the Authors A. Goel and K. Hur and
colleagues, L.M. Liao and L. E. Moore and colleagues and M.H. Greene
and L. Mirabello and colleagues for supporting more data not reported in
their articles.
Author Contributions
Conceived and designed the experiments: MV AA. Performed the
experiments: MB AQ AM. Analyzed the data: MB AA. Contributed
reagents/materials/analysis tools: MB AQ AM. Wrote the paper: MB MV
AA.
References
1. Cash H, Tao L, Yuan JM, Marsit C, Houseman E, et al. (2012) LINE-1hypomethylation is associated with bladder cancer risk among non-smoking
Chinese. Int J Cancer 130: 1151–1159.
2. Laird PW, Jaenisch R (1994) DNA methylation and cancer. Hum Mol Genet 3:
1487–1496.
3. Jones PA (1996) DNA methylation errors and cancer. Cancer Res 56: 2463–
2467.
4. Liu L, Wylie RC, Andrews LG, Tollefsbol TO (2003) Aging, cancer and
nutrition: the DNA methylation connection. Mech Ageing Dev 124: 989–998.
5. Davis CD, Uthus EO (2004) DNA methylation, cancer susceptibility, andnutrient interactions. Exp Biol Med 229: 988–995.
6. Chen RZ, Pettersson U, Beard C, Jackson-Grusby L, Jaenisch R (1998) DNAhypomethylation leads to elevated mutation rates. Nature 395: 89–93.
7. Lander ES, Linton LM, Birren B, Nusbaum C, Zody MC, et al. (2001) Initial
sequencing and analysis of the human genome. Nature 409: 860–921.
8. Rodriguez J, Frigola J, Vendrell E, Risques RA, Fraga MF, et al. (2006)
Chromosomal instability correlates with genomewide DNA demethylation inhuman primary colorectal cancers. Cancer Res 66: 8462–9468.
9. Agnelli L, Bicciato S, Mattioli M, Fabris S, Intini D, et al. (2005) Molecularclassification of multiple myeloma: a distinct transcriptional profile characterizes
patients expressing CCND1 and negative for 14q32 translocations. J Clin Oncol23: 7296–7306.
10. Fabris S, Ronchetti D, Agnelli L, Baldini L, Morabito F, et al. (2007)Transcriptional features of multiple myeloma patients with chromosome 1q
gain. Leukemia, 21: 1113–1116.
11. Woo HD, Kim J (2012) Global DNA Hypomethylation in Peripheral Blood
Leukocytes as a Biomarker for Cancer Risk: A Meta-Analysis. PLoS ONE7:e34615.
12. Hsiung D, Marsit C, Houseman E, Eddy K, Furniss C, et al. (2007) Global DNA
Methylation Level in Whole Blood as a Biomarker in Head and Neck Squamous
Cell Carcinoma. Cancer Epidemiol Biomarkers Prev 16: 108–114.
13. Zhu ZZ, Sparrow D, Hou L, Tarantini L, Bollati V, et al. (2011) Repetitiveelement hypomethylation in blood leukocyte DNA and cancer incidence,
prevalence and mortality in elderly individuals: the Normative Aging Study.
Cancer Causes Control 22: 437–447.
14. Wilhelm C, Kelsey K, Butler R, Plaza S, Gagne L, et al. (2010) Implications ofLINE1 Methylation for Bladder Cancer Risk in Women. Clin Cancer Res 16:
1682–1689.
15. Baba Y, Huttenhower C, Nosho K, Tanaka N, Shina K, et al. (2010)
Epigenomic diversity of colorectal cancer indicated by LINE-1 methylation in adatabase of 869 tumors. Molecular Cancer 9: 125.
16. Brennan K, Flanagan JM (2012) Is there a link between genome-wide
hypomethylation in blood and cancer risk? Cancer Prev Res (Phila) 5: 1345–
1357.
17. Moher D, Liberati A, Tetzlaff J, Altman DG, PRISMA Group (2010) Preferred
reporting items for systematic reviews and meta-analyses: the PRISMA
statement. Int J Surg 8: 336–341.
18. Higgins J, Thompson SG, Deeks JJ, Altman DG (2003) Measuring inconsistency
in meta-analyses. BMJ 327: 557–560.
19. Higgins JP, Thompson SG (2002) Quantifying heterogeneity in a meta-analysis.
Stat Med 21: 1539–1558.
20. Higgins JPT, Green S (2008) Cochrane handbook for systematic reviews of
interventions Version 5.0.0 updated February 2008. The Cochrane Collabora-
tion.
21. Ogino S, Nosho K, Kirkner GJ, Kawasaki T, Chan AT, et al. (2012) A cohort
study of tumoral LINE-1 hypomethylation and prognosis in colon cancer. J Natl
Cancer Inst 100: 1734–1738.
22. Sigalotti L, Fratta E, Bidoli E, Covre A, Parisi G, et al. (2011) Methylation levels
of the ‘‘long interspersed nucleotide element-1’’ repetitive sequences predict
survival of melanoma patients. J Transl Med 9: 78.
23. Bae JM, Shin SH, Kwon HJ, Park SY, Kook M, et al. (2012) ALU and LINE-1
hypomethylations in multistep gastric carcinogenesis and their prognostic
implications. Int J Cancer 131: 1323–1331.
24. Van Hoesel A, van de Velde C, Kuppen P, Liefers G, Putter H, et al. (2012)
Hypomethylation of LINE-1 in primary tumor has poor prognosis in young
breast cancer patients: a retrospective cohort study. Breast Cancer Res Treat
134: 1103–1114.
25. Gao XD, Qu JH, Chang XJ, Lu YY, Bai WL, et al. (2013) Hypomethylation of
long interspersed nuclear element-1 promoter is associated with poor outcomes
for curative resected hepatocellular carcinoma. Liver Int 34: 136–146.
26. Iwagami S, Baba Y, Watanabe M, Shigaki H, Miyake K, et al. (2013) LINE-1
Hypomethylation Is Associated With a Poor Prognosis Among Patients With
Curatively Resected Esophageal Squamous Cell Carcinoma. Ann Surg 257(3):
449–55.
27. Shigaki H, Baba Y, Watanabe M, Murata A, Iwagami S, et al. (2013) LINE-1
hypomethylation in gastric cancer, detected by bisulfite pyrosequencing, is
associated with poor prognosis. Gastric Cancer 16: 480–487.
28. Antelo M, Balaguer F, Shia J, Shen Y, Hur K, et al. (2012) A High Degree of
LINE-1 Hypomethylation Is a Unique Feature of Early-Onset Colorectal
Cancer. PLoS ONE 7: e45357.
Hypomethylation and Cancer: A Meta-Analysis
PLOS ONE | www.plosone.org 17 October 2014 | Volume 9 | Issue 10 | e109478
29. Estecio MRH, Gharibyan V, Shen L, Ibrahim AEK, Doshi K, et al. (2007)
LINE-1 Hypomethylation in Cancer Is Highly Variable and Inversely
Correlated with Microsatellite Instability. PLoS ONE 2:e399.
30. Hur K, Cejas P, Feliu J, Moreno-Rubio J, Burgos E, et al. (2014)
Hypomethylation of long interspersed nuclear element-1 (LINE-1) leads to
activation of protooncogenes in human colorectal cancer metastasis. Gut 63:
635–646.
31. Matsunoki A, Kawakami K, Kotake M, Kaneko M, Kitamura H, et al. (2012)
LINE-1 methylation shows little intra-patient heterogeneity in primary and
synchronous metastatic colorectal cancer. BMC Cancer 12: 574.
32. Pavicic W, Joensuu E, Nieminen T, Peltomaki P (2012) LINE-1 hypomethyla-
tion in familial and sporadic cancer. J Mol Med 90: 827–835.
33. Sunami E, de Maat M, Vu A, Turner RR, Hoon DSB (2011) LINE-1
Hypomethylation During Primary Colon Cancer Progression. PLoS ONE 6(4):
e18884.
34. Chalitchagorn K, Shuangshoti S, Hourpai N, Kongruttanachok N, Tangkijva-
nich P, et al. (2004) Distinctive pattern of LINE-1 methylation level in normal
tissues and the association with carcinogenesis. Oncogene 23: 8841–8846.
35. Hou L, Wang H, Sartori S, Gawron A, Lissowska J, et al. (2010) Blood leukocyte
DNA hypomethylation and gastric cancer risk in a high-risk Polish population.
Int J Cancer 127: 1866–1874.
36. Gao Y, Baccarelli A, Shu XO, Ji BT, Yu K, et al. (2012) Blood leukocyte Alu
and LINE-1 methylation and gastric cancer risk in the Shanghai Women’s
Health Study. Br J Cancer 106: 585–391.
37. Lee JR, Chung WC, Kim JD, Lee KM, Paik CN, et al. (2011) Differential LINE-
1 Hypomethylation of Gastric Low-Grade Dysplasia from High Grade Dysplasia
and Intramucosal Cancer. Gut Liver 5: 149–153.
38. Ramzy I, Omran D, Hamad O, Shaker O, Abboud A (2011) Evaluation of
serum LINE-1 hypomethylation as a prognostic marker for hepatocellular
carcinoma. Arab J Gastroenterol 12: 139–142.
39. Wu HC, Wang Q, Yang HI, Tsai WY, Chen CJ, et al. (2012) Global DNA
methylation levels in white blood cells as a biomarker for hepatocellular
carcinoma risk: a nested case–control study. Carcinogenesis 33: 1340–1345.
40. Tangkijvanich P, Hourpai N, Rattanatanyong P, Wisedopas N, Mahachai V,
et al. (2007) Serum LINE-1 hypomethylation as a potential prognostic marker
for hepatocellular carcinoma. Clin Chim Acta 379: 127–133.
41. Di JZ, Han XD, Gu WY, Wang Y, Zheng Q, et al. (2011) Association of
hypomethylation of LINE-1 repetitive element in blood leukocyte DNA with an
increased risk of hepatocellular carcinoma. J Zhejiang Univ-Sci B 12: 805–811.
42. Kreimer U, Schulz WA, Koch A, Niegisch G, Goering W (2013) HERV-K and
LINE-1 DNA methylation and reexpression in urothelial carcinoma. Frontiers in
Oncology 3: 255.
43. Wolff EM, Byun HM, Han HF, Sharma S, Nichols PW, et al. (2010)
Hypomethylation of a LINE-1 Promoter Activates an Alternate Transcript of
the MET Oncogene in Bladders with Cancer. PLoS Genet 6:e1000917.
44. Subbalekha K, Pimkhaokham A, Pavasant P, Chindavijak S, Phokaew C, et al.
(2009) Detection of LINE-1s hypomethylation in oral rinses of oral squamous
cell carcinoma patients. Oral Oncol 45: 184–191.
45. Phokaew C, Kowudtitham S, Subbalekha K, Shuangshoti S, Mutirangura A
(2008) LINE-1 methylation patterns of different loci in normal and cancerous
cells. Nucleic Acids Res 36: 5704–5712.
46. Pobsook T, Subbalekha K, Sannikorn P, Mutirangura A (2011) Improved
measurement of LINE-1 sequence methylation for cancer detection. Clin Chim
Acta 412; 314–321.
47. Daskalos A, Nikolaidis G, Xinarianos G, Savvari P, Cassidy A, et al. (2009)
Hypomethylation of retrotransposable elements correlates with genomic
instability in non-small cell lung cancer. Int J Cancer 124: 81–87.
48. Saito K, Kawakami K, Matsumoto I, Oda M, Watanabe G, et al. (2010) Long
Interspersed Nuclear Element 1 Hypomethylation Is a Marker of Poor Prognosis
in Stage IA Non–Small Cell Lung Cancer. Clin Cancer Res 16: 2418–2426.
49. Choi JY, James S, Link P, McCann S, Hong C, et al. (2009) Association between
global DNA hypomethylation in leukocytes and risk of breast Cancer.Carcinogenesis 30: 1889–1897.
50. Liao LM, Brennan P, van Bemmel DM, Zaridze D, Matveev V, et al. (2011)
LINE-1 Methylation Levels in Leukocyte DNA and Risk of Renal Cell Cancer.PLoS ONE 6:e27361.
51. Yegnasubramanian S, Haffner M, Zhang Y, Gurel B, Cornish TC, et al. (2008)DNA Hypomethylation Arises Later in Prostate Cancer Progression than CpG
Island Hypermethylation and Contributes to Metastatic Tumor Heterogeneity.
Cancer Res 68: 8954–67.52. Choi IS, Estecio M, Nagano Y, Kim DH, White J, et al. (2007) Hypomethyla-
tion of LINE-1 and Alu in well-differentiated neuroendocrine tumors (pancreaticendocrine tumors and carcinoid tumors). Modern Pathology 20: 802–810.
53. Dammann RH, Kirsch S, Schagdarsurengin U, Dansranjavin T, Gradhand E,et al. (2010) Frequent aberrant methylation of the imprinted IGF2/H19locus
and LINE1 hypomethylation in ovarian carcinoma. Int J Oncol 36: 171–179.
54. Lee JJ, Geli J, Larsson C, Wallin G, Karimi M, et al. (2008) Gene-specificpromoter hypermethylation without global hypomethylation in follicular thyroid
cancer. Int J Oncol 33: 861–869.55. Shuangshoti S, Hourpai N, Pumsuk U, Mutirangura A (2007) Line-1
Hypomethylation in Multistage Carcinogenesis of the Uterine Cervix. Asian
Pac J Cancer Prev 8: 307–309.56. Mirabello L, Savage S, Korde L, Gadalla SM, Greene MH (2010) LINE-1
methylation is inherited in familial testicular cancer kindreds. BMC Med Genet11: 77.
57. Fabris S, Bollati V, Agnelli L, Morabito F, Motta V, et al. (2011) Biological andclinical relevance of quantitative global methylation of repetitive DNA sequences
in chronic lymphocytic leukemia. Epigenetics 6: 188–194.
58. Bollati V, Fabris S, Pegoraro V, Ronchetti D, Mosca L, et al. (2009) Differentialrepetitive DNA methylation in multiple myeloma molecular subgroups.
Carcinogenesis 30: 1330–1335.59. Geli J, Kiss N, Karimi M, Lee JJ, Backdahl M, et al. (2008) Global and Regional
CpG Methylation in Pheochromocytomas and Abdominal Paragangliomas:
Association to Malignant Behavior. Clin Cancer Res 14: 2551–2559.60. Trankenschuh W, Puls F, Christgen M, Albat C, Heim A, et al. (2010) Frequent
and Distinct Aberrations of DNA Methylation Patterns in FibrolamellarCarcinoma of the Liver. PLoS ONE 5:e13688.
61. Igarashi S, Suzuki H, Niinuma T, Shimizu H, Nojima M, et al. (2010) NovelCorrelation between LINE-1 Hypomethylation and the Malignancy of
Gastrointestinal Stromal Tumors. Clin Cancer Res 16: 5114–5123.
62. Feinberg AP, Vogelstein B (1983) Hypomethylation distinguishes genes of somehuman cancers from their normal counterparts. Nature 301: 89–92.
63. Zhu ZZ, Hou L, Bollati V, Tarantini L, Marinelli B, et al. (2010) Predictors ofglobal methylation levels in blood DNA of healthy subjects: a combined analysis.
Int J Epidemiol 41: 126–139.
64. Piyathilake CJ, Macaluso M, Alvarez RD, Chen M, Badiga S, et al. (2011) Ahigher degree of LINE-1 methylation in peripheral blood mononuclear cells, a
one-carbon nutrient related epigenetic alteration, is associated with a lower riskof developing cervical intraepithelial neoplasia. Nutrition 27: 513–59.
65. van Bemmel D, Lenz P, Liao LM, Baris D, Sternberg LR, et al. (2012)Correlation of LINE-1 methylation levels in patient matched buffy coat, serum,
buccal cell and bladder tumor tissue DNA samples. Cancer Epidemiol
Biomarkers Prev 21: 1143–1148.66. Suter CM, Martin DI, Ward RL (2004) Hypomethylation of L1 retro-
transposons in colorectal cancer and adjacent normal tissue. Int J ColorectalDis 19: 95–101.
67. Rakyan VK, Down TA, Balding DJ, Beck S (2011) Epigenome-wide association
studies for common human diseases. Nat Rev Genet 12: 529–541.68. Beck S, Rakyan VK (2008) The methylome: approaches for global DNA
methylation profiling. Trends Genet 24: 231–237.69. Nelson H, Marsit C, Kelsey K (2011) Global Methylation in Exposure Biology
and Translational Medical Science. Environ Health Perspect 119: 1528–1533.
Hypomethylation and Cancer: A Meta-Analysis
PLOS ONE | www.plosone.org 18 October 2014 | Volume 9 | Issue 10 | e109478