lin - us environmental protection agency
TRANSCRIPT

linP.O. BOX 248, 1186 LOWER RIVER ROAD. NW, CHARLESTON, TN 37310-0248
__ - (423)336-4000 FAX (423) 336-4183
Via: Airborne Express
May 30, 1997
Mr. Eugene P. WingertRemedial Project ManagerU.S. Environmental Protection Agency (3HW41)841 Chester BuildingPhiladelphia, PA 19107
RE: Analytical Methods Study for the Olin Area Hanlin-Allied-Olin Site,Moundsville, West VirginiaEPA Docket No. III-94-29-DC
Dear Mr. Wingert:
Olin Corporation is pleased to submit the results of the Analytical Method Study prepared byDynCorp Information & Engineering Technology (DynCorp) and Lancaster Laboratories. Thenon-target compound list semivolatile organic compounds identified in the EngineeringEvaluation/Cost Analysis (EE/CA) Work Plan (RUST, May 1996) were included in the methoddevelopment process. These chemicals are aniline; 2,6-dinitrophenol; diphenyl; 4,4'-methylenedianiline (MDA); 2,4- and 2,6-toluenediamine (TDA); o-toluidine; 1-, 2-, 3-, and 4-methyl-l-cyclohexylamine; monoethanolamine (MEA); and 2-, 3-, and 4-methylcyclohexanone.
The study has culminated in the development of two analytical methods, applicable tosoil/sediment and water matrices, that are being submitted with this letter for USEPA review andcomment. The following discussion provides a summary of the method development processand recommendations for the elimination of the methylcyclohexylamine isomers and MEA from CDfurther consideration based upon analytical difficulties, low toxicity, low prevalence, and lack ofenvironmental persistence.
1.0 ANALYTICAL METHOD DEVELOPMENT ^cc
The complex process of analytical method development for the nontarget chemicals was begun Klin 1996 by DynCorp at the request of Olin Corporation. Approximately 70 laboratories wereinitially identified by DynCorp based upon the availability of instrumentation. Thirty percent ofthese laboratories responded to extensive surveys on instrumentation, detection limits andprevious experience with the chemicals of interest. Five candidate laboratories were ultimately
O L I N C O R P O R A T I O N

Mr. Eugene P. WingertJune 5, 1997Page 5
2.0 COMPOUNDS NOT SELECTED FOR METHOD DEVELOPMENT
MEA and the methycyclohexylamine isomers were found to be very problematic during themethod validation study. The study indicated that recoveries and isomer resolution were verypoor. The chemicals, which are relatively strong bases, have very different chemical propertiesthan TDA and MDA. There is also considerable question whether MEA could be analyzed bymass spectroscopy because of the lack of abundant ions for monitoring (only m/z 30 is abundantin its mass spectrum).
Olin proposes the removal of these chemicals from further consideration in the EE/CA based uponan evaluation of toxicity, potential prevalence, and environmental persistence, and this isdiscussed below.
2.1 MonoethanoUmine (MEA)
MEA is a constituent of many consumer products, such as detergents, soaps, other surfactants,and hair waving solutions, and it is used as a dispersing agent for agricultural chemicals (Howard1990). It occurs naturally in mammals and is a normal constituent of urine (Binks et al. 1992).Mammalian metabolic studies demonstrate that MEA is readily metabolized to urea, or may bemethylated to choline and converted to serine and glycine (Patty 1981, KJain et al. 1985).
Toxicity
USEPA has not developed health-based criteria for MEA. Available data indicate that MEAwould be considered a noncarcinogen. A battery of genotoxicity studies used as indicators of thepotential for carcinogenic effects revealed that MEA produced negative responses (Binks et al.1992). MEA is widely used in industry and is monitored in the workplace. The AmericanConference of Governmental Industrial Hygienists (ACGIH) has published a threshold limit value-time weighted average (TLV-TWA) of 8,000ufe/m3 and a short-term exposure limit (STEL) of15,00(X*r /ni3 for MEA exposures in occupational settings (ACGIH 1996a). The acute oral rat —LDtt isf/720 mg/kg which is fairly high; in comparison, the same value for sodium chloride is ~T3,000 mg/kg (RTECS 1997). o
CDAquatic life toxicity criteria have not been developed for MEA, but 96 hour LCso values for °°common aquatic test organisms were estimated for this evaluation based upon Quantitative EStructural-Activity Relationships (QSARs). QSARs relate the structure and physicochemicalproperties of molecules to their biological activities. The QSAR system used in this analysis is ajoint project of the USEPA Environmental Protection Agency Environmental ResearchLaboratory in Duluth, Minnesota, and Montana State University (TDS Numerica 1997). Thisscreening-level information is useful for providing an indication of potential toxicity of a chemical

Mr. Eugene P. WingertJune 5,1997Page 6
and the need for closer consideration. The toxicity parameters provided in the analysis were the96 hour lethal concentrations (LC*>) in seven common test organisms, as well as the 30 daychronic "no effect" level for the Fathead
The estimated LC!0s and the chronic "no-effect" level provided in Table 3 below do not indicate apotential problem with respect to these parameters. A substantial elevation of pH in the watersystem would, in fact, be observable before these levels were approached. For example, the pH ofa solution containing 6,000 mg/L of ME A would be approximately 12 (Merck Index 1989).
Table 3
Dqftnii
Rainbow Trout
Ookta*
BtuefiU
MfMqufco&h
30D»yNoEflw*L«vd
21,000
HOOO
43,000
51,000
49,000
50,000
38,000
8,400
Prevalence
The potential prevalence of MEA at the site also was considered in the decision to not continue CSJwith additional method development. Based upon an understanding of the manufacturing ^processes that occurred at the facility from 1956 to 1984, MEA is not anticipated to be prevalent oin environmental media at the she. This is because the chemical was used within a closed or CD"hermitized" system to absorb carbon monoxide from the hydrogen/carbon monoxide production coprocess. Thus, MEA was recycled within the system, handled infrequently and was not used as a ^raw material or intermediate in the manufacturing process. Potential fugitive releases fromprocess vents may have occasionally occurred.

Mr. Eugene P. WingertJune 5, 1997Page?
Persistencei
Fugitive releases of ME A to the atmosphere would have been rapidly degraded byphotochemicaJIy generated hydroxyl radicals. The estimated half-life of ME A in the atmosphere is4 to 11 hours (Dow Chemical 1980, Eisenreich et al. 1981, Atkinson 1987). In the event thatsmall amounts of ME A escaped to other environmental media, fate data strongly suggests that thechemical is not persistent. Shukla and Turner (1980) found ten taxonomically diverse species tobe capable of using ME A as a sole nitrogen source, which indicates that the compound is verydegradabie. The work of Shukla and Turner is corroborated by several researchers who haveshown substantial degradation of the chemical in biodegradation screening tests using sewagesludge over time periods ranging from 5 to 50 days (Bridie et al. 1979; Kawaski 1980; Kkano1978; Lamb and Jenkins 1952, Sasaki 1978; Young et al. 1968; Mills and Stack 1954). In anenvironmental study using river water samples from the River Aire in Leeds, Emtiazi and Knapp(1994) found MEA to be the most degradabie of all of the linear amines that were evaluated, withcomplete degradation observed within 1 to 2 days. In another environmental study using soil,researchers found that MEA in soil and sediment degraded rapidly after a relatively shortacclimation time at temperatures near 25°C and observed degradation under both aerobic andanaerobic conditions (Gallagher et al 1996). Although biodegradation is a complex phenomenonwith an efficiency that depends upon many factors, the weight-of-evidence indicates that MEAresidues should not be persistent at the site.
There is also no indication that MEA would partition into biota and thus bioconcentrate orbiomagmfy Accumulation in biota is observed for lipophilic compounds which tend to partitioninto fat and remain in an organism. MEA is an extremely polar molecule that will existpredominantly as a protonated or positively charged species in the environment as evidenced byits pKa of 9 48 at 25°C (Howard 1990). In an aquatic system, adsorption onto negatively chargedclay particles and humic materials in soil and sediment due to this positive charge will limitmobility to some extent, but some migration into surface water would also occur, In surfacewater, the enhanced polarity of a formal charge will limit the partitioning of MEA into lipid, asdemonstrated by its very low log octanol-water partition coefficient (log K*,) of-1.31 (Hanschand Leo 1985). Several data bases report a bioconcentration factor (BCF) of <1 for MEA, whichindicates that bioconcentration does not occur, reflecting its polar nature (HSDB 1997). Ratherthan accumulate, the chemical is readily metabolized in animal systems to compounds such asurea, choline, serine and glycine (Patty 1981, Klain et al. 1985, Sinks et al. 1992).
In summary, MEA is not expected to be a risk-driving chemical at the site based upon the criteriaof toxicity, prevalence and persistence, and was therefore not selected for special methoddevelopment after attempts to include it in the modified CLP method were unsuccessful. Thechemical was used in a closed system during manufacturing operations, which would have limited

Mr. Eugene P WingertJuneS, 1997PageS
handling and hampered its release to the environment. The preponderance of environmental fatedata indicates that the chemical is not persistent in air, soil, water or biota.
2.2 Methyteyclohexylamine homers
Toxicity
There are no published health-based criteria for these chemicals. No relevant toxicity studieswere identified in the literature that would provide useful information. In order to evaluate thepotential toxicity of these chemicals, a structural analog is therefore required.
USEPA has calculated risk-based concentrations (RBCs) for cyclohexyiamine, a commonindustrial chemical, with a published noncanccr reference dose (RfD) of 0.2 mg/kg-day. For theresidential ingestion of tap water, the RBC is 7,300 Tg/L, and a value of 14,600 Tg/L can becalculated for the consumption of water during industrial land use. The RBC for a residential soOingestion scenario is 16,000 mg/kg or 1.6%, while the industrial soil ingestion RBC is 410,000mg/kg or 41% (USEPA 1996). Three chronic animal studies designed to evaluate the potentialfor carcinogenic effects in rodents were all negative (Gaunt et al. 1976, Oser et al. 1976, Hardy etal. 1976). The American Conference of Governmental Industrial Hygienists (ACGIH) has placedthis chemical in their category A4, which means that there is inadequate data on which to classifythis chemical in terms of carcinogenicity to humans or animals. ACGIH has published a thresholdlimit value-time weighted average (TLV-TWA) of 41,000 Tg/m3 for cyclohexyiamine exposuresin occupational settings (ACGIH 1996a) This information is indicative of the tow toxicity of thegeneral class of chemicals.
No aquatic life toxicity criteria are available for methyicydohexylamine, but aquatic toxicity datafor cyclohexyiamine suggest that these cyclic amine compounds are relatively nontoxic to aquaticlife. Calamari et at. (1980) reported 96-hour LCM values for rainbow trout in the range of 44 to90 mg/L. Christensen and Luginbyhl (1975) reported even higher concentration limits for fish inin the range of 100 to 1,000 mg/L. Invertebrate toxicity was similarly high. Algae were slightlymore sensitive than invertebrates or fish, with growth inhibition occurring at median effectiveconcentrations in the range of 20 mg/L. Overall, acute toxicity values in this range are typicallyregarded as relatively nontoxic (Meyer and Barclay 1990). A significant elevation in the pH ofthe water system would be observable before these levels are reached. For example, a 14 mg/Lsolution of methylcyclohexylamine is estimated to have a pH of approximately 10 based uponanalogy to cyclobexylamine (Butler 1966).
AR3005UI*

Mr. Eugene P. WingertJune 5, 1997Page 9
Prevalence
The methylcyclohexylamine isomers are not expected to be prevalent on Olin property, or bepresent at concentrations higher than IDA, a potential human carcinogen for which an analyticalmethod has been developed. The methylcyclohexylamine isomers were unwanted by-productsgenerated during the TDA/TDI manufacture that occurred between 1956 to 1984. As unwantedby-products, they were formed in small quantities in comparison to TDA, with which they wouldbe associated.
Persistence
If methylcyclohexylamine isomers were released to the environment, available environmental fatedata suggest that the chemicals are not persistent. Cyclohexylamine at a concentration of 10 mg/Lin water from river mud was found to entirely degrade within 14 days (Calamari et al. 1980).Screening-level QSAR analyses predict that methylcyclohexylamine isomer residues shoulddegrade under environmental conditions, with half-lives ranging from 2 to IS days in soil (TDSNumerica 1997). If present in surface soil, a vapor pressure of 8.8 mm Hg at 25°C indicates thatsome volatilization into the atmosphere would occur (Howard 1990). Aliphatic amines in theatmosphere are expected to react with photochemically produced hydroxyl radicals, with acalculated half-life of approximately 2 days for this class of chemicals (Calvert and Pitts 1966).The preponderance of the data therefore indicate that cyclohexylamines are not persistant in theenvironment.
The chemical properties of the methyicyclohexylamines indicate that there is little tendency forthese chemicals to partition into biota, and thus, bioconcentrate or biomagmfy. For example, themethylcyclohexylamine isomers in aquatic environments will be in the form of protonated orcharged molecules by analogy to Cyclohexylamine, which has a reported pKa of 10.66 at 24°C(Howard 1990). The polarity of the chemicals greatly reduces their potential for bioconcentrationor biomagnifi cation in aquatic species. For example, the log Kow and BCF of the protonated formof 2-methylcyciohexylamine would be even lower than the estimated log K of 1 38 and BCF of5 (TDS Numerica 1997) of the neutral or.uncharged form of the same chemical (Hansch and Leo1995). USEPA considers BCFs less than 300 as insignificant in aquatic systems (USEPA 1989).
In summary, the methylcyclohexylamine isomers are not expected to be risk-driving chemicals atthe site based on the criteria of toxicity, prevalence and persistence, and were therefore notselected for special method development after attempts to include it in the modified CLP methodwere unsuccessful. During the operation of the facility, the chemicals were not purchased as rawmaterials, but rather were generated in small amounts as by-products of the TDA/TDImanufacturing process; an analytical method has been developed for TDA, a compound with

Mr. Eugene P. WingertJune 5, 1997Page 10
greater toxicity Tinally, the preponderance of environmental fate data indicates that thechemicals are not persistent in air, soil, water or biota.
3.0 SCHEDULE
Although Lancaster Laboratories conducted most of the laboratory work involved with theAnalytical Method Study, we have chosen IEA to conduct analysis of site samples. Our choice ofIEA is based entirely on cost for the upcoming analytical work. IEA is currently practicing theanalytical protocols for the six compounds discussed in Section 1 of this letter. As we previouslydiscussed, we request that you review the two enclosed analytical methods and reply within twoweeks. Your expedited review win allow us to begin field work on or about the week of June 23,1997. IEA is also scheduled to begin receiving samples from the site the week of June 23,1997.
If you have any questions, please call me at 423-336-4576.
Sincerely,OLIN CORPORATION
Richard W. McClure, PG, REMAssociate Project Coordinator
RWM/ljp
Enclosure (2) (DynCorp methods study reports)
cc (letter only):Tom O'Brien, OUnLorraine Miller, OUnBob Higgtns, Otin-Moundsville, WVJeff Jackson, Rust-Greenville, SCDale Skoff, Rust-Wexford, PALorraine Pearsafl, WEINBERG-Washington, D.C.
AR300546

REFERENCES
American Conference of Governmental and Industrial Hygienists (ACGIH). 1996a.Threshold Limit-Values for Chemical Substances and Physical Agents. BiologicalExposure Indices. Cincinnati, OH: ACGIH.
American Conference of Governmental and Industrial Hygienists (ACGIH). 1996b.Documentation of the Threshold Limit Values and Biological Exposure Indices.Supplements to Sixth Edition. Cincinnati, OH: ACGIH.
Atkinson,R. 1987. Inter. J. Chem. Kinet. 19:799-828. As cited in Environmental FateInformation (HSDB 1997).
Binks, S P, Smillie, M.V., Glass, D.C., Fletcher, A.C., Shackleton, S., Robertson, A.S.,Levy, L.S., and Chipman, J.K. 1992. Occupational Exposure Limits. Criteria Documentfor Ethanolamine, Commission of the European Communities. Office for OfficialPublications of the European Communities. Luxembourg.
Bridie, A.L, Wolflt C.J.M., and Winter, M. 1979. BOD and COD of somepetrochemicals. Water Res. 13:627-630. As cited in the Environmental Fate Data Base(IDS Numerical 997).
Butler, J.N. 1966. Ionic Equilibrium: A Mathematical Approach. Reading, MA:Addison-Wesley Publishing Company, Inc.
Calamari,D.,DaGasso, R., Galassi, S.,Privini, A., and Vighi, M. 1980. Biodegradationand toxicky of selected amines on aquatic organisms Chemosphere. 9:753-762.
Calvert, J.G. and Pitts, J.N., Jr. 1966. Photochemistry. New York: John Wiley & Sons.Pp. 899. As cited in Environmental Fate Information (HSDB 1997).
Christensen,H.E, andT.T. LugmbyW. 1975. Registry of Toxic Effects of ChemicalSubstances. U S, Department of Health, Education, and Welfare. As cited in Calamari etal. (1980).
Dow Chemical Company. 1980, The Alkanolamines Handbook. Midland, MI: DowChemical Co. As cited in the Environmental Fate Data Base (IDS Numerica 1997).
Eisenreich, S. J. et al. 1981. Environ. Sci. Technol. 15:30-38. As cited in EnvironmentalFate Information (HSDB 1997).
Emtiazi, G, and Knapp, J S 1994. The biodegradation of piperazaine and structurally-related linear and cyclic amines. Biodegradation 5:83-92.
AR3005U7

Mills, E.J., Jr. and Stack, V.T., Jr. 1954. Biological oxidation of synthetic organicchemicals. Proceedings of 8th Industrial Waste Conference, Eng. Bull., at PurdueUniversity. Eng. Ext. Ser Pp. 492-517 As cited in the Environmental Fate Data Base(IDS Numericrf997).
Oser, B L , Carson, S., Cox, G.E., et al. 1976. Long-term and multi-generation toxicitystudies with cyclohexylamine hydrochloride. Toxicol. 6:47-65. As cited in ACGIH1996b.
Patty's Industrial Hygiene and Toxicology (Pattv'sV 1981. 3rd Edition. Vol. 2B. NewYork: WUey-Interscience. As cited in Environmental Fate Information (HSDB 1997).
Registry for Toxic Effects of Chemical Substances (RTECS). 1997. National Institutesof Occupational Safety and Health (N1OSH). National Library of Medicine, Bethesda,MD.
Rust Environment & Infrastructure (RUST). 1996. Engineering Evaluation/Cost Analysis(EE/CA) Work Plan. May.
Sasaki, S. 1978. The scientific aspects of the chemical substance control law in Japan. InHutzinger, O, Von Letyoeld, L.H., and Zoeteman, B.C. J. (eds.). Aquatic Pollutants:Transformation and Biological Effects. Oxford; Pergamon Press. Pp. 283-298. As citedin the Hazardous Substance Data Base (IDS Numerica 1997).
Shukla, S.D. and Turner, J.M. 1980. Microbial metabolism of amino alcohols, Biochem.J 186:13-9. As cited in the Environmental Fate Data Base (TDS Numerica 1997).
Technical Database Services (TDS) Numerica. 1997. New York, NY.
U.S. Environmental Protection Agency (USEPA). 1996. Risk-Based ConcentrationTable. USEPA Region HI, Technical and Program Support Branch. Philadelphia, PA.
U.S. Environmental Protection Agency (USEPA). 1989. Risk Assessment Guidance forSuperfund V^my TT; Environmental Evaluation Manual. Interim Final. EPA/540/1-89/001.
Young, R.H.F., Ryckman, D.W., and Buzzdl, J.C., Jr. 1968. An improved tool formeasuring biodegradability. J. Water Pollut. Contr Fed. 40:354-368. As cited in theEnvironmental Fate Data Base (TDS Numerica 1997).
AR3005U8

Gallagher, J.R., Thompson, J.S., Sorenson, JA., and Schmit.C.R. 1996. An Assessmentof the Subsurface Fate of Monoethanolamine at Sour Gas Processing Plant Sites - Phase IReport. Grand Forks: Energy & Environmental Research Center, University of NorthDakota. —
Gaunt, I.F., Hardy, J, Grasso, P. et at. 1976. Long-term toxicity of cyclohexylaminehydrochloride in the rat. Food Cosmet. Toxicol. 14:255-267. As cited in ACGIH 1996b.
Hansch, C. and Leo, A. 1995. Exploring QSAR: Fundamentals and Applications inChemistry and Biology. Washington, DC: American Chemical Society.
Hansch, C. and Leo, A. 1985. MedChem Project. Claremont, CA: Pomona College Ascited in the Environmental Fate Data Base (TDS Numerica 1997).
Hardy, J., Gaunt, I.F., Hoosen, J., et at. 1976. Long-term toxicity of cyclohexylaminehydrochloride in mice. Food Cosmet. Toxicol. 14:269-276. As cited in ACGIH 1996b.
Hazardous Substance Data Bank (HSDB) 1997. National Library of Medicine,Bethesda, MD
Howard, P.H. 1990. Handbook of Environmental Fate and Exposure Data for OrganicChemicals. Vol. n. Solvents. Chelsea, MI: Lewis Publishers.
Kawaski, M. 1980. Experiences with the test scheme under the chemical control law ofJapan: An approach to structure-activity correlations. Ecotoxic. Environ. Safety 4:444-454. As cited in the Environmental Fate Data Base (TDS Numerica 1997).
Kitano, M. 1978. Biodegradation and bioaccumulation test on chemical substances.OECD Tokyo Meeting. Reference Book TSU-No. 3. As cited in the Environmental FateData Base (TDS Numerica 1997).
Klain, G J, et al. 1985. Fundam. Appi. Toxicol. 5(6, Pt 2):S127-S133. As cited in theHazardous Substance Data Bank (HSDB 1997).
Lamb, C.B. and Jenkins, G.F. 1952. BOD of synthetic organic chemical. Proceedings of8th IndustriatWaste Conference at Purdue University. Pp. 326-329. As cited in theEnvironmental Fate Data Base (TDS Numerica 1997).
Merck Index, The. 1989. The Merck Index: An Encyclopedia of Chemicals. Drugs, andBiologjcals. Eleventh Edition. Rahway, NJ: Merck & Co., Inc.
Meyer, P.P. and Barclay, L.A. 1990. Manual on the Investigation of Fish Kills. U.S.Department of the Interior. Resource Publication #177.
AR3005U9

Mr. Eugene P. WingertJuneS, 1997Page 3
3-Methykyclohexanofle 95.3 2.4 100.0
4-Methylcyclahexanone 89.7 105.9 1.2 3.0 99.0 104.0
4,4'-Methylene dianilioe 65.2 68.3 1.8 6.3 17.8 30.0
2.6-Dinitrophenol J,..5 61.8 3.1 7.7 157.7 161.0
Aniline 69,5 67.8 2.3 2.9 110.6 39.0
O-ToIuidine 71.5 74.3 1.1 3.1 53.6 35.0
Monoethanolamine
Methykyclohexylaminc ' 0.23.41.5
17.1 0.11.30.6
3.9 6.7
2,4-Toluenediamine 49.9 rt.61 1.9 3.51 3.1 9. 11
2,6-ToIuenediamine ' 52.5 1.9 3.1
1 These compounds are not amenable to analysis by this method1 Reported as total (i.e., unresolved isomers).
The validation study indicated that MEA, the methycyclohexylamine isomers and the IDAisomers were very difficult to analyze. These chemicals exhibited very poor or nonexistentrecoveries in water and soil/sediment with the modified CLP method. While MDA exhibitedreasonable recoveries in water, recoveries were poor in soil.
The decision to include or exclude chemicals from further method development at this stage of theprocess was based upon an evaluation of toxictty, environmental persistence, and the likelihood ofa chemical to be prevalent on the Olin property. The classification of a chemical as a possiblehuman carcinogen by USEPA or the International Agency for Research on Cancer (IARC) wasconsidered a sufficient reason to pursue further method development. USEPA has classified 2,4-TDA as a probable (B2) carcinogen, and IARC has classified MDA as a possible (2B) humancarcinogen. The TDA isomers (2,4- and 2,6-TDA) and MDA were therefore selected ascandidates for further method development. The 2,6-TDA isomer, a noncarcinogen, was includedbecause resolution of this isomer from the 2,4-TDA isomer is important.
1.2 Soil and Water Extraction Method with High-Volume Injection GOMS
AR300550

Mr. Eugene P. WIngertJuneS, 1997Page 4
Lancaster Laboratories developed a high volume injection GC/MS method for analyzing 2,4-TDA, 2,6-TDA and MDA in soil and water. This method, entitled "Determination of 2,4-Diaminotoluene, 2,6-DiaminotoInene, and 4,4'Methyienedianiline in Water by Solid-PhaseExtraction (SPE) and Soil by Accelerated Solvent Extraction (ASE) using High-VolumeInjection Gas Chromatography-Mass Spectrometry (HVI/GC/MS)" is enclosed with thisletter for USEPA review and comment.
The method involves a specialized extraction for both soil and water. Anarytes are separated froma water matrix by passing the sample through a cartridge containing a copolymer. The copolymeris then extracted with solvent (solid-phase extraction or SPE) and analyzed by GC/MS. Soilsamples are extracted using the accelerated solvent extractor (ASE) under elevated temperatureand pressure.
The use of the SPE for waters and ASE for soils with HVI/GC/MS yielded generally lower watermethod detection limits and higher mean recovery values for all three compounds when comparedto the values obtained using the modified CLP method as can be seen in Table 2 below. Therecovery of MDA in water using the SPE extraction method with HVI/GC/MS was comparableto the recoveries obtained with the modified CLP method, but the detection limits were lowerwith the HVI/GC/MS method.
Table 2
'|HHlM* ^ 3jjJfl nj£ *
2,4-Diammotolueoe2,6-Diaminotolueoc
2,4-DiammotoIuene2,6-DiammotoIuflae4,4'-Methylenedianilme
AR30055

Mr. Eugene P. WingertJune 5,1997Page 2
culled from the list of participating laboratories upon review of the survey responses. These fivelabs were closely evaluated on their ability to develop a modified Contract Laboratory Program(CLP) method that would address isomer resolution, chemical recovery and detection limits for allthe chemicals of interest in both a soil and water matrix. They were also evaluated with respect totheir quality assurance plan, standard operating procedures and previous experience with methoddevelopment. The final evaluation resulted in the selection of two laboratories for an actualmethod validation study of the nontarget chemicals: Lancaster Laboratories of Pennsylvania(Laboratory A) and Centre Analytical Laboratories (Laboratory B).
The primary goal of the validation study was to determine whether CLP Method OLM03.2 forthe analysis of semivolatile compounds in soil and water by gas chromatography/massspectrometry (GC/MS) could be used for the nontarget chemicals. Use of the existing CLPmethod was the most desirable situation because laboratories efficiently work with establishedprocedures. A second goal of the study was to develop, if necessary, a different analytical methodfor those chemicals that are not amenable to the modified OLM03.2 and are believed to be ofpotential concern with respect to human health and the environment.
1.1 Modified Contract Laboratory Method OLM03.2 for SeraivoUtiles
The validation study revealed that most of the nontarget chemicals are amenable to analysis withthe existing CLP method for semivolatiks. Aniline, 2,6-dinitrophenoI, diphenyl, otoluidine and2-, 3-, and 4-methylcyclohexanone were extracted with reasonable recoveries from bothsoil/sediment and water matrices as shown in Table 1 below. MDA demonstrated reasonablerecoveries in water, but relatively low recoveries in soil/sediment. A modified CLP MethodOLM03.2 incorporating the cyclohexanone isomers, MDA, diphenyl, 2,6-dinitrophenol, aniline,and o-toluidine as additional compounds was developed by DynCorp. The method, entitled"Analysis of Semrvolatile Compounds in Soil and Water for Olio Corporation'sMoundsville Project" is provided with this letter for USEPA review and comment.
Table 1Mean Recoveries and Method Detection Limits
AR300552

Analysis #Revision 1.0Supersedes Date: N/AEffective Date: May 1997Page 1 of 24
Determination of 2,4-Diaminotoluene, 2,6-Diaminotoluene, and4,4'-Methylenedianiline in Water by Solid-Phase Extraction (SPE) and Soil by
Accelerated Solvent Extraction using High-Volume Injection GasChromatography-Mass Spectrometry (HVI/GC/MS)
Scope:
This method is suitable for the determination of 2,4-diaminotoluene,2,6-diaminotoluene, and 4,4'-methylenedianiline at low ppb levels found ingroundwater or surface waters and soil samples. Conditions such as high levels oforganic compounds may interfere with normal detection limits.
Compound CAS Number EQL1 (uo/IJ
2,4 -diaminotoluene 95-80-7 2
2,6-diaminotoluene 823-40-5 2
4,4'-methylenedianiline 101-77-9 3
1 -nitronaphthalene* 86-57-7
Basic Principles:
The analytes and surrogate are extracted from a water sample by passing thesample through a solid-phase cartridge containing 500 mg ofdivinylbenzene/vinylpyrrolidone copolymer. The disk is eluted with 15 mL of 1:1
1 = Estimated Quantitation Limits. Values based on single laboratory method detection limit studyperformed on water.
* = surrogate standard
AR300553

Analysis #Revision 1.0Supersedes Date: N/AEffective Date: May 1997Page 2 of 24
ethyl acetate/methylene chloride. Soil samples are extracted using theaccelerated solvent extractor (ASE) at 50°C and 1500 psi using methylenechloride and a basic modifier (1,6-hexanediamine in methanol). After dryingthrough sodium sulfate, the solvent is then evaporated to 1.0 mL to concentratethe analytes. The diaminotoluene isomers and 4,4'-methylenedianiline areseparated by narrow-bore capillary gas chromatography and can be identified bytheir retention times and differences in their mass spectra. Quantification isperformed using an internal standard calibration.
Sample Collection and Storage:
Water samples should be collected in 1-L amber glass bottles and stored at 4° ±2°C. Soils should be collected in 8-oz wide-mouth glass jars and stored at 4° ±2°C. Water samples must be extracted within 7 days of sample collection. Soilsamples must be extracted within 14 days of sample collection. All extracts mustbe analyzed within 40 days of sample extraction.
Apparatus:
1. Hewlett-Packard Model 5890 gas chromatograph or equivalent
2. Hewlett-Packard Model 5971 mass selective detector or equivalent
3. Pro Sep 800 High Volume Injector - Apex Technologies, Inc. (Cincinnati,OH)
4. Water extraction apparatus - SPE vacuum manifold
5. Accelerated solvent extractor (ASE 200) or equivalent, Dionex Corp.,Sunnydale, CA
6. Sodium sulfate column and graduated ampule for concentration
7. 70-mL SPE sample reservoirs
AR3005514

Analysis #Revision 1.0Supersedes Date: N/AEffective Date: May 1997Page 3 of 24
8. 11 -ml_ stainless steel extraction vessels or equivalent, Dionex Corp.
9. ASE circle filter discs, 1,91 cm, Dionex Corp., P/N 049458
Reagents and Consumable Materials:
1. Waters Porapak® ROX (500 mg divinylbenzene/vinylpyrrolidone) sep-pak cartridge (Waters PN WAT047220)
2. Reagent Ottawa sand, EM Science or equivalent
3. Methylene chloride, Baker Ultra Resi-Analyzed or equivalent
4. Ethyl acetate, Baker Ultra Resi-Analyzed or equivalent
5. Acetonitrile, Baker Ultra Resi-Analyzed or equivalent
6. Methanol, Baker Instra-Analyzed or equivalent
7. Sodium sulfate, Fisher or equivalent - Prepared by baking at 400°C for4 hours prior to use to remove contaminants.
8. Potassium phosphate dibasic (K2HPO4), Baker Analyzed or equivalent
9. Phosphoric acid 85%, Fisher or equivalent
10. 1,6-Hexanediamine, Sigma Chemical or equivalent
11. Phosphate buffer (2 M) - Dissolve 34.82 g of K2HPO4 in reagent waterand dilute to a final volume of 1 L in a volumetric flask. Adjust to pH7.0 with phosphoric acid (85%).
12. Soil extraction fluid • Dissolve 5 g of 1,6-hexanediamine in methanoland dilute to 100 ml in methanol. Transfer to a 2-L volumetric flask and*»dilute to volume with methylene chloride,
AR300555

Analysis #Revision 1.0Supersedes Date: N/AEffective Date: May 1997Page 4 of 24
Preparation of Standards:
1. Combined stock standard (1000 |ig/rnL) - Weigh 25.0 ±0.1 mg of each2,4-diaminotoluene, 2,6-diaminotoluene, and 4,4'-methy!enedianiiineinto a 25-mL volumetric flask and dilute to volume with methanol. Storein a freezer at -15°C. Remake every 3 months.
2. Surrogate stock standard (1000 (ig/mL) • Weigh 25.0 ±0.1 mg of 1-nitronaphthalene into a 25-mL volumetric flask and dilute to volume withmethanol. Store in a freezer at -15°C. Remake every 3 months.
3. Intermediate combined standard (100 ug/mL) - Place 5.0 mL of thecombined stock standard into a 50-mL volumetric flask and dilute tovolume with methanol. Store in a freezer at-15°C. Remake every 3months.
4. Intermediate surrogate standard (100 ng/mL) • Place 5.0 mL of thesurrogate stock standard into a 50-mL volumetric flask and dilute tovolume with methanol. Store in a freezer at -15°C. Remake every 3months.
5. Spiking solution (analyte at 10 u,g/mL and surrogate at 5 ng/mL) - Place5.0 mL of the intermediate combined standard and 2.5 mL of theintermediate surrogate standard into a 50-mL volumetric flask and dilute
• to volume with methanol. Store in a freezer at -15°C. Adding 1.0 mL ofthis methanolic solution to 100 mL of water will produce analyteconcentrations of approximately 0.1 ng/mL and a surrogateconcentration of 0.05 u.g/mL, Replace monthly.
6. Surrogate spiking solution (5 u.g/mL) - Place 5.0 mL of the intermediatesurrogate standard into a 100-mL volumetric and dilute to volume withmethanol. Store in a freezer at-15°C. Replace monthly.
AR300556

Analysis #Revision 1.0Supersedes Date: N/AEffective Date: May 1997Page 5 of 24
7. Calibration standards - Prepare the appropriate five levels of standards(see below) by diluting the intermediate combined standard and theintermediate surrogate standard appropriately in ethyl acetate. Store ina refrigerator at 4°C. Replace weekly.
Preparation of Glassware:
All glassware is rinsed with tap water and soaked in dilute Chem-Solv for aminimum of 2 hours. The glassware is then rinsed with warm tap water followedby deionized water and baked in a drying oven for at least 1 hour or until dry.
Safety Precautions:
The toxicity or carcinogenicity of each reagent used in this method has not beenprecisely defined; however, each chemical compound should be treated as apotential health hazard. From this viewpoint, exposure to these chemicals mustbe reduced to the lowest possible level by whatever means available, such asfume hoods, lab coats, and gloves.
Water Extraction Procedure:
1. Set up the SPE vacuum manifold and position the RDX cartridges on themanifold. Normally, the vacuum is not required to condition thecartridges or load the samples.
2. ' Condition each cartridge with approximately 10 ml of acetonitrile(ACN). After allowing the ACN to soak into the resin for severalminutes, allow the ACN to drip through the cartridge until the solventreaches the top of the resin bed. Stop the flow.
3. Continue to condition each cartridge with 10 mL of deionized water.Allow the water to drip through the cartridge until the water reaches thetop of the resin bed. Stop the flow.
AR300557
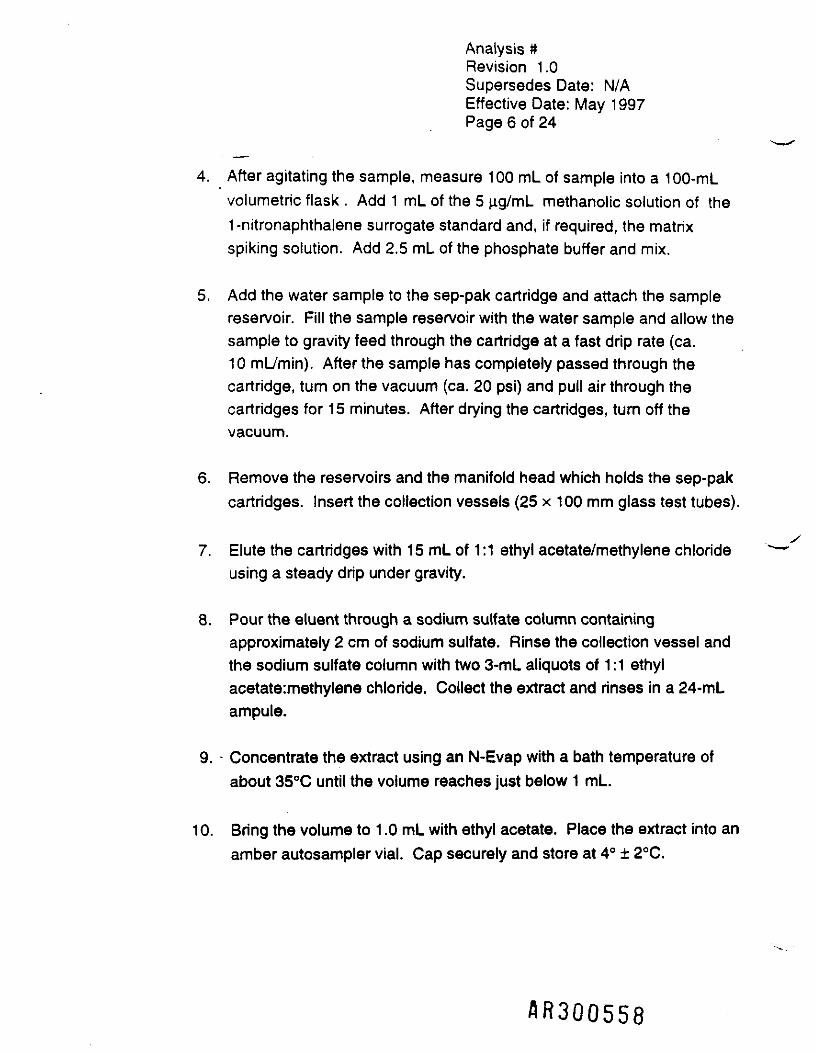
Analysis #Revision 1.0Supersedes Date: N/AEffective Date: May 1997Page 6 of 24
4. After agitating the sample, measure 100 mL of sample into a 100-mLvolumetric flask . Add 1 mL of the 5 ng/mL methanolic solution of the1-nitronaphthalene surrogate standard and, if required, the matrixspiking solution. Add 2.5 mL of the phosphate buffer and mix.
5. Add the water sample to the sep-pak cartridge and attach the samplereservoir. Fill the sample reservoir with the water sample and allow thesample to gravity feed through the cartridge at a fast drip rate (ca.10 miymin). After the sample has completely passed through thecartridge, turn on the vacuum (ca. 20 psi) and pull air through thecartridges for 15 minutes. After drying the cartridges, turn off thevacuum.
6. Remove the reservoirs and the manifold head which holds the sep-pakcartridges. Insert the collection vessels (25 x 100 mm glass test tubes).
7. Elute the cartridges with 15 mL of 1:1 ethyl acetate/methylene chloride ~—using a steady drip under gravity.
3. Pour the eluent through a sodium sulfate column containingapproximately 2 cm of sodium sulfate. Rinse the collection vessel andthe sodium sulfate column with two 3-mL aliquots of 1:1 ethylacetate;methylene chloride. Collect the extract and rinses in a 24-mLampule.
9. - Concentrate the extract using an N-Evap with a bath temperature ofabout 35°C until the volume reaches just below 1 mL.
10. Bring the volume to 1.0 mL with ethyl acetate. Place the extract into anamber autosampler vial. Cap securely and store at 4° ± 2°C.
flR300558

Analysis #Revision 1.0Supersedes Date: N/AEffective Date: May 1997Page 7 of 24
Soil Extraction Procedure:
1. Decant and discard any water layer on a sediment sample. Mixsamples thoroughly. Discard any foreign objects such as sticks, leaves,and rocks.
2. Place the end cap on the exit end of the 11-mL ASE stainless steelextraction cell. Using the tamping rod, push a circle filter disk to thebottom of the exit side of the cell and cover the disk with a layer ofOttawa reagent sand (approximately 0.5 cm in depth).
3. Weigh 5 to 10 g of soil (weighed to the nearest 0.01 g) directly in theASE stainless steel extraction cell. Soil samples which contain highlevels of water and are not free flowing should be weighed in a weighingdish and mixed with an equal weight of sodium sulfate prior to placing inthe extraction cell.
4. Add 1.0 mL of the surrogate spiking solution (5 M-g/mL 1 -nitronaphthalene in methanol) to the top of the soil in the extraction cell.Also add 1.0 mL of the spiking solution to the matrix spikes and thelaboratory control sample(s). Use Ottawa sand for laboratory controlsamples.
5. After filling any void volume in the extraction cell with sand, screw thetop end cap onto the 11-mL ASE stainless steel extraction cell. Make
- sure both ends are securely tightened.
6. Load the extraction celts on the top carousel of the ASE with the exitend (side with the filter paper) down.
7. Place labeled 40-mL collection vials in the appropriate locations on thelower carousel of the ASE.
AR300559

Analysis #Revision 1.0Supersedes Date: N/AEffective Date: May 1997Page 8 of 24
8. Extract each cell on the ASE under the following conditions:
Temperature 50°CPressure 1500psiStatic time 5 minutesFlush volume 60%Purge time 60 secondsCycles 3Extraction fluid Approx. 20 mL of 95/5 v/v methylene
chloride/5% 1,6-hexanediamine inmethanol
9. After the extraction has been completed, check that each collection vialcontains 15 to 20 ml of extraction fluid. A low volume may indicate amalfunction of the ASE during the extraction.
10. Pour the extract through a sodium sulfate column containing about 2 cmof sodium sulfate. Rinse the collection vial and the column with two 3-ml aliquots of methylene chloride. Collect the extract and the rinses inan ampule.
11. Concentrate the extract using an N-evap with a bath temperature of35°C until volume reaches about 1 mL.
12. Dilute to an appropriate final volume with ethyl acetate if highconcentrations of analytes are known to be present in the soil orreconcentrate to a final volume of 1.0 mL on the N-evap. Place theextract (1.0 mL) in an amber autosampler vial. Cap securely and storeat 4° ± 2°C.
AR300560

Analysis #Revision 1.0Supersedes Date: N/AEffective Date: May 1997Page 9 of 24
Percent Moisture Determination
1. Immediately after weighing the sample for extraction, weigh 5 - 10 g ofthe soil into a tared crucible. Determine the percent moisture by dryingovernight at 105°C. Allow to cool in a dessicator before weighing.Concentrations of individual analytes wilt be reported relative to the dryweight of soil.
„, .. . „ grams of wet sample - grams of dry sample% Moisture = ^——————————-———-——————*-———-^— x 100grams of wet sample
Instrumental Conditions:
Below are the recommended operating conditions for the Pro Sep 800 High-Volume Injector, the HP 5890 GC, and the HP 5971 MSD.
1. Pro Sep 800 High-Volume InjectorPrecolumn - MIDI II 240 x 2 mm ID coated with HT-5 phasePro Sep temperature program • Start at 90°C and hold for 0.2 minutes;Ramp at 300°C/min to 300°C, hold for 26 minutesHe flow through injector -100 mL/min
2. HP 5890 GCInjector temperature 260°CInjection volume 5 u.LSplit valve program Open at 0.00 min, close at 0.05 min
and open at 3.0 min.
AR30056

Analysis #Revision 1.0Supersedes Date: N/AEffective Date: May 1997Page 10 of 24
Capillary column Rtx-200 (trifluoropropylmethylpoly-siloxane) 30 m x 0.25 mm; df 0.25 mm
Oven temperature 50°C for 3 minutes; ramp at 20°C/minto 120°C; hold 1 min; ramp at 3°C/minto 154°C; ramp at 30°C/min to 300°Cand hold 5 min.
Run time 28.70 minutesCarrier gas Helium at 1.0 mL/min constant flow
3. HP 5971 MSDTune USEPA DFTPP criteriaScan range 50 to 550 amuScan rate 2.2 scan/secThreshold 50
Initial Calibration:
1. Tune the GC/MS system with a suitable calibrant to meet themanufacturer's specifications. The mass calibration and resolution ofthe GC/MS system should be verified every 12 hours with the injectionof 25 ng of DFTPP. The GC/MS system should meet the USEPA massspectral ion abundance criteria for DFTPP specified below.
A single spectrum or an average spectrum across the DFTPP peak maybe used to evaluate the performance of the system. If the DFTPP does
~ not meet the criteria rn Table I, the MSD must be retuned prior tocalibrating the system.
AR300562

Analysis #Revision 1.0Supersedes Date: N/AEffective Date: May 1997Page 11 of 24
Table IDFTPP Key Ions and Ion Abundance Criteria
Mass Ion Abundance Criteria51 30% to 60% of mass 19868 <2% of mass 6969 mass 69 relative abundance70 <2% of mass 69127 40% to 60% of mass 198197 <1%of mass 198198 Base peak, 100% relative abundance199 5% to 9% of mass 198275 10% to 30% of mass 198365 >1%of mass 198441 Present but less than mass 443442 40% to 100% of mass 198443 17% to 23% of mass 442
2. Inject the following five levels of calibration standards using a constantinjection volume ranging from 5 to 50 |iL
Surrogate Std. Cone. Internal Std. Cone.Analyte Cone. (1 -nitronaphthalene) (phenanthrene-d10)
uo/mL iiQ/mL uo/mL
Level! 0.50 5.0 5.0Level 2 1.0 5.0 5.0Level 3 2.0 5.0 5.0Level 4 5.0 5.0 5.0Levels 10.0 5.0 5.0

Analysis #Revision 1.0Supersedes Date: N/AEffective Date: May 1997Page 12 of 24
3. Using the Level 4 standard, verify GC performance and separation ofthe diaminotoluene isomers on the Rtx-200 column. The valley betweenthe 2,6 and 2,4 isomers must be <25% of the average of the two peakheights of the isomers. See Figure 2 as an example on how todetermine this resolution.
4. Calculate a response factor (RF) for each analyte of interest andsurrogate for each level using phenanthrene-d10 as the internalstandard.
(Ais)(QJ
Where:
Ax = Integrated abundance of the quantitation ion of the analyte
Ais = Integrated abundance of the quantitation ion internal standard
Qx = Quantity of analyte injected in ng or concentration units
Qis = Quantity of internal standard injected in ng or concentration units
For each analyte and surrogate, calculate the mean RF (M) from theanalyses of the five calibration solutions. Calculate the standarddeviation (3D) and the relative standard deviation (RSD) from eachmean: RSD = 100x (SD/M). If the RSD of any analyte or surrogatemean RF exceeds 30%, take action to improve GC/MS performance or,as an alternative to calculating mean response factors, use the GC/MSdata system software or other available software to generate a linearregression calibration curve. An acceptable correlation coefficient of thecurve will be 0.99.

Analysis #Revision 1.0Supersedes Date: N/AEffective Date: May 1997Page 13 of 24
Table II shows the quantitation and qualifier ions for each of theanalytes:
Table IITarget and Qualifier Ions
Analvte Quantitation QualifierIon
2,6-Diaminotoluene 122. 121, 104,94
2,4-Diaminotoluene 121 122, 104,94
4,4-Methylenedianiline 198 197, 182, 106
l-Nitronaphthalene(SS) 115 127, 173, 101
Phenanthrene-d10 188 187, 160,80
A spectrum for each analyte and the surrogate standard is shown inFigure 1.
Continuing Calibration:
Verify the initial calibration by injecting the Level 3, 2.0-ng/mL standard every 12-hour period or after every ten sample injections.
Calculate the RF for each analyte and surrogate from the data measured in thecontinuing calibration check. The RF for each analyte and surrogate must bewithin 30% of the mean value measured in the initial calibration. Alternatively, if alinear regression is used, the calculated amount for each analyte must be ±30% of
flR300565

Analysis #Revision 1.0Supersedes Date: N/AEffective Date: May 1997Page 14 of 24
the true value. If these conditions do not exist, corrective action should be takenwhich may require recalibration.
Sample Analysis:
After adding the internal standard, phenanthrene-d10 (10 (iLof 500 ng/pi_to 1.0ml_ extract), inject an aliquot of the extract (the same volume) under the sameGC/MS conditions as used in the initial and continuing calibrations.
Identification of Analytes:
Identify a sample component by comparison of its mass spectrum (afterbackground subtraction) to a reference spectrum in the user-created database.The GC retention time of the sample component should be within 0.05 minutes ofthe retention time observed for that same compound in the most recently analyzedcontinuing calibration check standard.
In general, all ions that are present above 10% relative abundance in the massspectrum of the standard should be present in the mass spectrum of the samplecomponent and should agree within absolute 20%. For example, if an ion has arelative abundance of 30% in the standard spectrum, its abundance in the samplespectrum should be in the range of 10% to 50%. Some ions, particularly themolecular ion, are of special importance and should be evaluated even if they arebelow 10% relative abundance.
Identification is hampered when sample components are not resolvedchromatographically and produce mass spectra containing ions contributed bymore than one analyte. When GC peaks obviously represent more than onesample component (i.e., broadened peak with shoulder(s) or valley between two ormore maxima), appropriate analyte spectra and background spectra can beselected by examining plots of characteristic ions for tentatively identifiedcomponents. When analytes coelute (i.e., only one GC peak is apparent), theidentification criteria can be met, but each analyte spectrum will containextraneous ions contributed by the coeluting compound.
AR300566
Analysis #Revision 1.0Supersedes Date: N/AEffective Date: May 1997Page 15 of 24
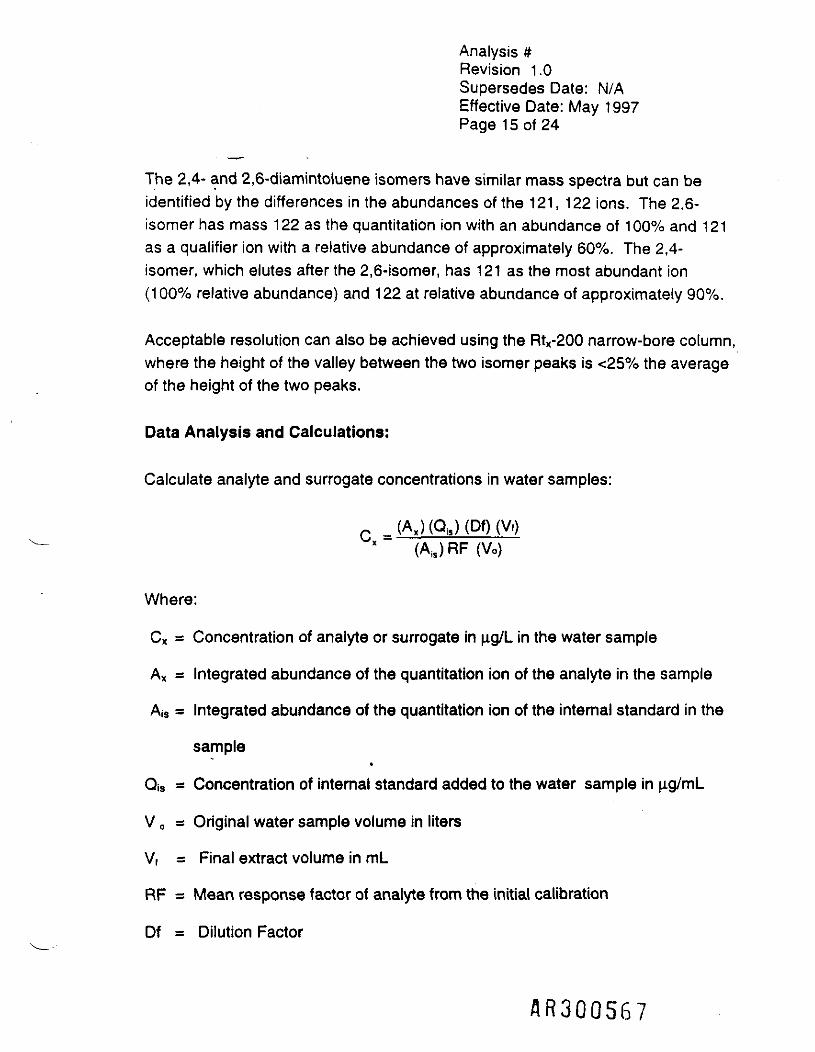
The 2,4- and 2,6-diamintoluene isomers have similar mass spectra but can beidentified by the differences in the abundances of the 121, 122 ions. The 2,6-isomer has mass 122 as the quantitation ion with an abundance of 100% and 121as a qualifier ion with a relative abundance of approximately 60%. The 2,4-isomer, which elutes after the 2,6-isomer, has 121 as the most abundant ion(100% relative abundance) and 122 at relative abundance of approximately 90%.
Acceptable resolution can also be achieved using the Rtx-200 narrow-bore column,where the height of the valley between the two isomer peaks is <25% the averageof the height of the two peaks.
Data Analysis and Calculations:
Calculate analyte and surrogate concentrations in water samples:
C ,(Ax)(Qis)(Df)(V,)(AJS)RF(Vo)
Where:
Cx - Concentration of analyte or surrogate in |ig/L in the water sample
Ax = Integrated abundance of the quantitation ion of the analyte in the sample
AjS = Integrated abundance of the quantitation ion of the internal standard in the
sample*
Qis = Concentration of internal standard added to the water sample in u,g/mL
V 0 = Original water sample volume in liters
V, = Final extract volume in mL
RF = Mean response factor of analyte from the initial calibration
Df = Dilution Factor
AR300567

Analysis #Revision 1.0Supersedes Date: N/AEffective Date: May 1997Page 16 of 24
Calculate analyte and surrogate concentrations in soil samples:
Cx = (Ax) (Qis) (Df) (V,)(Ais) RF (Ws ) D
Where:
Ax, Ais, Qis and V, are as given for water above.
Cx = Concentration of analyte (dry weight basis) or surrogate in p,g/g in the soilsample
Ws = Original soil sample weight in grams
RF = Mean response factor of analyte from the initial calibration
Df = Dilution Factor
_ 100 - % moisture100
Alternatively, use the GC/MS system software or other available proven softwareto compute the concentrations of the analytes and surrogates from the linearregression curves.
Method Performance:
Single laboratory accuracy and data for water using the method are shown inTable III. Quadruplicate spiking studies were performed on laboratory reagentwater and a background water sample taken from the site.
AR300568

Analysis #Revision 1.0Supersedes Date: N/AEffective Date: May 1997Page 17 of 24
Table IV shows a method detection limit study conducted on laboratory reagentwater and provides a calculation for the LOQ of the method.
Single laboratory accuracy and data for soil using the method are shown in TableV. Quadruplicate spiking studies were performed on laboratory reagent sand.Preliminary recovery studies on background soil taken from the site indicate highlevels of organics which enhanced recoveries of the analytes when compared to aclean top soil.
Quality Assurance:
For each batch of samples, a laboratory reagent blank (LRB), a matrix spike, amatrix spike duplicate, and a laboratory fortified blank (LFB) (deionized waterblank spiked with all compounds to be determined carried through the entireprocedure) must be extracted. A batch is defined as the samples to be extractedwithin a 12-hour period, but not to exceed 20 samples. If more than 20 samplesare set up, an additional LRB, spike, spike duplicate, and LFB must be prepared.
Technical Acceptance Criteria:
The following acceptance criteria were established based on single laboratoryperformance and are advisory.
The laboratory reagent blank must contain less than the estimated limit ofquantitation in water for each target analyte.
AR300569

Analysis #Revision 1.0Supersedes Date: N/AEffective Date: May 1997Page 18 of 24
Matrix Spike andSurrogate Recovery Limits
Compound % Recovery % RecoveryWater2 Soil
2,6-Diaminotoluene 44 - 80 46 - 562,4-Diaminotoluene 39 -65 68 - 784,4'-Methylenedianiline 49 - 91 (jL2 -"§3)1- Nitronaphthalene 78 - 97 (67-7CL)
Pollution Prevention:
This method utilizes liquid-solid extraction (LSE) technology to remove theanalytes from water. It requires the use of very small volumes of organic solventand very small quantities of pure analytes, thereby eliminating the potentialhazards to both the analyst and the environment involved with the use of largevolumes of organic solvents in conventional liquid-liquid extractions.
For information about pollution prevention that may be applicable to laboratoryoperations, consult "Less is Better Laboratory Chemical Management for WasteReduction" available from the American Chemical Society's Department ofGovernment Relations and Science Policy, 1155 16th Street NW, Washington,DC, 20036.
Waste Management:
It is the laboratory's responsibility to comply with all federal, state, and localregulations governing waste management, particularly the hazardous waste
Limits established based on single laboratory method performance. All limits are advisory.
AR300570

Analysis #Revision 1.0Supersedes Date: N/AEffective Date: May 1997Page 19 of 24
identification rules and land disposal restrictions. The laboratory using this methodhas the responsibility to protect the air, water, and land by minimizing andcontrolling all releases from fume hoods and bench operations. Compliance isalso required with any sewage discharge permits and regulations. For furtherinformation on waste management, consult The Waste Management Manual forLaboratory Personnel, also available from the American Chemical Society at theaddress in Section 14.2.
Revision Log:
Initiated Date: DATE
Ver. # Effective Date Change00
DOCID.DOCMMDDYY
Prepared by: _________________________ Date:
Approved by: _________________________ Date:
Approved by: _________________________ Date:
flR30057

Analysis #Revision 1.0Suoersedes Date: N/Aeffective Date: May 1997Page 20 of 24
Figure 1. Spectra of Analytes and Surrogate Standard
1 888888
100000 •
0-
i Scan 567 (14.1
94 104
77&& 65 || .1 1
106
1
341 min) : 0601006. O•2
(-)
2 , 6 -Diaaino toluene
128 15B6360 a'o 100 120 140 160
184180 200
215220
kbundanc*150000
100000
50000
0-•/«— > 4
> S<
.
977
52 67 1 .IJh .1 . Ml .11.1. A
0 60 80
=an 580 (]4
4105
jlf100 12<
L4. 133 Bin): 0601006.0 (-)1
2 , 4-Oiaminotolu«n«
-
3 140 160 180 200 220 240
Abundancej
300000
200000-
100000 ^?.j. JB/x — > 40 60 ' 80
Scan 1439 (20.208 ain):J
101 •99 1jfjj |Ji .
,50601006.0 (-)l-Nltronaphthal«n«
12711 149
k M |J 157
173
L100 120 140 160 180
199200
210220
237240
00
oCDCODC
kbundanca400000
200000-
0-n/z — > 4
Scan 1835 (23.025 Bin): 0601006. D (-100 X
77 93
4,4'-M*thyl«na Dianilin*
182.1
32 6!5 L J 1 (1 HS "0 1431?2 «» II" ,'M , i|n, ,.1,11, .|lh[ t ,iMi,i|"ft . '>• ,.'1'.. T', , fri , .'4'. .•[«. ., fl, ........ • i • •
a
)0 215 234410 60 80 100 120 140 160 180 200 220 240

Analysis #Revision 1.0Supersedes Date: N/AEffective Date: May 1997Page 21 of 24
Figure 2. Resolution Check for 2,6 and 2,4-diaminotoluene
FileOperatorAcquiredInstrumentSample NameHisc InfoVial Number
C:\HPCHEM\1\DATA\APR20\0601006.D
20 Apr 97 4:35 pm using AcqMethod OAMT5971JLS
STD 5.0 UG/ML IN ETHYL ACETATE
jundance TIC: 0601006.D
% valley - hv/ ((hi + h2)/2) x 100 %<
1000000=- (25/(143 + Il8)/2 ) x 100 %
14.05900000 -I f f =» 25/130.5 x 100 %
800000
700000
600000IT.^ i i
500000 .QCOcc
400000 T . _ . .,hl-143»» h2.118fflm1 /
300000
200000
looooo1 ' hv»25mm
cr
. i • i i i i i i i i i i i i i i i i i i i i i i i i i i i i i i i i i »• i ' i ' '•' i'•/Tine—> 13.85 13.90 13.95 14.00 14.05 14.10 14.15 14.20 14.25 14.30

«
Analysis #Revision 1.0Supersedes Date: N/AEffective Date: May 1997Page 22 of 24
ss 3« a* 3*q cp <p o>
b9 sS 9 Ut sSw* 9 4fe 30 *
g $^5 W H «d <•?"?•> |s: S 8^ P P « <?t3) g» r^oWK J S a» OIOOKSs coaco^ a«= 7<rcSn
5Q.
m_ E. W
* f S5 a E? I
I I"5 JS 1x Siu ^™ •" = » . _ ; — ; _ . — — — - ^ (,, gj „ ^ _ _ _ _ _
a 3 -w toS<°* | ?S8SSf ^ C n ^ ^ ^ ^ C M(L Sv« -K . "o** Q ut ^9 •*£•*& ^ U* >P>PN0-^ ^ PJ C*) = sa a isg* _jl ^^SK £t$$$$O M*£ T- "O ca^toco 5 " r- <o S t» ^22233
•Q g» 3 W S •* «? <°. ^. e S <^r*:cNu*2 II |f sffji? ? J|f isssa
I 4 ll* ??§5 I lit ?8§S I ^y w < £ m« 5 & " c3 3S
J a o5
' ;;i! s ill! £& ? illi i« i Ml! £5 I a5?i o~ i ***T -Ia o N N <* ~ a
AR3005714

_J fi r- <o o><3j « T T t\i3 O O O V
dob«
in f » ciid ea b 51
o o o n
oooooo
® -1« E* Sas JI !h- a
Anaivsi? *Revisior I 0Supersedes O-'.'iy: N/A
mi^o Data Way 1997e ?3 ?4
AR300575

Analysis #Revision 1.0Supersedes Date: N/AEffective Date: May 1997Page 24 of 24
Q — — p nCO « cy m .-CC
(T *« 3* £ £*~ <- •* » a»2 m r- o» <o/
-* ao *5 ,5
i
O S ^.a -a*- E o
ui J §*- ± u.g 3-9 *-
«S2'« *
8 I
3
35 I }^3 ^ flc 3 rt en d
W go
o *=
- £
flR300576