lin liu, ph.d. department of geography university of cincinnati cincinnati, oh 45221-0131 email:...
TRANSCRIPT

Lin Liu, Ph.D.Lin Liu, Ph.D.
Department of GeographyDepartment of Geography
University of CincinnatiUniversity of Cincinnati
Cincinnati, OH 45221-0131 Cincinnati, OH 45221-0131
Email: [email protected]: [email protected]
The Role of Street Network in Crime Analysis and Simulation

Jan. 29 - Feb. 2, 2007 Liu, at IPAM, UCLA 2
Who am I?Who am I? Education:Education:
– GeomorphologyGeomorphology– Remote Sensing and MappingRemote Sensing and Mapping– GIS, Economic GeographyGIS, Economic Geography– Computer ScienceComputer Science
A Barbarian by the Eck definition?A Barbarian by the Eck definition?– Haven’t invaded the CJ territory far enough Haven’t invaded the CJ territory far enough
How did I get into this?How did I get into this?

Jan. 29 - Feb. 2, 2007 Liu, at IPAM, UCLA 3
Motivation - Geographic Scale MattersMotivation - Geographic Scale Matters Recent attempt on modeling aggressive policing Recent attempt on modeling aggressive policing
by a graduate adviseeby a graduate advisee– Hypothesis: a higher rate of arrests on minor offense Hypothesis: a higher rate of arrests on minor offense
(A) leads to reduction on serious crime rate (C)(A) leads to reduction on serious crime rate (C)
– Previous studies suggest that the correlation between A Previous studies suggest that the correlation between A and C, r(A,C), is negative, when individual cities are and C, r(A,C), is negative, when individual cities are used as the unit of analysisused as the unit of analysis
– However, r(A,C) is positive if the unit of analysis is However, r(A,C) is positive if the unit of analysis is neighborhood areas in a cityneighborhood areas in a city
– Why is one positive while the other negative? Why is one positive while the other negative? » Models variant of geographic scale? Models variant of geographic scale?
» Perhaps the neighborhood model should be:Perhaps the neighborhood model should be: ?),( CAr

Jan. 29 - Feb. 2, 2007 Liu, at IPAM, UCLA 4
OutlineOutline The impact of spatial infrastructureThe impact of spatial infrastructure
– street network in a “racial profiling” studystreet network in a “racial profiling” study– water pipeline network in epidemiological water pipeline network in epidemiological
studystudy» Implication to crime studiesImplication to crime studies
Simulation of street robberySimulation of street robbery Typology of crime simulationTypology of crime simulation
– To be used in the crime simulation bookTo be used in the crime simulation book Issues and discussionsIssues and discussions

Jan. 29 - Feb. 2, 2007 Liu, at IPAM, UCLA 5
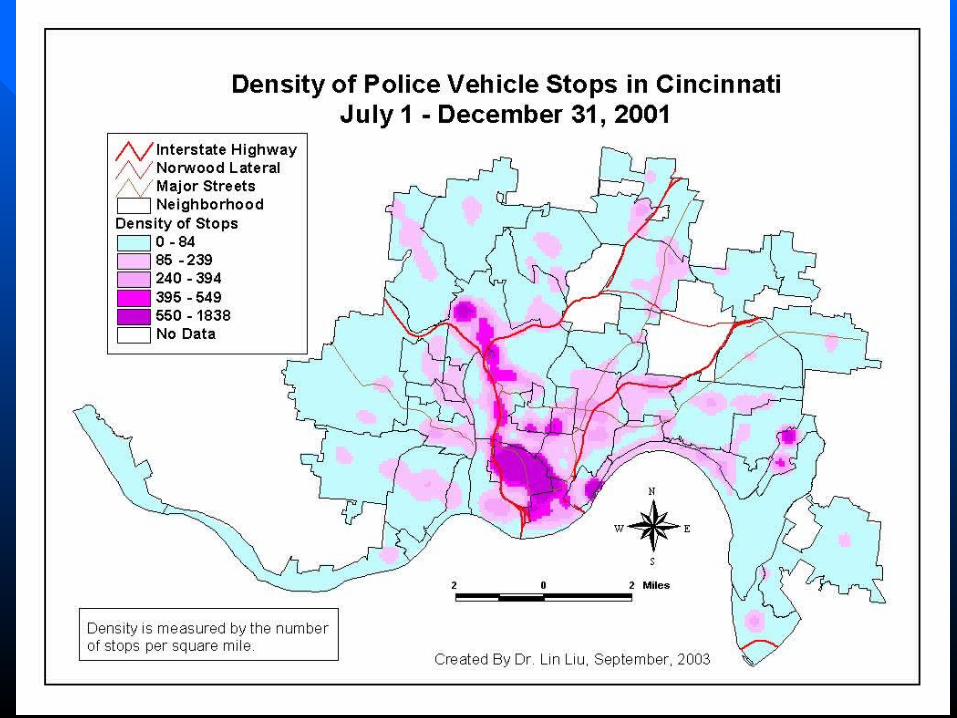
““Racial Profiling” in Traffic StopsRacial Profiling” in Traffic Stops Hypothesis: are vehicles driven by minorities Hypothesis: are vehicles driven by minorities
disproportionately stopped by police?disproportionately stopped by police? A pattern of disproportionality does not A pattern of disproportionality does not
show the process that gives arise to the show the process that gives arise to the pattern.pattern.
Liu, L. and J. Eck. Forthcoming. “Analyzing traffic stops in Cincinnati: A Geographic Perspective,” Geography Research Forum.
Jan. 29 - Feb. 2, 2007 Liu, at IPAM, UCLA 6

Jan. 29 - Feb. 2, 2007 Liu, at IPAM, UCLA 7
Jan. 29 - Feb. 2, 2007 Liu, at IPAM, UCLA 8
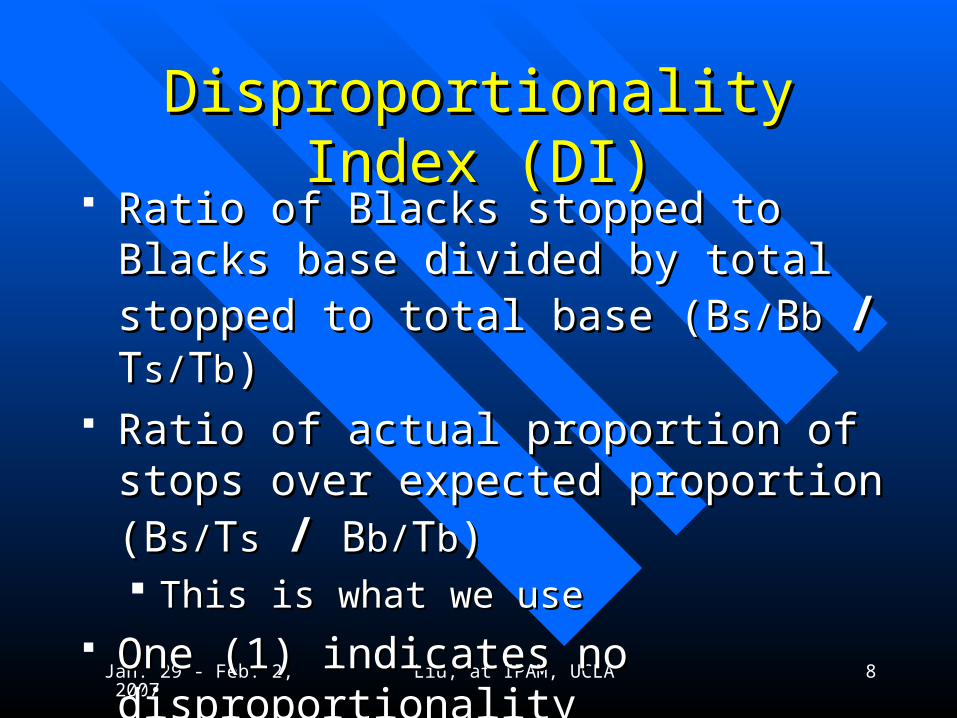
Disproportionality Index (DI)Disproportionality Index (DI) Ratio of Blacks stopped to Blacks base Ratio of Blacks stopped to Blacks base
divided by total stopped to total base divided by total stopped to total base (B(Bs/s/BBbb // T Ts/s/TTbb))
Ratio of actual proportion of stops over Ratio of actual proportion of stops over expected proportion (Bexpected proportion (Bs/s/TTss // B Bb/b/TTbb)) This is what we useThis is what we use
One (1) indicates no disproportionalityOne (1) indicates no disproportionality

Jan. 29 - Feb. 2, 2007 Liu, at IPAM, UCLA 9
DI CalculationDI Calculation The numerator is calculated from the data on The numerator is calculated from the data on
contact cardscontact cards For the denominator, many studies use Census For the denominator, many studies use Census
residential populationresidential population Assumes people drive where they liveAssumes people drive where they live Not reasonableNot reasonable
We use estimated vehicle miles by race in each of We use estimated vehicle miles by race in each of the 52 neighborhoodsthe 52 neighborhoods

Jan. 29 - Feb. 2, 2007 Liu, at IPAM, UCLA 10
Vehicle Miles by RaceVehicle Miles by Race Data usedData used
Average daily traffic countsAverage daily traffic counts Field observation for the race of driver during rush hoursField observation for the race of driver during rush hours Trip table: # of people traveling from one TAZ to work in another Trip table: # of people traveling from one TAZ to work in another
TAZTAZ
Vehicle milesVehicle miles Rush hours: 23% of the average daily traffic count, race by observation and Rush hours: 23% of the average daily traffic count, race by observation and
extrapolation. Equilibrium traffic assignment is used.extrapolation. Equilibrium traffic assignment is used. Work hours: 38.5% of the average daily traffic count, race by work hour Work hours: 38.5% of the average daily traffic count, race by work hour
population distributionpopulation distribution Nighttime: 38.5% of the average daily traffic count, race by census Nighttime: 38.5% of the average daily traffic count, race by census
population distributionpopulation distribution

Jan. 29 - Feb. 2, 2007 Liu, at IPAM, UCLA 11

Jan. 29 - Feb. 2, 2007 Liu, at IPAM, UCLA 12
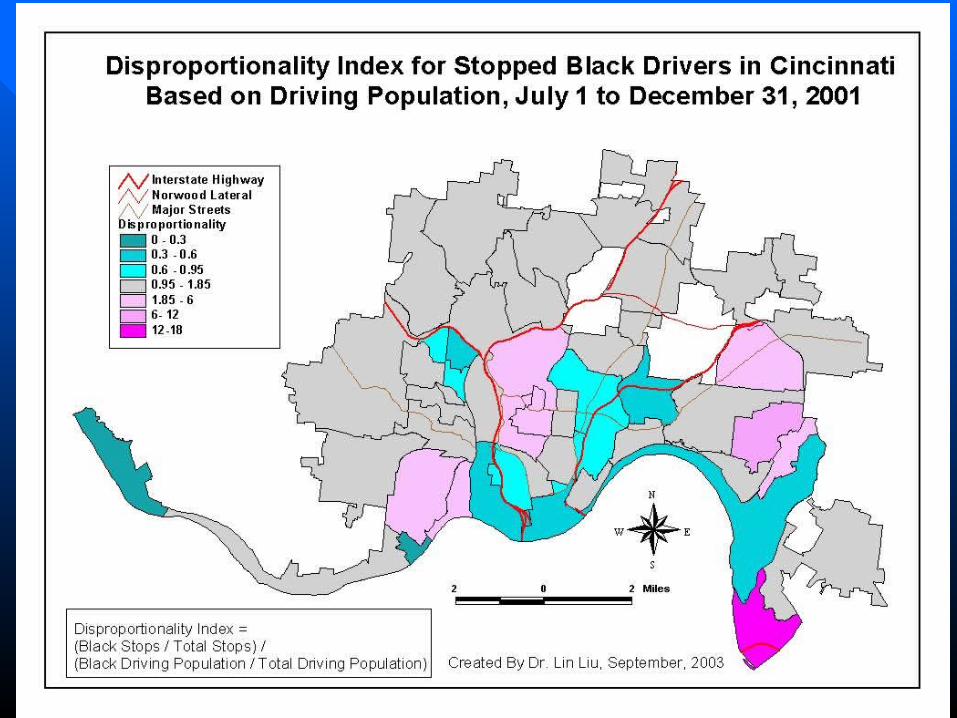
DI Calculation (Continued)DI Calculation (Continued) DI based on driving population DI based on driving population
0 to 0 to 17.817.8 in the 52 neighborhoods in the 52 neighborhoods 1.231.23 for the entire city for the entire city
DI based on vehicle milesDI based on vehicle miles 0 to 0 to 3.243.24 in the 52 neighborhoods in the 52 neighborhoods 1.361.36 for for the entire citythe entire city
The spatial distribution of these two sets of The spatial distribution of these two sets of DI is very different.DI is very different.
Jan. 29 - Feb. 2, 2007 Liu, at IPAM, UCLA 13

Jan. 29 - Feb. 2, 2007 Liu, at IPAM, UCLA 14
Jan. 29 - Feb. 2, 2007 Liu, at IPAM, UCLA 15
SummarySummary NetworkNetwork model improve the estimate of the model improve the estimate of the
denominatordenominator– Cannot assess its accuracy because the truth is Cannot assess its accuracy because the truth is
unknownunknown» Can simulation help?Can simulation help?
The disproportionality index is highly The disproportionality index is highly variant of the denominatorvariant of the denominator
A single globe measure does not help A single globe measure does not help improve policingimprove policing

Jan. 29 - Feb. 2, 2007 Liu, at IPAM, UCLA 16
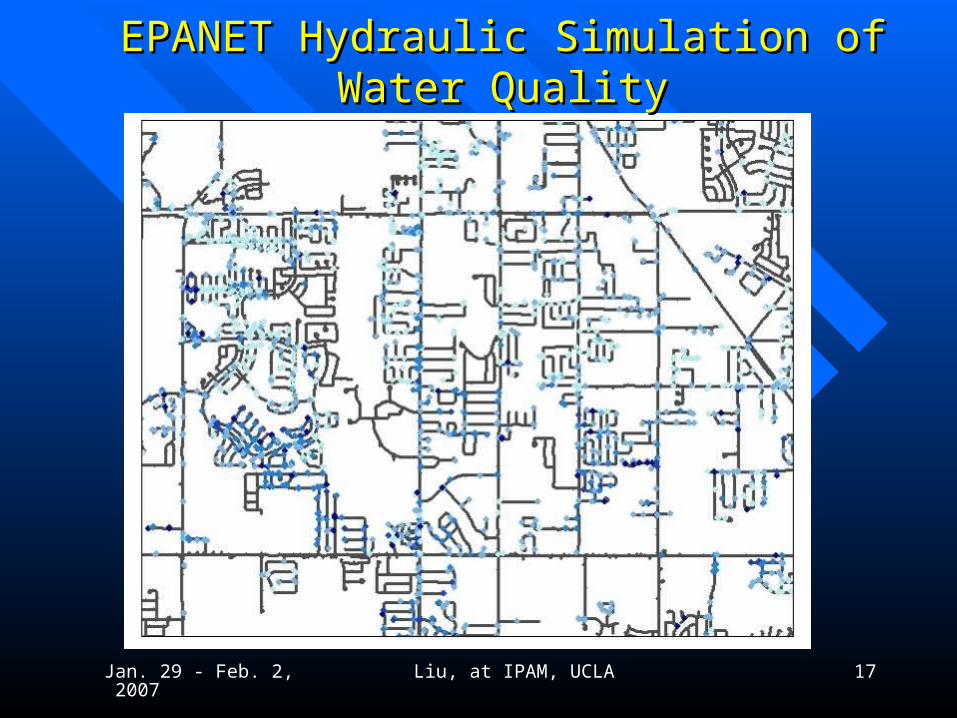
The Impact of Pipeline Network on The Impact of Pipeline Network on Spatial AggregationsSpatial Aggregations
Study the correlation between drinking Study the correlation between drinking water quality and gastrointestinal illnesswater quality and gastrointestinal illness
Implication on crime analysisImplication on crime analysis
Swift, A., L. Liu*, J. Uber. “Reducing MAUP Bias of Correlation Statistics between Water Quality and GI Illness,” submitted to Computers, Environment and Urban Systems.
Jan. 29 - Feb. 2, 2007 Liu, at IPAM, UCLA 17
EPANET Hydraulic Simulation of Water QualityEPANET Hydraulic Simulation of Water Quality
Jan. 29 - Feb. 2, 2007 Liu, at IPAM, UCLA 18
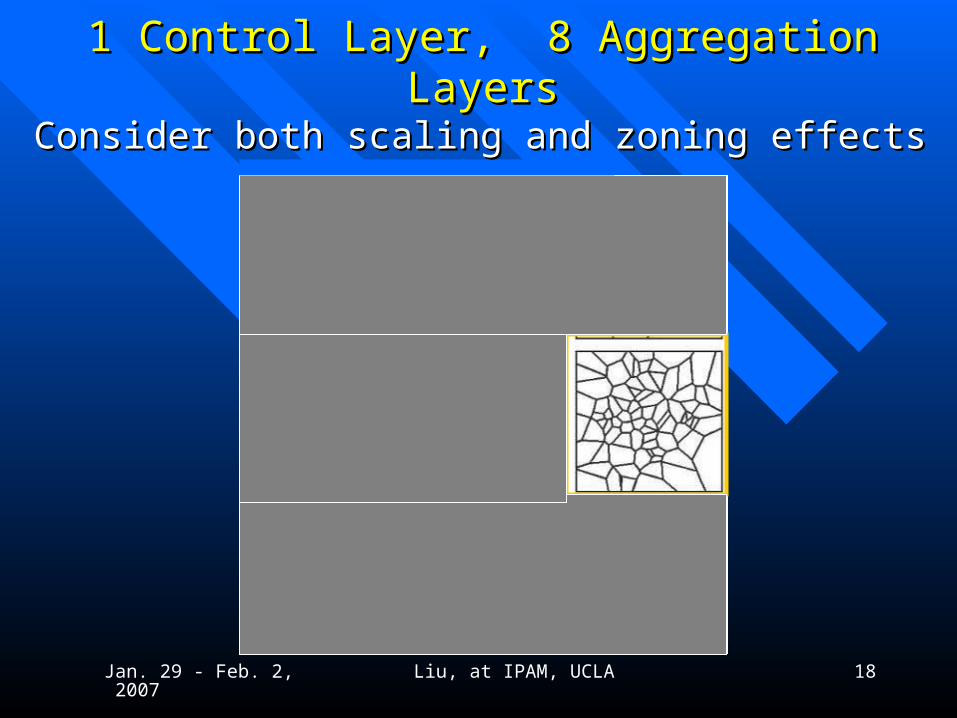
1 Control Layer, 8 Aggregation Layers1 Control Layer, 8 Aggregation Layers
Consider both scaling and zoning effectsConsider both scaling and zoning effects
Jan. 29 - Feb. 2, 2007 Liu, at IPAM, UCLA 19
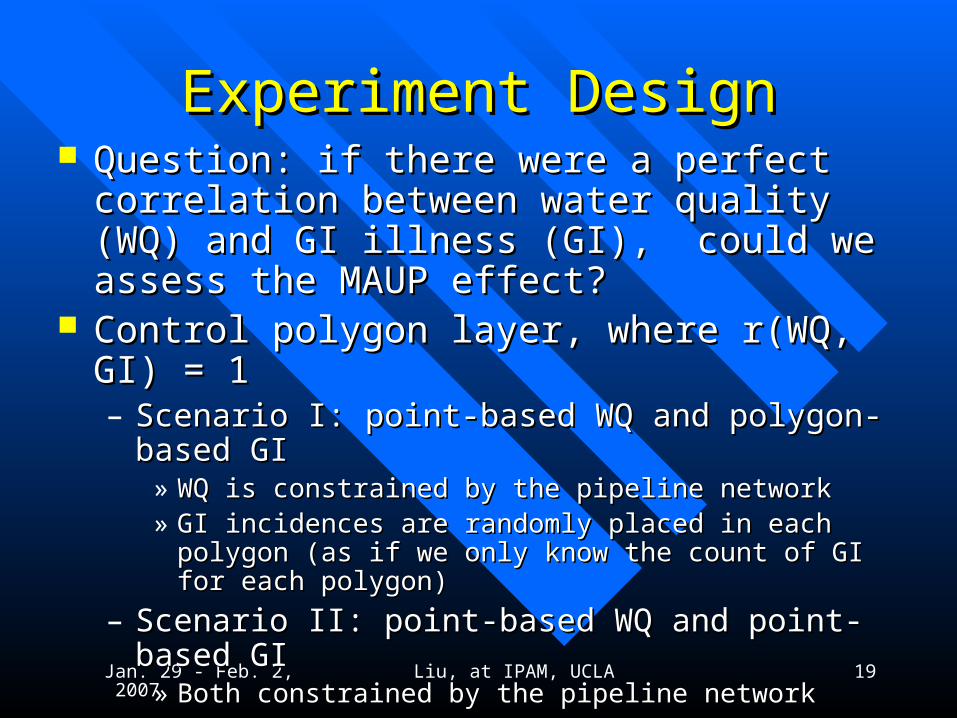
Experiment DesignExperiment Design Question: if there were a perfect correlation between Question: if there were a perfect correlation between
water quality (WQ) and GI illness (GI), could we water quality (WQ) and GI illness (GI), could we assess the MAUP effect?assess the MAUP effect?
Control polygon layer, where r(WQ, GI) = 1Control polygon layer, where r(WQ, GI) = 1– Scenario I: point-based WQ and polygon-based GIScenario I: point-based WQ and polygon-based GI
» WQ is constrained by the pipeline networkWQ is constrained by the pipeline network» GI incidences are randomly placed in each polygon (as if we only GI incidences are randomly placed in each polygon (as if we only
know the count of GI for each polygon) know the count of GI for each polygon)
– Scenario II: point-based WQ and point-based GIScenario II: point-based WQ and point-based GI» Both constrained by the pipeline networkBoth constrained by the pipeline network
– r1=r2=1r1=r2=1 Re-aggregate using different polygon layersRe-aggregate using different polygon layers
– Compare r1 and r2, with the expectation of r2>r1Compare r1 and r2, with the expectation of r2>r1

Jan. 29 - Feb. 2, 2007 Liu, at IPAM, UCLA 20
Jan. 29 - Feb. 2, 2007 Liu, at IPAM, UCLA 21
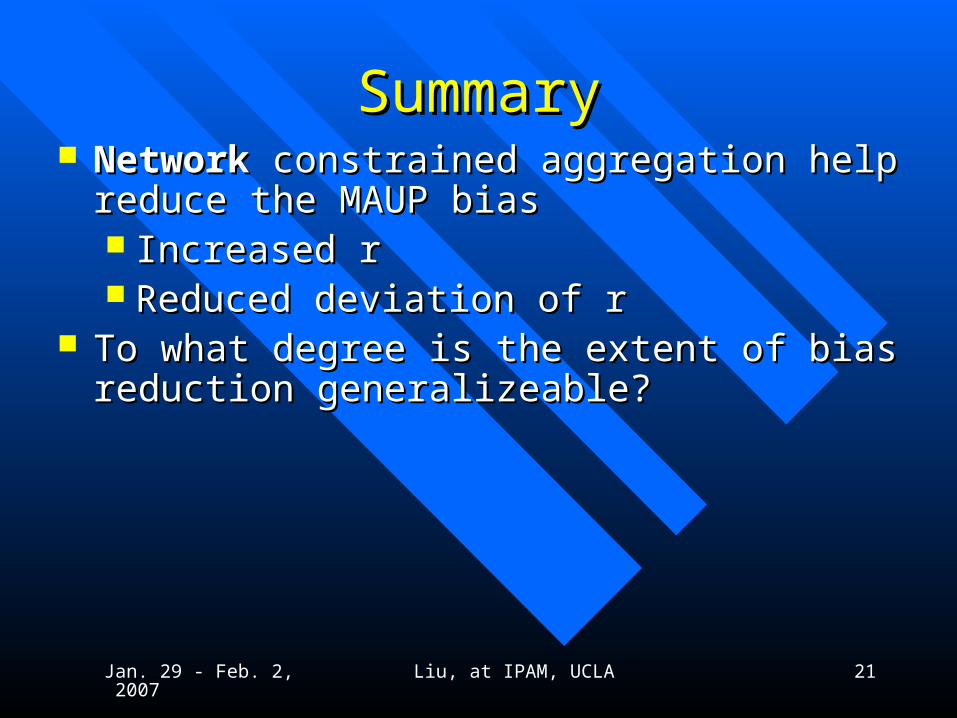
SummarySummary NetworkNetwork constrained aggregation help reduce the constrained aggregation help reduce the
MAUP biasMAUP bias Increased rIncreased r Reduced deviation of rReduced deviation of r
To what degree is the extent of bias reduction To what degree is the extent of bias reduction generalizeable?generalizeable?

Jan. 29 - Feb. 2, 2007 Liu, at IPAM, UCLA 22
Agent-Based Crime SimulationAgent-Based Crime Simulation Integrate agent based modeling and Integrate agent based modeling and cellular cellular
automaton to simulate street robbery eventsautomaton to simulate street robbery events Spatial Adaptive Crime Event Simulation Spatial Adaptive Crime Event Simulation
(SPACES)(SPACES)Liu, L. X. Wang, J. Eck and J. Liang. 2005. Simulating Crime Events And Crime Patterns In a RA/CA Model, Geographic Information Systems and Crime Analysis, edited by F. Wang. 2005. Reading, PA: Idea Publishing. Pp. 197-213.
Wang, X., L. Liu and J. Eck. Forthcoming. “Crime Patterns Simulation Using GIS and Artificial Intelligent Agents,” Artificial Crime Analysis Systems: Using Computer Simulations and Geographic Information Systems. Edited by Liu, L. and J. Eck. Idea Publishing.
Liu, L. and J. Eck. Forthcoming. Artificial Crime Analysis Systems: Using Computer Simulations and Geographic Information Systems. Idea Publishing.
Jan. 29 - Feb. 2, 2007 Liu, at IPAM, UCLA 23
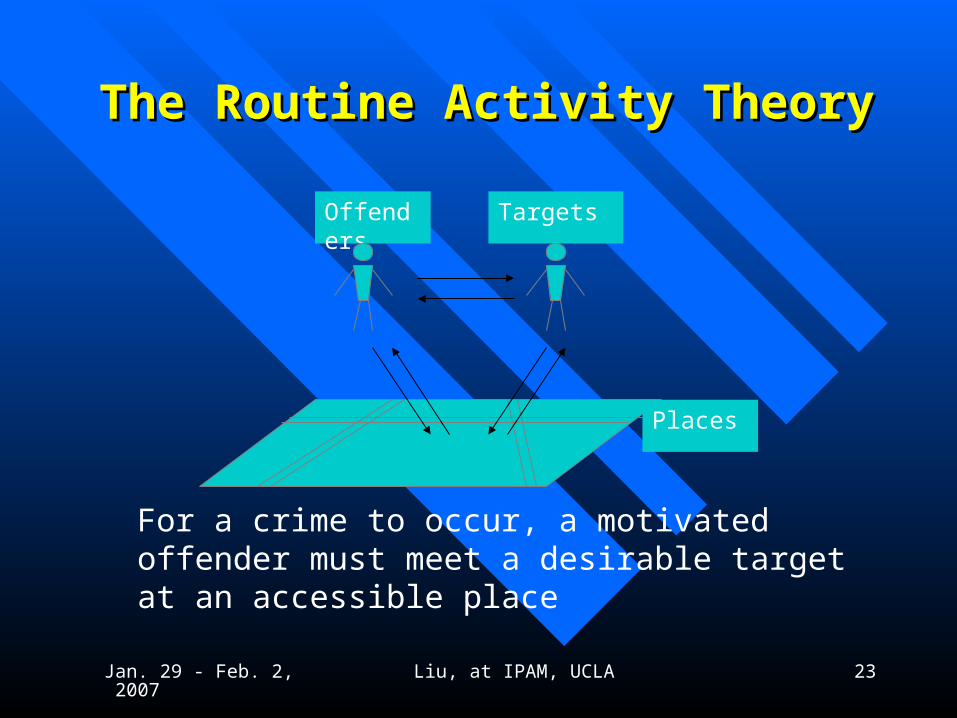
The Routine Activity TheoryThe Routine Activity Theory
For a crime to occur, a motivated offender must meet a desirable target at an accessible place
Offenders Targets
Places
Jan. 29 - Feb. 2, 2007 Liu, at IPAM, UCLA 24
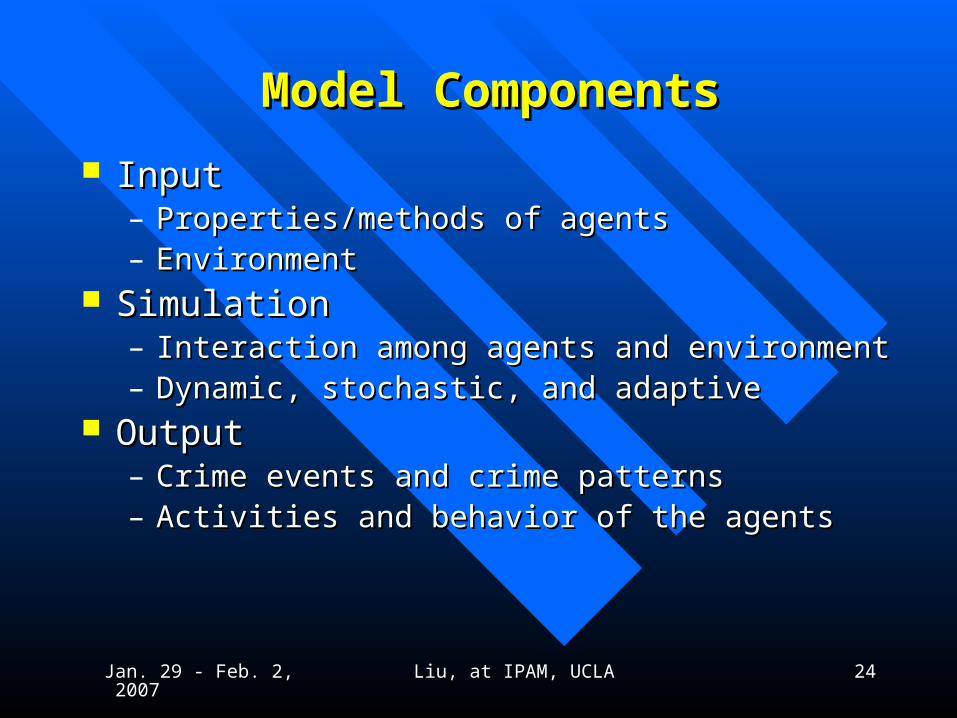
Model ComponentsModel Components
InputInput– Properties/methods of agentsProperties/methods of agents– EnvironmentEnvironment
SimulationSimulation– Interaction among agents and environmentInteraction among agents and environment– Dynamic, stochastic, and adaptiveDynamic, stochastic, and adaptive
OutputOutput– Crime events and crime patternsCrime events and crime patterns– Activities and behavior of the agentsActivities and behavior of the agents

Jan. 29 - Feb. 2, 2007 Liu, at IPAM, UCLA 25
The Simulation ComponentThe Simulation Component
Integration of agent based simulation and Integration of agent based simulation and Cellular automatonCellular automaton
Cellular automaton (CA)Cellular automaton (CA)– A space-time simulation frameworkA space-time simulation framework– Micro (local) rules lead to macro (global) Micro (local) rules lead to macro (global)
changeschanges Interaction among agents and environmentInteraction among agents and environment
– Agents placed on a CAAgents placed on a CA– Adaptation through feedback and experienceAdaptation through feedback and experience

Jan. 29 - Feb. 2, 2007 Liu, at IPAM, UCLA 26
A Crime CA ModelA Crime CA Model State variable – Tension (or fear)State variable – Tension (or fear)
– A surrogate measure of people’s reaction to crimeA surrogate measure of people’s reaction to crime» Global (via news media), and local (via personal experience)Global (via news media), and local (via personal experience)
– A crime event increases the tension at the crime locationA crime event increases the tension at the crime location» Decays in space and time through a wave like functionDecays in space and time through a wave like function
Tension surfaceTension surface– A crime event generates a tension wave, just like a stone A crime event generates a tension wave, just like a stone
generating a water wave in a pondgenerating a water wave in a pond– Multiple crime events generate multiple tension waves, Multiple crime events generate multiple tension waves,
which mix just like multiple water waves mixing in a which mix just like multiple water waves mixing in a pondpond
– A tension surface consists one tension wave or multiple A tension surface consists one tension wave or multiple mixed tension wavesmixed tension waves

Jan. 29 - Feb. 2, 2007 Liu, at IPAM, UCLA 27
Agents in Crime SimulationAgents in Crime Simulation Types of agents: offender, target, place manager, Types of agents: offender, target, place manager,
policepolice Properties: characteristics of an agentProperties: characteristics of an agent
– Desirability of a target, motivation of an offender, etc.Desirability of a target, motivation of an offender, etc.– Adaptation rate: how fast does an agent learn from the past Adaptation rate: how fast does an agent learn from the past
experienceexperience Methods: what an agent can doMethods: what an agent can do
– Update propertiesUpdate properties– Routine activities: homeRoutine activities: homeshoppingshoppinghome, etc.home, etc.– Adaptive learning: Adaptive learning:
» Adaptation rates determine the speed of learningAdaptation rates determine the speed of learning» Offenders and targets adjust movement patternsOffenders and targets adjust movement patterns» Place managers adjust security measuresPlace managers adjust security measures

Jan. 29 - Feb. 2, 2007 Liu, at IPAM, UCLA 28
Target AgentsTarget Agents Each crime event imposes a cost to targetEach crime event imposes a cost to target
– Saved at the crime location on a cost map, shared by all Saved at the crime location on a cost map, shared by all target agentstarget agents
– Cost decays in timeCost decays in time
Target cognitive mapTarget cognitive map– Guides spatial movement of all target agentsGuides spatial movement of all target agents
– Generated and dynamically updated by re-enforcement Generated and dynamically updated by re-enforcement learning of all target agentslearning of all target agents
» Based from travel cost and crime cost – a local modelBased from travel cost and crime cost – a local model
» The goal is to minimize overall costThe goal is to minimize overall cost
Jan. 29 - Feb. 2, 2007 Liu, at IPAM, UCLA 29
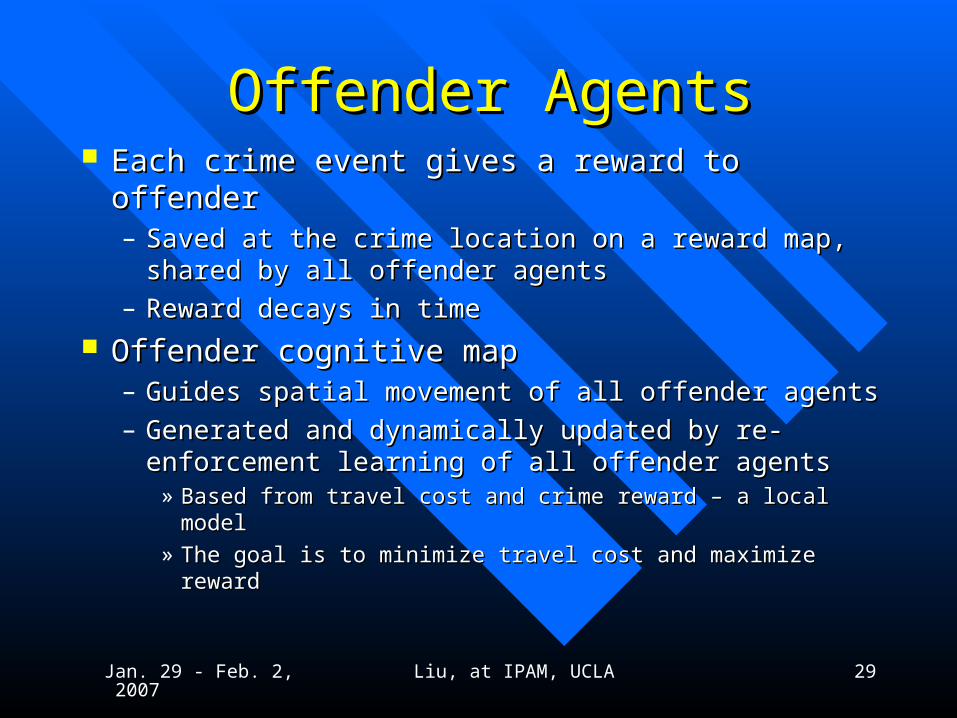
Offender AgentsOffender Agents Each crime event gives a reward to offenderEach crime event gives a reward to offender
– Saved at the crime location on a reward map, shared by Saved at the crime location on a reward map, shared by all offender agentsall offender agents
– Reward decays in timeReward decays in time
Offender cognitive mapOffender cognitive map– Guides spatial movement of all offender agentsGuides spatial movement of all offender agents
– Generated and dynamically updated by re-enforcement Generated and dynamically updated by re-enforcement learning of all offender agentslearning of all offender agents
» Based from travel cost and crime reward – a local modelBased from travel cost and crime reward – a local model
» The goal is to minimize travel cost and maximize rewardThe goal is to minimize travel cost and maximize reward
Jan. 29 - Feb. 2, 2007 Liu, at IPAM, UCLA 30

Jan. 29 - Feb. 2, 2007 Liu, at IPAM, UCLA 31
What For?What For?
Not for:Not for:– PredictionPrediction
ForFor– Examination of processesExamination of processes– Hypothesis generation and testingHypothesis generation and testing– What-if scenarios analysisWhat-if scenarios analysis– What do we learn from agent’s behavior?What do we learn from agent’s behavior?– What do we learn from spatial-temporal What do we learn from spatial-temporal
distribution of crime events?distribution of crime events?

Jan. 29 - Feb. 2, 2007 Liu, at IPAM, UCLA 32
ExperimentsExperiments
Adaptive learning of targetsAdaptive learning of targets– Shifting spatial movement patternsShifting spatial movement patterns
Adaptive learning of offenderAdaptive learning of offender– Shifting spatial movement patternsShifting spatial movement patterns
Impact of different adaptation ratesImpact of different adaptation rates– Fast learner v.s. slow learnerFast learner v.s. slow learner
Distribution and accumulation of crime Distribution and accumulation of crime events as a result of the agents’ adaptationevents as a result of the agents’ adaptation– Power lawPower law
Jan. 29 - Feb. 2, 2007 Liu, at IPAM, UCLA 33
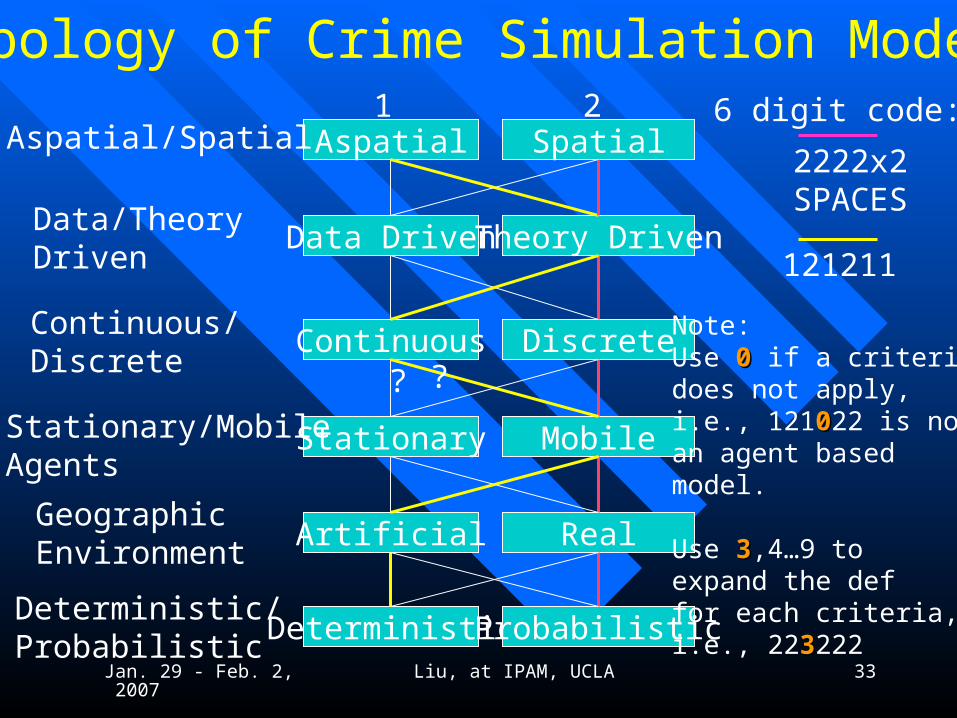
Aspatial Spatial
Data Driven Theory Driven
Continuous Discrete
Stationary Mobile
Artificial Real
Aspatial/Spatial
Data/TheoryDriven
Stationary/Mobile Agents
Continuous/Discrete
GeographicEnvironment
Deterministic ProbabilisticDeterministic/Probabilistic
Typology of Crime Simulation Models1 2
2222x2SPACES
121211
Note: Use 00 if a criteria does not apply, i.e., 1210022 is notan agent basedmodel.
Use 33,4…9 to expand the deffor each criteria,i.e., 2233222
6 digit code:
??

Jan. 29 - Feb. 2, 2007 Liu, at IPAM, UCLA 34
Key IssuesKey Issues Calibration and validationCalibration and validation
– Theory driven models that address agent behavior are Theory driven models that address agent behavior are difficult, if not impossible, to calibratedifficult, if not impossible, to calibrate
» Too many parametersToo many parameters» No data, or bad dataNo data, or bad data
– Data driven models that do not explicitly address the Data driven models that do not explicitly address the process are easier to calibrateprocess are easier to calibrate
– Must use real geographic environmentMust use real geographic environment How to compare two spatial layers?How to compare two spatial layers?
– Similarity measureSimilarity measure– A single (global) measure is not enoughA single (global) measure is not enough

Jan. 29 - Feb. 2, 2007 Liu, at IPAM, UCLA 35
Key IssuesKey Issues PredictionPrediction
– Total count (aspatial) can be predictableTotal count (aspatial) can be predictable» What will be next year’s over all crime rate for the entire city?What will be next year’s over all crime rate for the entire city?
– Individual events (spatial) is impossible to predictIndividual events (spatial) is impossible to predict» When will the next burglary occur at a specific location? When will the next burglary occur at a specific location?
– Accumulation of individual events at a location during Accumulation of individual events at a location during a period of time is difficult, but possible, to predicta period of time is difficult, but possible, to predict
» What is threshold temporal resolution to produce meaningful What is threshold temporal resolution to produce meaningful patterns?patterns?
Varies by crime, more frequent crime needs less timeVaries by crime, more frequent crime needs less time
– Un-calibrated models cannot be used to predictionUn-calibrated models cannot be used to prediction» Be careful with calibrated models as well, as they tend to over-Be careful with calibrated models as well, as they tend to over-
fit the datafit the data

Jan. 29 - Feb. 2, 2007 Liu, at IPAM, UCLA 36
SummarySummary Use model type 2222x2 (spatial, theory Use model type 2222x2 (spatial, theory
driven, discrete, mobile agents, real/virtual driven, discrete, mobile agents, real/virtual geographic environment, probabilistic)geographic environment, probabilistic)– as virtual labas virtual lab– to study process, mechanism, causal effectto study process, mechanism, causal effect– not for predictionnot for prediction
Use model x1xxxx (data driven)Use model x1xxxx (data driven)– for predictionfor prediction– but not for making causable statementbut not for making causable statement

Jan. 29 - Feb. 2, 2007 Liu, at IPAM, UCLA 37
ChallengesChallenges Create hybrid models that are both theory Create hybrid models that are both theory
and data driven and data driven – For causal analysis and predictionFor causal analysis and prediction
Design sound experiments for theory driven Design sound experiments for theory driven modelsmodels– Explore what’s newExplore what’s new

Jan. 29 - Feb. 2, 2007 Liu, at IPAM, UCLA 38
Thank You!Thank You!