limnology and oceanography: methods - aslo
TRANSCRIPT

319
Introduction
In the oceanic environment, primary production is con-trolled by major nutrient elements such as nitrogen, phos-phorus, and silicon (Falkowski et al. 1998), as well as byimportant trace metals such as iron (Martin and Fitzwater1988). Among all the nutrients, nitrate and phosphate are thetwo best studied compounds in the ocean. Nitrate is oftenthought as a proximate limiting nutrient to the seasonalgrowth of phytoplankton in the surface ocean while phos-phate is regarded as an ultimate limiting nutrient over geo-logical time scales. Several recent studies indicated that someN2-fixing organisms could be phosphate dependent in bothcoastal and open ocean environments (Sanudo-Wilhelmy etal. 2001; Sundareshwar et al. 2003), thus prompting contin-ued debate on the role of these two nutrients in the ocean. Atpresent, the biogeochemical cycling of these two nutrients inthe ocean is not fully understood, particularly in oligotrophic
regions where concentrations are below the detection limits ofconventional analytical techniques (Benitez-Nelson 2000).Accurate quantification of both nitrate and phosphate at lowconcentrations is therefore essential for understanding thedynamics of oligotrophic ecosystems and their role in globalclimate change.
In recent years, there has been increasing demand for novelanalyzers and sensor systems in support of in-situ oceano-graphic studies (Doney 2004), particularly instruments forsimultaneously measuring multiple variables (Gray et al.2006). Vink et al. (2000) developed a towed system to deter-mine both iron and aluminum by combining underway sam-pling with flow injection analysis (FIA), thus providing thehigh-resolution spatial distribution of these trace metals in theopen ocean. An auto-analyzer capable of the simultaneousdetermination of nitrate and total sulfide was applied success-fully in a hydrothermal vent system to study the chemistry inthis extreme habitat (Bris et al. 2000). Masserini and Fanning(2000) developed a sensor package to measure nitrate, nitrite,and ammonium in seawater, and this system was used tostudy the nitrogen cycle at nanomolar levels. Anautonomously deployed nutrient system showed promise forlong-term oceanographic monitoring of nitrate, phosphate,and silicate at depths to ~1000 m (Thouron et al. 2003). Thefeasibility of flow-injection techniques with spectroscopicdetection for remote deployment to measure multiple vari-ables with high resolution has been described recently (Man-rahan et al. 2002). Further improvement and application ofthese systems in field observations will greatly advance our
Underway monitoring of nanomolar nitrate plus nitrite andphosphate in oligotrophic seawaterQian P. Li1*, Dennis A. Hansell1, and Jia-Zhong Zhang2
1Rosenstiel School of Marine and Atmospheric Science, University of Miami, Miami, FL USA2Atlantic Oceanographic and Meteorological Laboratory, National Oceanic and Atmospheric Administration, Miami, FL USA
AbstractTo study nutrient dynamics and cycling in oligotrophic open ocean environments, continuous mea-
surements of nanomolar nitrate, nitrite, and phosphate are valuable. However, such studies are usually imped-ed by the detection limits of conventional nutrient-sensors and analyzers. Here, we developed a shipboarddeployable underway system for simultaneously monitoring nitrate plus nitrite and phosphate at nanomolarconcentrations by the coupling of an optimized flow injection analytical system with two long-path liquidwaveguide capillary cells (LWCC). The detection limits are ~2 nM for nitrate plus nitrite and ~1.5 nM for phos-phate, respectively. Results from realtime surveys of waters over the west Florida continental shelf and the olig-otrophic Sargasso Sea are presented. This system has also been successfully used to analyze more than 1000 dis-crete seawater samples manually during 2 cruises in the North Atlantic.
*Corresponding author: E-mail: [email protected] address: Scripps Institution of Oceanography, La Jolla, CA92093; phone: (858) 246-0360; fax: (858) 822-0562
AcknowledgmentsThe authors are grateful to the crews of R/V F.G. Walton Smith and
R/V Oceanus for their assistance during the fieldwork in South Floridacoastal waters and in the Sargasso Sea. We thank two anonymousreviewers for useful comments on the manuscripts. This work is support-ed by National Science Foundation (OCE0241340 to DAH) and aRSMAS Mary Roche Fellowship (to QPL). JJZ also wishes to acknowledgethe support of NOAA.
Limnol. Oceanogr.: Methods 6, 2008, 319–326© 2008, by the American Society of Limnology and Oceanography, Inc.
LIMNOLOGYand
OCEANOGRAPHY: METHODS

knowledge of biogeochemical dynamics in the ocean.Although several methods for nitrate and nitrite determina-
tions in seawater have been reported, including spectropho-tometry, chemilumenesence, electrophoresis, florescence spec-troscopy, high pressure liquid chromatography (HPLC), andion chromatography (Garside 1982; Kieber and Seaton 1995;Daniel et al. 1995; Hansen and Koroleff 1999; Okemgbo et al.1999; Masserini and Fanning 2000; Manrahan et al. 2002;Thouron et al. 2003; Ito et al. 2005), the colorimetric methodwith cadmium reduction remains the most popular techniquefor nitrate determinations in natural waters (Moorcroft et al.2001). To increase sensitivity, long-path flow cells have beensuccessfully incorporated into conventional spectrophotomet-ric methods for nitrate and nitrite measurements at nanomolarlevel (Yao et al. 1998; Zhang 2000).
Various techniques have been used to determine low-levelphosphate in natural seawater. Preconcentration is a com-monly employed approach, either by Mg(OH)2 induced copre-cipitation to scavenge phosphate onto the precipitates (Karland Tien 1992; Rimmelin and Moutin 2005; Anagnostou andSherrell 2008) or by solvent-extraction and filter-sorption toconcentrate the phosphate-molybdate complex (Hansen andKoroleff 1999; Zui and Birks 2000). All these preconcentrationprocedures are time consuming, easily contaminated, andunsuitable for automated analysis. Another technique relieson expensive instruments such as laser-induced thermal lens-ing (Fujiwara et al. 1982) and HPLC (Haberer and Brandes2003), which again are not feasible for direct shipboard mea-surements. Using chemiluminescence detection (Yaqoob et al.2004) and microsequential injection (Wu and Ruzicka 2001),highly sensitive determination of phosphate in fresh watersamples have been achieved, but to the best of our knowledge,these methods have not been successfully applied to oceano-graphic studies. The most feasible method for nanomolarphosphate determination is long-path spectrophotometry (Leiet al. 1983; Ormaza-Gonzalez and Statham 1991; Zhang andChi 2002). This technique is simple and easily automated, par-ticularly with application of long-path liquid waveguide capil-lary cell (LWCC) constructed with recently developed lowrefractive index fluoro-polymers (Dallas and Dasgupta 2004).Combining LWCC and conventional flow systems for phos-phate measurement, however, is challenged by problems suchas refractive index and baseline stability (Gimbert et al. 2007).
In this paper, we report an optimized continuous flow spec-trophotometric method to simultaneously determine nitrateplus nitrite and phosphate in seawater at nanomolar concen-trations using two 2-m LWCCs. This flow injection analyticalsystem is simple and largely minimizes the trouble introducedby segmentation bubbles in the gas-segmented flow system(Zhang 2000; Zhang and Chi 2002) and thus allows for real-time monitoring of low-level nitrate plus nitrite and phos-phate in seawater. Mixing and timing for chromophore devel-opment were optimized with emphasis on reducing the effectsof coating and baseline shifting to improve the analytical
performance. To reduce the background phosphate concentra-tion in the low-nutrient seawater that was used as a carriersolution, a novel procedure was employed based on thehydrolyzation of ferric ion and the subsequent removal ofphosphate from seawater by coprecipitation of phosphatewith ferric hydroxide. This analytical instrument can be usedfor either realtime monitoring of nutrient concentrations inthe oligotrophic ocean with an underway sampling unit ormanual analyses of discrete seawater samples from Niskin bot-tles. The system has been successfully deployed on severalcruises in the west Florida continental shelf and the NorthAtlantic Ocean near Bermuda.
Materials and proceduresLiquid waveguide capillary cell and photometric detector—Two
200-cm Liquid Waveguide Capillary Cells with quartz capil-lary tubing coated with a low refractive index polymer (WorldPrecision Instruments) were used here. The cells were regularlycleaned by continuous pumping of 10% HCl and deionizedwater. For water samples with high concentrations of particles,a pre-filtration step is recommended to reduce the chance ofblockage in the cells. If the cell is blocked by particles, the sys-tem should be stopped immediately, and the particlesremoved by slow injection of 10% HCl into the cell with asyringe. The photometric detectors in this system were con-ventional spectrophotometric detectors (Spectra SystemUV/vis-1000), with modifications to adapt to the long-pathliquid waveguide cells (Zhang 2000; Li et al. 2005).
Low phosphate seawater (LPSW)—Due to the difficulty inobtaining “phosphate-free” seawater, deionized water waschosen for the blank and standard matrix in an earlier versionof the long capillary cell method, resulting in a refractiveindex effect equivalent to ~13 nM of phosphate for North Seawater (Ormaza-Gonzalez and Statham 1991). To reduce theeffect of refractive index, matching the salinity between sam-ples and standards is important in colorimetric methods espe-cially for measurements made at nanomolar level (Li et al.2005). Supernatant from the co-precipitation of Mg(OH)2 andphosphate in seawater, the “MAGIC” procedure (Karl and Tien1992) has been used as a phosphate-free water to quantify thetrace amount of phosphate in oligotrophic surface seawater(Karl and Tien 1992; Rimmelin and Moutin 2005), and a sim-ilar procedure was chosen to prepare phosphate-free seawaterfor phosphate measurement in a long flow cell method withan air-segment flow analyzer (SFA) (Zhang and Chi 2002).However, given that a large amount of magnesium wasremoved from the seawater after adding NaOH, differences inthe matrix between the low-phosphate seawater and normalseawater were observed, as indicated from the significantspikes in peak signals when switching between sample andcarrier. In this study, FeCl3 (analytical grade) was used toremove the background phosphate in the low nutrient seawa-ter collected from the surface water of the west Florida conti-nental shelf near 83.0°W and 24.5°N, which has a phosphate
Li et al. Monitoring of Nanomolar Nutrients
320

concentration <50 nM (a detection limit of conventional auto-analyzer method) throughout the year. This procedure is basedon the scavenging of phosphate by amorphous Fe(OH)3 gener-ated from the hydrolysis of FeCl3. The net outcome of thisprocess is to acidify the seawater slightly without significantlychanging the composition of the water itself. The amorphousferric oxide can be readily removed by filtration via 0.2 μm fil-ters. To determine phosphate in oligotrophic surface water accu-rately, it is necessary to make a correction for the phosphateconcentration in LPSW, which can be qualified by analyzingLPSW as sample and DIW as the blank (carrier and the matrixfor calibration standard, assume negligible phosphate in DIW)with correction of refractive index and salt effect (Zhang 2000;Zhang and Chi 2002; Li et al. 2005). The estimated concentra-tion of phosphate in the LPSW was ~1 nM (n = 7).
Detailed procedure for preparation of LPSW: A 20 mL FeCl3
(1 M) was added to LNSW (20 L) at the ratio of 1 to 1000 (v/v).The particles formed were allowed to settle out of solution for4-5 d. Brown Fe(OH)3 particles attached to the container wallshould be removed by gently tapping the wall to force theattached particles to fall to the bottom. The supernatant wastransferred to another clean 20 L plastic bottle by siphonthrough a clean Teflon tube (1.5 mm inner diameter). Finally,the water was slowly filtered through a 0.2 μm capsule filter bygravity, thus producing a clear solution with final pH of ~6.This water was used as the carrier for the phosphate channel.
Given a minimal refractive index in nitrate analysis as aresult of buffer dilution (Zhang 2000) and the difficulty of get-ting nitrate-free seawater, deionized water (DIW) was used ascarrier for the nitrate channel. DIW in this study was double-distilled water after purification with a Millipore Super-Q PlusWater System that produces water with 18 MΩ resistances.Concentrations of nitrate and nitrite in the deionized waterwere negligible.
Preparation of reagents and standards—All reagents were pre-pared in deionized water with reagent-grade chemicals andstored in polypropylene bottles, which were soaked in 10%HCl solution for 12 h and rinsed 3 times with DIW prior to use.
Reagents and chemicals for nitrate and nitrite determina-tion (λ = 540 nm) were (1) N-1-naphthylethylenediamine(NEDA): 1 g C12H14N2⋅HCl dissolved in 1.0 L DIW, (2) sulfanil-amide: 10 g C6H8N2O2S dissolved in 1.0 L 10% HCl solution, (3)imidazole: 27 g C3H4N2 dissolved in 8.0 L DIW and adjusted topH ≈ 8 with 10% HCl, and (4) cadmium column: after coatedwith 2% CuSO4, cadmium filings were carefully packed into aglass tube (2 mm i.d.) filled with deionized water.
Reagents for phosphate determination (λ = 800 nm) were(1) molybdate solution: 2.4 g (NH4)6Mo7O24⋅4H2O dissolved in200 mL 5 N H2SO4 and then diluted to 1.0 L with DIW, (and2) Hydrazine: 1.0 g N2H4SO4 dissolved in 200 mL DIW.
Nitrate and phosphate standards were prepared fromreagent-grade pre-dried (105°C for 2 h) KNO3 and KH2PO4,respectively. Stock standard solutions of 10.0 mM KNO3 and1.0 mM KH2PO4 were stored in polypropylene bottles at 4°C.
Working standards for nitrate were made by serial dilution ofthe nitrate stock solution with DIW, while working standardsfor phosphate were made from the serial dilution of phos-phate stock solutions with LPSW. The polypropylene bottlesfor reagents and standards were covered with PARAFILM(American National Can) to avoid potential airborne contam-inations. Both reagents and standards were renewed every 10h in continuous underway measurements.
Configuration of continuous flow system—A LabVIEW-basedcommunication program was written to control the FIA-LWCC underway system. This program has two front panelswith separate sub-programs: one for underway sampling andthe other for the analytical process, including chemical reac-tion and data analyses. The sample concentrations were cal-culated from the peak-heights of samples and a linear calibra-tion curve, which usually included 4-5 standards. The rawdata (.txt file), consisting of peak heights from the detector,were automatically saved every second. Because of the hugevolume of raw data, the software emptied the buffer memoryand created a new file every 5 h. Sample information and itsnutrient concentrations were saved in a spreadsheet. To cor-rect the potential baseline shift due to the instability ofreagents over time, the system automatically inserted a blankor a set of standards (usually 1-4 standards) every 10-20 sam-ples during the analyses.
Instrument control was performed by SCB-68, a shieldedI/O connector block for interfacing I/O signals to PC with 68-pin connectors (National Instruments). Combined with theshielded cables, the SCB-68 provides rugged, very low-noisesignal termination. The periodic valves (Cole-Parmer) wereconnected to a circulation board with 8 Reed Relays (Switch-ing Voltage: 12v), which were also connected to the SCB-68.Each valve can be turned on or off by SCB-68 with analogueinput of 1 or 0 from the computer. The signals (voltage) fromthe detectors were transferred to the SCB-68 and finally out-put on the software in real time.
Fig. 1 is a schematic flow diagram used for sampling andonline determinations of nanomolar nitrate and phosphate insurface seawater. Using the shipboard underway system, sea-water was continuously pumped into a clean plastic vialthrough a Teflon tube, and then flowed into two separatechannels for nitrate plus nitrite and phosphate measurements.In each channel, the carrier (DIW for nitrate plus nitrite andLPSW for phosphate) separated the samples at preset timeintervals. Duration for sample or carrier can be adjusted onthe software panel. A 6-inlet and 1-outlet periodic valve (Cole-Parmer Manifold Mixing Solenoid Valve) was used to selectamong sample, standards, and carrier for each channel. Theflow out of the valve passed through the mixing coils wherereagents were added and the chemical reactions took place.The chromophore formed from the reaction passed throughthe LWCC. Light transmission through the LWCC was mea-sured by a spectrophotometer and recorded digitally to a com-puter. All the tubing used in this manifold was 0.5 mm i.d.
Li et al. Monitoring of Nanomolar Nutrients
321

PTEE, except the pump tubing used in the peristaltic pump,which was flow-rated PVC (information about tubing size wasshown in Fig. 1). A debubbler before the LWCC removes anypotential micro bubbles in the underway seawater, which maynot be necessary if the injection seawater samples have negligi-ble bubbles, but is highly recommended when deploying thesystem under some extreme weather conditions such as storms.
AssessmentOptimization of analytical method—In the conventional
flow-through type of chemical sensors, the output signals arecontinually recorded as a function of time. This design has themerit of high spatial or temporal resolution but suffers a loweraccuracy due to sample dispersion and the potential baselinedrift. To optimize the instrument for analytical accuracy, weused the flow injection configuration. In this design, individ-ual peaks were generated when samples were injected into thecarrier stream (deionized water for nitrate and LPSW for phos-phate). The advantage of introducing sample into the carrier-stream rather than a continuous flow of sample lies in that itsubstantially reduces the baseline drift, a problem resultingfrom chronic coating of the chromophore on the internal wallof the flow cell. Surfactants were added to the reagents toimprove the baseline stability: Brij-35 (Aqua Solutions) fornitrate plus nitrite and Dowfax (OI Analytical Alpkem) forphosphate. Our results indicate that 1 mL Brij-35 in 200 mLsulfanilamide solution and 0.5 mL Dowfax in 200 mL molyb-date solution were sufficient for maintaining a smooth base-line for both channels.
Baseline drift in the phosphate channel was found whenascorbic acid was used as a reducing reagent. It was replacedby hydrazine sulfate, which reduced the coating effect ofmolybdate-blue (Zhang et al. 2001). Optimal concentrations
of reagents for development of molybdate-blue in our systemare presented in section 2.3. This recipe is a compromisebetween sensitivity and baseline noise. Given the low particlecontent of open ocean water, we did not use a filtration unitin our system so as to avoid the potential contaminationinduced from the filtration. However, it is highly recom-mended to add a filtration cartridge into the system for high-particle environments. The filtration unit should be insertedbetween the underway pump and the vial (Fig. 1), similar to atow-fish device used for trace metal measurements (Bowie etal. 2002; Gray et al. 2006).
Calibration of analytical system—Typical output signals ofnitrate and phosphate calibrations (from field work over thewest Florida continent shelf) are presented in Fig. 2. Fig. 3a-bshows the shipboard calibration curve for nitrate (a) and phos-phate (b) measurements with the FIA-LWCC underway systemduring the cruise. Determinations of nitrate and phosphatewere rapid (3 min per sample) and both showed good repro-ducibility. Linear responses were obtained for nitrate (y =21.791 × +123.7, r2 = 0.995, n = 30) up to 200 nM and phos-phate (y = 24.699 × +51.9, r2 = 0.995, n = 66) up to 100 nM.Note that these calibrations were made at high sea underwindy condition. The system performs better in laboratory(Fig. 3c-d). The linear ranges of nitrate and phosphate mea-surements can be increased by adding a dilution line to thesystem when it is used for analysis of high nutrient samples(Zhang 2000;Li et al. 2005; Li and Hansell 2008b). The detec-tion limit (determined as 3 times the standard deviation of theanalytical blanks) for nitrate plus nitrite was ~2 nM, in agree-ment with a previous study (Zhang 2000). We found a detec-tion limit of ~1.5 nM for phosphate, estimated from the stan-dard deviation of the blank, which was also confirmed byrepeat analyses of a 5 nM sample solution (4.9 ± 0.4 nM,n = 20). The precision for nitrate and nitrite and phosphate
Li et al. Monitoring of Nanomolar Nutrients
322
Fig. 1. Flow diagram of the automated analytical system for nitrate andphosphate by coupling of FIA and LWCC. DB is debubbler; LP is the lengthof the light path; SN is standard of nitrate for channel #1; SP is standard ofphosphate for channel #2; clean seawater was collected by an underwayperistaltic pump and transferred to the ship through Teflon tubes.
Fig. 2. Typical shipboard calibration peaks. Standard series for phos-phate (black) were 20 nM (peaks 2, 6, 10, 14), 40 nM (peaks 3, 7, 11,15), 60 nM (peaks 4, 8, 12, 16), 80 nM (peaks 1, 5, 9, 13, 17), 100 nM(peaks 18-22); standard series for nitrate (red) are 50 nM (peaks 2, 6, 10,14), 100 nM (peaks 3, 7, 11, 15), 150 nM (peaks 4, 8, 12, 16), 200 nM(peaks 1, 5, 9, 13, 17) and DIW (peak 18-23).
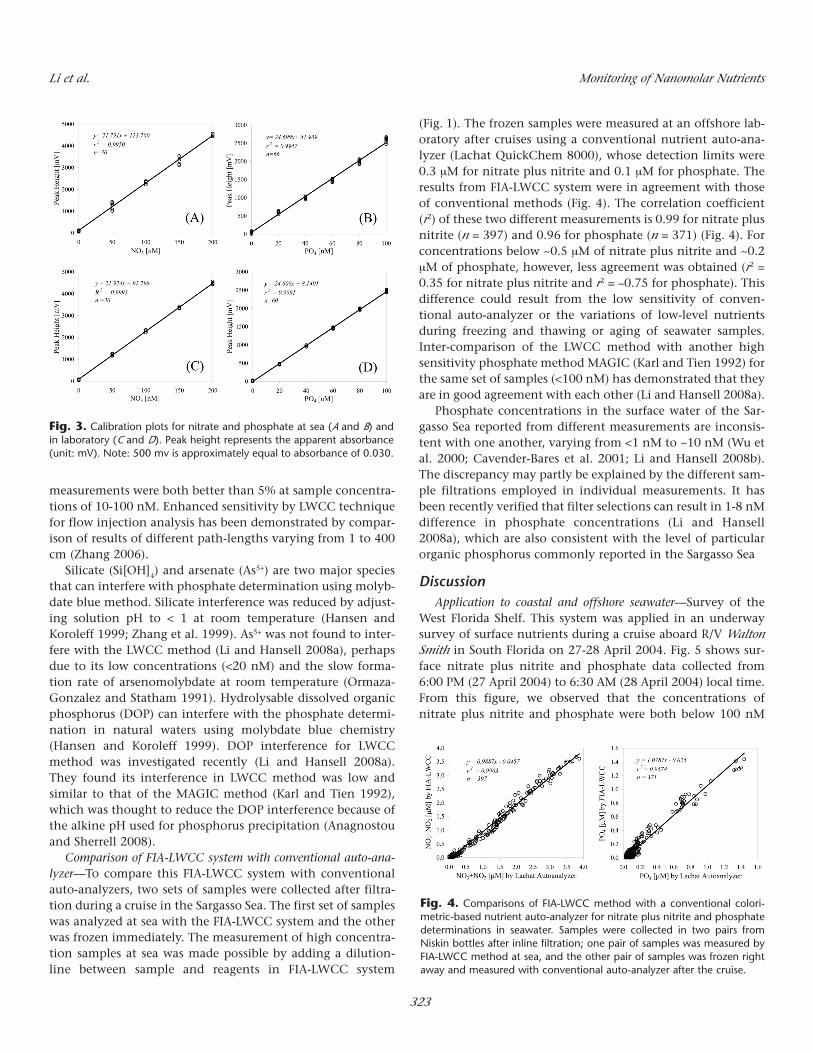
measurements were both better than 5% at sample concentra-tions of 10-100 nM. Enhanced sensitivity by LWCC techniquefor flow injection analysis has been demonstrated by compar-ison of results of different path-lengths varying from 1 to 400cm (Zhang 2006).
Silicate (Si[OH]4) and arsenate (As5+) are two major speciesthat can interfere with phosphate determination using molyb-date blue method. Silicate interference was reduced by adjust-ing solution pH to < 1 at room temperature (Hansen andKoroleff 1999; Zhang et al. 1999). As5+ was not found to inter-fere with the LWCC method (Li and Hansell 2008a), perhapsdue to its low concentrations (<20 nM) and the slow forma-tion rate of arsenomolybdate at room temperature (Ormaza-Gonzalez and Statham 1991). Hydrolysable dissolved organicphosphorus (DOP) can interfere with the phosphate determi-nation in natural waters using molybdate blue chemistry(Hansen and Koroleff 1999). DOP interference for LWCCmethod was investigated recently (Li and Hansell 2008a).They found its interference in LWCC method was low andsimilar to that of the MAGIC method (Karl and Tien 1992),which was thought to reduce the DOP interference because ofthe alkine pH used for phosphorus precipitation (Anagnostouand Sherrell 2008).
Comparison of FIA-LWCC system with conventional auto-ana-lyzer—To compare this FIA-LWCC system with conventionalauto-analyzers, two sets of samples were collected after filtra-tion during a cruise in the Sargasso Sea. The first set of sampleswas analyzed at sea with the FIA-LWCC system and the otherwas frozen immediately. The measurement of high concentra-tion samples at sea was made possible by adding a dilution-line between sample and reagents in FIA-LWCC system
(Fig. 1). The frozen samples were measured at an offshore lab-oratory after cruises using a conventional nutrient auto-ana-lyzer (Lachat QuickChem 8000), whose detection limits were0.3 μM for nitrate plus nitrite and 0.1 μM for phosphate. Theresults from FIA-LWCC system were in agreement with thoseof conventional methods (Fig. 4). The correlation coefficient(r2) of these two different measurements is 0.99 for nitrate plusnitrite (n = 397) and 0.96 for phosphate (n = 371) (Fig. 4). Forconcentrations below ~0.5 μM of nitrate plus nitrite and ~0.2μM of phosphate, however, less agreement was obtained (r2 =0.35 for nitrate plus nitrite and r2 = –0.75 for phosphate). Thisdifference could result from the low sensitivity of conven-tional auto-analyzer or the variations of low-level nutrientsduring freezing and thawing or aging of seawater samples.Inter-comparison of the LWCC method with another highsensitivity phosphate method MAGIC (Karl and Tien 1992) forthe same set of samples (<100 nM) has demonstrated that theyare in good agreement with each other (Li and Hansell 2008a).
Phosphate concentrations in the surface water of the Sar-gasso Sea reported from different measurements are inconsis-tent with one another, varying from <1 nM to ~10 nM (Wu etal. 2000; Cavender-Bares et al. 2001; Li and Hansell 2008b).The discrepancy may partly be explained by the different sam-ple filtrations employed in individual measurements. It hasbeen recently verified that filter selections can result in 1-8 nMdifference in phosphate concentrations (Li and Hansell2008a), which are also consistent with the level of particularorganic phosphorus commonly reported in the Sargasso Sea
DiscussionApplication to coastal and offshore seawater—Survey of the
West Florida Shelf. This system was applied in an underwaysurvey of surface nutrients during a cruise aboard R/V WaltonSmith in South Florida on 27-28 April 2004. Fig. 5 shows sur-face nitrate plus nitrite and phosphate data collected from6:00 PM (27 April 2004) to 6:30 AM (28 April 2004) local time.From this figure, we observed that the concentrations ofnitrate plus nitrite and phosphate were both below 100 nM
Li et al. Monitoring of Nanomolar Nutrients
323
Fig. 3. Calibration plots for nitrate and phosphate at sea (A and B) andin laboratory (C and D). Peak height represents the apparent absorbance(unit: mV). Note: 500 mv is approximately equal to absorbance of 0.030.
Fig. 4. Comparisons of FIA-LWCC method with a conventional colori-metric-based nutrient auto-analyzer for nitrate plus nitrite and phosphatedeterminations in seawater. Samples were collected in two pairs fromNiskin bottles after inline filtration; one pair of samples was measured byFIA-LWCC method at sea, and the other pair of samples was frozen rightaway and measured with conventional auto-analyzer after the cruise.

during the survey. It is also seen that nitrate plus nitrite covar-ied with phosphate in the surface (Fig. 5). The decrease ofnutrients in the early period of the survey (6 PM to 8 PM)reflects transit from a coastal region (continental shelf nearMarco Island) to the open waters of the Gulf of Mexico. Ele-vated nutrient concentrations (from 9 PM to 11 PM in Fig. 5)were observed near Dry Tortugas, which might result fromupwelling in this shoal area, as evidenced by the decrease ofsurface temperature from 25.2°C in the open ocean to 23.1°Cnear Dry Tortugas (data from two CTD casts). Our second visitto Dry Tortugas at the end of the survey again documented anincrease of surface nutrient concentrations (Fig. 5).
Open Ocean Survey. Several short trials were also under-taken in the Sargasso Sea near Bermuda. Fig. 6 shows the resultfrom the continuous measurements of nitrate plus nitrite,phosphate, and temperature on 18 June 2004. The ship tran-sited from 31°37′N, 60°04′W to 31°15′N, 60°27′W and then to31°15′N, 59°47′W during this trial. Both the surface concen-trations of nitrate plus nitrite and phosphate in the SargassoSea were ~10 nM (Fig. 6), and significantly lower than those ofSouth Florida coastal waters (Fig. 5). Covariation of these twonutrients was evident, though with much higher variability innitrate plus nitrate than in phosphate (Fig. 6).
Measurement from discrete bottle samples—The FIA-LWCCunderway system can also be used to analyze nitrate, nitrite,and phosphate manually in discrete water samples by switch-ing the underway sampling mode to manually handling dis-crete samples. Samples were collected from Niskin bottles afterinline filtration with a 0.8 μm pore-size Nuclepore filter andanalyzed at sea within 30 min of water collection. There weremore than 1000 seawater samples analyzed by this system in2 cruises during the summers of 2004 and 2005. Each samplewas analyzed up to 6 times, and the final value reported was
the average of the last 5 parallel measurements (The first mea-surement was not included as to avoid the carryover betweensamples). Nitrite was measured by removing the cadmiumreduction column and the buffer solution from the nitrateplus nitrite channel (Zhang 2000). Fig. 6 shows the verticalprofiles of nitrate, nitrite, phosphate, and Chl a at three sta-tions in an anticyclonic eddy located near Bermuda in July2005. Station 62 (30°54′N, 66°17′W) was located at the centerof the eddy as revealed from the XBT survey and satelliteimage and station 79 (30°43′N, 60°42′W) was the eddy center6 d later. Station 80 (30°49′N, 66°18′W) was close to the eddycenter (station 79) but with high fluorescence (Chl a). Ourresults confirm the previous hypothesis of a nitracline shal-lower than the phosphacline in the Sargasso Sea (Steinberg etal. 2001). A well developed nitrite maximum was alsoobserved in the water column. The concentrations of nitrate,nitrite, and phosphate in the euphotic zone were all below thedetection limits of previous measurements using a conven-tional auto analyzer (100 and 50 nM for N and P, Steinberg etal. 2001). Moreover, the depths of the nitracline, phospha-cline, and the nitrite maximum are well correlated with thedeep chlorophyll maximum (Fig. 7), suggesting the importantrole of nutrients on controlling the formation of the deepchlorophyll maximum (Li and Hansell 2008b).
In summary, we have described a shipboard deployable ana-lytical system for nitrate plus nitrite and phosphate mea-surements at nanomolar levels by coupling flow injection analy-sis with long-path spectrophotometry. Our results havedemonstrated the feasibility of this system for simultaneouslymonitoring surface nitrate plus nitrite and phosphate atnanomolar concentrations in both coastal and open-ocean envi-ronments. The system has been successfully applied to ship-board determinations of more than 1000 samples during two
Li et al. Monitoring of Nanomolar Nutrients
324
Fig. 5. Underway realtime survey of surface nitrate plus nitrite and phos-phate in the west Florida shelf system during April 27-28, 2004. Localtime was used. Cruise track for the survey is also presented (see text fordetails).
Fig. 6. Underway realtime survey of surface nitrate plus nitrite, phos-phate, and temperature in the Sargasso Sea near Bermuda on June 18,2004. Local time was used. Dashed line indicates the time when the posi-tion of the ship was at 31°15’N, 60°27’W (see text for details).

year’s field study in the North Atlantic. With this technique,nutrient dynamics and its relationships with biological produc-tivity in oligotrophic ocean systems can be investigated in detail.
For future application, this system may also be useful forfield (in situ) fertilization experiments or laboratory cultureswhere monitoring of nutrients over time is required. Futurework should also focus on modification and application ofthis system for longer time periods, such as weeks, which mayrequire additional configurations to achieve better perform-ance of the system, such as a stable baseline and reducedreagent consumption.
ReferencesAnagnostou, E., and R. M. Sherrell. 2008. A MAGIC method
for sub-nanomolar orthophosphate determination in fresh-water. Limnol. Oceanogr. Methods 6:64-74.
Benitez-Nelson, C. R. 2000. The biogeochemical cycling ofphosphorus in marine systems. Earth Sci. Rev. 51:109-135.
Bowie, A. R., E. P. Achterberg, P. N. Sedwick, S. Ussher, and P.J. Worsfold. 2002. Realtime monitoring of picomolar con-centrations of iron(II) in marine waters using automatedflow injection-chemiluminescence instrumentation. Envi-ron. Sci. Technol. 36:4600-4607.
Bris, N. L., P. M. Sarradin, D. Birot, and A. M. Alayse-Danet.2000. A new chemical analyzer for in situ measurement ofnitrate and total sulfide over hydrothermal vent biologicalcommunities. Mar. Chem. 72:1-15.
Cavender-Bares, K.K., D. M. Karl, and S. W. Chisholm. 2001.Nutrient gradients in the western North Atlantic Ocean:Relationship to microbial community structure and com-parison to patterns in the Pacific Ocean. Deep-Sea Res. I
48:2373-2395.Dallas, T., and P. K. Dasgupta. 2004. Light at the end of the
tunnel: recent analytical applications of liquid core wave-guides. Trends Anal. Chem. 23:385-392.
Daniel, A., D. Birot, S. Blain, P. Treguer, B. Leilde, and E.Menut. 1995. A submersible flow-injection analyzer for thein-situ determination of nitrite and nitrate in coastalwaters. Mar. Chem. 51:67-77.
Doney, S. C. 2004. Ocean carbon and climate change (OCCC):An implementation strategy for U.S. ocean carbon research.UCAR, Boulder, CO.
Falkowski, P. G., R. T. Barber, and V. Smetacek. 1998. Biogeo-chemical controls and feedback on ocean primary produc-tion. Science 281:200-206.
Fujiwara, K., L. Wei, H. Uchidoneyki, F. Shimokoshi, K. Fuwa,and K. Kobayashi. 1982. Determination of phosphorus atthe parts per trillion level by laser-induced thermal lensingcolorimetry. Anal. Chem. 54:2026-2029.
Garside, C. 1982. A chemiluminescent technique for thedetermination of nanomolar concentrations of nitrate andnitrite in seawater. Mar. Chem. 11:159-167.
Gimbert, L. J., P. M. Hayqarth, and P. J. Worsfold. 2007. Deter-mination of nanomolar concentrations of phosphate innatural waters using flow injection with a long path lengthliquid waveguide capillary cell and solid-state spectropho-tometric detection. Talanta 71(4):1624-1628
Gray, S., G. Hanrahan, I. McKelvie, A. Tappin, F. Tse, and P.Worsfold. 2006. Flow analysis techniques for spatial andtemporal measurement of nutrients in aquatic systems.Environ. Chem. 3:3-18.
Haberer, J. L., and J. A. Brandes. 2003. A high sensitivity, lowvolume HPLC method to determine soluble reactive phos-phate in freshwater and saltwater. Mar. Chem. 82:185-196.
Hansen, H. P., and F. Koroleff. 1999. Determination of nutri-ents, p. 159-228. In K. Grasshoff, K. Kremling, and M.Ehrhardt [eds.], Methods of seawater analysis, 3rd ed.Wiley-VCH.
Ito, K., Takayama, Y., Makabe, N., Mitsui, R., Hirokawa, T.,2005. Ion chromatography for determination of nitrite andnitrate in seawater using monolithic ODS columns. Journalof Chromatography A, 1083: 63-67.
Karl, D. M., and G. Tien. 1992. MAGIC: A sensitive and precisemethod for measuring dissolved phosphorus in aquaticenvironment. Limnol. Oceanogr. 37:105-116.
Kieber, R. J., and P. J. Seaton. 1995. Determination of sub-nanomolar concentrations of nitrite in natural waters.Anal. Chem. 67:3261-3264.
Lei, W., K. Fujiwara, and K. Fuwa. 1983. Determination ofphosphorus in natural waters by long-capillary-cell adsorp-tion spectrometry. Anal. Chem. 55:951-955.
Li, Q. P., J. Z. Zhang, F. J. Millero, and D. A. Hansell. 2005.Continuous colorimetric determination of trace ammo-nium in seawater with a long-path liquid waveguide capil-lary cell. Mar. Chem. 96:73-85.
Li et al. Monitoring of Nanomolar Nutrients
325
Fig. 7. Profiles of nitrate, nitrite, phosphate, and chlorophyll in the upper200 m during a Sargasso Sea cruise in the summer of 2005. Data from 3stations were presented here. Chl a data were collected using a continu-ous fluorescence sensor.

——— and D. A. Hansell. 2008a. Intercomparison and cou-pling of magnesium-induced co-precipitation and long-pathliquid-waveguide capillary cell techniques for trace analysisof phosphate in seawater. Anal. Chim. Acta 611:68-72.
——— and D. A. Hansell. 2008b. Nutrient distributions inbaroclinic eddies of the oligotrophic North Atlantic andinferred impacts on biology. Deep Sea Res. II 55:1291-1299.
Manrahan, G., S. Ussher, M. Cledhill, E. P. Achterberg, and P.J. Worsfold. 2002. High temporal and spatial resolutionenvironmental monitoring using flow injection with spec-troscopic detection. Trends Anal. Chem. 21:233-239.
Martin, J. H., and S. E. Fitzwater. 1988. Iron deficiency limitsphytoplankton growth in the north-east Pacific subarctic.Nature 331:341-343.
Masserini, R. T., and K. A. Fanning. 2000. A sensor package forthe simultaneous determination of nanomolar concentra-tions of nitrite, nitrate and ammonia in seawater by fluo-rescence detection. Mar. Chem. 68:323-333.
Moorcroft, M. J., J. Davis, and R. G. Compton. 2001. Thedetermination of nitrate and nitrite: a review. Talanta54:785-803.
Okemgbo, A. A., H. H. Hill, W. F. Siems, and S. Metcalf. 1999.Reverse polarity capillary zone electrophoretic analysis ofnitrate and nitrite in natural water samples. Anal. Chem.71:2725-2731.
Ormaza-Gonzalez, F. I., and P. J. Statham. 1991. Determinationof dissolved inorganic phosphorus in natural waters atnanomolar concentrations using a long capillary cell detec-tor. Anal. Chim. Acta 244:63-70.
Rimmelin, P., and T. Moutin. 2005. Re-examination of theMAGIC method to determine low orthophosphate concen-tration in seawater. Anal. Chim. Acta 548(1-2):174-182.
Sanudo-Wilhelmy, S. A., and others. 2001. Phosphorus limita-tion of nitrogen fixation by Trichodesmium in the centralAtlantic Ocean. Nature 411:66-69.
Steinberg, D. K., C. A. Carlson, N. R. Bates, R. J. Johnson, A. F.Michaels, and A. H. Knap. 2001. Overview of the U.S.JGOFS Bermuda Atlantic Time-series study: a decade-scalelook at ocean biology and biogeochemistry. Deep-Sea Res.II 48:1405-1447.
Sundareshwar, P. V., J. T. Morris, E. K. Koepfler, and B. Forn-walt. 2003. Phosphorus limitation of coastal ecosystemprocesses. Science 299:563-565.
Thouron, D., R. Vuillemin, X. Philippon, A. Lourenco, D.
Provost, A. Cruzado, and V. Garcon. 2003. An autonomousnutrient analyser for oceanic long-term in situ biogeo-chemical monitoring. Anal. Chem. 75:2601-2609.
Vink, S., and others. 2000. Automated high resolution deter-mination of the trace elements iron and aluminum in thesurface ocean using a towed Fish coupled to flow injectionanalysis. Deep-Sea Res. ΙΙ 47:1141-1156.
Wu, C. H., and J. Ruzicka. 2001. Micro sequential injection:environmental monitoring of nitrogen and phosphate inwater using Lab-on-Valve system furnished with a micro-column. Analyst 126:1947-1952.
Wu, J. F., J. F. Wu, W. Sunda, E. A. Boyle, and D. M. Karl. 2000.Phosphate depletion in the western North Atlantic Ocean.Science 289:759-762.
Yao, W., R. H. Byrne, and R. D. Waterbury. 1998. Determina-tion of nanomolar concentrations of nitrate, nitrite in nat-ural waters using long path length
Yaqoob, M., A. Nabi, and P. J. Worsfold. 2004. Determinationof nanomolar concentrations of phosphate in freshwatersusing flow injection with luminol chemiluminescencedetection. Anal. Chim. Acta 510:213-218
Zhang, J. Z., C. J. Fischer, and P.B. Ortner. 1999. Optimizationof performance and minimization of silicate interference incontinuous flow phosphate analysis. Talanta 49:293-304
———. 2000. Shipboard automated determination of traceconcentrations of nitrate and nitrite in oligotrophic waterby gas segmented continuous flow analysis with a liquidwaveguide capillary flow cell. Deep-Sea Res. I 47:1157-1171.
———, C. J. Fisher, and P. B. Ortner. 2001. Continuous flowanalysis of phosphate in natural waters using hydrazine asa reductant. Int. J. Environ. Anal. Chem. 80:61-73.
——— and J. Chi. 2002. Automated analysis of nanomolarconcentrations of phosphate in natural waters with liquidwaveguide. Environ. Sci. Technol. 36:1048-1053.
———. 2006. Enhanced sensitivity in flow injection analysisusing a long path-length liquid waveguide capillary flowcell for spectrophotometric detection. Anal. Sci. 22:57-60.
Zui, O. V., and J. W. Birks. 2000. Trace analysis of phosphorusin water by sorption preconcentration and luminal chemi-luminescence. Anal. Chem. 72:1699-1703.
Submitted 11 October 2007Revised 15 May 2008Accepted 4 June 2008
Li et al. Monitoring of Nanomolar Nutrients
326