limits of the seismogenic zone in the epicentral … limits of the seismogenic zone in the...
TRANSCRIPT

Limits of the seismogenic zone in the epicentral region of
the 26 December 2004 great Sumatra-Andaman
earthquake: Results from seismic refraction and
wide-angle reflection surveys and thermal modeling
Frauke Klingelhoefer, Marc-Andre Gutscher, S. Ladage, J.-X. Dessa, David
Graindorge, D. Franke, Camille Andre, Haryadi Permana, T. Yudistira, Ajay
Chauhan
To cite this version:
Frauke Klingelhoefer, Marc-Andre Gutscher, S. Ladage, J.-X. Dessa, David Graindorge, et al..Limits of the seismogenic zone in the epicentral region of the 26 December 2004 great Sumatra-Andaman earthquake: Results from seismic refraction and wide-angle reflection surveys andthermal modeling. Journal of Geophysical Research : Solid Earth, American GeophysicalUnion, 2010, 115, pp.B01304. <10.1029/2009JB006569>. <insu-00452634>
HAL Id: insu-00452634
https://hal-insu.archives-ouvertes.fr/insu-00452634
Submitted on 8 Feb 2010
HAL is a multi-disciplinary open accessarchive for the deposit and dissemination of sci-entific research documents, whether they are pub-lished or not. The documents may come fromteaching and research institutions in France orabroad, or from public or private research centers.
L’archive ouverte pluridisciplinaire HAL, estdestinee au depot et a la diffusion de documentsscientifiques de niveau recherche, publies ou non,emanant des etablissements d’enseignement et derecherche francais ou etrangers, des laboratoirespublics ou prives.

The limits of the seismogenic zone in the epicentral region of the 26 Dec. 2004
Great SumatraAndaman earthquake: results from a seismic refraction and
wideangle reflection surveys and thermal modeling
Klingelhoefer, F., Gutscher, M.A., Ladage, S., Dessa, J.X., Graindorge, D., Franke, D.,
André, C., Permana, H., Yudistira, T., Chauhan, A.
Abstract
The 26th December 2004 Sumatra earthquake (Mw=9.1) initiated around 30 km depth
and ruptured 1300 km of the IndoAustralian/Sunda plate boundary. During the SumatraOBS
survey a wideangle seismic profile was acquired across the epicentral region. A seismic
velocity model was obtained from combined travel time tomography and forward modeling.
Together with reflection seismic data from the SeaCause II cruise the deep structure of the
source region of the great earthquake is revealed. Four to five km of sediments overlie the
oceanic crust at the trench and the subducting slab can be imaged down to a depth of 35 km.
We find a crystalline backstop 120 km from the trench axis, below the forearc basin. A high
velocity zone at the lower landward limit of the raycovered domain, at 22 km depth, marks a
shallow continental Moho, 170 km from the trench.
The deep structure obtained from the seismic data was used to construct a thermal
model of the forearc in order to predict the limits of the seismogenic zone along the plate
boundary fault. Assuming 100150° C as its updip limit, the seismogenic zone is predicted to
begin 530 km from the trench. The downdip limit of the 2004 rupture as inferred from
aftershocks is within the 350450° C temperature range, but this limit is 210250 km from the
trench axis and is much deeper than the forearc Moho. The deeper part of the rupture occurred
along the contact between the mantle wedge and downgoing plate.
1 Introduction
Subduction megathrusts produce by far the largest earthquakes on earth (Ruff and
Kanamori, 1972; Stein and Okal, 2005). These large ruptures also cause significant vertical
motions that can generate devastating tsunamis (Savage, 1983; Satake, 1993; Johnson et al.,
1996; Fuji and Satake, 2007). Together these phenomena pose a substantial threat to
1
5
10
15
20
25

populations and infrastructure located in coastal regions, such as most of the Pacific rim. The
surface area of the earthquake fault plane, together with the amount of slip, controls the
magnitude of the earthquake (Wells and Coppersmith, 1994). The portion of the fault plane,
which ruptures, is said to be “seismogenic” and is bounded by an updip and a downdip limit
(Tichelaar and Ruff, 1993; Oleskevich et al., 1999). The position of the updip limit exerts a
strong control on tsunami generation and the location of the downdip limit which commonly
lies close to the coast, influences the intensity of ground shaking here. Therefore, it is of
critical importance for the estimation and mitigation of these natural hazards to have reliable
estimates of these updip and downdip limits. However, there is still no consensus on the
physical processes which control these limits, and thus large uncertainties still exist for most
zones which have not experienced a great earthquake in recent times, e.g. Cascadia (Hyndman
and Wang, 1995; Khazaradze et al., 1999; Stanley and Villasenor, 2000). This work focuses
on the SE end of the rupture zone of the great SumatraAndaman earthquake of 26 Dec. 2004,
where the event initiated. We present new deeppenetration seismic data to constrain the
geometry and structure of the crust and upper mantle. Additionally, numerical modeling of
forearc thermal structure is performed in order to calculate the thermally expected limits of
the seismogenic zone. These results are compared to the observed distribution of aftershocks
and to published sourcerupture models in order to determine where the earthquake rupture
initiated. The implications for the control of seismogenic rupture by the lithologies and
temperatures along the plate contact are discussed.
1.1 The NW Sumatra margin and the M9.3 2004 earthquake
One of the first deep seismic studies on the Sumatran subduction zone consisted of a
two ship survey in 1966/67 (Curray et al., 1977). Their preferred interpretation of a profile off
central Java shows minor thickening of the oceanic crust at the trench and slightly seawards
which they propose to be caused by faulting. Later studies were carried out by Kiekhefer, et
al., 1980 using free floating sonobuoys, airguns and explosives on 5 marginparallel lines
located offshore Nias and in the Nias basin. Based on the analysis of this dataset they propose
a shallow Moho depth beneath the continental crust of only about 20 km along this segment
of the Sumatra forearc.
2
30
35
40
45
50
55

During the SUMENTA I and II cruises in 1992 over 5000 km of 6 channel seismic
data were acquired offshore Sumatra (Izart et al., 1994), which helped to constrain the
existence of the Mentawai microplate formed by partitioning of the oblique convergence of
the subduction and strikeslip deformation of the upper plate (Malod and Kemal, 1996).
More recent multichannel and wideangle reflection seismic studies of the SESumatra
to Java portion of the Sunda margin were carried during the GINCO project with the German
research vessel Sonne in 1998 and 1999. Based on these data two main phases of forearc
basin and accretionary prism evolution were identified (Schlüter et al, 2002). Analysis of the
wideangle data provided images of the subducting plate to a depth of 20 km and additionally
the crustal structure was modeled to a depth of 30 km using gravity data (Kopp et al., 2001).
Their preferred model includes a shallow Moho at only 15 km depth beneath the Java margin
(Kopp et al., 2002).
The 26th December 2004 earthquake (Mw = 9.19.3) is among the four largest
earthquakes ever recorded and the largest of the last 40 years (Lay et al., 2005; Stein and
Okal, 2005). The earthquake initiated off the NW Sumatra margin in the vicinity of Simeulue
Island, and ruptured northwards past the Nicobar and Andaman islands, along 1300 km of the
IndoAustralian/Sunda plate boundary (Lay et al., 2005). Source time studies (Ammon et al.
2005) as well as geodetic (Vigny et al., 2005) and tsunami inversions (Fuji and Satake, 2007),
indicate that the rupture zone was widest (up to 200 km), coseismic slip was largest (locally
over 20m) and thus seismic moment release was greatest, in the region directly west of the
NW tip of Sumatra, near Banda Aceh (Figure 1).
Several marine geophysical surveys were conducted after the earthquake on the
Sumatran margin. During the first cruise onboard the British military vessel HMS Scott
multibeam bathymetry data were acquired on the southern part of the 2004 earthquake rupture
zone (Henstock et al., 2006). From February March 2005 a Japanese oceanbottom
seismometer array was deployed to record the numerous aftershocks of the earthquake. The
authors proposed the existence of two splay faults from the distribution of the earthquakes
(Araki et al., 2006). During the French Aftershocks cruise, 20 OBS's were deployed in the
region of largest slip offshore northwest of Sumatra. Examination of these data revealed the
existence of two postseismic active thrust faults and two other thrust faults, which were not
postseismically active (Sibuet et al., 2007). On the basis of the multibeam bathymetry data
3
60
65
70
75
80
85

of the French and British cruises, it was proposed that the upper plate deformation is strongly
influenced by the structure of the lower plate, which is characterized by NorthSouth trending
lineaments from the fossil Wharton spreading center (Graindorge et al., 2008).
Joint modeling of wideangle and reflection seismic data from four profiles located
offshore Simeulue acquired by the R/V Sonne in 2006 shows a significant deepening of the
top of the oceanic crust towards the SE (Franke et al., 2008). The authors interpret, that a
ridge currently undergoing subduction in this region is responsible for the segmentation of the
margin.
The SumatraOBS geophysical survey was conducted in July/Aug. 2006 onboard the
R/V Marion Dufresne in this area. The objective was to determine the crustal structure in the
epicentral region offshore NW Sumatra and in the zone of maximum coseismic
displacement, some 300 km northward. We report here on the results of wideangle seismic
modeling of Profile SumatraAB, a transect across the epicentral region of the 26 Dec. 2004
earthquake where the rupture initiated (Figure 2). Initial results from this survey are also
reported by (Dessa et al., 2009). Further results from interpretation of reflection seismic
profiles from a complementary cruise have been published recently (Singh et al., 2008). The
authors interpret some deep reflections west of Simeulue Island as representing broken slices
of oceanic crust, related to an oceanic mantle megathrust. They propose, that very strong
coupling, appropriate for brittle failure of mantle rocks, accounts for the occurrence of the
tsunamogenic event. Modeling of wideangle and reflection seismic data on a profile north of
Sumatra shows the presence of an active backthrust that is imaged down to at least 15 km
depth and reaches the surface near the western edge of the Aceh forearc basin (Chauhan et al.,
submitted to Geophys. J. Int.) The authors suggest that coseismic slip along the forearc
backthrust boundary might provide an explanation for the generation of the tsunami.
Modeling was performed in combination with the prestack depth migration of multi
channel seismic data from the R/V Sonne cruise located close to the SumatraAB profile.
Modeling of the limits of the seismogenic zone was performed using a geometry taken from
both the multichannel and wideangle seismic data.
4
90
95
100
105
110
115

1.2 The limits of the seismogenic zone
Several decades of research have been devoted to understanding how the physical and
mechanical properties of the rocks vary along the plate boundary fault plane and thus to try to
answer the question “why are earthquakes generated here?” (Byrne et al., 1988; Tichelaar and
Ruff, 1993; Pacheco et al., 1993 Oleskevich et al., 1999). A comprehensive review of current
knowledge on the limits of the seismogenic zone is given by Hyndman (2007). It has been
suggested that the uppermost portion of the plate boundary, below the accretionary wedge
behaves aseismically primarily due to the presence of high porosity, fluid rich sediments
(Byrne et al., 1988). Whereas some margins have no accretionary wedge, in all cases it seems
likely that the weakening effects of high fluid pressure within sediments along the plate
interface can have an impact on seismogenesis (Hubbert and Rubey, 1959; Davis et al., 1983;
Byrne and Fisher, 1990; Moore, et al., 1995; Saffer and Beakins, 2002). Other studies on the
updip limit proposed a possible control due to the rheological behavior of clay minerals and
sediments as these undergo lowgrade metamorphic reactions and diagenesis. In particular the
opal to quartz and smectite to illite and chlorite transitions occur primarily over a temperature
range of 100150°C with the higher grade minerals exhibiting a stickslip rheology consistent
with seismogenic behavior (Vrolijk, 1990; Moore and Saffer, 2001). However, recent
laboratory studies are inconsistent at least for the experimental range of conditions tested,
with the smectite illite transition being the sole control on the updip limit of the seismogenic
zone (Marone and Saffer, 2007).
There is also discussion on the mechanisms controlling the downdip limit. The two
propositions are a thermal control due to the transition to dislocation creep at high
temperatures (Scholz, 1990; Hyndman and Wang, 1993) or alternatively, that the presence of
a highly serpentinized mantle wedge, which permits aseismic sliding, may define the downdip
limit of seismogenic behavior (Hyndman et al., 1997). A global analysis of subduction
megathrust earthquakes indicates that on average, the downdip limit occurs at a depth of 40 ±
5 km (Tichelaar and Ruff, 1993) though some subduction zones may have shallower downdip
limits of about 2030 km, such as Mexico (Currie et al., 2002) and Cascadia (Hyndman and
Wang, 1995; Gutscher and Peacock, 2003). This depth range could potentially correspond to
either a thermal control or to a serpentinized mantle wedge, depending on the geometry and
lithology of the margin in question.
5
120
125
130
135
140
145

For most well studied margins (SW Japan, Cascadia, Chile, Mexico, Alaska), there
seems to be a fairly good agreement between the thermally predicted updip and downdip
limits, and these limits as obtained from other methods (e.g. sourcetime studies, aftershock
studies, geodetic studies, tsunami modeling) (Hyndman et al., 1995; Hyndman and Wang,
1995; Oleskevich et al., 1999; Currie et al., 2002; Gutscher and Peacock, 2003) (Figure 3).
Thus, thermal modeling appears to be a very useful method for determining the position of
both the updip and downdip limit.
2 Multichannel seismic reflection data
During a multichannel seismic (MCS) survey with the German R/V Sonne in
January/February 2006 a comprehensive dataset of 5358 line kilometers was acquired
coincident with gravity and magnetics in Indonesian waters over the southern part of the 2004
and the 2005 rupture zones. We used a 240 channel, 3 km streamer, and a tuned airgun array
consisting of 16 airguns with a total capacity of 50.8 liters. Record length was 14 s with a
sample interval of 2 milliseconds.
Processing of the two MCS lines BGR06115 and BGR06141 was performed up to
full Kirchhoff prestack depth migration and included the production and correction via MVA
(migration velocity analysis) of a depth velocity model. After testing various combinations of
processing parameters the following sequence was regarded as optimal. Prestack processing
included geometry editing, deconvolution, true amplitude recovery, and time and space
variant signal filtering. Reduction of waterbottom multiples was achieved by applying a
parabolic radon filter and inner trace mutes. Stacking velocities, at an average distance
interval of 3 km, were determined for the reference poststack time migrated sections. The
initial depth model was derived by combining the velocity field from the smoothed stacking
velocities (upper section) with the wideangle/refraction seismic data from the Profile AB
located close to these profiles along the lines BGR06115 & BGR06141 for the lower
section. Particularly the upper parts of the velocity fields were iteratively improved via MVA
until the migrated CRP gathers were flat. Quality control included a detailed evaluation of
congruence between the poststack migrated sections and the timeconverted prestack depth
migrated sections.
6
150
155
160
165
170
175

The MCS data were used to constrain the shallow crustal structure in the trench region
and the frontal portion of the accretionary wedge. Profile BGR06115 images the thick
undeformed sedimentary section (3 s TWT) at the trench and the accretionary wedge (Figure
4). The major reflectors observed were used on the one hand to help construct the pwave
velocity model based on the OBS data. For the thermal modeling described below it was also
particularly important to obtain the position of the deformation front, the sediment thickness
above the decollement and the geometry (depth and dip) of the decollement fault plane, which
represents the plate boundary fault.
3 Wideangle seismic data
Wideangle seismic data were processed using a tomographic approach to obtain an
independent velocity model (Zelt and Barton, 1998), followed by forward modeling in order
to incorporate secondary arrivals and the main reflectors from the reflection seismic data (Zelt
and Smith, 1992). Error analysis included calculation of synthetic seismograms, in order to
constrain velocity gradients, and gravity modeling.
3.1 OBS data acquisition and quality
During the SumatraOBS cruise (R/V Marion Dufresne, JulyAug. 2006) 56 ocean
bottom seismometers from the British OBIC pool, the French INSU pool, the University of
Brest and Ifremer were deployed along the abovementioned SWNE oriented SumatraAB
profile just north of Simeulue Island, in the epicentral area (Figure 2). The profile is 252 km
long, resulting in a 4.6 km instrument spacing. All instruments were successfully recovered.
A total of 2090 shots were fired on the profile by a 8260 in3 airgun array tuned to single
bubble mode to enhance the low frequencies and allow deep penetration (Avedik et al., 1993).
Preprocessing of the OBS data included calculation of the clockdrift corrections to adjust the
clock in each instrument to the GPS base time. Instrument locations were corrected for drift
from the deployment position during their descent to the seafloor using the direct water wave
arrival. The drift of the instruments never exceeded 100 m. Picking of the onset of first and
secondary arrivals was performed semiautomatic with a manual quality control and without
filtering where possible.
7
180
185
190
195
200

Data quality along the profile is generally good on all channels, although some
instruments show bands of noise on their geophone probably due to currents. Instruments
deployed without a trailing buoy displayed lower noise levels. The OBS's located on oceanic
crust show very good data quality (Figure 5) with clear arrivals from the sedimentary layers,
crust and upper mantle. Towards the toe of the accretionary prism, the OBS data sections
show an increasing amount of sedimentary arrivals (Figure 6). On the accretionary wedge the
data sections are highly asymmetric and display long and partly disturbed sedimentary
arrivals (Figure 7). Those instruments located in the forearc basin are mostly characterized by
clear sedimentary as well as reflections from the base of the top and base of oceanic crust.
Data sections from the most landward OBS's on the profile allow us to identify reflected
arrivals from the base of the continental crust as well as the base of the oceanic crust that
subducts below (Figure 8).
3.2 Tomographic inversion
The tomographic inversion code FAST (Zelt and Barton, 1998) was used to constrain
a velocity distribution that was used as an initial guideline to the forward modeling, described
hereafter. This code uses a regularized inversion in which user can specify parameters for the
travel time misfit and model roughness of the final solution. The method is linearized in that a
starting model and iterative convergence scheme are employed. Nonlinearity is accounted for
by calculating new ray paths for each iteration. The method generates smooth models, which
do not resolve sharp boundaries but steeper velocity gradients instead. The most important
structural features are thus resolved in an objective manner, i.e., not useroriented. Similar
tomographic inversion methods have been used in previous studies to constrain the crustal and
upper mantle velocities in subduction zones (eg. Graindorge et al., 2003; Dessa et al., 2004;
Ramachandran et al, 2006; Gailler et al., 2007) .
In order to perform this tomographic inversion of the first arrivals, 33 127 traveltimes
have been picked in the complete data set. Each pick has been assigned a picking error
between 20 ms and 150 ms depending on the data quality. The tomographic model used a
grid of 320 km x 40 km with a 1 km grid cell size (Figure 9). For the final model run, 5
different smoothing weights were tested in 10 nonlinear iterative steps. The final model
predicts a mean traveltime misfit of 156 ms. 97 % of all picks were traced in the model.
8
205
210
215
220
225
230
3.3 Forward raytracing modelling
To be able to include reflections from the oceanic and continental crust into the
modeling process, we converted the tomographic model into a forward raytracing model
using the RAYINVR software (Zelt and Smith, 1992) (Figure 10). The number of picks used
for the forward modeling was 36322, about 3200 picks higher than the tomographic model.
Sedimentary layers were taken from isovelocity contours of the inversion model and from
reflection seismic data of the region of the model. Crustal layers and the Moho were modeled
using phases generated by diving waves and deep reflected phases. This was done in
accordance with the tomographic model. For the model parametrization, we used the
minimumparameter/minimum structure approach, to avoid inclusion of velocity or structural
features into the model unconstrained by the data (Zelt 1999). Velocity gradients and phase
identification in the velocity model were further constrained by synthetic seismogram
modeling using the finite difference modeling code from the Seismic Unix package (Cohen
and Stockwell, 2003; Stockwell, 1999) (Figure 5b, 6b, 7b, 8b).
3.4 Error analysis
In order to constrain the dependency of the final tomographic model on the initial
model and especially the robustness of the high velocity zone interpreted to be the mantle
wedge, which is located at the boundary of the model, different model runs were conducted
using different initial models. A variety of simple initial models where selected and the
inversion performed (Figure 11). The resulting models are characterized by a lower fit of the
data. Nevertheless the high velocity anomaly is found in all resulting models, even though the
exact location and amplitude do vary. One test run with high velocities at unrealistically low
depths underneath the continental crusts produced a velocity anomaly more shallow (15 km
depth) than our preferred final model.
Twopoint raytracing between source and receiver (Figure 12) shows the well
resolved and the unconstrained areas. Ray coverage for diving and reflected waves is
generally very good due to the excellent data quality and close instrument spacing (Figure 12
a and b). All sedimentary layers are well sampled by reflected and turning rays in the model.
The crustal layers are well sampled except for the oceanic crust of the subducted slab at depth
larger than 30 km. The oceanic Moho at depth greater than 30 km, the continental Moho and
9
235
240
245
250
255
260

the mantle wedge geometry are mainly constrained by reflected arrivals, which generally
produce higher amplitude arrivals than diving waves from layers of low seismic velocity
gradients such as the upper mantle. The Moho has been additionally constrained by gravity
modeling at the ends of the profiles. The fit between predicted arrival times and traveltime
picks provides information about the quality of the model (Figure 12). The corresponding
misfit is 0.125 s using 95% of the picks.
Construction of a tomographic model as well as a forward raytracing model allows us
on the one hand to include additional information from the reflected phases and the multi
channel data into the model and on the other hand to verify that all structures from the
forward model are required to fit the data. These models are therefore complementary and
help to support our conclusions.
As the correct identification of velocity anomalies and the degree of resolution of the
model are of fundamental interest to the conclusions of the work, additional calculations of
the velocity resolution and depth uncertainty have been performed. The quality of the
velocities in the model can be gauged from the resolution parameter (see Figure 13).
Resolution is a measure of the number of rays passing through a region of the model
constrained by a particular velocity node and is therefore dependent on the node spacing (Zelt,
1999). If a layer can be modeled with one single velocity gradient the resolution parameter
will be high even in areas which have lower ray coverage as the area is related to only one
velocity node. Nodes with values greater than 0.5 are considered well resolved (Figure 13).
In order to estimate the velocity and depth uncertainty of the final velocity model a
perturbation analysis was performed. The depths of key interfaces were varied and an Ftest
was applied to determine if a significant change between models could be detected. The 95%
confidence limit gives an estimate of the depth uncertainty of the interface (Figure 13). The
sedimentary and crustal layers are well constrained throughout the model. The velocities in
the mantle wedge show a resolution of between 0.30.7 due to the missing information from
turning rays in this layer. The upper mantle velocities are wellconstrained. At greater depth
the velocities are less constrained due to fewer rays penetrating into this deeper portion of the
model. The depth of the main depth interfaces is constrained to a depth error of about + 1
km.
10
265
270
275
280
285
290
In order to constrain the velocity gradients of the different layers, synthetic
seismograms were calculated and compared to the data sections. The finite difference
modeling code from the Seismic Unix package (Cohen and Stockwell, 2003; Stockwell, 1999)
was used to calculate synthetic seismograms of a record length of 30 s at a 100 m spacing
(Figure 5b, 6b, 7b, 8b). The program uses the explicit second order differencing method for
modeling the acoustic wave equation. The input velocity model was calculated from sampling
the forward velocity model at a lateral 50 m interval and 10 m interval in depth. In order to
avoid grid dispersion, the peak frequency of the Ricker wavelet source signal is calculated to
be equal to the lowest velocity of the medium divided by the grid points per wavelength
multiplied by 10. In this case the source wavelet is centered at 8 Hz, similar to the signal from
the airgun array used during the cruise. The boundary conditions were set to be absorbing at
the sides and bottom of the model and free at the surface. Detailed raycoverage, traveltime
fit and synthetic data provide additional information of the identification of the picked phases
(Figure 14 and 15).
3.5 Gravity modeling
Since seismic velocities and densities are wellcorrelated, gravity modeling provides
an important additional constraint on the seismic model. Areas unconstrained by the seismic
data can be modeled by comparing calculated gravity anomalies with those observed.
The gravity data were forward modeled using the gravity module of the software of
Zelt and Smith (1992). Average Pwave velocities for each layer of the seismic models were
converted to densities in good agreement with different velocity density relationships from
laboratory measurements (Ludwig, Nafe and Drake (1970), Carlson and Herrick, 1990,
Hughes et al., 1998 and Hamilton et al., 1978) for the sedimentary layers and the relationship
of Christensen and Mooney (1995) for crustal layers (Figure 16). Layers from the velocity
modeling have only been subdivided where necessary and strong lateral velocity gradients are
present. The upper mantle densities were set to a constant 3.32 g/cm3. To optimize the fit of
the final gravity model (Figure 17) the densities of each layer were subsequently manually
varied within an error bound of 0.25 km/s from their original value. This deviation is
considered a realistic uncertainty of empirical relationships used for the velocitydensity
conversion. To avoid edge effects both models were extended by 100 km at both ends and
11
295
300
305
310
315
320
down to a depth of 95 km. The calculated anomalies can be compared with the shipboard
measured gravity anomaly (Figure 17). The predicted anomalies generally fit the observed
data well. The largest misfit is observed at around 240 km model distance and might be
caused by threedimensional effects of the basement topography.
For comparison we have calculated two additional models, in which the mantle wedge
is replaced by either continental crustal material, with a density of 2.83 kg/m3 or normal upper
mantle material characterized by a density of 3.32 kg/m3 (Figure 17). Neither of the two
alternative models shows a fit as satisfactory as our preferred model with a density of 3.1 kg/
m3
4 Numerical modeling of the Sumatra forearc thermal structure
We applied finiteelement modeling of forearc thermal structure in order to determine
the temperature distribution along the plate interface and to predict the updip and downdip
limits of the seismogenic zone. This approach is based on models, which consider temperature
(together with lithology) as one of the primary controls of stickslip rheological behavior that
lead to earthquake rupture (Hyndman and Wang, 1993; Hyndman et al., 1997; Peacock and
Wang, 1999; Gutscher and Peacock, 2003) (Figure 2). The geometry of the subducting
oceanic crust and the upper plate (down to 2030 km depth) is constrained primarily by the
OBS data presented above. The total sedimentary thickness of 5 km at the trench and a
decollement at 4 km depth are taken from published seismic reflection data (Karig et al.,
1980; Singh et al., 2008) and the BGR seismic data presented here (Franke, et al, 2008) (Fig.
4). The deeper geometry is obtained from the distribution of WadatiBenioff zone
hypocenters. The global relocated hypocenter catalog (Jan. 1964 Dec. 1995) was used
together with 3 additional years of data available online (Engdahl et al., 1998). Additionally
data from relocated aftershocks were taken to help constrain the plate interface in the 3050
km depth range (Engdahl et al., 2007). Together, these data are used to construct the 2D
finite element grid.
We used finite element (FE) software developed by Kelin Wang (Wang et al., 1995).
The 500 km long FEmodels consists of 936 quadrilateral elements, with a total of 2933
nodes. The models include the effects of radiogenic heating in the crust, shear heating along
the subduction interface (to a distance of 240 km from the trench) for an effective shear stress
12
325
330
335
340
345
350

of 10 MPa, and viscous corner flow in the mantle wedge. Thermal conductivity in the mantle
and oceanic crust is 3.138 W/mK consistent with the GDH1 model (Stein and Stein, 1992)
and thermal conductivity in the continental crust is 2.5 W/mK (Peacock and Wang, 1999).
Heat generation in the upper continental crust is 2.5 microWatt/m2 and in the lower
continental crust is 0.27 microWatt/m2. Models with lower radioactive heat generation (1.3
microWatt/m2) resulted in nearly the same thermal structure at depth (along the plate
interface), but predict a significantly lower surface heatflow than that observed in the arc and
backarc region. Thus, the higher value was selected in agreement with recent work (Hippchen
and Hyndman, 2008). The model geometry is shown in Figure 18.
The initial boundary conditions include: at the left side, oceanic lithosphere isotherms
for a subducting oceanic plate of the appropriate age based on the GDH1 thermal cooling
model (Stein and Stein, 1992), 0° C at the surface and an appropriate continental geotherm at
the right side boundary (representing the upper plate). The three primary input parameters to
the model are thus; the plate geometry, the age of the subducting lithosphere and the
subduction velocity.
The modeled transect is located on the NW Sumatra margin, in the epicentral region of
the 26 Dec. 2004 earthquake. The age of the subducting oceanic lithosphere is known from
magnetic anomaly studies (Mueller et al., 1997) and is approximately 60 Ma. At the northern
tip of Sumatra, the relative plate motion between the Australian plate and the Sunda block is 5
cm/yr in a N8°E azimuth and the motion between the Indian plate and the Sunda block is
4cm/yr in a N20°E direction (Vigny et al., 2005). The component of plate motion
perpendicular to the margin thus yields an orthogonal subduction velocity of 3cm/yr, which
was used as the preferred velocity for the thermal modeling.
4.1 Comparison of observed and calculated heat flow
Heat flow data are available in the study area from several different sources. Older
marine and terrestrial heat flow values were obtained from the Global Heat Flow Database (
http://www.heatflow.und.edu ). Marine heat flow data were acquired during the Marion
Dufresne Aftershocks cruise (Sibuet, 2005) and are shown here. Two other heat flow studies
performed during the R/V Sonne cruise 189, one with insitu measurements, and one obtained
13
355
360
365
370
375
380
from BSR observations (calculated using gashydrate stability conditions) are also included
here (Delisle and Zeibig, 2007). The observed heat flow pattern (Figure 19, A) shows a fairly
high degree of scatter, but some general trends are discernable. In the undisturbed oceanic
domain, heat flow is about 60 mW/m2. Three lower heat flow values near the trench (3040
mW/m2) are likely due to the cooling effect of hydrothermal fluid circulation as observed in
other subduction zone environments (Grevemeyer et al., 2005, EPSL, 236, 238248). Here the
effect appears to be local and not representative of largescale lithospheric cooling as
described for the Central American trench (Harris and Wang, 2002), since the mean heat flow
in this region (from the oceanic crust to the toe of the wedge) is about 60 mW/m2, the value
expected for typical 60 Ma oceanic lithosphere. Heat flow in the fore arc generally declines to
values in the 4060 mW/m2, though there is wide scatter in the observed data, with some
measurements as high as 80 mW/m2. An increase in heat flow is observed in the arc and back
arc region to values of 8090 mW/m2, as reported for other back arcs (Currie and Hyndman,
2006).
The expected heat flow at the surface calculated using the thermal model presented
here is shown in Figure 19, A. The calculated 60mW/m2 at the trench is in fairly good
agreement with the observed data. A decline to about 40mW/m2 is predicted in the forearc,
followed by an increase to 80mW/m2 in the arc region. No data are available to check the
modeled heat flow predicted for the onland portion of the forearc.
4.2 Thermal structure and the seismogenic zone
The modeled thermal structure is presented in Figure 19 B. The OBS velocity model
as well as the hypocenters used to constrain the modeled geometry, are shown as well. On the
basis of the 100150°C isotherms, the updip limit is predicted to be very close to the trench
(within 530 km). This appears to be due to the insulating effect of the thick sedimentary
cover at the trench. The thermally predicted position of the updip limit is in good agreement
with the observation of numerous aftershocks with a shallow thrusting mechanism in this
zone (Fig. 14C) (Engdahl et al., 2007). These results are also in agreement with a recently
published thermal model of the NW Sumatra margin located roughly 100200 km further SE
(Hippchen and Hyndman, 2008) which also predicts an updip limit near the trench. Their
14
385
390
395
400
405
410
150°C isotherm is 34 km from the trench. For the range of models we tested, we obtained a
150°C isotherm 30±10 km from the trench. Our 350°C and 450°C isotherms, which are
considered to correspond to the downdip limit, are located 210 km and 250 km, respectively,
from the trench axis. The thermal model further SW (at the limit between the 2004 and 2005
earthquakes) predicts the location of the 350°C and 450°C isotherms at distances of 214 km
and 254 km, respectively (Hippchen and Hyndman, 2008), which is nearly identical to the
results we obtain. Aftershocks are observed near the shallow dipping plate boundary up to a
distance of 220 km from the trench (Engdahl et al., 2007), which is once again in good
agreement with the thermally predicted limits.
5 Discussion
Tomographic inversion and forward modeling of wideangle seismic data from a line
located close to the epicenter zone of the great earthquake of December 2004 allows imaging
of the accretionary prism and subducted slab to a depth of 35 km (Figure 9 and 10). The
accretionary prism shows sedimentary layers with a total thickness of 20 km. 4 km of
sediments overlie the oceanic crust at the trench, probably consisting of hemipelagic
sediments and trench fill. The seismic velocities of the deeper layers are up to 5.5 km/s high,
probably due to compaction and to some low to middlegrade metamorphic reactions.
Sedimentary velocities of the forward model are taken from isovelocity contours of the
tomographic model. They roughly correspond to lines of equal lithostatic pressure. As one
single sedimentary layer recognized in the MCS data might be characterized by lower
velocities where its position is shallow and higher velocities in regions where its position is
deeper, the velocity contours do not coincide exactly with the deep sedimentary layer
stratification imaged by the reflection seismic data. In the Simeulue forearc basin the iso
velocity contours show a pronounced depression, following in general the Neogene basin fill
geometry as described by Berglar et al (2008).
The oceanic crust imaged by the reflection or wideangle seismic data is only about 5
km thick (Franke et al. 2008; Singh et al., 2008; this paper) and substantially thinner than
“normal” oceanic crust, which is characterized by a thickness of 7.1 + 0.8 km (White et al.,
1992). Velocities range from 5.80 to 6.80 km/s at the trench to 6.20 6.60 km/s at 270 km
model distance. The oceanic Moho found from wideangle seismic modeling is located at the
15
415
420
425
430
435
440

lower boundary of a series of prominent, discontinous reflectors in the reflection seismic data.
Unusually thin oceanic crust is known to form at ultra slow spreading centers, where
serpentinized mantle material commonly outcrops at the sea floor (Jackson et al., 1982;
Muller et al., 1997; Jokat and SchmidtAursch, 2007). The oceanic crust currently subducting
beneath the NW Sumatra margin was formed around 5060 Ma at the Wharton spreading
center at a half spreading rate between 50 and 75 mm/a (Royer and Sandwell, 1989). Thus,
very slow spreading can be ruled out to have formed the thin oceanic crust. Alternatively the
thickness of the crust might be explained by an unusually low mantle potential temperature at
the spreading center leading to low degrees of partial melting in the mantle (Klein and
Langmuir, 1987).
The velocities in the oceanic upper mantle are reduced at model distances between 0
and 140 km, with values of 7.40 to 7.60 km/s (Figure 10). A similar reduction in upper mantle
velocities was observed offshore Costa Rica over the flexurally faulted portion of the oceanic
Cocos plate before it enters the Middle America trench and interpreted as being due to
serpentinization of the uppermost mantle (Grevemeyer et al., 2007) through faults generated
by the flexure and imaged on seismic reflection data (Ranero et al., 2003). The oceanic crust
at this location offshore Central America formed at the fast spreading East Pacific Rise and is
unusually thin (4.8 – 5.5 km thick) (Grevemeyer et al., 2007). These thicknesses are very
close to those obtained by modeling of the OBS profile off NW Sumatra presented here (Fig.
10) and are also observed by the MCS data (Fig. 4). It is likely that thin oceanic crust may be
fractured more readily and therefore may permit a higher degree of serpentinization in the
upper mantle than thick oceanic crust.
We find a strong reflection from a crustal unit at a distance starting 120 km (220 km
model distance) from the trench and extending landwards (Figure 15). This backstop is
characterized by a rough surface showing several blocks and velocities between 6.30 km/s at
its top and 6.80 km/s at its base. These velocities and the relatively low velocity gradient of
this layer can be characteristic of either igneous continental crust (Christensen and Mooney ,
1995) or highly metamorphosed sediments. The corresponding continental Moho is located at
a shallow depth of 22 km, similar to that proposed by Kiekhefer et al., 1980 from wideangle
seismic modeling of trench parallel profiles near Nias island and by Simoes et al., 2004 from
16
445
450
455
460
465
470

gravity modeling of a profile south of Nias island. Both of these studies are located in the
segment ruptured during the March 2005 earthquake.
An earlier study based solely on multichannel seismic data acquired by Western
Geco, draws the conclusion that the 26 Dec. 2004 earthquake ruptured along a shallow
dipping fault beneath the oceanic Moho (Singh et al., 2008). Both the Western Geco seismic
line and the seismic data presented in Figure 4 show clear evidence of folding and thrusting of
recently deposited trench fill sediments at the toe of the accretionary wedge. Several of these
thrust faults, showing both landward and seaward vergence, can be traced down to a
decollement level within the sediments, roughly 1 km above the oceanic basement. These
observations suggest that the vast majority of strain from relative plate motion is
accommodated here, along the decollement beneath the accretionary wedge and above the
downgoing oceanic crust, as observed in all subduction zones worldwide. Megathrust
earthquake rupture along this decollement and deep into the subfore arc mantle offers the
most coherent explanation for the 26 Dec. 2004 event.
The thermal model presented here predicts a seismogenic zone extending down to 40
km depth and a distance of 220 km from the trench. On the basis of the OBS velocity model,
this is well below the forearc crust (which has a thickness of about 20 km at a distance of 170
km from the trench). This structural peculiarity is ascertained by several pieces of evidence
and supporting elements: (i) the mantle velocity anomaly below the forearc that is shown to
be robust through several tomographic inversion runs starting from fairly different initial
models and also (ii) to be necessary to model reflections from the oceanic plate subducting
below (Fig. 14 and 15); (iii) the observation of reflected phases corresponding to this shallow
Moho that can be modeled as well (Dessa et al. 2009); (iv) the report of a similarly shallow
mantle anomaly on favorably oriented profiles in the Nias basin, some 350 km south of our
study zone (Kieckhefer et al. 1980).
Together with the seismic data on deep structure, the thermal modeling permits us to
assess the hypothesis that either temperatures of 350450°C or the subforearc Moho defines
the downdip limit of the seismogenic zone, whichever is shallower (Hyndman et al., 1997).
The seismic velocity model clearly indicates that the Moho is shallower than the observed
downdip extent of the seismogenic zone (as defined by aftershocks). This does not support the
17
475
480
485
490
495
500

hypothesis that the Moho is its downdip limit. Our results imply that a significant portion
(>50 km) of the rupture occurred along the interface between the oceanic crust of the
downgoing plate and the forearc mantle of the upper plate. This contradicts the conclusions
of a recent thermal modeling study, which suggested that the 30 km deep downdip limit was
controlled by the presence of a serpentinized mantle wedge beneath the continental Moho
(Hippchen and Hyndman, 2008). Indeed until now, the 1994 SanrikuOki earthquake was the
best documented example of a subduction earthquake which ruptured into the sub fore arc
upper mantle (Hino et al., 2000). Here, in the Northeast Japan subduction zone, a M7.7 event
occurred and the detailed aftershock distribution was obtained by deploying a network of
OBS on the seafloor. The aftershocks extended to 50 km depth and the upper plate Moho is
known from deep crustal seismic studies to be located at 20 km depth (Hino et al., 2000). A
recent review of the seismogenic zone around the Japanese Islands confirms this tendency
(deep, subMoho rupture) for the northern Honshu and Kanto portions of the Japan trench
(Seno, 2005). The recent Tokachioki M8 earthquake of 2003 offshore Hokaido also exhibited
very deep rupture (4055 km) (Machida et al., 2009).
Our thermal model also predicts a very shallow updip limit of the seismogenic zone
extending almost all the way to the trench and thus implies a very large downdip width of the
seismogenic zone (about 200 km). While the exact extent of the updip portion of the rupture
plane is difficult to determine precisely (Wang and He, 2008), the results obtained using
several different methods all agree that the southernmost portion of the 2004 rupture zone, off
NW Sumatra was the widest, about 200 km. These methods include source time studies of
fault slip along the plate boundary fault (Ammon et al., 2005), fault slip inversions using
geodetic data (Vigny et al., 2005) and tsunami inversions (Fujii and Satake, 2007). The great
downdip width of 200 km is in agreement with that predicted by our thermal modeling and
can partly explain the great contribution to seismic moment, due to the large surface area of
the fault plane.
6 Conclusions
18
505
510
515
520
525
530

Combined modeling of wideangle seismic and reflection seismic data of a profile located
close to the epicentral area of the great Sumatra earthquake reveals the crustal structure of the
subduction zone down to a depth of 35 km. The main structures imaged by this data set are:
1) 45 km of sediments overlying the oceanic crust at the trench, probably consisting of
older sediments and trench infill.
2) An anomalously thin oceanic crust about 5 km thick. Although most thin oceanic crust
forms at very slow spreading centers, the oceanic crust in this region formed around
5060 Ma ago at the Wharton spreading center at a fast spreading rate.
3) A backstop structure located about 120 km from the trench beneath the forearc basin
and characterized by seismic velocities and gradients characteristic of continental
crust.
4) A shallow continental Moho at only around 22 km depth, 170 km from the trench.
5) The hypocenter of the great 2004 earthquake is located at the interface between the
downgoing plate and the upper plate continental mantle, indicating that the mantle
wedge is not serpentinised to a degree sufficient to prevent earthquake nucleation.
Thermal modeling of the subduction zone was performed using the crustal structure from
the wide angle seismic data and the distribution of aftershocks. These results indicate:
1) The upper limit of the seismogenic zone (as defined by the 100150°C isotherms) is
located close to the trench (within 530 km). This is in good agreement with the
observation of numerous aftershocks with a shallow thrusting mechanism in this zone.
2) The 350°C and 450°C isotherms are located 210 km and 250 km, respectively, from
the trench axis. This corresponds to the landward limit of aftershocks along the fault
plane. This limit is about 50 km further landward and 18 km deeper than the sub
forearc Moho.
3) A significant portion (>50 km) of the rupture occurred along the interface between the
oceanic crust of the downgoing plate and the forearc mantle of the upper plate. Thus,
the downdip limit of seismogenic rupture off NW Sumatra is not controlled by the
subforearc Moho, but appears to be controlled by temperatures of 350450°C
isotherms, at which felsic rocks begin to deform by ductile flow.
19
535
540
545
550
555
560

Acknowledgments
Oceanographic work in Indonesia was made possible thanks to the strong implication
of LIPI (Indonesian Institute of Sciences) and BPPT (Agency For the Assessment and
Application Technology). French ANR (Agence National de Recherche) and INSU (Institut
National des Sciences de l'Univers) and Ifremer (Institut français de recherche pour
l'exploitation de la mer) contributed to the funding of the SUMATRAOBS cruise. We would
like to thank the IPEV (Institut PaulEmile Victor), for supporting this work. We thank the
chief operator H. Leau, the captain F. Duchênes and the crew of the R/V Marion Dufresne for
their professional work during the oceanographic expedition. We would also like to thank the
technical teams of the four OBS pools (INSU, Ifremer, University of Brest and OBIC) and the
Genavir technical team for their professional work during the deployment of ocean bottom
instruments and the airgun array. We also thank the master and crew operating RV SONNE
during MCS data acquisition. The German Ministry for Research and Education (BMBF)
supported the study (grants 03G0186A). The GMT (Wessel and Smith, 1995) and Seismic
Unix software package (Stockwell and Cohen, 1999) were used in the preparation of this
paper. We thank Bob Engdahl for providing his relocated teleseismic events in the Sumatra
region.
We thank Roy Hyndman and an anonymous reviewer and the associate editor Kelin Wang for
their exhaustive and highly detailed reviews and for the opportunity to improve the
manuscript accordingly.
Figure captions
Figure 1: General location map of Sumatra convergent margin. The rupture planes of the three
great earthquakes are shown, with the 3month aftershocks in each case; M9.3 26 Dec. 2004
(red/circles), M8.7 28 March 2005 (yellow/squares), M8.4 12 Sept. 2007 (green/triangles).
The stars show where ruptures initiated. Estimated rupture zones from previous great
earthquake sequence are shown as dashed lines (Lay et al., 2005). The location of the
geophysical transect investigated in this study is indicated by the black line.
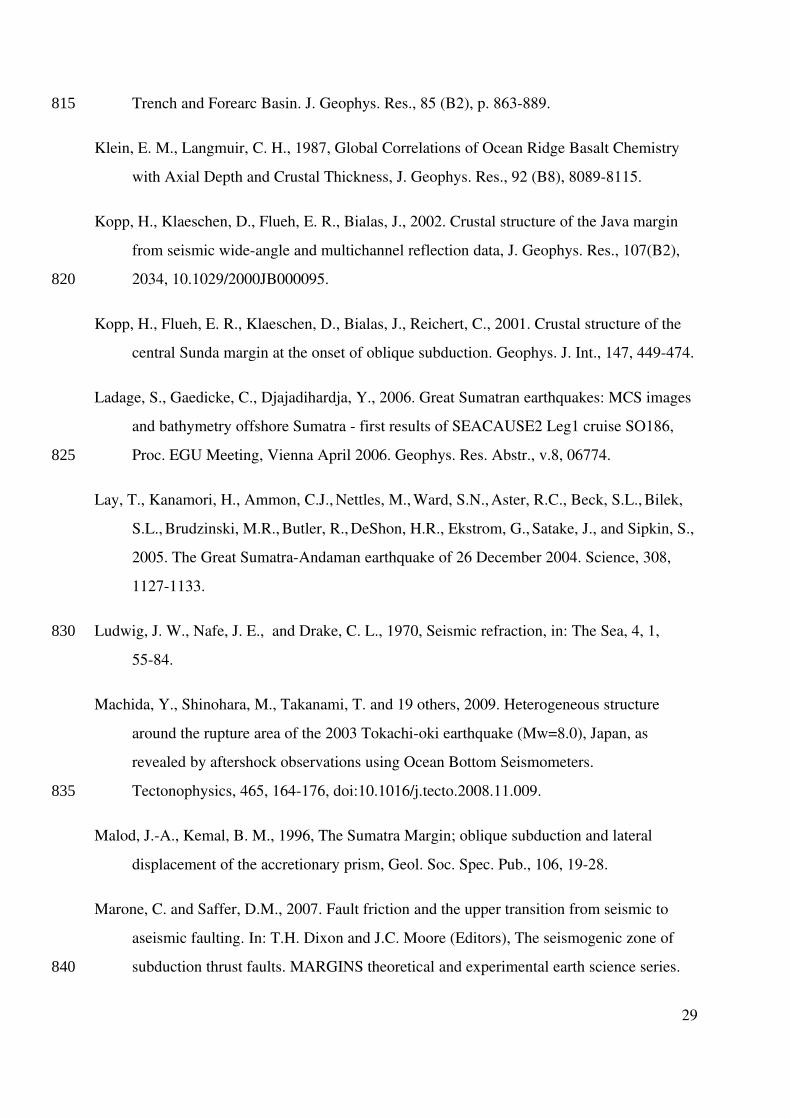
Figure 2: Seafloor bathymetry of the study region from Aftershocks and SumatraOBS
cruises. OBS are marked by red dots and MCS profiles by red lines. Shaded areas are not
covered by shipboard measured bathymetry and show predicted bathymetry from satellite
20
565
570
575
580
585
590

altimetry (Sandwell and Smith, 1995). Star marks location of the great Sumatra earthquake.
Figure 3: Schematic representation of a subduction zone showing the seismogenic zone where
stickslip behavior is believed to occur between the 150°C and 350°C isotherms. Note
transition zones exist (dashed) above the updip limit to around 100°C and below the downdip
limit to around 450°C (see text for further explanation).
Figure 4: Multichannel reflection seismic profiles from the BGR SEACAUSE II cruise in
2006. (A) Prestack depth migrated section of Profile BGR06115 (B) Prestack depth
migrated section of Profile BGR06141 (C) Profiles BGR06115 and BGR141 with layer
boundaries and velocities from the wideangle seismic modeling overlain.
Figure 5: (a) Bandpass filtered (35 Hz, 2436 Hz) vertical geophone data section from
OBS 05 located on oceanic crust. The data are displayed with a gain proportional to source
receiver offset and are reduced at a velocity of 8 km/s. PmP (reflection from the Moho), and
Pn (turning waves from the upper mantle) are annotated (b) Synthetic seismograms calculated
from the velocity model for the same station using the finitedifference modelling code from
the Seismic Unix package (Cohen, 2003; Stockwell, 1999). The synthetic seismograms are
calculated every 100 m with a source frequency centered around 5 Hz.
Figure 6: (a) Data from the vertical geophone data section from OBS 11 located on oceanic
crust close to the accretionary prism. The same gain, filter and scaling have been applied as in
Figure 4a. (b) Corresponding synthetic seismograms calculated from the model using the
same method as in Figure 4b.
Figure 7: (a) Data from the vertical geophone data section from OBS 34 located on the
accretionary prism. The same gain, filter and scaling have been applied as in Figure 4a. (b)
Corresponding synthetic seismograms calculated from the model using the same method as in
Figure 4b.
Figure 8: (a) Data from the vertical geophone data section from OBS 44 located the end of the
profile. The same gain, filter and scaling have been applied as in Figure 4a. (b) Corresponding
synthetic seismograms calculated from the model using the same method as in Figure 4b.
Figure 9: Result of the tomographic inversion of first arrivals. Overlain black lines represent
layer boundaries from forward modeling. Circles mark aftershock locations (Engdahl, 2007).
The hypocenter of the 2004 earthquake is projected onto the model and marked by a cross.
Figure 10: Final velocity models for the Profile including the model boundaries used during
21
595
600
605
610
615
620
625

inversion (solid lines) and isovelocity contours every 0.25 km/s. OBS locations are indicated
by red circles. Areas unconstrained by raytracing modelling are shaded. Vertical ex. 4.
Figure 11: Variation of the starting model. (A) initial model as used in this study (B) initial
model with a 5 km lower crustmantle boundary (C) initial model with a 5 km higher crust
mantle boundary (D) initial model with strong slope dipping towards the continent in the
crustmantle boundary (E) initial model with strong slope dipping towards the oceanic plate in
the crustmantle boundary (F) resulting velocity model from (A) leading to a ch2 = 9.8 (G)
resulting velocity model from (B) leading to a ch2 = 20.25 (H) resulting velocity model from
(C) leading to a ch2 = 11.5 (I) resulting velocity model from (D) leading to a ch2 = 14.7 (J)
resulting velocity model from (E) leading to a ch2 = 12.6.
Figure 1:Figure 12: (A) Upper panel: Ray coverage of diving waves with every fourtieth ray
from twopoint raytracing plotted. Lower panel: Observed traveltime picks and calculated
travel times (line) for the same phases for all receivers along the model. (B) Same as (a) but
for reflected phases.
Figure 13: Resolution parameter for depth nodes of the velocity model. Contour interval is
0.1. The depth uncertainty of the most important boundaries calculated from the 95 \%
confidence limit of the ftest given in the framed boxes.
Figure 14: (a) Raycoverage of OBS 26 in the model (b) travel time fit of the associated rays
(c) data section corresponding to the model (d) synthetic seismograms corresponding to he
model.
Figure 15: (a) Raycoverage of OBS 28 in the model (b) travel time fit of the associated rays
(c) data section corresponding to the model (d) synthetic seismograms corresponding to he
model.
Figure 16: Relationship between velocity and density from various publications. Inverted
triangles mark velocity and corresponding densities used for gravity modeling. Gray shaded
areas mark the error bounds of 0.25 km/s.
Figure 17: Results from gravity modeling. (A) Gravity model with densities used for
modelling in g/cm3 indicated by italic numbers. Positions of OBSs (circles) are indicated.
Black lines represent layer boundaries from seismic modelling. (B) Shipboard measured free
air gravity anomaly (black line). Predicted anomaly (dashed line) for our preferred model
marked by a dotted line, a model in which the mantle wedge has been replaced by continental
22
630
635
640
645
650
655

crust (2.83 kg/m3 marked by a broken line) and a model where the mantle wedge has been
replaced by normal mantle material (3.32 kg/m3, marked by solid line).
Figure 18: Finite element grid used for calculating forearc thermal structure. The three most
important factors controlling the thermal structure are the age of the subducting oceanic
lithosphere, the convergence velocity, and the geometry of the subduction zone. The model
includes radiometric heating in the crust, shear heating along the plate boundary and
convection in the asthenospheric wedge beneath the arc (using a Bachelor’s corner flow
solution).
Figure 19: Thermal model of the Sumatra subduction zone. (A) Location of the thermal
modeling profile (red line), earthquake hypocenters used to construct the model geometry
(colored circles), heat flux measurements (colored diamonds) and active volcanoes (triangles)
(B) Heat flux measurement (diamonds) and calculated heat flux from depth of a bottom
simulating reflector (BSR) (light blue zone) and calculated heat flow (black line) shown along
transect from thermal model shown in B. (C) Thermal structure along the transect (shown in
Fig. 1). The geometry is constrained by the reflection and wideangle seismic data in the
shallow portion (020 km depth) and by earthquake hypocenters (circles) in the deeper
portion. The thermally predicted seismogenic zone has a downdip width of roughly 200 km
(180 km taking only the 150°C and 350°C isotherms, 240 km when including the transition
zones to 100°C and 450°C). The gray shaded regions indicate the variation in the horizontal
(downdip) position of the 150°C, 350°C and 450°C isotherms for the range of models tested
(v = 2, 3 and 4 cm/yr and slab ages of 50, 60 and 80 Ma) and is thus a measure of uncertainty.
Note the 100°C isotherm shifts less than 2 km for all models tested. The updip limit extends
very close to the trench, beneath most of the accretionary wedge. The downdip portion
extends well into the forearc mantle of the upper plate. The thermally predicted limits are in
good agreement with the observed distribution of relocated aftershocks (black squares)
(Engdahl et al., 2007).
23
660
665
670
675
680

References :
Ammon, C.J., Ji, C., Thio, H.K., Robinson, D., Ni, S., Hjorleifsdottir, V., Kanamori, H., Lay,
T., Das, S., Helmberger, D., Ichinose, G., Polet, J., Wald, D., 2005. Rupture process of
the 2004 SumatraAndman earthquake. Science, 308, 11331139.
Araki, E., Shinohara, M., Obana, K., Yamada, T., Kaneda, Y., Kanazawa, T, Suyehiro, K.,
2006. Aftershocks distribution of the 26 December 2004 SumatraAndaman earthquake
from ocean bottom seismographic observation. Earth, Planets and Space, 58 (2),
113119.
Avedik, F., Renard, V., Allenou J. P., and Morvan, B., 1993, Single bubble" airgun array for
deep exploration, Geophysics, 58, 366382.
Berglar, K., Gaedicke, C., Lutz, R., Franke, D., and Djajadihardja, Y.S., 2008, Neogene
subsidence and stratigraphy of the Simeulue forearc basin, Northwest Sumatra, Marine
Geology, 253, 113, doi: 10.1016/j.margeo.2008.04.006
Byrne, D.E., D.M. Davis, and L.R. Sykes, 1988. Loci and maximum size of thrust
earthquakes and the mechanics of the shallow region of subduction zones. Tectonics, 7,
833857.
Byrne, T. and Fisher, D., 1990. Evidence for a weak and overpressured decollement beneath
sedimentdominated accretionary prisms. J. Geophys. Res., 95, 90819097.
Carlson, R. L., Herrick, C. N., 1990, Densities and porosities in the oceanic crust and their
variations with depth and age., J. Geophys. Res. B, 95, 91539170.
Christensen, N. I., Mooney, W. D., 1995, Seismic velocity structure and composition of the
continental crust; a global view, J. Geophys. Res., 100, 6, 97619788.
Chauhan, A. P. S., Singh, S. C., Hananto, N. D., Carton, H., Klingelhoefer, F., Dessa, J.X.,
Permana, H., White, N., Graindorge, D., and the SumatraOBS scientific team,
submitted to Geophys. J. Int., Role of the forearc backthrusting in generation of the
massive tsunami of 26 December 2004 offshore Northern Sumatra.
24
685
690
695
700
705

Christensen, N. I. & Mooney, W.D., 1995. Seismic velocity structure and composition of the
continental crust; a global view. J. Geophys. Res., 100, 6, , 97619788.
Cohen, J. K., and Stockwell, J. W., 2003, Seismic Unix Release 37: a free package for seismic
research and processing, Center for Wave Phenomena, Colorado School of Mines.
Curray, J. R., Shor, G. G., Raitt, R. W., Henry, M., 1977. Seismic refraction and relection
studies of the crustal structure of the Eastern Sunda and Western Banda Arcs, J.
Geophys. Res., 82(17), 24792489.
Currie C.A., Hyndman, R.D., Wang, K., and Kostoglodov, V., 2002. Thermal models of the
Mexico subduction zone: Implications for the megathrust seismogenic zone, J.
Geophys. Res., 107 (B12), 2370, doi:10.1029/2001JB000886.
Currie C.A., and Hyndman, R.D., 2006. The thermal structure of subduction zone back arcs,
J. Geophys. Res., 111, B08404, doi:10.1029/2005JB004024.
Davis, D., Suppe, J. and Dahlen, F., 1983. Mechanics of fold and thrust belts and accretionary
wedges. J. Geophys. Res., 88, 11531172.
Delisle, G., and Zeibig, M., 2007, Marine Heat Flow Measurements in hard ground offshore
Sumatra, EOS, 88 (4), 3839.
Dessa, J.X., Operto, S., Kodaira, S., Nakanishi, A., Pascal, G., Uhira, K., & Kaneda, Y. 2004.
Deep seismic imaging of the eastern Nankai trough, Japan, from multifold Ocean
Bottom Seismometer data by combined traveltime tomography and prestack depth
migration, J. Geophys. Res., 109, doi:10.129/2003JB002689.
Dessa, J.X., Klingelhoefer, F., Graindorge, D., André, C., Permana, H., Gutscher, M.A.,
Chauhan, A., Singh, S., and the SUMATRAOBS scientific team, Megathrust
earthquakes can nucleate in the forearc mantle: Evidence from the 2004 Sumatra event,
Geology, 37, doi:10.1130/G25653A.1.
Engdahl, E.R., R.D. van der Hilst, and R. Buland, 1998. Global teleseismic earthquake
relocation with improved travel times and procedures for depth relocation, Bull. Seism.
Soc. Am., 88, 722743.
25
710
715
720
725
730
735
Engdahl, E. R., Villasenor, A., DeShon, H. R. and Thurber, C. H., 2007. Teleseismic
Relocation and Assessment of Seismicity (1918–2005) in the Region of the 2004 Mw
9.0 Sumatra–Andaman and 2005 Mw 8.6 Nias Island Great Earthquakes, Bull. Seismol.
Soc. Am., doi: 10.1785/0120050614
Franke, D., Schnabel, M., Ladage, S., Tappin, D. R., Neben, S., Djajadihardja, Y. S., Mueller,
C., Kopp, H., Gaedicke, C. 2008. The great SumatraAndaman earthquakes – Imaging
the boundary between the ruptures of the great 2004 and 2005 earthquakes. Earth
Planet. Sci. Lett., 269, 118130.
Fuji, Y. and Satake, K., 2007. Tsunami source of ther 2004 SumatraAndaman earthquake
and the Indian Ocean tsunami. Bull. Seism. Soc. Am., 97, 192207.
Gailler, A., Charvis, P., Flueh, E., 2007, Segmentation of the Nazca and South American
plates along the Ecuador subduction zone from wide angle seismic profiles, Earth
Planet. Sci. Lett., 260 (34), 444464.
Graindorge, D., Klingelhoefer, F., Sibuet, J.C., McNeill, L., Henstock, T., Dean, S.,
Gutscher, M.A., Dessa, J.X., Permana, H., Singh, S., Leau, H., White, N., Carton, H.,
Malod, J.A., Rangin, C., Aryawan, K., Chaubey, K., Chauhan, A., Galih, D. R.,
Greenroyd, C. J., Laesanpura, A., Prihantono, J., Royle, G., Shankar, U. (2008) Impact
of the lower plate on upper plate deformation at the NW Sumatran convergent margin
from seafloor morphology. Earth Planet. Sci. Lett., 275, 34, 201210
Graindorge, D., Spence, G., Charvis, P., Collot, J.Y., Hyndman, R. D., Trehu, A. M., 2003, J.
Geophys. Res., 108 (B10), 2484, doi:10.1029/2002JB1823.
Grevemeyer, I., Kaul, N., DiazNaveas, J.L., Villinger , H.W., Ranero, C. R., and Reichert,
C., 2005. Heat flow and bendingrelated faulting at subduction trenches: Case studies
offshore of Nicaragua and Central Chile. Earth and Planetary Science Letters, 236,
238248.
Grevemeyer, I., Ranero, C. R., Flueh, E. R., Kläschen, D., Bialas, J., 2007. Passive and active
seismological study of bendingrelated faulting and mantle serpentinization at the
26
740
745
750
755
760
Middle America Trench, Earth Planet. Sc. Lett., 258, 528542.
Gutscher, M.A. and Peacock, S.M., 2003. Thermal models of flat subduction and the rupture
zone of great subduction earthquakes. J. Geophys. Res., 108 (B1), 2009,
doi:10.1029/2001JB000787.
Henstock, T., McNeill, L., Tappin, D. R., 2006, Seafloor morphology of the Sumatran
subduction zone: Surface rupture during megathrust earthquakes? Geology, 34 (6),
485488.
Hamilton, E. L., 1978, Sound velocitydensity relations in the seafloor sediments and rocks,
J. Ac. Soc. Am., 63, 366377.
Harris, R.N. and Wang, K., 2002. Thermal models of the Middle America Trench at the
Nicoya Peninsula, Costa Rica. Geophys. Res. Lett., 29, 2010, doi:1029/2002GL015406.
Hino, R., S. Ito, H. Shiobara, H. Shimamura, T. Sato, T. Kanazawa, J. Kasahara, and A.
Hasegawa, 2000. Aftershock distribution of the 1994 Sanrikuoki earthquake (Mw 7.7)
revealed by ocean bottom seismographic observation, J. Geophys. Res., 105,
2169721710.
Hippchen S., R. D. Hyndman, 2008, Thermal and structural models of the Sumatra
subduction zone: Implications for the megathrust seismogenic zone, J. Geophys. Res.,
113, B12103, doi:10.1029/2008JB005698.
Hubbert, M.L. and Rubey, W.W., 1959. Role of fluid pressure in mechanics of overthrust
faulting. Geol. Soc. Am. Bull., 70, 115206.
Hughes, S., Barton P. J., Harrison, D., 1998, Exploration in the ShetlandFaeroe Basin using
densely spaced arrays of oceanbottom seismometer, Geophys., 63, 2, 328334.
Hyndman, R.D., 2007. The seismogenic zone of subduction thrust faults; what we know and
don't know In: T.H. Dixon and J.C. Moore (Editors), The seismogenic zone of
subduction thrust faults. MARGINS theoretical and experimental earth science series.
Columbia University Press, United States, United States, pp. 1540.
27
765
770
775
780
785
Hyndman, R.D. and and K. Wang, 1993. Thermal Constraints on the Zone of Major Thrust
Earthquake Failure: The Cascadia Subduction Zone. J. Geophys. Res., 98, 20392060.
Hyndman, R.D. and K. Wang, 1995. The rupture zone of Cascadia great earthquakes from
current deformation and the thermal regime. J. Geophys. Res., 100, 2213322154.
Hyndman, R.D., M. Yamano, and K. Wang, 1995. Thermal constraints on the seismogenic
portion of the southwestern Japan subduction thrust. J. Geophys. Res., 100,
1537315392.
Hyndman, R.D., M. Yamano, and Oleskevich, D.A., 1997. The seismogenic zone of
subduction thrust faults. Island Arc, 6, 244260.
Izart, A., Mustafa Kemal, B., Malod, J. A. 1994. Seismic stratigraphy and subsidence
evolution of the northwest Sumatra forearc basin. Mar. Geol. 122, 109124.
Jackson, H. R., Reid, I., Falconer, R. K. H., 1982, Crustal structure near the Arctic midocean
ridge, J. Geophys. Res., 87, 17731783.
Johnson, J.M., K. Satake, S.R. Holdahl, and J. Sauber, 1996. The 1964 Prince William Sound
earthquake: Joint inversion of tsunami and geodetic data, J. Geophys. Res., 101,
1496514991.
Jokat, W., SchmidthAursch, M., 2007, Geophysical characteristics of the ultraslow
spreading Gakkel Ridge, Arctic Ocean, Geophys. J. Int., 168 (3), 983998.
Kanamori, H., 1972. Tectonic implications of the 1944 Tonankai and 1946 Nankaido
earthquakes. Phys. Earth Planet. Inter., 5, 129139.
Karig, D.E., M.B. Lawrence, G.F. Moore, and J.R. Curray, 1980, Structural framework of the
forearc basin, NW Sumatra. J. Geol. Soc. London, v.137, p. 7791.
Khazaradze, G., A. Qamar, and H. Dragert, 1999. Tectonic deformation in western
Washington from continuous GPS measurements. Geophys. Res. Lett., 26, 31533156.
Kiekhefer, R. M., Shor, G. G., Curray, J. R., 1980. Seismic refraction studies of the Sunda
28
790
795
800
805
810
Trench and Forearc Basin. J. Geophys. Res., 85 (B2), p. 863889.
Klein, E. M., Langmuir, C. H., 1987, Global Correlations of Ocean Ridge Basalt Chemistry
with Axial Depth and Crustal Thickness, J. Geophys. Res., 92 (B8), 80898115.
Kopp, H., Klaeschen, D., Flueh, E. R., Bialas, J., 2002. Crustal structure of the Java margin
from seismic wideangle and multichannel reflection data, J. Geophys. Res., 107(B2),
2034, 10.1029/2000JB000095.
Kopp, H., Flueh, E. R., Klaeschen, D., Bialas, J., Reichert, C., 2001. Crustal structure of the
central Sunda margin at the onset of oblique subduction. Geophys. J. Int., 147, 449474.
Ladage, S., Gaedicke, C., Djajadihardja, Y., 2006. Great Sumatran earthquakes: MCS images
and bathymetry offshore Sumatra first results of SEACAUSE2 Leg1 cruise SO186,
Proc. EGU Meeting, Vienna April 2006. Geophys. Res. Abstr., v.8, 06774.
Lay, T., Kanamori, H., Ammon, C.J., Nettles, M., Ward, S.N., Aster, R.C., Beck, S.L., Bilek,
S.L., Brudzinski, M.R., Butler, R., DeShon, H.R., Ekstrom, G., Satake, J., and Sipkin, S.,
2005. The Great SumatraAndaman earthquake of 26 December 2004. Science, 308,
11271133.
Ludwig, J. W., Nafe, J. E., and Drake, C. L., 1970, Seismic refraction, in: The Sea, 4, 1,
5584.
Machida, Y., Shinohara, M., Takanami, T. and 19 others, 2009. Heterogeneous structure
around the rupture area of the 2003 Tokachioki earthquake (Mw=8.0), Japan, as
revealed by aftershock observations using Ocean Bottom Seismometers.
Tectonophysics, 465, 164176, doi:10.1016/j.tecto.2008.11.009.
Malod, J.A., Kemal, B. M., 1996, The Sumatra Margin; oblique subduction and lateral
displacement of the accretionary prism, Geol. Soc. Spec. Pub., 106, 1928.
Marone, C. and Saffer, D.M., 2007. Fault friction and the upper transition from seismic to
aseismic faulting. In: T.H. Dixon and J.C. Moore (Editors), The seismogenic zone of
subduction thrust faults. MARGINS theoretical and experimental earth science series.
29
815
820
825
830
835
840

Columbia University Press, United States, United States, pp. 346369.
Moore, J.C., Shipley, T.H. and 26 others, 1995. Abnormal fluid pressures and faultzone
dilation in the Barbados accretionary prism: Evidence from logging while drilling.
Geology, 23, 605608.
Moore, J.C., and Saffer, D. 2001. Updip limit of the seismogenic zone beneath the
accretionary prism of southwest Japan: An effect of diagenetic to lowgrade
metamorphic processes and increasing effective stress. Geology, 29, 183186.
Mueller, D., Roest, W.R, Royer, J.Y., Gahagan, L.M., and Sclater, J.G., 1997. Digital
isochrons of the world’s ocean floor. J. Geophys. Res., 102, 32113214.
Muller, M. R., Robinson, C. J., Minshull, T. A., White, R. S., Bickle, M. J., 1997, Thin crust
beneath ocean drilling program borehole 735B at the southwest Indian Ridge?, Earth
Planet. Sci. Lett., 117, 295317.
Oleskevich, D.A., Hyndman, R.D. and Wang, K. 1999. The updip and downdip limits to great
subduction earthquakes: Thermal and structural models of Cascadia, south Alaska, SW
Japan, and Chile. J. Geophys. Res., 104, 14,96514,991.
Pacheco J.F., Sykes L.R. and Scholz C.H., 1993. Nature of seismic coupling along simple
plate boundaries of the subduction type. J. Geophys. Res., 98, 14,13314,159
Peacock, S.M., and K. Wang, 1999. Seismic consequences of warm versus cool subduction
zone metamorphism: Examples from northeast and southwest Japan, Science, v. 286,
937939.
Ramachandran, K., Hynman, R. D., Brocher, T. M., 2006, Regional P wave velocity structure
of the Northern Cascadia Subduction zone, J. Geophys. Res., 111 (B12301),
doi:10.1029/2005JB004108.
Ranero, C. R., Phipps Morgan, J., McIntosh, K., Reichert, C., 2003, bendingrelated faulting
and mantle serpentinization at the Middle America Trench, Nature, 425, 367373.
30
845
850
855
860
865

Royer, J.Y., Sandwell, D. T., 1989, Evolution of the Eastern Indian Ocean Since the Late
Cretaceous: Constraints from Geosat Altimetry. J. Geophys. Res., 94 (B10)
13,75513,782.
Ruff, L., and H. Kanamori, 1980. Seismicity and the subduction process. Phys. Earth Planet.
Inter., 23, 240252.
Saffer, D.M., and Bekins, B.A., 2002. Hydrological controls on the morphology and
mechanics of accretionary wedges, Geology., 29, 183186.
Sallares, V., and Ranero, C.R., 2005. Structure and tectonics of the erosional convergent
margin off Antofagasta, north Chile (23°30′S). J. Geophys. Res., 110, B06101,
doi:10.1029/2004JB003418.
Sandwell, D., W. Smith, 1995, Marine gravity from satellite altimetry, digital file, version 7.2,
Geol. Data Cent., Scripps Inst. of Oceanogr., La Jolla, Calif. (Available at anonymous
ftp tobaltica.ucsd.edu)
Satake, K., 1993. Depth distribution of coseismic slip along the Nankai Trough, Japan, from
joint inversion of geodetic and tsunami data. J. Geophys. Res., 98, 45534565
Satake, K., Shimazaki, K., Tsuji, Y., and Ueda, K., 1996. Time and size of a giant earthquake
in Cascadia inferred from Japanese tsunami records of January 1700, Nature, 379,
246249.
Savage, J.C., 1983. A dislocation model of strain accumulation and release at subduction
zones, J. Geophys. Res., 88, 49844996.
Schlueter, H.U., Gaedicke, C., Roeser, H.A., Schreckenberger, B., Meyer, H., Reichert, C.,
Djajadihardja, Y., and Prexl, A., 2002, Tectonic features of the southern Sumatra
western Java forearc of Indonesia: Tectonics, 21, 15 p, doi: 10.1029/2001TC901048
Scholz, C. H., 1990. The Mechanics of Earthquakes and Faulting, 439 pp., Cambridge Univ.
Press, Cambridge.
31
870
875
880
885
890

Seno, T., 2005. Variation of downdip limit of the seismogenic zone near the Japanese islands:
Implications for the serpentinization mechanism of the forearc mantle wedge, Earth
Planet. Sci. Lett., 231, 249262.
Sibuet, J.C., 2005. Aftershocks cruise report, publication of the Institut Paul Emile Victor.
Sibuet, J.C., Rangin, C., Le Pichon, X., Singh, S., Cattaneo, A., Graindorge, D.,
Klingelhoefer, F., Lin, J.Y., Malod, J., Maury, T., Schneider, J.L., Sultan, N., Umber,
M., Yamaguchi, H., 2007. 26th December 2004 great SumatraAndaman earthquake:
Coseismic and postseismic motions in northern Sumatra. Earth Planet. Sci. Lett., 263,
88103.
Simoes, M., Avouac, J.P., Cattin, R., and Henry, P., 2004. The Sumatra subduction zone: a
case for a locked fault zone extending into the mantle. Journal of Geophysical Research,
v. 109, doi: 10.1029/2003JB002958.
Singh, S. C., Carton, H., Tapponnier, P., Hananto, N. D., Chauhan, A. P. S., Hartoyo, D.,
Bayly, M., Moeljopranoto, S., Bunting, T., Christie, P., Lubis, H., Martin, J. (2008)
Seismic evidence for broken oceanic crust in the 2004 Sumatra earthquake epicentral
region, Nature Geoscience, 1 (11), 777781.
Stanley, D., and A. Villasenor, 2000 . Models of downdip frictional coupling for the Cascadia
megathrust. Geophys. Res. Lett., 27, 15511554.
Stein, S. and Okal, E.A., 2005. Speed and size of the Sumatra earthquake, Nature, 434,
581582.
Stein, C.A., and S. Stein, 1992. A model for the global variation in oceanic depth and heat
flow with lithospheric age. Nature, 359, 123126.
Stockwell, J. W., 1999, The CWP/SU: Seismic Unix Package, Computers and Geosciences,
25(4), 415419.
Tichelaar, B.W. and Ruff, L.J. 1993. Depth of seismic coupling along subduction zones, J.
Geophys. Res., 98, 20172037.
32
895
900
905
910
915

Wang, K.L. Hyndman, R.D., M. Yamano, and 1995. Thermal regime of the southwest Japan
subduction zone effects of the age history of the subducting plate. Tectonophys., 248,
5369.
Wang, K., and He, J., 2008. Effects of frictional behavior and geometry of subduction fault on
coseismic seafloor deformation. Bulletin of the Seismological Society of America, 98,
571579, doi: 10.1785/0120070097.
Wells, D. L., Coppersmith, K. J., 1994, New empirical relationships among magnitude,
rupture length, rupture width, rupture area, and surface displacement, Bull. Seismol.
Soc. Am., 84 (4), 9741002.
Wessel, P., Smith, W. H. F., 1995, A new version of the Generic Mapping Tool (GMT), EOS,
Trans. Am. Geophys. Un., 76, 329.
White, R. S., McKenzie, D. and O'Nions, R., 1992. Oceanic crustal thickness from seismic
measurements and rare earth element inversions. J. Geophys. Res., 97, 19,68319,715.
Vigny, C., Simons, W.J.F., Abu, S., Bamphenyu, R., Satirapod, C., Choosakul, N., Subarya,
C., Socquet, A., Omar, K., Abidin, H.Z., Ambrosius, B.A.C. , 2005. Insight into the
2004 Sumatra–Andaman earthquake from GPS measurements in southeast Asia, Nature,
436 201206.
Vrolijk, P., 1990. On the mechanical role of smectite in subduction zones, Geology, 18,
703707.
Zelt, C. A., and Barton, P. J., 1998, Threedimensional seismic refraction tomography: A
comparison of two methods applied to data from the Faroe Basin, J. Geophys. Res.,
103, 71877210.
Zelt, C. A., and Smith, R. B., 1992, Seismic travel time inversion for 2D crustal velocity
structure, Geophys. J. Int. 108, 1631.
Zelt, C. A., 1999, Modelling strategies and model assessment for wideangle seismic
traveltime data, Geophys. J. Int. 139, 183204.
33
920
925
930
935
940

34

Figure 1
35
945
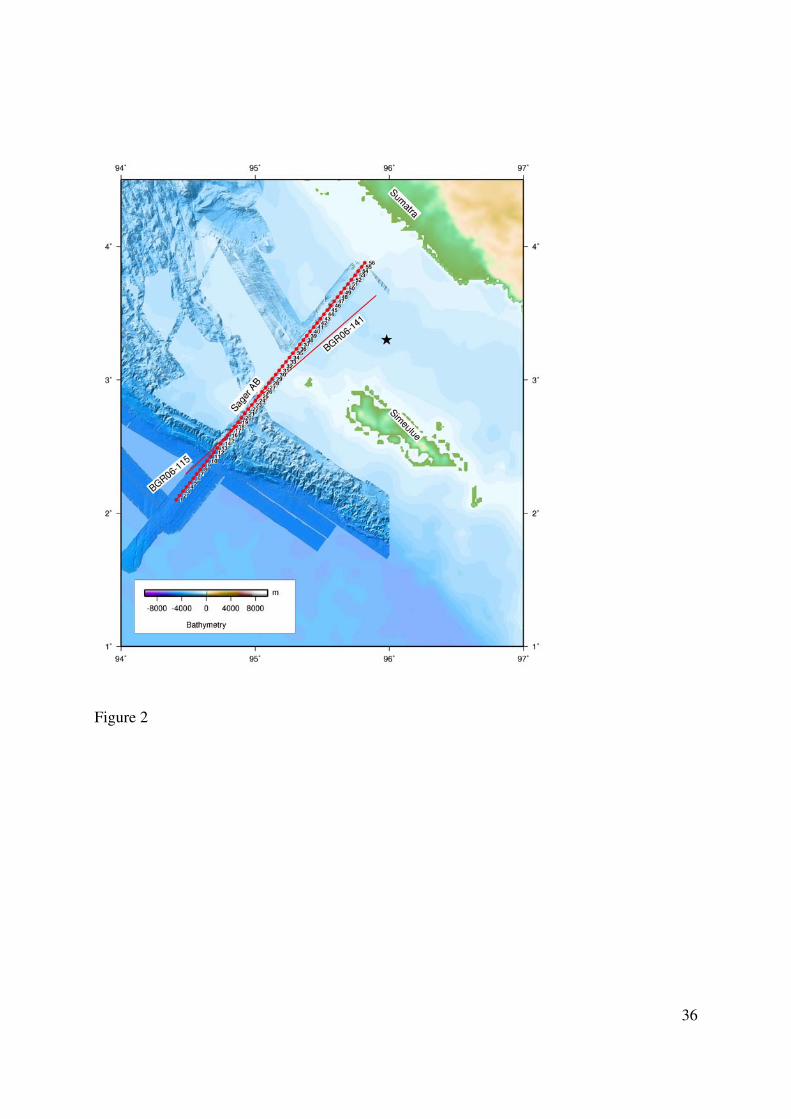
Figure 2
36
Figure 3
37
950
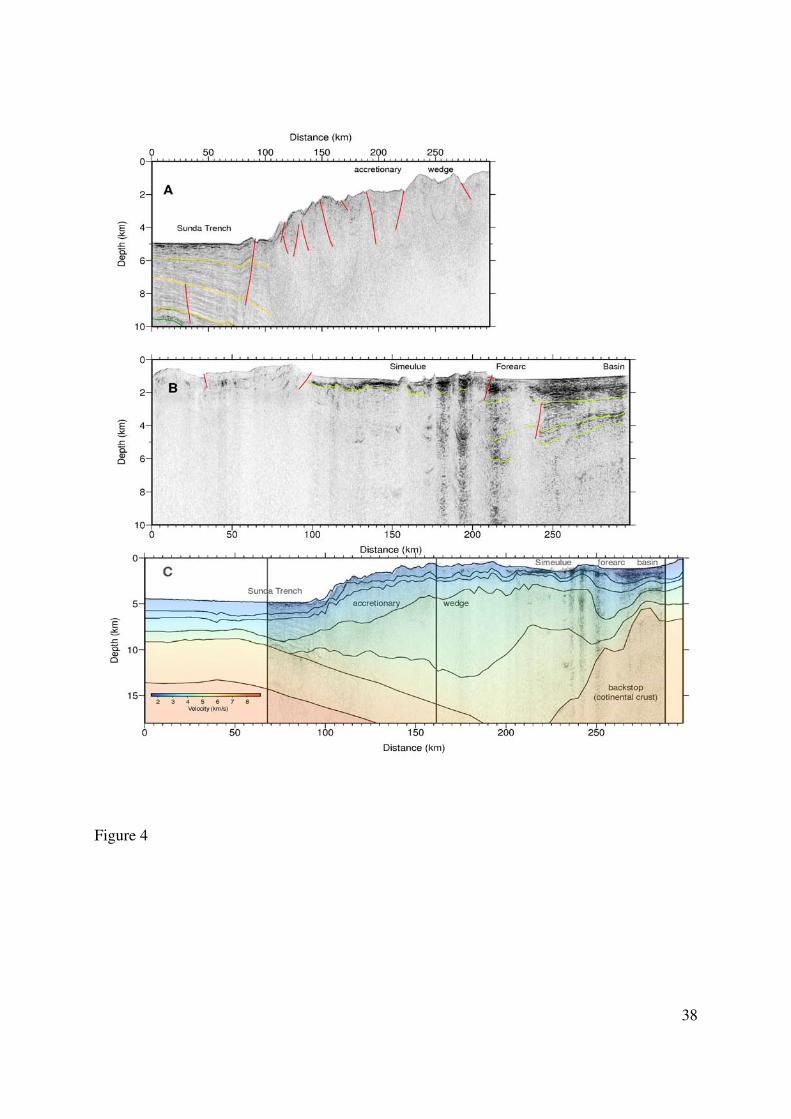
Figure 4
38

Figure 5
39

Figure 6
40
955

Figure 7
41

Figure 8
42
960
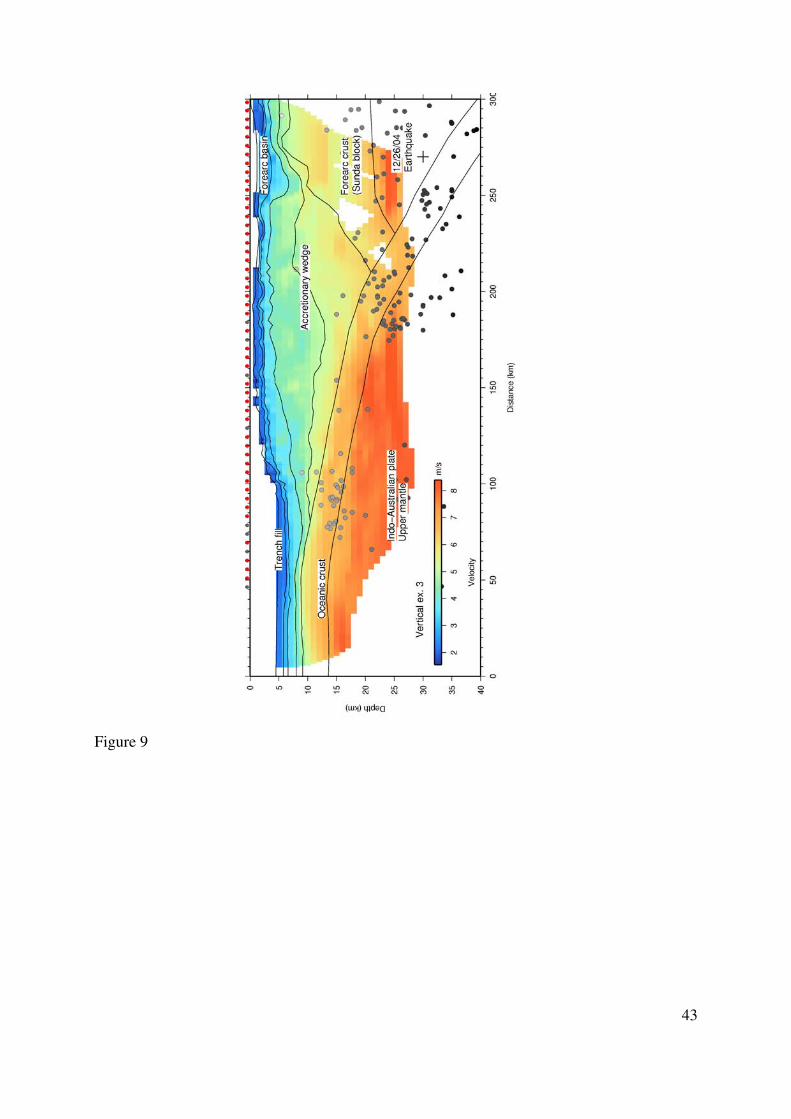
Figure 9
43
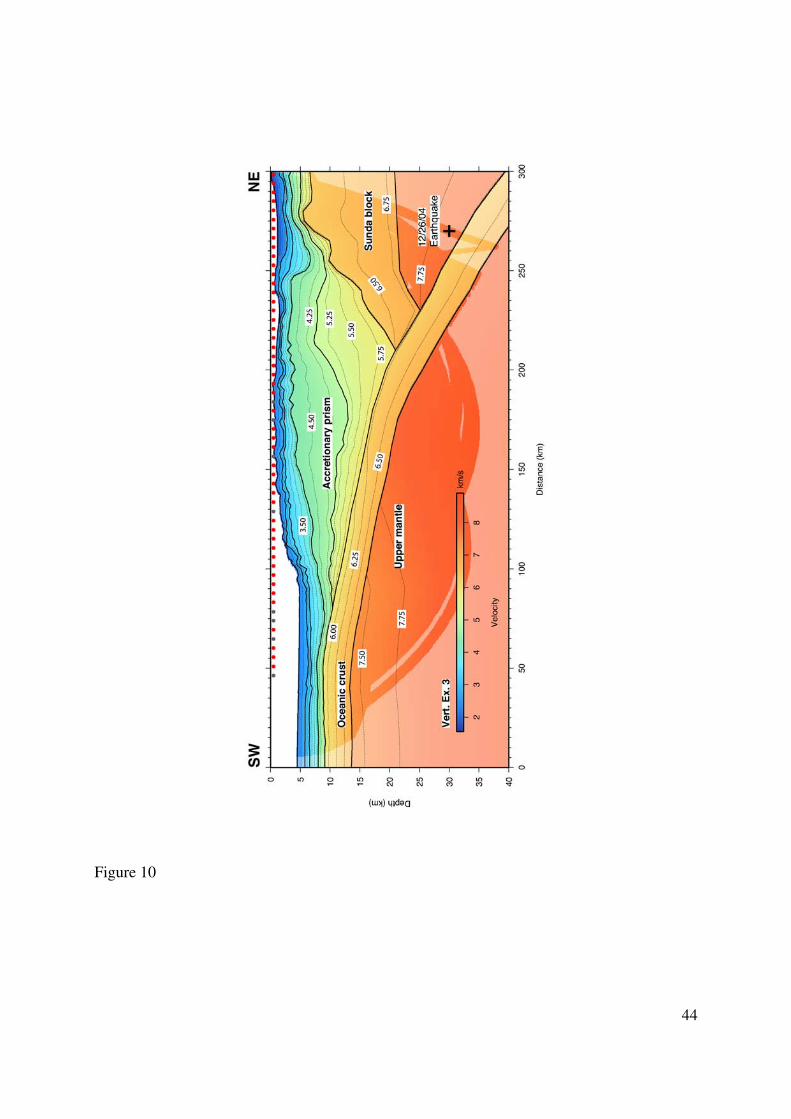
Figure 10
44
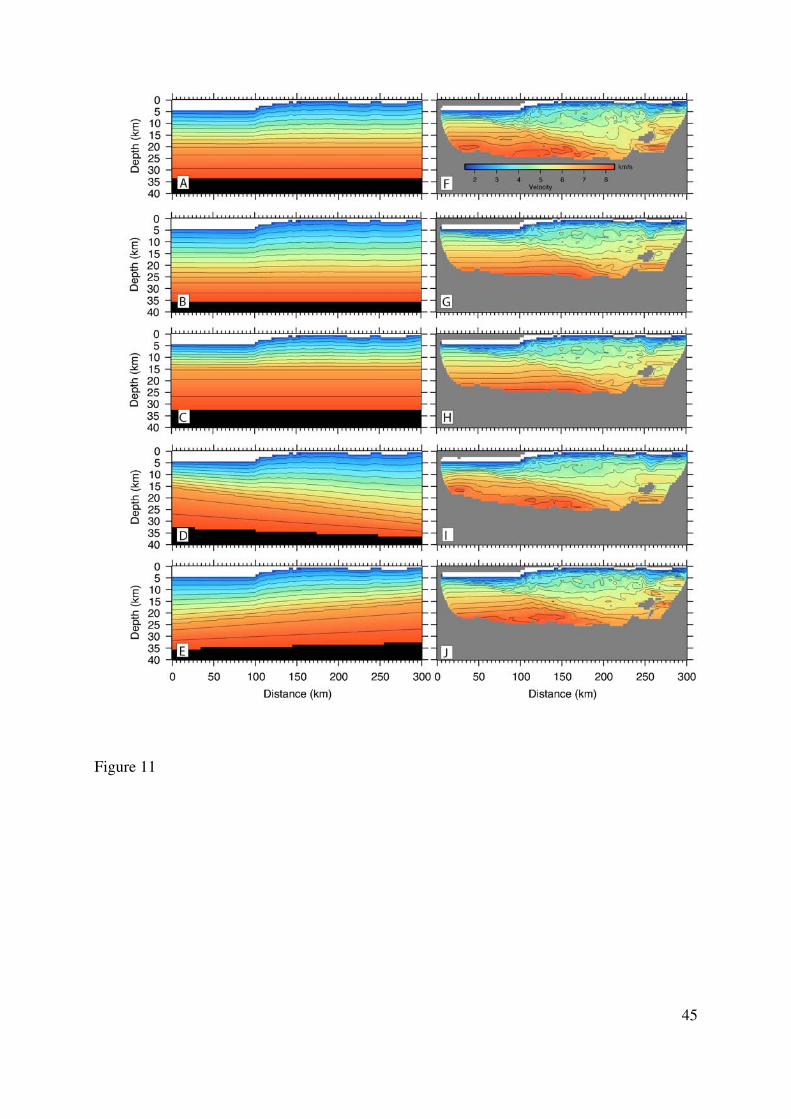
Figure 11
45
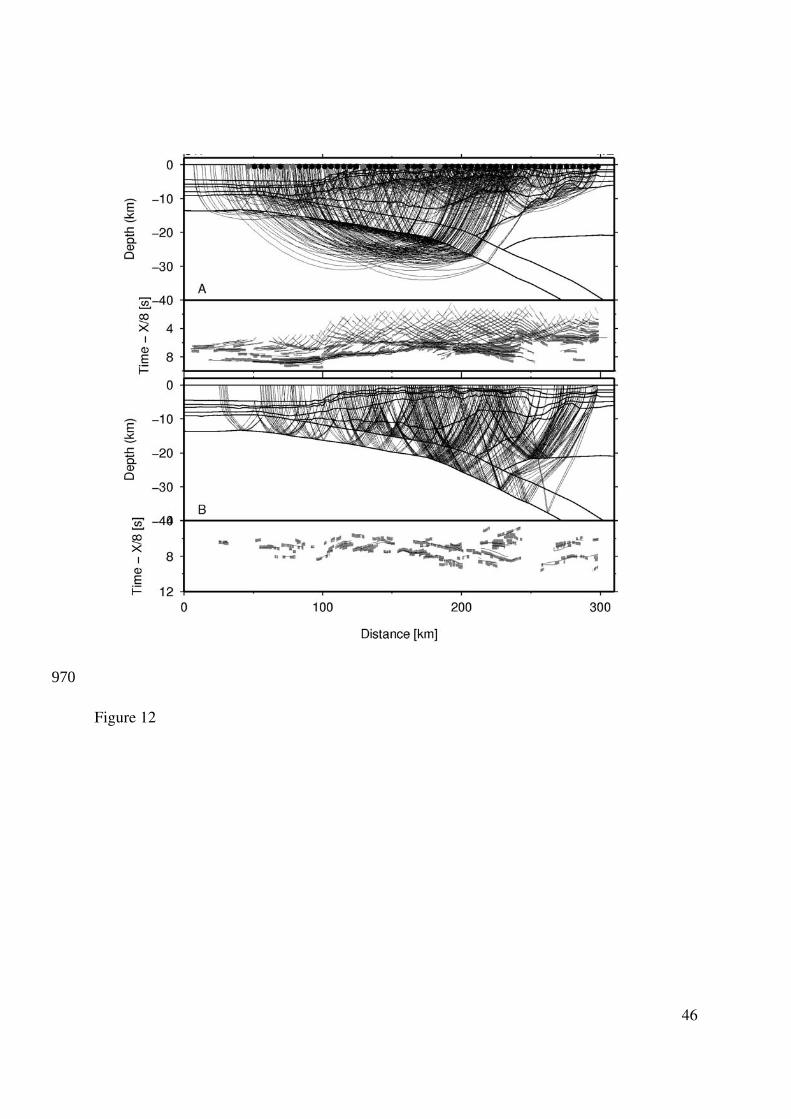
Figure 12
46
970

Figure 13
47
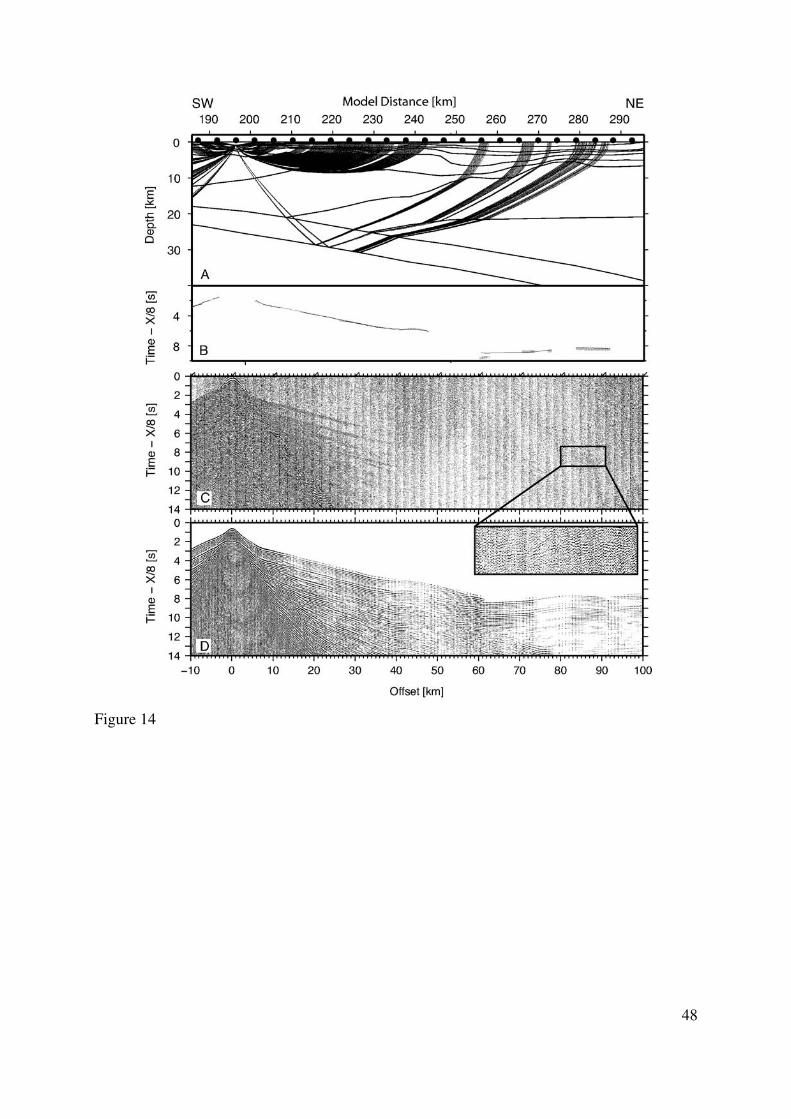
Figure 14
48
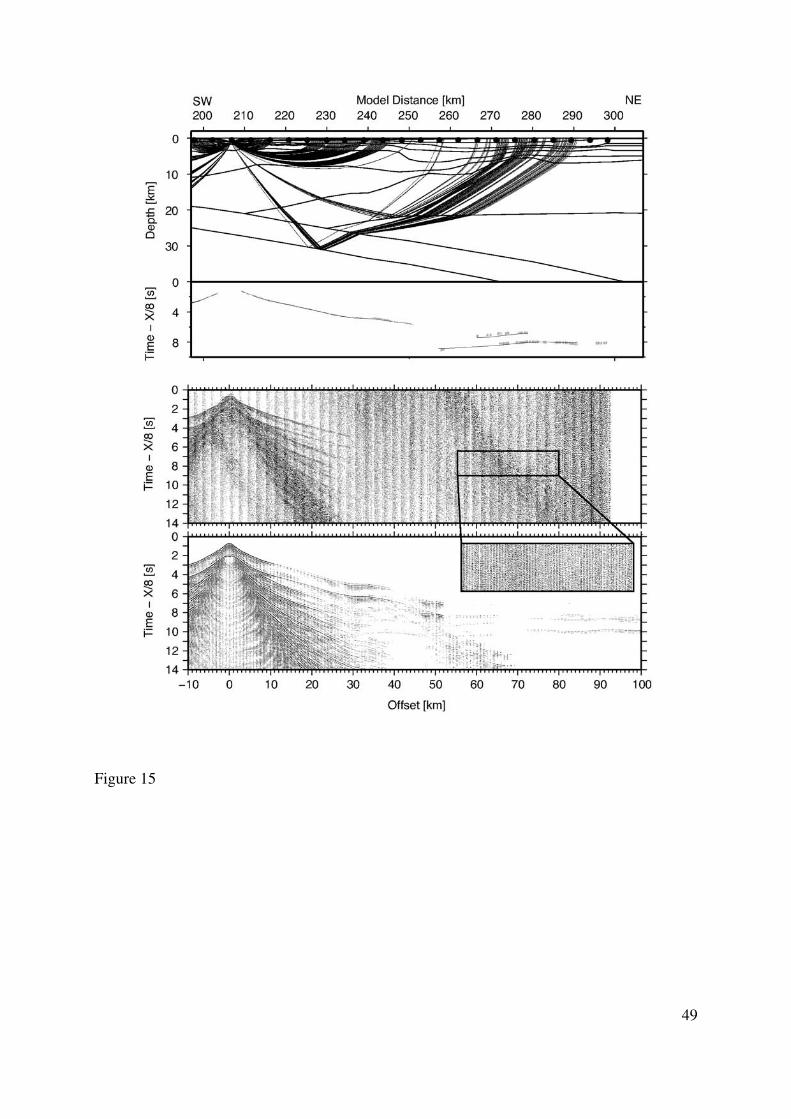
Figure 15
49
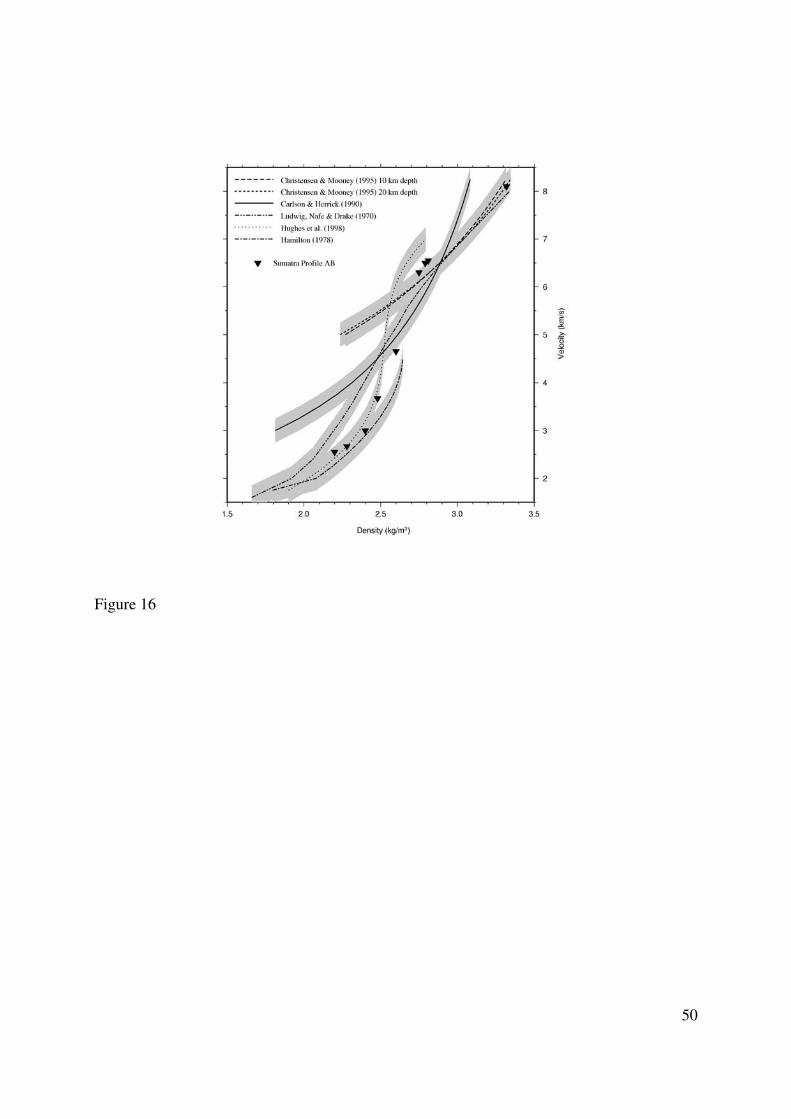
Figure 16
50

Figure 17
51
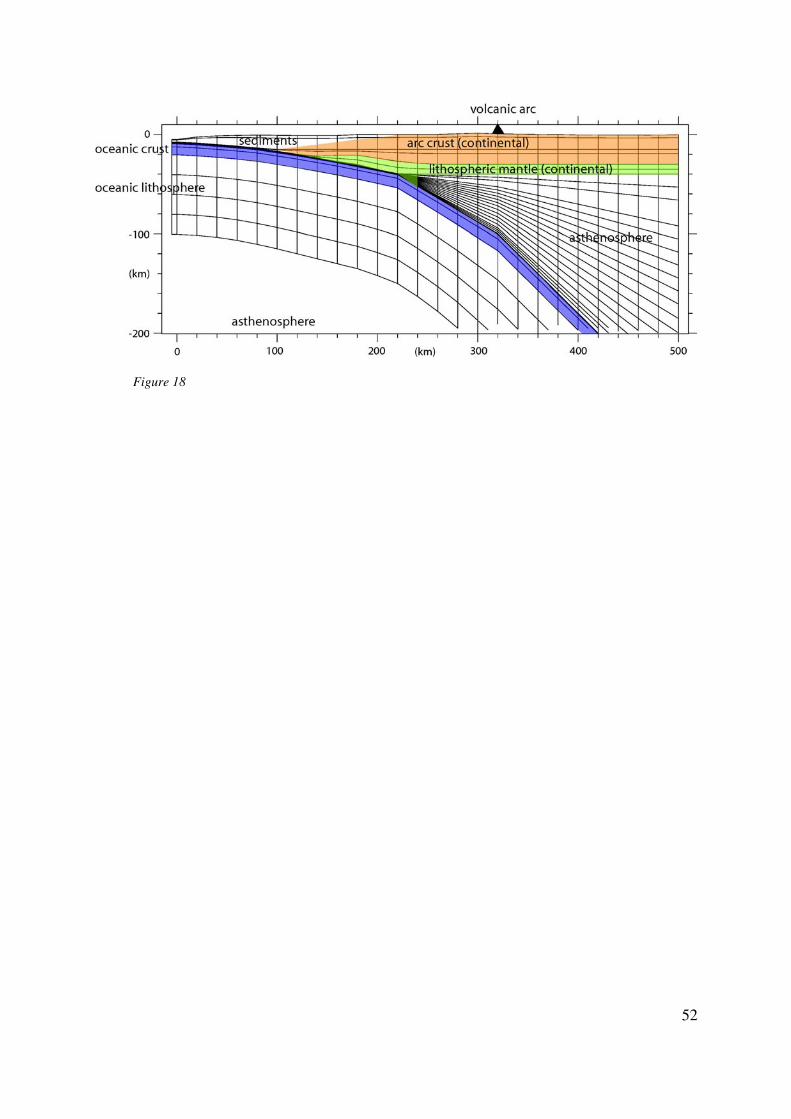
52
Figure 18
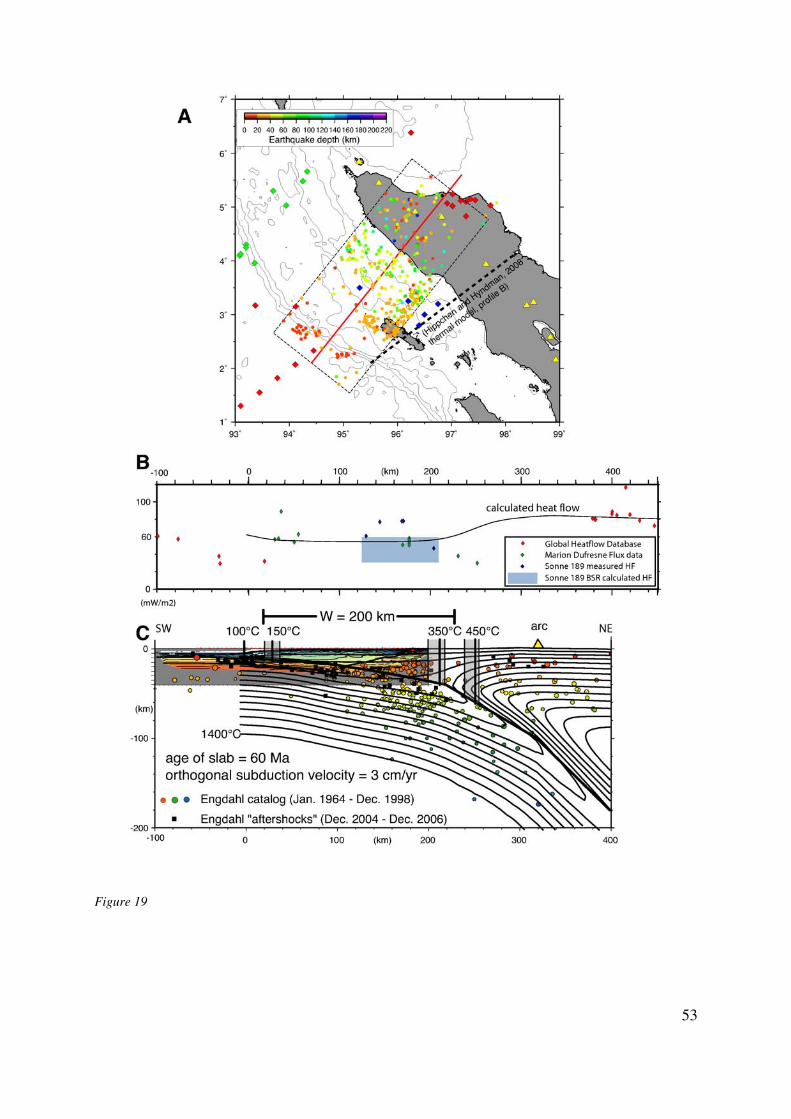
Figure 19
53