limits of peripheral acuity and implications for vr system
TRANSCRIPT
Limits of peripheral acuity and implications for VR system design
David Hoffman (SID Member)
Zoe MerazEric Turner
Abstract — At different retinal locations, we measured the visual system’s sensitivity to a number ofartifacts that can be introduced in near-eye display systems. One study examined the threshold levelof downsampling that an image can sustain at different positions in the retina and found that temporallystable approaches, both blurred and aliased, were much less noticeable than temporally volatile ap-proaches. Also, boundaries between zones of different resolution had low visibility in the periphery.We also examined the minimum duration needed for the visual system to detect a low-resolution regionin an actively tracked system and found that low-resolution images presented for less than 40 ms beforebeing replaced with a high-resolution image are unlikely to be visibly degraded. We also found that thevisual system shows a rapid falloff in its ability to detect chromatic aberration in the periphery. Thesefindings can inform the design on high performance and computationally efficient near-eye displaysystems.
Keywords — foveated rendering, peripheral acuity, artifact visibility, downsampling, scintillation, flicker,latency.
DOI # 10.1002/jsid.730
1 Introduction
The human visual system manages to perceive a wide field ofview while simultaneously offering the percept of good detailat all locations. This percept is an illusion; the photoreceptorsampling is non-uniform throughout the retina, and thebandwidth of nerve fibers connecting the retina to thebrain is only capable of transmitting a small fraction ofthe information available.1 Using the digital imagingtechniques that correspond to the sensitivities of thehuman visual system offers tantalizing possibilities atproducing compelling imagery with a limitedcomputational budget.
Head-mounted displays take advantage of thesetechniques by using foveated rendering: rendering eachframe locally at a quality level that is commensurate withthe visual system’s sensitivity.2 Ideally, there is a potential forsignificant saving in processing, transmission, and opticaldesign without any visible indication the image is not ofuniform high quality. This work explores the sensitivity ofthe visual system to different types of image artifacts thatare highly relevant to foveated rendering and near-eyedisplay systems. These visual system limits suggestperformance criteria for current and in development near-eye display systems. Some of the problems for which thiswork is relevant are as follows: eye tracking, displayresolution, anti-aliasing, rendering, and optical characteristics.
To address these challenges with hardware, we conducteda series of experiments (summarized in Table 1) to probe thesensitivity to various types of image degradation for different
parts of the retina. In one set of experiments, we exploredifferent rendering techniques that downsample an image.The approaches include a processing analogous to high-performance anti-aliased content (blur); a temporally stableapproach that attempts to align aliases with content (stablealias); and a frame-by-frame downsampling approach thatcan introduce spatial as well as temporal artifacts (volatilealias). We explored the sensitivity of the visual system tothese artifacts near the fovea as well as in different parts ofthe periphery. As part of this work, we consider the visibilityof these artifacts at transition boundaries between differentlevels of downsampling. In another experiment, we explorethe visibility of short duration exposure to a downsampledimage before it is corrected to the full-resolution image, andthis work can be applicable to latency requirements for anactive system. We also study how the sensitivity to chromaticaberration differs as a function of eccentricity.
2 Motivation and background
Virtual reality (VR) as a platform has several fundamentaldifferences from conventional displays. The currentgeneration of VR headsets still yield a modest field of viewof 90°–100° horizontally, which although is far less than thehuman binocular field of view of 220°, is still far greaterthan the angular coverage of the normal use-case of anydirect-view display. Even though VR displays featureimpressive pixel counts, the perceived pixel density is stillmuch worse than conventional monitors.3,4
Received 03/28/18; accepted 07/12/18.The authors are with the Google Inc., Mountain View, CA, USA; e-mail: [email protected].© 2018 Society for Information Display 1071-0922/18/0730$1.00.
Journal of the SID, 2018
As a result, real-time rendering for VR has a disadvantage.It is more expensive to render a scene of equivalentsophistication as a modern video game, judged by trianglecount, texture detail, and so on. VR systems need to renderthe scene at least twice per frame – once per eye – at ahigher resolution. With limited compute power, this resultsin perceptibly degraded quality. Many techniques have beendeveloped to improve the rendering efficiency in VR, suchas multiview stereo rendering,5,6 improvements inmultisampling,7–9 and foveated rendering.10–14
Each of these methods reduces the rendering load perframe based on some visual trade-off. Foveated renderingin particular allows computational savings by reducing thetotal number of pixels needed to be processed. Byproducing lower resolution rendering in the periphery, thegoal is to spend less time in areas for which the user willnot notice a difference. This technique relies on the acuitylimit of the human visual system, which has beenmeasured to have a dramatic falloff with eccentricityangle.1,15–17 However, many of the past studies relied onstatic letter acuity stimuli and did not measure sensitivityto dynamic content. This paper explores motion stimuli,which can expose dynamic artifacts that are not observedwith static imagery, and as will be described later, thevisual system is particularly sensitive to these artifacts. Themost prevalent motion artifact is a form of spatiotemporalflicker that manifests as a scintillation and is a criticalchallenge common to all of downsampling routines due tothe visual system’s sensitivity to these high-frequencyframe-by-frame subtle changes.18 Because foveatedrendering increases the angular spacing of pixels in theperiphery, any rasterization or upsampling artifacts also getmagnified, which exacerbates the scintillation. There is alsoclear literature showing that motion thresholds in theperiphery are lower than other spatial acuity metrics, whichis best exemplified by Mckee and Nakayama.19 This workfound that there was a dramatic falloff in motion acuitybetween 0° and 10° eccentricity and then more subtledrop between 10° and 40°.
One generic foveation technique is to render central andeccentric regions with different acuity via separate passes.So for a single frame, a “low acuity” and “high acuity” imageis generated, possibly with multiple levels in between. Theseimages are then upsampled and composited together into
the final frame.12,13,20 Depending on what part of thesystem the compositing occurs, foveated transmission canlessen bandwidth requirements for internal interfacesbetween the graphics processing unit and the displaypanel.21 For this approach, image artifacts get introduced atthe seams between regions and during upsampling of thelower resolution regions. Artifacts at the transitionboundaries between regions can be mitigated by overlappingthe low- and high-resolution regions and performing alphablending between the two images, which effectively blursthe boundary. This overlap imposes a trade-off, where awider overlap produces a more gradual transition but alsoincurs greater processing overhead. A narrower overlap isless expensive but may be more detectable.
Alternative approaches exist that allow for foveatedrendering to occur in a single render-pass, which alsoreduces the need for transition blending. Such examplesinclude ray-tracing approaches10,22 or masking-basedapproaches.23,24 Masking approaches render a full-resolutionimage, but use depth- or stencil-culling to mask outindividual pixels. Both of these approaches are less efficientthan just rendering a low-resolution frame directly but canprovide a visual benefit. Rasterization still requires a full-resolution image, but texture and fragment shading onlyoccur on the non-masked pixels. Continuous transitionsbetween levels of acuity can be formed without the need ofoverlapped rendering since arbitrary patterns can begenerated by masking individual pixels. By using acontinuous resolution reduction, artifacts caused bydiscontinuities in resolution are removed, resulting in fewerperceived artifacts overall.
All of the aforementioned foveated rendering methodscan be used either with or without eye tracking sensors. Infoveation without eye tracking, the outer edges of the VRdisplay can have lower requirements due to lens acuityfalloff, vignetting, and by the inability for users tocomfortably maintain a gaze at an oblique eccentricity forprolonged periods.25,26 Thus, some resolution reductionthat scales with eccentricity is not necessarilynoticeable.14,27,28 The use of an eye tracker can enable amore aggressive solution in which resolution scales withretinal eccentricity, allowing for a narrower high-acuityregion and more aggressive resolution reduction in theperiphery. However, eye trackers can also introduce othertypes of motion artifacts including issues related to latency,temporally stable position errors, and temporally noisyestimates.
Regardless of method, foveation requires resampling theimage and compositing images with different resolutions tofill the field of view. There are three main classes offoveated rendering degradation: blur, spatial aliasing, andspatial–temporal aliasing.
For blur, it is important to differentiate between foveatedrendering and foveated transmission. For foveatedtransmission, we can assume that the full-resolution contenthas already been processed, for example, a pre-rendered
TABLE 1 — Summary of experiments.
Experiment Investigation
1A Compare the relative sensitivities to different spatiotemporaldownsampling strategies.
1B Investigate if sensitivity to downsampling artifacts showsasymmetry in the retina.
1C Investigate if transition boundary in periphery increasesvisibility of downsampling.
2 Maximum presentation time of degraded imagery that issub-threshold.
3 Quantifying sensitivity to transverse chromatic aberration inthe periphery.
Hoffman et al. / Limits of peripheral acuity

360° video or cloud rendering, and foveation occurs to aid inbandwidth limits for transmission. In such a case,downsampling can occur with proper low-pass filtering andfull anti-aliasing, which reduces flicker due to animation inthe scene. The resulting low-resolution content is equivalentto an optical blur of the original, with no aliasing artifactsbut without high-frequency details.
During foveated rendering, however, the savings comesfrom never producing the full-resolution content to beginwith, meaning no opportunity exists to perform full low-passfiltering. Spatial aliasing occurs when the rasterizationresolution is of lower frequency than the original resolutionof the virtual content. Spatially stable artifacts may beintroduced by the use of methodically reducing texturedetail in the 3D scene, such as when an application forcestextures to the next mipmap level.29 Applications can alsodynamically adjust the geometry complexity to reducecomputation when objects are far away or in the peripheralvision.30 Although these aliasing artifacts are present, theyare aligned to the world geometry rather than the outputdisplay coordinates, meaning they do not produce flickeringor scintillation effects during head movement.31
The third class of artifacts are temporally volatile aliasingeffects. Much like spatial aliasing mentioned previously, thisclass of artifacts occur due to rasterization being performedat a lower resolution than the native fidelity of the virtualcontent. Aliasing artifacts are aligned with the pixel grid ofthe output display, rather than the geometry itself. Thiseffect can be a result of having a relatively low-resolutiondisplay or by forcing the rendering to be performed at anartificially low resolution in certain parts of the screen,such as for foveated rendering. Because these aliasingartifacts are aligned to the screen coordinate system, asthe user moves their head, the aliasing shifts relative tothe virtual content. This relative movement causesflickering or scintillation effects, resulting in temporallyvolatile artifacts.
Temporal artifacts can change the rendered image fromframe to frame even if there is minimal head movement. Asthe pose of the VR headset changes relative to the virtualcontent coordinate system, the pixel alignment moves withrespect to the virtual content.
The perceptibility of these flicker artifacts for upsampledcontent also depends on the interpolation method used.Nearest-neighbor interpolation, for example, offers betterlocal contrast retention than bilinear interpolation orbicubic but also amplifies these motion flicker artifacts.Similarly, kernel-based methods can minimize the visibilityof static aliasing artifacts, but likely are not hardwaresupported, and yield further reduction in local contrast.Foveation techniques can also reduce the initialgeneration of scintillation artifacts prior to rendering byeither randomizing the rasterization sampling32 or byaligning the pixel grid to world coordinates.31 Each ofthese methods introduce trade-offs of extra computationfor improved visual quality. In the experiments described
here, the goal is to look at the broad classes of solutionsrather than the efficacy of the variants within eachbroader category.
3 General methods
To evaluate the limits of visual sensitivity to different artifactsas a function of retinal eccentricity, we use a desktop-mounted display with a head restraint. Such a system has thebenefit of a high-resolution display without degradation froman optical element. For these tests, we used an RGB stripeSony BVM 300 4K OLED monitor. The viewing distance washeld at 55 cm with a chin and forehead rest so that the fullscreen subtended about 60° horizontally and pixels normal tothe eye subtended about 1 arcmin. The color was adjusted toRec. 709, with 2.2 gamma and peak luminance of 130nits.
One consideration in the presentation of imagery was thatthe angular subtense of pixels would vary depending on theeccentricity being tested. Pixels N° off-axis for the displaywould have an effective angular size of cos2(N) in thehorizontal direction and cos(N) in the vertical direction.Although this could be compensated in software, this wouldrequire an additional resampling stage that could introduceadditional artifacts. At 40° viewing angle, the pixels could beas little as 58% of the nominal pixel size, and this wasdeemed an unacceptable error. To mitigate this issue, wepresented the fixation target to the left of the front surfacenormal of the display equal and opposite to the largesteccentricity tested (Fig. 1). Thus, at the maximumeccentricity tested, 40°, the 0° and 40° conditions werepresented 20° from the front surface normal of the displayand limited pixel foreshortening effects to at most 12%,which was deemed acceptable.
FIGURE 1 — Top view of experimental setup. Fixation is offset from themonitor center to mitigate pixel foreshortening.
Journal of the SID, 2018

3.1 Participants
Five observers, with a letter acuity of 20/20 or corrected to20/20, completed each test. Ages ranged from 25 to 40 yearsold. Two of the observers were completely naive to thehypotheses and the rendering methods.
4 Experiment 1
A core question to understand the differential acuity of thevisual system is determining what types of details the visualsystem is sensitive to at any given location of the retina. Todo this, we needed to probe visual acuity with high spatialspecificity and with relevant imagery for a VR system.Furthermore, motion is inherent in VR systems becauseeven in a static scene, to avoid simulator sickness in VRimagery, objects should be counter-shifted with headrotation to resolve visual–vestibular conflict. In thisexperiment, we use a head restraint and a desktop monitorbut include motion on the screen to ensure that we canproperly showcase temporal issues in foveated rendering.We apply a circular orbit to an otherwise still image inwhich the image translates in a circular path with 30-arcmin diameter and 1-s period without change to itsorientation.
Experiment 1 is divided up into three parts. The first partconsiders different types of foveated rendering algorithms.The second part considers the symmetry of visual sensitivityacross the retina. The third part considers the visibility ofthe boundary between regions of different resolution.
4.1 Experiment 1A
In Experiment 1A, we probe three types of image artifacts atfive different locations in the retina and two different images.
The types of image impairments considered were asfollows:
1. blurring the image to remove the high spatialfrequencies;
2. downsampling the image before shifting so that the re-sampling artifacts are static (stable alias);
3. downsampling after motion leading to resampling on aper frame basis (volatile alias).
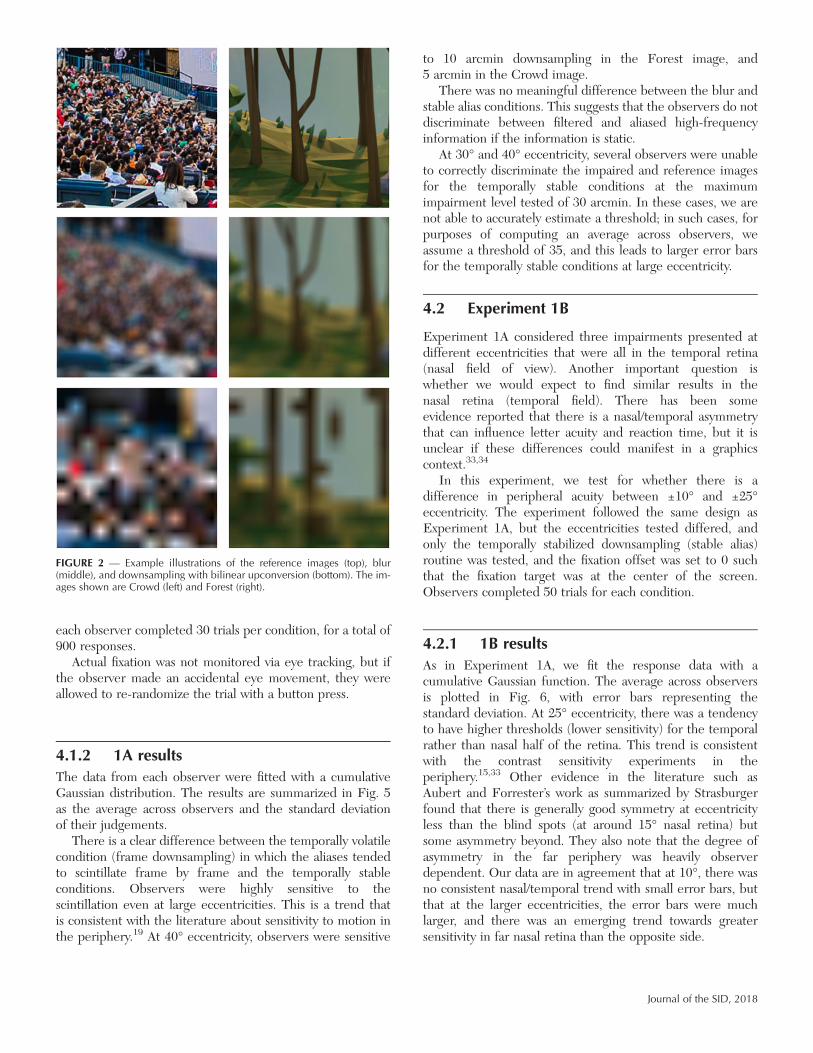
The images to which these impairments are applied areshown in the top panels of Fig. 2. They represent a detail-heavy photograph (Crowd) and a low-polygon renderedscene (Forest). These two classes of imagery, photography,and computer graphics represent two of the most commontypes of imagery viewed in VR devices. With mobilecomputing, current processors make use of lower polygoncounts than are found in desktop class rendering. TheForest image is one such scene that is the landing or home
screen for Google’s VR environment. This image had strongedges. Some of the most common VR applications areYouTube and Google Street View in which people observewide field-of-view imagery of real places that is capturedwith camera systems. To represent this type of image, wechose a photograph of a crowd. This image has high contrastwith high-frequency details. These images each represent adifferent type of challenge for downsampling.
The second row panels show the image with a cylindricalblur applied. This is analogous to a high-end anti-aliasingroutine that will remove the high-frequency details and not besubject to inserting spurious features from undersampling.The image exhibits excellent temporal stability.
The lower images use a nearest neighbor downsampling ofthe original image, followed by upsampling with bilinearinterpolation. This type of scheme can produce a set ofaliased qualities to the images including jaggie edges andbreaks in narrow features. In the second of the threeimpairments described previously, this downsampling isapplied once to the reference image before being translatedin its orbit motion (stable alias). This causes the breaks andblocks in the image to translate coherently with no temporalresampling artifacts. The aliases are registered to the imagecontent and do not vary with time.
The third type of impairment uses the same downsamplingroutine as the second, but it is applied after the image positionhas been updated in its orbit. This leads to a downsamplingbased on a different subset of original pixels. The jaggies,blocks, and breaks will change locations frame to frame. This isillustrated at four time intervals during the orbit in Fig. 3. Inthe experiment, a full orbit occurs once per second, and thedisplay updates 60 frames per second leading to a smoothorbit but with temporal scintillation at edges and features.
4.1.1 MethodsThe task was a forced choice experiment with a reference andtest image being offset vertically by 5°. Each image was256 pixels (subtended 4.2° in the center) such that therewas a 0.8° gap between them. The test/reference pair wasshown with different horizontal shifts from a fixation target.The shifts were 0°, 10°, 20°, 30°, and 40° towards the righthalf of the left eye’s field of view (i.e., temporal retina), andthe right eye was patched. Whether the reference or testappeared on the top or bottom was randomized each trial.The observers were instructed to fixate on the center of theblue target and make a judgment of which of the imageswas unimpaired without making a saccade. An example testscreen is illustrated in Fig. 4. When they could not tell, theywere asked to guess. Based on their response, the level ofdownsampling/blur was staircased via two down one upprocedure (with a clamped range of 2 to 30 arcmin). Therewere a total of 30 combinations of stimuli with fiveeccentricities, three types of impairments, and two differentimages. All the conditions were randomly interleaved, and
Hoffman et al. / Limits of peripheral acuity
each observer completed 30 trials per condition, for a total of900 responses.
Actual fixation was not monitored via eye tracking, but ifthe observer made an accidental eye movement, they wereallowed to re-randomize the trial with a button press.
4.1.2 1A resultsThe data from each observer were fitted with a cumulativeGaussian distribution. The results are summarized in Fig. 5as the average across observers and the standard deviationof their judgements.
There is a clear difference between the temporally volatilecondition (frame downsampling) in which the aliases tendedto scintillate frame by frame and the temporally stableconditions. Observers were highly sensitive to thescintillation even at large eccentricities. This is a trend thatis consistent with the literature about sensitivity to motion inthe periphery.19 At 40° eccentricity, observers were sensitive
to 10 arcmin downsampling in the Forest image, and5 arcmin in the Crowd image.
There was no meaningful difference between the blur andstable alias conditions. This suggests that the observers do notdiscriminate between filtered and aliased high-frequencyinformation if the information is static.
At 30° and 40° eccentricity, several observers were unableto correctly discriminate the impaired and reference imagesfor the temporally stable conditions at the maximumimpairment level tested of 30 arcmin. In these cases, we arenot able to accurately estimate a threshold; in such cases, forpurposes of computing an average across observers, weassume a threshold of 35, and this leads to larger error barsfor the temporally stable conditions at large eccentricity.
4.2 Experiment 1B
Experiment 1A considered three impairments presented atdifferent eccentricities that were all in the temporal retina(nasal field of view). Another important question iswhether we would expect to find similar results in thenasal retina (temporal field). There has been someevidence reported that there is a nasal/temporal asymmetrythat can influence letter acuity and reaction time, but it isunclear if these differences could manifest in a graphicscontext.33,34
In this experiment, we test for whether there is adifference in peripheral acuity between ±10° and ±25°eccentricity. The experiment followed the same design asExperiment 1A, but the eccentricities tested differed, andonly the temporally stabilized downsampling (stable alias)routine was tested, and the fixation offset was set to 0 suchthat the fixation target was at the center of the screen.Observers completed 50 trials for each condition.
4.2.1 1B resultsAs in Experiment 1A, we fit the response data with acumulative Gaussian function. The average across observersis plotted in Fig. 6, with error bars representing thestandard deviation. At 25° eccentricity, there was a tendencyto have higher thresholds (lower sensitivity) for the temporalrather than nasal half of the retina. This trend is consistentwith the contrast sensitivity experiments in theperiphery.15,33 Other evidence in the literature such asAubert and Forrester’s work as summarized by Strasburgerfound that there is generally good symmetry at eccentricityless than the blind spots (at around 15° nasal retina) butsome asymmetry beyond. They also note that the degree ofasymmetry in the far periphery was heavily observerdependent. Our data are in agreement that at 10°, there wasno consistent nasal/temporal trend with small error bars, butthat at the larger eccentricities, the error bars were muchlarger, and there was an emerging trend towards greatersensitivity in far nasal retina than the opposite side.
FIGURE 2 — Example illustrations of the reference images (top), blur(middle), and downsampling with bilinear upconversion (bottom). The im-ages shown are Crowd (left) and Forest (right).
Journal of the SID, 2018

4.3 Experiment 1C
Another common issue discussed in foveated rendering ishow to deal with transition boundaries between zones ofdifferent resolutions. In most implementations discussed, ablend transition is used between these regions to avoid harddiscontinuities. Experiment 1C examined if a hard boundarydirectly exacerbates the visibility of downsampling artifacts,such as creating a temporal flicker at the boundary asobjects shift from one zone to another. To evaluate thevisibility of this zone, we compare the visibility of artifactsthat have been uniformly downsampled and an image in
which 50% has been downsampled and the other half shownat full resolution.
The test method was the same as that in Experiment 1A,but only blur and temporally stabilized downsampleconditions were tested at temporal retinal eccentricities of10° and 20°. As before, the level of downsampling wasstaircased to determine observers’ thresholds. Thesethresholds were measured for the same two images but withand without a transition dividing through the imageexemplified in Fig. 7. When the transition was present, theleft half of the image (closer side to fovea) was drawnwithout resolution reduction, whereas the right side wasdrawn with the reduced resolution. The location of the
FIGURE 3 — Illustration of four phases of the orbit of the reference image and the resampled images with unstable locations ofthe aliasing. Top: reference image, Forest, without downsampling. Bottom: Volatile downsampling after image position update.
FIGURE 4 — Example presentation from Experiment 1A.
Hoffman et al. / Limits of peripheral acuity

transition remained static on the screen, while the imageorbited as before.
4.3.1 1C resultsIf a downsampled image translating behind a boundary wasenough to cause a temporal artifact, we might expect thesubsampled image to have higher artifact visibility than theuniformly blurred condition. We found the opposite. Thedata are shown in Fig. 8. The upper figures show the resultsof the blur downsampling, and the lower plots show the datafor the stable aliased downsampling. The left and rightcolumns present the data from the Crowd and Forestimages respectively. The blue lines represent the data fromthe uniform downsampling, which is analogous toExperiment 1, and the orange lines represent the splitcondition with partial full resolution and partial downsampled.
If a hard transition region introduced a temporal flicker, orwas objectionable, we would expect that it would increase thevisibility of the downsampling and thereby decrease thedownsampling thresholds. We found that instead, theimages with the transition regions could sustain greaterdownsampling before artifacts became visible.
One possible explanation is that the presence of the high-resolution imagery adjacent to the low-resolution regioncreates a crowding effect that makes the loss of detail in thelow-resolution region less noticeable. An alternativeexplanation is that by making the region of the image closer
to the fovea unblurred pushes the region with blur anadditional 2.4° farther into the periphery. We do not havethe data points of the uniform downsampling conditions thatare 2.4° farther to the fovea than the transition conditions,but based on the trends in the plots of Fig. 8, the shifthypothesis is unlikely to completely explain the difference insensitivity. A third alternative is that by replacing half of thelow-resolution image with high-resolution imagery, we havedecreased the area of the low-resolution region, and this lossof area is responsible for decreased sensitivity.
5 Experiment 2: Temporal masking andlatency
For dynamic foveated rendering (foveated region based ongaze estimate) to be a viable solution and be visuallyinnocuous, the system should be able to detect an eyemovement, measure the new gaze location, adjust thefoveated rendering algorithm to render high-resolutionimagery at the new gaze location, render the image data,transmit that data to the display, and update the pixels onthe display before the visual system perceives the low-resolution imagery. Albert and colleagues conductedmeasurements on the minimum system latency of such aloop and found that 50–70 ms would be tolerable.35
To further consider the latency requirements of foveatedrendering, we developed a task to explore how the temporal
FIGURE 5 — Results of Experiment 1A. The downsampling threshold is plotted as a functionof retinal eccentricity. The temporally stable strategies, blur and stable alias, are shown withblue circles and green triangles, respectively. The volatile alias condition is shown as orangesquares. Tolerance for downsampling increases with eccentricity, but tolerance for tempo-rally stable approaches increase much more dramatically.
Journal of the SID, 2018

masking inherent to foveated rendering could place a lower boundon the latency requirement for a dynamic foveated renderedsystem. In the task, there is a blank field before a sequence ofimages is shown in a region. The first N of these images has thedownsampling operation applied before the remaining framesare shown at full resolution (illustrated in Fig. 9).
In this experimental design, saccades and system latencyare irrelevant, and we are only concerned with theminimum duration a downsampled image must be shown inorder for it to be perceived. The display updates at 60 Hz,and thus, each frame has a duration of 16 ms. We ask theobserver after each presentation if they perceived adownsampled image before the high-resolution image.Based on their response, we adjusted the number ofdownsampled frames, N, until they were at 50% likelihood
of reporting that they perceived the downsampled frames.The level of downsampling was fixed at 10 and 20 arcminusing the time-stabilized alias strategy. Twelve percent of thetrials were check trials in which all frames were fullresolution. Each condition consisting of eccentricity, image,and downsampling level was presented 40 times. Observerswere allowed to discard a trial if they were inattentiveduring the presentation. All judgements were madebinocularly during Experiment 2.
5.1 Experiment 2 results
In Fig. 10 we plot the threshold duration (N*16, in ms) as afunction of eccentricity. The thresholds for the 10 and20 arcmin downsampling are shown in green and blue,
FIGURE 7 — Example stimuli showing the transition boundary between a high-resolutionand low-resolution image.
FIGURE 6 — Results from Experiment 1B. The threshold sensitivity to stable aliasdownsampling is plotted as a function of eccentricity. Negative eccentricities indicate nasalretina (temporal visual field), whereas positive eccentricities indicate temporal retina (nasalvisual field). There is good symmetry at small eccentricities with more variability and a trendtowards greater sensitivity in nasal retina at larger eccentricities.
Hoffman et al. / Limits of peripheral acuity

respectively. The right and left plots of Fig. 10 show the datafrom the Crowd and Forest images. For the five individualstested, false positive rates on the check trials neverexceeded 5%. The trends were similar for both imagecontent with the lowest thresholds occurring at loweccentricities and larger downsampling levels.
Although we tested at larger eccentricities, the conditionsand results occurring near fixation are the most informative.This offers some insight into the minimum time needed forthe visual system to perceive an impaired image in thepresence of subsequent masking by the full-resolutionimage. If the visual system makes a saccade to a locationwith downsampling, there will be some duration before thisregion can be drawn with full resolution. This measurementwe make that eliminates the eye movement can offer someguidance for the latency requirements of a foveatedrendering system. The findings, at both downsamplinglevels, that the visual system detected the downsampling if itwas present for ~40 ms or more suggest that if the systemlatency for dynamic foveated rendering were at 40 ms orless, we would expect no apparent lag to be visible. Thiswould hold for aggressive as well as subtle downsampling. Inthis experiment, we used a 60 Hz monitor, and it suggeststhat two frames of the downsampled image (32 ms) post-saccade is not visible, whereas three frames (48 ms) couldbe visible. In practice, with a saccade and its associatedsaccadic suppression, we might expect a slightly moreforgiving latency requirement. These results are consistentwith the conclusions of system level foveated rendering byAlbert and colleagues.35
6 Experiment 3
An issue of image quality that is orthogonal to downsampling butstrongly related to wide field-of-view systems is chromaticaberration. Some of the headsets employ a computationallyexpensive operation known as chromatic aberration correction inwhich each of the color planes on the display are warpedindependently such that after passing through the lens, theyappear superimposed. Other systems have optimized their opticsto minimize the chromatic aberration for a central region of theview and permit some chromatic aberration in the periphery.
In this experiment, we sought to quantify the thresholdmagnitude of chromatic displacement at which the aberrationbecomes visible and characterize this for different eccentricities.We use the same method as Experiment 1, a forced choicetask with two alternatives. One had registered color planes andthe other had opposing horizontal offsets applied to the redand blue color planes. This offset was staircased to determinethe threshold chromatic aberration at which the colordisplacement becomes noticeable. Example stimuli showing thesimulated chromatic aberration are shown in Fig. 11.
6.1 Results
The observer responds which of the options has chromaticshift, and the separation of the blue and red color planes isadjusted by a staircase method as we used in Experiment 1.We fit the psychometric data with a cumulative Gaussianfunction to estimate the 75% correct point for eacheccentricity. The displacement of the red and blue colorplanes is averaged across the five observers and shown inFig. 12. Error bars represent the standard deviation. Witheccentricity, the ability to perceive chromatic aberrationdrops monotonically for both images tested. At the locationsnear the fovea, displacements as small as 2 arcmin wereperceptible. At 30° eccentricity, there was considerablymore variation between observers and for the differentimages, but there was evidence that some displacementsexceeding 20 arcmin would be perceptible.
A typical molded acrylic VR lens introduces chromatic shiftof approximately 1, 8, 19, and 36 arcmin at 1°, 10°, 20°, and30° eccentricity, respectively. In the best case scenario, thislevel of chromatic aberration would be at or just above thethreshold if the observer was fixating at the center of thefield of view (aligned with the lens optical axis). However,typical eye movements would image regions with 19 arcminor more of chromatic shift on the fovea (0° eccentricity).Without digital chromatic aberration correction, chromaticaberrations in such a system would be clearly visible.
7 Discussion
The work we have described on measuring the limits of thevisual system to resolve different artifacts across the retina
FIGURE 8 — Results from Experiment 1C. Upper plots show blurdownsampling, and lower plots show stable aliasing downsampling. Theimage with the transition could consistently sustain more downsamplingthan the uniformly degraded images.
Journal of the SID, 2018

exposes some interesting possible avenues of achievingimproved image quality in VR display systems. With today’ssystems that have pixel sizes that are 6–8 arcmin, a numberof downsampling operations could be expected to visibly
degrade the image, especially those that introduce temporalvolatility. In the case of Experiment 1A, we found that withthe volatile resampling, even at 40° eccentricity,downsampling to 10 arcmin spacing would be noticeable.This suggests that with current pixel sizes, it is possible thateven 2 × 2 downsampling in the periphery could lead tovisible scintillation.
Furthermore, at up to 30° eccentricity, the sensitivity tovolatile resampling at sampling scales on the order of asingle pixel (6 arcmin) indicates that anti-aliasing strategieswould be likely to improve image quality by mitigating some
of the temporal fluctuation. Conversely, foveated renderingapproaches that are optimized to stabilize the pixelintensities, such as world-centric downsampling, could allowsampling spacing of 15 arcmin or more at 30° eccentricity.Even with these temporally stable strategies, minimaldownsampling is possible within the central 20°, whiledisplay pixel size remains at 6 arcmin or greater. As the pixelsizes shrink in next generation displays,21 we could expect tobegin to downsample more aggressively and begin at smallereccentricities.
Another issue we considered is the importance of thetransition region between zones of different resolution. Inmost graphics situations, a hard boundary is highly visible andwould be objectionable. For foveated rendering, this has led tomost implementations using a blending region between thedifferent zones, often with the width proportional to theeccentricity.35 In our experiments, we found that a hardtransition between zones in the periphery was less visible thana uniformly downsampled region; the test patches with thetransition required greater blur before it reached thethreshold for visibility. Earlier, we hypothesized that this effectcould be related to crowding. In most other image context, thepresence of extraneous details near a target decreases the
visibility of the target, and in this case, the presence of high-resolution imagery adjacent to low-resolution imagery couldmake the low-resolution imagery less obvious.
This finding seems to contradict the practical experiencewithfoveated rendering that indicates that a gradual transition isneeded. However, one major factor that is present in realfoveated rendering systems and is absent in this experiment iseye tracking. The transition would be obvious near fixation,and thus, eye tracking failures or latency could benefit from amore gradual transition. It would ensure that at any given eyeposition, things are locally consistent. But, if this were the
FIGURE 9 — Time course for Experiment 2, in which impaired imagery isshown for several frames preceding the full-resolution imagery.
FIGURE 10 — Duration of impaired image before replacement with high quality image. Theblue circles and orange squares represent 10 and 20 arcmin downsampling, respectively.Thresholds hovered near 40 ms in both downsampling conditions.
Hoffman et al. / Limits of peripheral acuity

explanation, the requirement for a gradual transition would bebased on foveal acuity as opposed to peripheral acuity, and wewould expect that an ideal system would not require thesetransition zones.
A second explanation is that with a dynamically foveatedsystem, eye-tracking error could create temporal artifacts atthe boundary between zones similar to what we observed inframe-by-frame resampling in Experiment 1. Consider thecase that the eye is fixated at the center of the display and adynamically foveated zone with best acuity is rendered witha 10° radius about that central location, with downsamplingbeyond. If that 10° radius high-resolution zone was adjustedbased on frame-by-frame eye tracking and the tracking wassusceptible to ±1° of jitter, there would be a 2° borderregion around the high-resolution zone that flickered as itoscillated from being high resolution to low resolution.Applying a spatial transition zone that is at least 2° widecould greatly reduce the contrast of the temporal fluctuationand make any scintillation less objectionable. If trackingjitter were the explanation, one would expect that the
transition zone should be tuned based on the eye-trackerjitter and not on an attribute of peripheral vision.Alternatively, an appropriate temporal filter on the eyetracker signal could ensure that adjustments avoid certainscintillation frequencies that are objectionable. Exploringthese mechanisms of foveated rendering failures attransition regions deserves extended study.
Related to eye tracking is another important questionabout foveated rendering: What should be the maximumlatency of such a system. There are two major ways in whichthe latency could be relevant: with pursuit eye movementsand with saccades. During a pursuit eye movement, a regionin the periphery could be closer to the fovea than ideal bythe product of the pursuit movement velocity and thelatency. Smooth pursuit eye movements can attempt to trackobjects moving at speeds approaching 100°/s, although atthis velocity, the smooth pursuit will be accompanied withcatch up saccades.36 Because of practical field of viewlimitations and pursuit lag, 10–20°/s smooth pursuit is moretypical.36,37 At 20°/s, even a comparatively slow 100 mslatency would only produce 2° of lag, which would be minorif the central full-resolution region were more than 10°radius. In the case of saccades, which can exceed 500°/s,38
even a relatively small latency of a single frame could permitthe fovea of the eye to land on a low-resolution portion ofthe image. The maximum time allowable before this lowresolution can be replaced with a high-resolution renderingis of great interest for the development of the eye trackingand display pipeline.
There are several visual system attributes that could affordsome tolerance for a longer latency loop. One is saccadicsuppression, which has been reported to make the visualsystem insensitive to changes during and in the brief periodfollowing the saccade.39 Another is temporal masking in which
FIGURE 11 — Example stimuli from Experiment 3.
FIGURE 12 — Results of Experiment 3. The threshold displacement between the red andblue color planes is plotted as a function of the eccentricity.
Journal of the SID, 2018
the presentation of imagery immediately following a brieflypresented stimulus prevents the visual system from perceivingthe details.40 In our experiment, we explored the latter effect.In the case of the zero eccentricity condition, we examine thecase where the eye has fixated on a new location that isrendered with low resolution briefly before being re-renderedin high resolution. We also tested peripheral regions to see ifthey would be sensitive to brief presentations at low resolutionbefore being replaced with high-resolution imagery. In theseexperiments, irrespective of eccentricity, we found thataggressively downsampled imagery became noticeable only ifit was on screen for about 40 ms. It is possible that saccadicsuppression could make this even more forgiving such as the50–70 ms suggested by Albert and colleagues.35
The use of molded plastic lenses to create a wide field of viewhas led to more chromatic dispersion than many other imagingsystems. Understanding the sensitivity of the visual system tochromatic aberration can be valuable in determining how tobest optimize the optics and the digital chromatic aberrationcorrection. Our experiment showed that within 10° of thefovea, transverse chromatic aberration is detectable at the scaleof arcminutes and decreases to about half a degree at 30°eccentricity. This follows a similar falloff as the temporallystable downsampling we observed in Experiment 1. Thisproperty of the visual system could enable a foveatedchromatic aberration correction, in which chromatic aberrationcan go uncorrected in the periphery without being perceptible.
In the experiments, all testing was based on two images. Theimages were selected to be representative of content relevantfor VR viewing. The differences in thresholds between thetwo images were fairly small. Conversely, based on theliterature with more traditional acuity tasks, the difference inthresholds is highly task dependent, with performance fallingoff much more rapidly for hyperacuity and landolt C whileonly gradually falling off for letter recognition andidentification.15 Furthermore, in these traditional acuitytasks, decreasing the stimulus contrast has a dramatic impacton the falloff with eccentricity. With continuous toneimagery, it is difficult to convert the specific imageimpairments into the primitives and contrast levels that havebeen tested in the literature. But based on the differencebetween the fovea and peripheral conditions, the sensitivityto the static artifacts (such as blur and stabilized aliasing) hadfalloff behavior that was relatively gradual and more similarto that of letter acuity than hyperacuity.
The work from these experiments can inform us aboutwhere we could best devote additional computation powerboth with current displays as well as future display systems.With today’s systems, in the central 30° radius of the retina,the visual system is highly sensitive to temporal artifacts thatare less than the size of a single 6 arcmin pixel. This suggeststhat anti-aliasing used in the rendering is valuable over alarge portion of the retina. We could expect a brute forcefoveated rendering approach with today’s pixel sizes to createvisible artifacts if used in the central 60° cone. Beginning at a20° radius, some foveated rendering is possible if techniques
are used to minimize the temporal volatility. Also, with thecurrent pixel size, chromatic registration should ideally haveless than a 3 arcmin offset in the central 20° but withincreasing tolerance at 30° and beyond.
When the pixel size approaches the 1-arcmin target in whichit is retinally limited at the fovea, aggressive downsampling willbe possibly starting at only a few degrees and is limitedprimarily by the gaze tracking accuracy and latency.
Our results on temporal masking of low-resolution imagerywith high-resolution imagery suggest that latency of about40 ms would not be perceptible, regardless of the location inthe retina. This finding is encouraging since if there were60 Hz eye tracking, it could permit at least one frame forcapturing the eye position post-saccade and one frame of thedisplay system to be re-rendered and drawn to the displaypanel. The accuracy of the eye tracking is not something thatwe explicitly studied, but based on the results of theresolution boundary experiment, it seems likely that erraticgaze estimation could lead to a volatile resampling artifact inthe periphery with sensitivity levels higher than a stabledownsampling. Based on this hypothesis, gaze estimationinstability could require a broader transition zone andpossibly slightly expanded foveal zone.
Acknowledgments
We are grateful to the review and advice of our colleaguesHaomiao Jiang, Peter Milford, and Nikhil Balram.
References1 S. M. Anstis, “A chart demonstrating variations in acuity with retinal posi-tion,” Vision Res. 31, 14, No. 7, 589–592 (1974).
2 B. Bastani et al., “Foveated pipeline for AR/VR head-mounted displays,”Inform. Displays, 33, No. 6, 14–19 (2017).
3 C. Anthes et al., State of the art of virtual reality technology. AerospaceConference, 2016 IEEE (pp. 1–19), (2016).
4 C. J. Lin and B. H. Woldegiorgis, “Interaction and visual performance instereoscopic displays: a review,” J. Soc. Inf. Disp., 23, No. 7, 319–332(2015).
5 P. Labatut et al., Fast level set multi-view stereo on graphics hardware. 3DData Processing, Visualization, and Transmission, 3 (2006).
6 S. Seitz et al., A comparison and evaluation of multi-view stereo recon-struction algorithms. IEEE Computer Society Conference on ComputerVision and Pattern Recognition, 1, (2006).
7 B. Karis, High-quality temporal supersampling. ACM SIGGRAPHCourses, 10, (2014).
8 K. Vaidyanathan et al., Coarse pixel shading. HPG ’14 Proceedings of HighPerformance Graphics, 9–18, (2014).
9 C. Wyman and M. McGuire, Hashed alpha testing. I3D, 1–7, (2017).10 M. Weier et al., “Foveated real-time ray tracing for head-mounted dis-
plays,” Eurographics, 35 (2016).11 Y. S. Pai et al., “GazeSim: simulating foveated rendering using depth in
eye gaze for VR,” SIGGRAPH (2016).12 B. Guenter et al., “Foveated 3D graphics,” ACM Trans. Graph. (TOG), 36
(2012).13 A. Patney et al., “Towards foveated rendering for gaze-tracked virtual re-
ality,” ACM Trans. Graph. (TOG), 35 (2016).14 A. T. Duchowski and A. Coltekin, “Foveated gaze-contigent displays for
peripheral LOD management, 3D visualization, and stereo imaging,”ACM Trans. Multimedia Comp., Comm. Appl. (TOMM), 24 (2007).
Hoffman et al. / Limits of peripheral acuity

15 H. Strasburger et al., “Peripheral vision and pattern recognition: a review,”J. Vision, 11 (2011).
16 J. Lubin, A human visual system model for objective picture quality mea-surements. International broadcasting conference (IBC), 498–503 (1997).
17 L. S. Stone et al., “Linking eyemovements and perception,” J. Vision, 3 (2003).18 D. M. Hoffman and D. Stolitzka, “A new standard method of subjective
assessment of barely visible image artifacts and a new public database,”J. Soc. Inf. Disp., 22, No. 12, 631–643 (2014).
19 S. P. McKee and K. Nakayama, “The detection of motion in the peripheralvisual field,” Vision Res., 24, No. 1, 25–32 (1984).
20 E. Liu, “Lens matched shading and unreal engine 4 integration part 1,”On-line, published Jan 18, (2017). https://developer.nvidia.com/lens-matched-shading-and-unreal-engine-4-integration-part-1, Accessed 23-Jan-2018.
21 C. Vieri et al., “An 18 megapixel 4.3 ″1443 ppi 120 Hz OLED display forwide field of view high acuity head mounted displays,” J. Soc. Inform.Disp., 26, No. 5, 314–324 (2018).
22 M. Fujita and T. Harada, “Foveated real-time ray tracing for virtual realityheadset,” Light Transp. Entertainment Res. (2014).
23 A. Vlachos. Advanced VR rendering performance. Game Developers Con-ference, (2016).
24 S.Hall, and J.Milner-Moore.Higher res without sacrificing quality and otherlessons from playstation VR worlds. Game Developers Conference, (2017).
25 A. T. Bahill, “Most naturally occurring human saccades have magnitudesof 15 deg or less,” Invest. Ophthalmol., 14, 468–469 (1975).
26 M. Haynes and T. Starner, “Effects of lateral eye displacement on comfortwhile reading from a video display terminal,” Proc. ACM on Interact., Mo-bile, Wearable Ubiquit. Technol., 1, No. 4, 138 (2018).
27 W. Mason, “SMI showcases foveated rendering with new 250Hz eyetracking kit,” Online, published Jan, (2016). https://uploadvr.com/smi-eye-tracking-foveated-rendering-exclusive/, Accessed 18-Oct-2017.
28 T. Lindeberg, Concealing rendering simplifications using gaze contingentdepth of field. Master’s Thesis, Royal institute of technology, school ofcomputer science and communication, (2016).
29 M. Woo et al., “OpenGL programming guide, 2nd edition,” OpenGL Ar-chitecture Review Board, Addison-Wesley, 338–362, (1998).
30 H. Hoppe, Progressive meshes. In Proceedings of the 23rd annual confer-ence on Computer graphics and interactive techniques (pp. 99–108).ACM, (1996).
31 E. Turner et al., Phase-aligned foveated rendering for virtual reality head-sets. IEEE VR, the 25th IEEE Conference on Virtual Reality and 3D UserInterfaces, (2018).
32 M. Stengel et al., “Adaptive image-space sampling for gaze-contingentreal-time rendering,” Comp. Graph. Forum, 35, No. 4, 129–139 (2016).
33 L. O. Harvey Jr. and E. Pöppel, “Contrast sensitivity of the human retina,”Optom. Vis. Sci., 49, No. 9, 748–753 (1972).
34 S. J. Anderson et al., “Human peripheral spatial resolution for achromaticand chromatic stimuli: limits imposed by optical and retinal factors,”J. Physiol., 442, No. 1, 47–64 (1991).
35 R. Albert et al., ACM Trans. Appl. Percept. (TAP), 14, No. 4, 25 (2017).36 C. H. Meyer et al., “The upper limit of human smooth pursuit velocity,”
Vision Res., 25, No. 4, 561–563 (1985).37 H. Collewijn and E. P. Tamminga, “Human smooth and saccadic eye
movements during voluntary pursuit of different target motions on differ-ent backgrounds,” J. Physiol., 351, No. 1, 217–250 (1984).
38 R. W. Baloh et al., “Quantitative measurement of saccade amplitude, du-ration, and velocity,” Neurology, 25, No. 11, 1065–1065 (1975).
39 A. Thiele et al., “Neural mechanisms of saccadic suppression,” Science,295, No. 5564, 2460–2462 (2002).
40 J. T. Enns and V. Di Lollo, “What’s new in visual masking?” Trends Cogn.Sci., 4, No. 9, 345–352 (2000).
David Hoffman graduated from the University ofCalifornia San Diego with a degree in Bioengineer-ing and received his PhD in Vision Science fromthe School of Optometry at the University of Cali-fornia Berkeley. He has since worked with severalcompanies on improving displayed image qualitythrough identifying, characterizing, and mitigatingdegradation and distortion sources throughout thesoftware and hardware acquisition and displaypipeline. Since 2017, he is an applied vision re-searcher at Google working on creating the displaysubsystem and imaging pipelines that facilitate ter-
rific head worn display experiences. A major part of this research is discov-ering how the limits of the visual system dictate which technologicaladvances will have the strongest perceptual impact. He is an associate ed-itor of the Journal of Society for Information Display and chairs the appliedvision subcommittee of SID Display Week.
Zoe Meraz graduated from the University of Ne-vada, Reno with a degree in Biochemistry and Mo-lecular Biology in 2015. She has since worked inhuman factors and eye tracking at a startup in Mil-pitas and now focuses on visual human factors atGoogle Daydream.
Eric Turner is a software engineer at Google Day-dream, focusing on foveated rendering techniquesand 3D reconstruction. Eric received his BS inElectrical and Computer Engineering from Carne-gie Mellon University in 2011, and his MS andPhD in Electrical Engineering and Computer Sci-ences from the University of California Berkeleyin 2013 and 2015, respectively. His backgroundis focused in 3D reconstruction and computationalgeometry, including working as the CTO and co-founder Indoor Reality, Inc. and working on rapid3D modeling of building interiors.
Journal of the SID, 2018