limits of off-line pd measurement to assess quality and ... 4.4 w ladstaetter.pdf · quality and...
TRANSCRIPT
Limits of off-line PD measurement to assess quality and condition of HV insulation windings for rotating machinesWerner Ladstätter, Insucon May 2017

Accident in power plant Rodund II / Austria in 2009

3 www.andritz.com
Predictive maintenance and residual life time calculation
FKM Guideline, “Analytical strength assessment of components in mechanical engineering”, 6th revised edition, 2012
Total degree of utilisation for critical regions Service life time: 40 years 5 Start/Stop cycles per day 1 load rejection / month
0.10.20.30.40.50.60.70.80.90

Residual life time predictionof a HV winding

Residual life time of high voltage windingsStatistics of hydro generator failures
Source: Cigre Working Group A1.10 „Survey of Hydro generator Failures“
Statistic was made in 7 countries with 1199 Hydro generatorsFailures are if generator> 10 MVA> 10 days outage> 10 years in operation
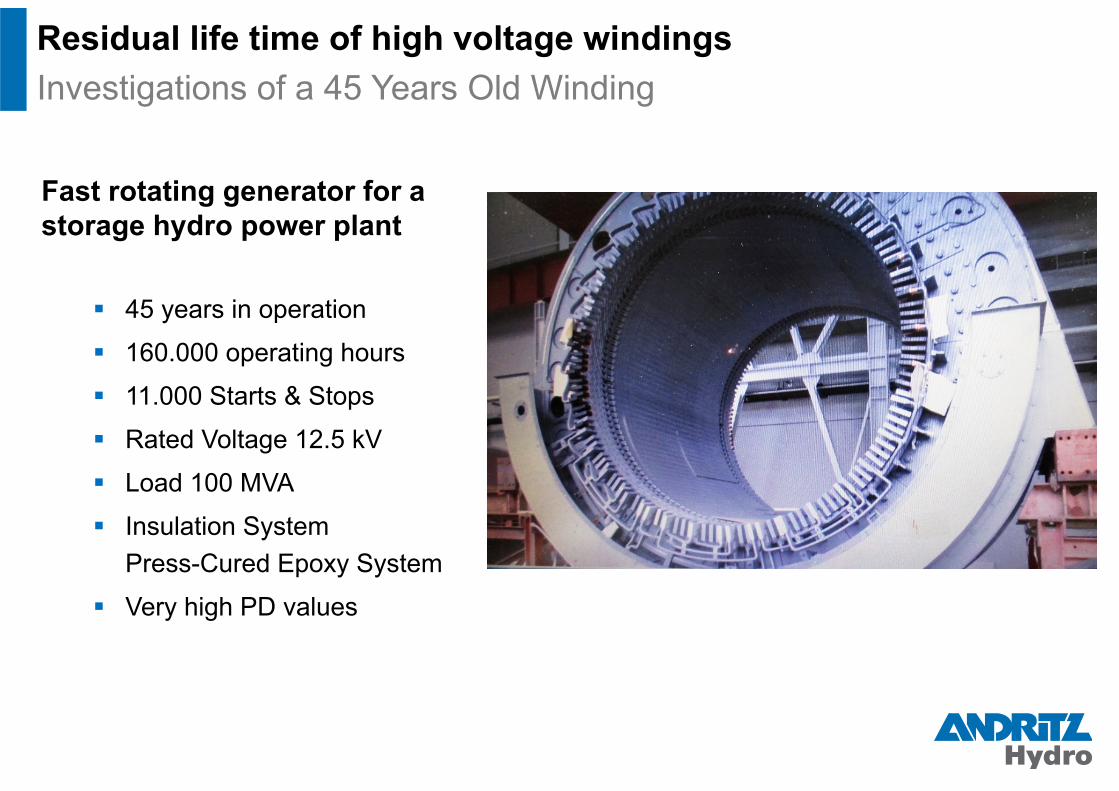
Residual life time of high voltage windingsInvestigations of a 45 Years Old Winding
Fast rotating generator for a storage hydro power plant
45 years in operation
160.000 operating hours
11.000 Starts & Stops
Rated Voltage 12.5 kV
Load 100 MVA
Insulation SystemPress-Cured Epoxy System
Very high PD values
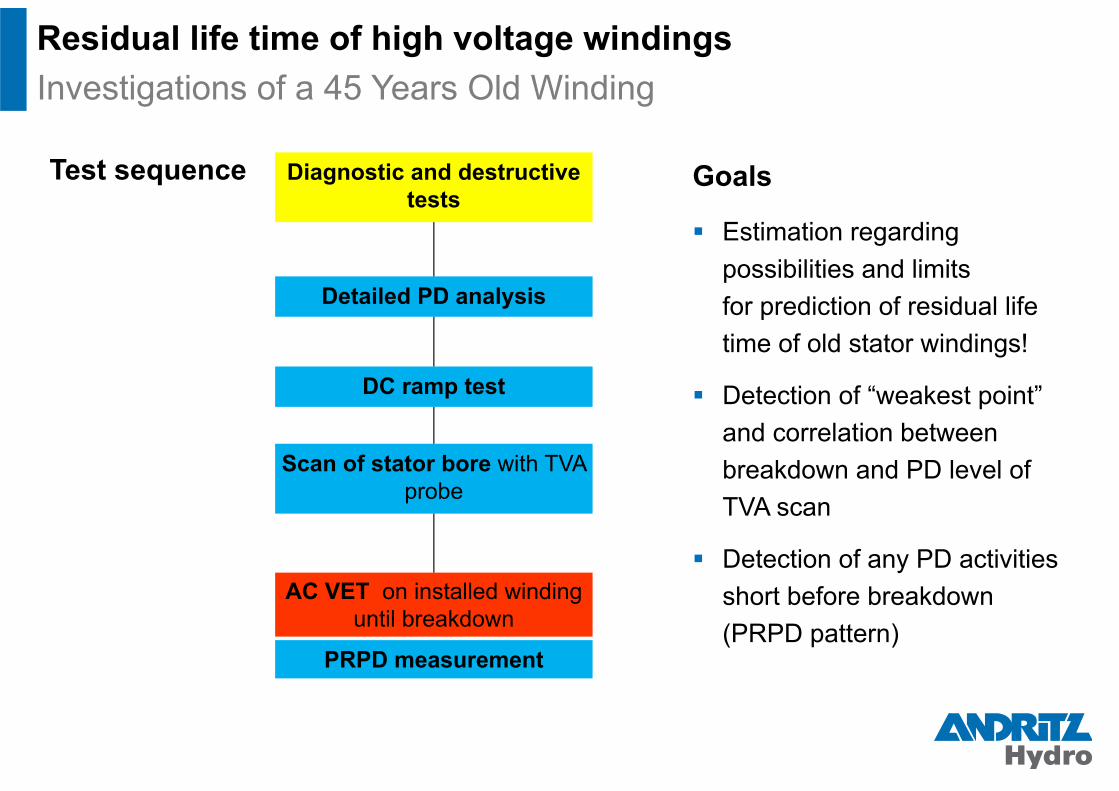
Test sequence
Residual life time of high voltage windingsInvestigations of a 45 Years Old Winding
Diagnostic and destructive tests
AC VET on installed winding until breakdown
Detailed PD analysis
Scan of stator bore with TVA probe
DC ramp test
PRPD measurement
Goals
Estimation regarding possibilities and limits for prediction of residual life time of old stator windings!
Detection of “weakest point” and correlation between breakdown and PD level of TVA scan
Detection of any PD activities short before breakdown (PRPD pattern)
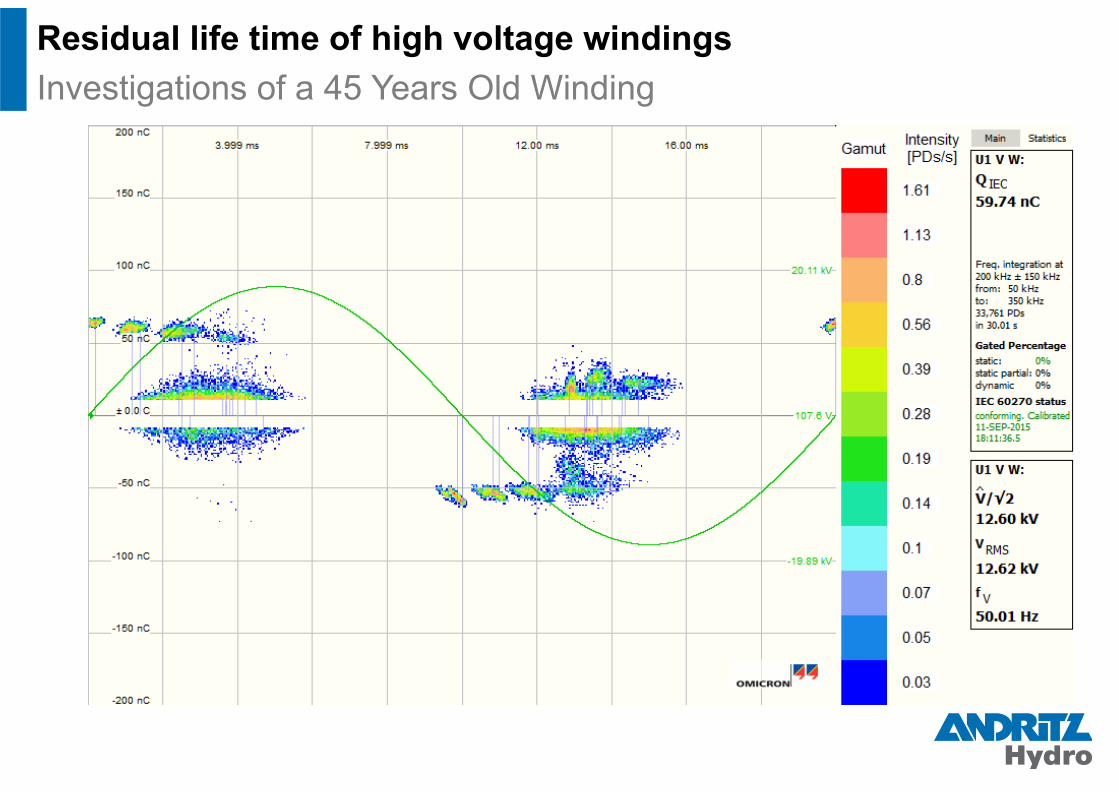
Residual life time of high voltage windingsInvestigations of a 45 Years Old Winding

Residual life time of high voltage windingsInvestigations of a 45 Years Old Winding
DC Ramp Test up to 32 kV DC performed before AC HIPOT Test
Charging current / UVW on HVRamp Rate: 2.5 kV / min.
Absolute normal behaviour up to 1.5 x 1.7 Un
No signs for serious insulation defects of a looming breakdown recognizable
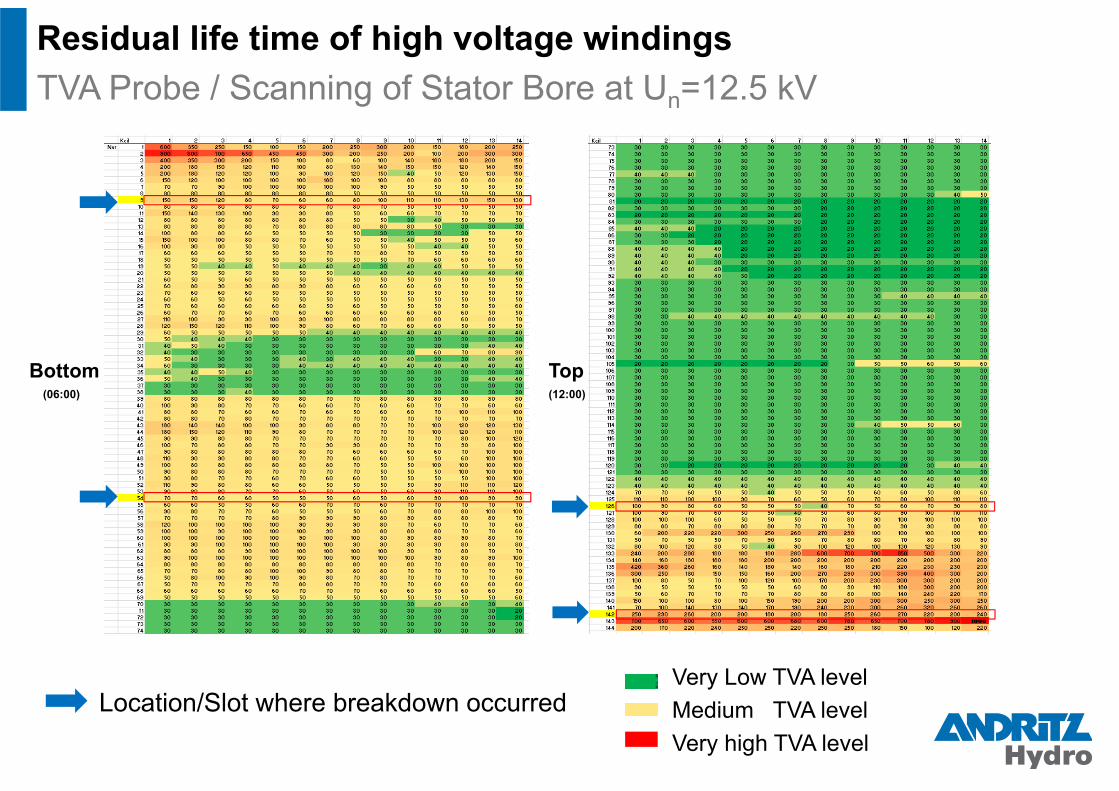
Residual life time of high voltage windingsTVA Probe / Scanning of Stator Bore at Un=12.5 kV
Location/Slot where breakdown occurredVery Low TVA levelMedium TVA levelVery high TVA level
Bottom(06:00)
Top(12:00)

Residual life time of high voltage windingsBreakdown statistic after 20 hours at 1.5 Un (18.75kV)
0,000 0,001 0,010 0,100 1,000 10,000 100,0001
11
21
31
41
51
61
71
81
91
101
111
121
131
141
Test Duration [hours]
Top
Bar
s [S
lot N
umbe
r]
Time to Breakdown
11 hours
3 seconds
97 seconds
2 hours
Two very critical bars Two bars with
“appropriate” residual life time
All 4 - top bars (no bottom)
284 bars with relatively good residual life expectancy for sufficient operational reliability

Residual life time of high voltage windingsPRPD Pattern / PD Scanning up to breakdown
Measurement Range : +- 500 nC
Measurement Range : +- 500 nC
Measurement Range : +- 500 nC
4 seconds before breakdown
2 seconds before breakdown
No significant change of PD pattern before breakdown
PD activity was continuous monitored over the whole test duration of 20.5 hours
At all other 3 breakdowns – not any indication of breakdown by PRPD recognizable
Even if the weak point is close to the line end (as in this case) there was no indication by PRPD measurement
PRPD pattern just before breakdown
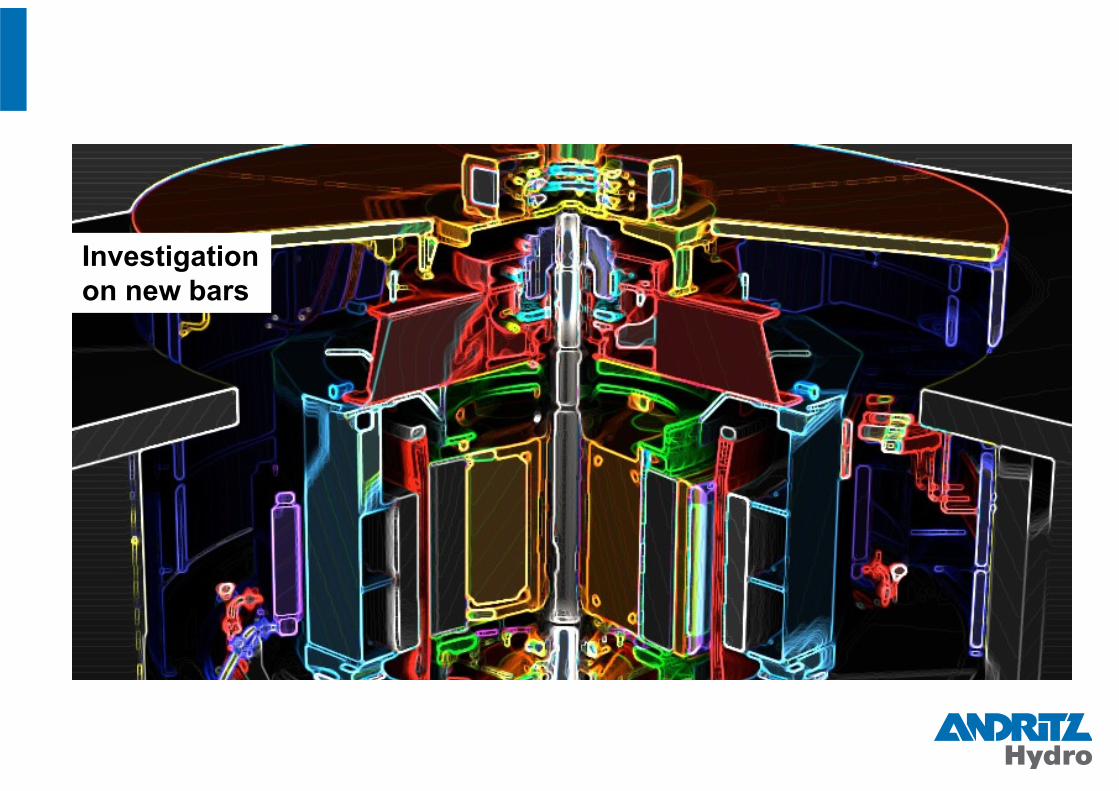
Investigationon new bars
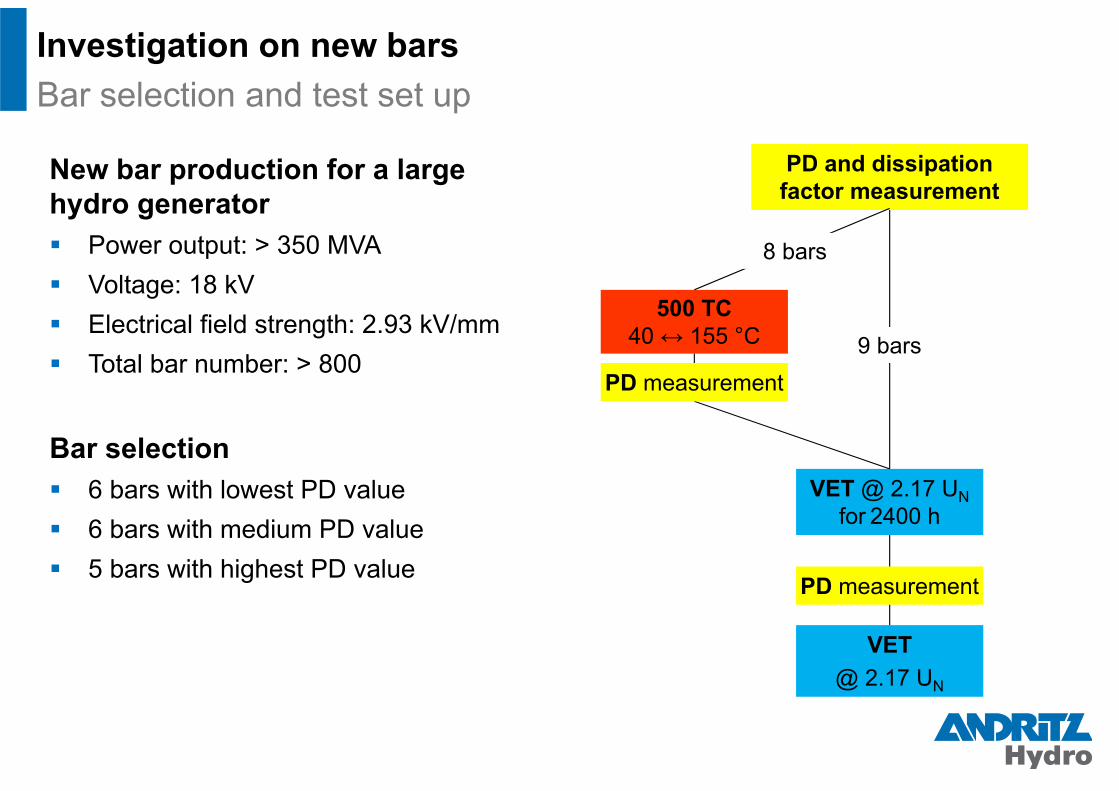
Investigation on new barsBar selection and test set up
New bar production for a large hydro generator Power output: > 350 MVA Voltage: 18 kV Electrical field strength: 2.93 kV/mm Total bar number: > 800
Bar selection 6 bars with lowest PD value 6 bars with medium PD value 5 bars with highest PD value
PD and dissipation factor measurement
500 TC 40 ↔ 155 °C
PD measurement
VET @ 2.17 UN for 2400 h
VET@ 2.17 UN
8 bars
9 barsPD measurement
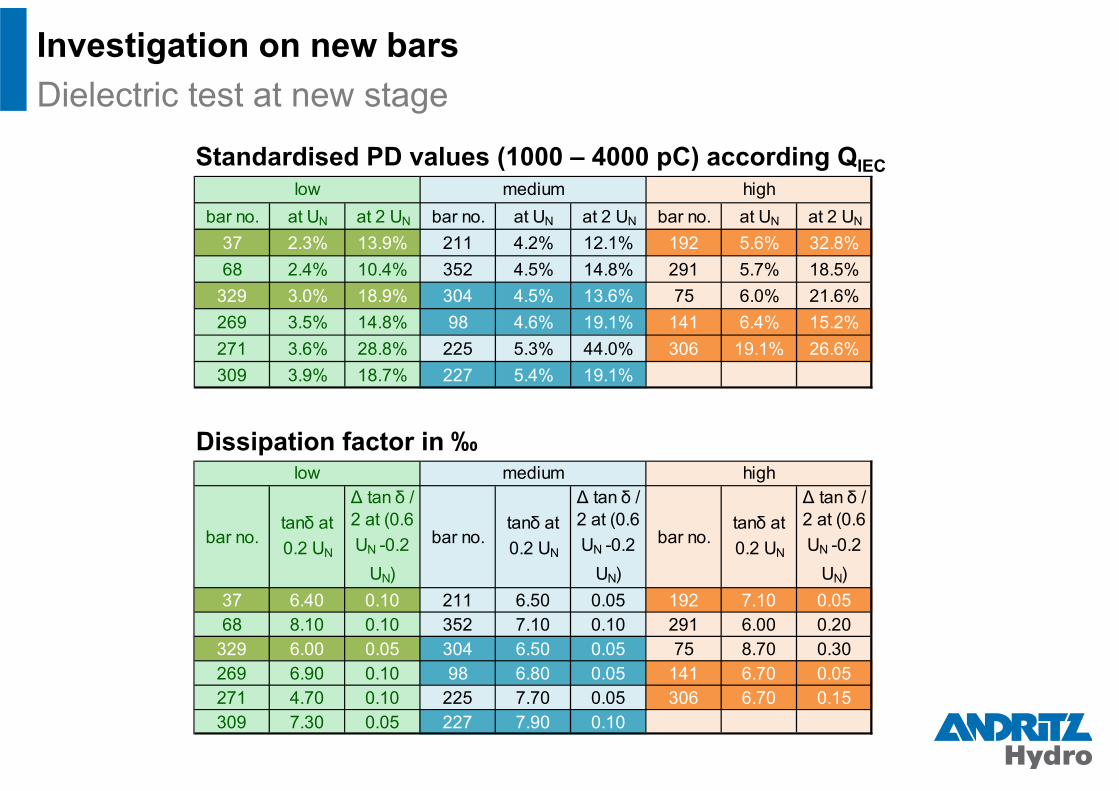
Investigation on new barsDielectric test at new stage
Standardised PD values (1000 – 4000 pC) according QIEC
bar no. at UN at 2 UN bar no. at UN at 2 UN bar no. at UN at 2 UN
37 2.3% 13.9% 211 4.2% 12.1% 192 5.6% 32.8%68 2.4% 10.4% 352 4.5% 14.8% 291 5.7% 18.5%
329 3.0% 18.9% 304 4.5% 13.6% 75 6.0% 21.6%269 3.5% 14.8% 98 4.6% 19.1% 141 6.4% 15.2%271 3.6% 28.8% 225 5.3% 44.0% 306 19.1% 26.6%309 3.9% 18.7% 227 5.4% 19.1%
low medium high
bar no.tanδ at 0.2 UN
∆ tan δ / 2 at (0.6 UN -0.2
UN)
bar no.tanδ at 0.2 UN
∆ tan δ / 2 at (0.6 UN -0.2
UN)
bar no.tanδ at 0.2 UN
∆ tan δ / 2 at (0.6 UN -0.2
UN)37 6.40 0.10 211 6.50 0.05 192 7.10 0.0568 8.10 0.10 352 7.10 0.10 291 6.00 0.20
329 6.00 0.05 304 6.50 0.05 75 8.70 0.30269 6.90 0.10 98 6.80 0.05 141 6.70 0.05271 4.70 0.10 225 7.70 0.05 306 6.70 0.15309 7.30 0.05 227 7.90 0.10
low medium highDissipation factor in ‰

Investigation on new barsAgeing via thermal cycling
Standardised PD values before and after thermal cycling according QIEC
PD range bar no. at UN at 2 UN
37 2.3% 13.9%329 3.0% 18.9%304 4.5% 13.6%98 4.6% 19.1%
227 5.4% 19.1%192 5.6% 32.8%141 6.4% 15.2%306 19.1% 26.6%37 13.0% 14.5%
329 14.8% 22.9%304 21.8% 31.4%98 7.4% 16.9%
227 5.5% 12.6%192 21.3% 20.4%141 12.0% 12.5%306 17.9% 14.0%
after cycling
low
medium
high
status of measurement
before cycling
low
medium
high
PD values at UN and before TC are recognisable lower High voltage system appears as TC and 2*UN resistant
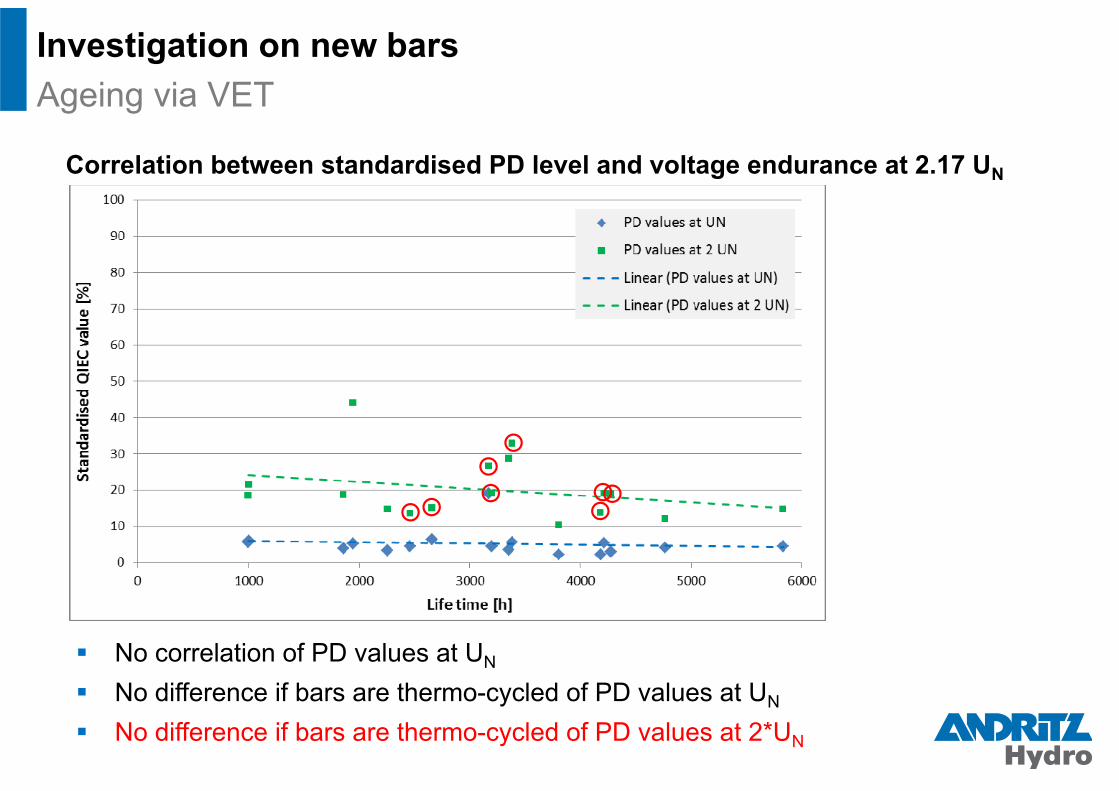
Investigation on new barsAgeing via VET
Correlation between standardised PD level and voltage endurance at 2.17 UN
No correlation of PD values at UN
No difference if bars are thermo-cycled of PD values at UN
No difference if bars are thermo-cycled of PD values at 2*UN

Investigation on new barsResidual life time after thermal and electrical ageing
Standardised PD values according QIEC after ageing for 2400 h at 2.17 Un
All 8 TC bars survived 2400 h in the VET
PD values for TC bars are remarkable higher
bar no. at UN at 2 UN bar no. at UN at 2 UN bar no. at UN at 2 UN
37 417% 837% 211 78% 183% 192 742% 829%68 21% 50% 352 37% 156% 291
329 294% 564% 304 580% 3626% 75269 98 564% 1769% 141 292% 466%271 19% 47% 225 306 304% 1031%309 227 275% 569%
low medium high
Correlation between standardised PD levels and residual life time aged at 2.17 UN after pre-ageing of 2400 h at 2.17 UN
No correlation of TC bars
Long residual life time for 83% of all bars

Residual life time of high voltage windingsSummary
Even slot resolved local PD measurement (TVA probe) could not reveal any correlation between PD level and residual life time for a 45 year old hydro generator
If 4 weakest bars could have been detected and removed more than 10 years of operation is statistically possible, but no state of the art detection method available
A simple low, medium and risky winding judgement based on PD levels seems OK
PD levels after new bar production do not give any correlation to thermal and electrical lifetime
TC in laboratory and temperature in operation increase the average VE life time
Residual life time estimation (based on PD) after 2400 h VE and 500 TC is not possible with new bars from production – same as for old bars after 45 years of real operation
Andritz Hydro will continue to find a way to estimate better residual life of HV windings
Request to RR and other VPI manufactures to start a similar investigation for comparison