lim thesis final - university of texas at austin
TRANSCRIPT
DISCLAIMER:
This document does not meet the current format guidelines of
the Graduate School at The University of Texas at Austin.
It has been published for informational use only.

Copyright
by
HyunJoo Lim
2018

The Thesis Committee for HyunJoo Lim Certifies that this is the approved version of the following Thesis:
Digital Engagement in Social Media:
Likes as a Predictor of Brand Value
APPROVED BY
SUPERVISING COMMITTEE:
Gary Wilcox, Supervisor Angeline Close Scheinbaum
Digital Engagement in Social Media: Likes as a Predictor of Brand
Value
by
HyunJoo Lim
Thesis
Presented to the Faculty of the Graduate School of
The University of Texas at Austin
in Partial Fulfillment
of the Requirements
for the Degree of
Master of Arts
The University of Texas at Austin
May 2018

iv
Acknowledgements
I would like to thank Dr. Gary B. Wilcox for his expert advice and encouragement
throughout the development of this thesis, as well as Dr. Angeline Close Scheinbaum for
her guidance.

v
Abstract
Digital Engagement in Social Media: Likes as a Predictor of Brand
Value
HyunJoo Lim, M.A.
The University of Texas at Austin, 2018
Supervisor: Gary Wilcox
This study suggests indicators of consumers’ digital engagement with brand-
related social media contents as a contemporary measure of brand equity and examines
its relationship with brand value. The study analyzes this relationship based on the data
collected from January 2016 to December 2017 on US brand performances, advertising
spending, and Facebook interaction devices including “Likes” as well as “the number of
users talking about this brand”. The results show that the total number of “Likes” a
brand’s official fan page receives on Facebook has a statistically significant positive
impact on the brand’s value. These findings not only support the consensus on brand
equity as a driver of brand value, but also successfully denote consumer engagement
measures as indicators of brand equity.
vi
Table of Contents
List of Tables .......................................................................................................................... ix
List of Figures .......................................................................................................................... x
Chapter 1: Introduction ......................................................................................................... 11
Objective ....................................................................................................................... 12
Chapter 2: Literature Review ................................................................................................ 13
Defining Brand Valuation............................................................................................ 13
Determinants of Brand Value ......................................................................... 15
Brand Equity as a Driver of Brand Value ................................................................... 16
Elements of Brand Equity ............................................................................... 18
Consumer Engagement ................................................................................................ 20
Digital Engagement and Brand Equity ........................................................... 22
Digital/Consumer Engagement on Social Media........................................... 23
Hypotheses .................................................................................................................... 24
Chapter 3: Methods ............................................................................................................... 26
Data ............................................................................................................................... 26
Dependent Variables........................................................................................ 26
Independent Variable I: Facebook Social Impacts ........................................ 28
Independent Variable II: Advertising Spending ............................................ 32
Data Analysis................................................................................................................ 35
vii
Chapter 4: Findings ............................................................................................................... 36
Chapter 5: Discussion ............................................................................................................ 39
Digital Engagement and Brand Value ........................................................................ 39
Limitations and Future Recommendations ................................................................. 41
References .............................................................................................................................. 43
viii
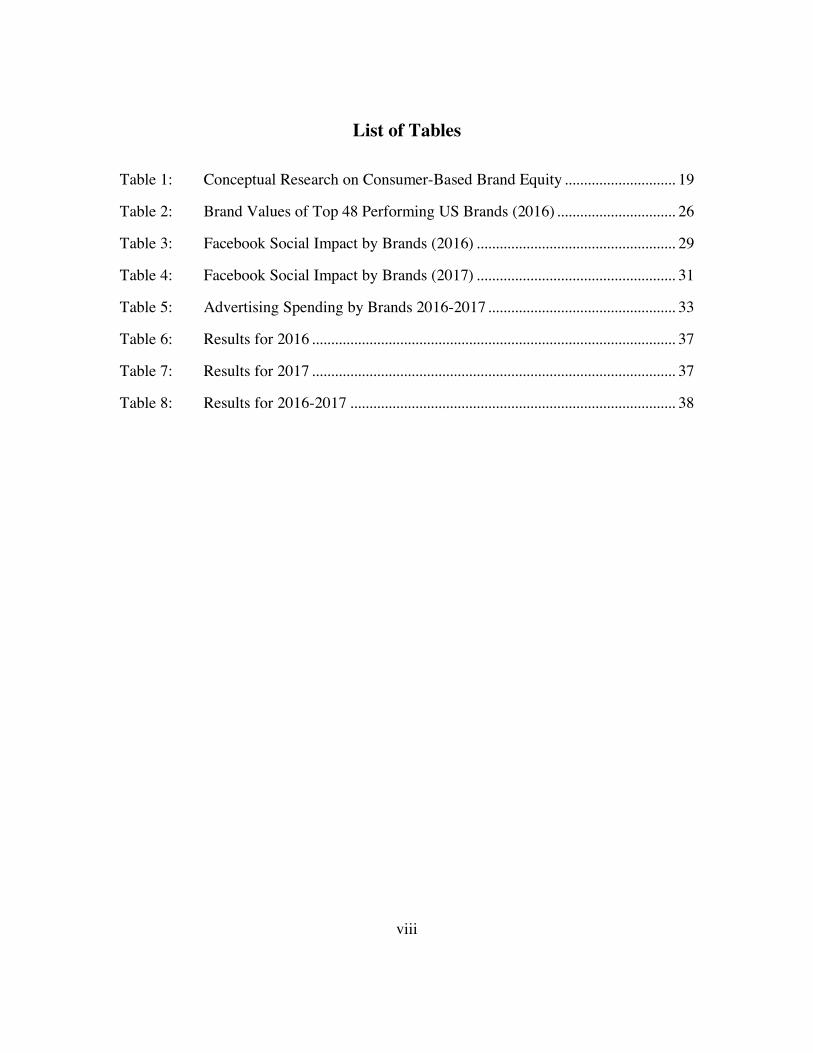
List of Tables
Table 1: Conceptual Research on Consumer-Based Brand Equity ............................. 19
Table 2: Brand Values of Top 48 Performing US Brands (2016) ............................... 26
Table 3: Facebook Social Impact by Brands (2016) .................................................... 29
Table 4: Facebook Social Impact by Brands (2017) .................................................... 31
Table 5: Advertising Spending by Brands 2016-2017 ................................................. 33
Table 6: Results for 2016 ............................................................................................... 37
Table 7: Results for 2017 ............................................................................................... 37
Table 8: Results for 2016-2017 ..................................................................................... 38

ix
List of Figures
Figure 1: Levels of Brand Value ..................................................................................... 15
Figure 2: Different Perspectives on the Meaning of Brand Equity .............................. 17
Figure 3: Consumer-Based Equity Conceptual Relationships ...................................... 21
1
Chapter 1: Introduction
Over the last few decades, the world has witnessed a rapid economic growth in
many regions. This has led to greater amount of disposable income for households,
thereby, boosting their demands for goods and services. Consumers are now exposed to
unprecedented variety of goods and services, which consequently, increased competition
among businesses. In such intense competition, a company cannot succeed by simply
providing a product that will meet consumers’ demands, but by creating value significant
enough for consumers to want to return to the brand for their next purchases. This logic
partly explains the concept of brand equity, which is broadly defined by Leuthesser
(1988) as the relationships and actions associated with a company and their stakeholders
that allow the brand to generate larger profitable values than it could without the brand
name. Consumers’ digital engagement with brands is thought to relate to brand equity.
From a consumer-centric standpoint, digital engagement is “an online behavior
resulting from a consumer’s thoughts, emotional connection, and intrinsic motivation to
interact and cooperate with a brand or its community members in a digital, mobile, or
social media setting” (Scheinbaum, 2016, p. 2). Digital engagement is “characterized by
thoughts, emotional connections and/or consumer actions (e.g., “likes”, clicks, reactions,
comments, shares, check-ins, posts) in the context of mobile and/or social media”
(Scheinbaum, 2016, p. 2).
In respect to digital engagement, a brand can build positive brand equity by
establishing a relationship directly with consumers through exposure and interaction
(Rodgers & Thorson, 2018). It is the ubiquity of social media which helps brands build
unique relationship with consumers that cannot be addressed by the traditional channels.
This means that the brands now have greater potential to reach target audiences for less
2
cost because of content-sharing behavior and popularity of social influencers as brand
ambassadors. However, in terms of social media engagement, there are only a limited
number of studies available to measure the impact of consumer-driven brand equity on
the company’s performances (e.g., Barger, Peltier, & Schultz, 2016; Hollebeek, Glynn, &
Brodie, 2014).
OBJECTIVE
The purpose of this study is to examine various indicators of consumers’ digital
engagement with brand-related social media activities as measures of brand equity,
thereby generating additional brand value. Hence, the research question is: What is the
relationship between digital engagement (e.g., likes, social media brand mentions) and
brand valuation? In order to answer this question, this paper first explores the concept of
brand value, brand equity, and digital engagement as the major constructs.
This paper is organized as follows. First, the link between these notions and their
applicability on social media is discussed. Based on the literature, three hypotheses are
introduced. The second section introduces and examines the dependent variable (brand
values) and independent variables (Facebook social impacts; advertising spending) that
were collected to serve as a database to test the hypotheses. The last two chapters analyze
the findings from the previous chapters and elaborate on the limitations along with
recommendations for the future studies.

3
Chapter 2: Literature Review
The focus of this paper is to examine the effect of consumer engagement
measures on brand value creation in the current market, especially in social media setting.
Therefore, this chapter is divided into three sections to review relevant constructs: brand
value, brand equity, and consumer engagement.
The first section presents the notion of brand value by introducing various
definitions that has been stemmed from different disciplines and affiliated brand
valuation mechanisms. In the sub-section that follows, a number of factors that may
influence the process of brand valuation is identified. The second section focuses on the
idea of brand equity as a major construct that influences brand value. In this process,
diverse dimensions of brand equity are introduced by reviewing the previous literatures.
Based on the attributes of brand value and brand equity established in the previous
sections, the last section introduces the concept of consumer engagement as a new
measure of brand equity.
DEFINING BRAND VALUATION
For many years, brand reports published by financial analysts have been referred
to when trying to determine the worth of a brand. These reports provide a list of brands
called the league tables which rank the brands according to their financial values, often
under the title of “best performing brands”. For related stakeholders in the market – from
consumers, employees, managers to investors – these tables serve as a useful benchmark
that reflects a certain kind of image associated with the brand, as well as other
performance estimations (Raggio & Leone, 2009; Reyneke, Abratt, & Bick, 2014). It is
also important to note that the brand valuation does not only demonstrate the productivity

4
of the brands, but it is too a source of motivation where different elements of valuation
process can positively affect brands’ financial performances (Raggio & Leone, 2009).
To fully understand what brand value is and how it is generated, the concept first
needs to be approached from an economic perspective. A brand can generate additional
value when its consumers recognize the businesses’ efforts to differentiate the brand’s
offerings (Doyle, 2001; Reyneke et al., 2014; Salinas, 2009). In fact, the ability to
differentiate the brand is a key to increase the level of demand for its goods and services
in the market as elaborated in Salinas’s (2009) work, and also shared by Raggio and
Leone (2009). Both literatures agree on the idea that the role of “brand” is to signal
consumers of functional and emotional qualities that are unique to the brand, thus to
make their products and services more distinctive and noticeable in the market, which
leads to a stable level of demand for the brand against competition.
There are numerous valuation service providers around the world that operate
with different purposes, thereby implement different methodologies. Models like
AbsoluteBrand, AUS Consultants, BBDO, and Interbrand are the examples of these
methodologies to name a few. These models may vary in terms of their formulas, but
they all share the similar process that defines the overall concept of valuation. Brand
valuation is an expert’s viewpoint on the worth of a brand, derived from various
prepositions built around different objectives and participants (Salinas, 2009). In general,
the brand valuation objectives include valuations for transactional and accounting
purposes, as well as for brand management purposes which is the primary focus of this
paper.
5
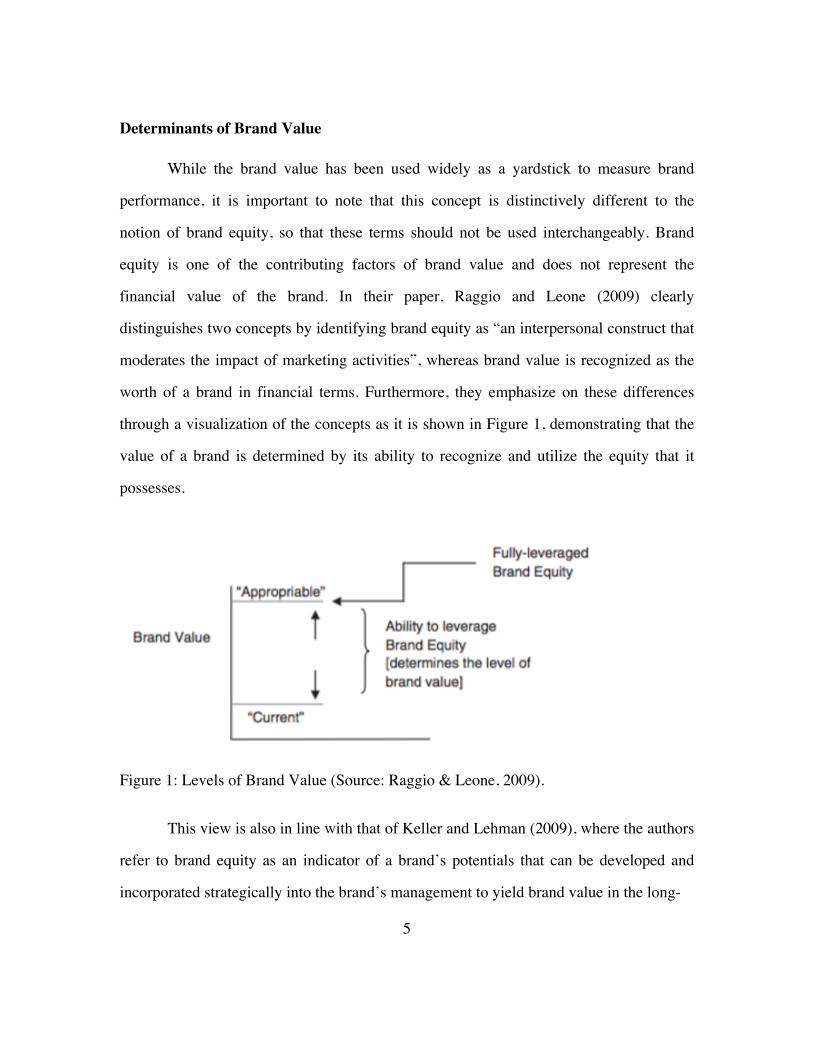
Determinants of Brand Value
While the brand value has been used widely as a yardstick to measure brand
performance, it is important to note that this concept is distinctively different to the
notion of brand equity, so that these terms should not be used interchangeably. Brand
equity is one of the contributing factors of brand value and does not represent the
financial value of the brand. In their paper, Raggio and Leone (2009) clearly
distinguishes two concepts by identifying brand equity as “an interpersonal construct that
moderates the impact of marketing activities”, whereas brand value is recognized as the
worth of a brand in financial terms. Furthermore, they emphasize on these differences
through a visualization of the concepts as it is shown in Figure 1, demonstrating that the
value of a brand is determined by its ability to recognize and utilize the equity that it
possesses.
Figure 1: Levels of Brand Value (Source: Raggio & Leone, 2009).
This view is also in line with that of Keller and Lehman (2009), where the authors
refer to brand equity as an indicator of a brand’s potentials that can be developed and
incorporated strategically into the brand’s management to yield brand value in the long-

6
term. In this sense, businesses need to be aware of the present value of their brands in the
market to be able to estimate the level of brand equity that they currently possess.
BRAND EQUITY AS A DRIVER OF BRAND VALUE
The concept of brand equity is one of the central elements in today’s market,
however, the broad nature of this construct makes it difficult to draw out a definition or a
measurement that can be applied universally. Its interpretations vary across disciplines,
and the two most prevailing perspectives come from the financial and marketing
literatures.
Brand equity, when viewed from a financial point of view, has been defined by
Motameni and Shahrokhi (1998) as “incremental discounted future cash flows” that
would be generated by products and services due to the brand name they are associated
with in relative to the same offerings appearing as generic brands. In this respect, the
level of equity a brand has can be estimated using the parent company’s stock prices,
which is also an indicator of the company’s degree of commitment to marketing as
suggested by Simon and Sullivan (1993). Other measures proposed by Wentz and Martin
(1989) and Kapferer (1992) include brand-earnings multiplier, averaged profits, as well
as weights measured based on past marketing expenditures and assessments, which are
often used by valuation companies and publications like the Interbrand Group and The
Financial World.
While the financial perspective provides company-oriented interpretations of
brand equity, definitions used in marketing literatures are more consumer-oriented
(Aaker, 1991; Christodoulides & de Chernatony, 2009; Christodoulides, de Chernatony,
Furrer, & Abimbola, 2006; de Chernatony, Harris, & Christodoulides, 2004; Keller,
7
1993; Pappu, Quester, & Cooksey, 2005; Vazquez, Del Rio, & Iglesias, 2002; You &
Donthu, 2001). Here, brand equity is defined by Keller (1993) as the differences in
consumers’ responses to marketing activities of a brand as a result of their awareness and
perceived image of the brand. In other words, when a brand has a positive brand equity,
consumers’ reactions will be more favorable to the marketing mix of the brand than they
would when the same mix had been implemented to a generic version of the same
product.
Hence, the financial approach of brand equity focuses on the economic values
associated with brands, whereas the marketing literatures address the concept as an
outcome of individual consumer’s perception and attitudes about brands (Salinas, 2009).
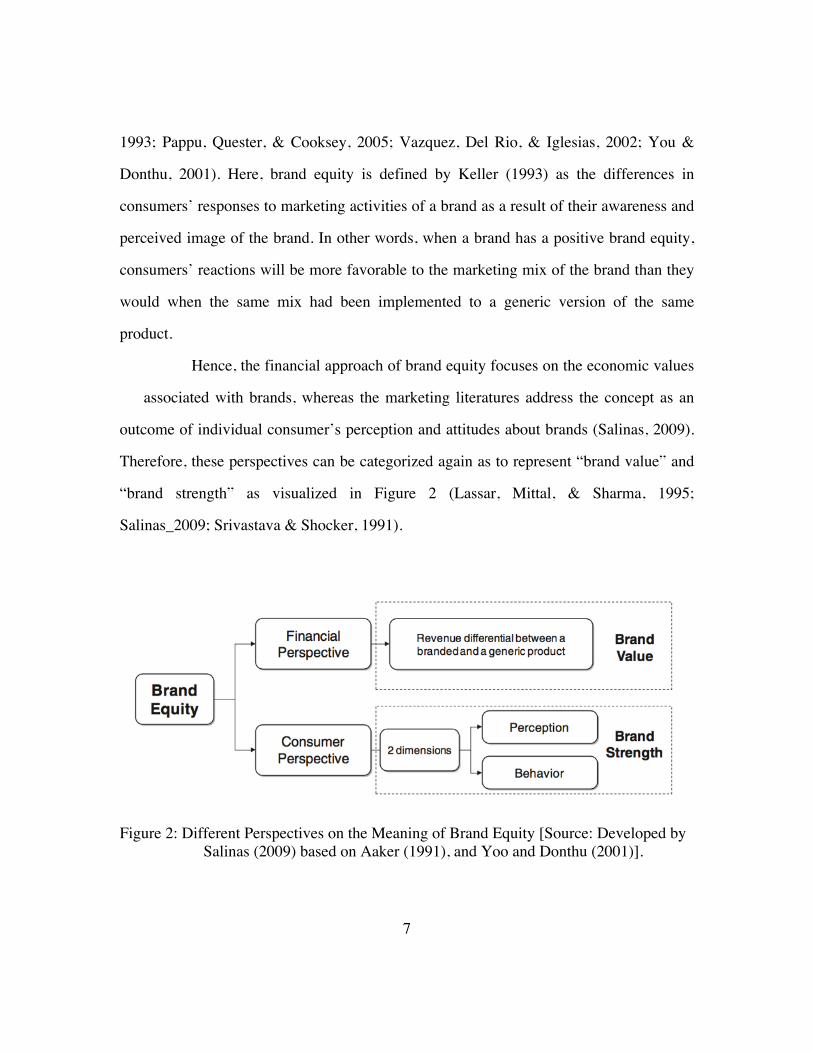
Therefore, these perspectives can be categorized again as to represent “brand value” and
“brand strength” as visualized in Figure 2 (Lassar, Mittal, & Sharma, 1995;
Salinas_2009; Srivastava & Shocker, 1991).
Figure 2: Different Perspectives on the Meaning of Brand Equity [Source: Developed by Salinas (2009) based on Aaker (1991), and Yoo and Donthu (2001)].
8
These classifications indicate that the economic benefits of brand equity (“brand
value”) cannot be apprehended unless a brand’s name has been recognized by a consumer
followed by a corresponding reaction (“brand strength”). To put it differently, consumer-
based brand equity needs to be established primarily in order to create a certain image in
the market, based on which brands can generate profit and enhance their presence in the
market that leads to development of firm-based brand equity (Christodoulides & de
Chernatony, 2009).
Elements of Brand Equity
Based on the different interpretations provided in the previous section, it can be
inferred that the consumers’ perceived value of brands is the source of brand equity.
Developed upon this notion, there has been a numerous research conducted over the last
few decades that explores various dimensions of brand equity.
Consumer’s brand association was first identified by Keller (1991, 1993) as one
of the key constructs of brand equity. Brand association consists of consumers’
awareness of a brand, knowledge about this brand, as well as their perceived image of the
brand (Lassar et al., 1995). This explains the reason why a consumer’s response to a
specific brand is different to its competitors. For instance, if an individual has a favorable
association with a specific brand, then it is more likely for this person to develop a
positive attitude toward the promotional activities of this brand when compared to that of
the same goods and services offered without a recognizable brand name (Christodoulides
& de Chernatony, 2009).
Another recognizable construct of brand equity is brand loyalty. Brand loyalty
was distinguished as a key dimension of brand equity in Bridge (1992) and Aaker’s

9
(1991) works along with brand association, brand awareness, perceived quality, and other
exclusive assets of a brand. Consumer’s loyalty towards a brand is developed from the
individual’s confidence in the brand, based on which they become more inclined to pay
premium when purchasing goods and services from this brand. This is how brands’
profitability can be affected by consumer-based brand equity (Lassar et al., 1995).
Like mentioned previously, there is no consensus on how to define or to measure
brand equity. In this sense, Christodoulides and De Chernatony (2009) provide a list of
dimensions that have been identified as the estimators of brand equity, like shown in
Table 1.
Study Dimensions of Consumer-Based Brand Equity
Aaker (1991, 1996) brand awareness, brand associations, perceived quality, brand loyalty
Blackston (1992) brand relationship (trust, customer satisfaction with the brand) Keller (1993) brand knowledge�(brand awareness, brand associations)
Sharp (1995) company/brand awareness,�brand image,�relationships with customers/existing customer franchise
Berry (2000) brand awareness brand meaning Burmann et al. (2009)
brand benefit clarity, perceived brand quality, brand benefit uniqueness, brand sympathy, brand trust
Table 1: Conceptual Research on Consumer-Based Brand Equity (Source: Christodoulides & de Chernatony, 2009).
Considering that the brand equity is not an objective indicator of brands’
performance but rather an evaluation of the consumers’ perceived value about the brands,
the way brand equity is measured should be revised to reflect the current market
conditions. To be more specific, in today’s environment surrounded by smart technology,
the idea of brand equity is now more than what consumers think of the brand. It is
10
consumers’ relationship with the brand that they have developed through personal
experiences of mutual communication in real-time with brands. Therefore, the focus of
these measures should go beyond from merely observing consumers’ responses and
attitudes toward the brands to acknowledging these consumers as active, primary agents
that drive brand equity through engagement and interaction.
CONSUMER ENGAGEMENT
Consumer engagement is a relatively new area of study, therefore represented by
a very limited availability of literatures. While the concept needs to be defined and
conceptualized more thoroughly by identifying appropriate measures in time to come, it
has been gaining a lot of attention for its relevance in the current market environment
(Baldus, Voorhees, & Calantone, 2015; Barger et al., 2016; Brodie, Ilic, Juric, &
Hollebeek, 2013; Kuvykaite & Piligrimiene, 2014).
This concept of “engagement” is very broad and focuses largely on the interactive
aspect of relationship building between consumers and brands. Consumer engagement
looks at this process as a form of two-way communication, where a consumer’s
experience about a brand does not just arise from the individual’s one-sided observations
of the brand, but it is a co-created outcome of consumer-brand interaction (Brodie,
Hollebeek, Juric, & Ilic, 2011; Calder, Malthouse, & Schaedel, 2009; Close, Finney,
Lacey, & Sneath, 2006; Kuvykaite & Piligrimiene, 2014; van Doorn et al., 2010). In this
regard, consumer engagement should be considered as a concept that is different to
consumer experience, which is a more involuntary process that does not require any
incitement from either entity (consumers and brands). That is, “experiences” can take
place even when the consumer is not emotionally or physically attentive of the brand

11
(Brakus, Schmitt, & Zarantonello, 2009; Lemke, Clark, & Wilson, 2011; Hollebeek et al.,
2014).
Therefore, the concept of brand engagement acknowledges today’s consumers as
representatives that are more active and social than the previous generations in
developing relationships with brands (Hoffman & Novak, 1996; Hollebeek et al., 2014;
Kuvykaite & Piligrimiene, 2014; Pagani, Hofacker, & Goldsmith, 2011; Prahalad, 2004;
Ramani & Kumar, 2008; Singh & Sonnenburg, 2012; Vivek, Beatty, Dalela, & Morgan,
2014). The key attribute here, is the “interactivity” of consumers with brands, meaning
that consumer-brand interaction does not start or end at the point of purchase, but it exists
throughout all stages of consumers’ buying process from cognitive, affective to cognitive
like in the model visualized by Hollebeek and colleagues’ (2014) as presented in Figure 3
(Patterson, Ting, & De Ruyter, 2006; van Doorn et al., 2010).
Figure 3: Consumer-Based Equity Conceptual Relationships (Source: Hollebeek, Glynn, & Brodie, 2014)
12
Digital Engagement and Brand Equity
While consumer engagement is broader, digital engagement is a specific
consideration of consumer engagement (Scheinbaum, 2016). From a consumer-centric
standpoint, digital engagement is “an online behavior resulting from a consumer’s
thoughts, emotional connection, and intrinsic motivation to interact and cooperate with a
brand or its community members in a digital, mobile, or social media setting”
(Scheinbaum, 2016, p. 2). Digital engagement is “characterized by thoughts, emotional
connections and/or consumer actions (e.g., “likes”, clicks, reactions, comments, shares,
check-ins, posts) in the context of mobile and/or social media” (Scheinbaum, 2016, p. 2).
This definition demonstrates that there is a positive relationship between brand
engagement and brand value creation. Other research shows that, based on the
observations of increased consumer-brand engagement generating greater value for
brands as reflected in terms of increased performance and profitability, customer
relationships, as well as product and service development (Bijmolt et al., 2010; Higgins
& Scholer, 2009; Hollebeek et al., 2014; Kuvykaite & Piligrimiene, 2014; Nambisan &
Baron, 2007; Prahalad, 2004; Sawhney, Verona, & Prandelli, 2005).
For many decades consumers were considered as just a passive recipient of brand
related benefits that had been sent out by the producers and delivered through a unilateral
form communication (Prahalad & Ramaswamy, 2004). Hence, the consumers had a
limited role in the process of value creation which had been developed and managed
within the businesses. Digital engagement however is not passive, but is interactive.
It is the emergence of the Internet and more critically the introduction of social
media that has changed this context dramatically. Most of today’s consumers are never
really “offline”, with the Internet being accessible through multiple mobile devices

13
anytime and anywhere. They do more than just networking on social media, and, as
indicated by Hoffman and Novak (2012), they are now constantly consuming content,
and even going a step further to share this content voluntarily. This phenomenon of
consumers socializing on internet communities, and brands looking into these
communities to create a relationship with potential customers formed a “three-party
relationship”, based on which a new notion of brand value was developed (Heding,
Knudzen, & Bjerre, 2009).
As greater number of consumers now take active part in shaping different parts of
brands, the way companies respond to consumer needs is changing correspondingly.
Previously, business operations have been largely based on the Goods Dominant Logic
perspective, which focuses on the value generated from exchange of goods and services.
This view is being replaced gradually by Service Dominant Logic, which focuses on the
purpose of exchanges and values co-created from the user-provider interaction (Vargo &
Lusch, 2004).
Digital/Consumer Engagement on Social Media
Social media is one of the areas that shows a strong presence of interaction among
individuals and brands, especially in regard to brand-related content sharing. It is a
medium that enables users to follow and interact with brands that they are interested in at
no cost and more conveniently than ever (de Vries, Peluso, Romani, Leeflang, & Marcati,
2017). In fact, nearly half of social media populations use the services as a means to
communicate with different brands, with almost 20 percent of all Tweets generated are
brand-related (Jansen, Zhang, Sobel, & Chowdury, 2009; Sharma, 2017).
While this sharing behavior indicates consumer’s active engagement with brands,
14
it is also a source of enhanced brand equity, thereby value-creation for these brands.
When a user shares and/or creates a branded content to their social media space, not only
is this individual endorsing the brand but is also creating an additional freely earned
exposure for the brand that serves as electronic word-of-mouth (eWOM) (Sharma, 2017;
Yuki, 2015). The power of eWOM has been recognized in Booth and Matic’s (2010)
work as to have greater impact on consumers’ purchase decisions and developing
preferences when compared to the effectiveness of brand-delivered promotional contents.
Hence, it has been suggested that there is more likelihood of enhanced brand
knowledge and equity for an individual and related others when the level of the
consumer’s engagement on social media increases, whether it is by creating a direct
connection with a brand or by sharing a brand-related content (Aaker, 1997; Bruhn,
Schoenmueller, & Schäfer, 2012; Christodoulides, Jevons, & Bonhomme, 2012; Keller,
1993; Schivinski & Dabrowski, 2014; Schivinski, Christodoulides, & Dabrowski, 2016).
HYPOTHESES
As emphasized throughout this paper, there are a limited number of studies
associated with consumer engagement, especially in relations to its applicability in social
media settings, concerning that both are relatively new fields of studies. While available
literature that explores these areas agree that social media is an interactive platform that
generates engagement among consumers and brands (Aaker, 1997; Bruhn,
Schoenmueller, & Schäfer, 2012; Christodoulides, Jevons, & Bonhomme, 2012; Keller,
1993; Schivinski & Dabrowski, 2014; Schivinski, Christodoulides, & Dabrowski, 2016).
These studies still show a restricted use of social media as a way to approach consumer
engagement to estimate its effect on brand values. Therefore, this paper proposes

15
Facebook’s interactive features (i.e. “Likes” and “the number of users talking about this
brand on Facebook”) as a measure of consumer engagement and intend to examine their
impact on brand values that is the outcome of brand equity. Based on this motivation, the
following hypotheses were developed:
H1: The total number of Likes a brand’s official1 fan page receives on
Facebook will be positively related with the brand’s valuation.
H2: The total number of users talking about a brand on Facebook will be
positively related with the brand’s valuation.
H3: A brand’s total amount of advertising spending will have a significant
relationship with the brand’s valuation.
The first two hypotheses were developed to test whether the number of Likes on a
brand’s official Facebook fan page and the number of users talking about this brand on
Facebook can be used as estimators of the brand’s place on the league tables. This is
based on the brand-related factors that can affect consumer engagement identified by
Barger and colleagues (2016), which includes brand attitude, word-of-mouth for brands,
commitment to communication methods. Spending on advertising was another factor
mentioned in the same work, thereby the last hypothesis was developed based on this to
clarify whether a brand’s advertising spending is an antecedent to consumer engagement,
thus affecting the brand’s valuation.
1 The term “official” is used to clarify between brand-related Facebook pages created by individual users to the pages created by official personnel of brands and acknowledged by Facebook.
16
Chapter 3: Methods
DATA
In order to test the relationship between the concept of consumer engagement in
social media and its impact on brand value, the primary objective of data selection was to
find a list of brands from a league table that specified the operating region of the brands
(i.e., US), as the coverage of the Facebook interaction devices is limited to show only the
top 25 countries with the highest number of likes and mentions.
A list of brands was pulled from Brand Finance’s league tables provided in their
annual reports (January 1 to December 31) for 2016 and 2017, and the total number of
Likes of these brands’ fan pages and users talking about these brands on Facebook were
retrieved from Facebook’s Graph API for the same time span to serve as the consumer
engagement measures.
Dependent Variable
The dependent variable used in this study is the brand value of the US brands
estimated by Brand Finance in US dollars, based on performance measures such as
Brand Strength Index (brand investment, brand equity, and brand performance), brand’s
royalty rate, and its revenues. Total of 48 US brands were collected for year 2016 and
20172, and the numbers are listed in Table 2.
2 All brand values were for the year ending December 31.

17
Brand name Brand Value ($m USD)
2016 2017
Apple 145,918 107,141 Google 88,173 109,470 Amazon.com 69,642 106,396 Microsoft 67,258 76,265 Verizon 63,116 65,875 AT&T 59,904 87,016 Walmart 53,657 62,211 Wells Fargo 44,170 41,618 McDonald's 42,937 38,966 GE 29,211 35,318 Coca-Cola 34,180 31,885 Facebook 34,002 61,998 IBM 31,786 36,112 Walt Disney 31,231 34,454 Chase 30,603 33,737 Marlboro 29,935 32,471 The Home Depot 28,798 30,216 Nike 28,041 31,762 Bank of America 26,928 30,273 Citi 26,031 27,674 Starbucks 23,185 25,615 CVS 22,884 23,286
Table 2: Brand Values of Top 48 Performing US Brands (2016) (Source: Brand Finance, 2017).
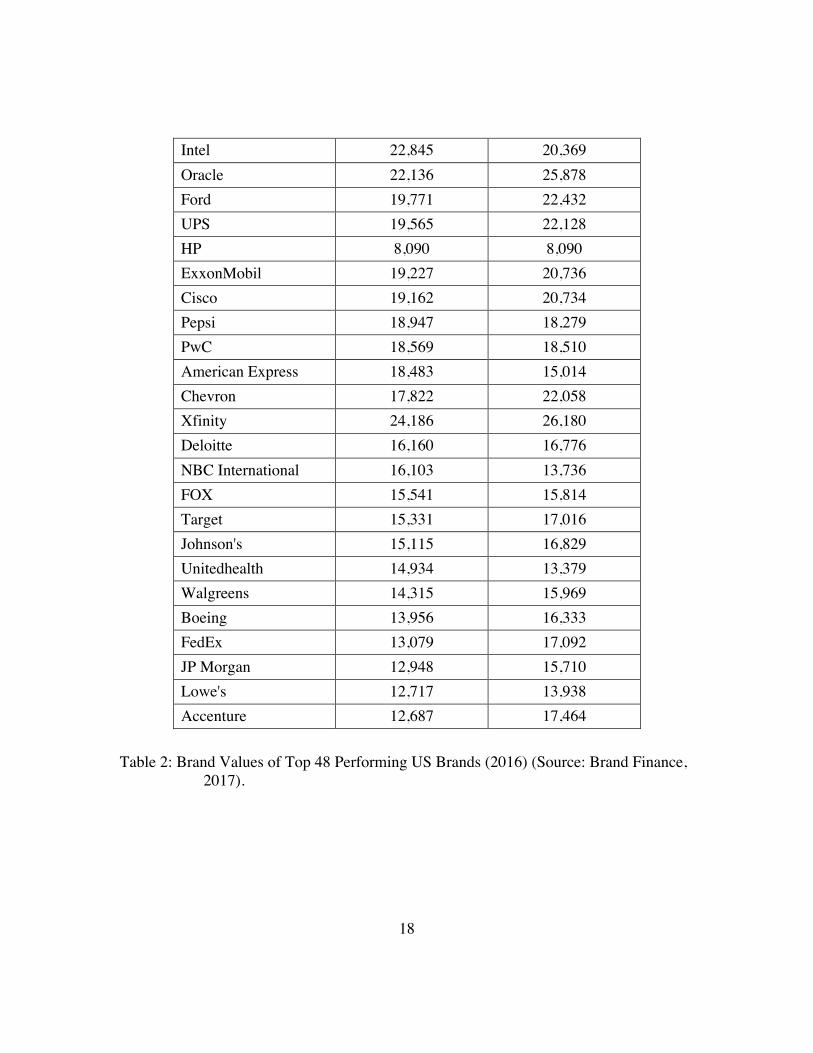
18
Intel 22,845 20,369 Oracle 22,136 25,878 Ford 19,771 22,432 UPS 19,565 22,128 HP 8,090 8,090 ExxonMobil 19,227 20,736 Cisco 19,162 20,734 Pepsi 18,947 18,279 PwC 18,569 18,510 American Express 18,483 15,014 Chevron 17,822 22,058 Xfinity 24,186 26,180 Deloitte 16,160 16,776 NBC International 16,103 13,736 FOX 15,541 15,814 Target 15,331 17,016 Johnson's 15,115 16,829 Unitedhealth 14,934 13,379 Walgreens 14,315 15,969 Boeing 13,956 16,333 FedEx 13,079 17,092 JP Morgan 12,948 15,710 Lowe's 12,717 13,938 Accenture 12,687 17,464
Table 2: Brand Values of Top 48 Performing US Brands (2016) (Source: Brand Finance, 2017).

19
Independent Variable I: Facebook Social Impacts
There is an increasing number of social network services available; however,
Facebook remains to be one of the largest and most well-known service as a pioneer of
this phenomenon (Shih, 2011). Not only does Facebook serves as a platform for users and
brands to create contents, but it also allows these contents to be shared within and outside
the site. Here, participants can disperse contents by clicking on “Likes” button as a form
of digital engagement. Facebook “Likes” are an indicator of the users’ personal
preferences and reactions toward the contents, and at the same time, these users are
endorsing the contents and generating electronic Word of Mouth (eWOM) among the
network of users (Hof, 2011; Hoffman & Fodor, 2010; Sharma, 2017).
It has been suggested that the recommendation from friends and families is one of
the most powerful elements that influences a consumer’s purchase decision process and
development of attitude towards a brand (Kotler & Keller, 2012; Sharma, 2017). And
considering that a typical user’s Facebook network consists largely of friends and
families, the effect of the user’s engagement with brands and brand-related content on
Facebook can be multiplied by the connected others (Sharma, 2017).
Facebook reported that the users that make the effort of clicking “Likes” is more
actively connected to Facebook with greater level of engagement compared to the
average users (Facebook, 2010). Therefore, the number of Likes displayed on a brand’s
official fan page and the number of users talking about this brand on Facebook can be a
reflection of consumers’ level of engagement toward that brand.
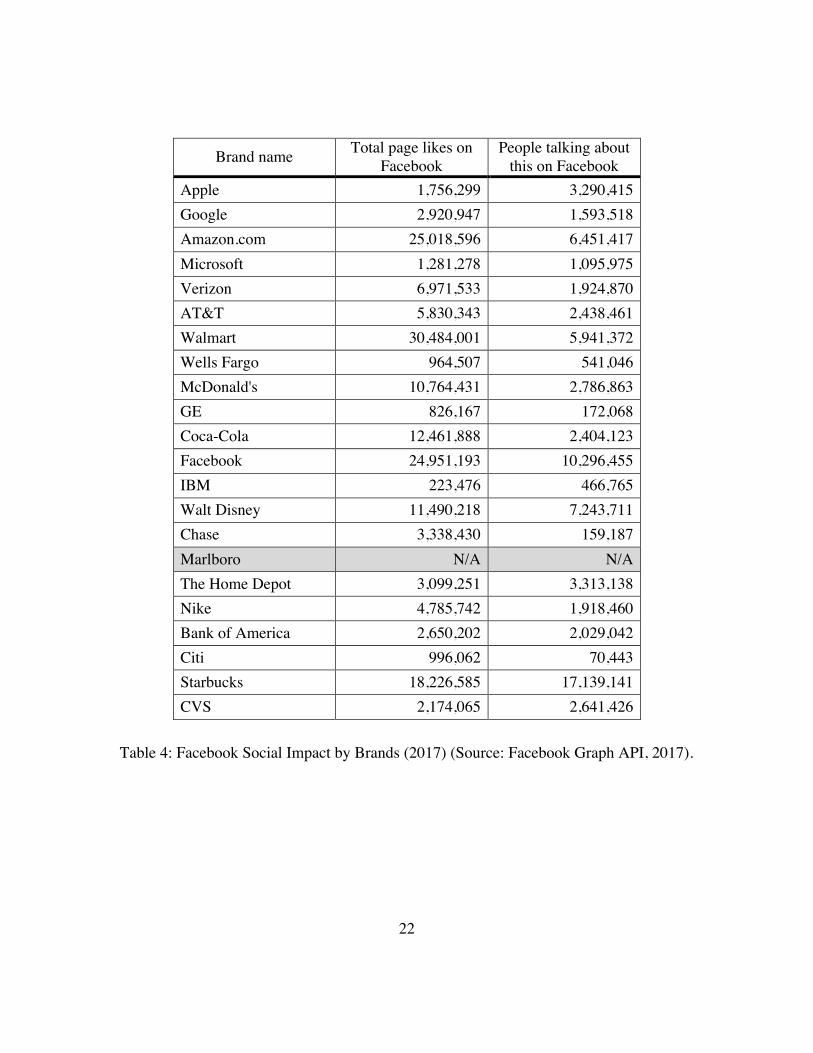
Based on the list of brands gathered from Brand Finance, Facebook Graph API
was used to retrieve the total number of Likes received through brands’ official fan pages
as well as the number of users that talked about each brand during 2016 and 2017 as
listed in Table 3 and 4.

20
Brand name Total page likes on Facebook
People talking about this on Facebook
Apple 1,066,984 3,290,415 Google 2,676,782 1,593,518 Amazon.com 24,133,624 6,451,417 Microsoft 1,187,720 1,095,975 Verizon 6,858,334 1,924,870 AT&T 5,570,470 2,438,461 Walmart 30,083,869 5,941,372 Wells Fargo 882,393 541,046 McDonald's 10,515,710 2,786,863 GE 794,124 172,068 Coca-Cola 12,518,699 2,404,123 Facebook 23,654,124 10,296,455 IBM 170,234 466,765 Walt Disney 11,481,259 7,243,711 Chase 3,233,577 159,187 Marlboro N/A N/A The Home Depot 2,221,613 3,313,138 Nike 4,327,997 1,918,460 Bank of America 2,467,797 2,029,042 Citi 941,053 70,443 Starbucks 17,670,531 17,139,141 CVS 1,856,569 2,641,426 Intel 2,067,273 1,238,407 Oracle 58,429 27,390 Ford 1,529,255 1,611,614
Table 3: Facebook Social Impact by Brands (2016)3 (Source: Facebook Graph API, 2017).
3 Marlboro and ExxonMobil were excluded from the final data set due to insufficient information.

21
UPS 1,261,696 658,679 HP 1,232,461 1,227,367 ExxonMobil 16,891 N/A Cisco 161,838 180,517 Pepsi 6,436,676 1,042,465 PwC 8,124 9,501 American Express 2,535,763 2,293,742 Chevron 632,185 252,013 Xfinity 6,025,411 1,412,796 Deloitte 44,945 5,895,499 NBC International 1,331,156 12,424 FOX 409,143 658,378 Target 22,045,833 7,890,349 Johnson's 1,208,468 220,966 Unitedhealth 80,179 156,690 Walgreens 4,183,068 1,536,035 Boeing 172,077 286,845 FedEx 894,940 963,894 JP Morgan 52,956 177,640 Lowe's 3,768,989 4,884,920 Accenture 33,299 19,984
Table 3: Facebook Social Impact by Brands (2016)4 (Source: Facebook Graph API, 2017).
4 Marlboro and ExxonMobil were excluded from the final data set due to insufficient information.
22
Brand name Total page likes on Facebook
People talking about this on Facebook
Apple 1,756,299 3,290,415 Google 2,920,947 1,593,518 Amazon.com 25,018,596 6,451,417 Microsoft 1,281,278 1,095,975 Verizon 6,971,533 1,924,870 AT&T 5,830,343 2,438,461 Walmart 30,484,001 5,941,372 Wells Fargo 964,507 541,046 McDonald's 10,764,431 2,786,863 GE 826,167 172,068 Coca-Cola 12,461,888 2,404,123 Facebook 24,951,193 10,296,455 IBM 223,476 466,765 Walt Disney 11,490,218 7,243,711 Chase 3,338,430 159,187 Marlboro N/A N/A The Home Depot 3,099,251 3,313,138 Nike 4,785,742 1,918,460 Bank of America 2,650,202 2,029,042 Citi 996,062 70,443 Starbucks 18,226,585 17,139,141 CVS 2,174,065 2,641,426
Table 4: Facebook Social Impact by Brands (2017) (Source: Facebook Graph API, 2017).
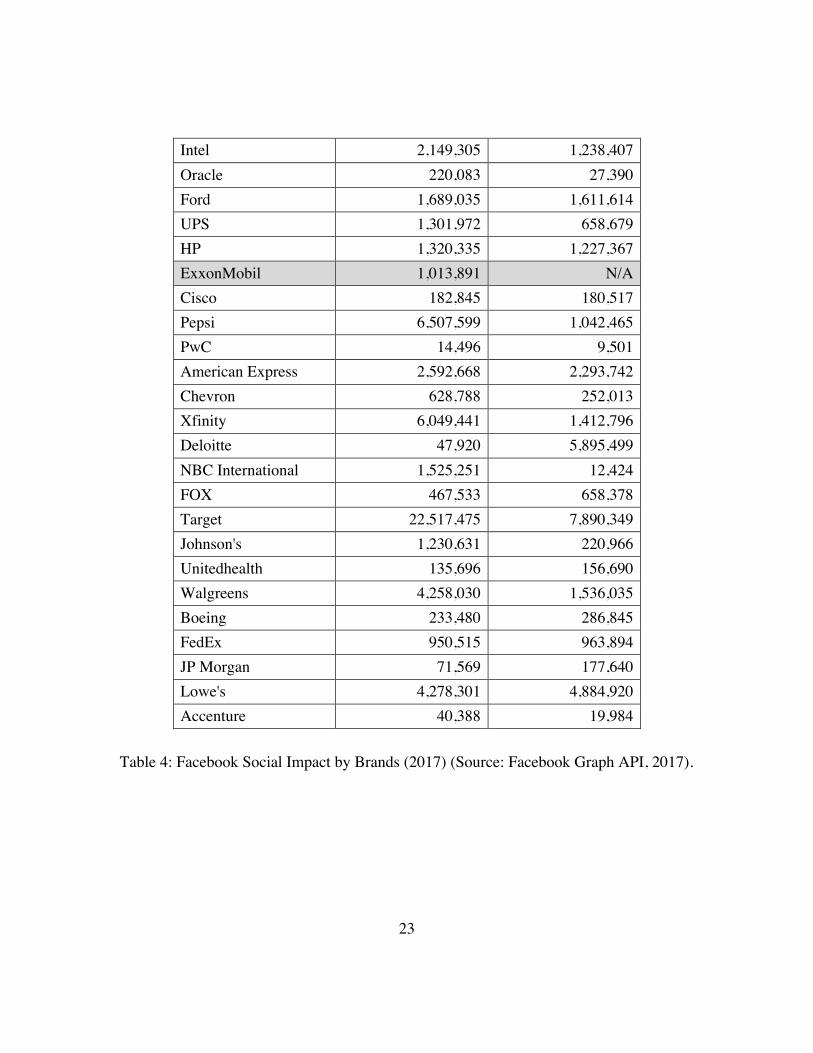
23
Intel 2,149,305 1,238,407 Oracle 220,083 27,390 Ford 1,689,035 1,611,614 UPS 1,301,972 658,679 HP 1,320,335 1,227,367 ExxonMobil 1,013,891 N/A Cisco 182,845 180,517 Pepsi 6,507,599 1,042,465 PwC 14,496 9,501 American Express 2,592,668 2,293,742 Chevron 628,788 252,013 Xfinity 6,049,441 1,412,796 Deloitte 47,920 5,895,499 NBC International 1,525,251 12,424 FOX 467,533 658,378 Target 22,517,475 7,890,349 Johnson's 1,230,631 220,966 Unitedhealth 135,696 156,690 Walgreens 4,258,030 1,536,035 Boeing 233,480 286,845 FedEx 950,515 963,894 JP Morgan 71,569 177,640 Lowe's 4,278,301 4,884,920 Accenture 40,388 19,984
Table 4: Facebook Social Impact by Brands (2017) (Source: Facebook Graph API, 2017).

24
Independent Variable II: Advertising Spending
Spending on traditional advertising was suggested by Barger and colleagues
(2016) as one of the brand-related factors that can influence consumer engagement. To
examine whether brands’ spending on advertising can estimate the value of the brand,
annual advertising spending of the brands listed in Table 2 were collected. The values
were taken from Ad Age Datacenter annual reports for 2016 to 2017 as listed in Table 5.
Brand name Advertising Spending (in $m USD)
2016 2017
Apple 610 750 Google 241 331 Amazon.com 445 537 Microsoft 569 611 Verizon 1,257 1,141 AT&T 1,262 905 Walmart 658 472 Wells Fargo 136 158 McDonald's 810 773 GE N/A N/A Coca-Cola 257 355 Facebook 310 310 IBM 482 507 Walt Disney 159 118
Table 5: Advertising Spending by Brands 2016-20175, Source: Ad Age Data Center, 2017).
5 GE, Oracle, UPS, Cisco, PwC, Chevron, Deloitte, Boeing, and Accenture were excluded from the final data set due to insufficient information.

25
Chase 277 219 Marlboro N/A 405 The Home Depot 329 303 Nike 1,406 1,468 Bank of America 168 144 Citi 335 235 Starbucks 63 63 CVS 380 310 Intel 102 112 Oracle N/A N/A Ford 793 892 UPS N/A N/A HP 219 219 ExxonMobil N/A N/A
Cisco N/A N/A
Pepsi 172 192 PwC N/A N/A
American Express 296 349 Chevron N/A N/A
Xfinity 505 470 Deloitte N/A N/A
NBC International 150 135 FOX 108 108 Target 122 473 Johnson's 2,009 1,929 Unitedhealth 193 193
Table 5: Advertising Spending by Brands 2016-20176, Source: Ad Age Data Center, 2017).
6 GE, Oracle, UPS, Cisco, PwC, Chevron, Deloitte, Boeing, and Accenture were excluded from the final data set due to insufficient information.

26
Walgreens 248 266 Boeing N/A N/A
FedEx 291 315 JP Morgan 2,063 2,233 Lowe's 209 324 Accenture N/A N/A
Table 5: Advertising Spending by Brands 2016-20177, Source: Ad Age Data Center, 2017).
DATA ANALYSIS
The hypothesized relationships were tested using simple linear regression
analysis. The SAS Proc Reg procedure was used to investigate the relationship between
brand value and Facebook Social Impacts and advertising spending. First, the analysis
was conducted on the data set for 2016 and 2017 separately, and then all data were
combined for the final analysis.
Throughout the series of analyses, the backward elimination technique was used
to determine an explanatory variable that showed statistically significant contributions.
Hence, the analysis began with all variables entered into the equation, and then at the end
of each analysis the least significant predictor variable was removed until the model was
left with a variable that was significant at the 0.05 significant level (p < 0.05).
7 GE, Oracle, UPS, Cisco, PwC, Chevron, Deloitte, Boeing, and Accenture were excluded from the final data set due to insufficient information.
27
Chapter 4: Findings
This chapter presents the results of regression analyses on data collected for years
2016 and 2017 and examines the relationship between valuations of 32 US brands8,
Facebook social impact indicators and the brand’s spending on advertising as measures of
consumer engagement.
Table 6 and 7 presents the analyses of data for year 2016 and 2017 each
conducted separately. These data were then combined for data analysis as summarized in
Table 8. In the previous section, assumptions were made that both the total number of
Likes a brand’s fan page receives on Facebook (H1), as well as the total number of users
talking about the brand on Facebook (H2) will be positively related with the brand’s
valuation. It was also assumed that the brand’s total amount of advertising spending will
show a significant relationship with its valuation (H3).
However, in the series of analyses, the total number of users talking about brands
on Facebook and advertising spending did not show statistically significant contributions
to the models in all cases, therefore, these variables were considered as non-significant
predictors, thus were dropped from the model.
On the other hand, “Likes” was a significant predictor variable in all three sets of
data as it can be seen from the tables below. The results indicate that about 20 per cent of
the variance in brand value can be predicted from the variable “Likes”. While the
strength of association seems relatively weak, it still shows a significant, positive
correlation between the number of Likes and brand valuation (see Table 8: t=2.70, p <
0.05).
8 In addition to Marlboro, ExxonMobil, GE, Oracle, UPS, Cisco, PwC, Chevron, Deloitte, Boeing, and Accenture that were excluded from the final data set due to insufficient information, Apple, Google, and Starbucks were considered as outliers and were also excluded from the final analyses.
28
Table 6: Results for 2016.
Table 7: Results for 2017
29
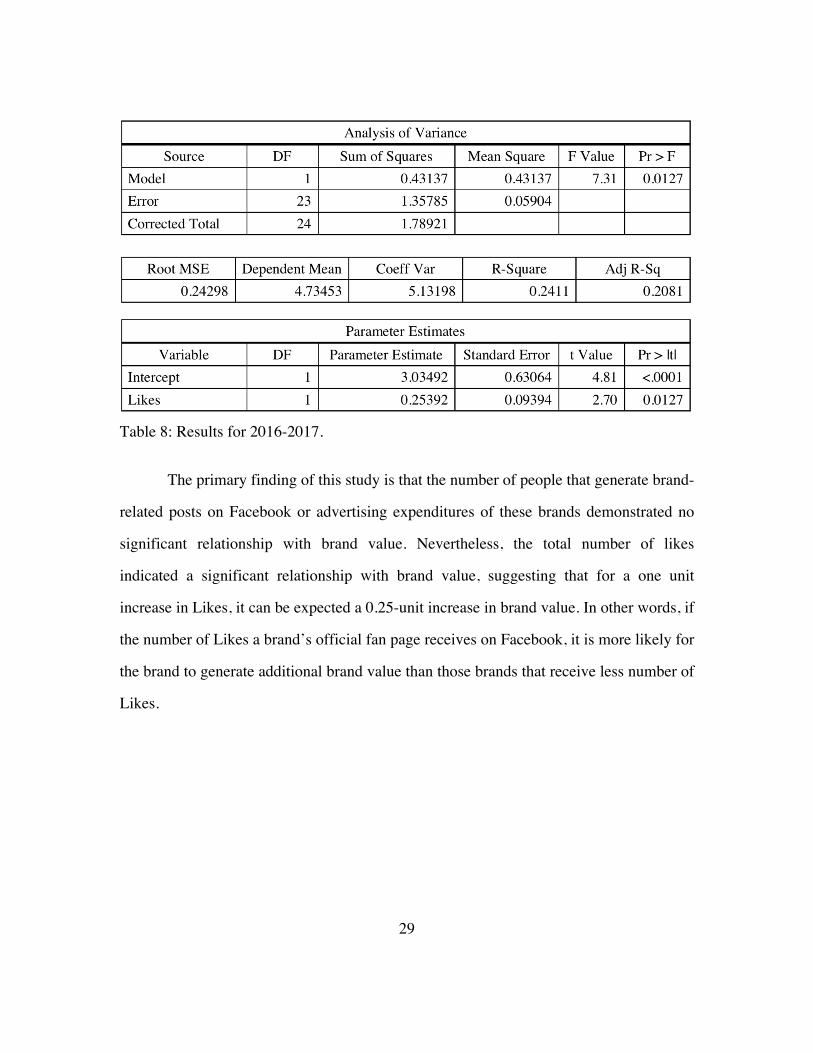
Table 8: Results for 2016-2017.
The primary finding of this study is that the number of people that generate brand-
related posts on Facebook or advertising expenditures of these brands demonstrated no
significant relationship with brand value. Nevertheless, the total number of likes
indicated a significant relationship with brand value, suggesting that for a one unit
increase in Likes, it can be expected a 0.25-unit increase in brand value. In other words, if
the number of Likes a brand’s official fan page receives on Facebook, it is more likely for
the brand to generate additional brand value than those brands that receive less number of
Likes.
30
Chapter 5: Discussion
This chapter is divided into two sections. The first analyzes the findings of this
study in respect to the relationship between consumer engagement and brand value. To
conclude, the paper elaborates upon such observations by discussing the limitations that
were identified throughout the study, as well as the recommendations for future research
and implications.
DIGITAL ENGAGEMENT AND BRAND VALUE
The purpose of this paper is to suggest digital engagement in a social media
setting as a contemporary measure of brand equity, as well as to examine its impact on
brand value.
As an independent variable, digital engagement was operationalized using
Facebook interaction devices including the total number of Likes received by a brand’s
fan page and the total number of users talking about the brand on Facebook, as well as
the brand’s total amount of advertising spending as a brand-related factor that can
influence consumer engagement, thereby brand value.
Despite the assumptions, the results showed that the number of users talking
about a brand on Facebook and the brand’s advertising spending had no relationship with
the brand’s value. However, despite its relatively weak associations, the number of Likes
a brand’s fan page receives and the brand’s values, suggested a significant correlation.
The findings of this study contribute toward expanding the stream of research by
bridging the two separated areas of focus; brand value creation from consumer
engagement (Hoffman & Novak, 1996; Hollebeek et al., 2014; Kuvykaite & Piligrimiene,
2014; Pagani, Hofacker, & Goldsmith, 2011; Prahalad, 2004; Ramani & Kumar, 2008;

31
Singh & Sonnenburg, 2012; Vivek, Beatty, Dalela, & Morgan, 2014), and consumer
engagement as a subject of social media activities (Aaker, 1997; Bruhn, Schoenmueller,
& Schäfer, 2012; Christodoulides, Jevons, & Bonhomme, 2012; Keller, 1993; Schivinski
& Dabrowski, 2014; Schivinski, Christodoulides, & Dabrowski, 2016). The findings
indicate that these two fields of research are closely related by demonstrating the
correlation between consumer’s engagement with brand-related social media contents
and the brand’s value, thus suggesting the level of social media engagement as an
indicator of brand equity affecting brand value.
Not only do these findings have academic value, but they also provide meaningful
insights for practitioners. The major implication of this study is that the brands need to
change the perceptions they have about today’s consumers. Compared to the previous
generations of consumers who were more passively involved with brands due to the
unilateral characteristics of promotional activities, the current consumers expect
“interaction” from the brands at every point to create relationship and want their voice
heard. It is critical for the brands to implement strategies to reflect such changes, as these
are now the new basis of brand equity, ultimately influencing the brand’s financial
performances and values.
This is especially crucial considering that many products and services in today’s
market offer benefits almost identical, where each can only be distinguished by the level
of equity the brand possesses. Hence, to create a value significant enough for consumers
to want to return to the brand for their next purchases, brands need to acknowledge
consumers as more than just recipients of offerings but as a focal subject of engagement.
Hence, knowing how to reach their target audiences will determine the brand’s
performance more than ever. This study clearly shows that the strength of engagement in

32
this digital world costs too much to ignore for any brands trying to build positive brand
equity.
LIMITATIONS AND FUTURE RECOMMENDATIONS
As described in the previous chapter, this study was conducted based on the data
collected using Facebook Graph API. While this tool provides the total number of Likes
received through brands’ official fan pages and the number of users that talked about
each brand, other indicators of user-brand interaction on Facebook, such as the number of
followers and shares were restricted from public access.
Even for the data that could be retrieved, any materials dated prior to 2016 were
not accessible and the same data only showed the top 25 countries with the highest rate of
interaction. Therefore, this study was conducted using the data on US users accumulated
subsequent to January 2016. Consequently, this restricted the use of the league tables,
where the data collected were restricted to their performance scores from the US market
while the brands referred to in the study are global businesses.
Again, acquiring the total amount of advertising spending for the brands was also
restricted by the factors mentioned above. Because many brands are operating globally, it
was often the case that their spending was not specified by regions. This eliminated a
handful of brands from the list, thus decreasing the total number of samples that could be
examined.
For future studies, the issue of data accessibility should be solved in order to
generate more precise results. Some recommendations include extended regions, external
sources, longitudinal observations, and alternate measure of impacts:
33
It is suggested the future studies to overcome the limited sample size by collecting
data on countries outside United States by referring to the brand’s fan pages dedicated to
specific countries. However, the number of measurable brands may decrease due to the
brands that only have one official fan page.
Another possible way to resolve the issue of data limitation is by referring to
external services that offer paid social media data. These services provide overall
statistics on the number of traffic and shares on the brands, thereby making more
elements available as measurable independent variables.
The same data could also be collected over the longer time period. While this
study could only present data accumulated over the last two years, the same data can be
collected over the next few years to increase the number of data for more precise
analyses.
It is also recommended for future studies to refer to other measures of social
engagement and platforms outside Facebook. In other words, brand-related social media
activities like the number of “shares” of contents or “hashtags” can also be referred to,
along with that of other social network services such as Twitter and Instagram. This will
help inducing a conclusion that is more precise and comprehensive.
The results may have been more precise or different, if larger number of data
could have been obtained from countries outside of United States and across greater time
span. Hence, future studies will have to find an alternate source or greater amount of data
to tackle such challenges for improved results.

34
References
Aaker, J. L. (1997). Dimensions of brand personality. Journal of Marketing Research, 34(3), 347-356.
Baldus, B. J., Voorhees, C., & Calantone, R. (2015). Online brand community engagement: Scale development and validation. Journal of Business Research, 68(5), 978-985.
Barger, V., Peltier, J. W., & Schultz, D. E. (2016). Social media and consumer engagement: a review and research agenda. Journal of Research in Interactive Marketing, 10(4), 268–287.
Booth, N., & Matic, J. A. (2011). Mapping and leveraging influencers in social media to shape corporate brand perceptions. Corporate Communications: An International Journal, 16(3), 184-191.
Bijmolt, T. H. A., Leeflang, P. S.H., Block, F., Eisenbeiss, M., Hardie, B. G. S., Lemmens, A., & Saffert, P. (2010), analytics for customer engagement. Journal of Service Research, 13(3), 341-56.
Brakus, J. J., Schmitt, B. H., & Zarantonello, L. (2009). Brand experience: what is it? How is it measured? Does it affect loyalty? Journal of Marketing, 73(3), 52-68.
Brand Finance. (2017). The Brand Finance Global 500. Retrieved from http://brandirectory.com/
Brodie, R. J., Hollebeek, L. D., Juric, B., & Ilic, A. (2011). Customer engagement: Conceptual domain, fundamental propositions, and implications for research. Journal of service research, 14(3), 252-271.
Brodie, R. J., Ilic, A., Juric, B., & Hollebeek, L. (2013). Consumer engagement in a virtual brand community: An exploratory analysis. Journal of Business Research, 66(1), 105-114.
Bruhn, M., Schoenmueller, V., & Schafer., D. B. (2012). Are social media replacing traditional media in terms of brand equity creation? Management Research Review 35(9), 770-790.��
Calder, B. J., Malthouse, E. M., & Schaedel, U. (2009). An experimental study of the. relationship between online engagement and advertising effectiveness. Journal of Interactive Marketing, 23(4), 321-31.
Christodoulides, G. & de Chernatony, L. (2010). Consumer-based brand equity conceptualization and measurement: a literature review. International Journal of Market Research, 52(1), 43-66.
Christodoulides, G., Jevons, C., & Bonhomme, J. (2012). Memo to marketers: quantitative evidence for change. How user-generated content really affects brands. Journal of Advertising Research, 52(1), 53-64.

35
Close, A. G., Finney, R. Z., Lacey, R. Z., & Sneath, J. Z. (2006). Engaging the consumer through event marketing: Linking attendees with the sponsor, community, and brand. Journal of Advertising Research, 46(4), 420.
de Vries, L., Peluso, A. M., Romani, S., Leeflang, P. S. H., & Marcati, A. (2017). Explaining consumer brand-related activities on social media: An investigation of the different roles of self-expression and socializing motivations. Computers in Human Behavior, 75, 272–282.
Facebook. (2010). ‘The value of a Liker’. Available at https://www.facebook.com/notes/facebook-media/the-value-of-a-liker/150630338305797/. Accessed 15 April 2018.
Facebook Graph API. (2017). Facebook for Developers. Retrieved from https://developers.facebook.com/docs/graph-api/explorer/#read
Ha, H. (2004). Factors influencing consumer perceptions of brand trust online. Journal of Product & Brand Management, 13(5), 329-342.
Heding, T., Knudzen, C.F., & Bjerre, M. (2009). Brand Management: Research, Theory and Practice. Abingdon: Routledge.�
Higgins, E. T., & Scholer, A. A. (2009). Engaging the consumer: The science and art of the value creation process. Journal of Consumer Psychology, 19(2), 100-114.
Hof, R. (2011). You are the ad. Facebook has emerged from a privacy scandal to become online advertising’s next great hope. Its goal: turning us all into marketers. Technology Review, 114(3), 64-69.
Hoffman, D., & Fodor, M. (2010). Can you measure the ROI of your social media marketing? MIT Sloan Management Review, 52(1), 41-49.
Hoffman, D. L., & Novak, T. P. (1996). Marketing in hypermedia computer-mediated environments: Conceptual foundations. The Journal of Marketing, 60(3), 50-68.
Hollebeek, L. D., Glynn, M. S., & Brodie, R. J. (2014). Consumer Brand Engagement in Social Media: Conceptualization, Scale Development and Validation. Journal of Interactive Marketing, 28(2), 149–165.
Jansen, B. J., Zhang, M., Sobel, K., & Chowdury, A. (2009). Twitter power: Tweets as electronic word of mouth. Journal of the Association for Information Science and Technology, 60(11), 2169-2188.
Keller, K. L. (1993). Conceptualizing, measuring, and Managing Customer-Based Brand Equity. Journal of Marketing, 57(1), 1-22.�
Kuvykaite, R., & Piligrimiene, Z. (2014). Consumer Engagement into Brand Equity Creation. Procedia - Social and Behavioral Sciences, 156, 479–483.
Lassar, W., Mittal, B., & Sharma, A. (1995). Measuring customer-based brand equity. Journal of consumer marketing, 12(4), 11-19.
36
Lemke, F., Clark, M., & Wilson, H. (2011). Customer experience quality: an exploration in business and consumer contexts using repertory grid technique. Journal of the Academy of Marketing Science, 39(6), 846-869.
Mariani, R., & D. Mohammed. (2014). Like a global endorsement: how clicking Like influences Facebook users’ recall and future purchasing intentions. Journal of Management Policy and Practice, 15(4), 51-63.�
Nambisan, S., & Baron, R. A. (2007). Interactions in virtual customer environments: Implications for product support and customer relationship management. Journal of interactive marketing, 21(2), 42-62.
Pagani, M., Hofacker, C. F., & Goldsmith, R. E. (2011). The influence of personality on active and passive use of social networking sites. Psychology & Marketing, 28(5), 441-456.
Patterson, P., Yu, T., & De Ruyter, K. (2006). Understanding customer engagement in services. In Advancing theory, maintaining relevance: Proceedings of ANZMAC 2006 conference, Brisbane (December 4-6).
Prahalad, C. K. (2004). The Co-Creation of Value: Invited Commentaries on ‘Evolving to a New Dominant Logic for Marketing. Journal of Marketing, 68(1), 23.�
Prahalad, C. K., & Ramaswamy, V. (2004). Co-creation Experiences: The Next Practice in Value Creation. Journal of Interactive Marketing, 18, 5-14.�
Raggio, R. D., & Leone, R. P. (2009). Drivers of brand value, estimation of brand value in practice and use of brand valuation: Introduction to the special issue. Journal of Brand Management, 17(1), 1–5.
Ramani, G., & V. Kumar. (2008). Orientation and Firm Performance. Journal of Marketing, 72(1), 27-45.�
Rodgers, S., & Thorson, E. (2018). Special issue introduction: Digital engagement with Advertising. Journal of Advertising, 47(1), 1-3.
Salinas, G. (2011). The International Brand Valuation Manual: A complete overview and analysis of brand valuation techniques, methodologies and applications. John Wiley & Sons.
Sawhney, M., Verona, G., & Prandelli, E. (2005). Collaborating to create: The Internet as a platform for customer engagement in product innovation. Journal of interactive marketing, 19(4), 4-17.
Scheinbaum, A. C. (2016). Digital engagement: Opportunities and risks for sponsors: consumer-viewpoint and practical considerations for marketing via mobile and digital platforms. Journal of Advertising Research, 56(4), 341-345.
Schivinski, B, Christodoulides, G., & Dabrowski, D. (2016). Measuring consumers’ engagement with brand-related social-media content - development and validation
37
of a scale that identifies levels of social-media engagement with brands. Journal of Advertising Research, 56(1), 1-18.
Schivinski, B., & Dabrowski, D. (2014). The effect of social media communication on consumer perceptions of brands. Journal of Marketing Communications, 22(2), 189-214.
Sharma, R. (2017). Like-influencer framework. In Rishi, B., & Bandyopadhyay, S. (Eds.), Contemporary Issues in Social Media Marketing (258-270). Routledge.
Shih, C. (2011). The Facebook Era: Tapping Online Social Networks to Market, Sell and Innovate. Boston, MA: Pearson Education.
Singh, S., & Sonnenburg, S. (2012). Brand Performances in Social Media. Journal of Interactive Marketing, 26(4), 189-97.
van Doorn, J., Lemon, K. N., Mittal, V., Nass, S., Peck, D., Pirner, P., & Verhoef, P. C. (2010). Customer engagement behavior: theoretical foundations and research directions. Journal of Service Research, 13(3), 253-66.
Vargo, S. L., & Lusch, R. F. (2004). Evolving to a New Dominant Logic for Marketing. Journal of Marketing, 68(1), 1-17.�
Vivek, S. D., Beatty, S. E., Dalela, V., & Morgan, R. M. (2014). A generalized scale for measuring customer engagement. Journal of Marketing Theory and Practice, 22(4), 401-420.
Yuki, T. (2015). What Makes Brands’ Social Content Shareable on Facebook? Journal of Advertising Research, 55(4), 458-470.