lights out the risks of climate and natural disaster …7b49faa1-ddf5-4e11-93a2...lights out the...
TRANSCRIPT

Lights out The risks of climate and natural disaster related disruption to the electric grid
A report prepared by students of Johns Hopkins University, School of Advanced International Studies

About the project
This report was authored by students of the Johns Hopkins University School of Advanced International Studies (SAIS) as part of a practicum project in the Energy, Resources and Environment Program. The practicum requires student teams to partner with key organizations to address critical international policy challenges. Natural disasters pose grave threats to electric grids and their ability to deliver reliable electricity to communities. Climate change, expanding populations, and insufficiently diversified sources make our energy future more unpredictable. This practicum explores how extreme weather and other natural catastrophes are evolving in the Pacific Northwest, including implications for reliability of the system and potential economic disruption.
The Swiss Re Institute provided financial support to Johns Hopkins SAIS to support the students’ work on this project.
Johns Hopkins University School of Advanced International Studies Energy, Resources and Environment Student Practicum
Authors Annabella Korbatov Julia PriceMadison Yihui Wang Yi Xu

Contents
Acknowledgements 2
Executive summary 3
The evolving risk landscape 6
The Pacific Northwest context 7 Regional natural disaster risks 8 Electricity system in the Pacific Northwest 9 Electric grid infrastructure vulnerability 11
Infrastructure resilience strategies and challenges 13 Infrastructure resilience strategies 13 Challenges and gaps in postdisaster financial recovery 14
Case studies 17 Hurricane Iniki, Kauai 17 Oregon 20 Comparative perspective: Canada 24
Innovative approaches on the horizon 26
Conclusion 27

2 Swiss Re Lights out: The risks of climate and natural disaster related disruption to the electric grid
Acknowledgements
The Johns Hopkins SAIS Swiss Re practicum team would like to acknowledge the following individuals for generously sharing their expertise and providing valued input regarding this report throughout the course of the 2016–2017 academic year.
BC HydroLana GilpinJacksonTara Laycock
Center for American ProgressLuke Bassett
Edison Electric InstituteKatie Jereza
Hawaii ElectricAlan M Oshima
Johns Hopkins University School of Advanced International Studies (SAIS)Professor John BanksProfessor Celeste ConnorsDr. Jonathan HaskettDr. Michael KleinDean Dr. Vali R. NasrDr. Mark White
Maryland Energy AdministrationDavid Comis
Natural Resources CanadaNicky HastingsMurray Journeay
Northwest Power and Conservation CouncilMike Starrett
Oregon Department of Geology and Mineral IndustriesIan Madin
Oregon State Department of EnergyAdam Schulz
Oregon State Office of Emergency ManagementBill Martin
Oregon State Office of the Governor (State Resilience Officer)Mike Harryman
Oregon State Public Utility CommissionLori Koho
Oregon State RepresentativeKen Helm
Oregon State Water Resources DepartmentMary Grainey
Pacific Northwest National LaboratoryRebecca O’Neil
PowerexClarke LindBrian Moghadam
Seattle City LightCrystal Raymond
Seattle City Resilience Officer, Office of Sustainability & EnvironmentJessica FinnCovenTracy Morgenstern
Swiss ReBrian BeebeAlex Kaplan
United States Department of EnergyDr. Craig Zamuda
USAIDGregory Gangelhoff

Swiss Re Lights out: The risks of climate and natural disaster related disruption to the electric grid 3
Executive summary
Why focus on the electric grid?
The electric grid is one of the most critical infrastructure systems for modern life, but it is also one of the most vulnerable. Much attention has been paid to cyber threats to the grid, but ordinary physical threats, such as weather, can be even more damaging to the grid’s ability to provide reliable electricity. According to the North American Electric Reliability Corporation (NERC), of 2 428 total unplanned electric grid outages in the western states in 2015, nearly a quarter were caused by extreme weather events and variability in environment.1 Moreover, the U.S. insurance industry has identified a USD 20–55 billion annual financial loss from power outages caused by flooding, hurricanes and extreme temperatures.2
Climate change, however, presents epistemic risks beyond predictable, ordinary weatherrelated risks to the electric grid. Climate change is expected to increase the incidence and severity of extreme weather conditions, putting the structural integrity of America’s ageing electric infrastructure under greater strain. A combination of higher average temperatures, more destructive storms and hurricanes, and increased risk of wildfire will ultimately worsen risk exposure for utilities.
The Pacific Northwest is an illustrative case study in climate and natural disaster related electric grid disruption. The region is prone not only to highfrequency, lowintensity natural disasters such as droughts and flooding, but also at risk of catastrophes like the Cascadian Subduction Zone (CSZ) event, an earthquaketsunami combination that is expected to devastate the coastline from northern California to southern British Columbia. As climate change alters the seasonality of water runoffs in the Pacific Northwest, electricity generation, as well as the operation and maintenance of hydroelectric dams, face additional challenges.
In what way is the electric grid vulnerable to natural disasters?
Different components of the electric grid are vulnerable to different natural hazards. Above ground transmission and distribution lines are highly vulnerable to weather events, and underground lines can be disrupted by earthquakes. According to Oregon’s Public Utility Commission, more than 50 percent of substations would be damaged beyond repair in the event of a magnitude 9.0 earthquake.3 In addition, the vulnerability of the electric grid is highly interdependent with other critical infrastructure systems, including roads, water and sewage treatment, and natural gas pipelines. In the event of a major earthquake, damage to road networks can make it impossible to repair transmission and distribution lines, thereby preventing the restoration of all other electricitydependent lifeline services (water, sewage, telecommunications).
How do interdependent risks complicate our understandingof grid resilience?
Interactions between climate and weather risks, as well as changing trends in electricity supply and demand, put increasing strain on America’s ageing electric grid. For example, Seattle City Light’s electricity infrastructure was not designed for higher summer temperatures and highintensity rainfall and flooding, but the utility is adapting its infrastructure to better withstand these new risks. Climate change is also expected to change the seasonality of rainfall in Washington State, adding potential strain to existing water storage capacity. In British Columbia, however,

4 Swiss Re Lights out: The risks of climate and natural disaster related disruption to the electric grid
Executive summary
the projected impacts of climate change are expected to increase the availability of spring runoff used for hydroelectric generation. In Oregon, a less waterrich state, concerns about drought and rising temperatures present substantial challenges for utilities. Ultimately, while interdependencies are evolving and dynamic, they are also highly contextspecific.
What are the short and longterm economic impacts of electricity disruption?
Earthquakes and weatherrelated natural disasters can damage generation, transmission and distribution, causing disruptions in electricity provision. Traditionally, in the short term, utilities are incentivised to pay out for immediate restoration and repair. Costs vary based on the severity of the disaster and damage to other critical infrastructure, as well as the population density of the region. The Western Electricity Coordinating Council estimated that the cost of constructing and restoring the electric grid is 1.59 times higher in areas with high population density than in flat areas with low population.4 Since the electric system is highly interconnected with all other critical infrastructure systems, there are both short and longterm economic implications to various stakeholders. A disaster that destroys designated “emergency” roads and floods the whole region will pose extra costs and increase the time it takes utilities to restore transmission and distribution infrastructure. Generally, the regional transmission organization (RTO) is responsible for coordinating the remaining resources to ensure minimum disruption, while

Swiss Re Lights out: The risks of climate and natural disaster related disruption to the electric grid 5
the state also bears the cost of fuel for backup diesel generation.5 In the long run, substantial costs can be reimbursed by the Federal Emergency Management Administration (FEMA), but the rest is ultimately passed onto ratepayers and taxpayers.
Are all of the financial risks addressed in the Pacific Northwest region?
The traditional postdisaster financial recovery framework, in which states rely heavily on FEMA assistance, is woefully inadequate in addressing the true financial burden of recovery. FEMA assistance to individuals and public entities often covers only a fraction of actual recovery costs. When federal and state funding and insurance coverage are inadequate, local governments may resort to raising taxes to cover remaining recovery costs. But considerable outmigration and a permanent reduction in population and economic activity postdisaster reduce local tax bases, making it more difficult for municipalities to recover costs through tax increases. Utilities also struggle to recover costs in areas blighted by natural disasters.
What resilience strategies are being deployed in the Pacific Northwest?
Risk reduction and resilience strategies are varied and interdisciplinary, touching on electric grid infrastructure, energy generation, financial mechanisms, and policy changes. With respect to infrastructure, risk mitigation strategies include utility vulnerability assessments, physical grid hardening, grid modernization, seismic retrofitting, construction or recommissioning of backup generation sources, and the construction of more transmission infrastructure. In terms of energy, utilities are exploring diversification of generation sources, increased investment in renewables and distributed generation sources, and powerpurchasing agreements (loadfeeding) to diversify their risk in the event of a natural disaster. In Washington State, where hydropower accounts for nearly 70% of total electricity generation, diversification of energy sources is of growing importance. On the finance side, insurance, reinsurance, and risk transfer pools are the main risk reduction strategies. In terms of policy, insurance laws, building codes, and improved regional and intergovernmental coordination and information exchange are the main strategies.
The evolving risk landscape
While closing financial gaps from natural disasters through innovative financing mechanisms remains a frontier area, the Pacific Northwestern states have demonstrated leadership in proactively addressing climate and seismic risks. With active collaboration between federal, state, and local governments, utilities, and the insurance industry, leaders in the public and private sector have the opportunity to reassess resilience and sustainable electricity infrastructure.

6 Swiss Re Lights out: The risks of climate and natural disaster related disruption to the electric grid
Mitigating risks to the electric grid from extreme weather events and climate variability becomes an even more challenging task when layered with other risks, such as changing energy supplies and shifting demand. Traditional risk mitigation strategies employed by policymakers, utilities, and the insurance industry are no longer meeting the challenge of an evolving risk landscape, a situation in which all of the risks (extreme weather, increasing variability in climate, growing populations, and insufficient energy diversification) are evolving and highly dynamic.
The electric grid is one of the most critical infrastructure systems supporting modern life, but it is also one of the most vulnerable. While cyber threats to the grid have received significant attention, physical threats, such as weather, can be even more damaging. According to the North American Electric Reliability Corporation (NERC), nearly a quarter of the total of 2 428 unplanned electric grid outages in the western states in 2015 were caused by extreme weather events and variability in environment,6 and the U.S. insurance industry has identified a USD 20–55 billion annual financial loss from power outages caused by flooding, hurricanes, and extreme temperatures.7
The evolving risk landscape

Swiss Re Lights out: The risks of climate and natural disaster related disruption to the electric grid 7
The electric grid in the Pacific Northwest is at increasing risk of a catastrophic natural disaster. A 2015 New Yorker article8 highlighting the risks from a potential Cascadia Subduction Zone (CSZ) event – an earthquake-tsunami combination expected to devastate the Pacific Northwest – prompted widespread concern. The CSZ is a 620-mile long dipping fault that stretches along the West Coast from northern California to southern British Columbia. As a subduction zone, it is one of the only faults in the world capable of producing earthquakes of magnitude 8.5 or greater.9 The last known megathrust occurred in January 1700 and produced a tsunami as far away as Japan.10 The impact of such a tsunami on the west coast would be catastrophic, but the return interval on CSZ events is expected to be 400–600 years. While it is the most headline-grabbing hypothetical natural disaster for the Pacific Northwest, a CSZ event is a small part of a much larger story about the risks the electric grid faces from climate change and natural disasters.
Reliable electricity sources essential for lifeline services
In the Pacific Northwest, lowintensity, highfrequency events include smaller earthquakes, droughts, landslides and floods, and threaten not only electric grid infrastructure, but can also lead to cascading effects on other lifeline services, such as water, oil, fuel, and sewage. These interdependencies are a critical piece of the story, in which all lifeline services are dependent upon the reliable provision of electricity, which in turn is dependent upon other critical infrastructure being operational, especially roads and other transportation infrastructure. The Pacific Northwest faces several of these challenges, and each natural disaster may bring another in turn; earthquakes lead to landslides, droughts increase the risk of flash flooding after heavy rains. The interconnected nature of risks is staggeringly complex.
The most memorable of these natural disasters with “cascading” effects is likely the 2011 magnitude 9.0 earthquake off the coast of Japan, which was followed about an hour later by a 15 meter tsunami that devastated the coastline, disabling the power supply and cooling systems of three Fukushima Daiichi nuclear reactors. The damage caused by the earthquake and tsunami in Japan should be especially concerning for those in the Pacific Northwest who are interested in a CSZ event, or even smaller natural disasters.
Japan has a long history of both earthquakes and tsunamis and the government has dedicated immense resources to increasing the country’s resilience and investing in mitigation strategies. The Pacific Northwest, on the other hand, has a relatively short history of earthquakes. It also has few construction retrofitting requirements and inadequate public funds invested in mitigation. Vancouver, for example, waives earthquake construction requirements for any building under three stories, as though these buildings are not at risk. These policies add an additional layer of risk to the city’s ability to withstand and quickly recover from a catastrophic event.
The Pacific Northwest context

8 Swiss Re Lights out: The risks of climate and natural disaster related disruption to the electric grid
Regional natural disaster risks
Countless risks are associated with natural disasters, impacting every single aspect of a community. An event such as an earthquake will cause immediate losses to residences, businesses and public buildings like hospitals and schools. People may be injured or killed, and many will likely be forced to leave their homes and rely upon the government to provide them with shelter. The interdependent nature of lifeline systems means that electricity cannot be restored until roads and major thoroughfares are repaired and reopened. Without electricity, telecommunications will go down, as will water and sewage treatment and fuel infrastructure. Without the rapid restoration of these vital services, communities will be brought to a standstill. In addition to the immediate aftereffects, communities that are heavily damaged by an event will suffer longlasting economic impacts. If businesses and commerce are disrupted for prolonged periods of time, residents will be unable to earn an income and will continue to rely on government assistance. The longer these impacts last, the more likely it is that many people will consider leaving their communities and search for new opportunities in regions unaffected by the natural disaster.
For some regions of the United States, an outmigration of populations from affected areas would likely lead to the permanent economic decline of cities and the permanent reduction in revenue sources for local governments. It is unlikely that people would return to rebuild if there are limited economic opportunities. For example, it took the economy of Kauai 7–8 years to return to predisaster levels after Hurricane Iniki devastated the island in 1992 (discussed further below), but 18 years following the disaster, the labor force and population had yet to recover.11 Following Hurricane Katrina in 2005, the population of New Orleans dropped dramatically (see figure below), and ten years later, had only returned to 90% of pre2005 levels.12
Source: U.S. Census Bureau
Total population of New Orleans 2000 – 2015; Hurricane Katrina hit New Orleans in 2005
1.5 million
1.0
0.5
0
2000 2002 2004 2006 2008 2010 2012 2014
Rest of metro areaCity
The Pacific Northwest context

Swiss Re Lights out: The risks of climate and natural disaster related disruption to the electric grid 9
Electricity system in the Pacific Northwest
Electricity basics
The electric grid is a vital component of critical infrastructure and lifeline systems all over the globe. In the United States, the electric grid (“the grid”) serves as an essential foundation for modern life. The grid generates, transmits and distributes electric power to millions of homes, schools, commercial and industrial facilities, and government buildings across the country. In this section, we take a closer look at the electricity network in the Pacific Northwest to explain how the grid is impacted by climate and natural disasterrelated risks.
While the electricity network of the Pacific Northwest is complex, there are three basic components common to all grids. The figure below shows the typical electrical path from a power station to a residential building or commercial facility. Electricity is generated at power stations, which use various generation sources, such as traditional fossil fuels (coal, gas, oil), renewables (solar, wind) and water (hydro), to generate power. In the second stage, the electricity is increased in voltage at power stations and then fed into the highvoltage transmission network that spans many states. Finally, the voltage of the electricity is progressively reduced at a series of substations spread throughout the networks until it is “steppeddown” to its final voltage of 110 V for supply to homes and businesses.
Graph showing the electricity transmission path in the grid. More on electricity basics can be found on: EduMission, http://cikguwong.blogspot.com/2011/06/physicsform5chapter3transmission.html.
Power plantgenerates electricity
Transmission lines carry electricity long distances
Transformers on poles step down electricity before it enters houses
Neighborhood transformer steps down voltage
Distribution lines carry electricity to houses
Transformer steps up voltage for transmission

10 Swiss Re Lights out: The risks of climate and natural disaster related disruption to the electric grid
Hydropower generation
For the Pacific Northwest region in particular, hydroelectric power dominates the region’s electricity generation mix. For Washington and Oregon, hydropower comprises 77 and 65 percent13 of their respective total electricity generation, with Washington leading hydroelectric power production in the United States, followed by Oregon14. Oregon and Washington are both surplus power producers, generating more electricity than they consume and supplying Canadian and U.S. markets with significant electricity.15 British Columbia also relies heavily on hydrogenerated electricity, with nearly 92% of electricity generated from hydropower sources.16
Map of hydropower projects in the Pacific Northwest (Washington and Oregon). Data source: The Northwest Power and Conservation Council
Electric grid transmission
The Pacific Northwest is part of the Western Interconnection, the widespread AC power transmission grid that stretches from Western Canada, southward to California, and eastward to the Great Plains. The region also covers the northern part of the Pacific Intertie, a highvoltage DC (HVDC) electric line that connects hydropower supply from the Columbia River Basin to demand in the Los Angeles area. The majority of the transmission infrastructure is owned and operated by the Bonneville Power Administration (BPA). They are regulated and monitored by WECC, the Western Electricity Coordinating Council (WECC), delegated to monitor grid reliability in all 14 U.S. Western states, two Canadian provinces, and the northern part of Mexico.
The Pacific Northwest context

Swiss Re Lights out: The risks of climate and natural disaster related disruption to the electric grid 11
Electric grid infrastructure vulnerability
Hydropower generation
Hydropower generation varies from year to year due to variations in weather and water runoff, changes in the condition of hydropower equipment, competing water demands from nonpower uses such as irrigation, and environmental requirements such as regulations protecting species listed under the Endangered Species Act. Fluctuations in precipitation and runoff, which are indirectly associated with temperature, have a more direct impact on expected hydropower generation.
In most cases, higher average temperatures as a result of climate change may increase the amount of precipitation that falls as rain instead of snow, leading to earlier snowmelt in the spring and overall reduced snowpack. In general, air temperature is projected to increase annually and seasonally for the near term to 2030 and midterm to 2050. However, in the Pacific Northwest, while the increase in temperature may not have a strong direct influence on annual water runoff, it will cause significant changes in seasonality – an earlier snowmelt in spring combined with decreased summer precipitation.
The hydropower shortage in the Pacific Northwest region provides an illustrative example. During the summer of 2010 when the Pacific Northwest experienced the third driest year in the last 50 years and the fifth lowest water level on record since 192917, BPA experienced a net loss of USD 164 million in fiscal year 2010, largely due to belownormal precipitation and streamflows. As a result, the BPA had insufficient hydropower generation to fulfill load obligations.18
Hydropower operation
While higher temperatures are projected to lead to increased winter rainfall that could be used to generate more power, this additional precipitation increases the probability of dam spilling, mostly in April and May.19 This poses challenges to hydropower operation and maintenance, in terms of managing the various other uses of dams, ranging from flood control, navigation, fishery and ecosystem restoration. For example, hydropower plant managers might find there is insufficient water for both power generation and fish conservation, even when there seems to be large volumes of water flowing in the spillway.
Transmission efficiency and capacity
Higher average temperatures can reduce the efficiency and capacity of electric lines and other grid components, such as transformers. For example, a rise in temperature can cause conductors to physically expand, making it more likely for power lines to shut off and cause automatic power outages. The transmission capacity of the grid is put under even greater strain during the summer, when temperatures rise and electricity demand peaks. In Seattle, for example, higher average summer temperatures have forced the Seattle City Light utility to install more cooling fans in control stations to prevent equipment malfunction.20

12 Swiss Re Lights out: The risks of climate and natural disaster related disruption to the electric grid
Earthquake risks
Electric grids are lifelines constructed over broad areas, and thus subject to a wide range of geographic conditions and seismic hazards. Given the dispersed nature of the grid, it is impractical to characterize and remediate hazards across the entire Pacific Northwest region. Another reason why natural disasterrelated risks are hard to define is the interdependency of different infrastructure. The disruption of power storage facilities could impact electricity transmission and distribution, while damage to fuel tanks and resulting liquid fuel leaks could disrupt the generation system and lead to serious environmental damage. It is worth noting that these widespread and interconnected grids are mostly laid out in a northsouth direction, which makes them vulnerable to seismic faults that run parallel.
A graph showing layout and electricity congestion in the PNW grid network. Source: National Electric Transmission Congestion Study, DOE 2006
In the case of Oregon, coastal areas tend to be the closest to identified faultlines, and therefore the closest to the epicenter of future earthquakes and most vulnerable to a CSZ event.21 Much coastal residential property is likely to be damaged or destroyed by a tsunami that could strike within 15–30 minutes of a severe earthquake. Structures not built to modern codes are likely to be destroyed.22 Electrical power will likely fail as transmission and distribution lines are taken down, along with most communication infrastructure. Fuel will be needed for emergency response and for power generation, but fuel tankers and backup generation sources may be difficult to access and/or severely damaged.
The Pacific Northwest context

Swiss Re Lights out: The risks of climate and natural disaster related disruption to the electric grid 13
Recent years have seen a trend of more natural disasters globally, with 191 natural catastrophes in 201623 and a 24 percent increase from the 200724 level. In the United States, 43 natural catastrophes caused huge property losses in 2016, almost double that of 200725. With the increase in natural disasters, the nation’s recent memory of Hurricane Katrina and Superstorm Sandy and the prospect of a magnitude 9.0 Cascadia earthquake, it is imperative that public and private sector entities explore potential solutions for combating and mitigating damage to the electrical grid and disruption from power outages.
Infrastructure resilience strategies
In general, for the electricity sector, strategies can be divided into two categories: system hardening and resilience measures. System hardening, for the purposes of this report, is defined as improvements to the utility’s physical infrastructure to make it less vulnerable to earthquakes and floods. System hardening improves the durability and reliability of transmission and distribution systems and minimizes the strain put on the generation side. Resilience refers to the capacity of utilities to quickly recover from damage to their facilities. Although resilience strategies do not directly prevent disasterinduced power outages from happening, they enable electric facilities to continue daytoday operations after sustaining damage.
Utilities can deploy a variety of strategies to increase resilience in their systems. The first step utilities take, often in conjunction with or at the behest of government agencies (often the state Public Utility Commissions), is to conduct utility vulnerability assessments to identify vulnerable infrastructure and develop resilience plans. Most utilities with whom we spoke (BPA, Seattle City Light) have taken this step and identified resilience and mitigation strategies that they intend to implement. However, implementation processes after these initial assessments vary widely by utility.
Utilities have several options for hardening the resilience of their systems, depending on the specific types of natural hazards they face. Checking poles for rot and moving infrastructure out of flood zones and landslideprone areas help prevent distribution and transmission infrastructure from going down in regions with heavy rainfall and flood risk, like British Columbia and Washington. Tree pruning to ensure that trees do not take down wires is also important in regions experiencing an uptick in highintensity storms, like Seattle.
When it comes to seismic retrofitting, however, policies differ greatly. Utilities pursue their own earthquake retrofit policies, based on their vulnerability assessment results as well as local and state policies. Given that these policies can differ greatly, the structural integrity of building stocks can vary widely by region or even city. Climate change also plays a significant role in terms of what resilience strategies utilities choose to pursue. Stakeholders in both Seattle and Vancouver indicated a lack of concern regarding the potential for longterm droughts to interrupt their stable supply of electricity, and have therefore determined no need to include any drought resilience in their plans (such as the construction of multiyear reservoirs). As both Seattle and Vancouver rely on hydropower to generate 80–90 percent of their electricity, droughts, no matter how unlikely they may be, have the potential to greatly impact the regions’ ability to generate sufficient electricity.
Infrastructure resilience strategies and challenges
Utility workers assessing transmission line repairs after a storm
14 Swiss Re Lights out: The risks of climate and natural disaster related disruption to the electric grid
Challenges and gaps in post-disaster financial recovery
According to the Quadrennial Energy Review by the U.S. Department of Energy (DOE), electricity system outages caused by natural disasters generated between USD 20 billion and USD 55 billion in economic losses annually.26 Although the amount of financial exposure to different disasters on electric transmission and distribution infrastructure is different case by case, understanding how stakeholders bear the financial risks is essential to identifying the financial gaps for future mitigation strategies.
Both public and private entities are involved in maintaining the electric grid in the U.S. On the private sector side, owners of transmission and distribution infrastructure are the primary stakeholders. In vertically integrated electricity markets – the primary market structure for most developing countries – utilities are responsible for managing and repairing the infrastructure. In many developed countries, like the U.S., the electricity market is vertically unbundled so the transmission and distribution infrastructure are owned by different companies from those that own generation infrastructure. This may complicate the ownership composition of interrelated energy infrastructure, and in turn the associated accountability when it comes to postdisaster recovery and restoration.
Different public sector entities bear the financial risks of natural disasters at different levels. In the U.S., the FEMA and the U.S. Treasury bear the financial risk postdisaster at the federal level. After a disaster, they reimburse states for part of the emergency spending and financial losses. At the state and local level, the state, county, and municipal governments bear the financial risks and responsibility for responding to emergencies, including electricity outages.
Due to the extreme difficulty posed by quantifying the financial risk of natural disasters before they occur, private and public sector entities are often reticent to invest in resilience strategies whose return on investment is unknown. As a result, mitigation strategies are not sufficiently funded, and most disasterrelated spending occurs in recovery, postdisaster.
In the U.S., utilities absorb the initial cost of restoring critical infrastructure following a disaster. The cost and economic loss vary not only by the resulting damage to the electric grid, but also by the condition and contingency plans of other critical infrastructure. If roads to substations and power lines are damaged, it delays the utility’s restoration process, and thus results in greater economic loss to utilities. Moreover, the state and federal government are also shortterm financial stakeholders.
In the long run, the governor of the affected state must make a request for a disaster declaration to the President. Once this is granted, negotiations between the chief negotiator (a presidential appointee) and the state’s chief negotiator (chosen by the governor) usually follow. These negotiations shape the size and scope of federal financial assistance. In the event a claim is accepted, FEMA recovery assistance is paid out in two main categories: public assistance (for public facilities and infrastructure) and individual assistance (for individuals and families). For each category, FEMA reimburses at least 75% of recovery costs while the state bears, at most, 25% of the claimed loss. However, the President may choose to waive certain categories so that FEMA pays 100% of the costs for certain categories.
Infrastructure resilience strategies and challenges

Swiss Re Lights out: The risks of climate and natural disaster related disruption to the electric grid 15
Encouraged by Congress to reduce federal spending on emergency aid, FEMA under the Obama Administration proposed a “disaster deductible”27 intended to give states a financial incentive to better prepare for natural disasters on their own, instead of depending too heavily on federal aid. The change would reward states that take steps to mitigate and prepare for disaster risks to pay a lower deductible after the disaster years, given that all states would be responsible for initial shares of disaster costs. These mitigation strategies28 include: adopting tougher building codes, establishing their own emergency management funds, getting insurance coverage for public facilities and infrastructure, and moving lowincome communities out of vulnerable areas. The proposal, which was introduced in May 2016, could become a promising first step to incentivize states and communities to increase resilience and predisaster preparedness, instead of focusing too heavily on postdisaster rebuilding.
There are two major challenges that can cause financial difficulties after a disaster. First, although financial risks are largely concentrated at the federal and state level, they are ultimately passed onto taxpaying residents in the long run. Federal disaster aid and FEMA funding, which most states traditionally rely on, come directly from taxpayers. A rise in electricity prices and taxes may affect the longterm economic recovery of a region if the cost of living becomes higher than neighboring areas, and employment opportunities in the short term are harmed.

16 Swiss Re Lights out: The risks of climate and natural disaster related disruption to the electric grid
According to the United Nations Framework Convention on Climate Change (UNFCCC), 56% of population relocation is caused by floods.29 Natural disasters affect not only those living in the disaster area, but can also have farreaching economic, social, political, and humanitarian effects far beyond affected areas. With more people emigrating from the affected region, utilities and state governments will generate less tax revenue and will be unable to recover their costs. Moreover, tax disruption in the event of a disaster is not covered by FEMA.
Even after a storm passes or a wildfire is extinguished, displaced people and shuttered businesses impose ongoing financial burdens on communities. The U.S. Bureau of Labor Statistics, for example, found that New Orleans lost 95 000 jobs and an estimated USD 2.9 billion in wages during the first 10 months after Hurricane Katrina.30 From the business side, it made the city less attractive to new businesses and investment since the employee base declined relative to other regions. In the long run, financial incentives would be needed by the state government to attract investment into the state, which means more government spending in the future.
The second major challenge for the electric grid is that traditional insurance approaches are unsuitable. Most utilities can only insure their generation stations, as transmission and distribution lines are too expensive to insure with commercial insurance. In addition, some states’ regulatory compacts, the legal structures governing the relationship between customers and utilities, prohibit public utilities from encumbering ratepayers with the costs of prohibitively expensive insurance policies. Utilities must justify any planned investments, both to the public and to PUCs. Furthermore, utilities can generally only charge customers for investments that are “used and useful” for providing utility service. While it may take a utility over a year to build a power plant or expand a transmission line, costs cannot be factored into rates until the infrastructure is fully operational.
While there are serious gaps in postdisaster financial recovery in the U.S., the situation tends to be worse in developing and even middleincome countries with underdeveloped insurance markets. For example, China’s natural disaster responses are highly dependent on social donations and central government payouts.31 Ultimately, the lack of suitable commercial insurance coverage for the electric grid greatly exacerbates economic losses caused by natural disasters.
The following sections are case studies focused on two areas in the United States: Hawaii and Oregon. We also provide a comparative study for British Columbia, Canada. These case studies illustrate challenges and strategies in different regions.
Infrastructure resilience strategies and challenges

Swiss Re Lights out: The risks of climate and natural disaster related disruption to the electric grid 17
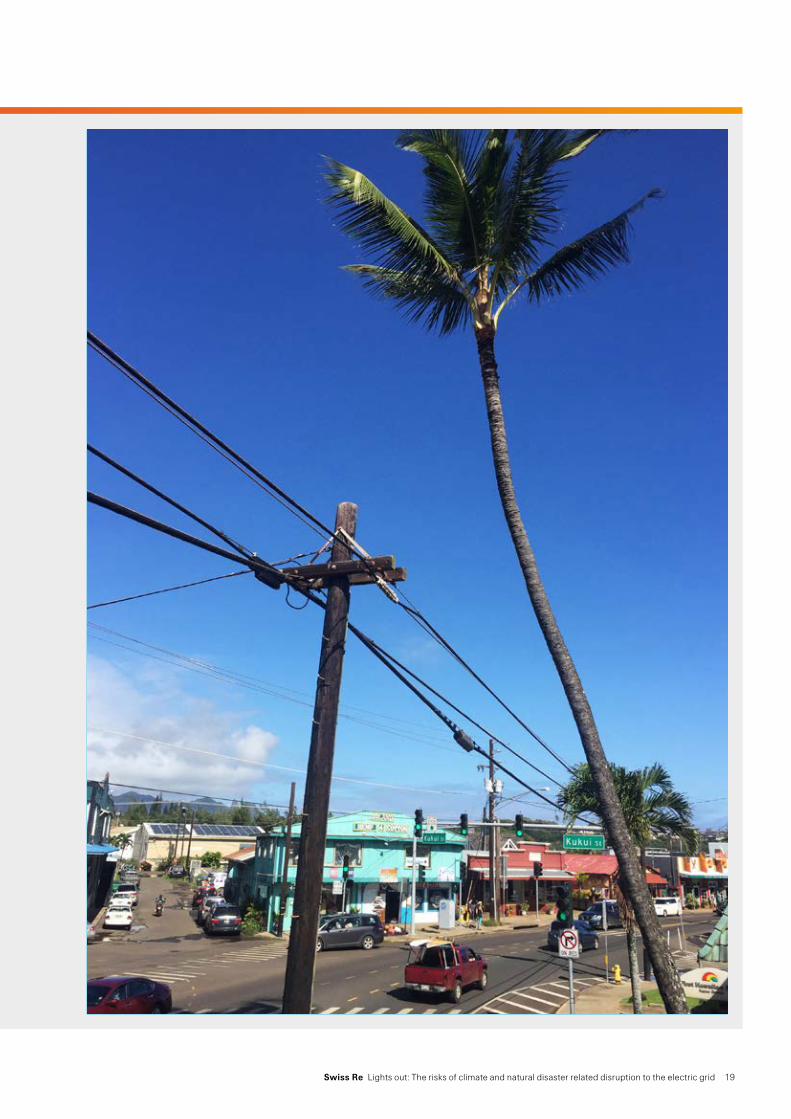
On 11 September 1992, Hurricane Iniki, the most powerful hurricane to strike the state of Hawaii in recorded history, made landfall on the island of Kauai. The ensuing damage to critical infrastructure serves as an illustrative case study in natural-disaster related electric grid disruption and post-disaster financial recovery.
Hurricane Iniki destroyed much of the island’s distribution and transmission infrastructure (substations, transmission towers, poles and transformers), knocking down 5 000 utility poles and nearly 17 000 telephone poles. High winds downed 26.5% of transmission poles, 37% of distribution poles, and 35% of the island’s 800 mile long distribution wire system.32 Generation facilities, however, remained functional. Electricity and television services were disrupted on the entire island for weeks to months in some areas. Within four weeks, utilities were able to restore power to 20% of the island, but fully restoring electricity took nearly three months.33
Infrastructure repair process – no easy task
For nearly two and a half months, diesel generation was used to keep lifeline services (eg sewer systems, electricity in hospitals) functioning and to power facilities and equipment used by emergency responders. Islanders also relied on coal and other biomass fuels for cooking until power was fully restored. The Kauai Electric Utility, as it was known then, worked to repair downed poles, wires, and towers and finally restored electricity to the island on 25 November 1992.
To expedite the restoration process, employees used helicopters, working together with linemen on the ground.34 The restoration process met another challenge due to supply chain problems (Hawaii Electric Utility was unable to procure wood for poles quickly enough due to another natural disaster that had increased demand for wood). “Getting all the poles up and the power back on to everyone on Kauai was going to take 6 months according to initial estimates, but with the help of HECO, MECO, HELCO and even crews from the mainland, the last circuit in Kalihiwai on Kauai’s North Shore was energized in less than 3 months, just days before Thanksgiving,” recalled Dan Cooke, Weather Anchor for Hawaii News Now.35
The scale of postdisaster financial recovery
For stakeholders in the public and private sector, Hurricane Iniki is also particularly insightful in terms of understanding postdisaster financial recovery – which entities bear the recovery costs and where they tend to be concentrated. Hurricane Iniki was the most expensive hurricane to strike the state of Hawaii in its recorded history, resulting in USD 1.8 billion in damage in 1992 USD.36 Hurricane Iniki also wrought the most damage on the island of Kauai, disrupting electricity for months, destroying thousands of homes, and causing six fatalities. Storm surge destroyed 63 homes, while high winds destroyed 1 421 homes. Another 5 152 homes were badly damaged, while 7 178 experienced minor damage, leaving nearly 7 000 people homeless after the hurricane.37 Hotels and condominiums on the south coast of Kauai were also badly damaged, with some taking years to rebuild, thus disrupting Kauai’s tourism industry, a vital part of the economy.
Hurricane Iniki,Kauai
Case studies
This section includes case studies in Hawaii, the Pacific Northwest, and British Columbia, Canada. The case studies illustrate the challenges in different regions.

18 Swiss Re Lights out: The risks of climate and natural disaster related disruption to the electric grid
The total cost of damage associated with Hurricane Iniki, in equivalent 2016 USD, is estimated at USD 3.1 billion (USD 1.8 billion in 1992 USD).38 It remains one of the most costly recorded hurricanes in the eastern Pacific. In October 1992, Hawaii Electric Utility, a subsidiary of Hawaiian Electric Industries Inc. (HEI), reported thirdquarter losses of USD 36.9 million, attributing those losses to Hurricane Iniki and “the cost of leaving the wind energy business.”39 “Because of communication and transportation problems it [was] difficult to assess the extent of the damage to our insurance customers on Kauai,” said Robert F. Clarke, then Hawaiian Electric Industries (HEI) president and chief executive officer.40 The hurricane also caused an estimated USD 1.6 billion in insured property damage. Clarke also noted that “damage was much worse than our earlier estimate ... Claims processing [had] been slow and is still not complete because of the magnitude of the destruction, the tremendous claims volume and the island’s isolated location.”41
On 12 September 1992, the federal government issued a Major Disaster Declaration for the state of Hawaii, initiating a FEMA response. Individual assistance was delivered to Hawaii County, Honolulu County, Kalawao County, Kauai County and Maui County. All five counties also received public assistance under categories A–G. FEMA assisted with infrastructure repair and also provided grants worth a maximum of USD 10 000 per household, a small fraction of repair costs.42
In 1993, the state established the Hawaii Hurricane Relief Fund (the Fund) to “provide hurricane property insurance policies in Hawaii in the event they are not available in the private market.”43 The Fund also protected homeowners against default by insurance companies and covered windloss and other damages. In December 2000 the Fund was retired and stopped writing hurricane insurance policies due to the increased availability of private sector hurricane insurance coverage.
Hawaii Governor Neil Abercrombie signed a bill (SB 1270) in June 2011 appropriating USD 42 million from the Fund to the state’s General Fund to balance the state budget. The bill also allows the governor to make future transfers from the Hurricane Reserve Trust Fund to the General Fund to balance the budget. In 2012, Hawaii’s state auditor criticized the use of the Fund: “In our review we noted funds of approximately USD 166 million were used in FY2012 from the Hawaii Hurricane Relief fund that did not serve the purpose for which the trust fund was originally established.”44
Protecting electricity infrastructure – who bears the costs?
FEMA Public Assistance was not enough to cover all electricity infrastructure restoration costs; the remaining financial burden was passed onto the Kauai Electric Utility, and then ultimately onto ratepayers. Kauai Electric Utility, like other electric companies, only insured its generation stations. As previously noted, transmission and distribution lines were and continue to be too expensive to insure with commercial insurance. As in other states, Hawaii’s state regulatory compact also prohibits public utilities from encumbering ratepayers with the costs of prohibitively expensive insurance policies.
The goal of Hawaii’s Public Utility Commission (PUC), and that of other state’s PUCs, is to keep utilities financially solvent so that they can access credit markets. Utilities also rely on equity reserves to cover restoration costs after a catastrophic natural disaster, as opposed to conventional commercial insurance.45 The example of the Kauai Electric Utility is consistent with that of other electric companies, as a report by George Mason University School of Law reveals: “Insurance today is not seen as a tool for protecting the electricity infrastructure.”46
Ultimately, the utility restoration costs for Hurricane Iniki were passed onto taxpayers. Ratepayers, dissatisfied with the holding of the PUC to pass those costs onto them, sued Kauai Electric Utility. The case was decided in favor of the utility company.
Hurricane Iniki,Kauaicontinued
Case studies
Swiss Re Lights out: The risks of climate and natural disaster related disruption to the electric grid 19

Oregon
20 Swiss Re Lights out: The risks of climate and natural disaster related disruption to the electric grid
Oregon is highly vulnerable to floods, droughts and earthquakes. In addition to natural disasters, climate change is expected to increase the average temperature of the state, which may increase precipitation falling as rain instead of snow, leading to earlier snowmelt in the spring47. This would change the volume of water stream and create challenges for hydroelectric stations – responsible for more than 65 percent of electricity generation in Oregon – in managing and adapting their power generation pattern.48
According to experts at the Northwest Power and Conservation Council, the worst case scenario of hydro generation adequacy is a 5% decrease of original loaded capacity,49 but the impact that climate change will have is still uncertain. Other than generation, the electric grid in Oregon is also highly vulnerable to natural disasters. Landslides triggered by earthquakes and/or floods present a real risk. According to Oregon’s Public Utility Commission, in the event of a magnitude 9.0 earthquake, more than 50 percent of substations would be damaged beyond repair.50 After such a disaster, it is estimated to take about two years to restore only 10–20 percent of the electrical grid, and could take several years to restore the entire system.51
Case studies

Swiss Re Lights out: The risks of climate and natural disaster related disruption to the electric grid 21
Disaster preparedness and recovery
In May 2015, the Oregon State Legislature created the position of an Oregon State Resilience Officer (the Officer) to “lead the state’s efforts with Cascadia earthquake preparedness and other disaster resiliency.”52 The Officer works with key agencies and stakeholders involved in disaster preparedness and recovery to advance legislative and policy action, and identify gaps and challenges to achieving a statewide resiliency strategy. This position helps the state in the development of a comprehensive contingency plan for disaster preparedness.53
Before the disasterTo confront the risks posed by earthquakes and floods, Oregon is working to mitigate future damage by assessing the potential physical and economic losses, hardening critical infrastructure or relocating it, and planning emergency response strategies. Mitigation strategies for cooperation between the public and private sectors and contingency plans are tailored for each potential disaster scenario.
Since Oregon initiated its mitigation effort to address natural disasters, several studies and reports have been published exploring earthquake risk and how to mitigate the risk. In 2012, the Oregon Department of Geology and Mineral Industries (DOGAMI) published a report arguing that major seismic vulnerabilities exist in the Critical Energy Infrastructure Hub of Oregon.54 The vast majority of the facilities are constructed on soil susceptible to liquefaction, and several critically important structures are susceptible to significant damage from a major earthquake. For electric utilities, the expected length of time to resume services after a Cascadia earthquake has not been evaluated by any company except BPA.
In 2013, Oregon formed a Seismic Safety Policy Advisory Commission (OSSPAC) and proposed the Oregon Resilience Plan to the state legislature. The plan recommends policies and investment priorities in Oregon from 2013 to 2018 with the goal of mitigating the risks posed by earthquakes and tsunamis.
Oregon traditionally finances its resilience programs through bond issuance. The majority of financing for schools and emergency facility retrofitting programs comes from taxpayerfunded bonds. However, most electric grids are privately owned, and utilities such as Portland General Electric (PGE) and Eugene Water and Electric Board (EWEB) play a critical role in investing in their own contingency plans to mitigate the risk. Most utilities follow three steps: identify the most vulnerable infrastructure and assets, harden the infrastructure, and plan for emergency response. For example, EWEB completed its strategic planning in 2013 along with the Oregon Resilience Plan of 2013, and is cooperating with Electric Engineering and Operations to designate yearly capital spending on transmission and distribution infrastructure to enhance its flexibility and resilience.55
Improving resilience – the challenges
One challenge utilities investing in improving resilience face is calculating financial risk before disasters. It also takes a long time to conduct the costandbenefit analysis. For example, it took Portland General Electric (PGE) four years to develop a risk model to defend investment in resilience over seismic risk.56
Similar mitigation procedures apply to preparation for floods, but another critical infrastructure to floods is hydroelectric dams. According to Oregon Water Resources Department, every large dam must pass periodic safety reviews. For highhazard dams, there is a safety review every year, and for lowhazard dams, there is a safety review every five years.57 Hazard levels are determined based on populations that would be impacted by a downstream flood. On top of government safety reviews, PGE also requires its dam operators to evaluate how climate change might impact the maximum flood level every year. This is needed for dams to ensure that they will be able to continue to function safely under climate change conditions.

Oregoncontinued
22 Swiss Re Lights out: The risks of climate and natural disaster related disruption to the electric grid
At both the federal and state level, operators of big dams are required to develop and implement an emergency action plan, which is practiced every year, organized and approved by the Oregon Water Resources Department. Utilities practice how to respond to high water levels, send out an emergency report, call for first response, and engage with the sheriff, FERC and other officials managing electricity services.
After the disasterAs stated in the plan, the Oregon state government and utilities will purchase diesel used by backup generators for the first 30 days,58 during which it will restore the transmission and distribution (T&D) facilities. Because T&D facilities are generally not insured by traditional insurance products, utilities bear the entire initial restoration costs upfront, but can file claims to the state government for reimbursement from FEMA. Meanwhile, the Oregon state government plans to waive the cost of the fuel for backup generators during the first 30day postdisaster.59 The fuel is mainly accessed and used to keep emergency and critical infrastructure functioning, especially for hospitals and schools, and for emergency response vehicles.60
In most cases, utilities are responsible for dealing with risks associated with natural disasters and other hazardous events, imposed on their energy infrastructure. The insurance industry has traditionally played an important role managing risks for U.S. states’ critical infrastructure61. Through insurance, owners and operators can choose to manage risks either by accepting and mitigating risks on their own, or by transferring risks through purchasing insurance products. For many utilities, however, risk transfer is less appealing when insurance products are too costly relative to the perceived probability and magnitude of loss. Utilities and asset owners often choose to selfinsure, setting aside funds to specifically cover the costs of potential damage after disasters strike.
During the course of this study, electric utilities tend to regard traditional insurance as expensive and having limited capacity to insure transmission and distribution assets. This is because T&D insurance products are difficult to generate due to jurisdictional issues, and T&D infrastructure such as wires and poles are sufficiently dispersed. According to a study done by George Mason University in 2005, the administrative costs involved with managing and renewing policies, as well as the relative cheaper costs to repair and replace after small events made traditional insurance unappealing62. As a result, when natural catastrophes which utilities previously regard as rare do happen, the utilities may turn to state and federal governments for reimbursement. In the long run, FEMA bears most of the financial risk.
Case studies

Swiss Re Lights out: The risks of climate and natural disaster related disruption to the electric grid 23
Financial risk exposure
According to Oregon’s Office of Emergency Management, FEMA pays out at least 75 percent of the state’s claimed financial losses, and the payout falls into two categories: public assistance and individual assistance.63 Individual assistance targets renters and homeowners while public assistance helps reimburse the government and the loss of critical infrastructure, including utilities.
Significant challenges remain, however. Despite FEMA’s policy, the final coverage and the timeline of reimbursement largely depend on the political relationship between the governor and the President. After a presidential declaration, Congress generally passes bills to assist the state financially postdisaster. This adds uncertainty to the state government’s financial risk exposure, which makes resilience and mitigation planning difficult at the state level. Moreover, as congressional resources are directed towards the public sector, businesses often struggle to get reimbursed.
Ultimately, taxpayers and ratepayers in Oregon bear the rest of the financial burden and uncertainty after a natural disaster. This financial uncertainty is also the main risk the state government is attempting to mitigate through predisaster planning, especially by hardening critical infrastructure. If the state and municipalities do not have an integrated mitigation plan, financial reserves, or access to credit markets, they may resort to raising taxes to cover the costs of postdisaster financial payouts. However, increasing taxes after a disaster might worsen an affected area’s economic recovery, by increasing outmigration and decreasing investment and business activity.
In pursuit of best practices
Overall, Oregon is a leader in implementing natural disaster mitigation strategies. Electricity, as a critical piece of infrastructure, has been addressed and integrated into the state’s predisaster mitigation plans and postdisaster recovery plans. Although challenges remain, the state continues to pursue best practices that are currently being developed and deployed in other U.S. states and countries.

Comparative perspective:Canada
24 Swiss Re Lights out: The risks of climate and natural disaster related disruption to the electric grid
When evaluating electric grid resilience issues in the Pacific Northwest, it is important to look at the respective and shared grid infrastructure between the United States and Canada, because the interconnected electricity network extends north to the provinces of Alberta and British Columbia of Canada. As one of the 100 Resilient Cities,64 Vancouver faces challenges similar to many U.S. cities in the Pacific Northwest. The United States and Canada have different approaches to mitigating climate change risks, however. Like Washington, British Columbia is a very wet region and relies heavily on hydropower for energy production; in 2016, Vancouver’s dependence on hydropower accounted for over 90% of its electricity generation. Periods of heavy rain mean that the region’s publicly-owned utility, BC Hydro, can generate sufficient electricity for Vancouver and sell excess generation down to U.S. states.
Climate change is expected to deliver even more rain to the region, resulting in an earlier and longer spring runoff increasing the amount of electricity BC Hydro can generate. The company also retains a decommissioned gas plant that can be brought back online should the hydro system be damaged by a natural disaster.
What if a natural disaster destroyed electric infrastructure in the region?
According to Natural Resources Canada, there is a oneinten chance of a massive earthquake hitting the British Columbia coast of Canada in the next 50 years.65 Like the United States, Canada has its own version of FEMA, Public Safety Canada (PSC), legally incorporated as the Department of Public Safety and Emergency Preparedness, which is tasked with ensuring public safety in Canada, including emergency preparation and management.
Although Canada has seen increasingly more natural disasters, with Hurricane Igor creating havoc in Newfoundland66 and flooding in B.C. affecting many communities,67 the Department seems to pay insufficient attention to those risks. Among the top six priorities the Department identified in 2016,68 only one area of focus is related to emergency management of resilience and the “risk environment”69 in general. And while specific mention of natural disaster risks is included in the priorities of its 2017–18 plan,70 it remains to be seen how funding would be allocated, given expected budget cuts for PSC’s emergency programs71 in recent years. Unlike FEMA, the Department of Public Safety is not as well capitalized, and therefore unable to provide as much financial assistance to communities devastated by natural disasters. Postdisaster financial recovery in Canada is further complicated by the large discrepancy between the Canadian insurance industry’s capacity to pay out insurance claims and the expected value of the damage from a potential catastrophe, which the Canadian federal government does not cover.
Case studies

Swiss Re Lights out: The risks of climate and natural disaster related disruption to the electric grid 25
In addition to financial gaps in the wake of natural disasters, Canada faces infrastructure challenges to its electric grid. For example, building codes in Vancouver apply seismic standards solely to buildings that have three or more stories.72 As a result, buildings under that height limit are not required to retrofit and are vulnerable to being damaged by even a moderate seismic event, which is notable considering Canada would also be affected by a Cascadia Subduction Zone event. Under these circumstances, Canada’s provinces are pursuing alternative strategies to mitigating local risk and shared risks.
The power of strong bilateral cooperation
In March 2016, then U.S. President Barack Obama and Canadian Prime Minister Justin Trudeau issued the “U.S.Canada Joint Statement on Climate, Energy, and Arctic Leadership.”73 In this Statement, the U.S. and Canada pledged to develop strategies to strengthen the security and resilience of the North America electricity grid, and to work together to fight against climate change impacts. The two governments also established an interagency, bilateral Policy Committee to review past and current efforts to complete this objective.
This progress is only possible based on the strong bilateral cooperation between these two countries, whose collaboration can be traced back to the Columbia River Treaty74 signed in the 1940s. The treaty was originally designed for the Canadian side to provide flood control and management for the downstream U.S. states, while allowing electricity transmission from Oregon and Washington to also supply Western Canadian provinces. However, environmental conditions have changed during the past decades, especially climate patterns and hydrologic flows, which affect hydro operations such as fish and wildlife management, navigation, and water supply.
The U.S. and Canadian Entities (U.S. Army Corps of Engineers & BPA and BC Hydro) are reviewing the Columbia River Treaty and studying environmental conditions in the region. The U.S. entity recommended neither termination of the Treaty nor the maintenance of the status quo, calling instead for the two nations to negotiate a “modernized” treaty with modifications that respond to current issues with flood control, coordinated power operations, ecosystem needs, and the calculation and sharing of benefits.

Innovations in disaster preparedness are coming from both the public and private sector, and range from risk transfer mechanisms to increased reliance on distributed energy sources. With regards to financial mechanisms, products such as parametric insurance and catastrophic bonds are increasingly viewed as part of a comprehensive risk management strategy. For example, parametric insurance, which disburses payments based on a triggering event (such as a magnitude 6.0 or greater earthquake), allows policyholders to tailor coverage to their specific risks.
For utilities, mutual risk pools such as AEGIS and ACE Power & Utilities have also emerged as an alternative to commercial insurance. To reduce their dependence on the traditional grid, many utilities in the Pacific Northwest are also taking steps to diversify their generation mix with more distributed energy sources and greater reliance on renewables. State governments have also embraced new models to reduce their own financial liability. California recently pioneered a law mandating that insurance companies offer earthquake insurance for property owners; Oregon State is currently following suit with a similar proposal.
Innovative approaches on the horizon
26 Swiss Re Lights out: The risks of climate and natural disaster related disruption to the electric grid

Conclusion
A holistic approach to addressing the evolving risk landscape of the Pacific Northwest region is needed in order to achieve electricity reliability and infrastructure resiliency. This includes the dynamics of shifting electricity supplyanddemand, the effects of natural disasters and extreme weather, as well as the interactions of policies and regulations which add another layer to the already complex electricity system.
Leveraging limited public resources
Changing climate patterns put additional strain on both power generation and transmission, and present an additional risk factor for natural disaster mitigation and recovery – increasing the intensity and frequency of hazardous events, and potentially straining the region’s energy system. Given these real and evolving risks, state governments and local communities need to continue to raise awareness of natural disaster risks and climate change. They should also continue to explore ways to leverage limited public resources through innovative partnerships with the private sector.
Ultimately, governments in the Pacific Northwest have become regional and national leaders in the development of risk mitigation and resilience strategies to build a more resilient energy future for the communities they serve.
Swiss Re Lights out: The risks of climate and natural disaster related disruption to the electric grid 27

28 Swiss Re Lights out: The risks of climate and natural disaster related disruption to the electric grid
1 The Western Electricity Coordinating Council (WECC). (2016). 2016 State of the Interconnection. Salt Lake City: WECC. https://www.wecc.biz/Reliability/2016%20SOTI%20Final.pdf
2 “Quadrennial Energy Review: First Installment.” U.S. Department of Energy. April 21, 2015: 2–6. Retrieved: https://energy.gov/epsa/quadrennialenergyreviewfirstinstallment
3 The Oregon Resilience Plan: Reducing Risk and Improving Recovery for the Next Cascadia Earthquake-and Tsunami. (2013). Salem: Oregon Seismic Safety Policy Advisory Commission (OSSPAC).
4 The Western Electricity Coordinating Council (WECC), (2014), 2–6, Capital Costs for Transmission and Substations, Black & Veatch. https://www.wecc.biz/Reliability/2014_TEPPC_Transmission_CapCost_Report_B+V.pdf
5 Ibid6 The Western Electricity Coordinating Council (WECC). (2016). 2016 State of the Interconnection.
Salt Lake City: WECC. https://www.wecc.biz/Reliability/2016%20SOTI%20Final.pdf7 “Quadrennial Energy Review: First Installment.” U.S. Department of Energy. April 21, 2015. Retrieved:
https://energy.gov/epsa/quadrennialenergyreviewfirstinstallment8 Schulz, K. (2015, July 20). The Earthquake That Will Devastate the Pacific Northwest. Retrieved July 06,
2017, from http://www.newyorker.com/magazine/2015/07/20/thereallybigone9 “Cascadia Subduction Zone.” Pacific Northwest Seismic Network. https://pnsn.org/outreach/earthqua
kesources/csz 10 Ibid11 Coffman, Makena. “A Hurricane’s LongTerm Economic Impact: the Case of Hawaii’s Iniki.” June 2009.
http://www.uhero.hawaii.edu/assets/WP_20096.pdf 12 Eaton, Leslie and Cameron McWhirter. “New Orleans’s Uneven Revival in Decade After Katrina.”
Wall Street Journal. August 26, 2015.13 U.S. Department of Energy Office of Energy Policy and Systems Analysis. (2015). Climate Change
and the U.S. Energy Sector: Regional Vulnerabilities and Resilience Solutions. Washington DC: U.S. Department of Energy. Retrieved from: https://energy.gov/sites/prod/files/2015/10/f27/Regional_Climate_Vulnerabilities_and_Resilience_Solutions_0.pdf
14 Ibid.15 U.S. Energy Information Administration. (2016). Electric Power Annual 2015. Washington, DC:
U.S. Department of Energy. Retrieved from: https://www.eia.gov/electricity/annual/pdf/epa.pdf 16 BC Hydro. (2015). BC Hydro. Retrieved Generation Type, Rates & CO2 Emissions. Retrieved from:
https://www.bchydro.com/accountsbilling/ratesenergyuse/electricityrates/residentialrates/generationratesco2comparison.html
17 U.S. Department of Energy, Homeland Security. (2011). Dams and Energy Sectors Interdependency Study. Retrieved from: https://energy.gov/sites/prod/files/DamsEnergy%20Interdependency%20Study.pdf
18 U.S. Department of Energy. (2016). The Energy Sector’s Vulnerabilities to Climatic Conditions. Retrieved from Energy.gov. Retrieved from: https://energy.gov/maps/climatevulnerabilities#water
19 Grainey, M. (2017, March). Hydroelectric Program Coordinator, Hydroelectric Section, Oregon Water Resources Department. (J. PriceMadison, A. Korbatov, Y. Wang, Y. Xu Interviewer)
20 Morgenstern, Tracy M. (March 2017). Seattle City Light. Policy Adviser. Office of Sustainability and Environment. City of Seattle. (J. Price Madison, A. Korbatov Interviewer).
21 The Director of Oregon Emergency Management. (2012). State of Oregon Cascadia Subduction Zone Catastrophic Earthquake Retrieved from: http://uploads.westernenergy.org/2015/12/09114712/OR_CSZ_Plan_Complete.pdf
22 Ibid.23 Swiss Re (2017). “Natural Catastrophes and Manmade Disasters in 2016: a Year of Widespread Damages,”
Sigma No 2/2017. Retrieved from http://media.swissre.com/documents/sigma2_2017_en.pdf.24 Swiss Re Sigma World Insurance Database (19702016). http://www.sigmaexplorer.com/25 The number of catastrophes only includes catastrophes causing insured property losses of at least
USD 25 million (1997 dollar) and affecting a significant number of policyholders and insurers. When taking into account losses covered by the federal administered National Flood Insurance Program (NFIP) and uninsured losses, the number would be even bigger. Source: Estimated Insured Property Losses, U.S. Catastrophes, 2007–2016. Insurance Information Institute. Retrieved from: http://www.iii.org/tablearchive/20922.
26 Quadrennial Energy Review: First Installment.” U.S. Department of Energy. April 21, 2015: 26. Retrieved: https://energy.gov/epsa/quadrennialenergyreviewfirstinstallment
27 Emergency Management. “FEMA’s New ‘Disaster Deductible’ Shifts Responsibility to States”, May 31, 2016, http://www.govtech.com/em/disaster/FEMAsnewdisasterdeductibleshiftsresponsibilitytostates.html?flipboard=yes&utm_source=feedburner&utm_medium=feed&utm_campaign=Feed%3A+emergencymgmt%2FHvhi+(Emergency+Management).
28 Public Assistance Deductible. (FEMA). Retrieved June 22, 2017, from https://www.fema.gov/deductible
29 UNFCCC, “ New Data Brings New Answers on Climate Migration, Experts Set Out Latest Advances in Bonn”, May 19, 2016, http://newsroom.unfccc.int/unfcccnewsroom/humanmobilityandtheparisagreement/
30 Center for American Progress, The Costs of Climate Inaction: How Extreme Weather Burdens U.S. Taxpayers, September 22, 2016. https://cdn.americanprogress.org/wpcontent/uploads/2016/09/21081429/CostsOfClimate.pdf
31 He Wang (2014), “巨灾保险制度要完善灾后重建管理机制 (Catastrophe Insurance Needs to Improve Postdisaster Restoration Mechanism) ”, Retrieved on May 12, 2017. http://finance.sina.com.cn/zl/insurance/20140312/182518487770.shtml
32 Unknown (1992). "Broadcast Journalism: Write to the Bite". Unknown. Retrieved 20170411.
Endnotes

Swiss Re Lights out: The risks of climate and natural disaster related disruption to the electric grid 29
33 Central Pacific Hurricane Center. The 1992 Central Pacific Tropical Cyclone Season (Report). United States National Oceanic and Atmospheric Administration's National Weather Service. Retrieved November 28, 2007.
34 Cooke, Dan. “Restoring electricity after Iniki was no easy task.” Hawaii News Now. 2012. http://www.hawaiinewsnow.com/story/19530534/hurricaneinikirestoringelectricity.
35 Ibid36 National Hurricane Center (2004). "Costliest U.S. Hurricanes 1900–2004 (unadjusted)". Retrieved
20170411.37 Central Pacific Hurricane Center. The 1992 Central Pacific Tropical Cyclone Season (Report).
United States National Oceanic and Atmospheric Administration's National Weather Service. R etrieved November 28, 2007.
38 National Hurricane Center (2004). "Costliest U.S. Hurricanes 1900–2004 (unadjusted)". Retrieved 20170411.
39 Hawaiian Electric Industries, INC. “Begins Hurricane Iniki Damage Assessment”, The Free Library. (2014). Retrieved Apr 13 2017 from https://www.thefreelibrary.com/HAWAIIAN+ELECTRIC+INDUSTRIES%2c+INC.+BEGINS+HURRICANE+INIKI+DAMAGE...a012557812.
40 Ibid41 Unknown author. “Hawaiian utility loses USD 36.9 million.” UPI Archives. October 12, 1992.
http://www.upi.com/Archives/1992/10/20/Hawaiianutilityloses369million/3504719553600/. 42 Henry Fox, Stephen. “Reality Check on FEMA’s Denial of Disaster Declaration.” HuffingtonPost.com.
September 3, 2014. http://www.huffingtonpost.com/stephenhenryfox/femasdenialofdisasterdeclaration_b_5734366.html
43 DCCA Hawaii. (n.d.). Hawaii Hurricane Relief Fund. Retrieved from DCCA Hawaii: http://cca.hawaii.gov/ins/hawaiihurricanerelieffund/
44 “Auditor attacks use of Hawaii Hurricane Fund.” Pacific Business News. November 5, 2015. http://www.bizjournals.com/pacific/news/2015/11/05/auditorattacksuseofhawaiihurricanerelief.html.
45 “The insurance obtained in the electricity sector is designed to reduce liability, not prevent catastrophic or terrorist related damage to the electricity infrastructure. During the course of the study, electric utilities did not express an active desire for new or enhanced insurance products. The sector representatives appeared to be satisfied with the arrangements currently in place. The insurance industry is focused on the standard operational functions of business, consumer type tort lawsuits involved in personal injury, and property damage backing. Insurance offerings in the electricity sector covers generation much more comprehensively than transmission and June 21, 2005 1 distribution. Transmission and distribution insurance products are difficult to generate because of jurisdictional issues. Also, transmission and distribution assets are sufficiently dispersed because it is cheaper to repair or replace than to insure for repair and replacement. Unfortunately, the administrative costs involved with managing and renewing policies make purchasing insurance unappealing in comparison with covering a company’s own transmission and distribution losses.” Frye, Emily; Emmons, Kathy. (June, 2005). Insurance and the Nation’s Electrical Infrastructure: Mutual Understanding and Maturing Relationships, George Mason University of Law. http://cip.gmu.edu/wpcontent/uploads/2016/06/CIPHS_InsuranceandtheNationsElectricalInfrastructure_WhitePaper.pdf.
46 Ibid47 Meeting with Pacific Northwest Utilities Conference Committee, March 24, 2017. Portland, Oregon
(J. PriceMadison, Y.Wang, Y. Xu Interviewer)48 U.S. Department of Energy Office of Energy Policy and Systems Analysis. (2015). Climate Change and
the U.S. Energy Sector: Regional Vulnerabilities and Resilience Solutions. Washington DC: U.S. Department of Energy. Retrieved from: https://energy.gov/sites/prod/files/2015/10/f27/Regional_Climate_Vulnerabilities_and_Resilience_Solutions_0.pdf
49 PNUCC, (2016, November), “The Value of Hydropower to the Northwest Grid”,P4, http://www.pnucc.org/sites/default/files/Value%20of%20Hydro%20PNUCC%20Nov%2022%202016_0.pdf
50 Meeting with Oregon’s Public Utility Commission, March 23, 2017. Salem, Oregon. (J. PriceMadison, A. Korbatov, Y. Wang, Y. Xu Interviewer)
51 Ibid.52 Patrick Sieng, “Harryman Appointed as New State Resiliency Officer”, published June 16, 2016
http://oregoncounties.org/harrymanappointednewstateresiliencyofficer/.53 Oregon State Resilience Officer Mike Harryman is responsible for convening relevant agencies on a
regular basis to discuss resilience planning and challenges, including the Department of Geology and Mineral Industries (DOGAMI), Oregon State Representative, Oregon Public Utility Commission, Oregon Department of Energy, Water Resources Department, and Pacific Northwest National Laboratory.
54 Wang, Y., Bartlett, S., & Miles, S. (2012). Earthquake Risk Study for Oregon's Critical Energy Infrastructure Hub. Oregon Department of Geology and Mineral Industries. https://www.oregon.gov/energy/docs/Earthquake%20Risk%20Study%20in%20Oregon%E2%80%99s%20Critical%20Energy%20Infrastructure%20Hub%202013.pdf
55 EWEB (2015). 2015 EWEB Strategic Plan: Board Update. Eugene Water and Electric Board.56 Koho L. (2017, March). Administrator of Safety, Reliability and Security Division, Oregon Public Utility
Commission. (J. PriceMadison, A. Korbatov, Y. Wang, Y. Xu Interviewer)57 Grainey, M. (2017, March). Hydroelectric Program Coordinator, Hydroelectric Section, Oregon Water
Resources Department. (J. PriceMadison, A. Korbatov, Y. Wang, Y. Xu Interviewer)58 Martin, B. (2017, March). Program Analyst Team Lead, Operations & Preparedness Section, Office of
Emergency Management. (J. PriceMadison, A. Korbatov, Y. Wang, Y. Xu Interviewer)59 Harryman, M. (2017, March). State Resilience Officer, Oregon Office of the Governor. (J. PriceMadison,
A. Korbatov, Y. Wang, Y. Xu Interviewer)

30 Swiss Re Lights out: The risks of climate and natural disaster related disruption to the electric grid
60 The Oregon Resilience Plan: Reducing Risk and Improving Recovery for the Next Cascadia Earthquake and Tsunami. (2013). Salem: Oregon Seismic Safety Policy Advisory Commission (OSSPAC). Page 188
61 U.S. Department of Energy, Office of Electricity Delivery and Energy Reliability, Infrastructure Security and Energy Restoration. (2013). Insurance as a Risk Management Instrument for Energy Infrastructure Security and Resilience. https://energy.gov/sites/prod/files/2013/03/f0/03282013_Final_Insurance_EnergyInfrastructure.pdf
62 Frye, Emily; Emmons, Kathy. (June, 2005). Insurance and the Nation’s Electrical Infrastructure: Mutual Understanding and Maturing Relationships, George Mason University of Law. http://cip.gmu.edu/wpcontent/uploads/2016/06/CIPHS_InsuranceandtheNationsElectricalInfrastructure_WhitePaper.pdf.
63 The Oregon Resilience Plan: Reducing Risk and Improving Recovery for the Next Cascadia Earthquake and Tsunami. (2013). Salem: Oregon Seismic Safety Policy Advisory Commission (OSSPAC). Page 188
64 Vancouver. 100 Resilient Cities. http://www.100resilientcities.org/cities/entry/vancouver#/_ / 65 Meissner, D. (2015, January 19). B.C. megathrust earthquake could rupture like a zipper, expert says.
Retrieved June 10, 2017, from http://www.cbc.ca/news/canada/britishcolumbia/bcmegathrustearthquakecouldrupturelikeazipperexpertsays1.2917261
66 Richard J. Pasch and Todd B. Kimberlain (15 February 2011). Tropical Cyclone Report Hurricane Igor (AL 112010). National Hurricane Center. Retrieved from http://www.nhc.noaa.gov/data/tcr/AL112010_Igor.pdf.
67 Linda Givetash, (May 06, 2017), “Flooding, mudslides wreak havoc across southern B.C.”. Retrieved June 22, 2017, from http://www.torontosun.com/2017/05/06/floodingmudslideswreakhavocacrosssouthernbc
68 Public Safety Canada. Report on Plans and Priorities 2016–17. Retrieved from https://www.publicsafety.gc.ca/cnt/rsrcs/pblctns/rprtplnsprrts201617/indexen.aspx#s1bd
69 Ibid.70 Public Safety Canada. Public Safety Canada Departmental Plan 2017–18. Retrieved from
https://www.publicsafety.gc.ca/cnt/rsrcs/pblctns/dprtmntlpln201718/indexen.aspx71 Canada News Wire (CNW), “Public Safety Canada budget cuts jeopardize the safety of all Canadians,”
Retrieved June 23, 2017, from http://www.newswire.ca/newsreleases/publicsafetycanadabudgetcutsjeopardizethesafetyofallcanadians545576022.html
72 Journeay, M. (2017, March). Research Scientist, Natural Resources Canada, (J. PriceMadison, A. Korbatov, Interviewer).
73 Governments of the United States and Canada (December 2016). Joint United StatesCanada Electric Grid Security And Resilience Strategy. https://www.whitehouse.gov/sites/whitehouse.gov/files/images/Joint_US_Canada_Grid_Strategy_06Dec2016.pdf
74 U.S. Army Corps of Engineers and Bonneville Power Administration (February 2009). Columbia River Treaty: History and 2014/2024 Review. https://www.bpa.gov/news/pubs/GeneralPublications/crtColumbiaRiverTreatyHistoryand20102024Review.pdf.
Endnotes


© 2017 Swiss Re. All rights reserved.
Title Lights out: The risks of climate and natural disaster related disruption to the electric grid
Authors: Annabella KorbatovJulia PriceMadisonYihui WangYi Xu
The Johns Hopkins University Paul H. Nitze School of Advanced InternationalStudies (SAIS)
Faculty Advisor: Celeste Connors
Swiss Re Institute: Stephan Schreckenberg
Swiss Re Advisor: Alex Kaplan
Managing Editor: Urs Leimbacher
Graphic design and production: Swiss Re Corporate Real Estate & Services/ Media Production, Zurich
Photographs: Getty images, front cover, p. 4, 6, 15, 18, 21 Amazon CloudFront, http://d279m997dpfwgl.cloudfront.net/wp/2016/08/0822_concord11000x651.jpg, p.13, IStockphoto, p. 26
Disclaimer The content of this report is subject to copyright with all rights reserved. The information may be used for private or internal purposes, provided that any copyright or other proprietary notices are not removed. Electronic reuse of the content of this brochure is prohibited. Reproduction in whole or in part or use for any public purpose is only permitted with the prior written approval of Swiss Re, and if the source reference is indicated. Courtesy copies are appreciated.
Although all the information discussed herein was taken from reliable sources, Swiss Re does not accept any responsibility for the accuracy or comprehensiveness of the information given or forward looking statements made. The information provided and forward looking statements made are for informational purposes only and in no way constitute or should be taken to reflect Swiss Re’s position, in particular in relation to any ongoing or future dispute. In no event shall Swiss Re be liable for any financial or consequential loss or damage arising in connection with the use of this information and readers are cautioned not to place undue reliance on forward looking statements. Swiss Re undertakes no obligation to publicly revise or update any forwardlooking statements, whether as a result of new information, future events or otherwise.
Visit www.swissre.com to download or to order additional copies of Swiss Re publications.
Order no: 1507315_17_en 07/17

Swiss Reinsurance Company Ltd Mythenquai 50/60 P.O. Box 8022 Zurich Switzerland
Telephone +41 43 285 2121 Fax +41 43 285 2999 www.swissre.com