lightning simulation of a combined overhead … · analysis is conducted by implementing a...
TRANSCRIPT

29th International Conference on Lightning Protection
23rd – 26th June 2008 – Uppsala, Sweden
6a-6-1
LIGHTNING SIMULATION OF A COMBINED OVERHEAD LINE/CABLE CONNECTED GIS
Jakob Kessel, Víðir Atlason, Claus Leth Bak Jesper Lund
Institut of Energy Technology, Aalborg University NV Net A/S [email protected] [email protected]
Pontoppidanstræde 101, DK-9220 Aalborg - Denmark Nefovej 50, 2. sal, DK-9310 Vodskov
Abstract – The following paper concerns different investigations of lightning simulation of a combined 170 kV overhead line/cable connected GIS. This is interesting due to the increasing amount of underground cables and GIS in the Danish transmission system. This creates a different system with respect to lightning performance, compared to a system consisting solely of AIS connected through overhead lines. The main purpose is to investigate whether overvoltage protection is necessary at the GIS busbar. Here, the price for a GIS SA is significantly more expensive than the price for an AIS SA. The analysis is conducted by implementing a simulation model in PSCAD/EMTDC.
Simulations are conducted for both SF and BFO where the overvoltages at the transformer are evaluated as this component has the lowest insulation strength. The overvoltages are evaluated for different front times of the lightning surge, different soil resistivities at the surge arrester grounding in the overhead line/cable transition and different length of the connection cable between the transformer and the GIS busbar with a SA implemented. Those simulations are conducted for different positions of the circuit breaker present at the GIS busbar. The lighting current required to cause inadmissible voltages at the transformer is evaluated and the MTBF is found for different cases. With the circuit breaker at the GIS busbar in closed position results indicate that SF does not cause inadmissible voltages to appear at the transformer. However, BFO caused by a lightning stroke of extremely high magnitude can cause inadmissible voltages to appear at the transformer. With the circuit breaker at the GIS busbar in open position results indicate that both SF and BFO can cause inadmissible voltages to appear at the transformer. A risk assessment based on the simulation results and statistical data for lightning, yields the conclusion that implementation of a surge arrester at the GIS busbar is not necessary.
1 INTRODUCTION In accordance with the increased focus on visual pollution, the Danish transmission system is being exposed to great
changes. Overhead lines (OHL) are being replaced with underground cables (UC) and air insulated substations (AIS) are being replaced with new less space consuming gas insulated substations (GIS). This is also the case for the 170 kV transmission system around Aalborg, where the objective is to replace most of the overhead lines with underground cables as well as rebuilding the substation in Aalborg East (ABØ) as an indoor GIS. This yields a different system with respect to lightning performance compared with a system consisting solely of AIS connected through OHL.
Though most of the system will consist of GIS and UC, and therefore not directly exposed to lightning, overvoltages due to lightning can still occur. Near the ABØ substation, an OHL section with two high towers across the Limfjord will still be present after the reconstruction of the system, resulting in a mixed OHL/UC section connecting to the ABØ GIS as shown in Fig. 1.
NVV
ADL
FER
HVV
5 km
ABØ
VHA
Overhead linesUnderground cables
170 kV outdoor substation170 kV gas insulated substation
To HVOTo SBA
To DYB
To MOSTo THØ
To BDK
Aalborg
Limfjord
Area 3
Area 2
Area 1
Area 4
Denmark
Fig. 1 – Geographical configuration of the 170 kV system in Aalborg, 2014.
© ICLP2008 Local Organisation Committee

6a-6-2
In Fig. 1, the transmission system is divided into four areas where lightning can enter the system. In [1], it has been found that only lightning to area 3 can cause inadmissible voltages, hence this is the only area of interest in this paper.
Protection for a GIS is significantly more expensive than protection for an AIS (roughly with a factor of 10), it is therefore interesting to investigate whether overvoltage protection is necessary for the new GIS in ABØ.
This paper presents modelling and lightning simulation of the 170 kV transmission system in Aalborg. Both shielding failure (SF) and back flashover (BFO) are simulated, and the influence of different surge front times, different soil resistivities at the OHL/UC surge arrester (SA) transition point and the influence of different distances of the connection cable between the transformer and the busbar with a SA present are evaluated.
2 SYSTEM DESCRIPTION A single line diagram of the transmission system around Aalborg is shown in Fig. 2, showing the relevant
components of the system. As previously described, only lightning entering the OHL section O4 can cause inadmissible voltage. This is due to its close proximity to the ABØ substation and the fact that it contains two tall towers on each side of the Limfjord which are expected to attract a high number of lightning.
420 kV
ADL
MOS
DYB
HVV
60 kVABØ
NVVVHA
60 kV
FER
SBA
THØ
HVO
60 kV
60 kV
C11 km C2
6 kmC114,7 km
C18,7 km
C21,8 km
C210,6 km
T1
T1
T2
T3
R1
R2
C23,5 km
C220 km
S1 S1 S1 S1 S1
S1 S2
S1
S1
S2
S2
S2
S2S2
S2
S2
S2
T1
T1
S3
JER
S1 S1S1
T2
Fig. 2 – Single line diagram for the proposed system in 2014, containing the relevant parts. Substations and equipment enclosed with
dotted lines are gas insulated.
Table 1 – Components in the single line diagram. Figure label Type
O1-09 Overhead lines C1-C3 Underground cablesS1-S3 Surge arresters R1-R2 Reactors T1-T4 Transformers
As OHL section O4 is the section of greatest interest, a more detailed description of the components in this section is
given in the following.
29th International Conference on Lightning Protection

6a-6-3
A. Lightning parameters The average lightning density in the Aalborg area is approximately 0,4 flashes to ground per km2 per year. The
lightning parameters are derived from measurements conducted on the mountain of San Salvatore in Switzerland [2].
B. ABØ substation As previously described, the ABØ substation is to be reconstructed as a GIS with a single busbar and only UC
entering the substation. A single line diagram of the proposed ABØ substation is shown in Fig. 3
NVV1 km UC1,5 km OHL
60 kV busbar
s.a.
170 kV busbar
ABØ - Indoor GIS
TF2
TF1
Busbarbreaker
VHA6 km
ADL14,7 km
Fig. 3 – A single line diagram of the planned GIS in ABØ. s.a. represents a committed placement for the optional surge arrester.
C. Underground cable ABØ-NVV Two different cable connection are entering the ABØ substation, namely C1 (NVV and ADL) and C2 (VHA). Both
cable types are single phase cables. C1 (AXLJ 1x2000mm2) represents a flat physical layout, with 2000 mm2 Al conductors, with a surge impedance of 20,5 Ω. C2 (AXLJ 1x1200mm2) represents a triangular physical layout, with 1200 mm2 Al conductors, with a surge impedance of 23,4 Ω.
D. Overhead line section O4 The OHL leading from NVV to the UC is 1,5 km long as shown in Fig. 2. This section contains two towers with a
total height of 145 m as shown in Fig. 4. As shown a 420 kV system is present at the same tower above the 170 kV system.
420 kV system
170 kV system
22,5 m
103,8 m
106,5 m104,5 m
7 m7 m
7 m 7 m 145,0 m
134,0 m
128,3 m
14 m14 m
Fig. 4 – Illustration of the tower profile used in section O4.
The Lightning Impulse Withstand Level (LIWL) of the 170 kV insulators is 750 kV and the LIWL for the 420 kV
insulators is 1425 kV.
ICLP 2008, June 23 - 26, Uppsala, Sweden

6a-6-4
E. Surge Arresters at the OHL/UC transition point At the OHL/UC transition point, a SA is implemented for each phase. These SA are of the type ABB Pexlim
P144XV170, line discharge class 4 (IEC), with nominal discharge current of 20 kA. Discharge current withstand strength: High current 4/10 μs, 100 kA peak; Low current 2000 μs 1350 Apeak. The discharge characteristics of the SA are given in Fig. 6.
F. Grounding electrode system The grounding electrodes in the system are single Cu rods, length 6 m, radius 5,5 mm.
3 MODELLING The simulation model of the above-mentioned system is implemented in PSCAD/EMTDC as presented in the
following. Gennerally following the guidelines stated in [3].
A. Transmission lines All OHL and UC in the system are modelled by use of the Frequency dependent (phase) model and implemented by
use of the physical configuration as suggested in [4].
B. Substations AIS busbars are modelled by transmission lines with the physical configuration. GIS busbars are modelled by their
equivalent capacitances. This is done to avoid heavy simulation, due to short length of the GIS busbars.
C. Transformers and reactors The transformers and reactors at the substations are modelled by their equivalent capacitances according to [3].
D. Voltage source The voltages at each phase for both the 170 kV and 420 kV are implemented with a DC supply with the
corresponding instantaneous AC voltages.
E. Surge generator The lightning surge generator is implemented with three inputs: the front time, the time to half and crest magnitude
of the lightning current. The lightning surge is based on an approximated double exponential function [5]:
)exp()exp()( tAtBtf ⋅−−⋅−= (1) Here, the constants B and A determine the front and tail time of the double exponential surge. The magnitude of the
lightning surge is multiplied with f(t).
F. Surge arrester A frequency dependent model for the SAs in the system is desired. For this purpose, a simplified version of the IEEE
model, presented by Pinceti et al. [6], is used as shown in Fig. 5.
L L
R A A0 0 1
10
Fig. 5 – Simplified IEEE prepared by Pinceti et al. [6].
The inductances L0 and L1 characterize the frequency dependency of the SA, with respect to lightning current surges.
The parameters are determined by a simplified method [7]:
n1
n0
03,001,0
ULUL
⋅=⋅= (2)
29th International Conference on Lightning Protection

6a-6-5
Where Un is the rated voltage of the SA. The input resistance is implemented for numerical stability and is given a general value of 1 MΩ [6]. The
conductances, which represent the non-linear characteristics of the SA, are found from general values given by [6]. These values are adjusted in order to obtain a discharge characteristic which fit data from SA producer. The conductances are implemented in EMTDC/PSCAD with the values listed in Table 2.
Table 2 – The paramter values for the conductances in the SA model.
Current [kA] A0 [p.u. of Un] A1 [p.u. of Un] Current [kA] A0 [p.u. of Un] A1 [p.u. of Un] 0,001 0,0001 0,0001 8,000 1,170 0,987 0,010 0,805 0,755 10,00 1,190 1,005 0,100 0,960 0,820 14,00 1,240 1,053 1,000 1,060 0,867 18,00 1,265 1,088 2,000 1,098 0,898 20,00 1,274 1,100 4,000 1,138 0,939
The discharge characteristics of the implemented model are compared with the discharge characteristics given by the
SA producer [8]. This comparison is shown in Fig. 6 evaluated for an 8/20 µs surge current.
Fig. 6 – Comparison of discharge characteristic for a 8/20 µs surge current for the model and producer data.
As shown, the SA model corresponds to the provided data for the 8/20 μs waveform.
G. Grounding resistance The grounding resistance is modelled as described in [9] and [10]. The grounding resistance is dependent on the
magnitude of the current flowing to ground and the actual resistance for low magnitude currents. The current dependent resistance is determined by:
0
00
2 :here w
1 REIRR g
gIRIt π
ρ=
+= (3)
Where: R0 is the low current grounding resistance IR is the peak value of the current flowing through the ground resistance. Ig is the critical current causing ionization of the soil The low current grounding resistance is found from the soil resistivity and physical dimensions of the grounding
rod [11]:
rlr
ll
R >>⎥⎦⎤
⎢⎣⎡ −
⋅= for ,14ln
20 πρ (4)
ICLP 2008, June 23 - 26, Uppsala, Sweden

6a-6-6
Where: ρ is the soil resistivity l is the length of the grounding rod r is the radius of the grounding rod
The grounding resistance is implemented for the grounding of the SA at the OHL/UC transition and for the grounding of the towers which are described in the following.
H. Tower model The tower model is based on the principle described in [3] and shown in Fig. 7. Here, one ground wire is placed
above the three phase conductors. The insulators between the crossarm of the tower and the phase conductors are modelled with equivalent capacitances. If a flashover across the insulator occurs, the capacitance is short circuited. The tower is represented with an equivalent surge impedance [12]-[13] and the grounding resistance is dependent on the current flowing to ground as previously presented.
Z
R
C C C
tower
t
Fig. 7 – A principle drawing of the tower model [14] showing a ground wire above the phase conductors, insulators, tower and
grounding resistance.
In the simulation model, a tower component is created following the principle presented above. The tower in OHL section O4 has a height of 145 m and the surge impedance is divided into three parts as shown in Fig. 8. This is done to implement the effect of different heights of the 420 kV and 170 kV system on the tower, respectively.
gw
a
170170170
T
20 [p
F]
Uins_a
U_a
BR
K_a
U_tt
b 20 [p
F]
U_b
c 20 [p
F]
U_c
I_tt
Rt +
I_R
gwT
420420
gwgw
420T
r 10 [p
F]
Uins_r
U_r
BR
K_r
s 10 [p
F]
U_s
t 10 [p
F]
U_t
Uins_b Uins_c
BR
K_b
BR
K_c
Uins_s Uins_t
BR
K_s
BR
K_t
Fig. 8 – The implemented tower model in PSCAD/EMTDC, showing the tower component and insulator. Breaker control for
insulator flashover is not shown here. The insulator model is implemented for both the 170 kV and the 420 kV system. For the 170 kV system, a
capacitance of 20 pF is chosen to represent the insulator, and for the 420 kV system a 10 pF capacitance is used, in
Ground wire Phase conductors Insulators Tower surge impedance Grounding resistance
29th International Conference on Lightning Protection

6a-6-7
accordance with [3]. Here the breakdown is implemented from an estimated volt-time characteristic of the insulator [14]:
75,02
1breakdown tK
KU += (5)
Where: Ubreakdown is the breakdown voltage of the insulator K1 = 400⋅ l K2 = 710⋅ l l is the length of the insulator t is the time elapsed after the lightning surge
I. Simulation model implemented in PSCAD/ EMTDC The model is implemented in PSCAD/EMTDC as shown in Fig. 9.
Fig. 9 – The full simulation model of the 170 kV transmission system in Aalborg. All substations are implemented as enclosed subsystems, surge arresters in the system are likewise implemented as subsystems, in most cases implemented inside a substation. At
the ABØ substation an optional surge arrester can be implemented. The OHL section O4 is implemented with 3 transmission lines with the two towers implemented in between. The lightning surge generator is implemented as a subsystem, where front time, time
to half and crest magnitude can be adjusted. Further description of the modelling of the system is given in [1].
4 SIMULATION The transformers placed in ABØ have a LIWL of 650 kV, hence, the maximum allowable voltage appearing at the
terminals is determined from safety factor of 15% (IEC) to be 565 kV. As the busbar breaker position is included in the analysis, four different cases are simulated:
• Shielding failure with the breaker at the busbar in ABØ in closed position. • Shielding failure with the breaker at the busbar in ABØ in open position.
OHL section O4 and underground cable
Surge generator
ABØ
SA
optionalSA
1O
1
1OT
2O
1
2O
1
2OT
25.84[ohm
]
25.84[ohm
]
25.84[ohm
]
25.84[ohm
]
7O
1
7O
1
7OT
8O
1
8O
1
8OT
25.84[ohm
]
25.84[ohm
]
25.84[ohm
]
25.84[ohm
]
3O
1
3OT
25.84[ohm
]
25.84[ohm
]
1C oba-vvn
2C
3C
1Coba-vvn
2C
3C
oba-vvnC
1C oba-ahv
2C
3C
1Coba-ahv
2C
3C
oba-ahvC
3O
1
9O
1
9O
1
9OT
25.84[ohm
]
25.84[ohm
]
BYD
ABS
KDB
1C rej-abs
2C
3C
1Crej-abs
2C
3C
rej-absC
OVH
1C lda-oba
2C
3C
1Clda-oba
2C
3C
lda-obaC
1C lda-vvh
2C
3C
1Clda-vvh
2C
3C
1C vvh-ref
2C
3C
1Cvvh-ref
2C
3C
lda-vvhC
vvh-refC
1C lda-ref
2C
3C
1Clda-ref
2C
3C
lda-refC
5O
1
5O
1
5OT
25.84[ohm
]
25.84[ohm
]
6O
1
6O
1
6OT
25.84[ohm
]
25.84[ohm
]
1C vah-oht
2C
3C
1Cvah-oht
2C
3C
vah-ohtC
AHVrabsuB
3N2N1N1N2N3N 1N2N3N1N2N3N
ØBABYDVVN
AD
Lbu
sbar
HVV
FER
SA
ABO
N1
N2
N3
N3
N2
N1
N3
N2
N1
N3
N2
N1
AB
Obu
sbar
AD
L
VH
AS
AN
VV
N1
N2
N3
N3
N2
N1
N3
N2
N1
N3
N2
N1
rabsubVVH
SOM LDA3N2N1N1N2N3N
Pexlim
VVNrabsuB
1N2N3N1N2N3N
ØBAAHV
1N2N3N3N 2N 1N
ABS
3N 2N 1N3N 2N 1N3N 2N 1N
KDB1OVH2OVH
REFrabsuB
3N2N1N1N2N3N 1N2N3N3N 2N 1N
LDASOMØHT
ØHT
SOM
milxeP
milxeP
1D
1
1D
11D
T
18.11[ohm
]
4O
1
4O
14O
T
2D
1
2D
1
4rewoT
2DT
wG
A
CB
18.1
1[o
hm]
0=R]mho[8.0]H[4410.0
0=R]mho[8.0]H[4410.0
0=R]mho[8.0]H[4410.0
]mho[004]mho[004]mho[004
wG
A
CB
Vk024egatlov
rotareneg_egrus
pmAflah_ttnorf_t
...iaM
053
0
flah_t
053
µs
flah_tr_uat
edutilpma
...iaM
51
0
r_uat
01
µs
...iaM
005
005-
edutilpma
082-
kA
4rewoT
ICLP 2008, June 23 - 26, Uppsala, Sweden
6a-6-8
• Back flashover with the breaker at the busbar in ABØ in closed position. • Back flashover with the breaker at the busbar in ABØ in open position.
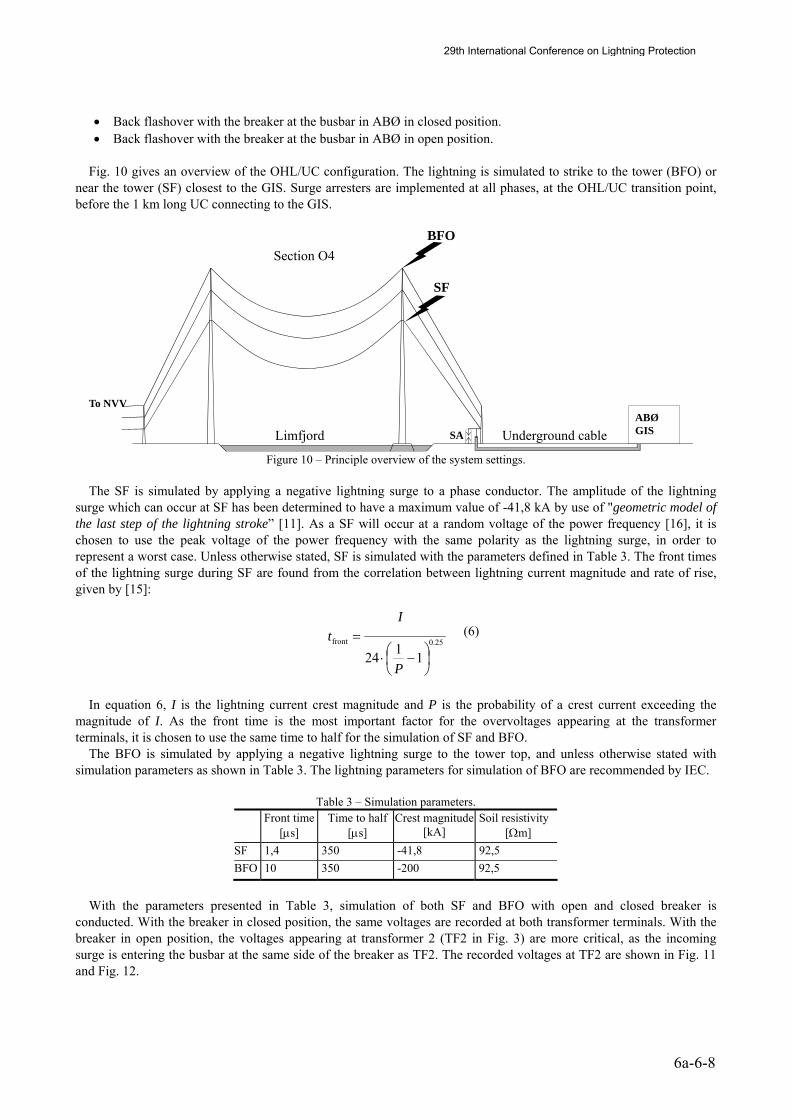
Fig. 10 gives an overview of the OHL/UC configuration. The lightning is simulated to strike to the tower (BFO) or
near the tower (SF) closest to the GIS. Surge arresters are implemented at all phases, at the OHL/UC transition point, before the 1 km long UC connecting to the GIS.
To NVVABØGIS
SF
BFOSection O4
Limfjord SA Underground cable
Figure 10 – Principle overview of the system settings. The SF is simulated by applying a negative lightning surge to a phase conductor. The amplitude of the lightning
surge which can occur at SF has been determined to have a maximum value of -41,8 kA by use of "geometric model of the last step of the lightning stroke” [11]. As a SF will occur at a random voltage of the power frequency [16], it is chosen to use the peak voltage of the power frequency with the same polarity as the lightning surge, in order to represent a worst case. Unless otherwise stated, SF is simulated with the parameters defined in Table 3. The front times of the lightning surge during SF are found from the correlation between lightning current magnitude and rate of rise, given by [15]:
25.0front
1124 ⎟⎠⎞
⎜⎝⎛ −⋅
=
P
It (6)
In equation 6, I is the lightning current crest magnitude and P is the probability of a crest current exceeding the
magnitude of I. As the front time is the most important factor for the overvoltages appearing at the transformer terminals, it is chosen to use the same time to half for the simulation of SF and BFO.
The BFO is simulated by applying a negative lightning surge to the tower top, and unless otherwise stated with simulation parameters as shown in Table 3. The lightning parameters for simulation of BFO are recommended by IEC.
Table 3 – Simulation parameters.
Front time [μs]
Time to half [μs]
Crest magnitude [kA]
Soil resistivity [Ωm]
SF 1,4 350 -41,8 92,5 BFO 10 350 -200 92,5
With the parameters presented in Table 3, simulation of both SF and BFO with open and closed breaker is
conducted. With the breaker in closed position, the same voltages are recorded at both transformer terminals. With the breaker in open position, the voltages appearing at transformer 2 (TF2 in Fig. 3) are more critical, as the incoming surge is entering the busbar at the same side of the breaker as TF2. The recorded voltages at TF2 are shown in Fig. 11 and Fig. 12.
29th International Conference on Lightning Protection

6a-6-9
From the simulation results, it can be seen that inadmissible voltages, defined to be 565 kV, do appear at the TF2
terminals when the breaker at the busbar is in open position. With the breaker in closed position, neither SF nor BFO caused inadmissible voltages to appear at the TF2 terminals. In order to analyse the influence of different parameters the following investigations are conducted:
• The front time of the lightning surge during SF. • The soil resistivity at the OHL/UC transition point. • Length of the connection cable between busbar and TF2, with a SA implemented at the busbar.
All simulation results shown in the following, concern SF as these give clearer viewing of the propagated
waveshapes appearing at the TF2, due to lesser reflections. An evaluation of lightning currents causing failure is conducted later in the paper concerning both SF and BFO.
A. Effect of surge front time at SF The following simulation concerns SF and the influence of different front times on the voltages appearing at TF2.
The simulation is conducted with the parameters shown in Table 3, only with varying front times as listed in Table 4.
Table 4 – The lightning current front times. Front time [μs] 1 2,5 5 7,5 10
The simulation results for SF, with varying front time are shown in Fig. 13 and Fig. 14.
The simulation results, with different front times yielded only slight differences in voltage amplitude, measured at the TF2, as shown in Fig. 13 and Fig. 14. This indicates that the steepness of the lightning surge is not a factor of great importance for lightning entering the system at this point, for tfront < 10 μs. This is due to the length of the cable leading into the substation which has a length of 1 km, where the propagation time is estimated to be approximately 5 μs. Hence, all surges have reached their crest value before a reflected wave returns and dampens the incoming surge. With the breaker at the busbar in closed position, voltages at the TF2 terminals did not reach inadmissible levels, defined to be 565 kV. With the breaker at the busbar in open position inadmissible voltage stress was recorded for all examined front times.
Fig. 11 – Simulation of a -41,8 kA 1,4/350 µs SF. Fig. 12 – Simulation of a -200 kA 10/350 µs BFO.
Fig. 13 – Varying lightning front time, SF, closed breaker. Fig. 14 – Varying lightning front time, SF, open breaker.
ICLP 2008, June 23 - 26, Uppsala, Sweden

6a-6-10
B. Effect of soil resistivity at the OHL/UC transition point during SF The influence of different soil resistivities, at the OHL/UC SA grounding point, on the voltages appearing at the TF2
are investigated during SF. The simulation is conducted with the parameters shown in Table 3, only with varying soil resistivity as listed in Table 5.
Table 5 – The soil resisivities with corresponding low current resistance R0 and critical current Ig.
ρ [Ωm] 10 50 100 200 500 1000 R0 [Ω] 1,96 9,8 19,6 39,2 97,9 195,8 Ig [kA] 166 33,2 16,6 8,3 3,3 1,7
The simulation results for SF, with varying soil resistivity are shown in Fig. 15 and Fig. 16.
As shown in Fig. 15 and Fig. 16, the simulation results with different soil resistivities yielded great differences in
voltage amplitude at TF2 for both closed and open breaker, indicating the importance of this factor for the model validity. With the breaker at the busbar in closed position, voltages at TF2 did not reach inadmissible levels. With the breaker at the busbar in open position inadmissible voltage stress was recorded for all simulation cases.
C. Effect of the cable length between GIS busbar and TF2 during SF, with a SA implemented at the GIS busbar The effect of the length of the connection cable between the GIS busbar and TF2 is evaluated with a SA
implemented at the GIS busbar. The simulation is conducted with the lightning parameters shown in Table 3 and a SA, with the same discharge characteristics as the SA described on page 4, implemented at the GIS busbar in the simulation model. Only the length of the connection cable is varied as listed in Table 6.
Table 6 – Length of cable between transformer and busbar.
Cable length [m] 5 15 30 50 100 150 200 The most important factors determining the voltage appearing at TF2, are the steepness of the lightning surge and the
cable length between the SA and the equipment which is to be protected. Here, the steepness is kept constant with a rise time of 1,4 μs, while varying the cable length from 5 to 200 m. The results are shown in Fig. 17 and Fig. 18.
Fig. 17 – Varying cable length to transformer, SF, closed breaker. Fig. 18 – Varying cable length to transformer, SF, open breaker.
Fig. 15 – Varying soil resistivity, SF, closed breaker. Fig. 16 – Varying soil resistivity, SF, open breaker.
29th International Conference on Lightning Protection

6a-6-11
The simulation results with different cable lengths yielded differences in the voltages at TF2, as shown in Fig. 17 and
Fig. 18, indicating the importance of this factor for the protection of the transformer. With the breaker at the busbar in closed position, voltages at TF2 did not reach inadmissible levels. With the breaker at the busbar in open position inadmissible voltage stress was recorded for all cases of cable length. Furthermore, cable length exceeding 50 m did not yield increased voltage stress of TF2. This is due to the steepness of the residual surge wave and travelling time across the cable, where the residual surge has reached its crest value before it has travelled 50 m. Here, the residual surge wave is the surge passing the SA towards TF2.
5 EVALUATION OF CURRENTS CAUSING INADMISSIBLE VOLTAGES AT TF2 In order to decide whether further protection of the GIS equipment is necessary, an evaluation of lightning currents
causing inadmissible voltages is needed. The case of inadmissible voltages at TF2 is defined as failure. This is evaluated for the different cases in the following.
A. Currents causing in admissible voltages for varying front time The currents required to cause failure are evaluated for SF with different front times. The correlation between the
front time and the current amplitude is shown in Fig. 19. Here, only a SF with the breaker in open position caused a failure.
Fig. 19 – Current vs. front time,
SF, open breaker. Fig. 19 shows the effect of lightning surge front times on the currents required to cause failure, where it is apparent
that slower surge fronts require higher current crest magnitude to cause failure.
B. Currents causing inadmissible voltages for varying soil resistivity The lightning currents required to cause failure are estimated for SF and BFO with different soil resistivities at the
OHL/UC transition point. No failures were recorded for SF, with the breaker at the busbar in closed position. However, failures were recorded for SF, breaker in open position, and BFO with breaker in open and closed position. The results are shown in Fig. 20, Fig. 21 and Fig. 22.
ICLP 2008, June 23 - 26, Uppsala, Sweden

6a-6-12
The currents required to cause failure are shown as a function of the soil resistivity in the three figures above. As
shown, the quality of the grounding affects the magnitude of the currents causing failure. Better grounding (lower soil resistivity) requires a higher current magnitude to cause failure. Furthermore, it can be seen that ρ > 500 Ωm does not yield significant changes in currents required to cause failure.
C. Currents causing inadmissible voltages for varying cable length between GIS busbar and TF2 The lightning currents required to cause a failure are evaluated for varying length of the connection cable between
the busbar, where a SA is implemented at the busbar. For this case, failure was only recorded with the busbar breaker in open position, both for SF and BFO. The resulting currents for varying cable lengths are shown in Fig. 23 and Fig. 24.
The currents required to cause failure are shown as a function of the length of the connection cable between the
busbar and the transformer. As shown, higher currents are required to cause failure for shorter cables. For cables above 50 m, approximately the same current is required to cause failure.
6 RISK ASSESSMENT The risk assessment is conducted by defining mean time between failure (MTBF), where failure is defined as the
appearance of a voltage surge, exceeding the allowable limit of 565 kV at the transformer terminals. In order to evaluate the MTBF, the number of lightning in the area is needed as well as the crest current probability and the probability of a given breaker position. Furthermore, when evaluating MTBF for SF, the probability of a shielding failure in the given system is required. Acceptable MTBF for a GIS is defined in [17] to be in the region of 250-1000 years, where in this case the higher value set as a limit.
Fig. 20 – Current vs. soil resistivity, SF, open breaker.
Fig. 21 – Current vs. soil resistivity, BFO, closed breaker.
Fig. 22 – Current vs. soil resistivity, BFO, open breaker.
Fig. 23 – Current vs. cable length, SF, open breaker.
Fig. 24 – Current vs. cable length, BFO, open breaker.
29th International Conference on Lightning Protection

6a-6-13
The MTBF for the four cases are calculated with the following equations:
( ) 1flashesclosed SF, )current( )closed( )sf(MTBF −⋅⋅⋅= NPPP (7)
( ) 1flashesopen SF, )current( )open( )sf(MTBF −⋅⋅⋅= NPPP (8)
( ) 1flashesclosed BFO, )current( )closed(MTBF −⋅⋅= NPP (9)
( ) 1flashesopen BFO, )current( )open(MTBF −⋅⋅= NPP (10)
The number of flashes to the section is Nflashes = 0,32 flashes/yr. The probability of a shielding failure is estimated, P(sf) = 0,02. The probability of the breaker being in open position is estimated, P(open) = 1/365 = 0,0027. The probability of the breaker being in closed position is P(closed) = 1 – P(open) = 0,9973. The probability of a lightning with a current magnitude of I or greater is given by [15]:
6,2
311
1)(
⎟⎠⎞
⎜⎝⎛+
=I
currentP (11)
The probability of the current is given as the difference between the probability of the minimum current which can
cause failure and the maximum current which can cause a SF.
(max)(min))current( PPP −= (12) The MTBF calculated for all the simulation cases yielding failure and the results are shown in the following.
A. MTBF for varying lightning surge front time As previously described, the relationship between the current required to cause failure and the front time of the
lightning surge was found. From this evaluation, the MTBF is calculated for the varying lightning surge front time with the corresponding results shown in Fig. 25.
Fig. 25 – MTBF vs. front time,
SF, open breaker.
The MTBFSF,open for varying front times show an estimated MTBF > 90.000 years.
B. MTBF for varying soil resistivity of the OHL/UC transition point Based on the evaluation of required currents to cause failure, the MTBF can be found for varying soil resistivity at
the OHL/UC transition point (SA grounding). The results are shown in Fig. 26, Fig. 27 and Fig. 28.
ICLP 2008, June 23 - 26, Uppsala, Sweden

6a-6-14
The MTBFSF,open for varying soil resistivity, show an estimated MTBF > 80.000 years The MTBFBFO,closed for varying soil resistivity, show an estimated MTBF > 2.000 years. The MTBFBFO,open for varying soil resistivity, show an estimated MTBF > 10.000 years.
C. MTBF for varying distance between transformer and busbar Based on the evaluation of required currents to cause failure, the MTBF can be found for varying distances of the
connection cable between the busbar and the transformer, with a SA implemented at the busbar. The results are shown in Fig. 29 and Fig. 30.
The MTBFSF,open for varying cable length, show an estimated MTBF > 100.000 years. The MTBFBFO,open for varying cable length, show an estimated MTBF > 2.000.000 years. As shown in the previous section, all estimated MTBF are above the acceptable limit of 1.000 years.
7 CONCLUSION This paper concerns a lightning simulation of a system containing a GIS, where all connections are in the form of
UC. The voltage experienced at TF2 was investigated for both SF and BFO with open and closed breaker at the busbar. Furthermore, the influence of three different parameters was investigated. From the simulation, cases yielding inadmissible voltages appearing at TF2 were defined as critical.
Fig. 29 – MTBF vs. distance, SF, open breaker.
Fig. 30 – MTBF vs. distance, BFO, open breaker.
Fig. 26 – MTBF vs. soil resistivity, SF, open breaker.
Fig. 27 – MTBF vs. soil resistivity,BFO, closed breaker.
Fig. 28 – MTBF vs. soil resistivity,BFO, open breaker.
29th International Conference on Lightning Protection

6a-6-15
• The steepness of the lightning surge did not prove to be a parameter of significance for this system. This is due to the length of the cable leading into the substation, as all simulated lightning surges have reached their crest value before a reflected wave reaches the OHL/UC transition point.
• The soil resistivity of the OHL/UC transition point, where a SA is implemented, did prove to be a factor of significance. As expected, improved grounding at this point resulted in a decrease of the voltage appearing at TF2, due to a lower SA residual voltage.
• The influence of the cable length between transformer and the SA implemented at the GIS busbar was investigated by simulation of critical cases. Increased cable length yielded increased voltage magnitude to appear at the transformer terminals, for cable lengths up to 50 m. This is due to the fact that the residual surge has reached its crest value before it has travelled 50 m.
A risk assessment was conducted for the cases defined as critical, yielding a MTBF above the acceptable limit of
1.000 years for all cases. The conclusion from this investigation of lightning to a mixed OHL-UC transmission system is that the UC
connecting to the substation along with the SA in the OHL/UC transition point provides adequate protection for the GIS equipment. Further protection in the form of SA at the GIS busbar is therefore not necessary.
8 REFERENCES [1] Jakob Kessel, Víðir Atlason, Mariusz Benesz, “Analysis and simulation of lightning performance of the 150 kV system in Aalborg”. IET, AAU
2008. This project is available at the institute secretary Maria Hald ([email protected]) at IET, AAU. [2] K. Berger, R.B. Anderson, “Parameters of Lightning Flashes”. Cigré Electra, No. 41, p. 23-37, 1975. [3] Fast Front Task Force of the IEEE Modeling and Analysis of System Transients Working Group, “Modeling guidelines for fast front transients”,
IEEE, 1997. [4] J.A. Martinez, F. Castro-Aranda , “Lightning Flashover Rate of an Overhead Transmission Line Protected by Surge Arresters”, IEEE 2007. [5] F. Heidler, J. M. Cvetic, B. V. Stanic, “Calculation of Lightning Current Parameters”, IEEE Transactions on Power Delivery, Vol. 14, No. 2,
April 1999. [6] P. Pinceti, M. Giannettoni, “A simplified model for zinc oxide surge arresters”, IEEE Transactions on Power Delivery, Vol. 14, No. 2, April
1999. [7] M. C. Magro, M. Giannettoni, P. Pinceti, “Validation of ZnO Surge Arresters Model for Overvoltage Studies”, IEEE Transactions on Power
Delivery, Vol. 19, No. 4, October 2004. [8] ABB Power Technologies, “High Voltage Surge Arresters, Buyer´s Guide”. ABB, 2007. Edition 5.1, 2007-04. [9] M. M. Osborne, A. Xemard, L. Prikler, J. A. Martinez , “Points to consider regarding the insulation coordination of GIS substations with cable
connections to overhead lines”, IPST 2007. [10] W. A. Chisholm, W. Janischewskyj, “Lightning Surge Response of Ground Electrodes”, IEEE Transactions on Power Delivery, Vol. 4, No. 2,
April 1989. [11] A. R. Hileman. “Insulation Coordination for Power Systems”. CRC Press, 1999. ISBN: 0-8247-9957-7. [12] Working Group on Lightning Performance of Transmission Lines, “A Simplified Method for Estimating Lightning Performance of Transmission
Lines”, IEEE Transactions on Power Apparatus and Systems, Vol. PAS-104, No. 4, April 1985. [13] M. A. Sargent, M. Darveniza, “Tower Surge Impedance”, IEEE Transactions on Power Apparatus and Systems, Vol. Pas-88, No. 5, May 1969. [14] P. Yadee and S. Premrudeepreechacharn, “Analysis of Tower Footing Resistance Effected Back Flashover Across Insulator in a Transmission
System”, IPST 2007. [15] H. M. Ryan. “High voltage engineering and testing”. Peter Peregrinus Ltd. 1st edition, 1994. ISBN: 0-86341-293-9. [16] IEC, “Insulation Coordination. Part 2: Application guide”. CEI, 1996, 3rd edition. [17] IEC, “Surge Arresters. Part 5: Selection and application recommendation”. CEI, 1996, 1st edition.
ICLP 2008, June 23 - 26, Uppsala, Sweden