light & engineering - sveto-tekhnika.ru · alexei a. korobko konstantin a. tomsky moscow, 2010...
TRANSCRIPT

Volume 18, Number 2, 2010
LIGHT & ENGINEERING
Znack Publishing House, Moscow
ISSN 0236-2945
Volu
me
18,
Num
ber
2, 2
010
LIG
HT &
EN
GIN
EER
ING

Editor-in-Chief: Julian B. Aizenberg
Associate editor: Sergey G. Ashurkov
Editorial Board: Lyudmila V. Abramova Alexander T. Ovcharov Artyom E. Ataev Pavel V. Plyaskin Victor V. Barmin Leonid B. Prikupets Vladimir P. Budak Vladimir M. Pyatigorsky Andrey A. Grigoryev Alexei K. Solovyov Alexander I. Tereshkin Raisa I. Stolyarevskaya Alexei A. Korobko Konstantin A. Tomsky
Moscow, 2010
Foreign Editorial Advisory Board:Lou Bedocs, Thorn Lighting Limited, United KingdomWout van Bommel, Philips Lighting, the NetherlandsPeter R. Boyce, Lighting Research Center, the USAMarc Fontoynont, Ecole Nationale des Travaux Publics de l'Etat (ENTPE), FranceLuciano Di Fraia, University of Naples, ItalyDietrich Gall, Institut für Lichttechnik und Technische Optik, Ilmenau, GermanyFranz Hengstberger, National Metrology Institute of South AfricaWarren G. Julian, University of Sydney, AustraliaZeya Krasko, OSRAM Sylvania, USARoss McCluney, Florida Solar Energy Center, USAEvan Mills, Lawrence Berkeley Laboratory, USAHiroshi Nakamura, Kyushu University, JapanEliyahu Ne'eman , Israel Institute of Technology, IsraelHans-Joachim Richter, TRILUX-LENZE GmbH + Co KG, GermanyLucia R. Ronchi, Higher School of Specialization for Optics, University of Florence, ItalyJanos Schanda, University of Veszprem, HungaryNicolay Vasilev, Sofi a Technical University, BulgariaJennifer Veitch, National Research Council of Canada
LIGHT & ENGINEERING(Svetotekhnika)
Profeccor Eliyahu Ne'eman1927–2010
Dear Colleagues,
With great regret, we have to inform you that Prof. Eliyahu Ne’eman, active member of Edito-
rial Board of our Journal, has suddenly died on April, 22nd.
Prof. Eliyahu (Mecky) Ne'eman was born in Tashkent, Uzbekistan. At age 8 he immigrated
with his family to Israel (Mandatory Palestine). Since joining the CIE in 1967, Professor Ne'eman
was a highly active member in the organization. He was Chairman and then President of CIE
Israel since 1975. Mr. Ne'eman chaired TC 4.2 on Daylight, TC 3–22 on Museum Lighting and
Protection against Radiation Damage, TC 3–41 on Visual Quality of Displays in Museum Light-
ing. He was known by his nickname "Mecky" among his colleagues and friends, of which he
had many in the CIE. His professional career was many faceted; a partial list includes research
on the use of greenhouses in agriculture; analysis and authorship of building codes and light-
ing design of schools, hospitals, highways, tunnels and airports; pioneering research in the use
of natural sunlight to improve buildings energy efficiency; and in later years a profound interest
in museum lighting. He found great satisfaction in the many roles he held in the CIE, and above
all cherished the CIE's mission of international cooperation between scientists and engineers
from around the world in lighting research.
On behalf of Editorial Board of “Light & Engineering” and “Svetotekhnika”Julian Aizenberg

CONTENTS
VOLUME 18 NUMBER 2 2010
LIGHT & ENGINEERING(SVETOTEKHNIKA)
Wout van Bommel Lighting Tomorrow: What’s Hot? 5
Sergei V. Kostyuchenko Current State and Perspectives of UV Water and Air Treatment Technology 10
Judit Fekete, Cecilia Sik-Lányi, and János Schanda Discomfort Glare Spectral Sensitivity 15
Andrei N. Didenko, Alexander V. Prokopenko, and Anton Yu. Shchukin High-Effi ciency Sulfuric Lamp of Low Power 21
Christoph Schiller, Jan Holger Sprute, Nils Haferkemper, and Tran Quoc KhanhDiscomfort Glare – Impact of Headlamp Optics, Spectrum of Adaptation and SPD 25
Jürgen Locher and Franziska Kley Disability and Discomfort Glare of Headlamps 30
Jan Holger Sprute, Stefan Söllner, Nils Haferkemper, Cristoph Schiller, Bastian Zydek, and Tran Quoc Khanh Investigations on Glare Impact at Long Distances 33
Alexei Korobko Problem of Lighting Design in Near Field 39
Masako Miyamoto and Michiko Kunishima Infl uence of Daylight in the Early Evening on Behaviours and Spatial Evaluations 47
Аlexei А. Gorbunov, Evgeny A. Karasyov and Anatoly S. Fedorenko Research of Ecological Compatibility Increase when Manufacturing and Using Fluorescent Lamps 54
Raphaël Labayrade, Henrik Wann Jensen, and Claus Wann Jensen An Iterative Workfl ow to Assess the Physical Accuracy of Lighting Simulation Programmes 60
Yury A. Anokhin and Alexander F. Peregudov Spherical Diffuse Illuminator 71
Svetlana S. Devyatkina A Concept of Light-Signal Support of Flights at Airfi elds with Two Runways 76
Magali Bodart, Benoit Roisin, Peter D’Herdt, Arno Keppens, Peter Hanselaer, Wouter R. Ryckaert, and Deneyer G. Arnaud Performances of Compact Fluorescent Lamps with Integrated Ballasts and Comparison with Incandescent Lamps 83
Cenk Yavuz, Ertan Yanikoğlu, and Önder Güler Determination of Real Energy Saving Potential of Daylight Responsive Systems:A Case Study from Turkey 99
Contents No. 3-2010 106

Scientifi c EditorsSergey G. Ashurkov Raisa I. Stolyarevskaya
Style EditorMarsha Vinogradova
Art and CAD EditorAndrey M. Bogdanov
Editorial Offi ce:VNISI, Rooms 327 and 334 106 Prospekt Mira, Moscow 129626, Russia Tel: +7.495.682.26.54 Tel./Fax: +7.495.682.58.46 E-mail: [email protected] http://www.svetotekhnika.com
Znack Publishing House P.O. Box 648, Moscow, 101000, Russia Tel./Fax: +7.495.361.93.77
© Svetotekhnika, 2009© Znack Publishing House, 2009
Moscow Power Engineering Institute Press

5
Light & Engineering SvetotekhnikaVol. 18, No. 2, pp. 5-9, 2010 No. 4, 2010
taking into account all the effects of mesopic vision, the direction for the most effective spectrum for road lighting points towards warm-white light. This is es-pecially effective also because of shortwavelength vision loss of the elderly.
Keywards: cradle to cradle, solid state lighting, glare, colour rendering, color appearance
INTRODUCTION
The focus of research and development chang-es with time because of a changing “outer world” and because of changes in technological possibili-ties. We will discuss what aspects in lighting will be, or should be, “hot” in the coming years. We will also point to some aspects that used to be important but will cease to be important because of changed circumstances.
The discussion is structured around three points of view: the society point of view, the product point of view and the application point of view. The ap-proach to these subjects will be more illustrative than exhaustive.
SOCIETY
Sustainability In 1972 the Club of Rome, a small internation-
al group of professionals from the fi elds of diplo-macy, industry, academia and civil society, pro-duced its report “The Limits to Growth”. This report showed for the fi rst time the contradiction of unlim-ited growth in material consumption in a world of fi -nite resources. It took some time before the lighting world reacted appropriately, for example by recon-
ABSTRACT
1From a society, product and application point of view examples are given of what will be “hot” in lighting in the years to come. From a society point of view, sustainability, and in that context, energy-friendly product and application design will remain important. More attention is needed for to-tally waste-free design, as defi ned by cradle to cra-dle design. As far as products are concerned, solid state will become the standard for many applications. The changeover to solid state lighting may be slowed down because it is precisely for solid state lighting that wrong data are often supplied, thus disappoint-ing new users by not meeting their expectations. Good glare restriction in solid state lighting requires innovative optical designs. Here a totally new glare evaluation system is needed, as the present systems have been empirically developed for circumstanc-es totally different from solid state lighting. Strict requirements for colour rendering and colour ap-pearance should be standardised for general indoor lighting purposes where those of the incandescent lamp are the benchmark. As far as applications are concerned intelligent dynamic lighting will become more and more the standard also to safeguard non-visual biological effects. We will see more applica-tions for lighting therapy to decrease problems relat-ed with disturbances in the biological clock. In fi xed road lighting visibility of objects looses importance because of developments in car systems themselves. Instead of the luminance concept of road lighting a more three-dimensional concept is needed. When
1 Report at LUX EUROPA 2009, Istanbul
LIGHTING TOMORROW: WHAT’S HOT1
Wout van Bommel
Van Bommel Lighting Consultant Nuenen, The Netherlands E-mail: [email protected]
Light & Engineering Vol. 18, No. 2
6
even longer. Solid state light sources for lighting are available on the market only since the turn of the century. Today LEDs are really “hot” and still in full development to become available in even more ef-fi cient and better colour quality versions. At this stage we are faced with some problems that have to be overcome in order not to hinder the introduction of good quality LED lighting solutions.
Correct data In conventional lighting the vast majority of sup-
pliers of both products and lighting designs provide correct data about their products or designs. It is dis-turbing to see that this is too often not the stand-ard procedure when it comes to solid state light-ing. The reason probably being that still too often products and designs do not (yet) fulfi ll the needs of the end-user. This behaviour of suppliers leads to new users of solid state lighting being disappointed in their expectations and as such it hampers a quick and successful introduction of good quality solid state lighting products and installations into both the consumer and professional market. As an illustra-tion: the Dutch Metrology Institute VSL in February of 2009 tested 5 different brands of LED lamps. The incandescent lamp wattage equivalence claimed was 25 to 40 W, whereas the measured reality was less to much less than 15 W [2]. Also in designs, “equiva-lence” with conventional installations is sometimes claimed while in reality the LED installation is not equivalent in terms of lighting level, uniformity or glare restriction.
Glare The very small size of an individual LED is one
its very interesting properties. It opens a number of new possibilities to create light distributions that were nit possible with larger conventional light sources. This in turn enables new types of lighting design. A good example are outdoor lighting de-signs for monuments and buildings with near paral-lel beam LED lines: new positioning possibilities to-gether with so far unknown dramatic effects. Howev-er the same property of a small light emitting surface gives in many other applications the risk of glare. New innovative (luminaire) optical designs are ur-gently needed. Here it is good to realise that evalu-ation of a design as far as glare restriction is con-cerned is diffi cult because most, if not all, of today’s glare evaluation systems are not suitable or valid for LED light sources. For indoor lighting the UGR sys-
sidering our lighting standards and developing more energy effi cient lighting products. For example, the fi rst energy effi cient alternative for the incandescent lamp, the compact fl uorescent lamp, was only intro-duced to the market in 1980, 8 years after the pub-lication of the Rome report. Of course since then, we have learned to react quicker, especially since in the nineteen nineties, when besides the shortage in available resources, also the negative consequenc-es of CO2 emissions on climate change became ap-parent. Today sustainability is the key word.
Energy and lifetime In the professional lighting world sustainability
has been approached from an energy effi ciency and lifetime point of view. And indeed we have seen very important developments in this respect in gas dis-charge lamps and more recently in solid state light-ing. Also the design of the total installation (lamps, luminaires, gear and layout of luminaires) is today geared towards energy friendly installations that live longer. Intelligent installations that optimize the actual use of lighting, further decrease the use of energy.
Cradle to Cradle In some other industries, apart from energy sav-
ing and longlife cycles, impressive recycling steps have already been taken. The ultimate goal here is “Cradle to Cradle” design or in practical words to create systems that are not just effi cient but essen-tially waste-free. As the inventors of this term, Mc-Donough and Braungart [1], say: “remaking the way we make things” is needed to achieve this. In the lighting industry, this “hot society theme” is still un-derdeveloped. Recycling of glass, mercury and phos-phorus can only be seen as the fi rst step, albeit an important one, especially if we take all components of a lighting installation into account.
PRODUCTS
Solid state lightingAfter the introduction of the fi rst incandescent
lamp in 1879, and the last fundamental improve-ment of that lamp in 1917 (double coil incandescent lamp), it took until 1932 to introduce a fundamental-ly new lamp technology: gas discharge lamps (fi rst type: low pressure sodium lamp). The time span to develop the next fundamentally new light source for professional and consumer lighting purposes took
Light & Engineering Vol. 18, No. 2
7
ramic is one of the directions enabling the reduc-tion of binning. As far as the quality of white light is concerned, for general indoor use we should not accept LEDs with a poorer colour rendering than the standard compact fl uorescent lamps provide today (Ra>80). Perhaps, since there is not yet a standard for LED lamps, we should consider to standardize colour rendering on a somewhat higher level than was accepted for CFLs. Standard CFLs have some-times generated colour rendering complaints when used in the home. Of course this would mean a some-what lower effi cacy, but given the LED’s develop-ment potential for higher effi cacies this should, in the longer term, be no severe problem. For general ac-ceptance of LEDs in home lighting it is also essential that the colour impression is closely the same as that of an incandescent bulb. Also here we come upon the problem that high colour temperature (“blue-rich white light”) LEDs can be produced more effi cient-ly than lower colour temperature LEDs. We should however rigorously stick to this requirement. Since the discovery in 2002 of a third photosensitive cell in the retina of the eye we understand the non-visual biological effects of lighting relatively well. We have learned that higher colour temperature light in the morning and lower colour temperature light in the evening before going to bed is effective in keeping the right rhythm of our biological clock. In this re-spect it could be interesting to develop special LED-lamps for home lighting that automatically adapt their colour temperature accordingly.
Solid state lighting: what’s next?We may ask ourselves the question what new
method of artifi cial light creation, fundamentally dif-ferent from incandescence, gas discharge and solid state, is possible? Perhaps we will learn to capture natural daylight and store it as light until the moment we want to use it as “artifi cial light”. So in a way “putting light in a box and releasing it when we need it” [4]. Nano-physical research with photonic crys-tals shows that light indeed can be stored as light [5].
LIGHTING APPLCATION
Non-visual biological effects
Natural circadian effects For only some ten years now the professional
lighting world has been seriously involved in the subject of non-visual biological effects of light.
tem is used for glare evaluation. Empirical research from both the USA and Europe, on which the UGR system is based, dates mainly back to the late fi f-ties and early sixties of the last century (e.g. Luck-iesh, Hopkinson, Guth, Sollner, Bodmann, Fischer). Small light sources and mirror optics were not or hardly taken into account in the research of those days. The TI concept as we use it today for glare re-striction in road lighting has been developed based on research dating back to the thirties of the last cen-tury (e.g. Holladay, Stiles). The concept has been re-fi ned for road lighting in the sixties and early seven-ties based on assessments of installations using long tubular low pressure sodium lamps and ovoid high pressure mercury lamps (e.g. de Boer, Schreuder, Adrian, Fisher, Sörensen). With smaller tubular high pressure sodium lamps it has already been noticed that sometimes the TI system leads to somewhat unexpected results as far as actual glare sensation is concerned. Finally, outdoor sports lighting also has got its own glare evaluation system: the GR system. It is based on appraisal tests carried out in the eight-ies of the last century on training fi elds and in stadia with high power metal halide lamps (van Bommel, Tekelenburg). With conventional lighting these three separate systems worked moderately well. Given the specifi c properties of LEDs and LED clusters it is ur-gently needed that all three glare systems are evalu-ated on their validity for installations using LEDS. Probably it is necessary to develop a whole new glare evaluation system. This would also give the chance to try to develop one generic system for all fi elds of application. Perhaps new knowledge about facial muscles refl exing in response to glare can play a role in the development of such a system. An ocular stress monitor that produces electromyograms (elec-trical activity generated by muscles) has already been developed to study discomfort glare [3].
White light colour quality LEDs can effi ciently be produced in all colours
of the rainbow, without using fi lters. However for use in many indoor lighting situations LEDS must also be produced in consistently white light of good quality. For consistency, the binning procedure is used by the manufacturer: testing all white LEDs produced and dividing them into bins with a same tint of white light.
Of course the goal must be to reduce the need for binning with the ultimate goal being no binning at all. Converting powder phosphors into solid ce-
Light & Engineering Vol. 18, No. 2
8
while they drive a long stretch of road. The purpose of this type of research is to examine if road lighting can reduce the number of micro sleeps of nighttime drivers. If so, the next question to answer, of course, is which type of road lighting does this most effec-tively. To illustrate the importance of this type of re-search: a test where the EEG of drivers was analyzed over a nighttime drive of 415 km motorway without fi xed road lighting revealed that the cumulative du-ration of these micro sleeps adds up to more than 6 minutes [6]. Here we thus have a whole new ap-proach to defi ning the need for and quality of road lighting, totally different from the conventional vis-ual performance and visual comfort arguments.
ROAD LIGHTING
Visibility In the beginning of the twentieth century,
Waldram defi ned on the basis of visibility of small objects the “silhouette principle”: most objects on roads with road lighting are seen as dark silhouettes against the bright background of the lit road surface. This, in turn, has been the key to the development of the luminance concept of road lighting as still used today. Already early on one realised that the combined effect of road and car lighting is a negative combination because the vertical component of car lights reduces the silhouette effect. However, in order to limit glare from oncoming cars, car beams could not reach far ahead and thus the negative “combina-tion effect” was limited and could be neglected. With the introduction of Advanced Front lighting Systems (AFS) this has now been changed. These intelligent and automatic car lighting systems have specifi c ur-ban-, highway- and “curve” beams that reach far and even “around the corner”. They increase visibility of objects to such an extent that often suffi cient vis-ibility can be guaranteed by the advanced car lighting system alone. IR night vision systems that display an image recorded with the aid of invisible IR radiators on the dashboard have also been introduced. They will further increase the importance of own car sys-tems as far as visibility is concerned. Clearly, as far as fi xed road lighting is concerned visibility of ob-jects on the road is not “hot” any more. The role of fi xed road lighting will move much more in the direction of providing traffi c guidance, traffi c fl ow, maybe reducing micro sleeps and, very important today, providing personal security. We have to ask ourselves therefore if the luminance concept is still
In 2002 a third type of photosensitive cell in the re-tina of the eye was discovered that is connected with the biological clock in our brain which in turn is con-nected with the pineal gland that regulates part of our hormone production. Some of these hormones give energy (cortisol that produces glucose) and some make us sleepy (melatonine). We now understand why the 24 hour rhythm of natural daylight and nat-ural darkness partly determines our alertness and en-ergy during the daytime and our sleep quality during night. When daylight is not suffi ciently available ar-tifi cial light has to take over its role. The maximum sensitivity of the new cell type is obtained for short wavelengths. Artifi cial light can therefore effi ciently be used by supplying cool white light in the morning and warm white light in the afternoon and evening For this reason intelligent dynamic lighting installa-tions are being used in offi ce and industrial lighting environments in many different ways. International guidelines, however, are still lacking. With the arriv-al of LED lamps for the consumer market, automatic colour adapting systems may be developed for those who cannot easily go outside to benefi t from day-light. So intelligent dynamic lighting will be “hot” for both professional and consumer applications.
Lighting therapy The knowledge about non-visual effects of light-
ing has also made clear that lighting can be used in lighting therapy to decrease problems related with disturbances in the biological clock. These distur-bances may occur because of certain illnesses or be-cause of our way of living. A well-known example of the fi rst category is SAD (seasonal affective disor-der or winter depression), and of the second category jetlag and shift work. Other applications for lighting therapy have been studied and protocols have been defi ned. Many more may be expected, sometimes as an alternative to the intake of medicines. In sum-mary, today’s use of lighting therapy is connect-ed connection with illnesses which include: SAD, geriatric depressions, sleep disorders, sleep-wake rhythm problems of Alzheimer patients, burnouts and ADHD. In connection with our way of living, the list today contains: jetlag, shift work and opti-mising the peak time of top sportsmen.
Neurological aspects and road lighting The neurological impact of road lighting is begin-
ning to attract attention as well. In fi eld tests, brain activity (EEG) of test drivers is being measured

Light & Engineering Vol. 18, No. 2
9
This total framework is described in far more detail in a recent publication by the author of this paper [7]. With the knowledge of today the conclu-sion clearly points to the direction of warm-white light being most effective. The decisive factors are the contribution of colour recognition and the short wavelength loss of the elderly. Given the increase in elderly participating in so many activities, we should take their needs into account more seriously in all lighting applications: another “hot” subject.
REFERENCES
1. McDonough, W; Braungart, M.; “Cradle to cra-dle”, North Poin press (2002).
2. Koek, W.; “LED’s be honest; the path to market acceptance”, Green lighting event, Frankfurt (2009).
3. Murray, I.J.; Plainis, S.; Carden, D.; “The ocular stress monitor: a new device for measuring discom-fort glare”, Lighting Res. Technol. 34,3, pp. 231–242 (2002).
4. Knoop, M,; “Light out of the box”, International Lighting Review, Yearbook (2007).
5. Flück, E.; Hammer, M.; Vos, W.L.; Hulst van, N.F.; Kuipers, L.; “Near-fi eld probing of photonic crys-tals”. Photonics and Nanostructures – Fundamentals and Applications, 2 (2), pp. 127–135. (2004).
6. Mollard, R.; “Hypovigilance and micro-sleep while driving a stretch of motorway”, Road Lighting Symposium, Brussels (2003).
7. van Bommel, W.J.M.; “The spectrum of light €sources and low lighting levels: the basics”, The Lighting Journal (ILE), October (2009).
the right concept. Probably a more three dimensional lighting concept is more suitable.
Road lighting and mesopic vision Already for quite some time heated discussions
have taken place about certain lamp spectra having advantages on vision at low lighting levels. The term “Mesopic Vision” is key in this discussion. Today this discussion is especially important because with LEDs all kinds of light colours and all kinds of dif-ferent tints of white light can be produced. Probably this year the CIE will come up with an important ex-tensive publication focussing especially on the off-line vision aspect of mesopic vision. While this will help to steer the discussions in the right direction, it could also mean that some readers will forget to take the complete picture into account meaning that the subject will remain “hot” for needlessly long. The complete picture is defi ned by:
• On-line vision where photopic photometry is determining.
• Off-line (peripheral) vision where mesopic pho-tometry is determining.
In mesopic photometry the determination of the actual adaptation state is required. Effects of glare sources from fi xed road lighting, oncoming cars, windows and refl ected glare should be taken into account together with the luminance of the road surface.
• Contribution of colour recognition to identifi ca-tion of faces (important for security).
• Short wavelength (blue and green) vision loss of the older eye.
Wout van Bommel, Prof., M.Sc. has over 35 years of experience in road, sports, offi ce, industrial, architectural lighting (indoor and outdoor). With his vast international experience in lighting application he advices as an independent Lighting Consultant, after his retirement from Philips Lighting, for lighting designers, researchers, companies, municipalities and governmental bodies. He assesses the quality of specifi cations of lighting installations (certifi cation). He presents papers in English, German and Dutch at congresses, symposia and workshops and teaches at lighting courses. He is available as a personal tutor for beginning presenters or those who want to improve their presentations. Since more than 10 years Wout van Bommel is also specialized in the new subject of non-visual biological aspects of lighting infl uencing in turn our health and wellbeing. He gives basic and advanced lectures about lighting, health and wellbeing for both professional and laymen groups of people

10
Light & Engineering SvetotekhnikaVol. 18, No. 2, pp. 10-14, 2010 No. 6, 2009, pp. 4-7
quired microbiological parameters has become unacceptable.
A negative infl uence on human health of disin-fection by-products formed as a result of irrational application of oxidizing methods (chlorination, ozo-nation), as well as their insuffi cient effi ciency in re-moving a number of microorganisms (viruses, pro-tozoa bladder, spores etc.), have promoted the de-velopment of such methods as membrane cleaning, sorption, UV disinfection, etc., which allow combin-ing chemical oxidizing with physical methods of wa-ter treatment. UV disinfection is the safest of these methods and at the same time is one of the most ef-fective methods for dealing with the whole spectrum of microorganism’s disinfection. It is used in practi-cally all schemes of drinking water preparation, and its only one disadvantage is non-availability of an aftereffect that in case of need can be compensated by using other technologies.
In the last few years, UV disinfection of sew-age has occupied a leading position in industrially developed countries. In the USA, more than 50 % of large-scale and medium-scale aeration stations of over 100 000 m3/day productivity already ap-ply UV equipment, and more than 90 % of those in design and construction will use this equipment in the future. In the People’s Republic of China, since 2005 tens of aeration stations with throughput of over 50 000–100 000 m3/day are commissioned every year, and overwhelming majority of them use UV disinfection. The method prevails over other methods of sewage disinfection in Western Europe as well. France, Italy and Spain are in favour of UV disinfection of sewage discharged into coast are-
ABSTRACT
The main advantages of UV disinfection of water and air compared to competing technologies are pre-sented, and the successes of LIT SCIENTIFIC AND PRODUCTION ASSOCIATION JOINT-STOCK COMPANY concerning the development and pro-duction of complete equipment for UV disinfecting are described in brief. This is an important issue not only for consumers within the CIS, but also abroad. The Company is among the top three world leaders in this fi eld, based on sales and production volume.
Keywords: water, air, chlorination, ozonation, membrane cleaning, sorption, UV disinfection, safe, harmless, economic
During the last few decades, ultra-violet (UV) disinfection of water has become a traditional wa-ter preparation method, together with other methods with the same aim. Such intensive growth is con-nected with new qualitative development of the method, and primarily with the next technological revolution in the fi eld of drinking water preparation and sewage treatment. The reason for this revolution was a growing comprehension in the 1980–1990 of global economic, epidemiological and medical prob-lems, which all industrially developed and develop-ing countries faced.
New requirements for the quality of economi-cally prepared drinking water and of sewage have made applied disinfection methods more intercon-nected, and so achievement at any cost of the re-
CURRENT STATE AND PROSPECTIVES OF UV WATER
AND AIR TREATMENT TECHNOLOGY*
Sergei V. Kostyuchenko
LIT Scientifi c And Production Association Joint-Stock Company E-mail: l – [email protected]
* Translated in English by G.G. Gorelov

Light & Engineering Vol. 18, No. 2
11
tion in various branches of municipal services and in industry [5–10].
Operational in Russia are more than 20 sta-tions of UV sewage disinfection of more than 50 000 m3/ day throughput, including those at the following treatment facilities: at Novolipetsky met-al works (90 000 m3/day); at ANHK Open Society, Angarsk (250 000 m3/day); at Avtovas Open Soci-ety, Toglyatty (290 000 m3/day); at St.-Petersburg (330 000 m3/day) and on Golodny island in Volgo-grad (458 000 m3/day).
In 2007 the largest UV sewage disinfection unit in the world was commissioned at the Lyuberet-sky treatment facilities of Moscow (its productivity is equal to 1 million m3/day) (Fig. 1), and projects for the Northern waterworks in St.-Petersburg (1.58 million m3/day) (Fig. 2), and for the Kury-anovsky treatment facilities of Moscow (3 million m3/day) are ongoing.
As mentioned above, UV disinfection is gaining ground in the industry of drinking water preparation. Depending on the set tasks and on the technological
as of the Mediterranean and that used for watering of agricultural crops. A separate, quickly develop-ing direction in regions with a droughty climate and defi ciency of fresh water (Israel, the USA (Califor-nia), Australia, the United Arab Emirates, etc.), is re-use of polished effl uent. UV disinfection in this fi eld is applied as a method being almost the only avail-able choice from ecological, economic and hygienic points of view [3, 4].
Russia does not just adopt the experience of oth-er countries but develops its own practical and re-search bases. The work performed by the FNCG of F.F. Erisman Federal State Unitary Enterprise, the Moscow Medical Academy of I.M. Sechenov, Institute of Medical Parasitology and Tropical Med-icine of E.I. Martsinovsky, Scientifi c and Research Institute of A.N. Sysin, the VODGEO Scientific and Research Institute, the MFTI (State Univer-sity) and by Federal Agency of Supervision in the sphere of consumers rights protection and of hu-man well-being, have allowed forming an exhaus-tive standard base of UV disinfection applica-
Fig. 1. Lyuberetsky treatment facilities, Moscow Region
Fig. 2. Northern waterworks, St.-Petersburg

Light & Engineering Vol. 18, No. 2
12
In Russia the world’s largest project of UV dis-infection system of drinking water for St.-Peters-burg was realized in record time (in 5 years only). The set of UV disinfection stations covering water supply of the metropolis and its suburbs, has maxi-mum productivity over 5.5 million m3/day. A similar project developed for New York, will be operational in 2010–2012.
A new application for Russia, which is quick-ly developing in the West, is use of UV radiation in conjunction with oxidizers (Н2 О2 or О3). The so-called method of deep oxidation is used to re-move difficult-to-oxidize anthropogenous impu-rities. In this case UV rays influencing Н2 О2 or О3 preliminary dissolved in water, form OH- radi-cals. Another prospective application of UV irradia-tion is photocatalysis.
A considerable number of scientifi c and tech-nological studies on photocatalysis in water are fo-cused on the application of TiO2 together with UV irradiation [14].
UV disinfection is widely used in food, pharma-cological and electronic industries, water recycling, fi sh farming, etc. [15]. Main directions of develop-ment of UV devices, sets and stations based on them are as follows: maximum automation, improvement of hydrodynamics and achievement of the highest possible parameters of UV lamps (effi ciency, power and life time).
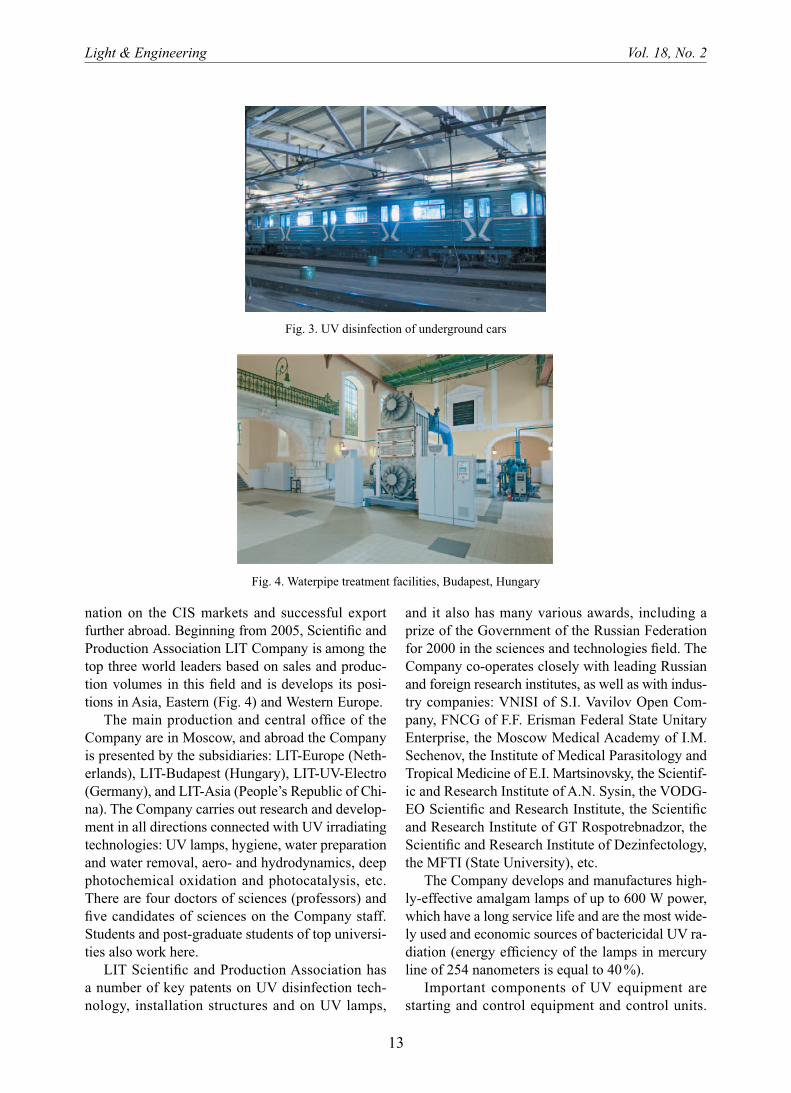
UV disinfection of air and surfaces until recently had a limited scope only in medical and other special fi elds. Because of the growing threat of infections carried by air-droplets and tactile contact, over the last years development of new technologies in build-ing, transport and in industry as well as their applica-tion in places of mass public gathering, cause a ne-cessity of improving quality of air medium by micro-biological indicators (Fig. 3). The UV disinfection method has appeared to be one of most ecologically safe and economic in solving these problems. There-fore in recent years, devices of UV air disinfection of large productivity (up to tens of thousands m3/hr) are quickly being developed to be used in centralized air conditioning and air ventilation systems in indus-try and transport facilities (recirculators, irradiators, modules etc.). Russian Scientifi c and Production As-sociation LIT Company has been occupied with UV disinfection since the 1990 s, when interest in this method was reviving. UV installations developed and manufactured by the company are equal to the best Western counterparts, which allows our domi-
chain, UV irradiation can be made in different points of the technological chain. Russia has conside rable positive experience of UV disinfection applica-tion in systems of centralized water supply and has reached a priority position regarding the implemen-tation of this method in comparison with other lead-ing countries. Western Europe and US companies apply UV irradiation to achieve a demanded degree of protection against pathogenic agents of parasitic and virus infections. To provide a guaranteed safety level for drinking water even at its acceptable qual-ity in the water source and at absence in it normal-ized indicators, a water preparation structure should secure the removal of viruses and bladders of pro-tozoa by an order of magnitude of 3–4. Taking into consideration the rigid limitations over a wide spec-trum of by-products, achievement of such a degree of protection using any one disinfection method in isolation is impossible. Therefore, the moderni-zation of water-supply facilities in these countries occurs as a rule by the escalation of cleaning steps and by using combinations of various disinfection methods. UV irradiation is well blended with the concept of multiple barriers thanks to a high effi -ciency relative to cryptosporidia bladders and to the absence of by-products formation. It should be noted that in Europe and in the USA cryptosporidia blad-ders are objects of great attention. Even in multi-stage cleaning structures, including sorption and (or) membrane fi ltration as well as reverse osmosis, UV irradiation is the fi nal guarantor of water safety [11]. According to the Degremon Technology Compa-ny data, volume of UV technologies introduction into water pipe systems in the USA even by abso-lute fi nancial costs, the next few years will outstrip the volume of ozone technologies, and cost of the fi rst ones relative to 1 m3 of the being treated wa-ter is several times lower than the second ones [12].
In Russia, there is unique experience of UV dis-infection use at the stage of natural water primary treatment, as well as at intermediate stages of water preparation.
The choice of the UV disinfection stage localiza-tion depends on many factors, which are estimated integrally for each object.
For example in Cherepovets, UV irradiation is carried out at one of the waterworks after clari-fi cation by recirculator before water is delivered to the fi lters, and at another station UV irradiation is made directly before water is supplied into the water-main [13].
Light & Engineering Vol. 18, No. 2
13
and it also has many various awards, including a prize of the Government of the Russian Federation for 2000 in the sciences and technologies fi eld. The Company co-operates closely with leading Russian and foreign research institutes, as well as with indus-try companies: VNISI of S.I. Vavilov Open Com-pany, FNCG of F.F. Erisman Federal State Unitary Enterprise, the Moscow Medical Academy of I.M. Sechenov, the Institute of Medical Parasitology and Tropical Medicine of E.I. Martsinovsky, the Scientif-ic and Research Institute of A.N. Sysin, the VODG-EO Scientifi c and Research Institute, the Scientifi c and Research Institute of GT Rospotrebnadzor, the Scientifi c and Research Institute of Dezinfectology, the MFTI (State University), etc.
The Company develops and manufactures high-ly-effective amalgam lamps of up to 600 W power, which have a long service life and are the most wide-ly used and economic sources of bactericidal UV ra-diation (energy effi ciency of the lamps in mercury line of 254 nanometers is equal to 40 %).
Important components of UV equipment are starting and control equipment and control units.
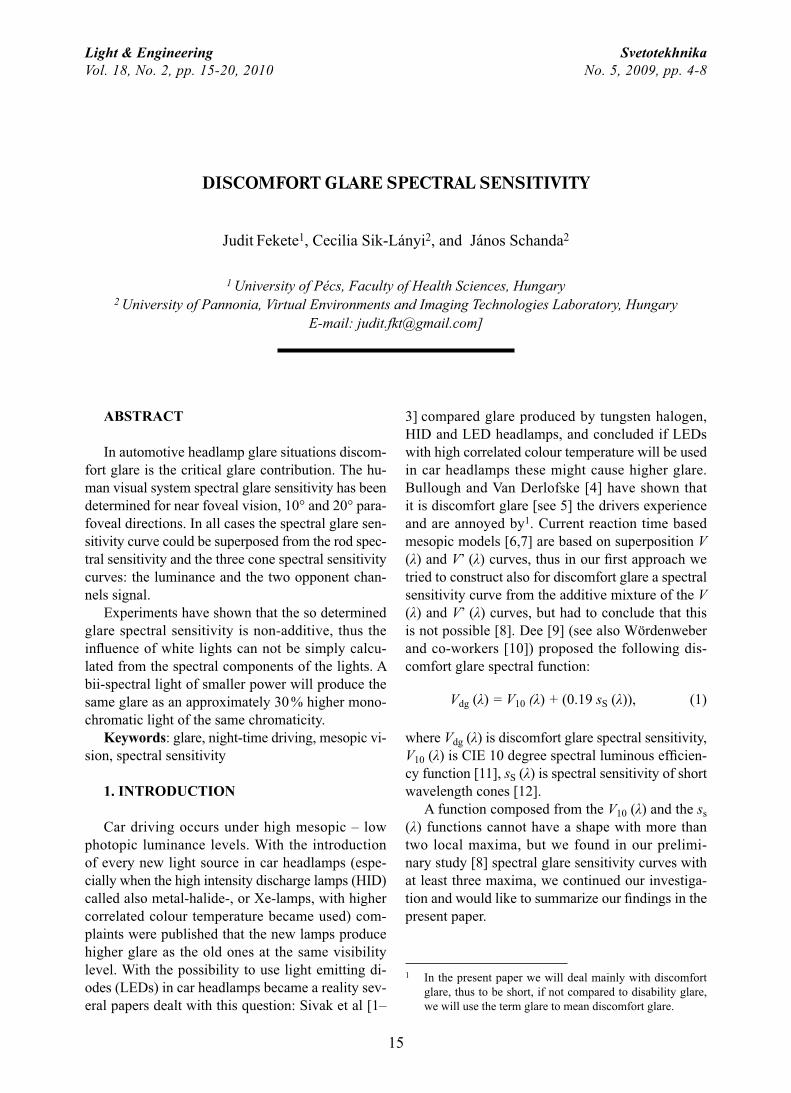
nation on the CIS markets and successful export further abroad. Beginning from 2005, Scientifi c and Production Association LIT Company is among the top three world leaders based on sales and produc-tion volumes in this fi eld and is develops its posi-tions in Asia, Eastern (Fig. 4) and Western Europe.
The main production and central offi ce of the Company are in Moscow, and abroad the Company is presented by the subsidiaries: LIT-Europe (Neth-erlands), LIT-Budapest (Hungary), LIT-UV-Electro (Germany), and LIT-Asia (People’s Republic of Chi-na). The Company carries out research and develop-ment in all directions connected with UV irradiating technologies: UV lamps, hygiene, water preparation and water removal, aero- and hydrodynamics, deep photochemical oxidation and photocatalysis, etc. There are four doctors of sciences (professors) and fi ve candidates of sciences on the Company staff. Students and post-graduate students of top universi-ties also work here.
LIT Scientifi c and Production Association has a number of key patents on UV disinfection tech-nology, installation structures and on UV lamps,
Fig. 3. UV disinfection of underground cars
Fig. 4. Waterpipe treatment facilities, Budapest, Hungary

Light & Engineering Vol. 18, No. 2
14
by, G.Tchobanoglous, D. Swhartzal: T. Asano, Ed. – Lan-caster, PA: Technomic Publishing Co., Inc., 1998.
5. MU 2.1.4.719–98 “Sanitary inspection of ultra-vi-olet radiation use in the technology of preparing drinking water”. –Ministry of Health of Russia, 1998.
6. MU 2.1.5.732–99.”Sanitary-and-epidemiologic su-pervision of sewage disinfection using ultra-violet radia-tion”. – Ministry of Health of Russia, 1999.
7. MU 2.1.2.694–98 “Use of ultra-violet radiation for disinfection of swimming pools water”. – Ministry of Health of Russia, 1998.
8. MU3.2.1757–03 “Sanitary-and-parasitologic evalu-ation of water disinfection effi ciency using ultra-violet ra-diation”.– Ministry of Health of Russia, 2003.
9. MUK4.3.2030–05 “Sanitary-and-virologic con-trol of drinking water and sewage disinfection effi ciency by means of UV-irradiation”.
10. MU 2.1.5.1183–03 “Sanitary-and-epidemiologic supervision of water use in the systems of technical wa-ter supply of industrial enterprises”. – Ministry of Health of Russia, 2003.
11. Awad, J. UV Disinfection Synergy with Ultrafi ltra-tion / Proc. 3 nd Int. Cong.on Ultraviolet Technologies, May 24–27, 2005, Wistler, Canada. – International Ultraviolet Association, 2005 (CD-ROM)
12. Alekseeva L. P. and, Draginsky V.L. Ozonization in technology of natural water cleaning // Vodosnabzhenie i san. tekhnika. 2007. A 4.
13. Results of introduction of up-to-date drinking wa-ter disinfection methods at treatment facilities of Chere-povets / S.N. Ilyin, M.N. Novikov, Yu.I. Nefedov and V.V.Malyshev // Pityevaya voda. – 2004. – № 4.
14. Sarathy, S. R., Mohseni, M. An Overview of UV-based advanced oxidation processes for drinking water treatment // IUVA News. – 2006. № 8 (2).
15. Worobo, R., Harman, Ph. Kinetics of Microbial Inactivation for Alternative Food Processing Technolo-gies. Ultraviolet Light. – U.S. Food and Drug Administra-tion Center for Food Safety and Applied Nutrition. – June 2, 2000.
When their designing and manufacturing the LIT applies components of the highest quality, of both domestic and foreign production.
The newest technical solutions and combination of the best design with microprocessor equipping al-low successful integration of this electric equipment into the systems of automated station control.
The products of the LIT Scientifi c and Production Association correspond to the standard documents of the Russian Federation concerning application of UV disinfection, have hygienic certifi cates and correspondence certifi cates, are certifi ed in accord-ance with the ONORM 5673–2 and DVGW Euro-pean standards for UV equipment.
LIT specialists perform a wide number of design and technologic projects connected with introduction of the UV technology:
• A technological inspection of the objects in-tended for development of optimum UV irradiating equipment confi guration;
• Trial tests of UV disinfection technology at the objects;
• Design works and fi eld supervision;• Equipment commissioning;• Development of regulation for UV disinfection
station operation.
REFERENCES
1. Zagorsky V. A.., Kozlov M.N. and Danilovich D.A. Methods of sewage disinfection // Vodosnabzhenie i san. tekhnika. – 1998. – № 2.
2. Jeyanayagam, S., Pirnie, M. The Links between Water and Wastewater Disinfection: The Past, Present, and Future // IUVA News. – 2003. – № 5 (4).
3. Rongjing, X. Ultraviolet Technology in Water Rec-lamation from Secondary Effl uent: a Perspective from the Tropical Enviroment // IUVA News. – 2005. – № 7 (4).
4. Ultraviolrt (UV) disinfection for wastewater reuse. In Wastewater Reclamation and Reuse / F.J. Loge, J.L. Dar-
Sergei V. Kostyuchenko, Ph.D. in phys.-math., graduated from Moscow Physical Technical Institute, General director of LIT Scientifi c and Production Association Joint-Stock Company
15
Light & Engineering SvetotekhnikaVol. 18, No. 2, pp. 15-20, 2010 No. 5, 2009, pp. 4-8
3] compared glare produced by tungsten halogen, HID and LED headlamps, and concluded if LEDs with high correlated colour temperature will be used in car headlamps these might cause higher glare. Bullough and Van Derlofske [4] have shown that it is discomfort glare [see 5] the drivers experience and are annoyed by1. Current reaction time based mesopic models [6,7] are based on superposition V (λ) and V’ (λ) curves, thus in our fi rst approach we tried to construct also for discomfort glare a spectral sensitivity curve from the additive mixture of the V (λ) and V’ (λ) curves, but had to conclude that this is not possible [8]. Dee [9] (see also Wördenweber and co-workers [10]) proposed the following dis-comfort glare spectral function:
Vdg (λ) = V10 (λ) + (0.19 sS (λ)), (1)
where Vdg (λ) is discomfort glare spectral sensitivity, V10 (λ) is CIE 10 degree spectral luminous effi cien-cy function [11], sS (λ) is spectral sensitivity of short wavelength cones [12].
A function composed from the V10 (λ) and the ss (λ) functions cannot have a shape with more than two local maxima, but we found in our prelimi-nary study [8] spectral glare sensitivity curves with at least three maxima, we continued our investiga-tion and would like to summarize our fi ndings in the present paper.
1 In the present paper we will deal mainly with discomfort glare, thus to be short, if not compared to disability glare, we will use the term glare to mean discomfort glare.
ABSTRACT
In automotive headlamp glare situations discom-fort glare is the critical glare contribution. The hu-man visual system spectral glare sensitivity has been determined for near foveal vision, 10° and 20° para-foveal directions. In all cases the spectral glare sen-sitivity curve could be superposed from the rod spec-tral sensitivity and the three cone spectral sensitivity curves: the luminance and the two opponent chan-nels signal.
Experiments have shown that the so determined glare spectral sensitivity is non-additive, thus the infl uence of white lights can not be simply calcu-lated from the spectral components of the lights. A bii-spectral light of smaller power will produce the same glare as an approximately 30 % higher mono-chromatic light of the same chromaticity.
Keywords: glare, night-time driving, mesopic vi-sion, spectral sensitivity
1. INTRODUCTION
Car driving occurs under high mesopic – low photopic luminance levels. With the introduction of every new light source in car headlamps (espe-cially when the high intensity discharge lamps (HID) called also metal-halide-, or Xe-lamps, with higher correlated colour temperature became used) com-plaints were published that the new lamps produce higher glare as the old ones at the same visibility level. With the possibility to use light emitting di-odes (LEDs) in car headlamps became a reality sev-eral papers dealt with this question: Sivak et al [1–
DISCOMFORT GLARE SPECTRAL SENSITIVITY
Judit Fekete1, Cecilia Sik-Lányi2, and János Schanda2
1 University of Pécs, Faculty of Health Sciences, Hungary 2 University of Pannonia, Virtual Environments and Imaging Technologies Laboratory, Hungary
E-mail: [email protected]]
Light & Engineering Vol. 18, No. 2
16
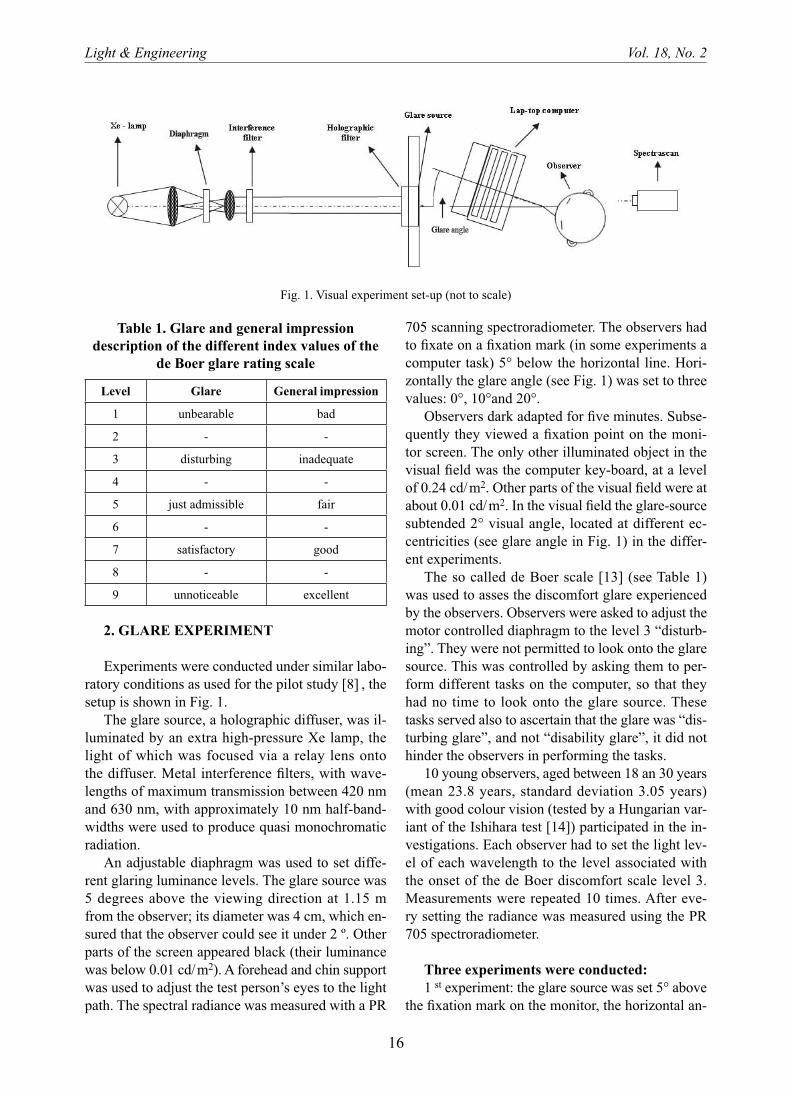
705 scanning spectroradiometer. The observers had to fi xate on a fi xation mark (in some experiments a computer task) 5° below the horizontal line. Hori-zontally the glare angle (see Fig. 1) was set to three values: 0°, 10°and 20°.
Observers dark adapted for fi ve minutes. Subse-quently they viewed a fi xation point on the moni-tor screen. The only other illuminated object in the visual fi eld was the computer key-board, at a level of 0.24 cd/ m2. Other parts of the visual fi eld were at about 0.01 cd/ m2. In the visual fi eld the glare-source subtended 2° visual angle, located at different ec-centricities (see glare angle in Fig. 1) in the differ-ent experiments.
The so called de Boer scale [13] (see Table 1) was used to asses the discomfort glare experienced by the observers. Observers were asked to adjust the motor controlled diaphragm to the level 3 “disturb-ing”. They were not permitted to look onto the glare source. This was controlled by asking them to per-form different tasks on the computer, so that they had no time to look onto the glare source. These tasks served also to ascertain that the glare was “dis-turbing glare”, and not “disability glare”, it did not hinder the observers in performing the tasks.
10 young observers, aged between 18 an 30 years (mean 23.8 years, standard deviation 3.05 years) with good colour vision (tested by a Hungarian var-iant of the Ishihara test [14]) participated in the in-vestigations. Each observer had to set the light lev-el of each wavelength to the level associated with the onset of the de Boer discomfort scale level 3. Measurements were repeated 10 times. After eve-ry setting the radiance was measured using the PR 705 spectroradiometer.
Three experiments were conducted:1 st experiment: the glare source was set 5° above
the fi xation mark on the monitor, the horizontal an-
2. GLARE EXPERIMENT
Experiments were conducted under similar labo-ratory conditions as used for the pilot study [8] , the setup is shown in Fig. 1.
The glare source, a holographic diffuser, was il-luminated by an extra high-pressure Xe lamp, the light of which was focused via a relay lens onto the diffuser. Metal interference fi lters, with wave-lengths of maximum transmission between 420 nm and 630 nm, with approximately 10 nm half-band-widths were used to produce quasi monochromatic radiation.
An adjustable diaphragm was used to set diffe-rent glaring luminance levels. The glare source was 5 degrees above the viewing direction at 1.15 m from the observer; its diameter was 4 cm, which en-sured that the observer could see it under 2 º. Other parts of the screen appeared black (their luminance was below 0.01 cd/ m2). A forehead and chin support was used to adjust the test person’s eyes to the light path. The spectral radiance was measured with a PR
Table 1. Glare and general impression description of the different index values of the
de Boer glare rating scale
Level Glare General impression
1 unbearable bad
2 - -
3 disturbing inadequate
4 - -
5 just admissible fair
6 - -
7 satisfactory good
8 - -
9 unnoticeable excellent
Fig. 1. Visual experiment set-up (not to scale)

Light & Engineering Vol. 18, No. 2
17
(L+M)-S type opponent inputs, producing the yellow/green perception.
For the relative contribution of the L and M cones in providing their additive signal we adopted the recent recommendation of Stockman [16] to use 1.82 L+M. The contribution of the S cones was also estimated to be 0.2 in establishing our glare sensitiv-ity equation. Based on these considerations the ge-neric equation has the following form:
Vdg* (λ) = aV’ (λ)+b (1.82 L++M)+c (L-M)+0.2 S, (2)
where a, b and c are parameters to be optimized, V’ (λ) is the spectral luminous effi ciency curve for scotopic vision.
L, M, S are integrals of the form
A ai i= ∫ ( ) ,λ λdnm
780nm
380
where Ai stands for L or M or S, ai ( )λ is one of the l m s( ), ( ), ( )λ λ λ cone funda-
mental based colour matching functions [17];i.e. Ai provides the contribution of the given cone signal.
Fig. 3 shows the glare sensitivity curve measured at 0° horizontal and 5° vertical (Δ) and the best fi t curve by optimizing parameters a, b and c of Equ.2. Values of the parameters are seen in Table 2, where also the correlation (goodness of fit) coefficient is shown. For this optimization the 2° LMS cone fundamental colour matching functions were used.
Fig. 4 shows similar data for 10° horizontal and 5° vertical, also in this case one can fi nd the best fi t parameter results and correlation coeffi cient in Ta-
gle between the glare source and fi xation mark was 0°, referred to as 0° experiment;
2 nd experiment: the glare source was set 5° above the fi xation mark on the monitor, the horizontal an-gle between the glare source and fi xation mark was 10°, referred to as 10° experiment;
3 rd experiment: the glare source was set 5° above the fi xation mark on the monitor, the horizontal an-gle between the glare source and fi xation mark was 20°, referred to as 20° experiment.
Fig. 2 shows the three spectral glare curves meas-ured at 0°, 10°, 20° horizontally (in all cases the glare source was vertically 5° above the fi xation mark). Vertical lines show standard deviation val-ues of the settings. As can be seen the reproducibil-ity of setting the glare levels was relatively good at 0°, with increasing uncertainty at higher horizontal angles. But it is clear that the curves consist of more than two peaks.
4. DISCUSSION AND SENSITIVITY MODELS
In analyzing the measurement results we have assumed that discomfort is mediated by the visual channels, thus we tried to construct the glare sensi-tivity function using the physiologically validated input channels of the visual system (see e.g. [15]). Input can be provided by the
Rod receptors, that show the V’ (λ) spectral responsivity,
L+M cone receptor input, providing a V (λ) like “luminance” channel,
L-M type cone opponent input, responsible in colour vision for red/green perception,
Fig. 2. Spectral glare sensitivity curves measured at 0°, 10°, 20° horizontally off-axis, and 5° vertically off-axis
Fig. 3. Measured spectrum, 0° horizontal and 5° vertical, (�) and best fi t curve based on optimizing parameters
of Equ. 2

Light & Engineering Vol. 18, No. 2
18
bility that the relatively high contribution of the rods might be due to inter-ocular spread light [18], thus we interpret the contribution of the rods in small angle glare as inter-ocular scattered light.
The decrease of the “luminance channel”, i.e. the contribution of the (1.82 L+M) cone signals, is in ac-cordance what one would estimate from cone den-sities. Similar tendency can be observed for the (L-M) channel.
5. ADDITIVITY EXPERIMENT
In photometry it is well known that if not only the “luminance”, i.e. the magnocellular visual chan-nel contributes to the visual signal, the additivity principle (or the validity of Abney’s law [19]) gets infringed. As we have seen in Section 3 in glare sensation also the chromatic channels seem to be involved, thus also the additivity of quasi mono-chromatic radiation components is important if one would like to estimate the glare produced by white-light glare sources. For a fi rst test the following ex-periment was set up:
ble 2. In this case – as the glare source was off-ax-is – the 10° LMS cone fundamental colour matching functions were used.
Finally Fig. 5 shows the measurement data and the best fi t curve based on Equ. 2 for 20° horizontal and 5° vertical The values of the parameters and the correlation coeffi cients are reproduced in Table 2.
As can be seen from Table 2, the goodness of fi t is for the 0° and 10° horizontal excellent and also for the 20° horizontal reasonably good (in all cases the stimuli were presented 5° vertical), especially if one takes into consideration that the scatter of the single measurement points was much larger in case of the 20° measurement. The value of the parameter a for 0° to 10° is interesting, the weight of V’ (λ) for near foveal vision (only 5° vertical displacement) is higher as originally expected. We tried also to fi t the 0° hori-zontal data by setting a = 0, and instead of that letting the parameter for the S cone contribution to be a vari-able (this would have brought us to an equation more similar to Equ.1.). This resulted – however – in a very bad fi t. Interesting is also the further decrease of pa-rameter a from 10° to 20°. We are indebted to Pro-fessor Pokorny, who called our attention to the possi-
Table 2. Model parameters for glare sensitivity functions
aV’ (λ)
b1.82 L+M
cL-M
Goodnessof fi t [Δ]
0° horizontal, 5° vertical (LMS with 2° viewing angle) 2.756 0.587 2.120 0.978
10° horizontal, 5° vertical (LMS with 10° viewing angle) 3.735 0.185 0.540 0.967
20° horizontal, 5° vertical (LMS with 10° viewing angle) 1.814 0.108 0.365 0.887
Fig. 4. Measured spectrum, 10° horizontal and 5° verti-cal, (�) and best fi t curve based on optimizing parameters
of Equ. 2Fig. 5. Measured spectrum (20° horizontal and 5° verti-
cal) (Δ) and best fi t curve based on optimizing parameters of Equ. 2

Light & Engineering Vol. 18, No. 2
19
6. CONCLUSIONS
From the performed experiments one can state that the discomfort glare sensitivity spectrum is not a simple function where one of the visual mechanisms dominates, but both the cone and the rod receptors play important roles. For the cone contribution both magnocellular and parvo-, konio-cellular channels seem to contribute. Due to this complex mechanism the spectral responsivity curve determined by meas-uring glare sensitivity at single wavelength produces non-additivity.
One has to stress, however, that the investigations described in this paper have been performed under laboratory conditions, under one level of mesopic surround luminance (as basic adaptation) and the added luminance of the monochromatic glare source, where at every wavelength equal discomfort glare was set according to the de Boer scale (and not equal to adaptation luminance). To extrapolate from these to road-lighting and car-headlamp lighting glare sit-uations some further experiments will be needed.
We have selected three LEDs, a green, a yellow and a red one, and had set the additive mixture of the red and green one to be in match with the colour of the yellow one (Rayleigh match). Fig. 6 shows the relative spectral energy distribution of the green + red and the yellow LED.
As a next step the two sources were set to equal glare level (level 3 on the de Boer scale), and the corresponding spectral power distributions (SPD) were measured. This has been repeated for all three angular settings: 5° vertical and 0°, 10° and 20° hori-zontal. Using the three glare sensitivity spectra, de-termined according to the previous section, the esti-mated calculated glare was determined. If the glare sensation would be additive the following equation should hold:
G G R
S V
S
DG
nm
nm
dg*
nm
LED�G+R) d
LED�Y)
( )
( ( )
(
+ =
= =
=
∫ λ
λ
λ λ430
660
430
6660nm
dg*
DGd∫ =V G Y( ) ( ),λ λ
(3)
where Sl (LED-G+R), Sl (LED-Y) are the measured SPDs, Vdg* (λ) is the discomfort glare sensitivity spectrum, determined according to Equ. 2 with the parameters of Table 2, and
G G R G YDG DGand( ) ( )+
are the short hand descriptors of discomfort glare produced by the green + red and the yellow LED respectively.
Experiments have shown that Equ. 3 does not hold. As can be seen from Table 3 the single yellow spectrum produces higher glare as the mixture of the two (red+green) spectra. With increasing eccentric-ity the non-additivity increases.
Table 3. Calculated discomfort glare values for equal visual glare
DDG (G+R) DDG (Y) % DDG [Y/ (G+R)]
0° horizontal, 5° vertical (LMS with 2° viewing angle) 0.003827 0.00439 13.74
10° horizontal, 5° vertical (LMS with 10° viewing angle) 0.0425 0.0577 30.22
20° horizontal, 5° vertical (LMS with 10° viewing angle) 0.00426 0.00593 32.645
Fig. 6. Spectral emission of the red + green and the yellow LED for equal chromaticity

Light & Engineering Vol. 18, No. 2
20
9. Dee, P. (2003). MS Thesis. Rensselare Polytechnic Inst., Troy NY.
10. Wördenweber B., Wallaschek J., Boyce P., Hoffman D. (2007). Automotive lighting and human vision. Springer-Verlag Berlin Heidelberg.
11. Commission Internationale d’Eclairage: CIE 10 degree photopic photometric observer, Publ. CIE 165:2005.
12. Commission Internationale d’Eclairage: Fundamental chromaticity diagram with physiological axes – Part 1, Publ. CIE 170–1:2006.
13. De Boer JB. (1967). Visual perception in road traffi c and the fi eld of vision of the motorist. Public Lighting. Eindhoven Pholops Technical Library.
14. Ladunga K, Wenzel K. (2004). Színlátásvizsgáló atlasz, Colorite Kft. Budapest.
15. Valberg, A (2005) Light Vision Color, Wiley Chiches-ter, Englad.
16. Stockman, A (2009) Luminous effi ciency, cone funda-mentals and chromatic adaptation, in Lingt and Lighting Conf., Budapest 2009.
17. Colour & Vision Res.Lab. Inst. Of Ophthalmology, UCL, Cone fundamentals at http://www.cvrl.org
18. Boynton RM, Riggs LA (1951) The effect of stimulus area and intensity upon the human retinal response. J. Exp. Psy-chol. 42, pp. 217.226.
19. See defi nition of Abney’s law as item 845–03–19 in CIE International Lighting Vocabulary, CIE Publ. 17.4–1987.
REFERENCES 1. Sivak, M., Schoettle, B., Flannagan, M. J. (2003). LED
headlamps: Glare and color rendering. Report UMTRI MI: University of Michigan Transportation Research Institute No. UMTRI-2003- 39.
2. Sivak, M., Schoettle, B., Minoda, T., Flannagan, M. J. (2005 a). Blue Content of LED Headlamps and Discomfort Glare. University of Michigan, USA, ISAL 2005. International Symposium on Automotive Lighting (P), Darmstadt, BRD, Sep-tember 27–28. pp. 212–221.
3. Sivak, M., Schoettle, B., Minoda, T., Flannagan M. J. (2005 b). Short-Wavelength Content of LED Headlamps and Discomfort Glare. Leukos, 2, pp. 145–154.
4. Bullough, J. D, Fu, Z., Derlofske, J. V. (2002). Discomfort and disability glare from halogen and HID headlamp systems. (SAE paper 2002–01–0010). In: Advanced Lighting Technology for Vehicles, SP-1668. Society of Automotive Engineers, War-rendale, PA, pp. 1–5.
5. See defi nition of discomfort glare as item 845–02–56 in CIE International Lighting Vocabulary, CIE Publ. 17.4–1987.
6. Rea M. S, Bullogh J. D., Freyssinier-Nova J. P., Bierman A. (2004). A proposed unifi ed system of photometry, Lighting Res. Technol. 36/2, pp 85–111.
7. CIE TC 1–58 Visual Performance in the Mesopic Range. http://www.lightinglab.fi /CIETC1- 58/index.html.
8. Fekete J., Sik-Lányi C., Schanda J. (2006). Spectral dis-comfort glare sensitivity under low photopic conditions. Opthal. Physiol. Optics 26, pp. 313–317.
Judit Fekete got her IT teacher degree at Loránd Eötvös University. At present she is working at the Faculty of Health Sciences of the University of Pécs as senior lecturer. Her special fi eld of interest is related to discomfort glare studies. The present work is part of her Ph.D. thesis handed in at the Doctoral School of Information Science and Technology of the University of Pannonia
Cecilia Sik-Lányi,Ph.D. from 2000, professor assistant at Visual Environment and Image Realization Lab. Of the University of Pannonia, Vesprem, Hungary. She is a lecture and lab research teacher in vertical reality and information
János Schanda, Dr., Professor Emeritus of the University of Pannonia, Member of the CIE Board. János Schanda is a well-known in the world specialist in fi eld of Colorimetry
21
Light & Engineering SvetotekhnikaVol. 18, No. 2, pp. 21-24, 2010 No. 5, 2009, pp. 22-24
least in MIFI1. Today, this is the National Nuclear University MIFI. The reached successes mainly con-cerned sulfuric lamps of about 700 W microwave power supply (light fl ux of about 100 klm, general colour rendering index no less than 80, etc.).
Now interest in sulfuric lamps of low microwave power supply of no more than 300 W has grown. (The aim of decreasing light fl ux is connected with the diffi culty of uniform distribution of signifi cant light fl uxes over lit objects.) However when reducing the above mentioned power, a decrease of sulfuric lamps light effi cacy occurs, and this highlights the problem of energy effi ciency of sulfuric lamps reten-tion at decrease of microwave power supply to the above mentioned, comparatively small, values. The present article is an addition to our publications [1, 2] is also dedicated to the solution of this problem2.
ABOUT DEVELOPMENT OF LOW POWER SULFURIC LAMPS
According to theoretical reasoning [1, 2, 4–6], to maintain high light effi cacy of sulfuric lamps at de-
1 Work on development of high-effeciency sulfuric lamps have been carried out in MIFI at the Electrophysical Installations Chair since 1996. This has generated consider-able experience of resonator systems development for these lamps. In recent years, MIFI has been cooperati in this fi eld with LG Electronics Company.
2 It should be noted that for example in paper [3], for light fl ux decrease of microwave electrodeless light sources without damage to their light effi cacy, it was proposed to use some other substances instead of sulphur, however no informative data were available in the literature.
ABSTRACT
A sulfuric lamp – a high-effi ciency light source based on electrodeless microwave discharge of ult-rahigh pressure in sulfur vapour – is developed with low power microwave power supply. To decrease the power to 220 W, two versions of pin inserts into the cylindrical resonator are proposed allowing to obtain strong linksof electric fi eld intensity in the lamp spherical envelope to the root square product of microwave radiation power reaching the resona-tor by the Q-factor of the latter. The lamp light ef-fi cacy is about 85 lm/W, light effi cacy of the lamp discharge part is about 140 lm/W, microwave supply power is 220 W and input power is 370 W.
Keywords: light source, sulfuric lamp, electrode-less discharge, microwave discharge, cylindrical res-onator, cylindrical pins, ring pins, lamp envelope, light effi cacy
INTRODUCTION
Research and development of light sources based on microwave discharge of ultrahigh pressure in sul-fur vapour were begun in 1992 by Fussion Lighting Company Inc. (USA) and then were actively contin-ued mainly by LG Electronics Company (Republic of Korea). In Russia this direction was mainly de-veloped by three groups of enthusiasts: in “Pluton”: VEI-MEI-Moscow State University-VNISI, MIFI, VNIIPF-VNIIIS, and the development continues at
HIGH-EFFICIENCY SULFURIC LAMP OF LOW POWER*
Andrei N. Didenko, Alexander V. Prokopenko, and Anton Yu. Shchukin
The National Research Nuclear University MIFI, Moscow E-mail: [email protected]
* Translated in English by G.G. Gorelov

Light & Engineering Vol. 18, No. 2
22
plication of such a resonator has allowed for the improvement of energy effi ciency of the electrode-less discharge at the set power of its microwave power supply of about 220 W. The details are pre-sented in [5].
To increase the ξ parameter at the lamp envelope even more, a cylindrical resonator with the ring pin was developed in the MIFI (Fig. 1).
Optimization of the Fig. 1 system parameters was performed using the CST Microwave Studio pack-age of applied programmes in accordance with mod-el [6], which we developed earlier.
The resonator optimization was carried out by maximizing the ξ parameter at the set frequen-cy ω.
In this case electric fi eld was concentrated be-tween the ring pin and the end face wall. It was di-rected along the resonator axis reaching a maximum at the edge of the pin, near which the lamp quartz en-velope is placed. According to the our calculations, at the envelope location ≈ 500 Ohm1/2/ m, i.e. more than in the cylindrical resonator with two rectangu-lar pins (440 Ohm1/2/ m).
crease of the discharge microwave power supply, in-tensity of electric fi eld E in the lamp envelope should be high. To be more exact, the value of parameter ξ should be as large as possible:
ξ =⋅
E
P Q,
where P is the power of the microwave radiation reaching the cylindrical resonator; Q is the own qual-ity factor of this resonator.
In accordance with this, it was decided in the MIFI to use a cylindrical resonator with pin inserts allowing miniaturizing cylindrical resonators, keep-ing the set frequency of the electromagnetic oscil-lations ω.
Consequently, in works [1, 2], as well as in [3], a cylindrical resonator with two rectangular pins was used. The system represented two identical rectangular pins installed by wide walls in parallel to each other and attached to the base of the reso-nator symmetrically relative to its central axis. Ap-
Fig. 1. A cylindrical resonator with ring pin and discharge part of the lamp with the spherical envelope
Fig. 2. Block diagram of the lamp with the spherical envelope:1 –power supply unit; 2 – magnetron; 3 – wave guide; 4 – resonator; 5 – ring pin; 6 – envelope; 7 – mesh

Light & Engineering Vol. 18, No. 2
23
loy. For convenient use, assembly of the wave guide with the resonator was carried out using a pressure clamp which secured the structure rigidity, assem-bling speed and necessary galvanic contact between the wave guide and the resonator. The resonator working chamber (Fig. 3) was made according to the design dimensions of the resonator and of the cylin-drical pin given above.
Research on the resonator working chamber char-acteristics was performed using a regular measur-ing installation of the microwave power engineer-ing laboratory of the MIFI. To measure the Q-factor of the resonator with ring pin, the two-port network method [7] was used. The installation included the G4–79 generator with working frequencies interval of 1.95–2.54 GHz and with output power no more than 40 mW. The frequency meter Ч3–34 А and the frequency carrier Я34–51 with absolute measure-ment error of no more than ± 1 kHz were used. Mi-crowave path of the installation contained the inves-tigated resonator connected by means of a transmis-sion-type circuit. The spectrum analyzer С4–34 was used as an indicator of the output signal by power and frequency. The installation was used for meas-urement of resonant frequency of the working cham-ber, of own (Q) and of loaded Q-factor of the reso-nator, as well as for the coupling window fi ne tun-ing. Resonant frequency and Q was 2452 MHz and 1200 accordingly.
Light left the resonator working chamber through a metal mesh with the cell area of 5 mm2.
Galvanic contact of the mesh with the resonator was accomplished by means of a pressure clamp.
Evaluation of the lamp light fl ux was made us-ing CL200 Minolta and Ю-117 luxmeters. Spheri-
Some designed dimensions of the resonator and of the ring pin are as follows: resonator diameter and height are equal to 66 and 47 mm; diameter, height and thickness of the pin wall are equal to 15.9; 17.9 and 4 mm respectively.
For the envelope effective cooling, it revolved on its symmetry axis (perpendicular to the resona-tor axis) with a speed of 2500 rpm. Without revolv-ing it would be softened thermally at one side and “blown out” (would become depressurized). The resonator was excited through the coupling open-ing located at the place of maximum intensity of the magnetic fi eld at the resonator cylindrical wall. Op-timum size of the opening was determined when resonator adjusting at a low power of the microwave power supply.
The sulfuric lamp (Fig. 2) was operated using a household circuit (220 V, 50 Hz). An inverter pow-er supply of the magnetron was made using step-up high-frequency transformers and operated in pulse mode. Input power of the lamp (the power consumed from the supplying circuit) in a regular mode was approximately equal to 370 W. For the microwave power supply, magnetron of 2 М214 model was used with ω = 2462 MHz and with air forced cooling. A stub antenna of the magnetron was dipped into a rectangular wave guide of 72×44 mm section short-circuited at one side. The wave used was Н10. At the other end of the wave guide, a wave-guide junction from 72×44 mm section to 72×17 mm section was made. The coupling device of the resonator with the wave guide was made as the inductive coupling win-dow mentioned (of 41 mm width) in the cylindrical wall of the resonator. The resonator and the wave-guide junction were produced from an aluminum al-
Fig. 3. Appearance of the resonator working chamber of a lamp with the spherical envelope
Light & Engineering Vol. 18, No. 2
24
cal quartz envelopes with inner diameter from 14 to 21 mm and with specifi c dosage of sulfur from 1 to 5 mg/cm3 were used. The result of this evaluation was as follows: the light fl ux was about 31.5 klm, which corresponds to the 85 lm/W light effi cacy of a sulfuric lamp at the microwave power supply about 220 W (input power was equal to 370 W).
Further research is planned to include performing more exact measurements of photometric and elec-trical power characteristics of the developed sulfuric lamps of low power.
REFERENCES
1. Shchukin AYu. and Denisov K.V. Choice of a resonator for effective microwave low power lamp//Izvestiya of the Russian Academy of Sciences. Se-ries “Power”– 2008. – №.2. – pp. 9–16.
2. Didenko A.N., Shchukin A.Yu.and Denisov K.V. Experimental research of a microwave lamp // Izvestiya of the Russian Academy of Sciences. Se-ries “Power”– 2008. – №.2. – pp. 17–21.
3. Vdovin V.G. and Korochkov Yu.A. Problems and prospectives of development of high-effective electrodeless discharge lamps of microwave exci-tation// Svetotekhnika. – 2006. – № 3. – pp. 28–32.
4. Didenko A.N. Microwave power engineer-ing: theory and practice. – Moscow.: Nauka, 2003. 448 p.
5. Didenko A.N., Shchukin A.Yu. and Denisov K.V. Experimental research of a light source based on pin system in the cylindrical resonator //Scientifi c session of the MIFI-2007: Collection of sci.works – Moscow: MIFI, 2007. Vol.8. – pp. 25.
6. Didenko A.N., Prokopenko A.V. and Sh-chukin A.Yu. Development of a microwave lamp based on the cylindrical resonator with a ring pin // Scientific session of the MIFI-2008: Collection of sci.works – Moscow: MIFI, 2008. Vol.5. – pp. 94.
7. Zverev B.V. and Prokopenko A.V. Calcula-tion and design of resonator working chambers for microwave installations. – Moscow.: MIFI, 2004. 92 pp.
Andrei N. Didenko, Dr. of phys.-math. sciences. Graduated from the Physical Department of the Tomsk State University in 1955. Professor, Head of the Chair “Electrophysical Installations” of the National Research Nuclear University “MIFI” (NIYaU “MIFI”). Member Correspondent of the Russian Academy of Sciences
Alexander V. Prokopenko, Ph.D. Graduated from the MIFI in 1998. A senior lecturer of the Chair “Electrophysical installations” of the NIYaU “MIFI”
Anton Yu. Shchukin, an engineer. Graduated from the MIFI in 2006. An engineer of the Chair “Electrophysical installations” of the NIYaU “MIFI”

25
Light & Engineering SvetotekhnikaVol. 18, No. 2, pp. 25-29, 2010 No. 2, 2010, pp. 24-27
provide more safety [1, 2] and reduce the number of nighttime accidents compared with tungsten hal-ogen (TH) headlamps [3]. However the discussion about headlamps during the last decades was often reduced to the aspects of glare. Today, glare is still important, but it has to be considered that it is just one out of many aspects for characterising automo-tive headlamps. Concerning the aspects of glare, lit-erature shows that the process of visibility loss (disa-bility glare) has been well defi ned – for the fi rst time in 1927 [4]. But the subjective feeling of glare (dis-comfort glare) is distinctly more complex, different from disability glare and is less defi ned.
It has been shown, that spectral power distribu-tion (SPD) has no considerable infl uence on the vis-ual performance of the driver (disability glare) when comparing TH and HID headlamps [5]. Surprising-ly this is not equivalent to the feeling of discomfort glare, which additionally is infl uenced by the emo-tional state of a person. Tests showed that HID head-lamps can produce more discomfort glare than TH headlamps [6, 7]. Many of the performed studies re-garding glare used a constant illuminance at the ob-server’s eye and were performed under laboratory conditions for characterising the impact of the SPD in terms of glare. But these results are diffi cult to ap-ply to daily traffi c situations. Therefore, fi eld tests under conditions which are comparable to common traffi c situations should be preferred.
Quite a number of single factors seem to contrib-ute to the complex process which as a result leads to the feeling of discomfort glare. Some of these factors are e.g. the illuminance at the observer’s eye, the SPD of the glaring headlamp and the glare
ABSTRACT
1The Laboratory of Lighting Technology at the Technische Universitãt Darmstadt has performed fi eld tests in order to describe selected parameters in more detail, which could have an infl uence on a subject’s feeling of discomfort glare. This paper dis-cusses the impact of
• the headlamp’s optical concept (reflexion; projection),
• the driver’s spectrum of adaptation (High Inten-sity Discharge, Tungsten Halogen) and
• the spectral power distribution (SPD) of the glare source (HID, Tungsten Halogen) as possible factors.
The choice of one’s own car’s headlamps (TH or HID) has an infl uence on the subject’s adaptation level, but has no real impact on discomfort glare ra-tings. Headlamp optics show a distinct pattern. The tested TH refl ector headlamps were detected to cause signifi cantly higher discomfort glare than both TH and HID projection headlamps, which led to nearly identical feelings of discomfort.
Keywords: discomfort glare, spectral power dis-tribution, headlamp optics, fi eld test
1. INTRODUCTION
High intensity discharge (HID) headlamps are the benchmark in today’s automotive front light-ing and their performance is well-accepted. They
* Report at the 8th International Symposium on Automotive Lighting
DISCOMFORT GLARE – IMPACT OF HEADLAMP OPTICS,
SPECTRUM OF ADAPTATION AND SPD*
Christoph Schiller, Jan Holger Sprute, Nils Haferkemper, and Tran Quoc Khanh
Laboratory of Lighting Technology, Technische Universitãt Darmstadt, Germany E-mail: [email protected]
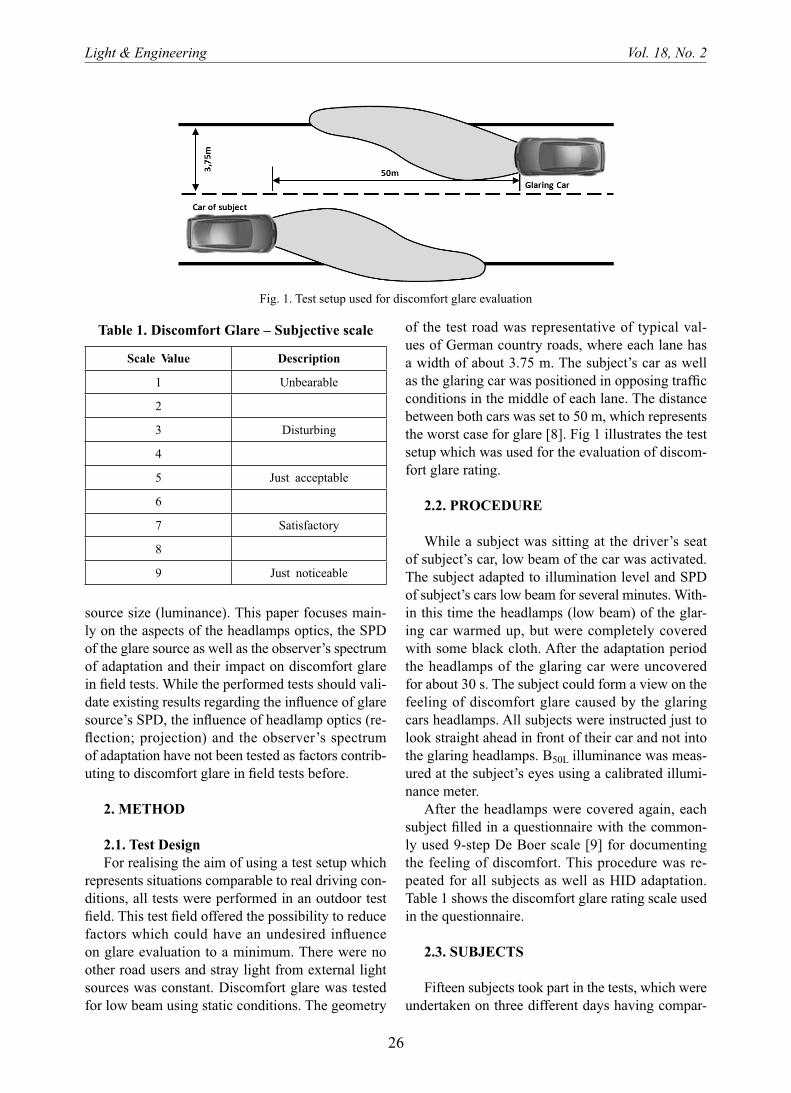
Light & Engineering Vol. 18, No. 2
26
of the test road was representative of typical val-ues of German country roads, where each lane has a width of about 3.75 m. The subject’s car as well as the glaring car was positioned in opposing traffi c conditions in the middle of each lane. The distance between both cars was set to 50 m, which represents the worst case for glare [8]. Fig 1 illustrates the test setup which was used for the evaluation of discom-fort glare rating.
2.2. PROCEDURE
While a subject was sitting at the driver’s seat of subject’s car, low beam of the car was activated. The subject adapted to illumination level and SPD of subject’s cars low beam for several minutes. With-in this time the headlamps (low beam) of the glar-ing car warmed up, but were completely covered with some black cloth. After the adaptation period the headlamps of the glaring car were uncovered for about 30 s. The subject could form a view on the feeling of discomfort glare caused by the glaring cars headlamps. All subjects were instructed just to look straight ahead in front of their car and not into the glaring headlamps. B50L illuminance was meas-ured at the subject’s eyes using a calibrated illumi-nance meter.
After the headlamps were covered again, each subject fi lled in a questionnaire with the common-ly used 9-step De Boer scale [9] for documenting the feeling of discomfort. This procedure was re-peated for all subjects as well as HID adaptation. Table 1 shows the discomfort glare rating scale used in the questionnaire.
2.3. SUBJECTS
Fifteen subjects took part in the tests, which were undertaken on three different days having compar-
source size (luminance). This paper focuses main-ly on the aspects of the headlamps optics, the SPD of the glare source as well as the observer’s spectrum of adaptation and their impact on discomfort glare in fi eld tests. While the performed tests should vali-date existing results regarding the infl uence of glare source’s SPD, the infl uence of headlamp optics (re-fl ection; projection) and the observer’s spectrum of adaptation have not been tested as factors contrib-uting to discomfort glare in fi eld tests before.
2. METHOD
2.1. Test Design For realising the aim of using a test setup which
represents situations comparable to real driving con-ditions, all tests were performed in an outdoor test fi eld. This test fi eld offered the possibility to reduce factors which could have an undesired infl uence on glare evaluation to a minimum. There were no other road users and stray light from external light sources was constant. Discomfort glare was tested for low beam using static conditions. The geometry
Table 1. Discomfort Glare – Subjective scale
Scale Value Description
1 Unbearable
2
3 Disturbing
4
5 Just acceptable
6
7 Satisfactory
8
9 Just noticeable
Fig. 1. Test setup used for discomfort glare evaluation

Light & Engineering Vol. 18, No. 2
27
setup confi gurations. One confi guration was real-ized for all subjects tested on one day, and then the confi guration (headlamps) was switched to the next one. All glaring cars were of the same type and were only different in light source and optics of the headlamps. Before each test, all headlamps were cleaned and their cut-off line was adjusted ac-cording ECE regulations. All headlamp parameters were ECE compliant (serial production) and were tested as a system together with the car where they were built-in.
able dry weather conditions. Table 2 gives an over-view of the number, age and gender of test subjects. Before each test all subjects were informed about the test setup, their task of evaluating discomfort glare and how to fi ll-in the questionnaire.
2.4. TESTED HEADLAMPS
Each subject had to evaluate six different test setups using three glaring cars and two subject’s cars (adaptation). Table 3 shows the different test
Fig. 2. Impact of headlamp optics and spectrum of adaptation on discomfort glare rating
Fig. 3. Impact of headlamp optics and spectrum of adaptation on glare illuminance
Table 2. Subjects of discomfort glare test
Male Female Total
MA1) Number MA1) Number MA1) Max. /Min. Age Number
30,1 13 40 2 31,4 20 / 55 151) MA: Mean Age (years)
Light & Engineering Vol. 18, No. 2
28
higher adaptation levels, are caused by the higher lu-minous fl ux coming from the HID headlamps. More light is refl ected from street surface to subject’s eyes. As a result the feeling of discomfort glare is slightly but not signifi cantly lower.
Both projection systems show nearly identical glare illuminance values (Fig. 3) just depending on the spectrum of adaptation. This consequently leads to comparable discomfort glare ratings (Fig. 2). Moreover higher glare illuminance values (TH re-fl ector system) are causing higher discomfort glare values. As a result, no signifi cant impact of the head-lamps SPD can be shown regarding discomfort glare. Although other research [10] shows that HID head-lamps produce more discomfort glare than TH head-lamps, performed fi eld test cannot validate these re-sults for real driving situations and for correctly ad-justed headlamps.
Glare illuminance, strongly infl uenced by head-lamps optics and design (light distribution), seems to be the most important aspect representing dis-comfort glare.
REFERENCES
1. Schiller, C.; Khanh, T. Q.: First Field Tests of Cars with Completely Built-in LED Headlamps under Realistic Driving Conditions, International Sympo- sium on Automotive Lighting (ISAL), Pro-ceedings, Technische Universität Darmstadt, Vol. 12, Utz Verlag, München, 2007, pp. 131–138.
2. Schiller, C.; Khanh, T. Q.: Geringe Blendung trotz guter Ausleuchtung – für Kfz-Scheinwerfer ein Widerspruch? (Less glare despite of good illumina-ti- on – a contradiction for automotive headlamps?), Verkehrsunfall und Fahrzeugtechnik (VKU), Vieweg Verlag, 9/2008.
3. Schäbe, H.; Schierge, F.: Untersuchung über den Einfl uss der Beleuchtung an Fahrzeugen auf das nächtliche Unfallgeschehen in Deutschland (Re- search on the infl uence of automotive lighting on nighttime accidents in Germany), TUV Rheinland, 25.09.2007, http://www.tuv.com/de/news_ xenonli-cht.html
3. RESULTS
The mean values of all tested subjects are given in Fig. 2 for both adaptation spectra and all three dif-ferent headlamp optics (glare sources).
The mean values of TH and the HID projection system (TH Lens and HID Lens) glare ratings seem to be very similar for both spectra of adaptation. But subjects tend to feel the TH refl ector system slightly more glaring for both TH and ID adapta-tion. Having a more detailed look at the results us-ing ANOVA, it can be shown, that the glare ratings for the TH refl ector system are signifi cantly higher than the ratings for both projection systems using lenses (p=0.08). This is valid for both TH and HID spectrum of adaptation. That means for tested serial production headlamps, which are fulfi lling all ECE regulations: tungsten halogen headlamps can cause a higher feeling of discomfort glare than HID head-lamps, when they are using refl ector optics.
The mean glare ratings also show that subjects seem to be more glared when their own car (subject’s car) uses TH headlamps and their eyes are adapted to the spectral power distribution of the tungsten halogen lamp. Due to the fact that the shown differ-ences are very small and within the standard devia-tions, there is no real impact on the feeling of dis-comfort glare caused by the spectrum of adaptation for the tested subjects (p=0.42). So driving a TH headlamp car or driving a HID headlamp car should make no difference regarding discomfort glare feel-ing in real traffi c, when the driver is just looking straight ahead in front of his own car and not into the glaring headlamps.
Trying to fi nd an explanation for both results de-scribed above, the measured glare illuminance data at the subject’s eye could provide more information. Fig. 3 shows the average values for all six test set-ups. The results clearly show that if the subject’s car uses HID headlamps, this results in a higher adapta-tion level which is caused by 44.4 % (TH Refl ector), 54,2 % (TH Lens) and 56,5 % (HID Lens) more glare illuminance compared to TH adaptation. The high-er glare illuminance values, and therefore also the
Table 3. Tested Headlamp Confi gurations (Test Setups)
Car of Subject (Adaptation) Glaring Car
TH (Refl ector) TH (Refl ector) TH (Lens) HID (Lens)
HID (Lens) TH (Refl ector) TH (Lens) HID (Lens)
Light & Engineering Vol. 18, No. 2
29
8. Schmidt-Clausen, H. J.: Uber die Verbesserung der Sehleistung im Begeg- nungsverkehr durch das kontinuierliche Abblenden (Dimmen) des Fern- lich-tes, Automobiltechnische Zeitschrift ATZ, 81. Jahr-gang, Nr. 9/1979, pp. 439–450.
9. De Boer, J. B.; Schreuder, D. A.: Glare as a Criterion for Quality in Street Lighting, in: Transac-tions of the Illuminating Engineering Society, Vol. 32, No. 2, 1967, pp. 117–135.
10. Sivak, M.; Flannagan, M. J.; Schoettle, B.; Adachi, G.: Driving with HID Headlamps: A Review of Research Findings, SAE Technical Papers Series, Publication Nr. 2003–01–0295, 2003.
4. Holladay, L. L.: Action of a Light Source in the Field of View lowering Visi- bility, Journal of the op-tical Society of America A, 14 (1927).
5. Flannagan, M. J.: Subjective and Objective As-pects of Headlamp Glare: Effects of Size and Spec-tral Power Distribution, Report No. UMTRI-99–36, University of Michigan, 1999.
6. Bullough, J. D.; Fu, Z.; Van Derlofske, J.: Dis-comfort and Disability Glare from Halogen and HID Headlamp Systems, SAE World Congress, 2002–01-
0010, 2002.7. Locher, J.; Isenbort, A.; Schmidt, S.; Kley,
F.: Disability Glare of Halogen, Xenon and LED headlamp systems, in: International Symposium on Auto- motive Lighting (ISAL), Vol. 12, Utz Verlag, München, 2007, pp. 700–706.
Tran Quoc Khanh, Prof. Dr.-Ing., specialist of colour appearance and visual perception in mesopic conditions, in colorimetry and photometry of signal and traffi c lights, optoelectronic and display technology,
in fi eld of LEDs and OLEDs, in optical spectroscopy (UV-VIS-IR) and technical modeling in optic. Dr. Tran Quoc Khanh is a head of the Lighting Technology chair at Technische Universität Darmstadt
Nils Haferkemper, Dipl.-Ing., graduated from Technical University Ilmenay. His fi eld of research is luminance of perception in photometry and colorimetry of automobile and interior
scenes in lighting engineering technologies, infl uence of luminance perception on human in dependence of type of light source, innovation methods of phometric and colorimetric measuremnets
Jan Holger Sprute,Dipl.-Wirtsch.-Ing. Jan Holger Sprute studied Electrical Engineering and Business Administration at Technische Universität Darmstadt, Germany and École Centrale de Lyon,
France. After graduation, he started as a research fellow at the Laboratory of Lighting Technology at TU Darmstadt. His main fi eld of research is new light-based driver assistance systems
Christoph Schiller, Dipl.-Wirtsch.-Ing, studied Electrical Engineering and Business Administration at Technische Universität Darmstadt and Technische Universität Dresden, Germany. After working
in the general lighting application industry, he joined the Laboratory of Lighting Laboratory at TU Darmstadt. His main fi eld of research is mesopic vision with a special interest in street lighting and automotive lighting
30
Light & Engineering SvetotekhnikaVol. 18, No. 2, pp. 30-32, 2010 No. 2, 2010, pp. 37-39
of 50 m (Fig. 1). In front of the subjects there was a pair of Halogen headlamps to illuminate their own foreground. In the oncoming lane the glare sources were installed in point B50L. Seven subjects could be tested at a time.
The glare sources were:• Halogen refl ection system; • Halogen projection system; • Xenon projection system; • LED headlamp prototype I; • LED headlamp prototype II. All headlamps were calibrated in a way that the
illuminance at the eyes of the test persons was 0.4 lx (including the foreground illumination). In prelimi-nary tests this has been assessed as a typical value. The visual performance of the subjects depending from the glare situation was assessed by measuring threshold contrasts. 25 m in front of the test persons a screen was placed in the lane. On this screen Lan-dolt rings were shown in different contrast stages. Each subject had a response board with eight buttons to mark where the gap of the ring was. For each sub-ject and each glare source the individual threshold contrast could be assessed in this way. High contrast means low visual performance, and vice versa.
The results are shown in Fig. 2. There are only very slight differences. If the legal requirements are fulfi lled the visual performance of glared drivers is nearly identical for all glare sources [1].
In further tests discomfort glare was assessed as well.
It was important to ensure that the test subjects did not look directly into the headlamps but into their own lane. Therefore, letters were shown on the screen. Subjects had to press a button if a special
ABSTRACT
1In two studies the infl uence of different headlamp systems on disability and discomfort glare has been quantifi ed. If the legal requirements were fulfi lled, the visual performance of the drivers was nearly identical for all systems (Xenon, Halogen, refl ec-tion systems, projection systems, LED headlamps). Discomfort glare varied slightly if the driver was looking at his own lane. The visual performance decreased dramatically as soon as the legal require-ments were not fulfi lled. In these situations discom-fort glare rose to a high amount.
Keywords: disability glare, discomfort glare, Xe-non, LED headlamp
1. EXPERIMENTS
In two sets of experiments, the infl uence of dif-ferent parameters on disability and discomfort glare was assessed. In their fi rst study, headlamps which fulfi l the legal requirements were tested. In the se-cond study, misaligned and manipulated headlamps were examined.
1.1. STUDY I
The experiments were done in the light testing fa-cility of the Hella company in Lippstadt (Germany). The test subjects found themselves in a typical driv-ing situation: sitting in their car in a driving position and being glared at by oncoming traffi c at a distance
* Report at the 8 th International Symposium on Automotive Lighting
DISABILITY AND DISCOMFORT GLARE OF HEADLAMPS*
Jürgen Locher and Franziska Kley
L-LAB, Germany E-mail: [email protected]

Light & Engineering Vol. 18, No. 2
31
tion system was replaced by the gas discharge lamp. The Xenon projection system of the study I was used as a reference system. Additionally the thresh-old contrast was assessed without glare source (but with foreground illumination).
Thus the following situations were evaluated (in parentheses the illuminance at the eyes of the subjects, foreground illumination included):
• Halogen refl ection system misaligned (1.5 lx); • Halogen reflection system with tuning foil
(1.82 lx); • Halogen refl ection system, Xenon upgrade il-
legal (1.58 lx); • Xenon projection system (0.40 lx); • No glare source (0.22 lx). The results concerning disability glare are shown
in Fig. 4. The threshold contrast for the Xenon pro-jection system is nearly identical with the value in study I. This proved the reliability of the experi-mental setting. Without a glare source the threshold contrast decreases from 4.23 to 3.33. The results for the Headlamps, which do not fulfi l the legal require-ments are particularly interesting. The threshold con-trasts increase dramatically. That means the visual performance is vastly decreased [2].
Another way of expression may illustrate these facts. Reciprocal contrast values yield a level of sen-sitivity. Assuming a threshold contrast of 3.33 stands
symbol appeared. The glare sources were activated simultaneously.
After each trial the test subjects used a slider at the response board to adjust how much they felt glared. Afterwards these values were calculated into the De Boer scale. Fig. 3 shows the results.
On the De Boer scale high values mean low dis-comfort glare and vice versa. Two results are note-worthy: there are no differences between Xenon and Halogen systems if the driver does not look directly into the glare source but into his own lane. The LED headlamps were rated as one stage more glaring. But note that the LED headlamps used here were proto-types of the fi rst generation.
1.2. STUDY II
The structure of study II was parallel to study I. But the glare sources used in study II did not fulfi l the legal requirements. Hence the illuminance at the eyes of the subjects varied strongly.
A Halogen refl ection system was misaligned in a way that the illuminance at the eyes of the subjects was 1.5 lx. This value has been found as realistic in former fi eld studies. A blue “tuning foil” was af-fi xed on the lens of a further Halogen projection sys-tem. In an internet shop an illegal “Xenon upgrade set” was bought. The bulb of a third Halogen refl ec-
Fig. 1. Test setup
Fig. 2. Disability glare Study I
Fig. 3. Discomfort glare Study I
Fig. 4. Disability glare Study II

Light & Engineering Vol. 18, No. 2
32
headlamp leveling control and – of cause – by an il-legal manipulation of the headlamp. Here there is an urgent need for action because this is an important hazard in nighttime traffi c.
In this study, no difference was found in discom-fort glare between Halogen and Xenon systems. So why are there often complaints about Xenon sys-tems? In the study the test subjects were forced to look into their own lane. It may be that many driv-ers are looking directly into the headlamps of on-coming cars in real traffi c. Projection systems (Xe-non and Halogen) have higher luminances at the cover lens and this may raise more discomfort glare in such cases. Many drivers may confuse Halogen projection systems with Xenon systems and people may mistake misaligned or manipulated headlamps for Xenon systems. Both presented reasons are cur-rently only assumptions and have to be validated. It is important to inform drivers that Xenon systems increase safety: they guarantee to maintain the legal requirements in the long run and there is no more disability glare compared to Halogen headlamps.
REFERENCES
1. Locher, J., Isenbort, A., Schmidt, S. & Kley, F. (2007). Disability Glare of Halogen, Xenon and LED Headlamp Systems. In ISAL 7 th International Symposium on Automotive Lighting pp.700–706. München: Herbert Utz Verlag.
2. Locher, J., Schmidt, S., Isenbort, A., Kley, F. & Stahl, F. (2008). Blendung durch Gegenverke-hr: Der Einfl uss unterschiedlicher Scheinwerfer-ei-gen- schaften auf die Sehleistung und das subjektiv empfundene Blend-gefühl. Zeitschrift für Verke-hrssicherheit, 54 (1), pp.10–15.
for 100 % visibility for the situation without glare, visibility go down to approx. 80 % if the glare comes from a vehicle with a Xenon system and to approx. 40 % if the glare comes from a misaligned or ma-nipulated headlamp.
The results for discomfort glare are shown in Fig. 5. It is hardly possible to compare these val-ues with those from Fig. 3 because very different stimuli establish a new internal reference system for the subjects. If the legal requirements are not fulfi lled not only the visual performance decreases. Also discomfort glare increases strongly.
2. CONCLUSION
There are no differences in disability glare be-tween different headlamp systems (Halogen, Xenon, LED, projection, refl ection) if an oncoming car’s headlamps fulfi ll the legal requirements. The visual performance of the glared driver is nearly identical in all these cases, although discomfort glare may vary. Headlamps which do not fulfi ll the legal re-quirements are dangerous! Reasons for a pos sible misalignment can be: the Halogen bulb is not insert-ed correctly or the driver forget to adjust the manual
Fig. 5. Discomfort glare Study II
Jürgen Locher, Dr. He is psychologist and heads the project group Human-Machine-Interaction in the L-LAB, a public private partnership of the University of Paderborn and the Hella company. He is
engaged in the development and optimisation of methods in ergonomic research in the context of vehicle lighting and guidance
Franziska Kley studied Optic Engineering and is an employee of Hella KGaA Hueck & Co. in the Department of Research and Development since 2003. In the L-LAB, she heads the project group Mesopic
Vision, where her main aim is to work on lighting technical and physiological topics as well as vehicle interior lighting design
33
Light & Engineering SvetotekhnikaVol. 18, No. 2, pp. 33-38, 2010 No. 2, 2010, pp. 28-32
distances longer than 500 m. At the same time, the size of the glare source is reduced to well below 1’. For a standard HID module (70 mm diameter of the lens) the object size is 0.6’ at 400 m and only 0.24’ at 1000 m distance.
The commonly used models for estimating dis-ability glare usually incorporate the glare angle as a variable in the denominator, which means a small glaring angle is tantamount to greater impairment for otherwise identical glare source properties and geometry.
In Holladay’s model this would, theoretically, lead to constant glare impairment, no matter how far away the glare source is situated, provided the road is straight and the luminous intensity towards the subjects’ eyes is constant. To illustrate this, a closer look on the model is appropriate. Holla-day [2] postulates, that the equivalent veiling lu-minance L is
2 ,· ·V n nL K E −= Θ∑ (1)
where n is the index for the n-th glare source.
The glare angle Θ can be assumed to be inverse-ly proportional to the glare distance x for long dis-tances. At the same time, the glare illuminance En behaves inversely proportional to the square of the distance x2. Consequently, both effects cancel each other out at long distances. The factor K is a constant that varies with the age of the subject. Interpersonal differences, like eye pigmentation, gender or acuity are not comprised.
ABSTRACT
1During the on-going standardisation of Adaptive Driving Beam systems, the question will be raised, to which maximum luminous intensities the eyes of oncoming road users can be exposed without im-pairing their vision with overdue glare.
Recent experiments on glare impact of new driv-ing beam systems revealed that the laboratory exper-iments on disability glare cannot be applied to real-traffi c conditions by implication. This is particularly true for glare distances over 300 m [1].
Therefore, glare tests with distances of 700 m and 1000 m have been conducted on the Universi-ty’s testing site “Griesheim Air Field”. The results show that the dependency on the glare angle in this study is found to be considerably lower than reported by other researchers.
This fact would enable a moderate increase of light intensity towards oncoming drivers, if these are found to be at a long distance. This enables the conception of new adaptive driving beams which would have induced more glare when the traditional glare models would also apply in traffi c conditions.
Keywords: long distance glare, dynamic glare, disability glare, discomfort glare
1. INTRODUCTION
The glare angle Θ between two distantly oppos-ing cars is becoming very small, i.e. below 0.5° for
* Report at the 8th International Symposium on Automotive Lighting
INVESTIGATIONS ON GLARE IMPACT AT LONG DISTANCES*
Jan Holger Sprute, Stefan Söllner, Nils Haferkemper, Christoph Schiller, Bastian Zydek, and Tran Quoc Khanh
Laboratory of Lighting Technology, Technische Universität Darmstadt, Darmstadt, Germany E-mail: [email protected]

Light & Engineering Vol. 18, No. 2
34
Fig. 1 illustrates these fi ndings by showing the calculated veiling luminance for all three equa-tions when one assumes conventional high beam sources and a straight standard European coun-try road.
The diagram demonstrates that the CIE and Hol-laday equations do not match the subjectively per-ceived glare induced by automotive headlights. Only Carraro’s equation yields an intuitively plausible re-sult. The question that shall be answered by this pa-per is, whether its prediction matches the result ob-tained in realtraffi c geometry.
2. TEST SETUP
To realise a reproducible test setup, the Uni-versity testing site on the former military air fi eld in Griesheim was used. The site offers a straight runway of 1.2 km length and its remote location en-sures that there are no other disturbing light sources present.
2.1. TESTING GEOMETRY
During the current tests, the runway was used and the glare situation was simulated by two static cars, opposed to each other at distances of 700 m and 1000 m. The simulated country road has an as-sumed standard lane width of 3,75 m. 50 m in front of the subjects’ car, a round black painted panel (re-fl ectance > ≈ 0,05) is used as projection screen for the viewing target (Fig. 2).
The viewing target itself is a Landolt ring whose contrast can be varied in 255 steps. The subjects’ task is to correctly report the opening in the ring. The minimum contrast of the background luminance LS and the object luminance L at which the task is still fulfi lled by the subject is measured and logged, i.e. the threshold contrast is determined.
2.2.TESTING EQUIPMENT
The viewing target is presented using a DLP dig-ital video projector. For accurate measurement of the glare illuminance at the respective subject’s eye, two Gigahertz HTC-99 portable illuminance meters are used.
The luminance of the Landolt ring and its sur-rounding (black screen) is measured using a Tech-noTeam LMK 98–3 color with a calibrated 50 mm lens.
This behaviour contradicts the everyday observa-tion that distant cars in fact do not impair as much as cars at an intermediate distance.
The model of Carraro [3] promises more realistic results in that respect:
.0,58 0,75· ·V n nL K E −= Θ∑ (2)
In 2002, the Commission Internationale de l’Eclairage (CIE) published a new model taking into account smaller glare angles (ranging from 0.10 up to 1000) and the personal characteristics of subjects, namely age A and eye pigmentation p [4].
Probably due to the laboratory test setup used, the CIE General Disability Glare equation (3) pre-dicts the observed effects of glare in traffi c situa-tions even worse. At small glare angles, which are induced by long distances, the calculated veiling luminan ces become over proportionally high, as it is considered nearly inversely proportional to the glare angle cubed.
.
×
× (3)
This formula implies that a luminaire with a con-stant intensity towards the subjects’ eye would be-come more glaring with higher distance. Translated into colloquial language, the farther away a car is, the more dazzling it becomes.
Fig. 1. Comparison of the three described glare estima-tion equations when assuming a conventional high beam
source

Light & Engineering Vol. 18, No. 2
35
sequence, the results of each subject have to be ana-lyzed separately. Fig. 3 illustrates the overall results and underlines the need for a differentiated analysis as the interpersonal variations in glare sensitivity are huge. However, it can already be guessed from the nearly linear scatter plot boundaries, that the under-lying principle might be a linear one as has already been shown in [1, 2, 5].
3.1. DEPENDENCY ON ILLUMINANCE
The first hypothesis that has to be verified is whether the dependency of disability glare from the glare illuminance is a linear one as assumed by Holladay and CIE models, or if the alternative hypothesis of a non-linear dependency as described by Carraro is valid [6].
To verify this, a linear regression of glare illumi-nance and threshold luminance difference for every test subject and every glare distance has been per-formed. The regressions show an average regres-
All measurement equipment is calibrated and traceable to German national standards.
2.3. SUBJECTS
The study is conducted with 12 subjects aged 26 to 34 years, all but one are male. The infl uence of age has already been well documented by Vos [5] and others so that a homogeneous group is not con-sidered a disadvantage.
2.4. ANALYSIS TOOLS
In order to be able to compare various measure-ments, the glare illuminance in the plane of the sub-ject’s eye is logged as well. Thus, the test design should be able to produce the dependency of disa-bility glare on illuminance and glare angle in terms of a varying minimum recognisable contrast, the threshold luminance difference ΔL resp. threshold Weber contrast C.
O SL L LΔ = − , (4)
.O SW
S
L LCL−
= (5)
The augmentation of ΔL induced by glare should
be equal to the veiling luminance forecasted by the introduced models, or at least show the same general dependency on the variables even if the commonly used constants are not proving applicable.
3. RESULTS
As always when results of physiological tests which involve different subjects have to be inter-preted, large variances are to be expected. As a con-
Fig. 2. Test setup with projection screen, glaring and subjects’ car
Fig. 3. Overall diagram of test results of all subjects. If theory holds, the threshold luminance difference ΔL
should equal the sum of the threshold difference without glare and the induced veiling luminance

Light & Engineering Vol. 18, No. 2
36
tance a linear model can hence be applied as already discussed above
, (7) where the proportionality factor P is only depend-ent on the distance d or the glare angle, respective-ly. The term K·P (d) can be interpreted as the slope coeffi cient of a linear regression as shown in Fig. 4.
As K is a constant for each test person the slope only varies with the distance.
⎜ ⎟ ,( ) arctan lP dd
β−⎛ ⎞=⎝ ⎠
(8)
where 1 is the constant lateral distance between glare source and viewing target.
If indeed an exponent β exists that fi ts all sub-jects suffi ciently accurately, the ratio R between the observed slopes for two distances can be calculated
= =2
1
arctan( )( )
arctan
P dRP d
β−⎛ ⎞⎜ ⎟⎜ ⎟≈⎜ ⎟⎜ ⎟⎜ ⎟⎝ ⎠
(9)
For the two distances investigated in this study this leads to
⎜ ⎟= ≈ .2
1
( ) 700 0,7( ) 1000
P d mRP d m
ββ
−−⎛ ⎞ =
⎝ ⎠
(10)
Therefore the twelve test subjects examined, the histogram in Fig. 5 shows the determined values of R
sion coeffi cient of R2 = 0,795 which implies a strong linear dependency between the two entities [7]. A similar coeffi cient for a power regression model can only be reached when the exponent is converg-ing on β = 1.
This fi nding is a strong indication that the Car-raro model cannot be applied unchanged, albeit its predictions seem the most realistic at fi rst glance. The linear dependency has to be accepted for a static test setup as already found by Holladay and strongly supported by Vos.
3.2. DEPENDENCY ON GLARE ANGLE
As has already been shown, the CIE glare mod-el is most probably not relevant for traffi c applica-tions. The implied proportionality to the inversely cubed glare angle contradicts the everyday obser-vation of car drivers that a distant car is less a hin-drance than a closer one. This is certainly true for the detection distance, as has been shown by Hohm [8] and others before him. One hypothesis for this stu- dy is that with greater spacing between the two cars the impairment is weaker. That means that the de-pendence on the glare angle should be less than in-versely square. This leads to a model on the basis of Holladay’s
,· ·V n nL K E β−= Θ∑ (6)
in which the exponent is β < 2.It can be shown that for the two glare sources
(each head lamp has to be evaluated separately) the linearization of the glare angle’s dependency on the distance holds true. Thus, the impact of the two sources can be analysed together. For a constant dis-
Fig. 5. Histogram of every test person’s slope ratio RFig. 4. Regressions for Weber contrast and ΔL for one test person at 1000 m distance

Light & Engineering Vol. 18, No. 2
37
clusions when positioning the subject in a moving vehicle.
To verify whether the dynamic component has an impact, the Laboratory of Lighting Technology has build up a dynamic test setup which incorporates a viewing target presented on a head-up display and voice recognition for the subjects’ feedback. First pi-lot tests show promising results which can be seen in Fig. 6. It shows the measured glare impairment versus the forecasts computed by using the formulae conceived by Holladay and Carraro [9].
REFERENCES
1. Sprute, J.H.: Bewertung der Blendbelastung neuartiger Kfz-Scheinwerfer, in: Licht2008, Confer-ence Proceedings, Technische Universität Ilmenau.
2. Holladay, L. L.: The fundamentals of of Glare and Visibility, Journal of the Optical Society of America and Review of Scientifi c Instruments, Vol. 12, No 4, 1926, S. 217 ff..
3. Eckert, M.: Lichttechnik und optische Wahrnehmungssicherheit im Stra- Renverkehr, 1 st edition, Verlag Technik, Berlin, 1993, ISBN 3–341–01072–6
4. Commission Internationale de l’E’ clairage. CIE. #146 CIE TC 1–50 report: CIE equations for disability glare. CIE Collection on Glare 2002; 1–12.
5. Vos, J.J.: Refl ections on Glare, Lighting Re-search and Technology Vol. 35, No. 2, pp 163–176, 2003.
6. Carraro, U.: Die Adaptationsleuchtdichte bei inhomogenen Leuchtdichte- feldern unter besonderer Berücksichtigung einer dynamischen Sehaufga- be, Dissertation, Fakultät für Technische Wissenschaf-ten, Technische Uni- versität Ilmenau, 1984.
for all test persons. One test person has surprisingly experienced less impairment at the longer distance which leads to a value of R < 1. The reason for this could not yet be identifi ed.
The mean value of the ration for the population is R = 1,56 at a standard deviation of α = 0,46. With this measured value, β can be calculated:
.0,7log 1,56 1,25β = − = (11)
The exponent found in this study is thus consider-ably lower than reported by Holladay and Vos. The equation derived for long distances found in this study is thus
,1,25· ·VL K E −= Θ (12)
where K proved to be specifi c for every subject. As the age group was very homogeneous, other param-eters that are less obvious are more crucial for glare susceptibility.
4. DISCUSSION
Provided the found exponent proves right, this would enable the automotive industry to raise the intensity towards oncoming drivers in a moderate way. This is, because the glare increase induced through lower glare angles does not outweigh the reduction of glare illuminance which follows an in-versely square law.
Only this augmentation enables new adaptive driving beam systems to work, as an increased light-ing distance always means also more scattered light in the direction of other drivers’ eyes, independent from the technology used.
Also, a camera based high beam assistance sys-tem which reacts relatively late might not prove as relevant to security as thought. More studies in this domain are needed to make a reliable quantitative proposition in this regard involving dynamic tests.
Drawbacks in this test series may be too few sub-jects, but given the complex tes- ting procedure, a larger population has not been realistic.
5. FUTURE PROJECTS
As the described experiment used a static setup, it may be possible to come to other results and con-
Fig. 6. Dependency of Weber contrast from distance d
Light & Engineering Vol. 18, No. 2
38
9. Zydek, B.: Entwicklung eines Freiversuchs-standes zur dynamischen Mes- sung der Blendung durch Fernlichtassistenzsysteme, Study project, FG.Lichttechnik, Technische Universität Darmstadt
7. Cohen, J.: Statistical power analysis for the be-havioral sciences, 2 nd editi- on, Hillsdale, NJ: Erl-baum, 1988, ISBN: 0–8058–0283–5.
8. Hohm, A.: Physiologische und Photometrische Untersuchungen zur Herlei- tung von Randbedin-gungen für eine Abblendautomatik. FG Lichttechnik, TU Darmstadt. Darmstadt: s.n., 2005.
Tran Quoc Khanh, Prof. Dr.-Ing., specialist of colour appearance and visual perception in mesopic conditions, in colorimetry and photometry of signal and traffi c lights, optoelectronic and display technology,
in fi eld of LEDs and OLEDs, in optical spectroscopy (UV-VIS-IR) and technical modeling in optic. Dr. Tran Quoc Khanh is a head of the Lighting Technology chair at Technische Universität Darmstadt
Jan Holger Sprute,Dipl.-Wirtsch.-Ing. Jan Holger Sprute studied Electrical Engineering and Business Administration at Technische Universität Darmstadt, Germany and École Centrale de Lyon,
France. After graduation, he started as a research fellow at the Laboratory of Lighting Technology at TU Darmstadt. His main fi eld of research is new light-based driver assistance systems
Nils Haferkemper, Dipl.-Ing., graduated from Ilmenau Technical University. His fi eld of research is luminance of perception in photometry and colorimetry of automobile and interior scenes in lighting
engineering technologies, infl uence of luminance perception on human in dependence of type of light source, innovation methods of phometric and colorimetric measuremnets
Christoph Schiller, Dipl.-Wirtsch.-Ing, studied Electrical Engineering and Business Administration at Technische Universität Darmstadt and Technische Universität Dresden, Germany. After working
in the general lighting application industry, he joined the Laboratory of Lighting Laboratory at TU Darmstadt. His main fi eld of research is mesopic vision with a special interest in street lighting and automotive lighting
Bastian Zydek is a Master Student at TU Darmstadt and is currently working on new assistance systems at Valeo Lighting Systems, France
Stefan Söllner, Dipl.-Ing., his fi eld of research is a physiological aspects of colour visual perception, he is in staff of Lighting engineering laboratory of Darmstadt Technical University

39
Light & Engineering SvetotekhnikaVol. 18, No. 2, pp. 38-42, 2010 No. 1, 2010, pp. 19-24
the inverse square law – is violated in that area. The traditional representation of luminaire lighting dis-tribution in the form of luminous intensity curves, as if for a point source, becomes incorrect.
The following applications deal with the near-fi eld problems: illumination of ceilings by pendant luminaires, illumination of school black-boards and other vertical surfaces by cantilever and other lu-minaires, accent lighting of buildings architectural elements by closely located fl oodlights and lumi-naires, local task illumination, lighting of large-scale construction elements which serve as sec-ondary light sources (light ceilings, bays, false windows, and stained-glass windows). Similarly, in irradiating engineering there are tasks of irradi-ating objects by closely located devices (e.g. IR-drying), lighting of plants in green-houses, and oth-er applications.
Presently, two main methods are used to compute illumination in the near fi eld: application distance photometry and luminance field photometry [1]. The essential fault of these methods is as follows: to obtain the original photometrical data for a lu-minaire, one should use the methods different from those commonly used to measure the luminous in-tensity outside the near fi eld, i.e. in the so called “far fi eld”. In addition, the second method requires fun-damentally new photometrical equipment (digital luminance meters capable of scanning over the total area of an exit opening and in any direction of the ambient space). Besides, the obtained photometrical data is unsuitable for presentation in standard data formats, e.g. IES-format, despite this being very im-portant for the modern computer-aided lighting de-sign practice.
ABSTRACT
1Two methods are presented that enable to per-form lighting calculations in a near fi eld of a lumi-naire. The methods used the basic concepts of a light fi eld theory. They allow for the calculation of the il-luminance level in a near fi eld of axially symmetri-cal (light tube method) and asymmetrical (light vec-tor projections method) luminaires on an arbitrary directed plane. To perform these calculations, the luminous distributions of luminaires are represent-ed in the form of one or three tables containing the products between the corresponding projections of a light vector and the distance squared between the photometrical centre and the test point, located in a near and far fi eld. The luminous intensity is given as a function of the distance, polar and azimuth an-gles. These photometrical data may be included into universal tables and represented in standard elec-tronic formats (e.g., IES-format) in order to be used in computer programmes to aid the design process of lighting systems.
Keywords: near fi eld photometry, far fi eld pho-tometry, inverse square law, light vector, light tube, axially symmetrical luminaire
1. INTRODUCTION
Sometimes, in the course of design of lighting in-stallations, it is necessary to assess the illuminance level in a “near fi eld”, i.e. in an area located relative-ly close to luminaires. The basic photometrical law –
* On basis of report at 6th LUX PACIFICA 2009 conference, Thailand
PROBLEM OF LIGHTING DESIGN IN NEAR FIELD*
Alexei Korobko
Group of companies ‘Svetoservis’, Russia [email protected]

Light & Engineering Vol. 18, No. 2
40
These data enable us to construct a light line passing through the given point ( , )r γ . The tangent to the light line defi nes the direction of the light vec-tor
�E( , )r γ at this point (Fig. 1). The vector
�Er r( , )γ
is a radial projection of the light vector �E( , )r γ ,
hence its modulus E r( , )γ is calculated as
E r E rr( , ) ( , ) cosγ γ φ= ,
where cosφ is defi ned from the scalar product ( )t r⋅ of the unit vector t codirected as the light vector
�E( , )r γ and the unit vector r of the point
( , )r γ .Knowing the direction and the modulus of the
light vector �E( , )r γ , one may calculate the illumi-
nance E rQ ( , )γ on an arbitrary plane Q , which pass-es through the point ( , )r γ (Fig. 1). That is, if the outer normal to the plane Q is defl ected by an angle θ , than the illuminance E rQ ( , )γ that represents the modulus of the light vector projection
�EQ r( , )γ to
the normal direction equals to
E r E rQ ( , ) ( , )cosγ γ θ= .
It is important that this plane does not intersect the exit opening of a luminaire.
The report describes two new methods for solv-ing the above-mentioned problems. Both methods are based on the fundamental concepts of the light-fi eld theory developed by A.Gershun [2].
2. LIGHT TUBE METHOD
This method is applicable for luminaires having an axially symmetrical lighting distribution. The method uses the main property of a light tube – the constancy of a light-vector flux running through any section of a light tube. The near-fi eld illumi-nance distribution E rr ( , )γ , experimentally meas-ured on a spherical surface centered with respect to the exit opening of a luminaire, serves as the prime photometrical data for calculations. The illumina-tion is measured as a function of sphere radius r and polar angle γ .
Table. An example of the unifi ed table with light distribution of the luminaire for the near and
far fi elds
γ ,deg.
I rr ( , )γ , cd/1000 lm
r D/ :rff0.5 0.75 1 1.5 2 3 4 5
0 х х х х х х Х х х
5 х х х х х х Х х х
10 х х х х х х Х х х
15 х х х х х х Х х х
20 х х х х х х Х х х
25 х х х х х х Х х х
30 х х х х х х Х х х
35 х х х х х х Х х х
40 х х х х х х Х х х
45 х х х х х х Х х х
50 х х х х х х Х х х
55 х х х х х х Х х х
60 х х х х х х Х х х
65 х х х х х х Х х х
70 х х х х х х Х х х
75 х х х х х х Х х х
80 х х х х х х Х х х
85 х х х х х х Х х х
90 х х х х х х Х х х
Fig. 1. Construction of a light vector in a near fi eld by the light tube method
1 is a luminaire; 2 is a light line; 3 is a light tube.The asymptotic approximation of the light line to the radial
direction is shown by the dotted line

Light & Engineering Vol. 18, No. 2
41
luminaire exit plane r , polar angle γ and azimuth angle C . However this vector is not defi ned by us-ing the light tube, but through defi ning its three pro-jections: radial
�Er , horizontal
�Eh , and vertical
�Ev
(Fig. 2).The projection modules represent the illuminanc-
es at a given test point on the planes which are di-rected perpendicularly to the radius-vector to the test point, horizontally, or vertically (in a meridian plane), respectively. These illuminance levels can be determined easily with the aid of the conven-tional measuring method. For instance, the module of vertical projection is defi ned as a difference of il-luminance levels on two sides of a meridian plane E E Ev v v= −+ − . That is, four measurements of illumi-nance should be made in every point ( , , )r C γ in a near fi eld. Further, the light vector is determined as,
�= − +
+ + +
E C E C
E C E C E
C v
C v h
cos sin
sin cos ,
where EE E
Cr h=
− cos
sin
γγ
.
Then the illuminance on an arbitrarily directed plane Q with normal nQ containing a given point is obtained as
= ⋅E r CQ ( , , )γ�E nQ
.
It is also necessary here that this plane does not cross the exit opening of a luminaire.
Thus, in practical realisation of this method, the measurements are performed according to usual rou-tine of measuring luminous intensity of a luminaire with the aid of conventional photometrical equip-ment (goniophotometer). The measurements are car-ried out for several distances r in a near fi eld, and this is the main difference from the conventional method. It is convenient to represent the measured values as the products of the radial illuminance and distance squared I r E r rr r( , ) ( , )γ γ= 2 , which can be treated as quasi luminous intensities of a luminaire at close distances. These data are given as two-dimen-sional arrays of quasi luminous intensities I rr ( , )γ with respect to measurement distance r and polar angle γ (see Table).
And at last, it is reasonable to add the measure-ments of luminous intensity at a given distance rff in a far fi eld to the measurements in a near fi eld. This will enable us to have a universal set of initial data both for near and far fi elds.
2. LIGHT VECTOR PROJECTIONS METHOD
Unlike the previous one, this method is universal, since it enables to compute the illuminance levels in the fi eld of a luminaire with arbitrary light distri-bution, but it is most effi cient when applied to the luminaires and fl oodlights whose light distributions do not possess axial symmetry. Like for the light-tube method, the core of the method is in the deter-mination of a light vector
�E( , , )r C γ in the near-fi eld
points given by the distance from the center of the
Fig. 2. Construction of a light vector in a near fi eld by the light vector projections method 1 is a luminaire, 2 is meridional plane with a given point
Light & Engineering Vol. 18, No. 2
42
luminaire photometrical cente e and the test point lo-cated in a near or far fi eld with respect to distance, polar and azimuth angles.
The input data for the light distributions are ob-tained from standard measurements of illuminance, but made at different distances in a near fi eld and one distance in a far fi eld. These photometrical data may be put into the universal tables and represen-ted in standard electronic formats (e.g., IES-format) in order to be used in computer programmes to aid to the design process of lighting installations.
REFERENCES
1. The IESNA Lighting Handbook, 9-th Edition. IESNA, 2000.
2. Gershun, A. The light field. P. Moon and G. J. Timoshenko, trans. J. Math. Phys. 18 (2), pp.51–151, 1939.
Like in the fi rst method, the initial data here can be stored easily in the form of the 2-dimensional ar-rays of values Ir , Ih and Iv , representing the prod-ucts between the corresponding light-vector projec-tion modules Er , Eh and Ev and the distance r squared, and one array containing luminous intensi-ties I r C( , , )γ in any point of the far fi eld.
3. CONCLUSION
The light tube and light vector projections meth-ods represented in this work allow for the easy calcu-lation of illuminance on an arbitrarily directed plane in a near fi eld of axially symmetrical and asymmetri-cal luminaires.
To implement the methods, it is necessary to rep-resent the luminous intensity distributions of lumi-naires in the form of one or three tables containing the products between the corresponding projections of a light vector and the square distance between the
Alexei Korobko, Ph.D., graduated from Moscow Power Energy Institute in 1971, the principal scientist of Group of companies ‘Svetoservis’

43
Christoph Schiller, Jan Holger Sprute, Nils Haferkemper, and Tran Quoc KhanhDiscomfort Glare – Impact of Headlamp Optics, Spectrum
of Adaptation and SPD
Holger Sprute, Stefan Söllner, Nils Haferkemper, Cristoph Schiller, Bastian Zydek, and Tran Quoc Khanh
Investigations on Glare Impact at Long Distances
Fig. 1. Test setup used for discomfort glare evaluation
Fig. 2. Test setup with projection screen, glaring and subjects’ car
Fig. 2. Test setup with projection screen, glaring and subjects’ car

44
Sergei V. KostyuchenkoCurrent State and Perspectives of UV Water and Air Treatment Technology
Fig. 1. Lyuberetsky treatment facilities, Moscow Region
Fig. 2. Northern waterworks, St.-Petersburg
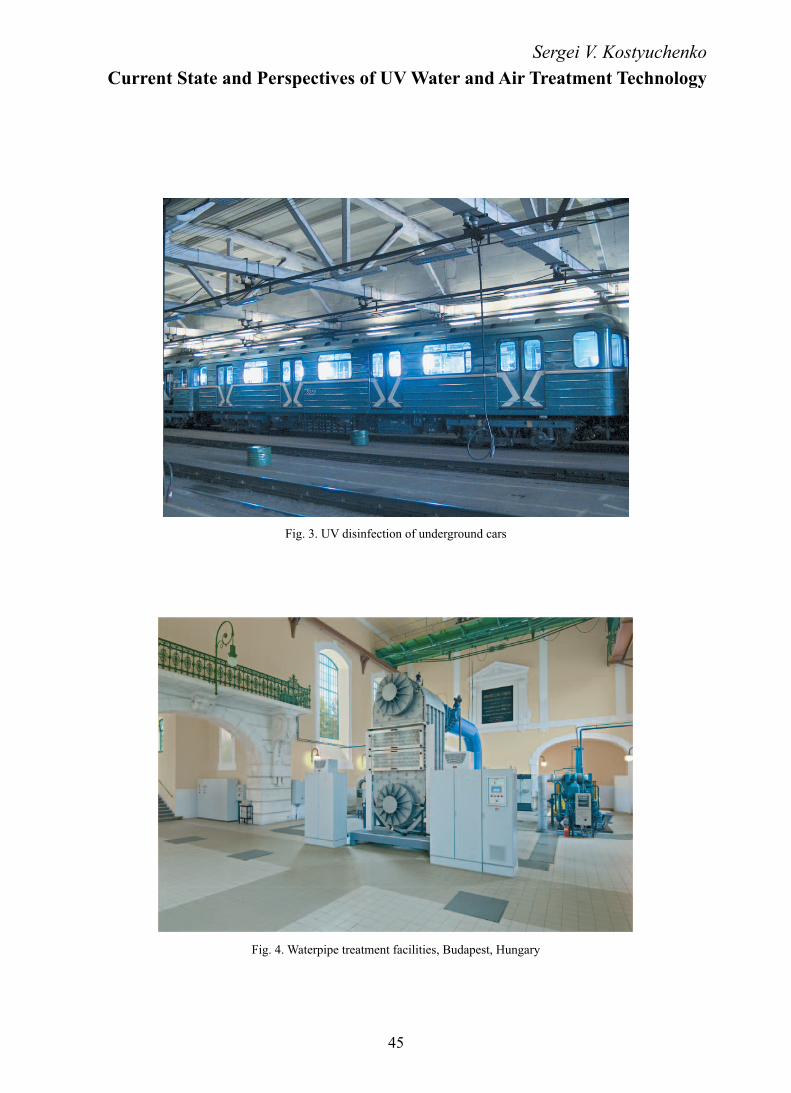
45
Sergei V. KostyuchenkoCurrent State and Perspectives of UV Water and Air Treatment Technology
Fig. 3. UV disinfection of underground cars
Fig. 4. Waterpipe treatment facilities, Budapest, Hungary
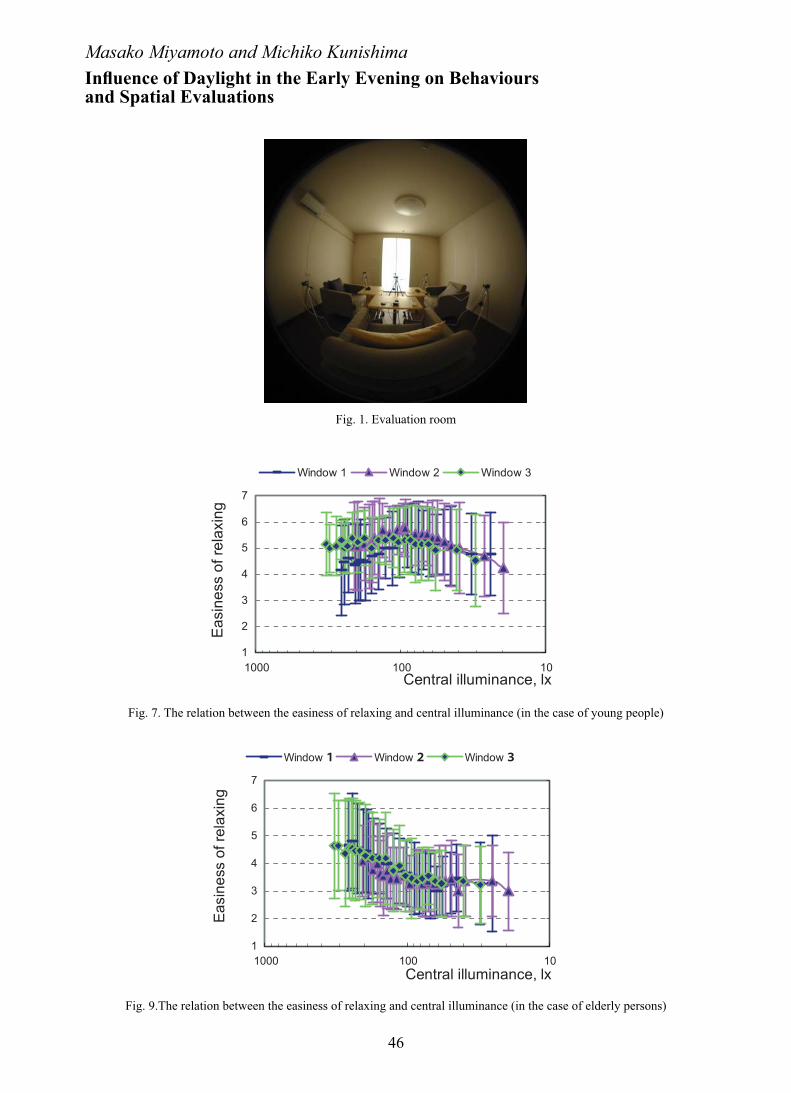
46
Masako Miyamoto and Michiko KunishimaInfl uence of Daylight in the Early Evening on Behaviours and Spatial Evaluations
Fig. 1. Evaluation room
Fig. 7. The relation between the easiness of relaxing and central illuminance (in the case of young people)
Fig. 9.The relation between the easiness of relaxing and central illuminance (in the case of elderly persons)

47
Light & Engineering SvetotekhnikaVol. 18, No. 2, pp. 47-53, 2010 No. 1, 2010, pp. 38-43
aspect of living conditions today. Daylight is natu-ral energy used easily in the house, and its effective use contributes to energy conservation. However, ac-cording to the measurement survey of the light envi-ronment in households, many people live under arti-fi cial lighting conditions even in daytime [1].
Therefore, the purpose of this research is to examine how the changing daylight in the early evening infl uences the necessity for artifi cial lighting and evaluation of atmosphere in the room. Moreover, the indoor illumination distribution changes accord-ing to the shape of the window, even if they have the same area. As a result, there is a possibility that timing for the need of artifi cial lighting will change. Then, the shape of window is taken up in this re-search as a condition to obtain daylight effectively.
How to use the high quality daylighting, which can contribute to energy conservation, was examined.
2. OUTLINE OF EXPERIMENT
2.1. Measurement of horizontal illuminance
The experiments were conducted in Tatsumi test-ing facilities of Kansai Electric Power Company in Osaka.
The continuous measurement of the interior hor-izontal illuminance is done by a multipoint illumi-nance meter (the Konica Minolta CL-200) to exam-ine a lighting environment by daylighting obtained through a window for about three hours until sunset. The change of brightness of the room by daylight,
ABSTRACT
1The purpose of this research is to examine how the changing daylight in the early evening infl uences the necessity for artifi cial lighting and spatial evalua-tion. The shape of a window is taken up as a compar-ative condition to obtain daylight effectively. The in-terior illuminance change by actual daylighting was measured, and a pseudo-daylight device was used for the experiment. This can change illuminance based on the actual measurement value. The aspects evalu-ated are the necessity for artifi cial lighting, the easi-ness of functioning and the atmosphere of the room.
The results are as follows.The shape of the window infl uences the evalu-
ation of brightness and the necessiry degree of the artifi cial lighting.
In this research, luminance of the window does not directly infl uence the evaluation of the bright-ness of the room.
There are some differences between the evalua-tion by young people and the evaluation by elderly people.
Keywords: daylight, behaviors, spatial evalua-tion, living room, shape of window, artifi cial lighting
1. INTRODUCTION
It is thought that it is important to connect peo-ple and buildings with nature organically, not only to preserve the terrestrial environment but also a basic
* Paper presented at the LUX PACIFICA conference 2009
INFLUENCE OF DAYLIGHT IN THE EARLY EVENING
ON BEHAVIOURS AND SPATIAL EVALUATIONS*
Masako Miyamoto1 and Michiko Kunishima2
1 The University of Shiga Prefecture, Japan 2 Kyoto Women’s Junior College, Japan
E-mail: [email protected]; [email protected]
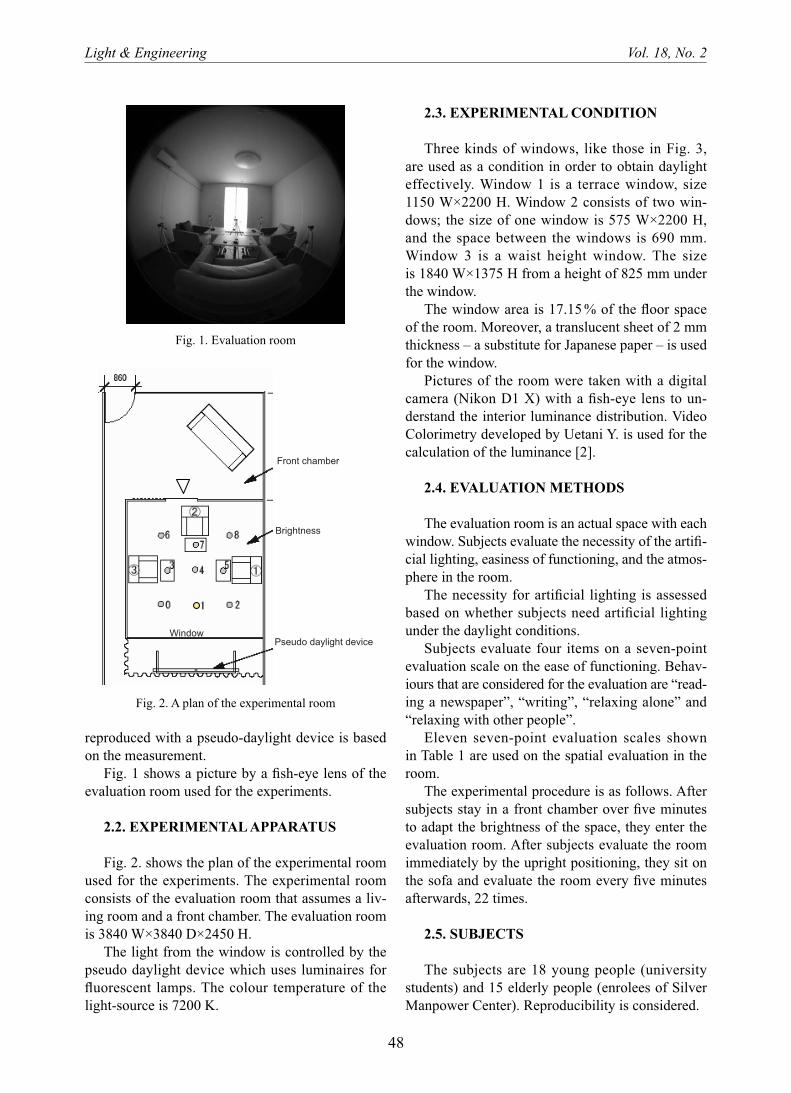
Light & Engineering Vol. 18, No. 2
48
2.3. EXPERIMENTAL CONDITION
Three kinds of windows, like those in Fig. 3, are used as a condition in order to obtain daylight effectively. Window 1 is a terrace window, size 1150 W×2200 H. Window 2 consists of two win-dows; the size of one window is 575 W×2200 H, and the space between the windows is 690 mm. Window 3 is a waist height window. The size is 1840 W×1375 H from a height of 825 mm under the window.
The window area is 17.15 % of the fl oor space of the room. Moreover, a translucent sheet of 2 mm thickness – a substitute for Japanese paper – is used for the window.
Pictures of the room were taken with a digital camera (Nikon D1 X) with a fi sh-eye lens to un-derstand the interior luminance distribution. Video Colorimetry developed by Uetani Y. is used for the calculation of the luminance [2].
2.4. EVALUATION METHODS
The evaluation room is an actual space with each window. Subjects evaluate the necessity of the artifi -cial lighting, easiness of functioning, and the atmos-phere in the room.
The necessity for artifi cial lighting is assessed based on whether subjects need artifi cial lighting under the daylight conditions.
Subjects evaluate four items on a seven-point evaluation scale on the ease of functioning. Behav-iours that are considered for the evaluation are “read-ing a newspaper”, “writing”, “relaxing alone” and “relaxing with other people”.
Eleven seven-point evaluation scales shown in Table 1 are used on the spatial evaluation in the room.
The experimental procedure is as follows. After subjects stay in a front chamber over fi ve minutes to adapt the brightness of the space, they enter the evaluation room. After subjects evaluate the room immediately by the upright positioning, they sit on the sofa and evaluate the room every fi ve minutes afterwards, 22 times.
2.5. SUBJECTS
The subjects are 18 young people (university students) and 15 elderly people (enrolees of Silver Manpower Center). Reproducibility is considered.
reproduced with a pseudo-daylight device is based on the measurement.
Fig. 1 shows a picture by a fi sh-eye lens of the evaluation room used for the experiments.
2.2. EXPERIMENTAL APPARATUS
Fig. 2. shows the plan of the experimental room used for the experiments. The experimental room consists of the evaluation room that assumes a liv-ing room and a front chamber. The evaluation room is 3840 W×3840 D×2450 H.
The light from the window is controlled by the pseudo daylight device which uses luminaires for fl uorescent lamps. The colour temperature of the light-source is 7200 K.
Fig. 1. Evaluation room
Fig. 2. A plan of the experimental room

Light & Engineering Vol. 18, No. 2
49
age that the time of turning on occupies at one pulse.The relational formula between the duty ratio
and the central illuminance of the room to reproduce daylighting with the pseudo daylight device is de-rived as follows. The central illuminance indicates the illuminance in the room without the translucent sheet of 2 mm thickness over the window.
y=1·10–7·x3–0.0003 x2+0.2917 x–14.41 (R2=0.9953), (1)
where y is Duty ratio ( %) and x is the central il-luminance of the evaluation room (lx)
3.1.2. THE ILLUMINANCE OF EACH WINDOW
Fig. 4 shows an actual illuminance level for the experiment. The central illuminance of 85 cm height and the illuminance on each desktop of 60 cm height were measured.
The analysed data are 13 young persons’ data and 11 elderly persons’ data.
3. RESULTS
3.1. The illuminance change by daylight
3.1.1. Calculation of duty ratio
The continuous illuminance each 30 seconds in the afternoon was measured to examine the light environment by daylighting from a window with transparent glass. The illuminance change by day-lighting was the steadiest according to the meas-urement result on August 1, 2006. Illuminance was measured on 400 mm height from the fl oor in the centre of the room with Window 1. Therefore, the relational formula between the duty ratio and the illuminance was calculated based on the measure-ment result. The duty ratio is defi ned as the percent-
Fig.3. Shapes of the window
Table 1. Correlation between the central illuminance of the room and the spatial evaluation
Evaluation scalesWindow 1 Window 2 Window 3
Elderly Young Elderly Young Elderly Young
bright – dark 0.600 ** 0.755 ** 0.472 ** 0.842 ** 0.663 ** 0.783 **
non-uniform – uniform -0.054 0.063 -0.027 -0.039 -0.064 -0.027
non-glaring – glaring -0.24 ** -0.716 ** -0.191 ** -0.723 ** -0.289 ** -0.735 **
pleasant – unpleasant 0.312 ** -0.02 0.17 ** 0.076 0.299 ** 0.076
open – closed 0.403 ** 0.379 ** 0.28 ** 0.567 ** 0.431 ** 0.461 **
comfortable – uncomfortable 0.298 ** -0.092 0.192 ** 0.00 0.246 ** 0.157 **
calming – restless 0.252 ** -0.548 ** 0.184 ** -0.514 ** 0.246 ** -0.546 **
warm – cold 0.357 ** -0.233 ** 0.311 ** -0.017 0.424 ** -0.185 **
natural – artifi cial 0.109 -0.163 ** 0.132 * -0.191 ** 0.169 ** -0.137 *
varied – monotonous 0.187 ** 0.147 * 0.174 ** 0.111 0.16 ** -0.164 **
satisfi ed – unsatisfi ed 0.292 ** -0.094 0.205 ** 0.024 0.293 ** 0.009
Signifi cance level **:1 %, *:5 %
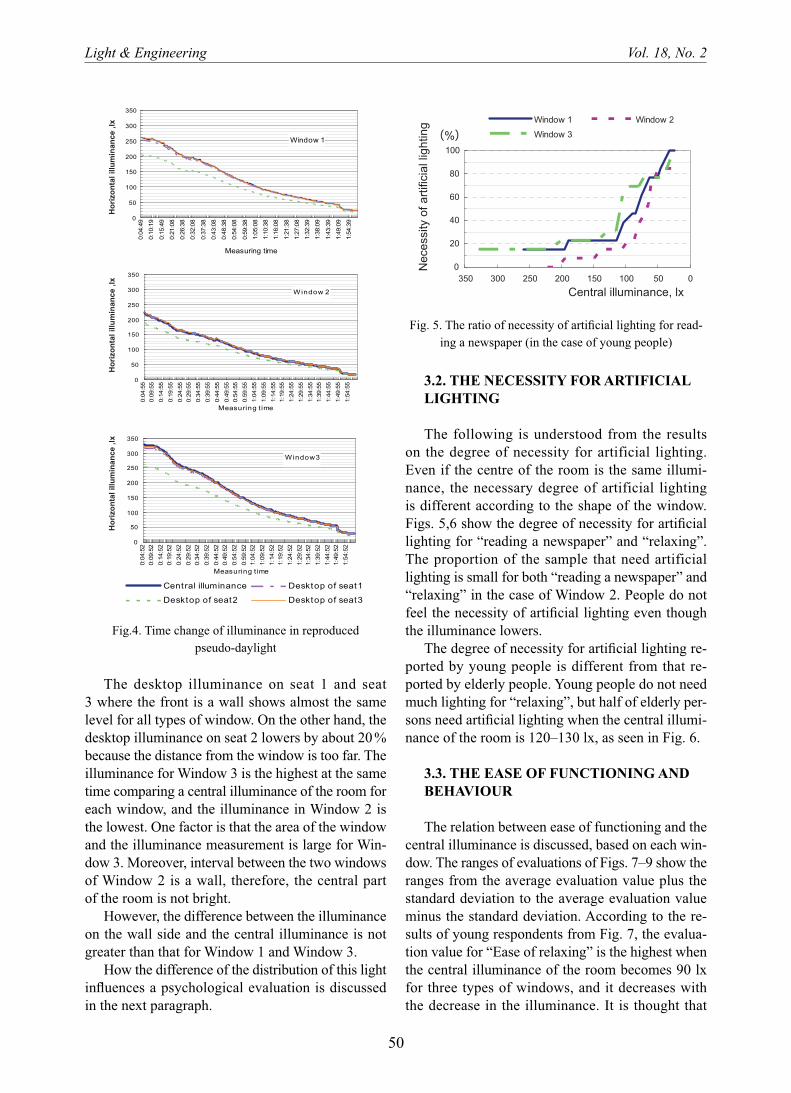
Light & Engineering Vol. 18, No. 2
50
3.2. THE NECESSITY FOR ARTIFICIAL LIGHTING
The following is understood from the results on the degree of necessity for artificial lighting. Even if the centre of the room is the same illumi-nance, the necessary degree of artificial lighting is different according to the shape of the window. Figs. 5,6 show the degree of necessity for artifi cial lighting for “reading a newspaper” and “relaxing”. The proportion of the sample that need artificial lighting is small for both “reading a newspaper” and “relaxing” in the case of Window 2. People do not feel the necessity of artifi cial lighting even though the illuminance lowers.
The degree of necessity for artifi cial lighting re-ported by young people is different from that re-ported by elderly people. Young people do not need much lighting for “relaxing”, but half of elderly per-sons need artifi cial lighting when the central illumi-nance of the room is 120–130 lx, as seen in Fig. 6.
3.3. THE EASE OF FUNCTIONING AND BEHAVIOUR
The relation between ease of functioning and the central illuminance is discussed, based on each win-dow. The ranges of evaluations of Figs. 7–9 show the ranges from the average evaluation value plus the standard deviation to the average evaluation value minus the standard deviation. According to the re-sults of young respondents from Fig. 7, the evalua-tion value for “Ease of relaxing” is the highest when the central illuminance of the room becomes 90 lx for three types of windows, and it decreases with the decrease in the illuminance. It is thought that
The desktop illuminance on seat 1 and seat 3 where the front is a wall shows almost the same level for all types of window. On the other hand, the desktop illuminance on seat 2 lowers by about 20 % because the distance from the window is too far. The illuminance for Window 3 is the highest at the same time comparing a central illuminance of the room for each window, and the illuminance in Window 2 is the lowest. One factor is that the area of the window and the illuminance measurement is large for Win-dow 3. Moreover, interval between the two windows of Window 2 is a wall, therefore, the central part of the room is not bright.
However, the difference between the illuminance on the wall side and the central illuminance is not greater than that for Window 1 and Window 3.
How the difference of the distribution of this light infl uences a psychological evaluation is discussed in the next paragraph.
Fig. 5. The ratio of necessity of artifi cial lighting for read-ing a newspaper (in the case of young people)
Fig.4. Time change of illuminance in reproduced pseudo-daylight
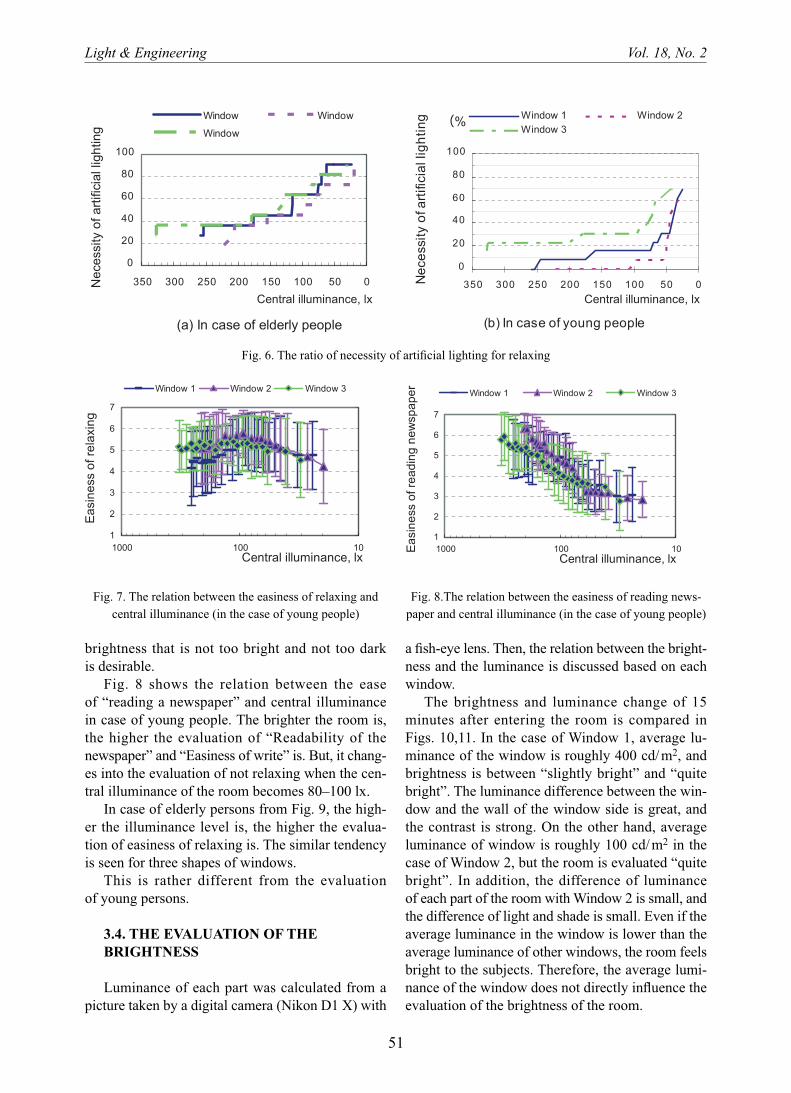
Light & Engineering Vol. 18, No. 2
51
a fi sh-eye lens. Then, the relation between the bright-ness and the luminance is discussed based on each window.
The brightness and luminance change of 15 minutes after entering the room is compared in Figs. 10,11. In the case of Window 1, average lu-minance of the window is roughly 400 cd/ m2, and brightness is between “slightly bright” and “quite bright”. The luminance difference between the win-dow and the wall of the window side is great, and the contrast is strong. On the other hand, average luminance of window is roughly 100 cd/ m2 in the case of Window 2, but the room is evaluated “quite bright”. In addition, the difference of luminance of each part of the room with Window 2 is small, and the difference of light and shade is small. Even if the average luminance in the window is lower than the average luminance of other windows, the room feels bright to the subjects. Therefore, the average lumi-nance of the window does not directly infl uence the evaluation of the brightness of the room.
brightness that is not too bright and not too dark is desirable.
Fig. 8 shows the relation between the ease of “reading a newspaper” and central illuminance in case of young people. The brighter the room is, the higher the evaluation of “Readability of the newspaper” and “Easiness of write” is. But, it chang-es into the evaluation of not relaxing when the cen-tral illuminance of the room becomes 80–100 lx.
In case of elderly persons from Fig. 9, the high-er the illuminance level is, the higher the evalua-tion of easiness of relaxing is. The similar tendency is seen for three shapes of windows.
This is rather different from the evaluation of young persons.
3.4. THE EVALUATION OF THE BRIGHTNESS
Luminance of each part was calculated from a picture taken by a digital camera (Nikon D1 X) with
Fig. 7. The relation between the easiness of relaxing and central illuminance (in the case of young people)
Fig. 6. The ratio of necessity of artifi cial lighting for relaxing
Fig. 8.The relation between the easiness of reading news-paper and central illuminance (in the case of young people)

Light & Engineering Vol. 18, No. 2
52
is seen in the evaluation of “warm – cold”. The high-er the illuminance is, the warmer the atmosphere of the room is.
The infl uence of the illuminance is not so strong to the evaluation of “non-uniform – uniform”, “natu-ral – artifi cial”, and “varied – monotonous” in both cases of the young and the elderly. In addition, the positive correlation between the central illuminance of the room and the satisfaction rating that is the overall evaluation is seen for the elderly persons and the relation is not seen for the young persons.
4. CONCLUSIONS
This research aimed to examine how the chang-ing daylight in the early evening infl uences the ne-cessity for artifi cial lighting and spatial evaluation. The shape of window was taken up as a comparative condition to obtain daylight effectively.
The following results were obtained.It is clear that the shape of the window infl uences
the evaluation of brightness and the degree of neces-sity for artifi cial lighting.
Young people do not need much lighting for “re-laxing”, but half of elderly people need artifi cial lighting when the central illuminance of the room is 120–130 lx.
A high correlation is seen between “readabil-ity of the newspaper” or “easiness of writing” and brightness. The correlation between “easiness of re-laxing” and brightness is not high, especially for young people.
In this research, luminance of the window does not directly infl uence the evaluation of the bright-ness of the room.
3.5. THE SPATIAL EVALUATION
The relation between the illuminance change and the spatial evaluation by young people is com-pared with that by elderly people. As a result, the difference of the evaluation to lighting environment between young and elderly people are discussed. The scores are presented in Table 1 based on sub-jects’ raw data. The correlation coeffi cient between the central illuminance of the room and the spatial evaluation was calculated. The result of evaluation scales where signifi cance level is satisfi ed is shown in Table 1.
The illuminance change remarkably infl uences the evaluation of “bright – dark”, “non-glaring – glaring”, “open – closed”, and “calming – restless” for the young respondents. The infl uence of the il-luminance is remarkable for the elderly respondents in the evaluation of “bright – dark” and “open – closed”. Moreover, the infl uence of the illuminance
Fig. 11. The relation between the evaluation of brightness and average luminance of each part
(in the case of Window 2)
Fig. 9.The relation between the easiness of relaxing and central illuminance (in the case of elderly persons)
Fig. 10. The relation between the evaluation of brightness and average luminance of each part
(in the case of Window 1)

Light & Engineering Vol. 18, No. 2
53
REFERENCES
1. Miyamoto M., Kunishima M.: LIGHTING IN A LIVING ROOM IN THE DAYTIME, Proceed-ings of LUX PACIFICA 2002, pp.343–346.
2. Uetani Y.: MEASUREMENT OF CIE TRIS-TIMULUS VALUES XYZ BY COLOR VIDEO IM-AGES: Development of Video Colorimetry, Jour-nal of architecture, planning and environmental engineering (Transactions of AIJ) ,2001, No.543, pp.25–31.
The difference between the evaluation of young people and the evaluation of elderly people is seen in many evaluation items. Therefore, it is necessary to design a window based on both aspects. This re-sult is signifi cant as material to obtain a comforta-ble lighting environment that does not relate to age.
In future research it is necessary to examine the lighting system including artifi cial lighting to con-tribute to energy conservation further, based on these results.
ACKNOWLEDGEMENT
This project was supported by Kansai Electric Power Company in Japan.
Masako Miyamoto, graduated in 1983. She has a Ph.D. from Nara Women’s University in 1994. At present she is Associate Professor of The University of Shiga Prefecture in Japan
Michiko Kunishima, graduated from the doctoral course of Nara Women’s University in 1985, and has a Ph.D. At present she is Associate Professor of Kyoto Women’s Junior College in Japan )

54
Light & Engineering SvetotekhnikaVol. 18, No. 2, pp. 54-59, 2010 No. 6, 2009, pp. 17-20
The “mercury danger” of producing and operat-ing FLs is well-known, and it is also known that this can be reduced, in particular by using the following methods of mercury introduction into FLs:
• In tight ampoules and capsules (liquid mercu-ry) installed at inner elements of a lamp and opened in the evacuated lamp using a thermal method;
• In a bound state as titan mercuride (powder de-posited on a substrate, or a bead placed into unpres-surized capsule) which in the evacuated lamp releas-es mercury vapour, when heating the substrate or the capsule to 800 ÷ 900 °C;
• As amalgams [2].Experience shows that the most prospective
method of introducing mercury into FLs is the amal-gam method. Amalgams can be low-temperature (based on lead, Pb, tin, Sn, and bismuth, Bi) and high-temperature (based on indium, In or cadmium, Cd). To control the temperature of the fusion and the mechanical properties, other elements of the pe-riodic system can be added to these amalgams, i.e. amalgams can be not only two-, three- and four- but even fi ve-component. Low-temperature amalgams secure optimum pressure of mercury vapour (PHg) 0.8 ÷ 1.0 Pa and, accordingly, FL maximum light effi cacy at the ambient temperature tamb = 25 °C. Use of high-temperature amalgams in FLs allows for the shifting of the maximum of temperature de-pendence of the luminous fl ux (and, accordingly, of the luminous effi cacy) to a high temperature area tamb = 50 ÷ 60 °C.
This makes FLs with high-temperature amalgams almost irreplaceable at raised thermal and electric
ABSTRACT
Some main intermediate results of research per-formed by specialists of the Mordovian State Uni-versity of N.P. Ogaryov State Educational Enterprise of Higher Vocational Training, are presented on the increase of ecological safety of fl uorescent lamps (FL) by replacement of liquid mercury used in them as an active substance with amalgams.
The studies are dedicated to searching for opti-mum compositions of amalgams, of amalgam loca-tion versions in the FLs and of the correspondent structural solutions, to the development of amal-gam manufacturing technique and to the develop-ment of amalgam FLs as a whole, to the develop-ment of a measurement method of mercury quantity in fl uorescent lamps, to the creation of prototypes of amalgam FLs, to the determination of their char-acteristics and to the comparison of the latter ones with similar characteristics of normal FLs (with liq-uid mercury).
Keywords: fl uorescent lamp (FL), liquid mer-cury, amalgam, composition optimization, amalgam FL, characteristics, technology, structure
At present the most highly prioritized directions in design of light sources (LS) are ecological com-patibility, resource saving and reliability [1]. Our studies, refl ected in this article, considered the in-crease of ecological compatibility of fluorescent lamps (FL).
RESEARCH OF ECOLOGICAL COMPATIBILITY INCREASE WHEN
MANUFACTURING AND USING FLUORESCENT LAMPS*
Аlexei А. Gorbunov, Evgeny A. Karasyov, and Anatoly S. Fedorenko
The Mordovian State University of N.P. Ogaryov State Educational Enterprise of Higher Vocational Training, Saransk
E-mail: [email protected]
* Translated in English by G.G. Gorelov

Light & Engineering Vol. 18, No. 2
55
gam); manufacturing and test of the lamp prototypes, of test and pilot batches of the lamps.
When solving these problems, it was meant that development and batch production of AFLs would allow reaching the results as follows:
1. Reduction of the mercury quantity consumed when producing FLs (3–4 times in comparison with FL production with liquid mercury).
2. Reduction of mercury in each AFL to neces-sary values (3 ÷ 15 mg, depending on the volume and power of the lamp).
3. An essential decrease of the “mercury danger” when producing and operating FLs by exception of use of liquid mercury along with minimisation of mercury quantity in the ready lamps.
4. Unifi cation of manufacturing FLs of different applications to operate in open luminaires (using low-temperature amalgam) and in closed luminaires (by means of high-temperature amalgam) based on In or Cd ). Lighting characteristics of AFLs operat-ed in open luminaires, remain at the base level, and the ones operated in closed luminaires, – increase by 20–25 %.
5. Increase of FL quality uniformity, including exception of delivery to consumers of “dim” lamps (i.e. of the lamps with insuffi cient mercury quantity, the luminous fl ux of which decreases 50–100 times from the initial level because of the full bonding mercury atoms by oxygen released from the oxide coating of the electrodes).
6. Simplifi cation of the semiautomatic exhaust-ing machine service due to removal of dosing units for mercury (or for amalgam) from all positions, and
loadings (in closed and tight luminaires, in rooms with a high tamb).
The main goal of our research was structure and manufacturing technology development of FLs with minimum necessary mercury quantity (3 ÷ 15 mg, depending on a lamp standard size) being in a bound state – as amalgam
It should be stated right away that production of a wide range of amalgam FLs (AFL), is already implemented worldwide, (in Russia at Osram Open Society), but the technology and the equipment are expensive and cannot currently be applied now at other domestic enterprises (for example at Lisma). The aim of our research is to determine a more sim-ple and cheap production technology of ecologically safe AFLs.
It is known that one of the main problems when manufacturing AFLs is that as the lamp passes through the furnace of the exhaust semiautomatic machine (at the stage of assembly operations) the amalgam loses mercury due to its evaporation. One can solve this problem in two ways: 1) to use amal-gams with a high temperature of fusion; 2) to place it in a container interfering the evaporation of mer-cury under high temperature.
As the research has shown [3], the most suitable materials for amalgam production are the following metals: Cd, In, Sn, Pb, Bi, Tl and Zn (proceeding from solubility of the metals in mercury, constitu-tion diagrams of amalgams, from mercury vapour pressure isotherms in amalgams (Fig. 1) and from manufacturing technology). However, fusion tem-perature of amalgams based on the metals is much lower than the temperature necessary in the fur-nace of the exhaust semiautomatic machine 400 ÷ 450 °C.
Therefore, we have chosen the second solution to the problem: use of containers for the amalgam.
In this way, we should solve the following prob-lems: choice of an optimum amalgam composition and of its manufacturing technology as ingots, wire, beads and balls, if necessary; choice of structure and material of the container for the amalgam and technology of container manufacturing and its fi ll-ing with amalgam; development of a method and installation for determining mercury quantity in the lamp; development of introducing amalgam (or the container with amalgam) technology into the lamp; development, manufacturing and test of the dos-ing unit for amalgam when introducing it into the lamp (or when introducing the container with amal-
Fig. 1. Isotherms of mercury vapour pressure at 50 о C for the systems: 1 – Cd-Hg; 2 – In-Hg; 3 – Pb-Hg; 4 – for an
ideal solution
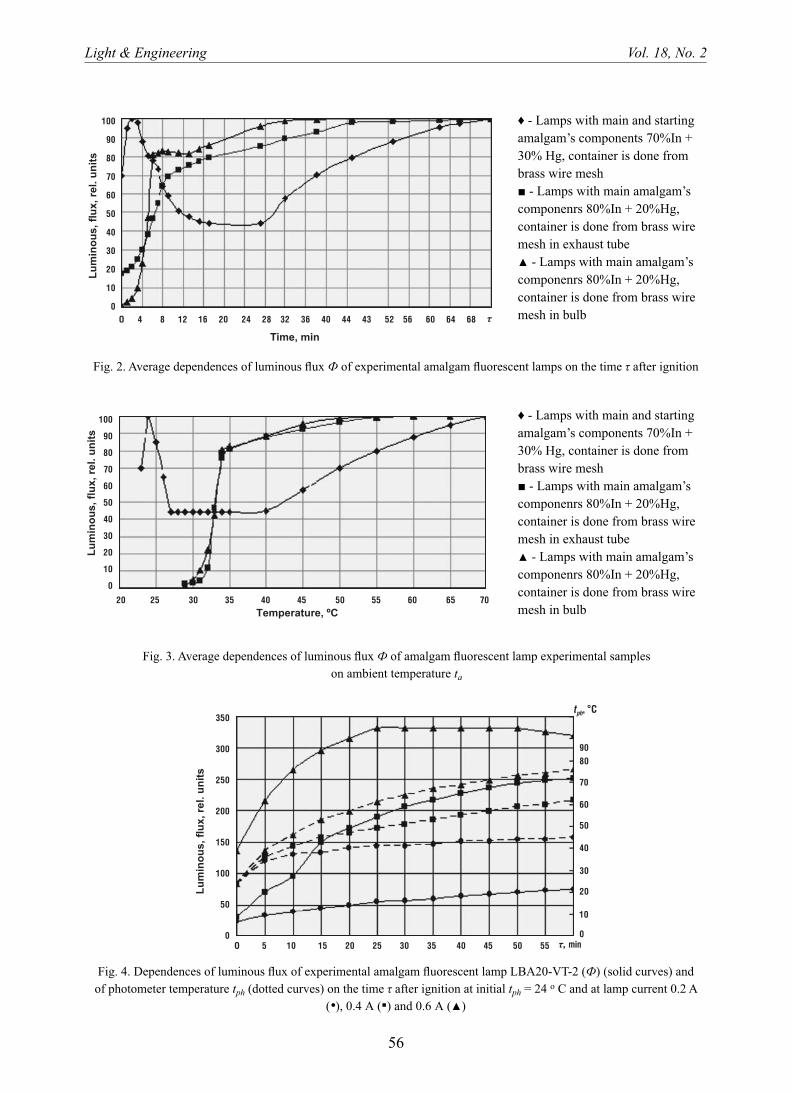
Light & Engineering Vol. 18, No. 2
56
Fig. 2. Average dependences of luminous fl ux Ф of experimental amalgam fl uorescent lamps on the time τ after ignition
Fig. 3. Average dependences of luminous fl ux Ф of amalgam fl uorescent lamp experimental samples on ambient temperature tа
Fig. 4. Dependences of luminous fl ux of experimental amalgam fl uorescent lamp LBA20-VT-2 (Ф) (solid curves) and of photometer temperature tph (dotted curves) on the time τ after ignition at initial tph = 24 о C and at lamp current 0.2 A
(•), 0.4 А (▪) and 0.6 А (▲)
♦ - Lamps with main and starting amalgam’s components 70%In + 30% Hg, container is done from brass wire mesh■ - Lamps with main amalgam’s componenrs 80%In + 20%Hg, container is done from brass wire mesh in exhaust tube▲ - Lamps with main amalgam’s componenrs 80%In + 20%Hg, container is done from brass wire mesh in bulb
♦ - Lamps with main and starting amalgam’s components 70%In + 30% Hg, container is done from brass wire mesh■ - Lamps with main amalgam’s componenrs 80%In + 20%Hg, container is done from brass wire mesh in exhaust tube▲ - Lamps with main amalgam’s componenrs 80%In + 20%Hg, container is done from brass wire mesh in bulb
Light & Engineering Vol. 18, No. 2
57
gam in the exhaust tube. The version of free location of the container with amalgam in a lamp envelope is acceptable, because the container mass is very small 50–100 mg, and consequently it does not cause damage of the luminophor layer when AFL manu-facturing, transporting and operating.
The results of the research concerning In amal-gam are presented in Figs. 2, 3. Luminous fl ux here for convenience is expressed in relative units. Light-ing characteristics of AFLs with a low-temperature amalgam do not differ from those for normal FLs. AFLs with a high-temperature amalgam as well have lighting characteristics at the level of normal FLs in the high-temperature interval.
Subsequently, in 2007, Lisma-VNIIS of A.N. Lo-dygin Open Society and the Chair of Light Sourc-es of the Mordovian State University of N.P. Oga-ryov carried out a set of studies concerning choice of amalgams’ composition, their manufacturing tech-nology, 20 W power AFLs structure and manufactur-ing technology, as well as their build-up (light fl ux stabilisation after their switching on) and also de-termining expediency of specifi ed amalgam appli-cation in serial and mass production of AFLs to be operated at high temperatures (samples LBA20-VT) and at low temperatures (samples 20-NT) [1, 5, 8, 9]. The developed technique of researching infl u-ence of amalgam composition on AFL parameters, provides for a measurement of light (luminous fl ux) and electric (current, voltage and power) parameters of the lamps at various temperatures of amalgam lo-cated in the “cold” area. In this way, the amalgam temperature was regulated by change of air temper-ature surrounding the lamp. The practical research problem of amalgam composition infl uence on the AFLs parameters, was reduced to research of tem-perature dependence of their luminous fl ux at differ-ent amalgam compositions (Figs. 4, 5). The research technique of luminous fl ux temperature dependence secures a possibility of strict comparison of these dependences for lamps with mercury and with vari-ous amalgams.
A comparative analysis of the build-up process of the LBA 20-VT and LBA 20-NT experimental samples allows drawing the following conclusions:
1. The time for reaching a maximum luminous fl ux for AFLs with low-temperature amalgam makes 5–6 minutes at the photometer temperature of 24 ÷ 35 о С and is close to 0 minutes at 45 ÷ 54 о С (that corresponds to the FLs of LB20 type with liquid mercury).
installation of only one amalgam dosing unit before the exhaust of the semiautomatic machine.
Therefore, to carry out the tasks listed above, Lis-ma-VNIIS of A.N. Lodygin Open Society performed in 2006 a set of studies (theoretical, experimental and technological ones) in order to select amalgam composition, technology of their manufacturing, structure and manufacturing technology of 15 W power AFLs [1, 4, 6–8].
Parting undertaking this part of the research, it was proposed to introduce amalgam either into the exhaust tube, through which the lamp exhaust-ing is not made, or directly into the lamp before the exhausting (after the lamp welding-up). In this case the amalgam is heated up and degassed at the lamp exhausting. To minimise the change in amalgam composition at lamp passage through the furnace of the exhaust semiautomatic machine (or of the ex-haust unit), the amalgam is placed into a container, the structure of which secures small evaporation of mercury from the amalgam. At the stage of AFL prototypes and test samples, Pb+Hg, Sn+Hg, In+Hg amalgams and containers of different versions (nick-el tubule, nickel micromesh, brass micromesh, alu-minium foil etc.) were tested. To accelerate AFLs build-up, a starting amalgam was introduced into them in addition to the main amalgam, (as well as in the container). The starting amalgam was fi xed near the electrode on one of the current leads. The following was found:
1. Most acceptable lighting characteristics have lamps with an amalgam composition of 80 % In + 20 % Hg, containers with brass micromesh – for high-temperature AFLs and lamps with Pb and Sn amalgams, containers with brass micromesh – for low-temperature AFLs.
2. Presence of the additional starting amalgam near the cathode (on one of the current leads) es-sentially reduces build-up time of the lamps (to 2–3 minutes). Abrupt growth of AFL light fl ux in the fi rst minutes after switching on and then its decrease with subsequent slow growth can be caused by the fact that mercury from the starting amalgam at the fi rst minutes quickly evaporates, whereas mercury from the main amalgam escapes much more slowly, therefore the lamp sometimes experiences “mercu-ry starvation”. To solve this problem, one can fasten starting amalgams at the both ends of AFL and care-fully select dimensions of the starting amalgam bead.
3. An AFL with In amalgam in the envelope have slightly better characteristics than those with amal-

Light & Engineering Vol. 18, No. 2
58
sources // Reports theses of the Vth All-Russian Con-ference “Fundamental and applied problems of phys-ics of semiconductors and light sources”. – Saransk, 2007. –pp. 56–57.
2. Fedorenko A.S., Abramova L.V., Karasyov E.A., Merkushkin V.V., Teryoshkin A.I. and Dadonov V.F.. About development of ecologically safe fl uores-cent lamps // Reports theses of the VIth Internation-al Lighting Conference. – Kaliningrad, Svetlogorsk, 2006 – pp. 56–57.
3. Mesheryakov Yu.A. Thermodynamic analy-sis of amalgams and development of their composi-tion for fl uorescent lamps // Dis. … Cand.Tech.Sci.: 02.00.04. – Saransk: VNIIS of A.N. Lodygin, 1985.
4. Fedorenko A.S., Karasyov E.A., Tereshkin A.I., Dadonov V.F. and Merkushkin V.V. Optimization of the high-temperature amalgam fl uorescent lamp structure // Problems and prospectives of domes-tic light engineering development, electrical engi-neering and power engineering: Collection of sci-entifi c works of the IVth All-Russian Scientifi c and Engineering Conference / Under editorship of prof. L.V.Abramova. – Saransk: SVMO, 2006. –pp. 33–36.
5. Durdaev A.A., Panteleev A.V., Karasyov E.A. and Fedorenko A.S. Research of characteristics of 20 W power amalgam fl uorescent lamps // Mate-rials of the 12 th Scientifi c Conference of Young Sci-entists, Post-Graduate Students and Students of The Mordovian State University of N.P. Ogaryov: Part. 2: Natural and engineering sciences – Saransk: Publish-ing house of the Mordovian State University. 2007. – pp. 172–176.
6. Fedorenko A.S., Karasyov E.A., Tereshkin A.I., Dadonov V.F. and Merkushkin V.V. Optimization
2. The time for reaching a maximum luminous fl ux for AFLs with high-temperature amalgam de-pends on the current of a lamp and on the photom-eter temperature, decreasing at their increase.
For these lamps it can be reduced 2–3 times, using at the fi rst stage (during 10 ÷ 15 minutes) a forced mode (the current is 1.5 times more than the rated one).
In 2007 at the Chair of Light Sources of the Mor-dovian State University of N.P. Ogaryov and at Lis-ma-VNIIS of A.N. Lodygin Open Society, studies concerning the development of a method and of an installation to determine mercury quantity in FLs, were also carried out [10]. The essence of the de-veloped method consists in determination of mer-cury particle transport time dependence on mercury mass in a lamp using the cataphoresis phenomena. At present this research continues, and their results will be published separately.
***The presented results are interesting and prac-
tically signifi cant, and despite their intermediate nature they deserved publication. One of the aims of this article is to arouse interest of domestic and foreign companies to carryout joined-up work in this direction, because their full continuation independ-ently without due fi nancing is impossible.
REFERENCES
1. Fedorenko A.S., Ashryatov A.A., Karasyov E.A., Bogdashkin E.S. and Durdaev A.A. Resource saving, ecological compatibility and reliability are the major factors of development of up-to-date light
Fig. 5. Dependences of luminous fl ux of experimental amalgam fl uorescent lamp LBA20-VT-2 (Ф) (solid curves) and of photometer temperature tph (dotted curves) on the time τ after ignition at initial tph = 45 о C and at lamp current 0.2 A
(•), 0.4 А (▪) and 0.6 А (▲)

Light & Engineering Vol. 18, No. 2
59
facturing fl uorescent lamps with controllable mercu-ry quantity. //Theses of reports of the Vth All-Russian Cconference “Fundamental and applied problems of physics of semiconductors and light sources”. – Saransk, 2007. – pp. 58–59.
10. Durdaev A.A., Fedorenko A.S., Ashryatov A.A. and Kargin T.N. About development of mercu-ry quantity monitoring in fl uorescent lamps. // Prob-lems and prospectives of development of domestic light engineering, electrical engineering and power engineering: Collection of sci. works of the Vth All-Russian Sci-and-tech. Conference / Under editorship of prof. L.V.Abramova. – Saransk: SVMO, 2007. – pp. 44–48.
of high-temperature amalgam fl uorescent lamp struc-ture // Reports theses of the VIth International Light-ing Conference. – Kaliningrad, Svetlogorsk, 2006 – pp. 64.
7. Choice of amalgam for high-temperature fl uo-rescent lamps. //The XXXVth Ogaryov’s readings: Materials of the Scientifi c Conference of the Mor-dovian State University of N.P. Ogaryov. – Saransk. Publishing house of the Mordovian State University, 2007. – p. 231–233.
8. A problem of retention of amalgam properties when manufacturing fluorescent lamps. // Theses of reports of the Vth All-Russian Conference “Funda-mental and applied problems of physics of semicon-ductors and light sources”. – Saransk, 2007. – pp. 51.
9. Fedorenko A.S., Karasyov E.A., Durdaev A.A., Kargin T.N. and Ashryatov A.A. Features of manu-
Alexey A. Gorbunov an engineer. He is graduated from the Mordovian State University of N.P. Ogaryov in 2007. At present time he is post-graduate student of the Chair of Light Sources of the Lighting Department of the Mordovian State University of N.P. Ogaryov State Educational Enterprise of Higher Vocational Training
Evgeny A. Karasyov, an engineer. Graduated from the Mordovian State University of N.P. Ogaryov in 2007. At present time he is post-graduate student of the Chair of Light Sources of Lighting Department of the Mordovian State University of N.P. Ogaryov State Educational Enterprise of Higher Vocational Training
Anatoly S. Fedorenko, Doctor of tech. sciences. Graduated from the Mordovian State University of N.P. Ogaryov in 1962. Head of the Chair of Light Sources of Lighting Department of the Mordovian State University of N.P. Ogaryov State Educational Enterprise of Higher Vocational Training
60
Light & Engineering SvetotekhnikaVol. 18, No. 2, pp. 60-70, 2010 No. 2, 2010, pp. 53-60
1. INTRODUCTION
Lighting simulation is a key tool in research and engineering areas including lighting design, archi-tecture, and lighting quality subjective assessment (Newsham et al. 2005). For instance, light transport simulation can be used by professionals (architects, designers, research departments) to study light lev-els (both artifi cial and natural) and appearance of a building prior to its realisation. Light simulation programmes try to solve the global illumination problem formalised in the rendering equation (Ka-jiya, 1986); in the last decades, various algorithms have been proposed to simulate the physical behav-iour of light (Pharr et al., 2004). Radiance (Ward, 1994) is one of the most famous software imple-menting such algorithms. Several simulation pro-grammes for building design are based on Radiance, like Daylight 1–2-3 (Reinhart, 2007) which is aimed at studying both daylighting and energy performanc-es in buildings.
The critical question is whether lighting simu-lation programmes produce accurate and trustable simulations. In other words, are these programmes able to simulate the light transport in a physically correct way? The answer to this question is crucial for the user, and should be considered as a chief cri-terion for choosing a simulation programme (Donn et al., 2007). To answer this question, international standards can be used to assess the physical accuracy of lighting simulation programmes, by making com-
ABSTRACT
Lighting simulation programmes are used widely in the areas of research and engineering. A crucial question is whether these programmes produce ac-curate and trustable simulations which the user can have confi dence in. To answer this question, inter-national standards can be used to assess the physi-cal accuracy of lighting simulation programmes, by making comparisons between simulations and reference (analytical or experimental) for various test cases. Nevertheless, it may be diffi cult to give a simple answer to this question, since usually the lighting programme accuracy is ruled by software settings tuned by the user. Moreover, in addition to physical accuracy, these settings also impact the simulation time. In this paper, we propose an itera-tive workfl ow aimed at identifying a range of simu-lation settings which achieve accurate predictions, and calibrating the simulation settings in regards to accuracy and rendering time. The proposed work-fl ow needs fewer simulations to perform, than sim-ulating each available test case of the international standard for each available setting, while remain-ing robust. We illustrate this workfl ow by assessing the physical accuracy and simulation time of Velux Daylight Visualizer 2 against CIE 171:2006 test cases.
Keywords: lighting simulation program, iterative workfl ow, physical accuracy, Velux Daylight Visual-izer 2, CIE 171:2006
AN ITERATIVE WORKFLOW TO ASSESS THE PHYSICAL ACCURACY
OF LIGHTING SIMULATION PROGRAMMES
Raphaël Labayrade1, Henrik Wann Jensen2, and Claus Wann Jensen3
1 Université de Lyon, Lyon, France 2 Computer Graphics Laboratory, Computer Science and Engineering,
University of California, San Diego 3 Luxion, Advanced Lighting Technology
E-mail: [email protected]; [email protected]; [email protected]
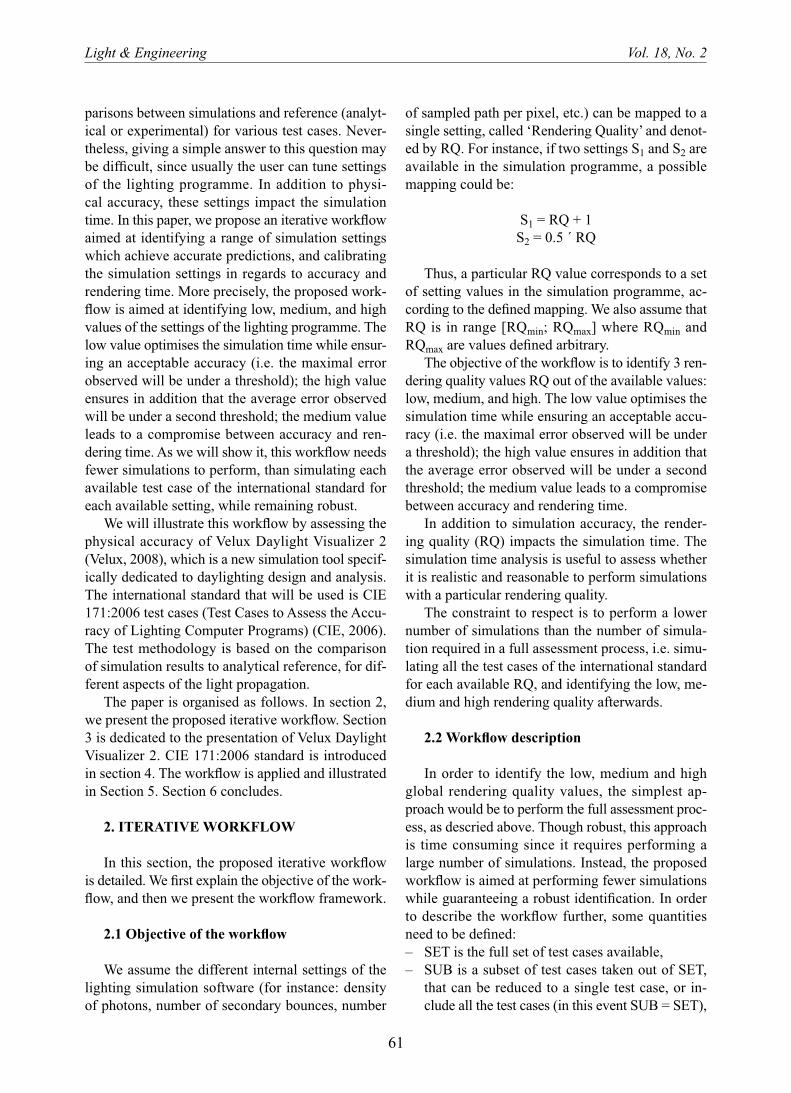
Light & Engineering Vol. 18, No. 2
61
of sampled path per pixel, etc.) can be mapped to a single setting, called ‘Rendering Quality’ and denot-ed by RQ. For instance, if two settings S1 and S2 are available in the simulation programme, a possible mapping could be:
S1 = RQ + 1 S2 = 0.5 ´ RQ
Thus, a particular RQ value corresponds to a set of setting values in the simulation programme, ac-cording to the defi ned mapping. We also assume that RQ is in range [RQmin; RQmax] where RQmin and RQmax are values defi ned arbitrary.
The objective of the workfl ow is to identify 3 ren-dering quality values RQ out of the available values: low, medium, and high. The low value optimises the simulation time while ensuring an acceptable accu-racy (i.e. the maximal error observed will be under a threshold); the high value ensures in addition that the average error observed will be under a second threshold; the medium value leads to a compromise between accuracy and rendering time.
In addition to simulation accuracy, the render-ing quality (RQ) impacts the simulation time. The simulation time analysis is useful to assess whether it is realistic and reasonable to perform simulations with a particular rendering quality.
The constraint to respect is to perform a lower number of simulations than the number of simula-tion required in a full assessment process, i.e. simu-lating all the test cases of the international standard for each available RQ, and identifying the low, me-dium and high rendering quality afterwards.
2.2 Workfl ow description
In order to identify the low, medium and high global rendering quality values, the simplest ap-proach would be to perform the full assessment proc-ess, as descried above. Though robust, this approach is time consuming since it requires performing a large number of simulations. Instead, the proposed workfl ow is aimed at performing fewer simulations while guaranteeing a robust identifi cation. In order to describe the workfl ow further, some quantities need to be defi ned: – SET is the full set of test cases available, – SUB is a subset of test cases taken out of SET,
that can be reduced to a single test case, or in-clude all the test cases (in this event SUB = SET),
parisons between simulations and reference (analyt-ical or experimental) for various test cases. Never-theless, giving a simple answer to this question may be diffi cult, since usually the user can tune settings of the lighting programme. In addition to physi-cal accuracy, these settings impact the simulation time. In this paper, we propose an iterative workfl ow aimed at identifying a range of simulation settings which achieve accurate predictions, and calibrating the simulation settings in regards to accuracy and rendering time. More precisely, the proposed work-fl ow is aimed at identifying low, medium, and high values of the settings of the lighting programme. The low value optimises the simulation time while ensur-ing an acceptable accuracy (i.e. the maximal error observed will be under a threshold); the high value ensures in addition that the average error observed will be under a second threshold; the medium value leads to a compromise between accuracy and ren-dering time. As we will show it, this workfl ow needs fewer simulations to perform, than simulating each available test case of the international standard for each available setting, while remaining robust.
We will illustrate this workfl ow by assessing the physical accuracy of Velux Daylight Visualizer 2 (Velux, 2008), which is a new simulation tool specif-ically dedicated to daylighting design and analysis. The international standard that will be used is CIE 171:2006 test cases (Test Cases to Assess the Accu-racy of Lighting Computer Programs) (CIE, 2006). The test methodology is based on the comparison of simulation results to analytical reference, for dif-ferent aspects of the light propagation.
The paper is organised as follows. In section 2, we present the proposed iterative workfl ow. Section 3 is dedicated to the presentation of Velux Daylight Visualizer 2. CIE 171:2006 standard is introduced in section 4. The workfl ow is applied and illustrated in Section 5. Section 6 concludes.
2. ITERATIVE WORKFLOW
In this section, the proposed iterative workfl ow is detailed. We fi rst explain the objective of the work-fl ow, and then we present the workfl ow framework.
2.1 Objective of the workfl ow
We assume the different internal settings of the lighting simulation software (for instance: density of photons, number of secondary bounces, number
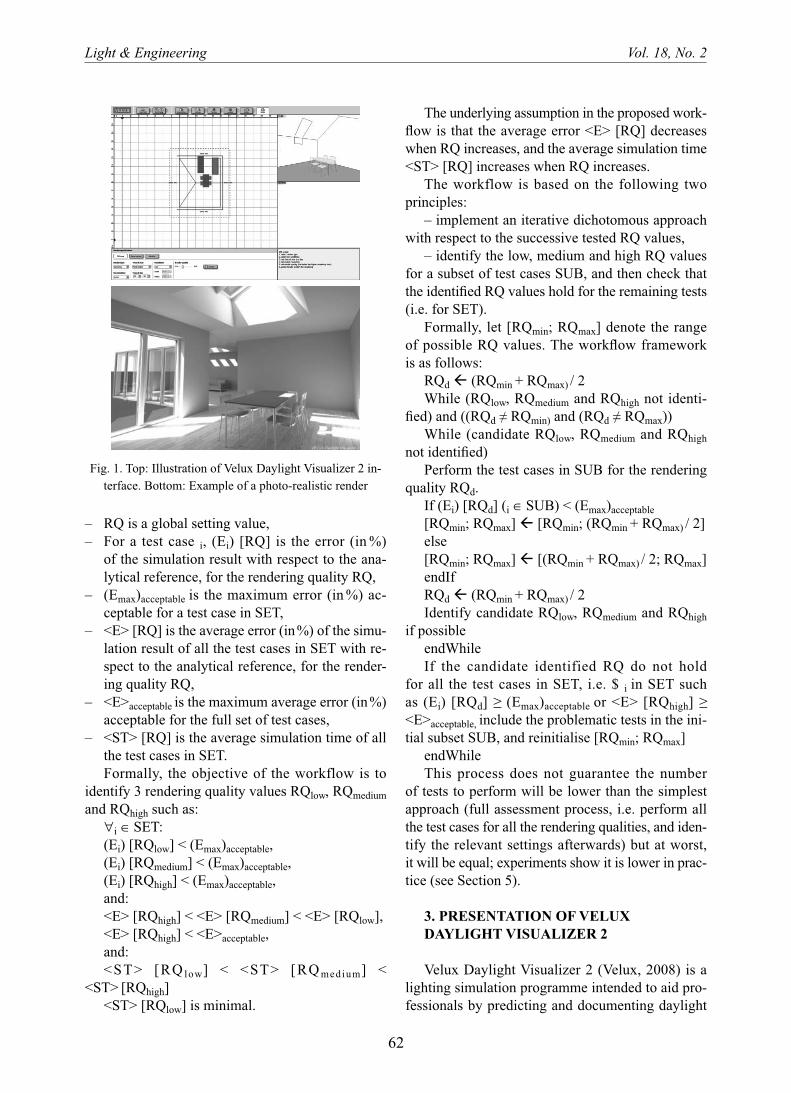
Light & Engineering Vol. 18, No. 2
62
The underlying assumption in the proposed work-fl ow is that the average error <E> [RQ] decreases when RQ increases, and the average simulation time <ST> [RQ] increases when RQ increases.
The workflow is based on the following two principles:
– implement an iterative dichotomous approach with respect to the successive tested RQ values,
– identify the low, medium and high RQ values for a subset of test cases SUB, and then check that the identifi ed RQ values hold for the remaining tests (i.e. for SET).
Formally, let [RQmin; RQmax] denote the range of possible RQ values. The workfl ow framework is as follows:
RQd � (RQmin + RQmax) / 2 While (RQlow, RQmedium and RQhigh not identi-
fi ed) and ((RQd ≠ RQmin) and (RQd ≠ RQmax)) While (candidate RQlow, RQmedium and RQhigh
not identifi ed) Perform the test cases in SUB for the rendering
quality RQd.If (Ei) [RQd] (i ∈ SUB) < (Emax)acceptable [RQmin; RQmax] � [RQmin; (RQmin + RQmax) / 2] else [RQmin; RQmax] � [(RQmin + RQmax) / 2; RQmax] endIf RQd � (RQmin + RQmax) / 2 Identify candidate RQlow, RQmedium and RQhigh
if possible endWhile If the candidate identified RQ do not hold
for all the test cases in SET, i.e. $ i in SET such as (Ei) [RQd] ≥ (Emax)acceptable or <E> [RQhigh] ≥ <E>acceptable, include the problematic tests in the ini-tial subset SUB, and reinitialise [RQmin; RQmax]
endWhile This process does not guarantee the number
of tests to perform will be lower than the simplest approach (full assessment process, i.e. perform all the test cases for all the rendering qualities, and iden-tify the relevant settings afterwards) but at worst, it will be equal; experiments show it is lower in prac-tice (see Section 5).
3. PRESENTATION OF VELUX DAYLIGHT VISUALIZER 2
Velux Daylight Visualizer 2 (Velux, 2008) is a lighting simulation programme intended to aid pro-fessionals by predicting and documenting daylight
– RQ is a global setting value, – For a test case i, (Ei) [RQ] is the error (in %)
of the simulation result with respect to the ana-lytical reference, for the rendering quality RQ,
– (Emax)acceptable is the maximum error (in %) ac-ceptable for a test case in SET,
– <E> [RQ] is the average error (in %) of the simu-lation result of all the test cases in SET with re-spect to the analytical reference, for the render-ing quality RQ,
– <E>acceptable is the maximum average error (in %) acceptable for the full set of test cases,
– <ST> [RQ] is the average simulation time of all the test cases in SET.Formally, the objective of the workflow is to
identify 3 rendering quality values RQlow, RQmedium and RQhigh such as:
∀i ∈ SET:(Ei) [RQlow] < (Emax)acceptable, (Ei) [RQmedium] < (Emax)acceptable, (Ei) [RQhigh] < (Emax)acceptable, and:<E> [RQhigh] < <E> [RQmedium] < <E> [RQlow], <E> [RQhigh] < <E>acceptable, and:<ST> [RQ low] < <ST> [RQ medium] <
<ST> [RQhigh] <ST> [RQlow] is minimal.
Fig. 1. Top: Illustration of Velux Daylight Visualizer 2 in-terface. Bottom: Example of a photo-realistic render

Light & Engineering Vol. 18, No. 2
63
• ambient = on • trace level = 4 • ambient trace level = 8 • ambient precision = RQ × 0.2 + 0.5 • ambient complexity = RQ + 1 • ambient feature size = 0 For instance, RQ5 is the global quality setting
mapped to the following internal settings:• ambient = on • trace level = 4 • ambient trace level = 8 • ambient precision = 1.5 • ambient complexity = 6 • ambient feature size = 0
4. PRESENTATION OF CIE 171:2006 STANDARD
In 2006, the CIE proposed a benchmarking en-titled CIE 171:2006 Test Cases (Test Cases to As-sess the Accuracy of Lightning Computer Program) (CIE, 2006).
4.1 General presentation
The test methodology is based on the comparison of simulation results to analytical reference, for dif-ferent aspects of the light propagation. This method-ology has been used to assess the accuracy of several simulation sofwares, including Radiance (Geisler-Moroder et al., 2008).
For illustration purposes and for readers unfa-miliar with CIE 171:2006 test cases, we present test case 5.4 below. The other test cases used in this pa-per are detailed in (CIE, 2006).
4.2 Example of test case: test case 5.4
The objective of test case 5.4 is to assess the lu-minous fl ux conservation between the light source
levels and appearance of a space prior to realisation of the building design.
3.1 Velux Daylight Visualizer 2 features
Velux Daylight Visualizer 2 permits generation of 3 D models in which roof and facade windows are freely inserted. Other settings include the loca-tion and orientation of the models, the date and time of the simulation, as well as the sky type (from clear to overcast). All the features of the building, win-dows, furniture, orientation and sky conditions can be edited also. In addition to photorealistic render-ing, the simulation output includes luminance, illu-minance and daylight factor maps. Fig. 1 illustrates the Visualizer interface (left) and presents an exam-ple of a render obtained with Velux Daylight Visu-alizer 2 (right). Fig. 2 presents a false colour lumi-nance map.
3.2 Velux Daylight Visualizer 2 settings
Internally, various light transport algorithms are involved: photon mapping (Jensen, 2001), bidirec-tional path tracing, irradiance caching. The settings of each algorithm impact the simulation accuracy and rendering time. The fi nal user can set a single parameter that rules the global simulation quality, and that is mapped to internal settings.
Six settings are used internally to parameter the light transport algorithms used:
• ambient: indicates whether indirect illumina-tion is simulated,
• trace level: is the number of bounces of all types of lighting,
• ambient trace level: is the number of bounces of ambient (indirect) lighting,
• ambient precision: relates to the image based sampling used,
• ambient complexity: describes the lighting complexity. It influences the number of samples used. Higher values equal higher precision,
• ambient feature size: relates to the image in-terpolation quality.
Since the study is related to the assessment of the software accuracy in terms of physical correctness, and not with respect to the image quality, the ambi-ent feature size setting is set to 0 in the experiments.
The global rendering quality value (RQ) can be set by the user between 0 and 10 and is mapped to internal settings as follows:
Fig. 2. Example of a false colour luminance map
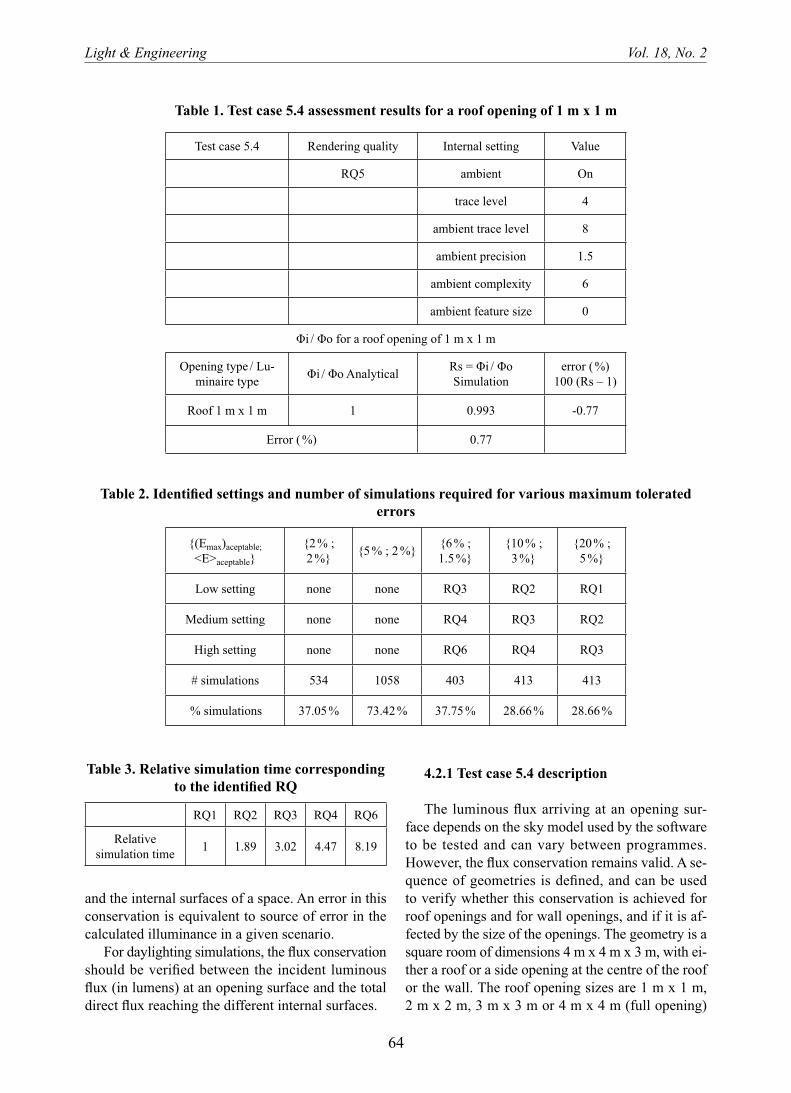
Light & Engineering Vol. 18, No. 2
64
4.2.1 Test case 5.4 description
The luminous fl ux arriving at an opening sur-face depends on the sky model used by the software to be tested and can vary between programmes. However, the fl ux conservation remains valid. A se-quence of geometries is defi ned, and can be used to verify whether this conservation is achieved for roof openings and for wall openings, and if it is af-fected by the size of the openings. The geometry is a square room of dimensions 4 m x 4 m x 3 m, with ei-ther a roof or a side opening at the centre of the roof or the wall. The roof opening sizes are 1 m x 1 m, 2 m x 2 m, 3 m x 3 m or 4 m x 4 m (full opening)
and the internal surfaces of a space. An error in this conservation is equivalent to source of error in the calculated illuminance in a given scenario.
For daylighting simulations, the fl ux conservation should be verifi ed between the incident luminous fl ux (in lumens) at an opening surface and the total direct fl ux reaching the different internal surfaces.
Table 1. Test case 5.4 assessment results for a roof opening of 1 m x 1 m
Test case 5.4 Rendering quality Internal setting Value
RQ5 ambient On
trace level 4
ambient trace level 8
ambient precision 1.5
ambient complexity 6
ambient feature size 0
Φi / Φo for a roof opening of 1 m x 1 m
Opening type / Lu-minaire type Φi / Φo Analytical Rs = Φi / Φo
Simulationerror ( %)
100 (Rs – 1)
Roof 1 m x 1 m 1 0.993 -0.77
Error ( %) 0.77
Table 2. Identifi ed settings and number of simulations required for various maximum tolerated errors
{(Emax)aceptable; <E>aceptable}
{2 % ;2 %} {5 % ; 2 %} {6 % ;
1.5 %}{10 % ;
3 %}{20 % ;
5 %}
Low setting none none RQ3 RQ2 RQ1
Medium setting none none RQ4 RQ3 RQ2
High setting none none RQ6 RQ4 RQ3
# simulations 534 1058 403 413 413
% simulations 37.05 % 73.42 % 37.75 % 28.66 % 28.66 %
Table 3. Relative simulation time corresponding to the identifi ed RQ
RQ1 RQ2 RQ3 RQ4 RQ6
Relative simulation time 1 1.89 3.02 4.47 8.19
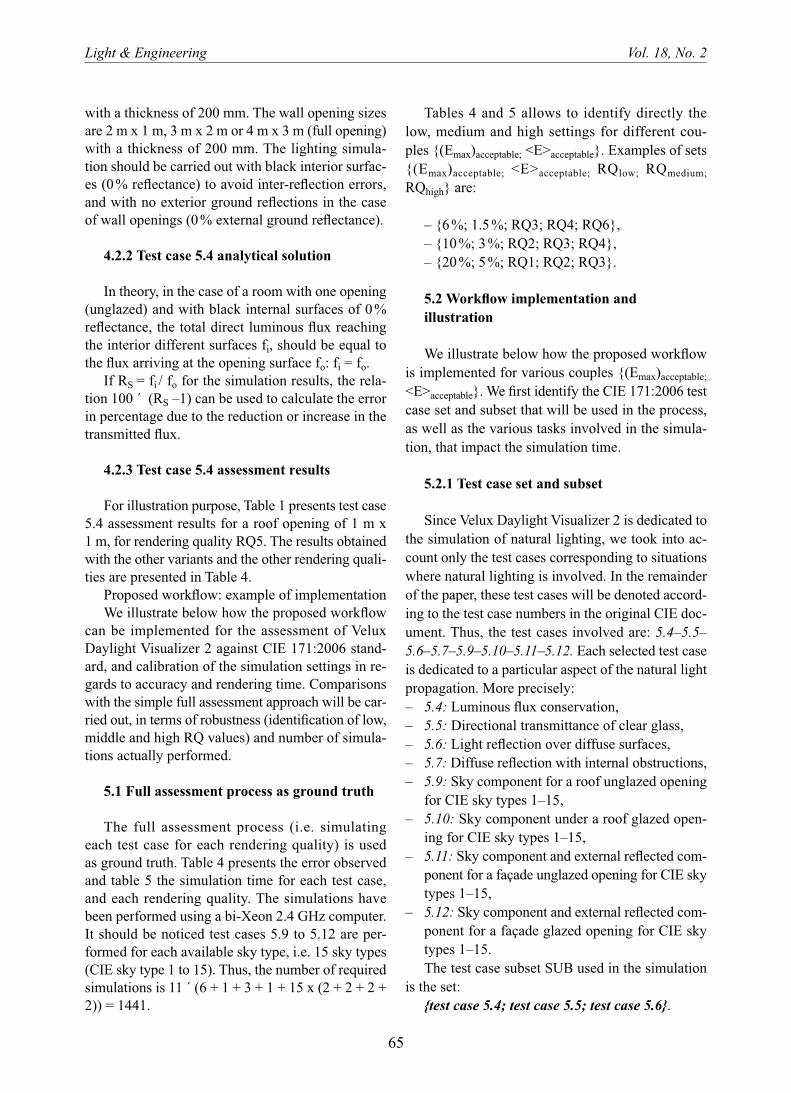
Light & Engineering Vol. 18, No. 2
65
Tables 4 and 5 allows to identify directly the low, medium and high settings for different cou-ples {(Emax)acceptable; <E>acceptable}. Examples of sets {(Emax)acceptable; <E>acceptable; RQlow; RQmedium; RQhigh} are:
– {6 %; 1.5 %; RQ3; RQ4; RQ6}, – {10 %; 3 %; RQ2; RQ3; RQ4}, – {20 %; 5 %; RQ1; RQ2; RQ3}.
5.2 Workfl ow implementation and illustration
We illustrate below how the proposed workfl ow is implemented for various couples {(Emax)acceptable; <E>acceptable}. We fi rst identify the CIE 171:2006 test case set and subset that will be used in the process, as well as the various tasks involved in the simula-tion, that impact the simulation time.
5.2.1 Test case set and subset
Since Velux Daylight Visualizer 2 is dedicated to the simulation of natural lighting, we took into ac-count only the test cases corresponding to situations where natural lighting is involved. In the remainder of the paper, these test cases will be denoted accord-ing to the test case numbers in the original CIE doc-ument. Thus, the test cases involved are: 5.4–5.5–5.6–5.7–5.9–5.10–5.11–5.12. Each selected test case is dedicated to a particular aspect of the natural light propagation. More precisely: – 5.4: Luminous fl ux conservation, – 5.5: Directional transmittance of clear glass, – 5.6: Light refl ection over diffuse surfaces, – 5.7: Diffuse refl ection with internal obstructions, – 5.9: Sky component for a roof unglazed opening
for CIE sky types 1–15, – 5.10: Sky component under a roof glazed open-
ing for CIE sky types 1–15, – 5.11: Sky component and external refl ected com-
ponent for a façade unglazed opening for CIE sky types 1–15,
– 5.12: Sky component and external refl ected com-ponent for a façade glazed opening for CIE sky types 1–15.The test case subset SUB used in the simulation
is the set:{test case 5.4; test case 5.5; test case 5.6}.
with a thickness of 200 mm. The wall opening sizes are 2 m x 1 m, 3 m x 2 m or 4 m x 3 m (full opening) with a thickness of 200 mm. The lighting simula-tion should be carried out with black interior surfac-es (0 % refl ectance) to avoid inter-refl ection errors, and with no exterior ground refl ections in the case of wall openings (0 % external ground refl ectance).
4.2.2 Test case 5.4 analytical solution
In theory, in the case of a room with one opening (unglazed) and with black internal surfaces of 0 % refl ectance, the total direct luminous fl ux reaching the interior different surfaces fi, should be equal to the fl ux arriving at the opening surface fo: fi = fo.
If RS = fi / fo for the simulation results, the rela-tion 100 ´ (RS –1) can be used to calculate the error in percentage due to the reduction or increase in the transmitted fl ux.
4.2.3 Test case 5.4 assessment results
For illustration purpose, Table 1 presents test case 5.4 assessment results for a roof opening of 1 m x 1 m, for rendering quality RQ5. The results obtained with the other variants and the other rendering quali-ties are presented in Table 4.
Proposed workfl ow: example of implementation We illustrate below how the proposed workfl ow
can be implemented for the assessment of Velux Daylight Visualizer 2 against CIE 171:2006 stand-ard, and calibration of the simulation settings in re-gards to accuracy and rendering time. Comparisons with the simple full assessment approach will be car-ried out, in terms of robustness (identifi cation of low, middle and high RQ values) and number of simula-tions actually performed.
5.1 Full assessment process as ground truth
The full assessment process (i.e. simulating each test case for each rendering quality) is used as ground truth. Table 4 presents the error observed and table 5 the simulation time for each test case, and each rendering quality. The simulations have been performed using a bi-Xeon 2.4 GHz computer. It should be noticed test cases 5.9 to 5.12 are per-formed for each available sky type, i.e. 15 sky types (CIE sky type 1 to 15). Thus, the number of required simulations is 11 ´ (6 + 1 + 3 + 1 + 15 x (2 + 2 + 2 + 2)) = 1441.

Light & Engineering Vol. 18, No. 2
66
Table 4. Full assessment process results. Error ( %) with respect to analytical reference for each test case and each rendering quality
RQ0 RQ1 RQ2 RQ3 RQ4 RQ5 RQ6 RQ7 RQ8 RQ9 RQ10Test Case number Test Case variant
Test Case 5.4 Roof opening 1 m x 1 m 3.68 1.38 1.22 0.92 0.84 0.77 0.75 0.71 0.66 0.67 0.69
Roof opening 2 m x 2 m 0.75 0.14 0.29 0.05 0.09 0.05 0.05 0.03 0.01 0.02 0.03
Roof opening 4 m x 4 m 0.21 0.25 0.02 0.17 0.14 0.16 0.14 0.14 0.17 0.16 0.15
Wall opening 2 m x 1 m 1.88 0.32 0.07 0.21 0.32 0.39 0.42 0.45 0.44 0.76 0.46
Wall opening 3 m x 2 m 1.49 0.84 0.62 0.62 0.53 0.49 0.48 0.45 0.47 0.46 0.46
Wall opening 4 m x 3 m 0.10 0.14 0.33 0.27 0.33 0.34 0.37 0.38 0.36 0.38 0.39
Test Case 5.5 - 1.15 1.08 1.07 1.07 1.07 1.07 1.07 1.07 1.07 1.07 1.07
Test Case 5.6 S2 of 50 cm x 50 cm 32.38 11.66 6.64 3.57 2.35 2.87 2.09 1.93 0.99 1.29 1.39
S2 of 4 m x 4 m 0.96 0.70 0.45 0.45 0.44 0.39 0.38 0.39 0.37 0.36 0.36
S2 of 500 m x 500 m 3.88 3.07 2.42 2.36 2.10 2.11 1.91 1.99 1.98 1.87 1.87
Test Case 5.7 - 2.23 0.68 0.25 0.42 0.30 0.13 0.15 0.15 0.06 0.04 0.05
Test Case 5.9 Roof opening 1 m x 1 m 11.50 4.17 2.74 2.40 1.91 1.56 1.28 1.40 1.22 1.15 1.07
Roof opening 4 m x 4 m 3.83 3.31 3.21 3.19 3.18 3.15 3.12 3.12 3.12 3.12 3.12
Test Case 5.10 Roof opening 1 m x 1 m 9.71 3.34 3.92 5.19 5.10 5.33 5.46 5.54 5.27 5.19 5.22
Roof opening 4 m x 4 m 2.14 1.70 1.56 1.62 1.67 1.65 1.65 1.66 1.68 1.67 1.66
Test Case 5.11 Wall opening 2 m x 1 m 5.75 2.48 1.49 0.96 0.83 0.67 0.60 0.45 0.39 0.36 0.31
Wall opening 4 m x 3 m 1.55 0.97 0.84 0.67 0.71 0.67 0.64 0.67 0.65 0.61 0.61
Test C)ase 5.12 Wall opening 2 m x 1 m 8.53 5.70 4.99 4.44 4.68 4.59 4.64 4.57 4.51 4.38 4.31
Wall opening 4 m x 3 m 2.69 2.53 2.39 2.34 2.36 2.33 2.27 2.26 2.28 2.28 2.28
Minimum 0.10 0.14 0.02 0.05 0.09 0.05 0.05 0.03 0.01 0.02 0.03
Maximum 32.38 11.66 6.64 5.19 5.10 5.33 5.46 5.54 5.27 5.19 5.22
Average 4.97 2.34 1.82 1.63 1.52 1.51 1.45 1.44 1.35 1.36 1.34
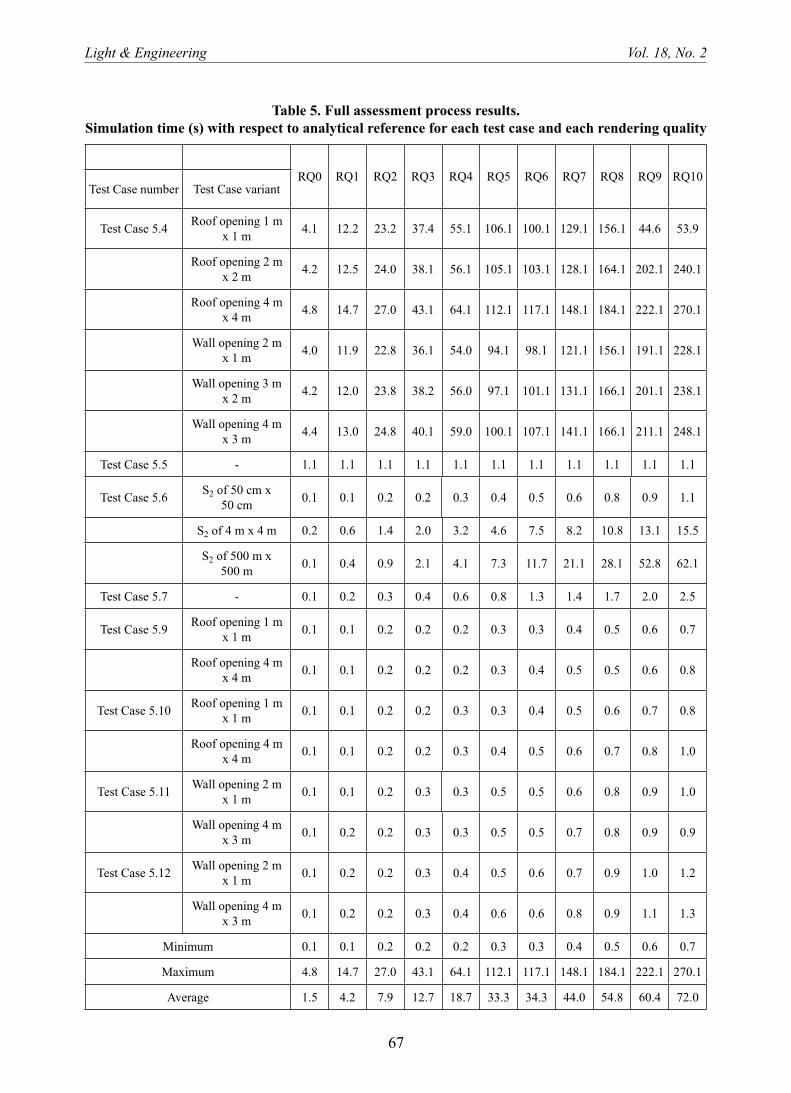
Light & Engineering Vol. 18, No. 2
67
Table 5. Full assessment process results. Simulation time (s) with respect to analytical reference for each test case and each rendering quality
RQ0 RQ1 RQ2 RQ3 RQ4 RQ5 RQ6 RQ7 RQ8 RQ9 RQ10Test Case number Test Case variant
Test Case 5.4 Roof opening 1 m x 1 m 4.1 12.2 23.2 37.4 55.1 106.1 100.1 129.1 156.1 44.6 53.9
Roof opening 2 m x 2 m 4.2 12.5 24.0 38.1 56.1 105.1 103.1 128.1 164.1 202.1 240.1
Roof opening 4 m x 4 m 4.8 14.7 27.0 43.1 64.1 112.1 117.1 148.1 184.1 222.1 270.1
Wall opening 2 m x 1 m 4.0 11.9 22.8 36.1 54.0 94.1 98.1 121.1 156.1 191.1 228.1
Wall opening 3 m x 2 m 4.2 12.0 23.8 38.2 56.0 97.1 101.1 131.1 166.1 201.1 238.1
Wall opening 4 m x 3 m 4.4 13.0 24.8 40.1 59.0 100.1 107.1 141.1 166.1 211.1 248.1
Test Case 5.5 - 1.1 1.1 1.1 1.1 1.1 1.1 1.1 1.1 1.1 1.1 1.1
Test Case 5.6 S2 of 50 cm x 50 cm 0.1 0.1 0.2 0.2 0.3 0.4 0.5 0.6 0.8 0.9 1.1
S2 of 4 m x 4 m 0.2 0.6 1.4 2.0 3.2 4.6 7.5 8.2 10.8 13.1 15.5
S2 of 500 m x 500 m 0.1 0.4 0.9 2.1 4.1 7.3 11.7 21.1 28.1 52.8 62.1
Test Case 5.7 - 0.1 0.2 0.3 0.4 0.6 0.8 1.3 1.4 1.7 2.0 2.5
Test Case 5.9 Roof opening 1 m x 1 m 0.1 0.1 0.2 0.2 0.2 0.3 0.3 0.4 0.5 0.6 0.7
Roof opening 4 m x 4 m 0.1 0.1 0.2 0.2 0.2 0.3 0.4 0.5 0.5 0.6 0.8
Test Case 5.10 Roof opening 1 m x 1 m 0.1 0.1 0.2 0.2 0.3 0.3 0.4 0.5 0.6 0.7 0.8
Roof opening 4 m x 4 m 0.1 0.1 0.2 0.2 0.3 0.4 0.5 0.6 0.7 0.8 1.0
Test Case 5.11 Wall opening 2 m x 1 m 0.1 0.1 0.2 0.3 0.3 0.5 0.5 0.6 0.8 0.9 1.0
Wall opening 4 m x 3 m 0.1 0.2 0.2 0.3 0.3 0.5 0.5 0.7 0.8 0.9 0.9
Test Case 5.12 Wall opening 2 m x 1 m 0.1 0.2 0.2 0.3 0.4 0.5 0.6 0.7 0.9 1.0 1.2
Wall opening 4 m x 3 m 0.1 0.2 0.2 0.3 0.4 0.6 0.6 0.8 0.9 1.1 1.3
Minimum 0.1 0.1 0.2 0.2 0.2 0.3 0.3 0.4 0.5 0.6 0.7
Maximum 4.8 14.7 27.0 43.1 64.1 112.1 117.1 148.1 184.1 222.1 270.1
Average 1.5 4.2 7.9 12.7 18.7 33.3 34.3 44.0 54.8 60.4 72.0

Light & Engineering Vol. 18, No. 2
68
RQ5 (SUB)�RQ2 (SUB)�RQ1 (SUB)�RQ3 (SUB)�RQ4 (SUB)�RQ2 (SET)�RQ3 (SET)� RQ4 (SET)
The identifi ed settings are {RQ2; RQ3; RQ4}. The total number of simulations performed is: 3 ´ (6 + 1 + 3 + 1 + 15 × (2 + 2 + 2 + 2)) + 2 × (6 + 1 + 3) = 413, i.e. 28.66 % of the number of simulations required in the full assessment process. The identi-fi ed settings from the full assessment process are the same.
5.2.3.3 {(Emax)acceptable = 20 %; <E>acceptable = 5 %}
The successive simulations performed in the it-erative workfl ow are as follows:
RQ5 (SUB)�RQ2 (SUB)�RQ1 (SUB)�RQ0 (SUB)�RQ3 (SUB)�RQ1 (SET)�RQ2 (SET)� RQ3 (SET)
The identifi ed settings are {RQ1; RQ2; RQ3}. The total number of simulations performed is: 3 ´ (6 + 1 + 3 + 1 + 15 × (2 + 2 + 2 + 2)) + 2 × (6 + 1 + 3) = 413, i.e. 28.66 % of the number of simulations required in the full assessment process. The identi-fi ed settings from the full assessment process are the same.
5.2.3.4 {(Emax)acceptable = 2 %; <E>acceptable = 2 %}
We study now a case where no setting can be identifi ed, if we refer to Table 4. Indeed, no RQ val-ue lead to a maximum error below 2 %. In this case, the successive simulations performed through the it-erative process are as follows:
RQ5 (SUB)�RQ7 (SUB)�RQ8 (SUB)�RQ9 (SUB)� RQ7 (SET)� RQ8 (SET) � RQ9 (SET)�RQ10 (SUB)� RQ10 (SET)
No settings are identified. The total number of simulations performed is:
4 ´ (6 + 1 + 3 + 1 + 15 × (2 + 2 + 2 + 2)) + 1 × (6 + 1 + 3) = 534 = 37.05 % of the number of simu-lations required in the full assessment process.
5.2.3.5 {(Emax)acceptable = 5 %; <E>acceptable = 2 %}
We study another case where no setting can be identifi ed, since no RQ value lead to a maximum error below 5 % (see Table 4). The successive sim-ulations performed in the iterative process are as follows:
5.2.2 Simulation time
The simulation time analysis is required to cal-ibrate the simulation settings, to know whether it is realistic and reasonable to perform simulations with a particular rendering quality. The simulation time includes the following tasks: – parsing, – setup, – light transport simulation, – image rendering.
5.2.3 Implementation for various tolerated errors
We are going to list the successive RQ tested, as well as the test case subset involved in the simula-tion. For instance, RQ5 (SUB) means the simulation is performed for the test case subset SUB for the ren-dering quality 5; RQ2 (SET) means the simulation is performed for all the test cases for the rendering quality 2. The reader can follow and check the proc-ess from Tables 4 and 5.
A simulation will be indicated in italic if the max-imum error observed is under the maximum toler-ated error, i.e: (Ei) [RQd] (i Î SUB) < (Emax)acceptable
A simulation will be indicated in italic bold if, in addition, the average error observed for the full set of test cases is under the average tolerated error, i.e: <E> [RQd] < <E>acceptable
5.2.3.1 {(Emax)acceptable = 6 %; <E>acceptable = 1.5 %}
The successive simulations performed in the it-erative workfl ow are as follows:
RQ5 (SUB)�RQ2 (SUB)�RQ3 (SUB)�RQ4 (SUB)�RQ3 (SET)�RQ4 (SET)�RQ5 (SET)� RQ7 (SUB)�RQ6 (SUB)�RQ6 (SET)
The identifi ed settings are {RQ3; RQ4; RQ6}. The total number of simulations performed is: 4 ´ (6 + 1 + 3 + 1 + 15 ´ (2 + 2 + 2 + 2)) + 2 ´ (6 + 1 + 3) = 544, i.e. 37.75 % of the number of simulations required in the full assessment process. The identi-fi ed settings from the full assessment process are the same.
5.2.3.2 {(Emax)acceptable = 10 %; <E>acceptable = 3 %}
The successive simulations performed in the it-erative workfl ow are as follows:
Light & Engineering Vol. 18, No. 2
69
The proposed workfl ow was illustrated by the assessment and calibration of Velux Daylight Visu-alizer 2 against CIE 171:2006 test cases. Compared to a full assessment process, the number of tests to perform is reduced by 58.89 % on average, and the iterative process is robust: the results are the same as those obtained from the full assessment proc-ess, i.e. performing each test case for each setting, and identifying the low, medium and high settings afterwards.
A secondary result of this paper is the validation of Velux Daylight Visualizer 2 physical accuracy against CIE 171:2006 test cases dedicated to natural lighting. For eight identifi ed settings, the maximal error with respect to the reference is below 6 % and the average error is below 1.8 %; thus, Velux Day-light Visualizer 2 can predict accurately daylight lev-els and appearance of a space lightened with natural light, prior to the realisation of the building design. The simulation times are reasonable for using the software for building design and analysis.
Future works will be concerned with the proposal of a new methodology to assess the rendered image quality from representative scenes lighting transport programmes can do, where various aspects of light transport are involved simultaneously.
ACKNOWLEDGEMENT
The authors would like to thank Nicolas Roy and Marc Fontoynont for their helpful comments and suggestions, Cyrille Mouret for having run the ex-periments, and Pascale Avouac and Marie-Claude Jean for their helpful assistance.
REFERENCES
1. Newsham, G.R., Richardson, C., Blanchet, C., and Veitch, J.A. Lighting quality research using rendered im-ages of offi ces. Lighting Research & Technology, vol. 37, No. 2, pp. 93–115 (2005).
2. Kajiya, J. T., The rendering equation. SIGGRAPH Computer Graphics, Volume 20, pp. 143–150 (1986).
3. Pharr, M., and Humphreys, G., Physically Based Rendering: from Theory to Implementation. ISBN 0 12 553180 X (2004).
4. Ward, G. J., The RADIANCE Lighting Simulation and Rendering System. SIGGRAPH Computer Graphics, pp. 459–472 (1994).
5. Reinhart, C., Bourgeois, D., Dubrous, F., Laouadi, A., Lopez, P., and Stelescu, O., Daylight 1–2-3 – A State-
RQ5 (SUB)�RQ2 (SUB)�RQ3 (SUB)�RQ4 (SUB)� RQ3 (SET)� RQ4 (SET)� RQ5 (SET)� RQ7 (SUB)� RQ6 (SUB)� RQ8 (SUB)� RQ6 (SET)� RQ7 (SET)� RQ8 (SET)� RQ9 (SUB)� RQ10 (SUB)� RQ9 (SET)�RQ10 (SET)
No settings are identified. The total number of simulations performed is: × x (6 + 1 + 3 + 1 + 15 × (2 + 2 + 2 + 2)) + 1 × (6 + 1 + 3) = 1058 = 73.42 % of the number of simulations required in the full assessment process. This case is not favorable to the iterative workfl ow and many RQ values must be successively tested: indeed the pre-identifi ed settings from the test case subset SUB are not suitable when tested for the full set of test cases SET. Nevertheless, the number of simulations performed remains lower than the total number of simulations required in the full assessment process.
5.2.4 RESULT OVERVIEW
Table 2 gathers the results obtained for the sev-eral maximum tolerated errors. The average number of simulations required to identify the low, medium and high settings is, on average, 58.89 % lower than the number of simulations required in the full as-sessment process. The identifi cation is robust, if we refer to table 4.
Table 3 indicates the relative simulation time cor-responding to the identifi ed RQ (1 corresponds to 4.19 s using a bi-Xeon 2.4 GHz computer). These times are reasonable for using the software for build-ing design and analysis.
6. CONCLUSION
In this paper, an iterative workfl ow was proposed to identify a range of lighting programme simula-tion settings which achieve accurate predictions, and to calibrate the simulation settings in regards to accuracy and rendering time. More precisely, the proposed workfl ow is aimed at identifying low, me-dium, and high values of the settings of the lighting programme. The low value optimises the simulation time while ensuring an acceptable accuracy (i.e. the maximal error observed will be under a threshold); the high value ensures in addition that the average error observed will be under a second threshold; the medium value leads to a compromise between accu-racy and rendering time.

Light & Engineering Vol. 18, No. 2
70
8. CIE, CIE 171:2006 Report. ISBN 978 3 901906 47 3 (2006). http://www.cie.co.at/publ/abst/171–06.html http://www.techstreet.com/ciegate.tmpl
9. Jensen, H.W., Realistic Image Synthesis Using Pho-ton Mapping. AK Peters, ISBN 156 8 811470 (2001).
10. Geisler-Moroder, D., and Dür, A., Validation of Radiance against CIE 171:2006 and Improved Adap-tive Subdivision of Circular Light Sources. 7 th Interna-tional RADIANCE workshop, Fribourg (2008).
Of-The-Art Daylighting/Energy Analysis Software for Initial Design Investigations. Building Simulation, pp. 1669–1676 (2007).
6. Donn, M., Xu, D., Harrison, D. and Maamari, F., Using Simulation Software Calibration Tests as a Con-sumer Guide – A Feasibility Study Using Lighting Sim-ulation Software. Building Simulation, pp. 1999–2006 (2007).
7. Velux, Velux Daylight Visualizer 2. http://viz.velux.com/ (2008).
Raphaël Labayrade was born in France, in 1976. He received the M.S. degree in 2000 from the university of Saint Etienne, and was graduated from the ENTPE engineer school in 2000. He received the Ph.D. degree in 2004 from the university of Paris 6 – Jussieu. From 2000 to 2007 he worked in the perception team of the LIVIC (INRETS) department and works on automated highway and on on-board driving assistance systems
Claus Wann Jensen is co-founder of Luxion ApS. Luxion was founded in 2003 and specializes in advanced lighting technology. He received his M.Sc. in Computer Science from the Technical University of Denmark in 1999. He has extensive computer programming experience from 15 years in the industry where he has done system development for clients like IBM, Maersk Line, Lucent Technology, OFS Fitel, Cisco and more. His expertise is high performance computing, parallel computing and system development
Henrik Wann Jensen is the Chief Scientist of Luxion ApS, and also an associate professor at the University of California at San Diego, where he is working in the computer graphics lab. His research is focused on realistic image synthesis, global illumination, rendering of natural phenomena, and appearance modeling. His contributions to computer graphics include the photon mapping algorithm for global illumination, and the fi rst technique for effi ciently simulating subsurface scattering in translucent materials. He is the author of “Realistic Image Synthesis using Photon Mapping,” AK Peters 2001. He has rendered images that have appeared on the frontcovers of the SIGGRAPH proceedings (2001) and National Geographic Magazine (2002), and rendered three animations that have been shown in the SIGGRAPH electronic theater (1998,2000,2001)
71
Light & Engineering SvetotekhnikaVol. 18, No. 2, pp. 71-75, 2010 No. 5, 2009, pp. 18-21
method also allows estimating irregularity of SDI light opening illumination. This method is intended to simplify the optimization of the design solution of SDIs, being devices very similar to integrating spheres [4–6].
When developing an SDI of any type, one should achieve maximum illuminance from it over the OS.
In doing so, it is necessary to determine the SDI diameter, spectral composition of the light source (LS) radiation, light distribution of the illuminator, number and location of the LS, diameter of the SDI light opening and optical properties of the refl ection coating of the SDI inner surface.
The photometric characteristics of an SDI as a product are as follows: average illuminance over the OS (Еav), illumination irregularity coeffi cient K, chromatic temperature, general colour rendering in-dex and effi ciency. In this case
ΚΕ Ε
Ε=
−max min ,avg
where Εmax , Εmin and Еavg are designed or meas-ured maximum, minimum and average illuminance over the OS correspondingly.
METHOD OF ILLUMINANCE DISTRIBUTION CALCULATION FROM A SPHERICAL DIFFUSE ILLUMINATOR
In the general case, one can calculate illuminance distribution over the operation surface by solving the integro-differential equation of radiation transfer
ABSTRACT
The article considers lighting characteristics of a spherical diffuse illuminator for scanners of fi lm material. An algorithm for the calculation of illumi-nance distribution from the illuminator over an op-eration surface is developed.
Keywords: diffuse illumination, spherical illumi-nator, diffuse illuminator, illuminance, single refl ec-tion, multiple refl ection, refl ection factor, illumina-tion irregularity, operation surface
STATING THE PROBLEM: THE MAIN REQUIREMENTS FOR A SPHERICAL DIFFUSE ILLUMINATOR
Diffuse illumination is used extensively in light-ing engineering, cinema and TV. With its help many effects can be achieved, such as making face wrin-kles ”disappear”, improving image quality when us-ing scanners of fi lm material, “fi ltering” out some defects of a fi lm [1–3].
Diffuse illumination can be obtained in three ways:
• by means of lighting a diffusely refl ecting sur-face, for example using the spherical diffuse illumi-nator (SDI);
• by realising the “deep mode” in a light-diffus-ing medium;
• by transmitting light through a matte glass plate.
This work is dedicated to the development of a method of calculation of illuminance distribution from an SDI over the operation surface (OS). The
SPHERICAL DIFFUSE ILLUMINATOR
Yury A. Anokhin1 and Alexander F. Peregudov2
1 The Federal State Educational Institution of Additional Vocational Training St.-Petersburg Power Institute of Improvement of Professional Skill,
2 The St.-Petersburg State University of Cinema and TV E-mail: [email protected]

Light & Engineering Vol. 18, No. 2
72
ΕΕA
S
e i
ldq= ⋅
⋅ ⋅∫
ρπ
cos cos,
2
where EA is illuminance at the sphere inner surface in point A; S is area of the sphere inner surface.
The same formula is in the spherical system of co-ordinates (R, θ, φ) with the centre in point O, with due regard for dq R d dAA A A= 2 sinθ θ φ , looks like
E
E
В
A A A
A A B B
R
R
l RAA
e
=⋅
== ∫∫
ρπ
θ ϕθ ϕ θ ϕϕ
π
θ
π
2
20
2
0
×
××
×
( , , )
( , , , )
cos (,
θθ ϕ θ ϕθ ϕ θ ϕθ θ ϕ
A A B B
A A B B
A A A
id d
, , )
cos ( , , )
sin ,
,
,
×× ×
×
Ε Ε
Ε ΕA A A A d A A
A A A A m A A
R R
R R
( , , ) ( , , )
( , , ) ( , , ),
,
, ,
θ ϕ θ ϕ
θ ϕ θ ϕ
= +
+ +1
where ΕA d, is a direct (primary) component of the ΕA , ΕA,1 is once refl ected (secondary) component of the ΕA , and ΕA m, is the sum of subsequent mul-tiply refl ected components of the ΕA .
ΕA v R, ( ) / ( ),121 4= −φ ρ ζ π
ΕA m R, ( ) / [ ( )] ,= − − −{ }φρ ζ ρ ζ π2 2 21 1 1 4
whereϕv is LS luminous fl ux; ζ is relative portion of the sphere inner surface occupied by SDI light opening. Based on these formula, an algorithm of the ЕВ calculation is developed.
LIGHT SOURCES
The LSs used for the purposes of this research were light emitting diodes (LED) with light effi ca-cy of 100 lm/W order and higher and of 100 thou-sand hours order declared service life. Namely: white LEDs of Philips/Lumileds Company: LXHL-LW3 C (of Luxeon® III Star series) and LXHL-NWG8 (of Luxeon® Star/О series) [8, 9]. The LXHL-NWG8 LED is equipped with a secondary collimator lens. Some characteristics of these LEDs
under the correspondent boundary conditions [10]. However despite the development of computer de-velopment, lighting application of the radiation transfer theory is complex enough (mainly, because of complex boundary conditions).
There are also more simple methods of solving this problem. In particular, to calculate illuminance from an SDI over OS, one can use the theory of in-tegrating sphere, which is describe in [4–7]. How-ever, this method does not provide answers to the questions of optimum LS location, of the ability to use direct light of an LS for diffuse illumination and of illumination irregularity infl uence on the irregu-larity of OS Illumination (for example, of the fi lm aperture in scanning systems) when OS illuminating with LS direct light of SDI inner surface.
In Fig. 1, point O is the SDI sphere centre, point A is centre of an infinitesimal site being tangent to the sphere surface of area dq, е is an angle be-tween the normal to the specifi ed site and direction of the refl ected ray АВ, i is incidence angle of ray АВ on the OS, l is length of ray АВ, ОА ≡ R is ra-dius of the SDI sphere inner surface. As can be seen from Fig. 1, in this case the planes of the SDI light opening and of the OS do not coincide. Illuminance is calculated on the OS in point B (ЕВ).
Based on the lighting engineering, at diffuse (Lambert’s) refl ection from a sphere inner surface with refl ection factor ρ (being spectroscopically in-dependent in the visible interval and identical for all this surface), ЕВ is calculated by the formula:
Fig. 1. Section of a spherical diffuse illuminator (SDI) by meridian plane
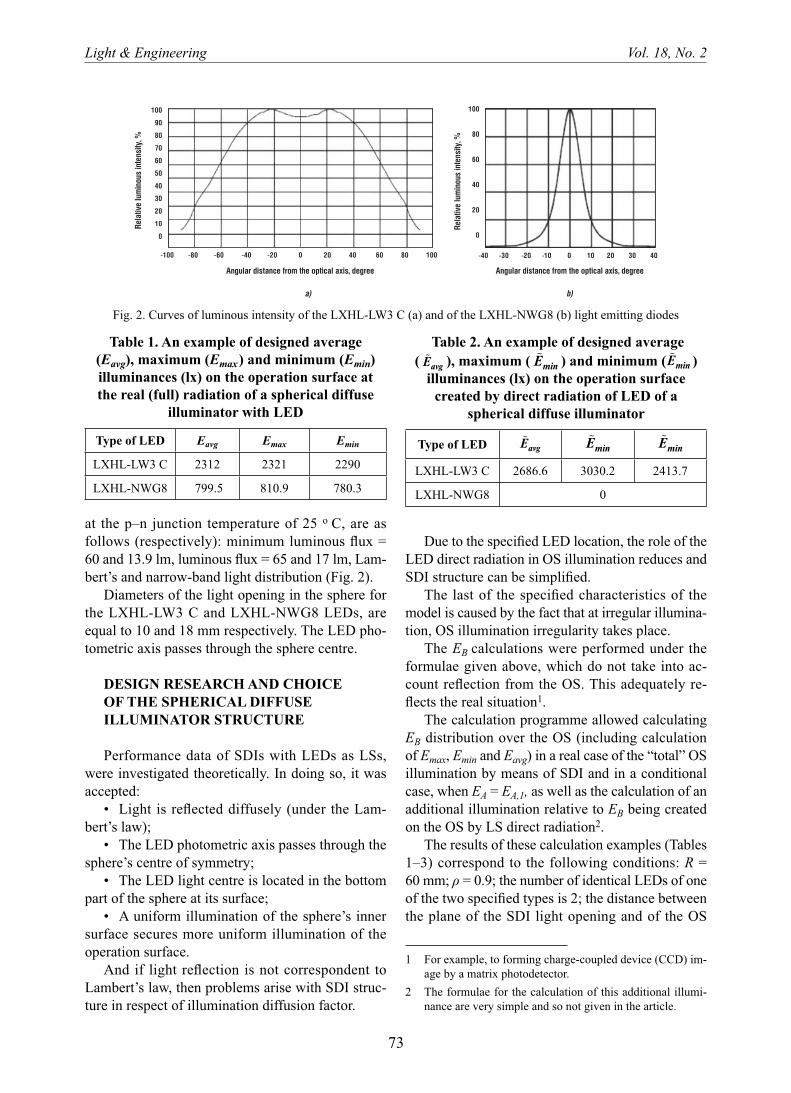
Light & Engineering Vol. 18, No. 2
73
Due to the specifi ed LED location, the role of the LED direct radiation in OS illumination reduces and SDI structure can be simplifi ed.
The last of the specifi ed characteristics of the model is caused by the fact that at irregular illumina-tion, OS illumination irregularity takes place.
The EB calculations were performed under the formulae given above, which do not take into ac-count refl ection from the OS. This adequately re-fl ects the real situation1.
The calculation programme allowed calculating ЕВ distribution over the OS (including calculation of Еmax, Еmin and Еavg) in a real case of the “total” OS illumination by means of SDI and in a conditional case, when ЕА = ЕА,1, as well as the calculation of an additional illumination relative to ЕB being created on the OS by LS direct radiation2.
The results of these calculation examples (Tables 1–3) correspond to the following conditions: R = 60 mm; ρ = 0.9; the number of identical LEDs of one of the two specifi ed types is 2; the distance between the plane of the SDI light opening and of the OS
1 For example, to forming charge-coupled device (CCD) im-age by a matrix photodetector.
2 The formulae for the calculation of this additional illumi-nance are very simple and so not given in the article.
at the p–n junction temperature of 25 о С, are as follows (respectively): minimum luminous fl ux = 60 and 13.9 lm, luminous fl ux = 65 and 17 lm, Lam-bert’s and narrow-band light distribution (Fig. 2).
Diameters of the light opening in the sphere for the LXHL-LW3 C and LXHL-NWG8 LEDs, are equal to 10 and 18 mm respectively. The LED pho-tometric axis passes through the sphere centre.
DESIGN RESEARCH AND CHOICE OF THE SPHERICAL DIFFUSE ILLUMINATOR STRUCTURE
Performance data of SDIs with LEDs as LSs, were investigated theoretically. In doing so, it was accepted:
• Light is refl ected diffusely (under the Lam-bert’s law);
• The LED photometric axis passes through the sphere’s centre of symmetry;
• The LED light centre is located in the bottom part of the sphere at its surface;
• A uniform illumination of the sphere’s inner surface secures more uniform illumination of the operation surface.
And if light refl ection is not correspondent to Lambert’s law, then problems arise with SDI struc-ture in respect of illumination diffusion factor.
Fig. 2. Curves of luminous intensity of the LXHL-LW3 C (a) and of the LXHL-NWG8 (b) light emitting diodes
Table 1. An example of designed average (Еavg), maximum (Emax ) and minimum (Еmin) illuminances (lx) on the operation surface at the real (full) radiation of a spherical diffuse
illuminator with LED
Type of LED Еavg Еmax Еmin
LXHL-LW3 C 2312 2321 2290
LXHL-NWG8 799.5 810.9 780.3
Table 2. An example of designed average ( �Eavg ), maximum ( �Emin ) and minimum ( �Emin )
illuminances (lx) on the operation surface created by direct radiation of LED of a
spherical diffuse illuminator
Type of LED �Eavg�Emin
�Emin
LXHL-LW3 C 2686.6 3030.2 2413.7
LXHL-NWG8 0

Light & Engineering Vol. 18, No. 2
74
plane, in which LS light centres are located, does not essentially infl uence SDI main performance data;
• If uniformity of OS illumination is important, OS shielding against LS direct radiation is practical;
• The specifi ed shielding can be avoided by use of LS with a narrow-band light distribution;
• Increase of the distance between OS and SDI light opening, appreciably reduces OS average illu-minance (Еavg) but improves uniformity of OS illu-mination (for example, of fi lm aperture);
• Increase of SDI sphere radius (R) in particu-lar from 60 to 80 mm, reduces Еavg approximate-ly (80/60) 2 times but raises uniformity of the OS illumination.
Besides, the more the SDI (namely R) value, the easier it is to increasing the LS number, thereby rais-ing OS illuminance. SDI structure choice is also in-fl uenced by the level of SDI inner surface coating refl ection.
REFERENCES
1. Peregudov A.F. Film scanners: between past and fu-ture//Tekhnika i Tekhnologia Kino – 2007. – № 5. – pp. 56–63.
2. Fielding, G., Dowdell, J. Method for infrared im-age correction and enhancement // VOIS Patent applica-tion WO2009/035628. Published 19.03.2009.
3. Swinson, P. Film Scanning for Archives: New in-novations in dust/scratch busting & image stabilization // Proc. SMPTE Techn. Conf., 24–27.10.2007, Brooklyn, NY, 2007.
is equal to 0; the LED centres are in a plane located below of the sphere centre at a distance of 37.9 mm (that is at the distance of 20 mm from the OS); di-ameter of the specifi ed light opening makes 31.1 mm and is equal to the diagonal of a rectangular OS; symmetry axes of the specifi ed light opening and of the OS coincide.
As it can be seen from Tables 1–3, uniformity of OS illumination becomes worse due to direct LED radiation (K grows). At the same time for example, LED number doubling (to 4) raises this uniformity to an acceptable value lowering K by 43 and 60 % (to 1.36 and 0.69 %) in the event of the LXHL-LW3 C and LXHL-NWG8 LEDs respectively. That is one can achieve an acceptable uniformity of OS diffuse illumination by increasing the number of LSs, even without shielding their direct light.
The calculation results have also shown that for example, increasing light opening and shielding LED direct light, allow for obtaining K value of no more than 0.5 %. The same is also achievable with-out shielding but with use of LS with a narrow-band light distribution (as for example, the LXHL-NWG8 LED has).
Examples of other useful calculation data on SDI structure optimisation are given in Tables 4–6.
CONCLUSION
As a whole, the analysis of the calculation results shows that:
• The distance between the OS plane and a
Table 3. An example of designed average (Eavg), maximum (Emin) and minimum (Emin) illuminances (lx) on the operation surface under conditional (EA= EA1) radiation of a spherical diffuse
illuminator with LED
Type of LED Eavg Emin Emin
LXHL-LW3 C 2312 2321 2290LXHL-NWG8 799.5 810.9 780.3
Table 4. An example of designed average illuminance Еavg (lx) and of illuminance distribution irregularity coeffi cient K (%) over the operation surface (OS) at a real (full) radiation of a spherical diffuse illuminator with LEDs at various distances between light opening of this illuminator and OS
h (mm)
Type of LED H 20 15 10 5 0
LXHL-LW3 CЕavg 3318,8 4912.6 12547 17280 22640K 53.9 66.4 6943 71.9 2.4
LXHL-NWG8Еavg 2224.9 2885.2 3802.6 4974.1 6227.5K 58.06 67.75 63.32 63.22 1.7

Light & Engineering Vol. 18, No. 2
75
8. Technical Datasheet DS23 “LUXEON® Star“. URL: http://www.philipslumileds.com (Addressing date 01.02.2009).
9. Technical Datasheet DS46 “LUXEON® III Star”. http://www.philipslumileds.com (Addressing date 01.02.2009).
10. Ishimaru А. Propagation and scattering waves in randomly inhomogeneous mediums. 2 volumes. Vol. 1. – Translation from English. – Moscow: Mir, 1981. 281 p.
4. Rvachyov V.P. Introduction into biophysical pho-tometry. – Lvov: Publishing house of the Lvov Univer-sity, 1966. 378 p.
5. Tikhodeev P.M. Light measurements in lighting en-gineering. – 2 nd edition – Moscow – Leningrad: Gosen-ergoizdat, 1962.
6. Gurevich M.M. Photometry (theory, methods and devices). – 2 nd revised edition – Leningrad.: Energoat-omizdat, 1983. 272 p.
7. Sapozhnikov P.A. Theoretical photometry. – 3 rd re-vised edition – Мoscow: Energiya, 1977. 264 p.
Table 5. An example of designed average illuminance Еavg (lx) and of illuminance distribution irregularity coeffi cient K ( %) over the operation surface (OS) at a real (full) radiation of a spherical
diffuse illuminator with LED at various distances between light centers of the LEDs and OS Н (mm)
Type LED Н 10 20 40
LXHL-LW3 CЕavg 22686 22640 22861K 6.86 2.39 1.78
LXHL-NWNG8Еavg 6300.6 6227.5 6213.5K 1.7 1.7 1.57
Table 6. An example of designed average illuminance Eavg� (lx) and of illuminance distribution irregularity coeffi cient K– (per cent) over the operation surface (OS) at a real (full) radiation
of a spherical diffuse illuminator with LED minus direct radiation of LED infl uence, at various distances between light centers of LEDs and OS Н (mm)
Type of LED Н 10 20 40
LXHL-LW3 CEavg − 20017 19954 19512
K– 1.5 1.52 1.53
LXHL-NWNG8Eavg − 6300.6 6227.5 6213.5
K– 1.7 1.7 1.57
Yury A. Anokhin, Ph.D. In 1967 he is graduated from the Leningrad University (Physics Department). At present time he is senior lecturer of the Federal State Educational Institution of Additional Vocational Training St.-Petersburg Power Institute of Improvement of Professional Skill
Alexander F. Peregudov, Ph.D. In 1976 graduated from the Ryazan Radio and Engineering Institute. The Prorector of the St.-Petersburg University of Cinema and TV on scientifi c and innovative activities
76
Light & Engineering SvetotekhnikaVol. 18, No. 2, pp. 76-82, 2010 No. 5, 2009, pp. 67-71
In large-scale international airports with high in-tensity of air traffi c, two and more runways are fre-quently used, which increases throughput of an air-fi eld, and positively infl uences safety and regularity of the fl ights.
Examples of such airports are most European air-ports, including Borispol airport (Ukraine).
Modern ALSs contain thousands of various elec-trotechnical and lighting elements, devices and sys-tems which are distributed over an area of several tens of hectares and are the most expensive facilities of fl ight safety for civil aircraft airfi elds. The total cost of the ALSs of I – III classes reaches millions of euros without considering annual operational and electric power cost. The high cost of the light-signal equipment is the main problem in replacing out-of-date equipment with new modern facilities for many Ukrainian, Russian and other European airports. The problem becomes more signifi cant when equipping two and more runways with light-signal facilities.
ANALYSIS OF RESEARCH AND PUBLICATIONS
The analysis of the international standard doc-uments on visual support of fl ights is an evidence of the possibility to simplify confi guration of sepa-rate subsystems of air fi eld fi res for up-to-date ALSs, and it is confi rmed by the conclusion given in ICAO documents: “Imitation fl ight tests have unambigu-ously shown that number of fi res forming a system confi guration, can be considerably reduced without essential deterioration its operational characteris-tics”, p. 16.6.4, [1].
ABSTRACT
The main provisions of the concept of light-sig-nal fl ight support at an airfi eld with two runways are considered. The fact of mutual redundancy of two runways forms the basis of the concept for fl ying under complex weather conditions.
Keywords: concept, light-signal support of fl ights, airfi eld, two runways, ICAO
PROBLEM STATEMENT
The primary goal of the light-signal system of an airfi eld (ALS) is providing an aircraft pilot with in-formation on its location in space, namely, about direction to the runway axis, about the distance to the runway and about an optimum glide path (at the landing approach). The light-signal system is used by the pilot at the most complex and responsible stage of a fl ight: visual piloting at the landing ap-proach and landing from the decision-making alti-tude to taxiing to a halt, as well as during aircraft take-off. It is an unique source of visual information for an aircraft pilot.
Correct operation of the ALS is a guarantee of an acceptable level of fl ight safety at civil aviation air-fi elds provided the aircraft crew operates correctly and ground and onboard fl ight safety systems oper-ate effi ciently.
Every runway is intended for aircraft fl ight safe-ty under simple and complex weather conditions should be equipped with light-signal facilities.
A CONCEPT OF LIGHT-SIGNAL SUPPORT OF FLIGHTS
AT AIRFIELDS WITH TWO RUNWAYS*
Svetlana S. Devyatkina
The National Aircraft University, Kiev, Ukraine E-mail: [email protected]
* Translated in English by G.G. Gorelov

Light & Engineering Vol. 18, No. 2
77
landing approach when using ALSs with a reduced number of air fi eld fi res, various failures of the on-board equipment were simulated, including engine failure. However when doing so, expert pilots also characterised the simplifi ed ALS as "suffi cient" for normal landing approach and landing itself.
An analysis of designing ALS for airfi eld with two runways was carried out in [4] and [5]. The composition, structure and confi guration of ALS for airfi elds with two runways were analysed.
The main principles and possibilities of reducing the number of air fi eld fi res and cable lines in some ALS subsystems have been formulated.
This article is dedicated to a new concept of light-signal support at airfi elds with two and more run-ways with due regard for mutual redundancy of the latter ones.
THE CONCEPT OF LIGHT-SIGNAL SUPPORT OF FLIGHTS AT AIRFIELDS WITH TWO RUNWAYS
The proposed concept means a scientific ap-proach to the solution of this problem, in which mu-tual redundancy of two and more runways equipped with light-signal facilities should be taken into con-sideration, and ICAO standards and recommenda-tions on use of simplifi ed confi gurations of separate ALS subsystems are realised. Redundancy of two runways is a possibility to use ALSs installed on them for securing the stage of visual piloting at day and night time in complex meteoro-logical condi-tions. The most practical is a version of reduced re-dundancy, because it is technologi-cally acceptable and economic.
Normally at airfields with two runways, one runway is basic, and another is redundant. In this
The last versions of ICAO standards and recom-mendations [1, 2] give examples of simplifi ed con-fi gurations of different classes of ALSs. Use of sim-plifi ed confi gurations is permitted provided an ALS service system secures a standard level of reliabili-ty indicators for the subsystems with the simplifi ed confi guration and provided the correspondent confi r-mation of this fact takes place [1, p. 16.6.5].
ICAO standards [2, p. 1.2.28] do not simply per-mit but also recommend the application of simplifi ed confi gurations of air fi eld fi res: “The information volume perceived by a pilot from a comparatively short general fi re system confi guration when ap-proaching to it and observing it at a high fl ight speed under low visibility conditions, is strongly limited. As a pilot has no more than several seconds to see visual facilities and accordingly react to them at a low visibility, simplifi ca-tion of the system confi g-uration in addition to its standardization is con-sidered to be ex-tremely important”.
The analysis of scientifi c publications in the fl ight light-signal support sphere shows that the problem of the light-signal equipment decrease is urgent not only for developing countries but also for large Eu-ropean states. This problem was already consid-ered in 2000 by UK specialists, who proposed some measures on ALS cost reduction. The conclusions presented in [3] confi rm this fact. The aim of the pro-posed measures is simplifi cation of some subsystems of air fi eld fi res on reten-tion of an acceptable fl ight safety level. The conclusions of the UK research are based on the tests performed with the participation of expert pilots of different classes using training simulators and in real fl ight conditions. All the pilots described ALSs with reduced number of fi res in cer-tain subsys-tems as "suffi cient" to receive necessary visual information. Besides, simultaneously with
Fig. 1. Light-signal systems of an airfi eld with approach fi res in accordance with the Culvert version (standard confi gura-tions) of I (a) and ІІ (b) classes

Light & Engineering Vol. 18, No. 2
78
The above is a necessary but insuffi cient condi-tion for light-signal system supporting an acceptable level of fl ight safety.
A light-signal system should have suffi cient time stability of all technical data which determine its ability to perform necessary functions. In this case the ALS is only capable of providing an acceptable level of fl ight safety. Thus one can say that the suf-fi cient condition for ALS to provide an acceptable fl ight safety level is a certain level of its reliability, i.e. correspondence of the reliability indicators to the standard values. This is also confi rmed by ICAO standard [1, p. 17.3.5]: “Confi rmation of a system working capacity degree should become an integral part of any project”.
The necessity of reliability indicators determin-ing for ALS subsystem and for ALS as a whole is in addition confi rmed in new ICAO standards, in which application of a simplifi ed confi guration of air fi eld fi res is permitted and recommended, and the number of fi res in separate subsystems can be less than in standard ones.
Implementation of the simplifi ed confi gurations of air fi eld fi res is only permitted under the condi-tion that the ALS service system supports indicators of their reliability during fl ights. ICAO document [2] regulates failure criteria of separate ALS subsys-tems but unfortunately there are no standard levels of their reliability indicators there, and this makes a real implementation of the simplifi ed confi gura-tion of air fi eld fi res practically impossible. The fact of determining ALS reliability indicators at the de-sign step in itself does not give information on the safety level of aircraft fl ights at the stage of visual piloting. One should perform rationing reliability in-dicators of ALS separate subsystems and ALS as a whole, proceeding from the principle of their infl u-
case ALS on the main runway operates in the rated mode, and the second one works in a reduced, so-called standby mode provided for all ALS equipment of foreign production (Thorn, Honeywell, Idman etc. companies.)
When operating two runways, an ALS of ІІ (III) class is installed on each from one landing direction, and an ALS of І class – from another landing direc-tion, which ensures aircraft landing and take-off at an acceptable level of safety provided ALSs are de-signed to a certain degree of quality.
It is said in [4] that generally ALS quality means their suitability degree for the solution of the for-mulated problem, i.e. forming a light-signal picture which secures visual contact of an aircraft crew and its subsequent keeping during the whole stage of vis-ual piloting. Thus, one can say that ALS quality is its light-signal information value, that is ability to cre-ate such a light-signal picture which provides relia-ble visual contact of the crew with ground reference points under the corre-spondent weather conditions.
The ALS light-signal information value is regu-lated by ICAO standards [1] and by require-ments “4 С”:
1. According to air fi eld fi res luminous intensity (Candle).
2. According to air fi eld fi res chromatic charac-teristics (Colour).
3. According to confi guration of the fi res location over an airfi eld (Confi guration).
4. According to the area of suffi cient distribution of air fi eld fi res luminous intensity (Coverage).
Depending on the class, ALSs should meet all standard requirements which are formulated in ICAO standards [2] according to the “4 С” re-quirements. Therefore ALS design is to be carried out in strictly defi ned limits.
Fig. 2. Light-signal systems of an airfi eld with approach fi res in accordance with the Culvert version (simplifi ed confi gura-tions) of I (a) and ІІ (b) classes

Light & Engineering Vol. 18, No. 2
79
3. Application of a simplified configuration in subsystems of runway axial fires and landing area runway fi res.
4. Non-availability of an automatic control sys-tem of air fi eld fi res technical state in all subsystems provided that visual control of the state of air fi eld fi res is carried out daily. In order to provide comfort-able conditions for the attendants, the system of air fi eld fi res automatic control can be used in each ca-ble line with indication of disabled fi res number.
5. Use of only one cable line in the electrical sup-ply systems of all subsystems of the runway air fi eld fi res and approach fi res.
Application of this concept is possible, if all list-ed below is available:
1. Scientifically reasonable failure criteria of complex topological light-signal system and their separate subsystems.
2. Determination technique of ALS and its sub-systems reliability indicators.
3. Standard values of reliability indicators for ALS subsystems.
4. Technique of determination and evaluation of ALS and its subsystem reliability indicators in-fl uence on safety level of aircraft fl ights at the stage of visual piloting.
The main provisions of this concept can be ana-lysed by considering of three versions of ALS equip-
ence on the safety level of aircraft fl ights at the vis-ual piloting stage under the correspondent weather conditions.
Availability of standard indicators of ALS sub-system reliability will allow evaluating infl uence of the reliability indicators determined at the ALS design stage on the aircraft fl ight safety level, se-lecting elements of the light-signal equipment cor-respondent to the air fi eld fi res subsystem confi gu-ration, forming structure of their electrical supply, proving the necessity of using systems of automatic control and selecting strategy of ALS maintenance service and repair. Based on the calculations of ALS and its subsystems reliability indicators which are planned for equipping an airfi eld with two runways, evaluations of reliability indicators influence on the fl ight safety level of an airfi eld with two run-ways presented in [4–6], will allow to formulate the main provisions of the concept of light-signal sup-port for fl ights at airfi elds with two runways as fol-lows (Fig. 1):
1. Application of a simplifi ed confi guration in the subsystem of approach fi res of the central row with fi ve light horizons on a site of 900–720 m length from the runway end face (Culvert’s version).
2. Application of a simplifi ed confi guration in the subsystem of approach fi res of the side rows on a site of 300 m length from the runway end face.
Table 1. І class ALS composition of standard and simplifi ed confi guration
№ Subsystem nameNumber of air fi eld fi res,
piecesNumber of cable lines,
pieces
Standard Simplifi ed Standard Simplifi ed
1 Subsystem of approach fi res of the central row (Culvert’s version) 60 30 2 1
2 Subsystem of light horizons (Culvert’s version) 60 50 2 1
Table 2. II class ALS composition of standard and simplifi ed confi gurations
№ Subsystem nameNumber of air fi eld fi res,
piecesNumber of cable lines,
pieces
Standard Simplifi ed Standard Simplifi ed
1 Subsystem of approach fi res of the central row (Culvert’s version) 90 30 2 1
2 Subsystem of light horizons (Culvert’s version) 60 50 2 1
3 Subsystem of approach fi res of the side rows 58 24 2 1
4 Subsystem of the landing area runway fi res 180 90 2 1
5 Subsystem of the runway axial fi res 200 100 2 1

Light & Engineering Vol. 18, No. 2
80
to install the standard ALS confi guration of І and ІІ classes on the both runways. The confi gurations are normalised by ICAO standards and recommen-dations [1, 2]. An modern ALS consists of some number of subsystems, and each shows a separate runway site. Altogether ALS subsystems form a light-signal picture guiding an aircraft pilot dur-ing visual piloting. To form an “ideal” light picture, which remains in the memory of the pilot, a light-signal system must meet the “4 С” requirements for-mulated in [1].
Standard documents regulate subsystem compo-sition, their confi guration (i.e. certain location lay-out on the airfi eld) and structure. The document [1, part 5] contains a requirement concerning the struc-ture: “the system should be designed so that at a fail-
ping for each of two runways (ALS of the “fi res of high intensity” – HIF type ІІ and I) [4]:
1. Standard confi gurations of ALS for both run-ways (Fig. 1).
2. Standard ALS confi guration for runwa y -1 and ALS simplifi ed confi guration for runway-2.
3. Simplifi ed confi guration of ALS for both run-ways (Fig. 2).
We will ground the composition, configura-tion and structure of electrical supply of ALS sub-systems for each version, estimate approximate economic benefi t of using the simplifi ed confi gu-rations and estimate ALS infl uence on the fl ight safety level.
The fi rst equipment version is for both runways of 3000 m length and of 60 m width. It is possible
Table 3. A list of elements of standard and simplifi ed* ALS subsystems confi gurations.
№ Element name Cost of unit, €
NumberStandar d Simplifi ed
Total cost, eurosStandardSimplifi ed
ALS of І class
1 Air fi eld fi res, elevated type, pieces 200 12080
2400016000
2 Insulating transformers, pieces 180 12080
2160014400
3 Cable, m 2.5 50002500
125006250
4 Automated control system 15000050000 1 150000
50000
In total f or ALS of І class:Standard
Simplifi ed
20810086650
ALS of ІІ class
1 Air fi eld fi res, of elevated type, pieces 200 208104
4160020800
2 Insulating transformers, pieces 180 588294
10584052920
3 Cable, m 2,5 2000010000
5000025000
4 Air fi eld fi res of deepened type, pieces 600 380190
228000114000
5 Automated control system 200000100000 1 200000
100000
In total for ALS of IІ class:Standard
Simplifi ed
625440312720
* The data concerning simplifi ed confi gurations, are presented in fractions denominators.

Light & Engineering Vol. 18, No. 2
81
gle cable line remained in effi cient state, will give a pilot suffi cient visual information. This fact is con-fi rmed by the ICAO research results: “Ability of a pilot to process information can sharply decrease in case input information does not correspond to the expected one and is ambiguous or inexact. In this situation the pilot can make an erroneous decision and continue landing approach, though the real con-ditions demand go-around procedure” [1, p. 1.2.33]. Thus use of two cable lines in ALS electrical supply structure with simplifi ed confi guration only reduces reliability of the subsystem, and use of one cable line only is correct.
The composition of І and ІІ class ALS with sim-plified configuration (Fig. 2) is shown in Tables 1 and 2 (columns “simplifi ed”).
To calculate the cost of an ALS equipped in ac-cordance with the second version, we will use Table 3.
Approximate total cost of the compared ALS sub-systems and control systems for the second version (a standard confi guration for one runway and simpli-fi ed – for another) adds up to €1.233 million.
Let’s consider the third version: ALS of І and ІІ classes with simplifi ed confi gurations (Fig. 2) are installed on both runways. The composition of sub-systems and elements of the І and ІІ classes ALS are given in Table 1 and 2 (columns “simplifi ed”), and the data concerning cost of elements of the ALS subsystems – in Table 3.
Total cost of the light-signal equipment of both runways for the third version makes €798.74 thousand
So the economic benefi t of І and ІІ class ALS with simplifi ed confi guration use on one runway is €434 thousand, and when using ALS simplifi ed confi gurations on both runways, the economic ben-efi t is about €868 thousand.
Indicators of І and ІІ class ALS and its subsys-tems reliability with due regard for failure criteria, which are proposed by ICAO [2] and scientifi cally grounded by the author, confi rm that an ALS de-signed according to the ICAO standard and recom-mendation requirements using elements of leading supplier companies of light-signal equipment (Hon-eywell, Eltodo, Siemens, Philips (Idman), etc.), will ensure acceptable levels of fl ight safety at the visu-al piloting stage under the conditions of operational minima of I and ІІ class airfi elds.
An analysis of the calculation results [4] has also shown that even without control systems recom-
ure of electrical supply of air fi eld fi res cable line, the subsystem confi guration remained undamaged, even though the distance between air fi eld fi res in-creases twice”. Thus the electrical supply subsystem of each ALS subsystem should at least include two cable lines. A possibility of ALS subsystems remote control should be provided for.
So, taking into consideration the abovementioned requirements, we will reduce composition of stand-ard ALS confi guration of І and ІІ classes (Fig. 1) into Tables 1 and 2 (column “Standard”). In the Ta-bles only those subsystems subject to simplifi cation are given.
When determining the approximate econom-ic benefi t using simplifi ed confi gurations, we will only compare those subsystems which are subject to simplifi cation.
To calculate the cost of the compared subsystems of one runway, we will form Table 3 which presentss basic elements of ALS subsystems and their approxi-mate prices in euros (column “Standard”).
Thus the total cost of compared ALS subsys-tems and control systems for the first version (a standard confi guration of both runways) adds up to €1.667 million.
Now let’s consider the second version: an ALS of І and ІІ class is installed with the simplifi ed con-fi guration on one runway (Fig. 2), and on the sec-ond runway – an ALS with the standard confi gura-tion (Fig. 1).
Simplifi cation of the confi guration concerns ALS subsystems according to p. 1–5 of the described con-cept of fl ight light-signal support at airfi elds with two runways (Fig. 2):
An analysis of electrical supply structure of vari-ous ALS subsystems [4] has shown that the require-ment to use at least two cable lines is outdated, be-cause its aim is redundancy of the cable being most reliable elements of the light-signal equipment. A failure of the power high-voltage ALS cable is a gradual failure, i.e. probability of the “breakage” type failure of a cable can be brought down almost to zero through correct and timely actions of the at-tendants. To provide an additional guarantee of ALS subsystem effi cient state, one can use a redundant lu-minance regulator for several subsystems as modern luminance regulators are adapted for switching sev-eral cable lines. Besides, a failure of one cable line of ALS subsystem leads to failure of 50 % of fi res, which is unacceptable and is considered subsystem failure. Therefore one should not consider that a sin-
Light & Engineering Vol. 18, No. 2
82
manufacturer companies are practical when equip-ping one or two runway-airfi elds with light-signal equipment.
5. An analysis shows that best ratio of light-signal system quality and its cost is reached in cases when simplifi ed confi guration of air fi eld fi res is used on both runways.
REFERENCES
1. Manual on design of airfi elds. Part 4. Visual fa-cilities., Part 5. Electric systems. The 4 th edition. – 2004. Doc. 9157, AN/901.
2. Airfi elds. Appendix14 to the Convention on the International Civil Aircraft of 2 vol. / Edition 4, July 2004. – Vol. 1: Design and operation of airfi elds.
3. Smith, E. J. Researches shows less costly light-ing systems can meet safety and operational require-ments // ICAO Journal. – 1998. – Vol. 53, № 8.
4. Devyatkina S. Design of light-signal systems for airfi elds of civil aircraft with two runways // Vis-nik of TAU. – 2007. – № 10. – pp. 89–91.
5. Devyatkina S. Composition, structure and con-fi guration for airfi elds of civil aircraft with two run-ways // Visnik of TAU. – 2008. – № 11. – pp. 79–83.
6. Devyatkina S. Reliability analysis of mod-ernized light-signal systems for airfields of civ-il aircraft // Materials of the ІVth IST conference „АVІА-2002”. – Vol. 2. – Kiev.: NAU, 2002. – pp. 23.87–23.90.
mended by ICAO, such light-signal systems between two planned visual checks (12–18 hours) secure an acceptable level of fl ight safety. Use of automat-ic control system for air fi eld fi res with indication of disabled fi res numbers only (without determin-ing their location) is only practical for usability of attendants, that reduces ALS cost approximately by 30 %.
CONCLUSIONS
1. In ICAO standards and recommendations, use of simplifi ed confi gurations of І and ІІ class light-signal system subsystems is permitted and unam-biguously recommended provided normalised levels of their reliability are secured.
2. Application of the simplifi ed confi gurations of І and ІІ class light-signal systems subsystem is es-pecially urgent for airfi elds with two and more run-ways as it allows lowering initial capital investments when acquisition of light-signal systems and obtain-ing economic benefi t due to decrease of costs for their maintenance service during operation.
3. Approximate economic benefi t which can be obtained due to use of І and ІІ class light-signal sys-tems with simplifi ed confi guration for both runways makes €200–500 thousand (ignoring annual opera-tional costs).
4. Simplifi ed confi guration of І and ІІ class light-signal systems with equipment of leading world
Svetlana S. Devyatkina, Ph.D., graduated from the Kiev International University of Civil Aircraft in 2000.At present time she is asenior lecturer of the Chair of Electrical Engineering and Light Engineering of the Institute of Electronics and Control Systems of National Aircraft University. Orientation of scientifi c activity is visual ground aero navigation facilities of fl ight light-signal support at airfi elds of civil aircraft

83
Light & Engineering SvetotekhnikaVol. 18, No. 2, pp. 83-98, 2010 No. 2, 2010, pp. 13-20
time to reach their nominal fl ux. Finally, the meas-urements did not show any correlation between the lamp price and their quality.
Keywords: CFL, stabilisation time, run-up time, colour
2. INTRODUCTION
In the context of global warming and limita-tion of fossil fuel energy resources, energy used for general lighting applications has become a major concern.
Lighting consumption ranged between 6 % and 18 % of the total electricity consumption in dwell-ings for the EU-15 members and this fi g. tends to be higher in the new EU Member States [1]. Indeed, the lighting consumption in the enlarged EU-27 was around 95 TWh per year in 2004 [1].
Ineffi cient incandescent bulbs are still widely used in dwellings while compact fl uorescent lamps (CFL) can replace them effi ciently. According to Bertoldi, the cost-effective saving potential of at least 12.6 TWh per year could be captured in the en-larged EU-27 and aggressive policies could further increase the CFL use in dwellings, leading to a sav-ing of 18.7 TWh per year.
Compact fl uorescent lamps are of two types. The compact fl uorescent lamps best known by end-users are screw-based compact fl uorescent lamps (also called integrally ballasted fluorescent lamps, in-
1. ABSTRACT
The saving potential of electrical energy for lighting in housing is very high. With the fi rst phase of the European regulation on the production and sale of non-effective incandescent lamps having just come into effect, it appears that the use of compact fl uorescent lamps (CFL) becomes an important top-ic. For that reason, this paper lists the major barriers to the spread of compact fl uorescent lamps in hous-ing and analyses four of them. 16 compact fl uores-cent lamps were measured in a laboratory in order to study their warm-up time, their colour shift during warm-up, the impact of their position on their lumi-nous fl ux and their light output equivalent, in com-parison to two incandescent lamps. Measurements show that information given on the lamp package is incomplete and inaccurate. The 1:5 rule, current-ly applied by European manufacturers in order to calculate the power of a CFL replacing an incan-descent lamp, is inappropriate. A ratio of 1:4 would be better. While it has been observed that the po-sition of the lamp base has an impact of the lamp effi cacy, it was impossible to predict which posi-tion is best. The run-up time of compact fl uorescent lamp can be long and depends on the shape of the lamp. The lamp colour modifi cation during run-up is visible and can be a barrier to the use of compact fl uorescent lamps. Tube CFLs should be favored as they have a higher luminous effi cacy and take less
PERFORMANCES OF COMPACT FLUORESCENT LAMPS
WITH INTEGRATED BALLASTS AND COMPARISON
WITH INCANDESCENT LAMPS
Magali Bodart 1, Benoit Roisin 1, Peter D’Herdt 2, Arno Keppens 3, Peter Hanselaer3, Wouter R. Ryckaert 3, and Deneyer G. Arnaud 2
1 Université catholique de Louvain (UCL), Architecture. Dept., Belgium.2 Belgian Building Research Institute (BBRI), Department of Acoustics, Energy and Climate, Belgium.
3 Catholic University College Ghent, Light and Lighting Laboratory, BelgiumEmail: [email protected]

Light & Engineering Vol. 18, No. 2
84
Another reason could be that CFLs’ output is typi-cally measured with their base up and that modify-ing the position of the lamp could have a large im-pact on its fl ux [7]. Moreover, the lumen output de-preciation is higher for CFL than for incandescent lamps, which can exacerbate this effect if the lamp is not chosen properly [1]. Finally, the colour ren-dering index (Ra) of CFLs is not as high as the one of incandescent lamps. Typical values range from 82 to 86, which is appropriate for most applica-tions but may be a barrier to the spread out of CFLs in housing [1, 3].
• CFLs experience an aesthetic barrier due to their shape, size and colour temperature [1, 3, 4, 5, 6, 8, 9]. Moreover, there is a lack of dedicated and well-designed luminaires [4, 5, 10].
• CFL needs too much time to warm up [6, 5, 8, 10, 11, 12].
• Even if Specialty CFLs (lamps that can accept a high number of on/off cycles, lamps that can re-place spot incandescent or halogen lamps) appear gradually on the market, the customer either re-mains uninformed about that or does not accept the prohibitive cost for these lamps [1, 3, 5, 9, 10]. One characteristic of incandescent lamps which is high-ly appreciated is that they are dimmable. Dimma-ble CFLs have been developed recently but are still very expensive.
• CFLs of low quality, which blemish the im-age of compact fl uorescent lamps, are largely avail-able in stores but are still more expensive than incandescent lamps [4, 5, 10]. FLs of old gener-ation were almost unable to offer acceptable am-biance solutions [10] and customers are not aware of the progress and advantages of new-generation CFLs [3].
• CFLs are sensitive to voltage fl uctuations [10] and ambient temperature [12], and have a low pow-er factor [4].
• The mercury used in CFL is extremely toxic; therefore an important risk of environmental dam-age exists if they are not properly recycled at end of life [12].
• Some people are waiting incandescent bulbs to turn out or are storing incandescent lamps [5]. Consumers opt to avoid changing habits especially when conditions such as energy prices are stable [3]. Crucially, many consumers are concerned that new lamps will lack performance and reliability. Espe-cially in the case of CFL, early equipment was inad-equate and bad reports quickly dispersed [3].
tegrated compact fluorescent lamps, self-ballast-ed compact fl uorescent lamps or ballast-integrated compact fl uorescent lamps). These discharge lamps have been designed to substitute incandescent lamps in the same luminaires. The control gears necessary to their operation (ballast and starters) are integrat-ed into the base of these lamps. The second type of compact fl uorescent lamps is pin-based compact fl uorescent lamps. These lamps do not include the ballast which is separated from the lamp and fi xed in the luminaire itself. This luminaire should be spe-cially designed to host CFLs. Although less used in dwellings, these types of luminaires are much more interesting as the lamps can be replaced with-out replacing the ballast, which generally has a long-er lifespan and a higher effi cacy than the lamp, and as it does not allow users to turn back to ineffi cient incandescent lamps.
At the moment, screw-based CFLs seem to be the ideal solution for decreasing lighting consump-tions in dwellings, as they permit a direct replace-ment of incandescent lamps. Moreover, in European countries, consumers are forced to make the switch to energy effi cient lighting due to the phasing out of incandescent lamps [2]. However, the penetration of CFLs in housing is still very low [1, 3]. In 2006, the number of CFL per household has been evalu-ated in Europe. It ranged from 0.2 in Romania and Estonia to 6.5 in Germany [1]. Expressed in percent-age of lamp, that means that only 2 % of the lamps are CFL in Romania, while this fi g. reaches 20 % in Germany [1].
Therefore, it is important to highlight the barri-ers to the penetration of CFLs and to evaluate if and how these barriers can be overcome.
In the literature, the following barriers have been emphasised:
• According to [1] and [3], the continuing lack of awareness of possible energy savings and the high purchase price of CFLs are still the key factors ex-plaining the slow penetration of CFLs on the market. Kofod gives the same reasons and Rasmussen fi nds that the high price is the second factor preventing the increasing of CFLs use [4, 5]. This initial cost was also stated as a barrier by Figueiro et al [1].
• Consumers report that they have the feeling that CFL do not give good lighting [1, 3, 4, 6]. This perception is a consequence of the fact that the lu-men output of the CFL is lower than that of the replaced incandescent lamp, when following the current 1:5 rule given by the lamp manufacturers.
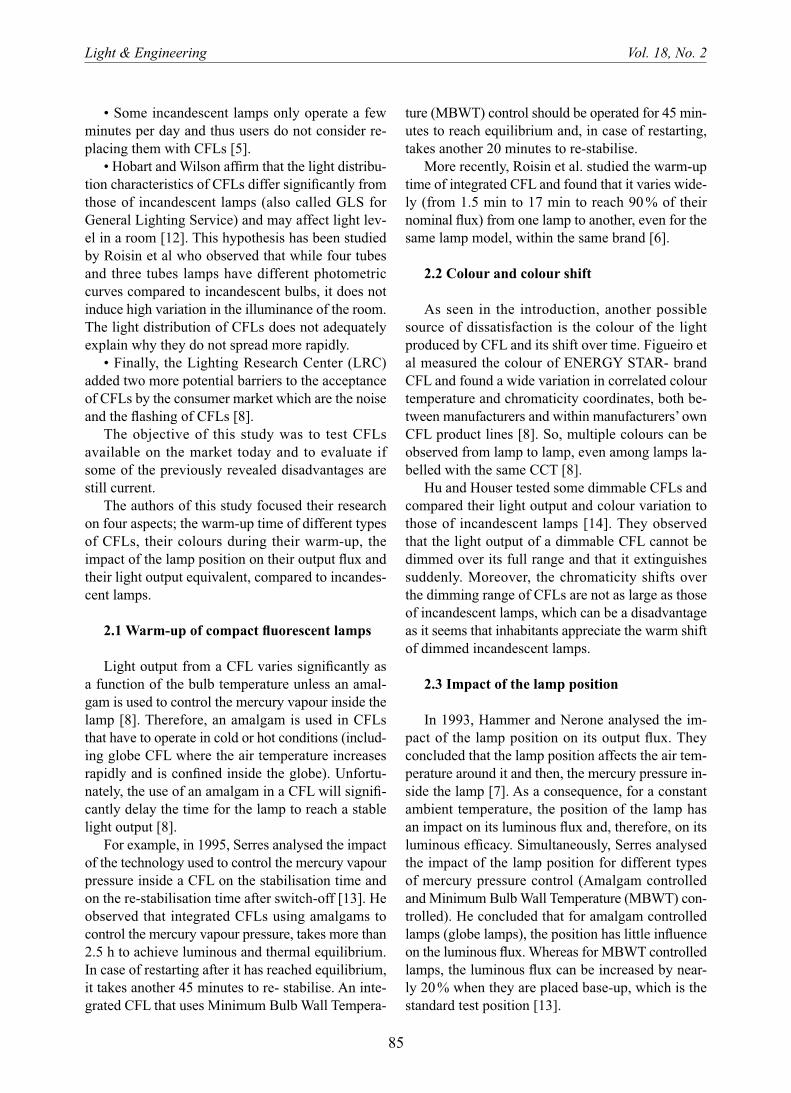
Light & Engineering Vol. 18, No. 2
85
ture (MBWT) control should be operated for 45 min-utes to reach equilibrium and, in case of restarting, takes another 20 minutes to re-stabilise.
More recently, Roisin et al. studied the warm-up time of integrated CFL and found that it varies wide-ly (from 1.5 min to 17 min to reach 90 % of their nominal fl ux) from one lamp to another, even for the same lamp model, within the same brand [6].
2.2 Colour and colour shift
As seen in the introduction, another possible source of dissatisfaction is the colour of the light produced by CFL and its shift over time. Figueiro et al measured the colour of ENERGY STAR- brand CFL and found a wide variation in correlated colour temperature and chromaticity coordinates, both be-tween manufacturers and within manufacturers’ own CFL product lines [8]. So, multiple colours can be observed from lamp to lamp, even among lamps la-belled with the same CCT [8].
Hu and Houser tested some dimmable CFLs and compared their light output and colour variation to those of incandescent lamps [14]. They observed that the light output of a dimmable CFL cannot be dimmed over its full range and that it extinguishes suddenly. Moreover, the chromaticity shifts over the dimming range of CFLs are not as large as those of incandescent lamps, which can be a disadvantage as it seems that inhabitants appreciate the warm shift of dimmed incandescent lamps.
2.3 Impact of the lamp position
In 1993, Hammer and Nerone analysed the im-pact of the lamp position on its output fl ux. They concluded that the lamp position affects the air tem-perature around it and then, the mercury pressure in-side the lamp [7]. As a consequence, for a constant ambient temperature, the position of the lamp has an impact on its luminous fl ux and, therefore, on its luminous effi cacy. Simultaneously, Serres analysed the impact of the lamp position for different types of mercury pressure control (Amalgam controlled and Minimum Bulb Wall Temperature (MBWT) con-trolled). He concluded that for amalgam controlled lamps (globe lamps), the position has little infl uence on the luminous fl ux. Whereas for MBWT controlled lamps, the luminous fl ux can be increased by near-ly 20 % when they are placed base-up, which is the standard test position [13].
• Some incandescent lamps only operate a few minutes per day and thus users do not consider re-placing them with CFLs [5].
• Hobart and Wilson affi rm that the light distribu-tion characteristics of CFLs differ signifi cantly from those of incandescent lamps (also called GLS for General Lighting Service) and may affect light lev-el in a room [12]. This hypothesis has been studied by Roisin et al who observed that while four tubes and three tubes lamps have different photometric curves compared to incandescent bulbs, it does not induce high variation in the illuminance of the room. The light distribution of CFLs does not adequately explain why they do not spread more rapidly.
• Finally, the Lighting Research Center (LRC) added two more potential barriers to the acceptance of CFLs by the consumer market which are the noise and the fl ashing of CFLs [8].
The objective of this study was to test CFLs available on the market today and to evaluate if some of the previously revealed disadvantages are still current.
The authors of this study focused their research on four aspects; the warm-up time of different types of CFLs, their colours during their warm-up, the impact of the lamp position on their output fl ux and their light output equivalent, compared to incandes-cent lamps.
2.1 Warm-up of compact fl uorescent lamps
Light output from a CFL varies signifi cantly as a function of the bulb temperature unless an amal-gam is used to control the mercury vapour inside the lamp [8]. Therefore, an amalgam is used in CFLs that have to operate in cold or hot conditions (includ-ing globe CFL where the air temperature increases rapidly and is confi ned inside the globe). Unfortu-nately, the use of an amalgam in a CFL will signifi -cantly delay the time for the lamp to reach a stable light output [8].
For example, in 1995, Serres analysed the impact of the technology used to control the mercury vapour pressure inside a CFL on the stabilisation time and on the re-stabilisation time after switch-off [13]. He observed that integrated CFLs using amalgams to control the mercury vapour pressure, takes more than 2.5 h to achieve luminous and thermal equilibrium. In case of restarting after it has reached equilibrium, it takes another 45 minutes to re- stabilise. An inte-grated CFL that uses Minimum Bulb Wall Tempera-
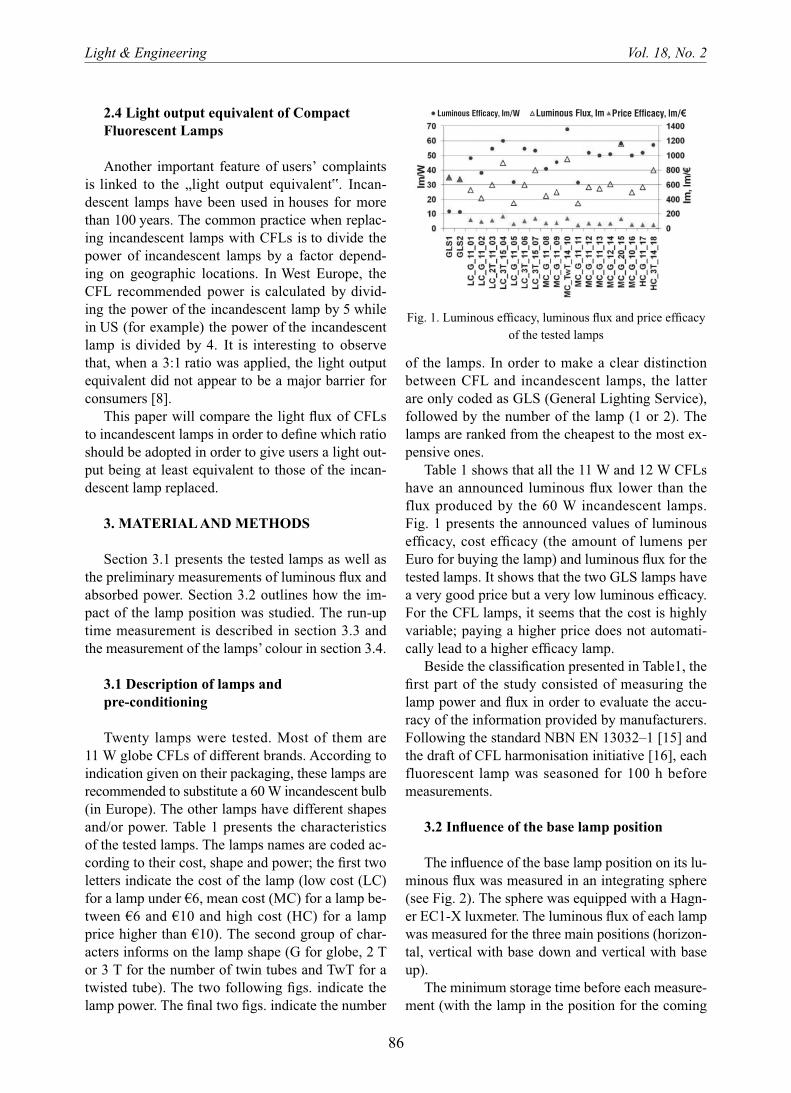
Light & Engineering Vol. 18, No. 2
86
2.4 Light output equivalent of Compact Fluorescent Lamps
Another important feature of users’ complaints is linked to the „light output equivalent‟. Incan-descent lamps have been used in houses for more than 100 years. The common practice when replac-ing incandescent lamps with CFLs is to divide the power of incandescent lamps by a factor depend-ing on geographic locations. In West Europe, the CFL recommended power is calculated by divid-ing the power of the incandescent lamp by 5 while in US (for example) the power of the incandescent lamp is divided by 4. It is interesting to observe that, when a 3:1 ratio was applied, the light output equivalent did not appear to be a major barrier for consumers [8].
This paper will compare the light fl ux of CFLs to incandescent lamps in order to defi ne which ratio should be adopted in order to give users a light out-put being at least equivalent to those of the incan-descent lamp replaced.
3. MATERIAL AND METHODS
Section 3.1 presents the tested lamps as well as the preliminary measurements of luminous fl ux and absorbed power. Section 3.2 outlines how the im-pact of the lamp position was studied. The run-up time measurement is described in section 3.3 and the measurement of the lamps’ colour in section 3.4.
3.1 Description of lamps and pre-conditioning
Twenty lamps were tested. Most of them are 11 W globe CFLs of different brands. According to indication given on their packaging, these lamps are recommended to substitute a 60 W incandescent bulb (in Europe). The other lamps have different shapes and/or power. Table 1 presents the characteristics of the tested lamps. The lamps names are coded ac-cording to their cost, shape and power; the fi rst two letters indicate the cost of the lamp (low cost (LC) for a lamp under €6, mean cost (MC) for a lamp be-tween €6 and €10 and high cost (HC) for a lamp price higher than €10). The second group of char-acters informs on the lamp shape (G for globe, 2 T or 3 T for the number of twin tubes and TwT for a twisted tube). The two following fi gs. indicate the lamp power. The fi nal two fi gs. indicate the number
of the lamps. In order to make a clear distinction between CFL and incandescent lamps, the latter are only coded as GLS (General Lighting Service), followed by the number of the lamp (1 or 2). The lamps are ranked from the cheapest to the most ex-pensive ones.
Table 1 shows that all the 11 W and 12 W CFLs have an announced luminous fl ux lower than the flux produced by the 60 W incandescent lamps. Fig. 1 presents the announced values of luminous effi cacy, cost effi cacy (the amount of lumens per Euro for buying the lamp) and luminous fl ux for the tested lamps. It shows that the two GLS lamps have a very good price but a very low luminous effi cacy. For the CFL lamps, it seems that the cost is highly variable; paying a higher price does not automati-cally lead to a higher effi cacy lamp.
Beside the classifi cation presented in Table1, the fi rst part of the study consisted of measuring the lamp power and fl ux in order to evaluate the accu-racy of the information provided by manufacturers. Following the standard NBN EN 13032–1 [15] and the draft of CFL harmonisation initiative [16], each fluorescent lamp was seasoned for 100 h before measurements.
3.2 Infl uence of the base lamp position
The infl uence of the base lamp position on its lu-minous fl ux was measured in an integrating sphere (see Fig. 2). The sphere was equipped with a Hagn-er EC1-X luxmeter. The luminous fl ux of each lamp was measured for the three main positions (horizon-tal, vertical with base down and vertical with base up).
The minimum storage time before each measure-ment (with the lamp in the position for the coming
Fig. 1. Luminous effi cacy, luminous fl ux and price effi cacy of the tested lamps

Light & Engineering Vol. 18, No. 2
87
nal luminous fl ux after switch-on. This delay is char-acterised by the run-up time.
By definition, the run-up time is “the period in minutes from when the supply voltage to the lamp is switched on, to the point at which the lamp reach-es 80 % of its fi nal luminous fl ux (fi nal luminous fl ux is defi ned as the point when variation in lumi-nous fl ux is less than 2 % per minute)” [16]. The In-ternational CFL harmonisation initiative proposes
test) was set to one day, and the fl ux measurement was performed one hour after the lamp switch-on in order to allow the lamp to stabilise before the measurements.
3.3 Run-up time measurement
In contrast with incandescent lamps, compact fl u-orescent lamps need some time to reach their nomi-
Table 1. Tested lamps; announced power, fl ux and colour temperature, cost, calculated luminous effi cacy, and calculated cost effi cacy
Denomination Power,W
Flux,lm
CCT,K
Cost,€
Calculatedluminous effi cacy,
lm/W
Calculatedcost effi cacy,
lm/€
GLS1 60 700 2700 1.00 11.7 700.0
GLS2 60 675 2700 1.00 11.3 675.0
LC_G_11_01 11 530 2700 4.50 48.2 117.9
LC_G_11_02 11 420 2700 4.50 38.2 93.3
LC_2 T_11_03 11 600 2700 5.45 54.5 110.1
LC_3 T_15_04 15 900 4000 5.45 60.0 165.1
LC_G_11_05 11 350 2700 5.70 31.8 61.4
LC_3 T_11_06 11 600 2700 5.99 54.5 100.2
LC_3 T_15_07 15 800 2700 5.99 53.3 133.6
MC_G_11_08 11 450 2700 6.29 40.9 71.5
MC_G_11_09 11 500 2700 6.60 45.5 75.8
MC_TwT_14_10 14 950 2700 6.99 67.9 135.9
MC_G_11_11 11 347 2700 7.75 31.5 44.8
MC_G_11_12 11 570 2700 8.19 51.8 69.6
MC_G_11_13 11 550 2700 8.90 50.0 61.8
MC_G_12_14 12 610 2700 8.99 50.8 67.9
MC_G_20_15 20 1160 2700 8.99 58.0 129.0
MC_G_10_16 10 500 2700 9.76 50.0 51.2
HC_G_11_17 11 570 2700 11.49 51.8 49.6
HC_3 T_14_18 14 800 2700 16.81 57.1 47.6
Fig. 2. Measurement of the infl uence of the lamp base position. (a) horizontal, (b) base down, (c) base up

Light & Engineering Vol. 18, No. 2
88
• First cycle: 1 h30 on, • Second cycle: 5 min off / 1 h30 on, • Third cycle: 15 min off / 1 h30 on, • Fourth cycle: 30 min off / 1 h30 on, • Fifth cycle: 1 h off / 1 h30 on. The aim of the preconditioning phase was to
eliminate any infl uence of the lamp handling on the results.
The fi rst cycle is called the “cold start cycle” (the lamp is cold before being switched on), the second cycle is the “hot start cycle” (the lamp is supposedly warm before being switched on). The other three cy-cles should allow investigating the infl uence of the lamp cooling time.
During test phase, the illuminance was recorded every 5 seconds and the power, voltage and current every 3 seconds.
3.4 Colour measurements
In contrast with an incandescent lamp, a CFL needs some time to reach a stable colour. This colour shift is another important factor that may discourage the customer from replacing an incandescent lamp with a CFL.
To quantify the colour shift, spectral measure-ments were performed. The ability to discrimi-nate colours was predicted using Mac Adam el-lipses [17]. These ellipses are contours which were defi ned by Mac Adam around some chosen colours, specified by their chromaticity coordinates [18]. These contours can be seen as the boundaries for which a given percentage of people may or may not observe a difference between two colours, one col-our with chromatic coordinates in the centre of the contour and another colour with chromatic coordi-nates on the contour. Because distances in the CIE x, y-chromatic diagram do not correlate well with the perceived magnitudes of colour differences, the contours are ellipses
99.44 % of the general, colour-normal population would notice a colour difference between a point at the boundary of the 3-step ellipse with the centre point (for the 1- and 2-step MacAdam ellipse these percentages are 68 % and 95 % respectively, corre-sponding with the standard deviations of the normal distribution).
In a uniform colour system, the contours would appear as circles (with equal radii). Therefore, the MacAddam ellipses can be transformed (see section 4.5) to a more uniform colour system, the u’v’ CIE
to perform the run-up measurement during 20 min-utes [16]. If the fl ux is not stabilised within these 20 minutes, the run-up time is then defi ned as the time needed to reach the 80 % of the luminous fl ux of the lamp after 20 minutes. This method leads to different results as those obtained taking into ac-count the defi nition of the stabilisation fl ux given by [15]. Indeed, in the EN 13032–1, the luminous fl ux is considered as being stabilised if the varia-tion of the fl ux within 1 minute is less than 1 % [15].
For our measurements, the second criterion was followed in order to specify the stabilised luminous fl ux.
The time needed to reach the stable luminous fl ux is called the “stabilisation time”. The stabilisation curves show for some lamps a lower constant lumi-nous fl ux for more than one minute before reaching the true equilibrium. We have taken into account this phenomenon in order to obtain the true stabilisation time. This effect is discussed more in detail in sec-tion 4.3.
The run-up time was measured in the BBRI light-ing laboratory. The illuminance provided by the lamp was measured by a fi xed illuminance meter placed 1 m above the lamp on an axis centered on the lamp (ballast not included), facing down and ver-tically oriented (see Fig. 3).
lamps were tested base down after being stored in the same position at least one day before measurements [16].
The lamp power, current and voltage were meas-ured during the whole test phase using a Voltech PM 100.
As one of the measurement’s objectives was to determine if the lamp temperature had an infl uence on the run-up time, the lamps were all tested follow-ing a well-determined switch on/ switch off scheme described here below:
• Preconditioning phase: 6 h on / 6 h off,
Fig. 3. Run-up time measurement
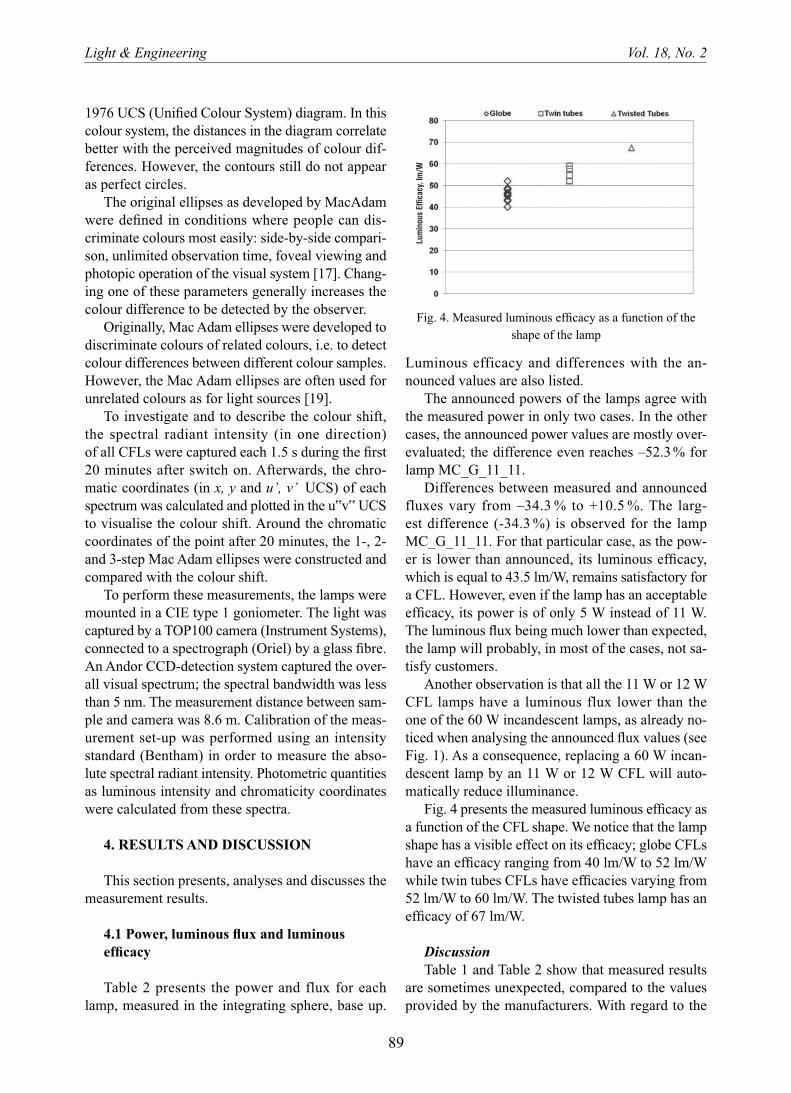
Light & Engineering Vol. 18, No. 2
89
Luminous efficacy and differences with the an-nounced values are also listed.
The announced powers of the lamps agree with the measured power in only two cases. In the other cases, the announced power values are mostly over-evaluated; the difference even reaches –52.3 % for lamp MC_G_11_11.
Differences between measured and announced fluxes vary from –34.3 % to +10.5 %. The larg-est difference (-34.3 %) is observed for the lamp MC_G_11_11. For that particular case, as the pow-er is lower than announced, its luminous effi cacy, which is equal to 43.5 lm/W, remains satisfactory for a CFL. However, even if the lamp has an acceptable effi cacy, its power is of only 5 W instead of 11 W. The luminous fl ux being much lower than expected, the lamp will probably, in most of the cases, not sa-tisfy customers.
Another observation is that all the 11 W or 12 W CFL lamps have a luminous flux lower than the one of the 60 W incandescent lamps, as already no-ticed when analysing the announced fl ux values (see Fig. 1). As a consequence, replacing a 60 W incan-descent lamp by an 11 W or 12 W CFL will auto-matically reduce illuminance.
Fig. 4 presents the measured luminous effi cacy as a function of the CFL shape. We notice that the lamp shape has a visible effect on its effi cacy; globe CFLs have an effi cacy ranging from 40 lm/W to 52 lm/W while twin tubes CFLs have effi cacies varying from 52 lm/W to 60 lm/W. The twisted tubes lamp has an effi cacy of 67 lm/W.
DiscussionTable 1 and Table 2 show that measured results
are sometimes unexpected, compared to the values provided by the manufacturers. With regard to the
1976 UCS (Unifi ed Colour System) diagram. In this colour system, the distances in the diagram correlate better with the perceived magnitudes of colour dif-ferences. However, the contours still do not appear as perfect circles.
The original ellipses as developed by MacAdam were defi ned in conditions where people can dis-criminate colours most easily: side-by-side compari-son, unlimited observation time, foveal viewing and photopic operation of the visual system [17]. Chang-ing one of these parameters generally increases the colour difference to be detected by the observer.
Originally, Mac Adam ellipses were developed to discriminate colours of related colours, i.e. to detect colour differences between different colour samples. However, the Mac Adam ellipses are often used for unrelated colours as for light sources [19].
To investigate and to describe the colour shift, the spectral radiant intensity (in one direction) of all CFLs were captured each 1.5 s during the fi rst 20 minutes after switch on. Afterwards, the chro-matic coordinates (in x, y and u’, v’ UCS) of each spectrum was calculated and plotted in the u‟v‟ UCS to visualise the colour shift. Around the chromatic coordinates of the point after 20 minutes, the 1-, 2- and 3-step Mac Adam ellipses were constructed and compared with the colour shift.
To perform these measurements, the lamps were mounted in a CIE type 1 goniometer. The light was captured by a TOP100 camera (Instrument Systems), connected to a spectrograph (Oriel) by a glass fi bre. An Andor CCD-detection system captured the over-all visual spectrum; the spectral bandwidth was less than 5 nm. The measurement distance between sam-ple and camera was 8.6 m. Calibration of the meas-urement set-up was performed using an intensity standard (Bentham) in order to measure the abso-lute spectral radiant intensity. Photometric quantities as luminous intensity and chromaticity coordinates were calculated from these spectra.
4. RESULTS AND DISCUSSION
This section presents, analyses and discusses the measurement results.
4.1 Power, luminous fl ux and luminous effi cacy
Table 2 presents the power and flux for each lamp, measured in the integrating sphere, base up.
Fig. 4. Measured luminous effi cacy as a function of the shape of the lamp

Light & Engineering Vol. 18, No. 2
90
As already mentioned, the luminous fl ux (an-nounced fl ux as well as measured fl ux) of all the CFLs having a power lower or equal to 12 W is be-low the luminous flux of the 60 W incandescent lamps. The difference ranges from about 10 % to more than 50 %. We conclude that the “equivalent in-candescent wattage” announced by the manufactur-ers on their lamp package is not appropriate and that advice given by lamp manufacturers will automati-cally induce a decrease of the average illuminance in a room. As already stated by other experts, a ratio of 1:4 would be more appropriate when replacing an incandescent lamp with a CFL [1].
This advice is consistent with the Ecodesign di-rective which requires that manufacturers advise a minimum light fl ux of 741 lm for the replacement of a 60 W incandescent lamp by a CFL [20]. Fol-lowing this rule, the only tested CFL that could re-place a 60 W incandescent lamps are lamps number 3 and 7 (15 W), lamp 10 (14 W – twisted) and lamp 15 (20 W). Measurements also show that the twisted
power, the differences between the two kinds of val-ue were high (up to 52 %). Large differences also ap-pear (even though reduced – up to 34 %) when com-paring the luminous fl ux and as a consequence, the luminous effi cacy of the lamps. One possible rea-son explaining this difference between announced and measured values is that we did not use a stabi-lised power source during our measurements (justi-fi ed by the fact that we wished to measure the lamps in real household use conditions).
However, the voltage measurement during the tests shows that it remained close to the recommend-ed 230 V (less than 2 % of mean difference and less than 3.5 % of maximal difference). So the difference in the supply voltage cannot explain single-handedly the power and luminous fl ux differences.
Another explanation could be that we only test-ed one lamp of each sort. Differences probably exist among different lamps of the same model. A more extensive measurement campaign should be per-formed in order to test this assumption.
Table 2. Measured power, luminous fl ux and luminous effi cacy and differences with the announced values
Lamp Power, W Δ P [-] Flux, lm ΔΦ [-] Effi cacy, lm/W Δ E [-]
GLS1 56.0 -6.7 % 630.3 -10.0 % 11.3 -3.5 %
GLS2 56.0 -6.7 % 587.7 -12.9 % 10.5 -6.7 %
LC_G_11_01 10.5 -4.5 % 421.5 -20.5 % 40.1 -16.7 %
LC_G_11_02 10.0 -9.1 % 452.4 7.7 % 45.2 18.5 %
LC_2 T_11_03 10.8 -2.3 % 560.7 -6.6 % 52.2 -4.4 %
LC_3 T_15_04 14.0 -6.7 % 765.6 -14.9 % 54.7 -8.9 %
LC_G_11_05 9.0 -18.2 % 386.7 10.5 % 43.0 35.0 %
LC_3 T_11_06 11.0 0.0 % 572.3 -4.6 % 52.0 -4.6 %
LC_3 T_15_07 13.0 -13.3 % 750.1 -6.2 % 57.7 8.2 %
MC_G_11_08 9.0 -18.2 % 433.1 -3.8 % 48.1 17.6 %
MC_G_11_09 10.0 -9.1 % 487.2 -2.6 % 48.7 7.2 %
MC_TwT_14_10 14.0 0.0 % 943.5 -0.7 % 67.4 -0.7 %
MC_G_11_11 5.3 -52.3 % 228.1 -34.3 % 43.5 37.8 %
MC_G_11_12 11.0 0.0 % 572.3 0.4 % 52.0 0.4 %
MC_G_11_13 10.0 -9.1 % 483.3 -12.1 % 48.3 -3.3 %
MC_G_12_14 12.0 0.0 % 560.7 -8.1 % 46.7 -8.1 %
MC_G_20_15 20.5 2.5 % 889.3 -23.3 % 43.4 -25.2 %
MC_G_10_16 9.5 -5.0 % 433.1 -13.4 % 45.6 -8.8 %
HC_G_11_17 11,5 4.5 % 529.7 -7.1 % 46.1 -11.1 %
HC_3 T_14_18 12,5 -10.7 % 738.5 -7.7 % 59.1 3.4 %

Light & Engineering Vol. 18, No. 2
91
We observe on Fig. 6 that the stabilisation time varies between 150 and 750 seconds when the lamp is cold and between 75 and 575 seconds when the lamps is warm. In general, cold lamps have a long-er stabilisation time than warm lamps (average sta-bilisation time of 337 seconds for cold lamps and of 177 seconds for warm lamps) but some lamps show an opposite behaviour (lamps 2, 4, 6, and 7).
Fig. 7 shows that the run-up time varies between 40 and 430 seconds when the lamp is cold and be-
CFLs we tested had the highest luminous effi cacy and that CFLs with tube have a better effi cacy than the CFLs with globe, (see Fig. 4).
Our hypothesis explaining this difference is that the lower effi cacy of globe lamps is, fi rst, due to light loss through the globe light transmission, which does not occur for tubes CFL. Secondly, it appears that the control of mercury vapour pressure typical-ly employed in globe CFLs is made by using amal-gam [21], in order to permit lamps to work over a wide range of ambient temperatures. Amalgam technology induces a lower light output than the use of bulb wall temperature control, which is the way used to control the vapour mercury pressure in non-globe CFLs [21]. However, this hypothesis was not verifi ed as it was impossible to get information from manufacturers about the way the vapour mercury is controlled in the tested CFLs.
As a conclusion of our observation, the use of twisted or tubes CFL should be favoured.
4.2 Effect of the base position on the luminous fl ux
Fig. 5 presents the fl ux differences for other base positions compared to the fl ux of the lamp in hori-zontal position.
DiscussionThe results show that the position of the lamp
can have a signifi cant impact on the lamp luminous fl ux. We noticed up to 20 % of luminous fl ux differ-ence between the horizontal and the base-up posi-tions (see Fig. 5). We observe that there is no gen-eral preferable position for the lamps. Some lamps are more effi cient when placed base up while oth-ers have higher effi cacy when placed horizontally or base down. Unlike Serre [21], we found that the lamp position has more impact on globe CFL than on other ones.
Apparently, there is no correlation between the lamp price and the impact of its base position on its luminous fl ux.
4.3 Stabilisation and run-up time
This section presents the results of stabilisation (Fig. 6) and run-up time measurements (Fig. 7). The impact of restarting a lamp which is still warm is also discussed. Results for the GLS lamps are not shown because the stabilisation is almost instantaneous.
Fig. 5. Difference in the luminous fl ux compared with the horizontal position
Fig. 6. Stabilisation time for the CFLs lamps
Fig. 7. Run-up time for the CFLs lamps

Light & Engineering Vol. 18, No. 2
92
run-up time for the globe lamps is spread from 45 to 440 seconds when the lamps are cold and from 5 to 60 seconds when they are hot. For the tubes lamps (twin tubes and twisted tubes), the difference is less pronounced.
DiscussionThe stabilisation time of CFLs can be very long
(up to more than 12 minutes for the tested lamps – see Fig. 6). Fortunately, the human eye is not sensi-tive to small light quantity variations. So the run-up time may prove to be a better indicator than the sta-bilisation time to characterise the human perception of the fl ux variation after switch-on. The average run-up time is 132 seconds for the tested CFLs while the average stabilisation time is equal to 337 seconds (see Fig. 7).
Fig. 7 and Fig. 8 show that restarting a lamp quite soon after having switched it off can drastically re-duce the run-up time. But if the lamp cools down for more than 15 minutes, the effect is insignifi cant and the lamp behaves as if it was cold. The shape of the lamp has an effect on the re-run-up time. Indeed, globe CFLs have a longer run-up time than twisted and twin tubes CFLs. We assume that the temper-ature in the globe takes a longer time to stabilise. However, when these lamps have been started once, they stay warm for a longer time than the twisted and twin tube lamps and so they restart quicker than the others (see Fig. 9). This observation strength-ens the observation made by Rea, and Yasuda, and Kando who showed that the temperature in the lamp has an impact on the different amalgams and thus on the mercury pressure inside the lamp [17, 22]. So, if during the off period the temperature is kept near the temperature of the switched-on lamp, the run-up time will be shorter. The run-up time of the lamps having naked tubes is really quick (less than 90 seconds) and the effect of restarting them when they are hot is not signifi cant compared to the globe lamps. In conclusion, the lamps with globe perform better than the tube lamps when only considering the restarting when warm. The lamp with twisted tube takes longer to start compared to the lamps with twin tubes and the positive effect of a hot start is even less noticeable.
4.4 Behaviour after switch-on
This section studies three different lamp behav-iours after switch-on for a cold start and a warm
tween 5 and 60 seconds when the lamp is warm. Ex-cept for the LC_G_11_02, the run- up time is shorter when the lamp is warm. For most of the lamps, the difference is very high (the run-up time decrease ranges from 30 % to 98 %).
Fig. 6 and Fig. 7 show that there is no correla-tion between the price and the stabilisation time or the run-up time. Expensive lamps do not reach their stabilised fl ux quicker than cheap lamps and the run-up time of the former is not lower than the one of the latter.
In order to compare the effect of the lamps cool-ing before switch on, the run-up time as well as their average (A) and standard deviation (σ) are presented in Fig. 8, for the tested cycles. We notice that there are no signifi cant changes between a cooling time of 6 h, 1 h and 30 minutes. The difference in run-up times appears between the 30 minutes and 15 min-utes cycles and is particularly visible between 15 and 5 minutes cycles.
Lastly, Fig. 9 presents the run-up time for the lamps grouped by shape for a cold start and a hot start (restart after 300 seconds). We can see that the
Fig. 9. Run-up time in function of the shape and the tem-perature of the lamp
Fig. 8. CFL run-up time after cooling for different cooling time

Light & Engineering Vol. 18, No. 2
93
count while determining the stabilisation time for compact fl uorescent lamps.
4.5 Colour shift during stabilisation
As explained in section 3.4, the colour of the light produced by CFLs may change during start-up. In order to quantify the colour shift, spectral measurements were performed each 1.5 s during twenty minutes after switching on the lamps (cold start). The spectral radiant intensity of each lamp was measured in the base up position for one direc-tion. Fig. 11 shows the spectral radiant intensity after 4.5 s and after 20 min for the LC_G_11_05.
The chromatic coordinates u', v' can be calculated from spectral curves, for each measurement.
The colour shift for the incandescent lamp (GLS1) and the LC_G_11_02 compact fl uorescent
lamp are plotted in Fig. 12 and Fig. 13. In these graphics, the time between two points is 60 s. The 1-, 2- and 3-step Mac Adam ellipses are plotted around the chromatic coordinates of the colour reached after
start. The illuminance measured by an illuminance meter placed at 1 m above the lamp (see section 3.3) is drawn in Fig. 10. The shapes of the stabili-sation curves can be compared. Indication of stabi-lisation and run-up time are marked on the curves by squares and circles, respectively. Fig. 10 shows that the MC_G_20_15 follows a different curve than the two other lamps. The lamp fl ux increases rapidly, then decreases and increases again until stabilisation. This lamp takes thus quite a long time to stabilise, as already observed on Fig. 6 and Fig. 7. Fig. 10 also shows that when the MC_G_11_11 lamp is warm, it stabilises very quickly.
DiscussionFig. 10 shows the behaviour of some lamps after
switch on and point out that the difference in the de-fi nition of stabilisation can lead to different stabilisa-tion time values. As a reminder, the European stan-dard EN13032–1 [15] considers that a lamp is stable if its fl ux varies less than 1 % during 1 minute while the International CFL Harmonisation Initiative [16] considers the variation of 2 % during the same time.
Fig. 10 presents the particular case of lamp HC_G_11_17 which reaches a constant level for more than a minute (at approximately 42 lx) be-fore increasing again up to a fi nal stabilised level of 48 lx. In accordance with the defi nition of the sta-bilisation in EN13032–1 [15], this lamp needs only 100 seconds to stabilize, whereas in reality it needs about 400 seconds. Considering EN13032–1, the sta-bilised level would be set to 42 lx instead of 48 lx and, in consequence, the run-up time would be equal to 5 s instead of 10 s. In our case, the run-up time is hardly infl uenced but as a consequence of this ob-servation, we take this kind of behaviour into ac-
Fig. 11. Spectral radiant intensity of CFL LC_G_11_05 af-ter 4,5 s (grey) and after 20 min (black)
Fig. 10. Switch on behaviour for three lamps for a cold and a hot start – stabilisation marked by squares and run-up
marked by circles
Fig. 12. Colour shift for an incandescent lamp (including the 1-,2-and 3-step Mac Adam ellipses)
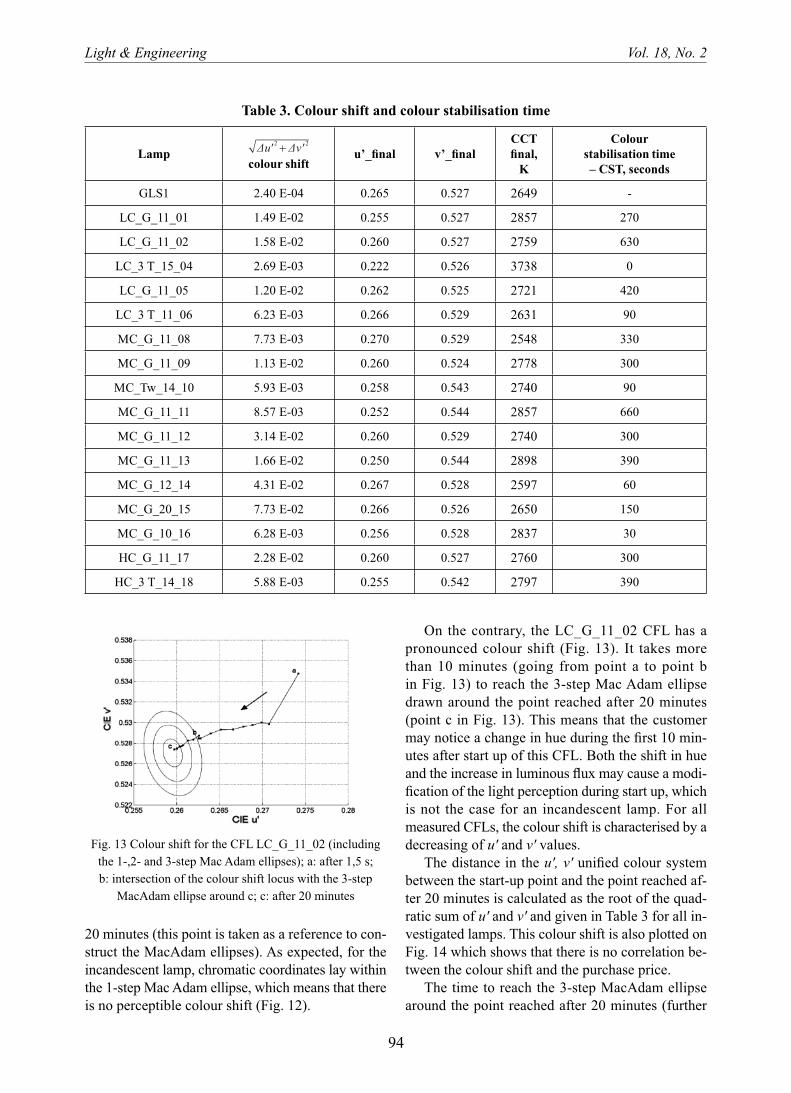
Light & Engineering Vol. 18, No. 2
94
On the contrary, the LC_G_11_02 CFL has a pronounced colour shift (Fig. 13). It takes more than 10 minutes (going from point a to point b in Fig. 13) to reach the 3-step Mac Adam ellipse drawn around the point reached after 20 minutes (point c in Fig. 13). This means that the customer may notice a change in hue during the fi rst 10 min-utes after start up of this CFL. Both the shift in hue and the increase in luminous fl ux may cause a modi-fi cation of the light perception during start up, which is not the case for an incandescent lamp. For all measured CFLs, the colour shift is characterised by a decreasing of u' and v' values.
The distance in the u', v' unifi ed colour system between the start-up point and the point reached af-ter 20 minutes is calculated as the root of the quad-ratic sum of u' and v' and given in Table 3 for all in-vestigated lamps. This colour shift is also plotted on Fig. 14 which shows that there is no correlation be-tween the colour shift and the purchase price.
The time to reach the 3-step MacAdam ellipse around the point reached after 20 minutes (further
20 minutes (this point is taken as a reference to con-struct the MacAdam ellipses). As expected, for the incandescent lamp, chromatic coordinates lay within the 1-step Mac Adam ellipse, which means that there is no perceptible colour shift (Fig. 12).
Table 3. Colour shift and colour stabilisation time
Lampcolour shift
u’_fi nal v’_fi nalCCTfi nal,
K
Colourstabilisation time– CST, seconds
GLS1 2.40 E-04 0.265 0.527 2649 -
LC_G_11_01 1.49 E-02 0.255 0.527 2857 270
LC_G_11_02 1.58 E-02 0.260 0.527 2759 630
LC_3 T_15_04 2.69 E-03 0.222 0.526 3738 0
LC_G_11_05 1.20 E-02 0.262 0.525 2721 420
LC_3 T_11_06 6.23 E-03 0.266 0.529 2631 90
MC_G_11_08 7.73 E-03 0.270 0.529 2548 330
MC_G_11_09 1.13 E-02 0.260 0.524 2778 300
MC_Tw_14_10 5.93 E-03 0.258 0.543 2740 90
MC_G_11_11 8.57 E-03 0.252 0.544 2857 660
MC_G_11_12 3.14 E-02 0.260 0.529 2740 300
MC_G_11_13 1.66 E-02 0.250 0.544 2898 390
MC_G_12_14 4.31 E-02 0.267 0.528 2597 60
MC_G_20_15 7.73 E-02 0.266 0.526 2650 150
MC_G_10_16 6.28 E-03 0.256 0.528 2837 30
HC_G_11_17 2.28 E-02 0.260 0.527 2760 300
HC_3 T_14_18 5.88 E-03 0.255 0.542 2797 390
Fig. 13 Colour shift for the CFL LC_G_11_02 (including the 1-,2- and 3-step Mac Adam ellipses); a: after 1,5 s; b: intersection of the colour shift locus with the 3-step
MacAdam ellipse around c; c: after 20 minutes
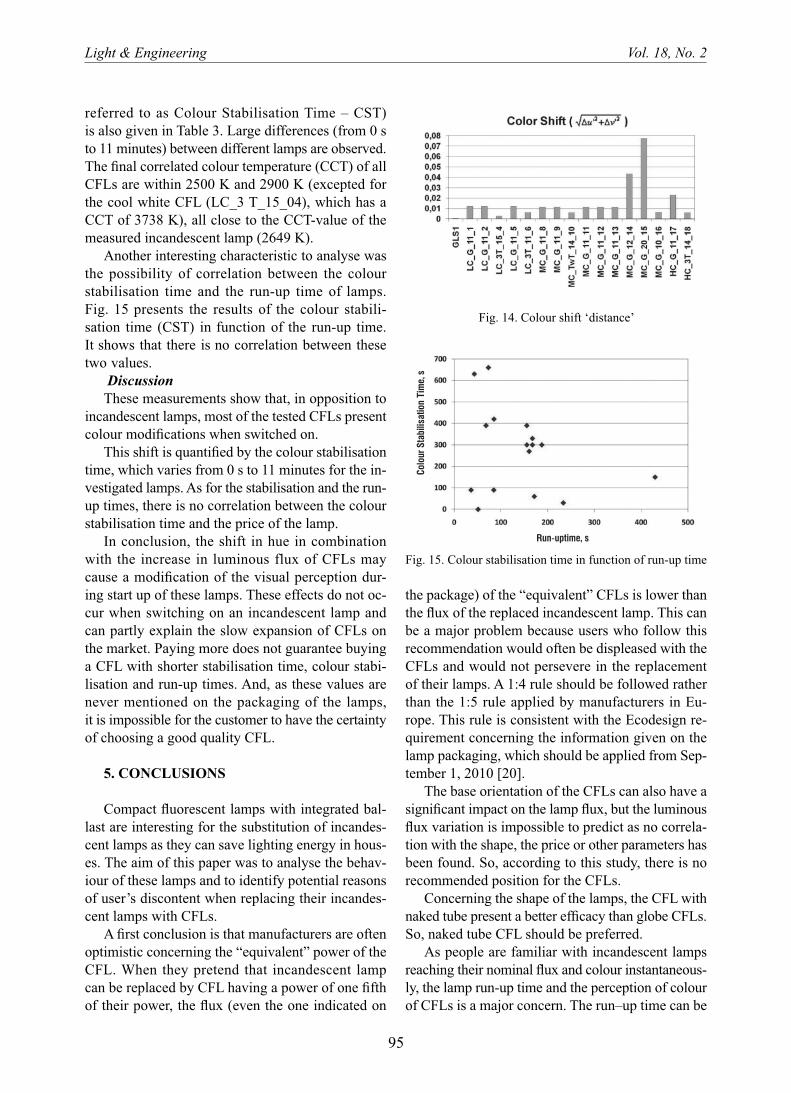
Light & Engineering Vol. 18, No. 2
95
the package) of the “equivalent” CFLs is lower than the fl ux of the replaced incandescent lamp. This can be a major problem because users who follow this recommendation would often be displeased with the CFLs and would not persevere in the replacement of their lamps. A 1:4 rule should be followed rather than the 1:5 rule applied by manufacturers in Eu-rope. This rule is consistent with the Ecodesign re-quirement concerning the information given on the lamp packaging, which should be applied from Sep-tember 1, 2010 [20].
The base orientation of the CFLs can also have a signifi cant impact on the lamp fl ux, but the luminous fl ux variation is impossible to predict as no correla-tion with the shape, the price or other parameters has been found. So, according to this study, there is no recommended position for the CFLs.
Concerning the shape of the lamps, the CFL with naked tube present a better effi cacy than globe CFLs. So, naked tube CFL should be preferred.
As people are familiar with incandescent lamps reaching their nominal fl ux and colour instantaneous-ly, the lamp run-up time and the perception of colour of CFLs is a major concern. The run–up time can be
referred to as Colour Stabilisation Time – CST) is also given in Table 3. Large differences (from 0 s to 11 minutes) between different lamps are observed. The fi nal correlated colour temperature (CCT) of all CFLs are within 2500 K and 2900 K (excepted for the cool white CFL (LC_3 T_15_04), which has a CCT of 3738 K), all close to the CCT-value of the measured incandescent lamp (2649 K).
Another interesting characteristic to analyse was the possibility of correlation between the colour stabilisation time and the run-up time of lamps. Fig. 15 presents the results of the colour stabili-sation time (CST) in function of the run-up time. It shows that there is no correlation between these two values.
DiscussionThese measurements show that, in opposition to
incandescent lamps, most of the tested CFLs present colour modifi cations when switched on.
This shift is quantifi ed by the colour stabilisation time, which varies from 0 s to 11 minutes for the in-vestigated lamps. As for the stabilisation and the run-up times, there is no correlation between the colour stabilisation time and the price of the lamp.
In conclusion, the shift in hue in combination with the increase in luminous flux of CFLs may cause a modifi cation of the visual perception dur-ing start up of these lamps. These effects do not oc-cur when switching on an incandescent lamp and can partly explain the slow expansion of CFLs on the market. Paying more does not guarantee buying a CFL with shorter stabilisation time, colour stabi-lisation and run-up times. And, as these values are never mentioned on the packaging of the lamps, it is impossible for the customer to have the certainty of choosing a good quality CFL.
5. CONCLUSIONS
Compact fl uorescent lamps with integrated bal-last are interesting for the substitution of incandes-cent lamps as they can save lighting energy in hous-es. The aim of this paper was to analyse the behav-iour of these lamps and to identify potential reasons of user’s discontent when replacing their incandes-cent lamps with CFLs.
A fi rst conclusion is that manufacturers are often optimistic concerning the “equivalent” power of the CFL. When they pretend that incandescent lamp can be replaced by CFL having a power of one fi fth of their power, the fl ux (even the one indicated on
Fig. 15. Colour stabilisation time in function of run-up time
Fig. 14. Colour shift ‘distance’

Light & Engineering Vol. 18, No. 2
96
5. Rasmussen T, Canseco J, Rubin R, Teja A. Are we done yet? An assessment of the remaining barriers to increasing compact fl uorescent lamp in-stallations and recommended program strategies for reducing them. Proceeding of the 2007 European Council for an energy Effi cient Economy (ECEEE 2007), pp. 1951–1958. 2007.
6. B. Roisin, M. Bodart, A. Deneyer and P. D‟Herdt, On the substitution of incandescent lamps by compact fl uorescent lamps: switch on behaviour and photometric distribution, Ingeneria Illuminatului 19, 2007, pp. 50–59.
7. E.E. Hammer, N. Nerone, Performance charac-teristics of an integrally ballasted 20-W Fluorescent quad lamp. Journal of the Illuminating Engineering Society 22 (2), 1993, pp.183- 190
8. Figueiro, Mariana, Jennifer Fullam, Conan O‟Rourke, Martin Overington, Mark Rea, and Jen-nifer Taylor, Increasing Market Acceptance of Com-pact Fluorescent Lamps (CFLs), Lighting Research Center, Rensselaer Polytechnic Institute, Troy, NY, Prepared for US Environmental Protection Agency, September 30, 2003.
9. Csuti P, Némethné Vidovszky A, Schanda J, On the application of modern light sources – with emphasis on home lighting. Light and Engineering 84 (8), 2008, pp. 84–88.
10. Zissis G, Ruscassié R, Aubès M. estimating the impact of labelling high quality compact fl uores-cent lamps on the energy consumption for lighting in the residential sector. Proceedings of the 2007 Eu-ropean Council for an Energy Effi cient Economy (ECEEE 2007), pp. 1169–1174, 2007.
11. Yasuda T, Kando M, Experimental Study on the mercury vapor pressure in amalgam-dosed dis-charge tubes for compact fl uorescent lamps during switch-off period. Journal of Light anv Visual envi-ronment, vol 32, 1, pp. 33–38. 2008.
12. Hobart C., Wilson M. Compact fl uorescent lightbulbs: an acceptability study. Proceedings of the 2 nd Palenc conference and the 28th AIVC confer-ence on Building Low Energy Cooling and advanced Ventilation Technologies in the 21st Century, Crete Island, Greece, pp. 426–430, 2007.
13. A.W. Serres, On the photometry of Integrated Compact Fluorescent Lamps. Journal of the Illumi-nating Engineering Society 24 (1), 1995, pp. 58–62
14. X. Hu and K.W. Houser, Spectral and electri-cal performance of screw-based dimmable compact fl uorescent lamps. Lighting Research & Technolo-gies 35 (4), 2003, pp. 331–342.
quite long and depends on the shape of the lamps. Globe CFLs take longer to start compared to CFLs with naked tubes. The study showed that restarting a lamp within 15 minutes after switch-off decreases the run-up time. The effect is more perceptible for lamps with globes. Between different CFLs, the col-our shift can be totally different. Herewith, the time to reach the 3-step Mac Adam ellipse around the sta-bilisation point (20 minutes after start-up) can be in-stantaneous or last more than 10 minutes.
During the whole study, a focus has been put on the impact of the price on the different lamp char-acteristics. The conclusion of this study is that there is no evidence that paying a higher price will guar-antee a lamp having better performances. A more ex-tensive study on several samples of the same lamp (type, brand, power, …) but bought in different plac-es and/or at different times might give more accurate conclusions on this point.
6. ACKNOWLEDGEMENT
Benoit Roisin, Arnaud Deneyer and Peter D’Herdt were supported by the “Region Wallonne”
and Magali Bodart was supported by the Fonds de la Recherche Scientifi que (FNRS).
Wouter Ryckaert, Arno Keppens and Peter Hanselaer wish to thank the Institute for the Pro-motion of Innovation by Science and Technology in Flanders (IWT-Vlaanderen) for fi nancial support („Groen Licht Vlaanderen‟ IWT 070488; „Licht en Kleur‟ IWT 080609).
7. REFERENCES
1. P. Bertoldi, B. Atanasiu, Characterisation of residential lighting consumption in the enlarged
European union and policies to save energy, In-ternational Journal of Green Energy, 5, pp. 15 –34, 2008.
2. Offi cial Journal of the European Union – Im-plementing Directive 2005/32/EC of the European Parliament and of the Council with regard to ecode-sign requirements for non-directional household lamps.
3. P. Waide, S. Tanishima, Light‟s Labour‟s Lost: Policies for Energy Effi cient Lighting, Paris:
OECD/IEA, 2006 4. Kofod C, Room for more energy savings,
Lamp in the home – use of lighting and barriers. Pro-ceedings of Right light 4, vol 2, pp. 195–198. 1997.

Light & Engineering Vol. 18, No. 2
97
ceeding of SPIE 5941, pp. 291–299, Bellingham, WA, USA.
20. European Commission, Commission regu-lation (EC) N°244/2009 of 18 March 2009, imple-menting directive 2005/32/EC of the European Par-liament and of the Council with regard to ecodesign requirements for non-directional household lamps. Offi cial Journal of the European Union.
21. A.W. Serres, A method to improve the per-formance of compact fluorescent lamps, Journal of the Illuminating Engineering Society 22 (2), 1993, pp. 40–48.
22. T. Yasuda and M. Kando, Improvement of the luminous run-up characteristics in ballast- integrat-ed compact fl uorescent lamps covered with outer globes. Leukos 4 (1), July 2007, pp. 57–70.
23. Wyszecki G., Stiles W S. 1982. Color Sci-ences: concepts and methods, quantitative data and formulae. 2 nd Edition. New York: John Wiley and sons.
15. IBN, NBN EN 13032–1: Light and lighting – Measurement and presentation of photometric data of lamps and luminaires – Part 1: Measurement and fi le format, IBN 1 st edition, October 2004.
16. International CFL Harmonisation Initiative, Draft IEC CFL Standard: Self-ballasted Compact Fluorescent Lamps – Methods for measuring the performance. Version 13, April 2006. www.apec-esis.org/cfl
17. M. S. Rea, The IESNA Lighting Handbook, ninth edition. The IESNA, New York, 2000. ISBN 0–87995–150–8
18. G. Wyszecki and W.S. Stiles, Color Science – Concepts and methods, quantitative data and for-mulae, John Wiley & Sons, Second edition, ISBN 0–471–02106–7, 1982.
19. M. Dyble, N. Narendran, A. Bierman and T. Klein, Impact of dimming white LEDs: Chromatic-ity shifts due to different dimming methods, Fifth international conference on solid state lighting, Pro-
Magali Bodart graduated as civil engineer in 1994 at the Université catholique de Louvain, Belgium (UCL). She obtained an Advanced Master in Architecture and Sustainable development in 1997 (EPFL) and her Ph. D. in 2002. Researcher in the team “Architecture et Climat” since 1994, she is currently Scientifi c Research Worker at FNRS and in charge of several projects in electric lighting and daylighting. She is also teaching lighting to civil engineers and architects students
Benoit Roisin graduated as electromechanical engineer at UCL in 2006. His master’s thesis focused on the lighting consumption in offi ces. Afterwards he worked during two years as a research assistant at UCL in the fi eld of effi cient lighting in dwellings. He is now employed at GEI, a private company specialized in Building Services
Peter D’Herdt graduates as electromechanical engineer at Ghent University in 2003. He works for the BBRI, division Climate, Installations and Energy Performance since 2004. His work focuses mainly on research and support in the fi eld of the global energy performance of buildings and more specifi cally on the energy impact of lighting installations (light sources, lighting control)

Light & Engineering Vol. 18, No. 2
98
Arno Keppens studied at Ghent University (Belgium). Graduated as a Master in Physics in 2006, he started a Ph.D. research project at the Light & Lighting Laboratory (Ghent, Belgium) on the integration of high power light-emitting diodes in general lighting. Today, this four-year project is still continued in cooperation with K.U.Leuven (Belgium) and fi ve major luminaire manufacturers
Peter Hanselaer was born in 1959 and received his Ph. D. in Physics at University of Gent (B) in 1986. Peter is professor at the Catholic University College St.-Lieven and associate professor at the university of Leuven. In 1997, he founded the Light&Lighting Laboratory specialized in spectral optical measurements. The main research areas are lighting, colour and appearance, optical design and photovoltaic energy. He is the Belgian delegate in the CIE, division1. Peter is teaching physical topics of the master courses lighting and opto-electronics
Wouter R. Ryckaert was born in Ghent, Belgium, in 1976. He received the M.Eng. degree in electrical engineering from KaHo Sint – Lieven, Ghent, in 1998, and the M.Sc. and Ph.D. degrees in electrical and mechanical engineering from Ghent University, Ghent, in 2001 and 2006, respectively. Currently, he is with the Light and Lighting Laboratory from the Catholic University College Ghent (KaHo Sint - Lieven). His research topics include energy effi cient lighting and luminance based design
Deneyer G. Arnaudwas born in Enghien, Belgium, in 1975. He received the M.Eng. degree in Architecture engineering from the Faculté Polytechnique, Mons, in 1998. Currently, he is head of the Light and Building Laboratory at the Belgian Building Research Institute (BBRI). His research topics include daylighting and energy effi cient lighting. He is involved in the CEN and CIE standardization bodies as vice-president of the Belgian Lighting Institute

99
Light & Engineering SvetotekhnikaVol. 18, No. 2, pp. 99-105, 2010 No. 3, 2010, pp. 50-55
to advancing and developing technology. A signifi -cant number of Turkey’s energy generation sources have been imported recently. Therefore, effi cient use of electrical energy would contribute to developing the national economy and reducing the level of de-pendence on other countries. Energy saving can be enhanced by using new lighting equipment technol-ogy and increasing research and development in the subject [1, 2]. Energy effi cient lighting equipment is an attractive means to save energy that can be ap-plied all over the world.
A number of recent studies have examined sav-ing lighting energy by using daylight as much as possible. Such systems use daylight to provide the required illumination levels and then use artifi cial lighting systems to supplement illumination levels when daylight is not suffi cient. Some studies ex-amined lighting energy savings [1], while others specialised in daylight performance, physical struc-ture, and building geometry or direction [3, 4, 5, 6]. Studies on daylight responsive systems indicate that accurate lighting systems reduce demand and consumption of electrical energy in offi ce build-ings [7, 8, 9] and that a total 30 % energy saving is possible [10].
As a result of these studies, a project entitled “Determination of Interior Lighting Energy Saving Potential for Sakarya Region”, fi nanced and support-ed by Sakarya University Engineering Faculty (since 2005) and the Scientifi c Research Projects Commis-sion (since 2007), has started. Electrical and climatic data used in this study was collected from the day-light responsive automated lighting control system that is arranged to obtain detailed information on
ABSTRACT
Energy saving approaches for interior lighting, especially for government and non-government of-fi ces, are signifi cant for every country around the world. As energy sources are rapidly depleting and greenhouse gas emissions increase, lighting ener-gy savings should be considered more seriously. A project entitled “Determination of Interior Light-ing Energy Saving Potential for Sakarya Region”, fi nanced and supported by Sakarya University En-gineering Faculty (since 2005) and the Scientifi c Research Projects Commission (since 2007), has started. Using electrical and climatic data collected from the daylight responsive automated lighting con-trol system constructed in 2008, detailed informa-tion regarding the real energy saving potential of an offi ce building is estimated. Approximately 36 % of the lighting energy used in the room over a peri-od of 6 months can be saved without taking climatic energy consumption into account. In
accordance with the results of the total energy consumption in the test room, a clear path may be drawn to determine and increase the real energy sav-ing potential.
Keywords: Lighting Energy Savings, Daylight Responsive Systems, Lighting Control, Energy Effi ciency
1. INTRODUCTION
Effi cient use and saving of electrical energy have become important worldwide because of inadequate energy sources and increasing energy demand due
DETERMINATION OF REAL ENERGY SAVING POTENTIAL OF DAYLIGHT
RESPONSIVE SYSTEMS: A CASE STUDY FROM TURKEY
Cenk Yavuz, Ertan Yanikoğlu, and Önder Güler
Sakarya University, Engineering Faculty, Elec.&Electronics Eng. Dept, Turkey E-mail: [email protected]
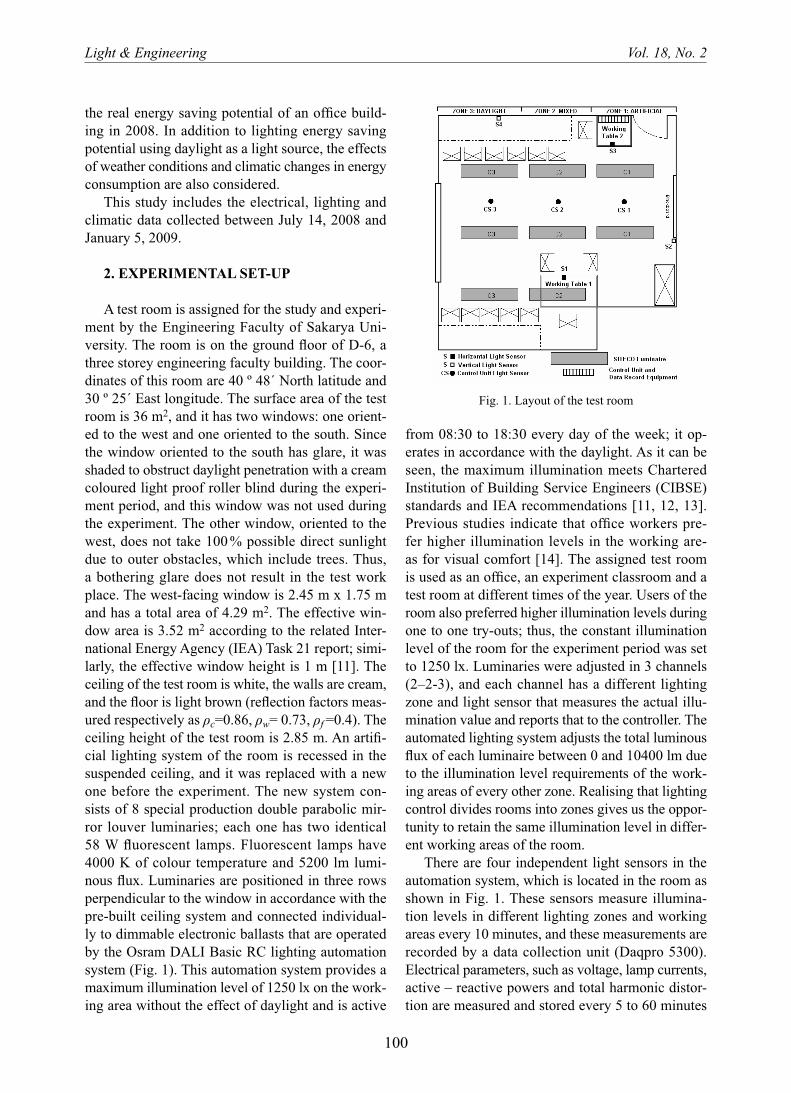
Light & Engineering Vol. 18, No. 2
100
from 08:30 to 18:30 every day of the week; it op-erates in accordance with the daylight. As it can be seen, the maximum illumination meets Chartered Institution of Building Service Engineers (CIBSE) standards and IEA recommendations [11, 12, 13]. Previous studies indicate that offi ce workers pre-fer higher illumination levels in the working are-as for visual comfort [14]. The assigned test room is used as an offi ce, an experiment classroom and a test room at different times of the year. Users of the room also preferred higher illumination levels during one to one try-outs; thus, the constant illumination level of the room for the experiment period was set to 1250 lx. Luminaries were adjusted in 3 channels (2–2-3), and each channel has a different lighting zone and light sensor that measures the actual illu-mination value and reports that to the controller. The automated lighting system adjusts the total luminous fl ux of each luminaire between 0 and 10400 lm due to the illumination level requirements of the work-ing areas of every other zone. Realising that lighting control divides rooms into zones gives us the oppor-tunity to retain the same illumination level in differ-ent working areas of the room.
There are four independent light sensors in the automation system, which is located in the room as shown in Fig. 1. These sensors measure illumina-tion levels in different lighting zones and working areas every 10 minutes, and these measurements are recorded by a data collection unit (Daqpro 5300). Electrical parameters, such as voltage, lamp currents, active – reactive powers and total harmonic distor-tion are measured and stored every 5 to 60 minutes
the real energy saving potential of an offi ce build-ing in 2008. In addition to lighting energy saving potential using daylight as a light source, the effects of weather conditions and climatic changes in energy consumption are also considered.
This study includes the electrical, lighting and climatic data collected between July 14, 2008 and January 5, 2009.
2. EXPERIMENTAL SET-UP
A test room is assigned for the study and experi-ment by the Engineering Faculty of Sakarya Uni-versity. The room is on the ground fl oor of D-6, a three storey engineering faculty building. The coor-dinates of this room are 40 º 48´ North latitude and 30 º 25´ East longitude. The surface area of the test room is 36 m2, and it has two windows: one orient-ed to the west and one oriented to the south. Since the window oriented to the south has glare, it was shaded to obstruct daylight penetration with a cream coloured light proof roller blind during the experi-ment period, and this window was not used during the experiment. The other window, oriented to the west, does not take 100 % possible direct sunlight due to outer obstacles, which include trees. Thus, a bothering glare does not result in the test work place. The west-facing window is 2.45 m x 1.75 m and has a total area of 4.29 m2. The effective win-dow area is 3.52 m2 according to the related Inter-national Energy Agency (IEA) Task 21 report; simi-larly, the effective window height is 1 m [11]. The ceiling of the test room is white, the walls are cream, and the fl oor is light brown (refl ection factors meas-ured respectively as ρc=0.86, ρw= 0.73, ρf =0.4). The ceiling height of the test room is 2.85 m. An artifi -cial lighting system of the room is recessed in the suspended ceiling, and it was replaced with a new one before the experiment. The new system con-sists of 8 special production double parabolic mir-ror louver luminaries; each one has two identical 58 W fl uorescent lamps. Fluorescent lamps have 4000 K of colour temperature and 5200 lm lumi-nous fl ux. Luminaries are positioned in three rows perpendicular to the window in accordance with the pre-built ceiling system and connected individual-ly to dimmable electronic ballasts that are operated by the Osram DALI Basic RC lighting automation system (Fig. 1). This automation system provides a maximum illumination level of 1250 lx on the work-ing area without the effect of daylight and is active
Fig. 1. Layout of the test room
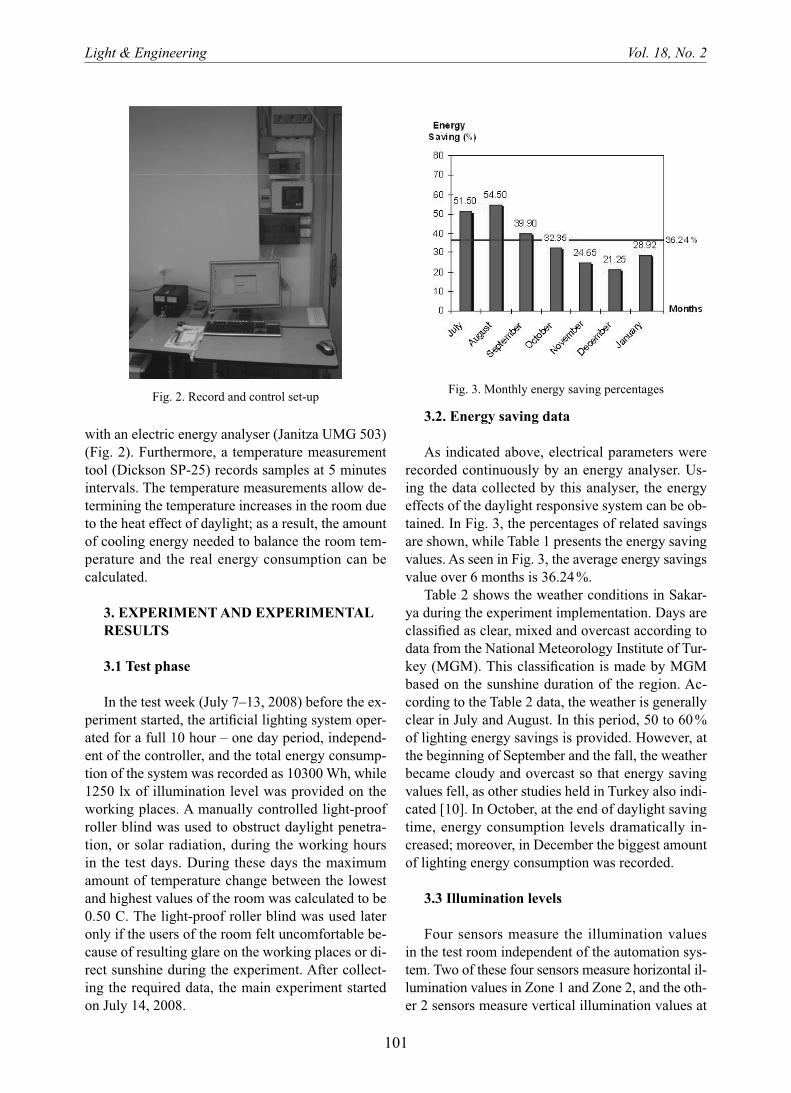
Light & Engineering Vol. 18, No. 2
101
3.2. Energy saving data
As indicated above, electrical parameters were recorded continuously by an energy analyser. Us-ing the data collected by this analyser, the energy effects of the daylight responsive system can be ob-tained. In Fig. 3, the percentages of related savings are shown, while Table 1 presents the energy saving values. As seen in Fig. 3, the average energy savings value over 6 months is 36.24 %.
Table 2 shows the weather conditions in Sakar-ya during the experiment implementation. Days are classifi ed as clear, mixed and overcast according to data from the National Meteorology Institute of Tur-key (MGM). This classifi cation is made by MGM based on the sunshine duration of the region. Ac-cording to the Table 2 data, the weather is generally clear in July and August. In this period, 50 to 60 % of lighting energy savings is provided. However, at the beginning of September and the fall, the weather became cloudy and overcast so that energy saving values fell, as other studies held in Turkey also indi-cated [10]. In October, at the end of daylight saving time, energy consumption levels dramatically in-creased; moreover, in December the biggest amount of lighting energy consumption was recorded.
3.3 Illumination levels
Four sensors measure the illumination values in the test room independent of the automation sys-tem. Two of these four sensors measure horizontal il-lumination values in Zone 1 and Zone 2, and the oth-er 2 sensors measure vertical illumination values at
with an electric energy analyser (Janitza UMG 503) (Fig. 2). Furthermore, a temperature measurement tool (Dickson SP-25) records samples at 5 minutes intervals. The temperature measurements allow de-termining the temperature increases in the room due to the heat effect of daylight; as a result, the amount of cooling energy needed to balance the room tem-perature and the real energy consumption can be calculated.
3. EXPERIMENT AND EXPERIMENTAL RESULTS
3.1 Test phase
In the test week (July 7–13, 2008) before the ex-periment started, the artifi cial lighting system oper-ated for a full 10 hour – one day period, independ-ent of the controller, and the total energy consump-tion of the system was recorded as 10300 Wh, while 1250 lx of illumination level was provided on the working places. A manually controlled light-proof roller blind was used to obstruct daylight penetra-tion, or solar radiation, during the working hours in the test days. During these days the maximum amount of temperature change between the lowest and highest values of the room was calculated to be 0.50 C. The light-proof roller blind was used later only if the users of the room felt uncomfortable be-cause of resulting glare on the working places or di-rect sunshine during the experiment. After collect-ing the required data, the main experiment started on July 14, 2008.
Fig. 3. Monthly energy saving percentages Fig. 2. Record and control set-up

Light & Engineering Vol. 18, No. 2
102
Average illumination level values are not far from the desired values, even if the artifi cial lighting sys-tem turned down by the controller.
3.4. Relations between temperature change and lighting energy savings
In the test week, the maximum temperature changes without daylight, or solar radiation pen-
visual height in Zone 1 and Zone 3. Each zone rep-resents a different working area. Different luxmeter measurements held manually can determine any uni-formity problem. The uniformity is mainly a result of using three different lighting zones. In Figs. 4 and 5, the average illumination values of two working ar-eas located in Zone 1 and Zone 2, are shown. These values were collected from sensors 1 and 3, which measured horizontal illumination values.
Fig. 5. Average illumination values on the working surfaces (27.09.2008) Energy saving: 12.63 %
Fig. 4. Average illumination values on the working surfaces (03.08.2008) Energy Saving: 53.40 % Fig. 5. Average illumi-nation values on the working surfaces (27.09.2008) Energy saving: 12.63 %
Table 1. Daily energy consumption of the artifi cial lighting system
Month July ‘08 Aug ‘08 Sept ‘08 Oct ‘08 Nov ‘08 Dec ‘08 Jan ‘09 Average
Daily Consumption (Average-Wh) 4996 4687 6190 6968 7761 8049 7321 6567
Daily Saving(Average-Wh) 5304 5613 4110 3332 2539 2251 2979 3733
Table 2. Weather conditions during the experiment period (black-out days excluded)
Month July ‘08 Aug ‘08 Sept ‘08 Oct ‘08 Nov ‘08 Dec ‘08 Jan ‘09 Total
Clear 16 29 11 8 10 7 0 81
Mixed 1 2 12 13 13 6 1 48
Overcast 1 0 7 10 7 18 4 47

Light & Engineering Vol. 18, No. 2
103
and the total energy consumption of the cooling sys-tem can be calculated. For these 13 weeks, the total temperature change is (14.4 x 13) = 187.2 ºC, and the amount of energy to reduce the temperature to the lowest values recorded in the morning is (187.2 x 37.2 x 5) ≈ 34820 Wh. This result is nearly 8 % of the total lighting energy savings (439600 Wh). Considering the type and effi ciency of the cooling equipment and the heating losses on the wiring sys-tem, the calculated value of extra energy consump-tion rises by an unexpected 10 %. In particular, on days when the weather is clear and the daily sun-shine duration is long, this unexpected energy con-sumption may increase.
Comparing the cooling consumptions of the day-light responsive system and continuous electrical lighting conditions, the effect of solar radiation pen-etration may be better understood. Under continu-ous electrical lighting conditions (light proof roller blind is drawn, no light penetration); the biggest dif-ference between the highest and lowest room tem-peratures is 0.5 ºC.
For 13 weeks, the total temperature rise is (0.5 x 7 x 13) = 45.5 ºC and the total amount of energy to reduce the temperature to the lowest value re-corded on the appropriate day is (45.5 x 37.2 x 5) ≈ 8465 Wh. This means 78 % of cooling energy may be saved without using the daylight responsive sys-tem. But while saving cooling energy, lighting ener-gy consumption rises to the maximum possible val-ue for this system and a grand total of 409645 Wh energy savings disappear. From this perspective, the positive effect of daylight responsive systems on electrical energy saving is undeniable.
The relationship between temperature rise and lighting energy consumption may also be consid-ered. In Fig. 7, the energy savings are given in terms of Wh, and the temperature differences between
etration, are recorded. Between 08:30 and 18:30, the room temperature increased by a maximum of 0.5 oC in spite of the hot weather and high out-side temperature. During the experiment period, the average temperature was greater than 25 °C for only 13 weeks. The greatest and least temperature changes were recorded in the test room in weeks 1 and 4 with 2 °C, and week 10 with 1 °C respec-tively. Fig. 6 shows the weekly average temperature changes in terms of °C.
To remove the temperature changes in the room, without using the temperature value, and prevent of-fi ce or lab workers from overheating problems, the room temperature was reduced to the lowest value of the day. For the abovementioned 13 weeks, the lowest temperature value of the test room is record-ed at 8:30 every day. As a result, extra cooling en-ergy consumption is required, and this consumption negatively affects the lighting energy savings. Using formula 1, the amount of energy to cool the room can be calculated.
Q = d·V·c· (t2-t1) (1)
Under room temperature conditions, the vari-ables of the formula can be described as follows: density of air “d” is 1,226 kg/ m3 according to the standards; the specifi c heat “c” is 1060 J/kg ºC; and the volume of the test room, “V,” is 103 m3. Using Formula 1, the amount of electrical energy can be calculated as 37.2 Wh to cool the test room by 1 ºC. In the test week, the maximum temperature rise was recorded as 0.5 ºC with light-proof roller blinds that obstructed daylight penetration. Assuming that a 0.5 ºC temperature rise is the limit value, the aver-age value of the total temperature rises for the related 13 weeks is 14.4 ºC. Assuming the cooling system operates only 5 hours, the total temperature changes
Fig. 6. Weekly average temperature changes of the experiment room for the fi rst 13 weeks
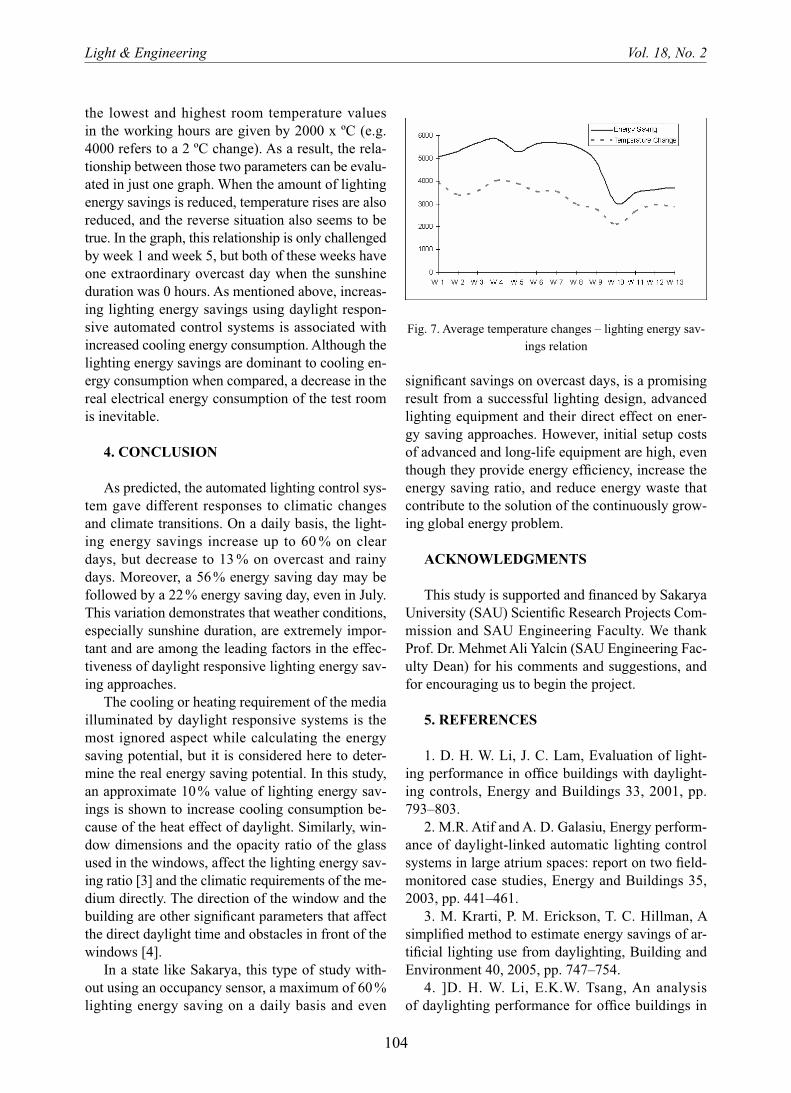
Light & Engineering Vol. 18, No. 2
104
signifi cant savings on overcast days, is a promising result from a successful lighting design, advanced lighting equipment and their direct effect on ener-gy saving approaches. However, initial setup costs of advanced and long-life equipment are high, even though they provide energy effi ciency, increase the energy saving ratio, and reduce energy waste that contribute to the solution of the continuously grow-ing global energy problem.
ACKNOWLEDGMENTS
This study is supported and fi nanced by Sakarya University (SAU) Scientifi c Research Projects Com-mission and SAU Engineering Faculty. We thank Prof. Dr. Mehmet Ali Yalcin (SAU Engineering Fac-ulty Dean) for his comments and suggestions, and for encouraging us to begin the project.
5. REFERENCES
1. D. H. W. Li, J. C. Lam, Evaluation of light-ing performance in offi ce buildings with daylight-ing controls, Energy and Buildings 33, 2001, pp. 793–803.
2. M.R. Atif and A. D. Galasiu, Energy perform-ance of daylight-linked automatic lighting control systems in large atrium spaces: report on two fi eld-monitored case studies, Energy and Buildings 35, 2003, pp. 441–461.
3. M. Krarti, P. M. Erickson, T. C. Hillman, A simplifi ed method to estimate energy savings of ar-tifi cial lighting use from daylighting, Building and Environment 40, 2005, pp. 747–754.
4. ]D. H. W. Li, E.K.W. Tsang, An analysis of daylighting performance for offi ce buildings in
the lowest and highest room temperature values in the working hours are given by 2000 x ºC (e.g. 4000 refers to a 2 ºC change). As a result, the rela-tionship between those two parameters can be evalu-ated in just one graph. When the amount of lighting energy savings is reduced, temperature rises are also reduced, and the reverse situation also seems to be true. In the graph, this relationship is only challenged by week 1 and week 5, but both of these weeks have one extraordinary overcast day when the sunshine duration was 0 hours. As mentioned above, increas-ing lighting energy savings using daylight respon-sive automated control systems is associated with increased cooling energy consumption. Although the lighting energy savings are dominant to cooling en-ergy consumption when compared, a decrease in the real electrical energy consumption of the test room is inevitable.
4. CONCLUSION
As predicted, the automated lighting control sys-tem gave different responses to climatic changes and climate transitions. On a daily basis, the light-ing energy savings increase up to 60 % on clear days, but decrease to 13 % on overcast and rainy days. Moreover, a 56 % energy saving day may be followed by a 22 % energy saving day, even in July. This variation demonstrates that weather conditions, especially sunshine duration, are extremely impor-tant and are among the leading factors in the effec-tiveness of daylight responsive lighting energy sav-ing approaches.
The cooling or heating requirement of the media illuminated by daylight responsive systems is the most ignored aspect while calculating the energy saving potential, but it is considered here to deter-mine the real energy saving potential. In this study, an approximate 10 % value of lighting energy sav-ings is shown to increase cooling consumption be-cause of the heat effect of daylight. Similarly, win-dow dimensions and the opacity ratio of the glass used in the windows, affect the lighting energy sav-ing ratio [3] and the climatic requirements of the me-dium directly. The direction of the window and the building are other signifi cant parameters that affect the direct daylight time and obstacles in front of the windows [4].
In a state like Sakarya, this type of study with-out using an occupancy sensor, a maximum of 60 % lighting energy saving on a daily basis and even
Fig. 7. Average temperature changes – lighting energy sav-ings relation

Light & Engineering Vol. 18, No. 2
105
small offi ce. Journal of the Illuminating Engineer-ing Society 30, 2001, pp. 176–188.
10. S. Onaygil, Ö. Güler, Determination of the energy saving by daylight responsive lighting con-trol systems with an example from İstanbul, Build-ing and Environment 38, 2003, pp. 973–977.
11. International Energy Agency, Daylight in buildings: A source book on daylighting systems and components, A Report of IEA SHC Task 21/ECBCS Annex 29. 2000.
12. CIBSE code for interior Lighting. CIBSE 1987. London, UK.
13. M.R. Atif, J.A. Love, P. Littlefair, Daylight-ing Monitoring Protocols & Procedures for
Buildings, A report of Task 21 / Annex 29 Day-light in Buildings, IEA Protocol 1997.
14. B. Manav, An experimental study on the ap-praisal of the visual environment at offi ces in rela-tion to colour temperature and illuminance, Building and Environment 42, 2007, pp. 979–983.
Hong Kong, Building and Environment 43, 2008, pp. 1446–1458.
5. D.H.W. Li, E.K.W. Tsang, An analysis of measured and simulated daylight illuminance and lighting savings in a daylit corridor, Building and Environment 40, 2005, pp. 973–982.
6. D.H.W. Li, J.C Lam, An analysis of lighting energy savings and switching frequency for a day-lit corridor under various indoor design illuminance levels, Applied Energy 76, 2005, pp. 363–378.
7. I.P. Knight, Measured energy savings due to photocell control of individual luminaires, Light-ing Research and Technology 31, 1999, pp. 19–22.
8. B.V. Neida, D. Maniccia, A. Tweed, An anal-ysis of the energy and cost savings potential of oc-cupancy sensors for commercial lighting systems, Journal of the Illuminating Engineering Society 30, 2001, pp. 1–27.
9. S.Y. Kim, R. Mistrick, Recommended daylight conditions for photosensor system calibration in a
Cenk Yavuz was born in Turkey in 1979. He received the Electrical and Electronics Engineering degree from Sakarya University (SAU), Turkey in 2002. He later obtained his MSc and Ph.D. degrees in Electrical Engineering from SAU in 2004 and 2010 respectively. His current research interests include daylighting applications, lighting energy savings, energy effi ciency and quality in lighting
Ertan Yanikoğlu obtained his Ph.D. in Electrical Engineering from Istanbul Technical University in 1990. He is currently a professor of Electrical Engineering at Sakarya University, Turkey. His research interests are energy effi ciency, electric energy quality, reliability analysis and short-term voltage drops
Önder Güler received the BSc, MSc and Ph.D. degrees in Electrical Engineering from the Istanbul Technical University (ITU) in 1991, 1995 and 2001 respectively. He has been working as an assistant professor at the Energy Institute of ITU since 2003. He is a member of Turkish National Illumination Committee and Chamber of Electrical Engineers. His research areas are road lighting, energy saving, energy management in industry and buildings, wind energy, electrical energy quality
Light & Engineering Vol. 18, No. 2
106
CONTENTS
VOLUME 18 NUMBER 3 2010
LIGHT & ENGINEERING(SVETOTEKHNIKA)
Vladimir I. Polyakov and Demetrius S. StrebkovMatrix Solar Cells for Conversion of Concentrated Radiation
Andreas Ludwig The Challenge is the Balance the Lighting Industry’s View on Energy Effi ciency and Lighting Quality
Andrei V. Aladov, Elena D. Vasilieva, Alexander L. Zakgeim, Gregory V. Itkinson, Vsevolod V. Lundin, Mikhail N. Mizerov, Victor M. Ustinov, and Andrei F. TsatsulnikovPresent Time High Power LEDs and their Application in Light and Engineering
Peter Dehoff Quality Criteria as Part of the European Standardisation – the Revision of EN 12464–1 “Lighting of Interior Workplaces”
Zoltán Vas, Peter Bodrogi, János Schanda, and Geza VaradyThe Non-Additivity Phenomenon in Mesopic Photometry
Monica SäterUser Responses to LED as a Guide for Energy Effi cient Lighting Applications in Domestic Environments
Sergey I. Lishik, Alexander A. Pautino, Valery S. Posedko, Yuri V. Trofi mov, and Vitally I. TsvirkoStructural and Technological Solutions for Light-Emitting Diode Lamps of Direct Replacement
Inna V. LyakishevaThe First in Russia Museum Dynamic Illumination Using Light Emitting Diodes
Sergei A. KobozevThe Reconstruction of Illumination of Moscow Metropolitan Stations
Mikhail V. RyzhkovAbout White LEDs Degradation and Refusals
Vladislav A. Alpert Twenty-Year Experience of Production and Operation of the URL-2 Vacuum Thermal Demercurization Equipment
Aleksander V. Kochurov and Vladimir N. TimoshinOn Solution of Recycling Problems of Energy Saving Mercury Containing Lamps
Irina E. Zhuravlyova and Nicolai I. Shchepetkov About Lighting Education of Architects (From the Biography of the Architectural Physics Chair of the Moscow Architectural Institute)