light-driven hydrogen evolution role of nitrogen defects
TRANSCRIPT

S1
Role of Nitrogen Defects in Graphitic Carbon Nitride for Visible-
Light-Driven Hydrogen Evolution
Jiawei Xue, Mamoru Fujitsuka, and Tetsuro Majima*
The Institute of Scientific and Industrial Research (SANKEN), Osaka University, Mihogaoka 8-1, Ibaraki, Osaka 567-0047, Japan
Section 1. Experimental Details
1.1. Synthesis Method
N-deficient g-C3N4 (DCN) was synthesized via a KOH-assisted thermal
polymerization method.1 Briefly, 15 g of urea was dissolved with stirring into the
KOH solution (1.0 g KOH in 30 mL of H2O), and then the as-obtained solution
evaporated to dryness in an oven at 80 °C overnight. The solid mixtures of urea and
KOH were then calcined at 550 °C in a muffle furnace for 4 h using a heating rate of
2 °C min-1. For comparison, bulk g-C3N4 (CN) was also synthesized parallelly in the
absence of KOH.
1.2. Characterization
The samples were characterized using X-ray diffraction (XRD, Rigaku, Smartlab;
operated at 40 kV and 200 mA, Cu Kα source), scanning electron microscopy (SEM,
JEOL, JSM-6330FT). The XPS measurements were carried out on a PHI X-tool
8ULVAC-PHI instrument. Fourier transformed infrared (FTIR) measurements were
conducted by a PerkinElmer spectrometer. The steady-state diffuse reflection spectra
were measured on a UV-vis-NIR spectrophotometer (Jasco, V-570) at room
temperature. Electro paramagnetic resonance (EPR) spectra were recorded on a JEOL
JES-RE2X electron spin resonance spectrometer at room temperature.
1.3. Photocatalytic Activity Tests
3 mg of the sample was dispersed in 5 mL triethanolamine (TEOA)-H2O solution
Electronic Supplementary Material (ESI) for Physical Chemistry Chemical Physics.This journal is © the Owner Societies 2019

S2
(VTEOA:VH2O = 1:4) and added into a 35 mL cylinder reactor. Then, 3 wt% (respect to
Pt, acting as co-catalysts) H2PtCl6·6H2O was deposited onto the photocatalyst by the
photodeposition method. The reactor was sealed, and then bubbled with argon
through the reactor for 30 min to completely remove the dissolved oxygen and ensure
the reactor was in an anaerobic condition. Subsequently, the suspension with
continuous stirring was irradiated under a UV-LED source (POT-365; 100 mW cm−2)
or a Xe lamp (Asahi Spectra, HAL-320; 350 mW cm−2) equipped with a 420 nm or
460 nm cutoff filter at room temperature. H2 production was measured by using
Shimadzu GC-8A gas chromatograph equipped with an MS-5A column and a thermal
conductivity detector. The apparent quantum efficiency (AQE) for H2 production at
different wavelengths (420, 460, 500, 560 nm) of the monochromatic light was
calculated via the following equation: AQE = (2 × number of H2 molecules/number of
incident photons) × 100 %.
1.4. Transient Absorption Measurements
The femtosecond time-resolved transient absorption (TA) spectra were measured by
the pump and probe method using a regeneratively amplified titanium sapphire laser
(Spectra-Physics, Spitfire Pro F, 1 kHz) pumped by a Nd:YLF laser (Spectra-Physics,
Empower 15). The seed pulse was generated by a titanium sapphire laser (Spectra-
Physics, Mai Tai VFSJW; FWHM 80 fs). The output (420 nm or 560 nm, 4 J per
pulse) of the optical parametric amplifier (Spectra-Physics, OPA-800CF-1) was used
as the excitation pulse. A white light continuum pulse, which was generated by
focusing the residual of the fundamental light on a sapphire crystal after the computer
controlled optical delay, was divided into two parts and used as the probe and the
reference lights, of which the latter was used to compensate for the laser fluctuation.
Both probe and reference lights were directed to the sample powder coated on the
glass substrate, and the reflected lights were detected by a linear InGaAs array
detector equipped with the polychromator (Solar, MS3504). The pump pulse was
chopped with a mechanical chopper synchronized to one-half of the laser repetition
rate, resulting in a pair of spectra with and without the pump, from which the

S3
absorption change (% Abs) induced by the pump pulse was estimated. All
measurements were carried out at room temperature.
1.5. Density Functional Theory (DFT) Calculations
All calculations were carried out using CASTEP, as implemented in Materials Studio
8.0. Nonlocal exchange and correlation energies were treated with the Perdew-Burke-
Ernzerhof (PBE) functional, which was based on the generalized gradient
approximation (GGA). a 500 eV cutoff was assigned to the plane-wave basis set and
the Brillouin zone was sampled by 3×3×4 k-points. In the geometry optimization
process, the energy convergence tolerance and maximum force were set to be 5 × 10⁻⁶
eV per atom and 0.01 eV Å-1, respectively.

S4
Section 2. Supplementary Data
Figure S1. SEM images of CN and DCN.
Table S1. N/C atomic ratios of CN and DCN determined by the elemental analysis
(EA) and XPS.
EA XPSSamples N
(wt%)C
(wt%)H
(wt%)N/C
(atomic)N
(at%)C
(at%)O
(at%)K
(at%)N/C
(atomic)CN 57.54 32.66 1.95 1.51 54.49 42.94 2.56 - 1.27
DCN 56.18 33.73 2.08 1.43 46.81 43.74 5.67 3.78 1.07
It should be mentioned here that the N/C atomic ratio in CN obtained by EA is
generally higher than the stoichiometric ratio of 1.33 due to the residual amino groups
originating from incomplete condensation of the precursor.2 In contrast, the N/C
atomic ratio in CN obtained by XPS is lower than the stoichiometric one because the
thermal oxidation etching would remove the surface N atoms.3
Because EA provides the information of the whole sample, while XPS can only
provide surface information, the percentage of N vacancies is calculated to be 5.3 %
in DCN according to EA results. However, we cannot determine the percentage of
cyano groups in DCN based on EA results because the formation of cyano groups
does not result in N loss in the bulk.1
S5
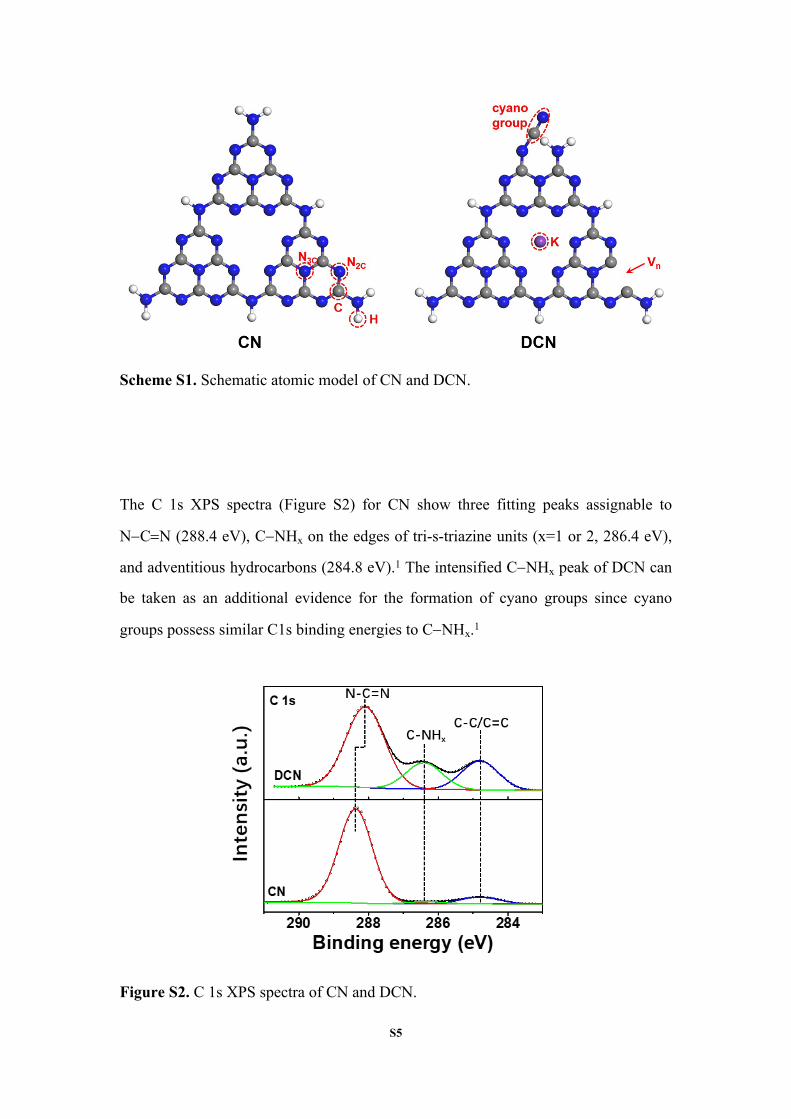
Scheme S1. Schematic atomic model of CN and DCN.
The C 1s XPS spectra (Figure S2) for CN show three fitting peaks assignable to
NCN (288.4 eV), CNHx on the edges of tri-s-triazine units (x=1 or 2, 286.4 eV),
and adventitious hydrocarbons (284.8 eV).1 The intensified CNHx peak of DCN can
be taken as an additional evidence for the formation of cyano groups since cyano
groups possess similar C1s binding energies to CNHx.1
Figure S2. C 1s XPS spectra of CN and DCN.

S6
Figure S3. K 2p XPS spectrum of DCN.

S7
According to Figure S10, the bandgap calculation is based on the fact that the
transition from VB to CB for CN is direct, while the transition from Vn states (band
tail states) to CB for DCN is indirect. However, it is difficult to directly figure out
whether the transition from the intrinsic VB of DCN to the CB is direct or indirect
because VBM at Z point is only a little bit higher than VB at G point for CN-Vn. It
should be considered as a “slightly” indirect transition. Therefore, both bandgaps due
to direct and indirect transitions are considered.
If the transition from the intrinsic VB of DCN to the CB is direct, the gap is calculated
to be 2.70 eV (Figure 2b). In this case, the intrinsic VBM of DCN is 0.19 eV lower
than the VB of CN (Figure 2d). However, if the transition is indirect, the gap is
calculated to be 2.39 eV (Figure S4). Then the intrinsic VBM of DCN is 0.12 eV
higher than the VB of CN. However, according to the Figure 2c, the VBM of DCN is
lower than that of CN. Therefore, the transition from the intrinsic VB of DCN to the
CB should be still considered as a direct one.
Figure S4. Tauc plot for the band gap calculation for DCN.

S8
The VBM potential of TiO2 (anatase) versus normal hydrogen electrode (NHE, PH =
7) is calculated by using the formula EVBM vs. NHE/V = Φ + E VBM vs. Fermi − 4.44 (EVBM
vs. NHE of 2.74: VBM potential of TiO2 vs. NHE;4 Φ of 4.5: work function of TiO2;5
EVBM vs. Fermi: the difference between the VBM of TiO2 and Fermi level).6 Therefore,
EVBM vs. Fermi is calculated to be 2.68 eV. However, the tested EVBM vs. Fermi = 2.85 eV
(Figure S5), which means there is an error of 0.17 eV in our VB XPS test. Then, we
use this error to calibrate the VB XPS of CN and DCN in this work, as shown in
Figure 2c.
Figure S5. VB XPS spectrum of TiO2 (anatase).
S9
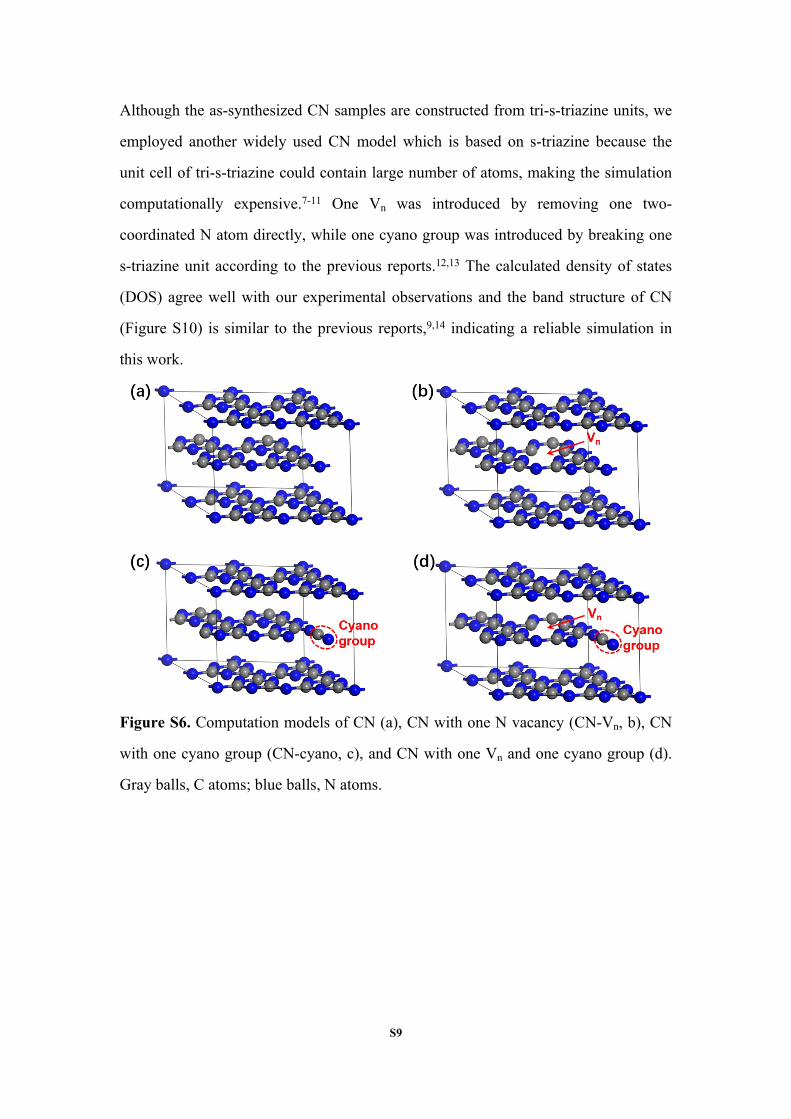
Although the as-synthesized CN samples are constructed from tri-s-triazine units, we
employed another widely used CN model which is based on s-triazine because the
unit cell of tri-s-triazine could contain large number of atoms, making the simulation
computationally expensive.7-11 One Vn was introduced by removing one two-
coordinated N atom directly, while one cyano group was introduced by breaking one
s-triazine unit according to the previous reports.12,13 The calculated density of states
(DOS) agree well with our experimental observations and the band structure of CN
(Figure S10) is similar to the previous reports,9,14 indicating a reliable simulation in
this work.
Figure S6. Computation models of CN (a), CN with one N vacancy (CN-Vn, b), CN
with one cyano group (CN-cyano, c), and CN with one Vn and one cyano group (d).
Gray balls, C atoms; blue balls, N atoms.

S10
Figure S7. Photocatalytic H2 evolution using CN and DCN under UV irradiation.
Figure S8. Nitrogen adsorption-desorption isotherms of CN and DCN.
S11
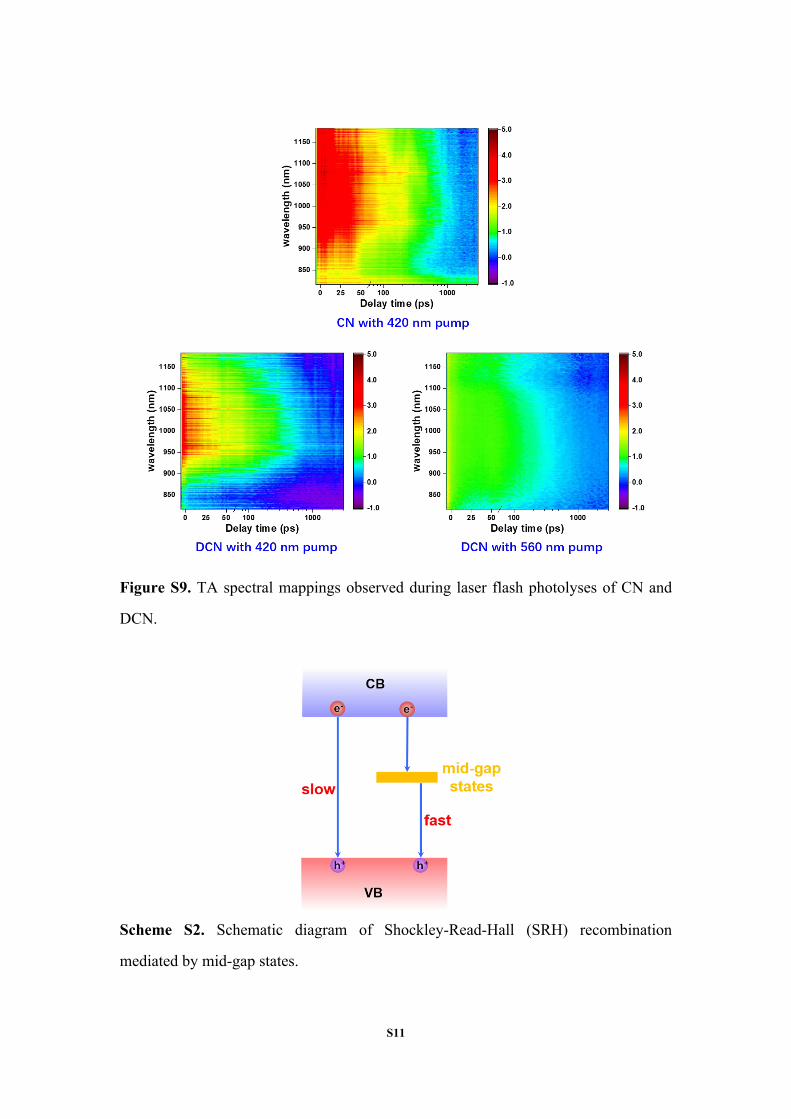
Figure S9. TA spectral mappings observed during laser flash photolyses of CN and
DCN.
Scheme S2. Schematic diagram of Shockley-Read-Hall (SRH) recombination
mediated by mid-gap states.

S12
As shown in Figure S10, after the introduction of the cyano group, the band structures
around CBM and VBM become less dispersive, reflecting the heavier photogenerated
electrons and holes. This trend is in accordance with the report by Zhang et al.13
Another interesting finding is that the introduction of the Vn results in the change of
CN from a direct semiconductor to an indirect one, which may increase the electron-
hole lifetime.15
Figure S10. Calculated band structures of CN, CN-Vn, and CN-cyano. The Fermi
level is taken to be zero. The red arrows mark the CBM, VBM, and the maximum of
the Vn energy level.
S13
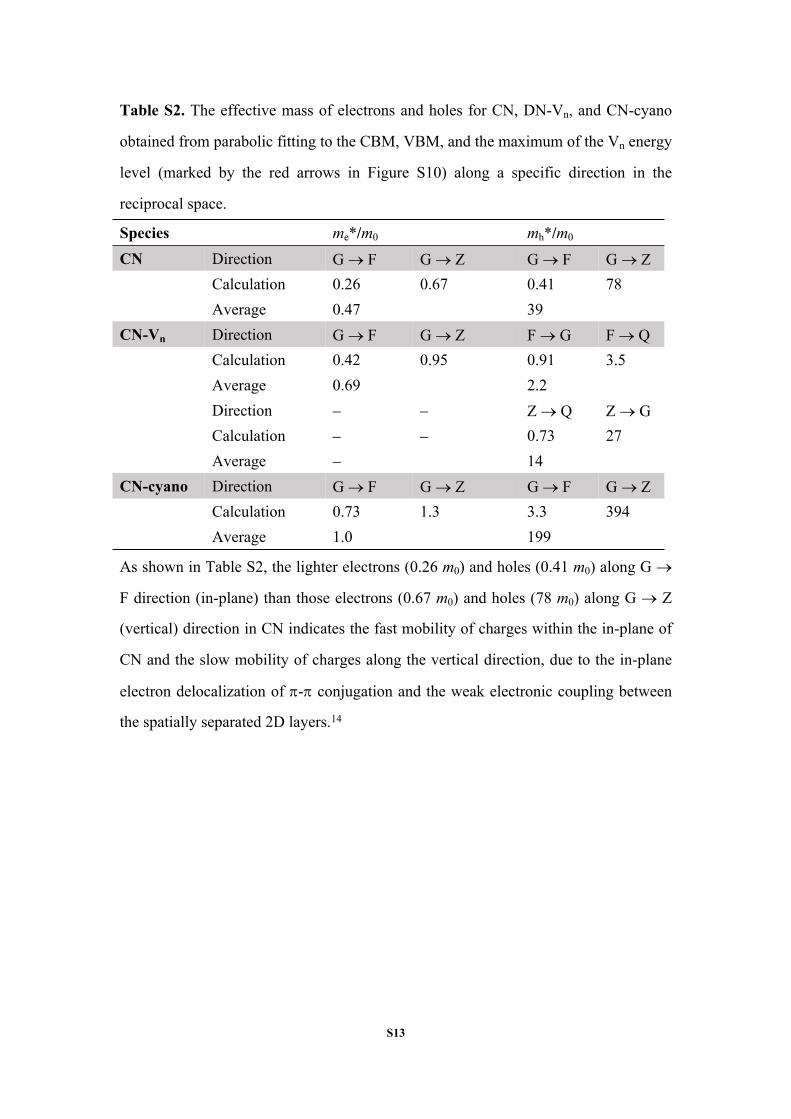
Table S2. The effective mass of electrons and holes for CN, DN-Vn, and CN-cyano
obtained from parabolic fitting to the CBM, VBM, and the maximum of the Vn energy
level (marked by the red arrows in Figure S10) along a specific direction in the
reciprocal space.
Species me*/m0 mh*/m0
CN Direction G F G Z G F G ZCalculation 0.26 0.67 0.41 78Average 0.47 39
CN-Vn Direction G F G Z F G F QCalculation 0.42 0.95 0.91 3.5Average 0.69 2.2Direction Z Q Z GCalculation 0.73 27Average 14
CN-cyano Direction G F G Z G F G ZCalculation 0.73 1.3 3.3 394Average 1.0 199
As shown in Table S2, the lighter electrons (0.26 m0) and holes (0.41 m0) along G
F direction (in-plane) than those electrons (0.67 m0) and holes (78 m0) along G Z
(vertical) direction in CN indicates the fast mobility of charges within the in-plane of
CN and the slow mobility of charges along the vertical direction, due to the in-plane
electron delocalization of - conjugation and the weak electronic coupling between
the spatially separated 2D layers.14
S14
References:
(1) H. Yu, R. Shi, Y. Zhao, T. Bian, Y. Zhao, C. Zhou, G. I. N. Waterhouse, L. Z.
Wu, C. H. Tung and T. Zhang, Adv. Mater., 2017, 29, 1605148.
(2) W. Tu, Y. Xu, J. Wang, B. Zhang, T. Zhou, S. Yin, S. Wu, C. Li, Y. Huang, Y.
Zhou, Z. Zou, J. Robertson, M. Kraft and R. Xu, ACS Sustainable Chem. Eng., 2017,
5, 7260-7268.
(3) Z. Huang, F. W. Yan and G. Q. Yuan, ACS Sustainable Chem. Eng., 2018, 6,
3187-3195.
(4) W. Ong, L. Tan, Y. H. Ng, S. Yong and S. Chai, Chem. Rev., 2016, 116, 7159-
7329.
(5) H. Yaghoubi, Z. Li, Y. Chen, H. T. Ngo, V. R. Bhethanabotla, B. Joseph, S. Ma, R.
Schlaf and A. Takshi, ACS Catal., 2015, 5, 327-335.
(6) J. Cao, W. Nie, L. Huang, Y. Ding, K. Lv and H. Tang, Appl. Catal. B, 2019, 241,
18-27.
(7) Q. Tay, P. Kanhere, C. F. Ng, S. Chen, S. Chakraborty, A. C. H. Huan, T. C. Sum,
R. Ahuja and Z. Chen, Chem. Mater., 2015, 27, 4930-4933.
(8) X. Zhang, X. Xie, H. Wang, J. Zhang, B. Pan and Y. Xie, J. Am. Chem. Soc., 2013,
135, 18-21.
(9) W. Yu, D. Xu and T. Peng, J. Mater. Chem. A, 2015, 3, 19936-19947.
(10) J. Liu, B. Cheng and J. Yu, Phys. Chem. Chem. Phys., 2016, 18, 31175-31183.
(11) P. Li, F. Wang, S. Wei, X. Li and Y. Zhou, Phys. Chem. Chem. Phys., 2017, 19,
4405-4410.
(12) F. Yang, D. Liu, Y. Li, L. Cheng and J. Ye, Appl. Catal. B, 2019, 240, 64-71.
(13) D. Zhang, X. Han, T. Dong, X. Guo, C. Song and Z. Zhao, J. Catal., 2018, 366,
237-244.
(14) W. Yu, J. Chen, T. Shang, L. Chen, L. Gu and T. Peng, Appl. Catal. B, 2017, 219,
693-704.
(15) J. Zhang, P. Zhou, J. Liu and J. Yu, Phys. Chem. Chem. Phys., 2014, 16, 20382-
20386.