lifelife- ---cycle productivity of industrial inventors ... › events › 2013 › 06 › document...
TRANSCRIPT

1
LifeLifeLifeLife----cycle Productivity of Industrial Inventors:cycle Productivity of Industrial Inventors:cycle Productivity of Industrial Inventors:cycle Productivity of Industrial Inventors: Education and Other DeterminantsEducation and Other DeterminantsEducation and Other DeterminantsEducation and Other Determinants
Onishi Koichiro
Faculty of Intellectual Property, Osaka Institute of Technology
5-16-1, Ohmiya, Asahi-Ku, Osaka, 535-8585, Japan
Phone:+81-6-6954-4887, Fax: +81-6-6954-4164
E-mail: [email protected]
Nagaoka Sadao
Institute of Innovation Research, Hitotsubashi University and RIETI
2-1 Naka, Kunitachi, Tokyo, 186-8601, Japan
January 2013

2
AbstractAbstractAbstractAbstract
This paper examines the life-cycle inventive productivity of Japanese
industrial inventors. Using a panel of 1,731 inventors, we explore two issues.
First, we examine whether and how inventors with advanced doctorate
degrees (PhDs) perform better than their non-PhD counterparts. Second, we
examine whether inventors who earned their doctorate degrees on the basis
of a dissertation only (PhD-DO) are similarly productive. We found that
inventors with traditional PhDs are significantly more productive than
inventors with lower education levels, even controlling for their delayed start.
We further found that inventors with PhDs-DO have also high productivity,
and they work longer as inventors.
Keywords: Inventor, life-cycle inventive productivity, productivity profile,
education, patent
JEL Classifications: O31, O34, I21

3
1. INTRODUCTION
It is widely recognized that higher education is essential for
strengthening the innovative capacity of domestic industry, especially for
those countries at the technology frontier1. In this vein, scientists and
engineers with advanced doctoral degrees (PhDs) would help a firm increase
its absorptive power for exploiting recent scientific advances (see Cohen and
Levinthal, 1989 for the importance of absorptive power). In addition, hiring a
PhD can directly transfer a new technological expertise from universities to
industries (Stephan, 2011)2. Recognizing these implications, many countries
have expanded their respective higher education systems and have thus
increased the supply of PhD scientists and engineers. As a reflection of these
efforts, the Organization for Economic Co-operation and Development
(OECD, 2010) reported that enrolment in doctoral programs increased
1 Agihon et al. (2009) emphasized that highly skilled workers who acquire higher level education are
the engine of economic growth for the countries which have already reached the technological frontier.
On the other hand, basic education is found to have a positive effect on economic growth more globally
(Kruger and Lindahl, 2001).
2 Chapter 4 of Stephan (2011) comprehensively discussed how PhDs working in industry contribute to
economic growth. It quotes the statement of former President of the National Academy of Sciences,
who said that ‘the real agents of technology transfer from university laboratory were the students who
took jobs in the local biotech industry’.

4
annually by 4% between 1998 and 2006 among OECD countries.
In Japan, individuals with PhDs still represent a small minority (just
over 10%) of inventors. In contrast, nearly half of American inventors
possess a PhD (Walsh and Nagaoka, 2009). Moreover, only half of the
Japanese inventors with PhDs have obtained their degrees by completing
traditional doctoral course work. The other half have obtained their PhDs
only by submitting dissertations which are largely based on their
firm-related research (‘PhD (dissertation only’); hereafter ‘PhD-DO’)3.
Despite recognizing the importance of strengthening the technological
basis of their firms, many Japanese managers are reluctant to hire PhDs.
Some of them point out that PhDs tend to be narrow-minded and inflexible.
In addition, acquiring a PhD requires several years of schooling. As such,
PhD inventors are typically delayed in beginning their professional careers.
In Japan, inventors begin and leave their careers as inventors at younger
ages than their American counterparts4, thus making the attendance of a
3 PhD-DO is a unique Japanese PhD accreditation system. People wishing to acquire a PhD-DO don't
need to take any PhD course works. They only submit their dissertations to a university, and if these
dissertations show excellent academic achievements, they are awarded PhD degree.
4 Almost 80% of Japanese inventors have their first patent application before the age of 30, but less
than 30% of the US inventors do so (see Walsh and Nagaoka 2009).

5
traditional PhD program costlier in Japan.
These observations raise several pressing questions. First, given the
delayed start to their careers, how do corporate inventors with PhDs perform
in relation to their non-PhD counterparts? In particular, can a higher annual
productivity compensate for a delayed start to an inventing career? While it
will not be surprising to know that the PhD inventors have higher life cycle
inventive productivity than the others, the sources of such higher
productivity have not been well understood. As Jones (2008) indicated, if
overcoming the ‘burden of knowledge’ has become a critical component of a
successful career, inventors must spend more time or money to acquire
state-of-the-art technology and training to invent new products. Attending a
PhD program may be one important channel for doing this. If so, a PhD’s
delayed start of his/her professional career may not necessarily result in the
delayed start of their inventive career. Moreover, we need to control for types
of places at which inventors work and the types of projects in which they are
engaged in assessing the productivity of a PhD inventor, since they
significantly affect the resources and opportunities for inventions.
Secondly, are PhD-DO inventors similarly productive as inventors who

6
obtained their PhDs through traditional coursework? If they are, the system
of awarding PhDs-DO may be an efficient complement to a formal education
program. Since PhDs-DO write their dissertations on the basis of their
industrial research, unemployment is hardly an issue for them. This can be
an important advantage of such system since many traditional PhD holders
face difficult job markets in many countries5. Because a PhD-DO system is
unique to Japan, the assessment of how such pure certification system based
on industrial research may help corporate inventors reveal and/or develop
scientific human capital will provide important lessons for policy makers in
other countries.
To explore these issues, we investigate the relationship between
invention productivity and inventor education level using a life-cycle
perspective. Specifically, we assess whether an inventor who acquired his
PhD through a traditional doctoral program (i.e. one that grants a PhD for
the completion of numerous requirements, including coursework) can
compensate for a late start to his professional career by generating a greater
number or higher quality inventions and/or by quickly starting their
5 See Cyranoski et al. (2011).

7
invention activities and maintaining them later into their professional
careers. We also compare how PhD-DO inventors compare with traditional
PhD inventors in order to understand how a certification based PhD
granting system differs from a traditional PhD granting system. In these
analyses, we control for the type of workplace in which the inventor works as
well as the type of R&D project that he pursues. Since a PhD inventor may
look to be productive not because he has higher human capital but because
he is given more time and resources for inventions or he is given a task (in
particular, basic research) more prone for generating inventions, it is very
important to control workplace and the type of R&D. We also control for the
abilities of the inventor by constructing an indicator variable for the quality
of the university from which he/she graduated as well as by using a panel
estimation. This new variable (a T-score hereafter) is a standardized score
gauging the difficulty of the attended university’s entry examination.
Further, we employ a Hausman-Taylor estimation in panel data analysis to
control for unobserved inventor ability or other unidentified individual
characteristics. To the best of our knowledge, there has been very little
research focusing on life-cycle inventive productivity for industrial workers

8
and those studies that do exist do not control for the ability of inventors nor
the workplace and the type of R&D. As such, this study provides a more
structural and accurate view of the association between education level and
invention productivity than has been produced in the past.
We find that traditional PhDs have significantly higher annual
productivity than the inventors with other education levels in terms of both
patent and forward citation counts, and that they can easily compensate for
their delayed start to their business-related activities. We find that this is
the case even after controlling for workplace, research stage and inventor
ability. One source of higher life cycle productivity of traditional PhDs is the
short period of time between the first work year and the first invention year.
PhDs-DOs also have high patent productivity (which increases more rapidly
with greater levels of experience), which are lower but do not significantly
differ from traditional PhDs. They often work in independent laboratories
and are involved in basic research as frequently as traditional PhDs. In
addition, PhDs-DO leave their inventive activity significantly later than the
other inventors, controlling for the types of project the inventor is working on,
the number of co-inventors or the inventor’s ability.

9
Section 2 reviews relevant literature. Section 3 explains the data
construction and patent application activities of Japanese industrial
inventors. Section 4 explains the estimation models and methodology used
for this study. Section 5 presents the estimation results. Section 6 concludes
the paper.
2. LITERATURE REVIEW
Empirical studies on corporate inventors are limited. One of the
pioneering works in this domain was conducted by Narin and Breitzman
(1995), which confirmed the finding by Lotka (1926) that scientists’
respective productivities are highly skewed. Four recent studies based on
large scale datasets which are salient to the current research are
summarized in Table 1. Each of these studies used individual patent
application or grant data which was matched with firms. Only one study
(Kim, Lee and Marschke, 2004) used panel data (inventors organized by
application/grant years), as this study does. Mariani and Romanelli (2007)
uncovered a significant relationship between education level and patent
development. They found that inventors with PhDs generate 21% more

10
patents (on average) than inventors with only a high school degree, but that
there is no significant difference in the level of citations per patent. Kim, Lee
and Marschke (2004) also found that an inventor with a PhD has a
significantly greater number of patent applications. In contrast, Hoisl (2007)
found that over his/her life-cycle, a PhD inventor does not generate more
patent applications than a non-PhD when the productivity measure takes
into account the loss of invention period above the age of 25. Finally, with
respect to quality, Schettino, Sterlacchini and Venturini (2008) discovered
that patent quality increases by 17% with a higher level of education (PhD
relative to non-university degree).
(Table 1)
One reason for the observed variations in the relationship between
education level and invention activity relates to the accounting for delayed
commencement of one’s invention career resulting from pursuing a PhD. To
account for this delay, it is imperative to measure life-cycle patent
applications and to assess how cumulative applications differ as a result of

11
variance in educational level. Among the studies in Table 1, only Hoisl (2007)
has undertaken such an endeavor. By contrast, the other studies may
overestimate the effect of higher education on life-cycle invention
productivity. As the ‘burden of knowledge’ has become more prominent, the
issue of delayed invention careers has become serious (Jones 2008). An
increased burden of knowledge has required a longer period of time for a new
PhD to absorb past knowledge. To accommodate for this ‘lost time’ in
academia, some PhDs may offset the late entry into inventive work by
departing that work later as well. Thus, the adoption of a life-cycle
perspective allows for the analysis of invention productivity that may be
affected by late entry and exit into the invention workforce.
A second reason for observed variations in how education affects
invention productivity is a varying degree of control over omitted variables
which are highly interrelated with education or ability. For example, none of
the studies listed in Table 1 control for inventor ability. Hoisl (2007), however,
controls for inventor knowledge sources, but that variable is likely correlated
with level of education and ability. In fact, according to her study, this is one
of the few sources of advantage to a PhD inventor.
12
Extant research has controlled for neither the type of the workplace
(e.g. independent laboratory, manufacturing division laboratory, software
development divisions) in which inventors operate, nor the stage of the
research being conducted (e.g. basic research, applied research, development,
technical services, or other). Despite the failure of past research to include
them as control variables, workplace and project type are likely to
significantly affect invention productivity. A laboratory dedicated to research
is more likely to provide assets conducive to invention and patenting. In
addition, basic research is likely to generate more patents than development,.
An inventor with a PhD is more likely to be employed in a laboratory and in
the basic stage of research. To redress these gaps in the literature, we take
workplace and the research stage into account as controls while conducting
our analyses.
There are many empirical studies on the research productivity of
scientists. Although they work in different settings, some of the findings
from these studies may be useful for understanding the productivity of
corporate inventors. One of the basic findings from this research is that the
research productivity distribution of scientists is highly skewed, with a
13
relatively small number of scientists accounting for a significant portion of
the publications. One influential explanation for this skewedness is the
cumulative advantage resulting from the ‘Matthew effect’ or preferential
attachments (see Merton, 1968, Allison and Stewart, 1974).
Another finding from this literature may be relevant for invention
productivity research relates to human capital theory. As human capital
theory postulates, a scientist’s productivity will initially rise but then decline
with age and experience. Diamond (1984) investigated the relationship
between age and the number of research publications among
mathematicians, and found an inverted U-shape relationship over the
life-cycle. Levin and Stephan (1991) also found a similar association among
physicists (except particle physicists) and earth scientists. Oster and
Hamermesh (1998) and Baser and Pema (2004) showed that publications
increase with age and experience at the early stages of one’s life-cycle but
sharply decline during these stage among economists. Recently, Turner and
Mairesse (2005) investigated the relationship between age and publications
in French physicians and found an inverted U-shape function during their

14
academic life-cycle 6 . We employ a similar econometric model which
accommodates the inverted U-shape relationship over the life-cycle. However,
for corporate inventors, the decline of productivity with age may be caused
by the changes of an inventor’s primary tasks within a firm from invention to
management. Given this, we cannot adopt human capital theory for
interpreting the results.
An alternative to estimating the patent production function is to
follow the tradition of Becker (1965) and Mincer (1974) and use wage as a
performance measure. Some recent surveys on the relationship between
education and wage suggest that Master’s degree (MA) and PhD holders
respectively earn 10% to 30% higher wages than those with undergraduate
degrees alone (Card 1999, Deere and Vesovic 2006). In a Japanese case,
Morikawa (2012) found that workers who have MAs or higher earn
approximately 20% higher wage premiums than those workers who have
Bachelor’s degrees or lower7. However, corporate inventors are not directly
6 It is important to note, however, that identifying the age effect requires strong prior assumptions on
cohort and year effects, as clarified by Hall, Mairesse and Turner (2007).
7 To our knowledge, Toivanen and Vaananen (2012) is an unique study to investigate the relationship
between inventors' education level and their reward. However, they don't refer to their results in more
detail in their paper.

15
rewarded with wages for their creations. Instead, employee inventors receive
generally fixed salaries and transfer ownership of their inventions to the
companies for whom they work. In addition, there are significant financially
intangible benefits to inventive work, which makes a wage amount an
undervalued variable representing the inventive performance. As a result,
wage may not be very informative to this end.
3. DATA DESCRIPTION
3.1. Data
We focus the industrial inventors who responded to the RIETI
Inventor Survey in 2007, which surveyed Japanese patent inventors selected
by quasi-random sampling8. The questions that comprise this survey cover
not only the inventive process and the use of patents but also inventor
characteristics. Questions related to birth year, gender, the first employed
year, highest education, and year of graduation were all included in the
8 Around 70% of the focal patents are selected from triadic patents, which are skewed toward high
quality patents. The rest are selected from non-triadic patents, which is close to a pure random
sampling of the population. This indicates that the survey oversamples the respondent inventors
having high ability. For a more detailed description of the sampling method, see Nagaoka and Tsukada
(2007).

16
survey, to which 5,278 inventors responded. We gathered all patents which
included respondent inventor names to obtain the life-cycle inventive profile
of these inventors (which was comprised of responses to questions related to
personal characteristics). We used the Institute of Intellectual Property (IIP)
patent database for Japanese patent bibliographic data which cover patent
applications from 1964 to 2009.
We then identified which patents are truly invented by the
respondents9. To avoid treating different inventors with the same name as
the same person, we used only the patent applications whose inventor’s
name appears only for one company. This matching strategy likely produces
a valid panel data of corporate inventors because the probability of different
persons who have the same name appear only in one particular company
(and nowhere else) is quite low in Japan10. While this procedure caused us to
9 Since inventor mobility is larger for smaller firms, our sample is somewhat biased towards large
companies. 91% of our inventors come from companies that employ more than 500 employees.
10 Japanese names have a lot of variety in both family name and first name (typically three or four
different Chinese characters are used for a name). For example, the most frequently used name is
Minoru Tanaka in the overall Japanese telephone directory database for 2001, and the frequency with
which this name appeared is only 2,620 out of 30,552,849 records. As a result, the probability of such
name appearing for an inventor is only less than 1/10,000. Since the distribution of the frequency of
names is highly skewed, almost all names have much lower probability of appearance. To identify

17
lose all those inventors who moved from one company to another, we could
focus on inventors who stayed in the same company until retirement, a
practice that is quite typical in Japan.
After these screening procedures, we were left with 1,978 inventors
and their corresponding patents. From here, we further screened our sample
by removing those respondents whose age at which he created his first
invention age was younger than the age when the inventor was employed
first time.
3.2. Explanations of output indicators
We used an inventor’s number of applications as an indicator of
his/her innovative output. However, almost all patent applications are
contributed to by multiple inventors, and a whole patent count which
attributes each patent to each inventor regardless of the number of inventors
tends to inflate the innovative output of an inventor who invents primarily
as a team. This is especially the case when forward citation counts are used
as output measures, since using a whole patent count approach results in whether an inventor belongs to one company or not, we used the patent applicant database provided
by Onishi et al. (2012).

18
double or more counting of the same forward citations made. To cope with
this problem, we use fractional counts as one patent divided by the number
of inventors11.
In addition, we counted the number of forward citations which each
patent received from other patents, so as to develop data related to
quality-adjusted outputs. The number of forward citations a patent receives
is correlated with that patent’s quality (Hall, Jaffe and Trajtenberg, 2005;
Haroff, Scherer and Vopel, 2003). To ensure consistency of our indicator over
time, we used only the citation count by patent examiner. Finally, to cope
with truncations of forward citations, we counted the number of forward
citations which each patent received within five years following its
application.
As shown in Figure 1, the life-cycle number of patents per an inventor
(fractional counts) nearly follows a log-normal distribution. That is, it has a
highly skewed distribution whereby most inventors have a relatively small
number of patent applications. Narin and Breitzman (1995) noted that this
was particularly salient for industrial inventors in a few firms. On average,
11 We show the results based on whole counts in appendix table 1 for a robustness check.

19
each inventor had 9.1 patents. Similarly, the number of citations an inventor
receives also nearly follows a log-normal distribution (see Figure 2).
Inventors received, on average, 16.8 forward citations for the cumulative
total of all his patent applications.
(Figure 1 and 2)
4. ESTIMATION MODELS AND METHODOLOGY
4.1. Cross section estimation based on cumulative outputs
We first use cross sectional data, with the cumulative patent counts
and forward citations received by these patents (within the first 5 years from
patent applications) as dependent variables. The estimation equation is:
ln(������� ������) = ∑ ��� ���������� + ���� + ����� (1)
Here the dependent variables are the natural log of the number of
patent applications or the number of forward citations received by inventor i.
The dependent variables were then transformed into natural logarithmic

20
forms because the distributions of these variables follow approximately
log-normal distributions. Education dummies indicate each inventor’s level
of education. X is a vector of control variables (see explanations for these
control variables below). Equation (1) does not include the length of an
inventor’s active span, so the coefficient for an explanatory variable (such as
an education dummy) reflects both its effect on annual productivity and the
length of inventive time span. We control for cohort years (our sample’s main
cohorts cover birth years from 1946 to 1975), technology areas, and firms.
To measure annual productivity, we used the following equation:
������� ������������� ��!
= ∑ ��� ���������� + ���� + ����� (2)
We use two measures for inventive span in the denominator . The first is
from the year in which the inventor was first employed to the last year in
which he was employed12. The second is from eighteen years old to the last
year in which he invented. The former measures inventors’ productivity in
terms of their actual employment spans. The latter is an indicator of
life-cycle productivity, taking into account the opportunity cost of attending 12 Last year of inventive span is truncated by the patent data limitation. In order to control for this,
we use cohort dummy as independent variables as explained bellow.

21
schools to obtain a BA degree or higher.
Educational level:Educational level:Educational level:Educational level: To measure education level, we use the following
dummy variables: (a) the BA degree dummy, (b) the MA degree dummy, (c)
the traditional PhD degree dummy, and the PhD-DO dummy. The
appropriate dummy variable is assigned according to participants’ responses
to questions regarding their highest degree at the time of their first
invention as well as the registry of PhDs13. The reference group for these
dummy variables is two year college degree or lower. With these variables,
we investigate how different levels of education contribute to inventive
productivity after controlling for workplace characteristics, inventor
motivations, technological areas, and inventor ability. One of our primary
focuses is the comparison between the traditional PhDs and PhDs-DO with
respect to their inventive productivity. If the two types of PhDs perform
comparably as corporate inventors, it would suggest that the screening or
certification function of a university is very important, or perhaps dominant,
in enhancing inventive productivity.. If traditional PhD performs 13 To identify these two types of PhDs, we used Doctoral Dissertation Bibliographic Database which is
provided by National Diet Library and National Institute of Informatics.

22
significantly better than PhDs-DO with respect to inventive productivity, it
would imply that additional graduate education does provide significant
added value to inventive productivity14.
To test these relationships, we must control for several potential
confounding influences. These variables are the characteristics of workplace,
firm characteristics, personal motivations and profiles, and technology. It is
to the explication of these control variables to which we now turn.
Workplace:Workplace:Workplace:Workplace: We introduce the variables related to workplace to indicate which
type of a unit the inventor belonged to when they invented the patent of
interest. The types of unit are categorized as independent laboratory,
laboratory attached to manufacturing division, software development
division, manufacturing division, and other division. We use manufacturing
unit as the reference group. These variables give us important information
on how much time an inventor can devote to his invention and how many
complementary assets he has at his disposal for his inventive work. A PhD
14 Another possibility is lower standard for PhDs-DO in certification. However, there seems to exist no
consensus view on the level of standard for PhD-DO vs. that for traditional PhD.

23
inventor may look to be productive not because he has higher human capital
but because he is given more time and resources for inventions. This variable
controls for such a confounding effect.
Research stage:Research stage:Research stage:Research stage: The research stage at which respondents performed their
work was also included as a control variable. The questionnaire asked the
inventor to identify whether he was engaged in basic research, applied
research, development, technical service or others (multiple choices are
allowed). A PhD inventor may look to be productive simply he is engaged
more in basic research. This variable controls for such a confounding effect.
Firm Firm Firm Firm fixed fixed fixed fixed effectseffectseffectseffects and firm patent applicationsand firm patent applicationsand firm patent applicationsand firm patent applications:::: We controlled for firm
characteristics with the firm dummies or firm fixed effects. These variables
control for the firm’s complementary assets, the internal knowledge stock,
and the natural logarithm of the number of patent applications by the firm
each year. This variable controls for firm size change as well as the firm’s
propensity for developing patent applications over time.

24
Motivation: Motivation: Motivation: Motivation: The questionnaire also asked the inventors about the
importance of their motivations for invention. Some of these motivations
included scientific contributions, challenge, contribution to firm performance,
career advancement, improved working conditions, and pecuniary
motivation. This was assessed with five-point Likert scale items ranging
from very important to absolutely not important. If their answer was very
important or important, this variable was coded as 1. Otherwise, it was
coded as 0.
Gender: Gender: Gender: Gender: We use gender of the inventor as an independent variable. If the
inventor is male, gender was coded as 1; otherwise, it was coded as 0.
TechnologicalTechnologicalTechnologicalTechnological dummiesdummiesdummiesdummies and cohort dummies: and cohort dummies: and cohort dummies: and cohort dummies: To control for the technological
areas in which the inventor worked, we included technological area dummies,
which were determined by the most frequent IPC class of the patent
applications by each inventor15. Finally, to control for a cohort effect on
patent productivity, we included cohort dummy variables in our estimation 15 We constructed dummy variables in accordance with IPC sub-class. As a result, the number of
technological dummies was 258.

25
equation.
TTTT----scorescorescorescore ((((aaaa measure of measure of measure of measure of inventor ability)inventor ability)inventor ability)inventor ability): To control for the effect of
independent inventor abilities, we used T-score calculated using the entrance
exams from university which the inventor attended16. Unfortunately, our
sample was reduced when we included this variable because T-score was
available only for the inventors with degree higher than a BA. We obtained
this data from Kawai-jyuku, which is one of the largest preparatory schools
in Japan17.
Table 2 shows the mean scores for major variables by educational level.
There are significant mean differences between levels of education with
regard to all of four variables related to patent output. Both types of
PhD-holding inventors largely belong to independent laboratory (84% for
16 This variable may indicate education quality for university education because a high T-score
university is also high research university. Therefore, the effect of education level on patent outputs
may be underestimated with the T-score variable.
17 We deduct 5 points from T-scores for private universities because T-scores for private universities
tend to be higher, since they impose fewer number of exam subjects on examinees than t national
universities

26
inventors with traditional PhDs and 95% for inventors with PhD-DO). Their
projects often cover basic research (46% for inventors with traditional PhDs
and 48% for inventors with PhD-DO), relative to those inventors with other
education levels. In these two respects, the two types of PhD-inventing
inventors are very similar. On the other hand, the average length of the
inventive span is around 7 years longer for inventors with PhD-DO than for
those with traditional PhDs (25 years vs. 18 years). We will investigate why
PhDs-DO have so long inventive span after controlling for cohort effects in
the paper. While cumulative patent outputs are similar between the two
types of PhD-holding inventors, the annual productivity of the inventors
with traditional PhDs is significantly higher than those with PhD-DO18.
Furthermore, PhD-DO holders graduated from the universities with the
highest T-score, indicating that these inventors have significantly higher
inventive ability.
18 While means of the annual productivity of PhD-DO holders are same as those of BA holders,
differences between the two groups are much larger after including technological dummies in the
estimation results. This reason is that PhD-DO holders in the sample are often in the chemical or
medical science area which produces less number of patent applications relative to IT or electronics
area.

27
(Table 2)
4.2. Panel estimation
Next, to investigate the determinants of life-cycle inventive profile
within a firm, we develop a panel estimation model. This also allows us to
control for time-invariant unobserved heterogeneity among inventors.
Though a fixed-effect model is the most suitable for this procedure, it does
not allow us to estimate the effect of time-invariant variables such as
education level. To cope with this problem, we employ a Hausman-Taylor
random effect model (Hausman and Taylor, 1981). Through this model, we
can identify the effect of the variables which are potentially correlated with
unobserved individual characteristics by using exogenous variables as
instruments after fixed effects are estimated. That is, instrumental variables
are composed of the exogenous time-variant and time-invariant variables in
the equation. We estimate inventor’s life-cycle productivity profile with
Equation (3):
ln(�����"�� ������") = ∑ ��� ���������� + #$�%����� �" +����
28
#��%����� �"� + ���� + � + & + �" (3)
Here the dependent variables are the natural logarithm of fractional
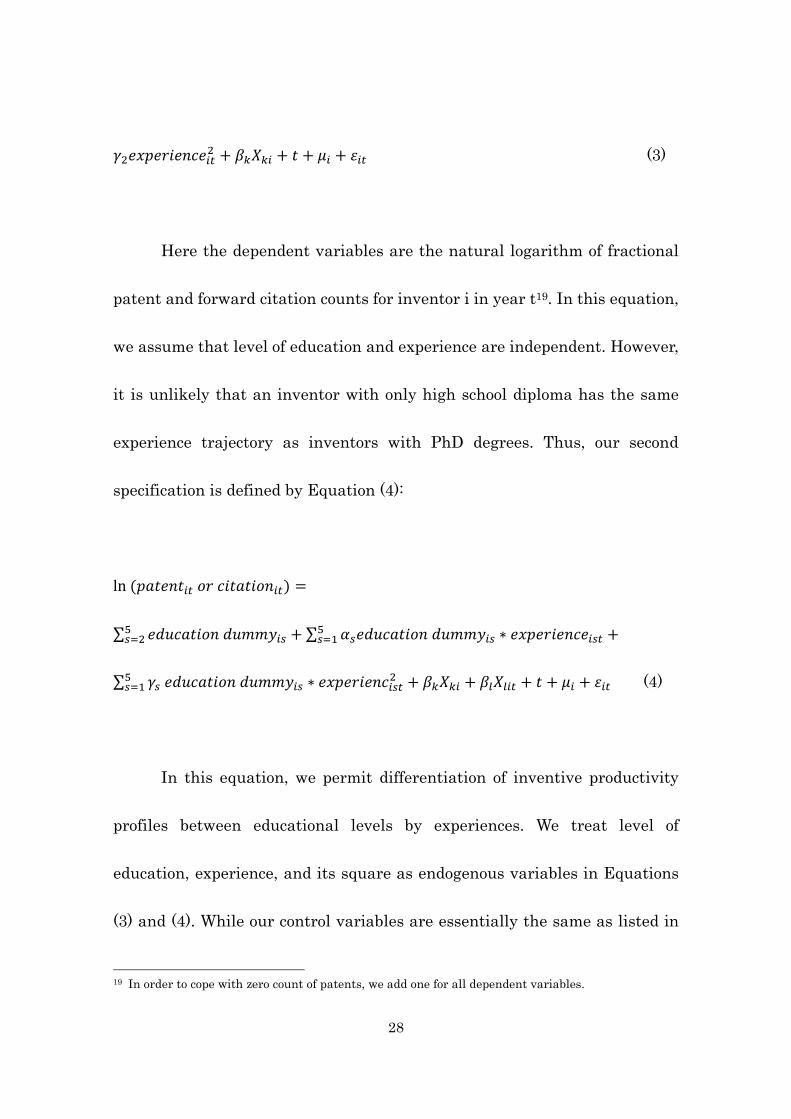
patent and forward citation counts for inventor i in year t19. In this equation,
we assume that level of education and experience are independent. However,
it is unlikely that an inventor with only high school diploma has the same
experience trajectory as inventors with PhD degrees. Thus, our second
specification is defined by Equation (4):
ln(�����"�� ������") =
∑ ��� �������������� + ∑ '���� ���������� ∗ �%����� ��"
���$ +
∑ #���� ���������� ∗ �%����� �"��
��$ + ���� + �)�)" + � + & + �" (4)
In this equation, we permit differentiation of inventive productivity
profiles between educational levels by experiences. We treat level of
education, experience, and its square as endogenous variables in Equations
(3) and (4). While our control variables are essentially the same as listed in
19 In order to cope with zero count of patents, we add one for all dependent variables.

29
Equation (2), the number of patent applications by each firm in year t
becomes a time-variant variable in Equations (3) and (4).
4.3. Estimation of exit from inventive activity
Finally, to know determinants of inventive span, we analyze how
education level are associated with an inventor’s exit from his/her inventive
activity. To do so, we employ a Cox Proportional Hazard model to estimate
the likelihood of exit from inventive activity, taking into account the
truncations. We prepare the duration data starting with the year in which
the focal patent was applied. In addition, we define the year in which an
inventor applied for a patent finally as the exit year. Following this, we need
to distinguish the exit and right side truncation of patent data. Figure 3
gives the distribution of the last year when an inventor applied for a patent.
This indicates that the peaks of the distribution occur after 2005. Many
inventors are truncated simply because their inventive activity has not yet
been reflected into the patent data. We decided to use the last year before
2004 as the actual exit year. In our view, this criterion is a conservative one

30
(Figure 3)
We specify the hazard function h(t) following Equation (5):
ℎ(�) = ℎ+�%�(∑ ��� ���������� + #$�,�" + #��,�"� + ���� + �)�)" +
����
& + �") (5)
Here, ℎ+isthebaselinehazard, andℎ(�)isthe exit rate at time t when
the inventor stops his/her inventive activity. All covariates in the exponents
are shift parameters of the hazard rate. We include education level,
workplace, research stage, motivation, gender, technological dummies and
cohort dummies as time-invariant covariates. Further, we treat the
inventor's age and the age square as time-variant covariates. Since Japanese
companies traditionally implement seniority systems, age may be an
important factor for exit. Other time-variant covariates include the average
number of co-inventors with whom the inventor invented during his/her
career, the number of patent applications by each firm in year t, and year
dummies.

31
5. ESTIMATION RESULTS
5.1. Estimation results of cross sectional analysis
First, we explain the major estimation results based on cross-section
cumulative life-cycle outputs. Here the observations are individual
respondents. Table 3 reports the regression results from Equations (1) and
(2)20. The first year of inventive activity is defined as the first year of
employment in these estimations. Columns 1 to 4 of Table 3 are the results
without including the variables for workplaces and research stages; Columns
5 to 8 are the results with these variables included.
(Table 3)
All coefficients associated with the level of education variables are
significantly positive for the number of patent applications and forward
citations. Further, the coefficients increase with the level of education in all
estimations. These results indicate that a higher level of education is 20 The results of these estimations based on whole counts of patent outputs are quite similar, and
reported in the Appendix.
32
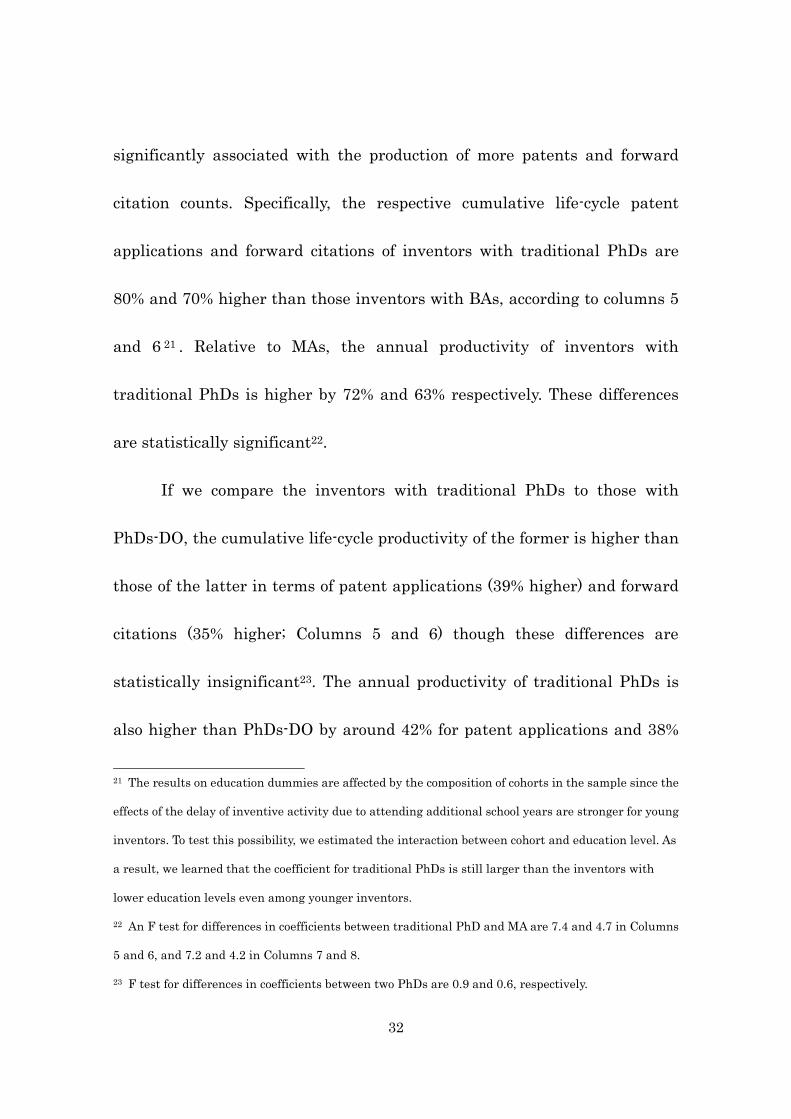
significantly associated with the production of more patents and forward
citation counts. Specifically, the respective cumulative life-cycle patent
applications and forward citations of inventors with traditional PhDs are
80% and 70% higher than those inventors with BAs, according to columns 5
and 6 21 . Relative to MAs, the annual productivity of inventors with
traditional PhDs is higher by 72% and 63% respectively. These differences
are statistically significant22.
If we compare the inventors with traditional PhDs to those with
PhDs-DO, the cumulative life-cycle productivity of the former is higher than
those of the latter in terms of patent applications (39% higher) and forward
citations (35% higher; Columns 5 and 6) though these differences are
statistically insignificant23. The annual productivity of traditional PhDs is
also higher than PhDs-DO by around 42% for patent applications and 38%
21 The results on education dummies are affected by the composition of cohorts in the sample since the
effects of the delay of inventive activity due to attending additional school years are stronger for young
inventors. To test this possibility, we estimated the interaction between cohort and education level. As
a result, we learned that the coefficient for traditional PhDs is still larger than the inventors with
lower education levels even among younger inventors.
22 An F test for differences in coefficients between traditional PhD and MA are 7.4 and 4.7 in Columns
5 and 6, and 7.2 and 4.2 in Columns 7 and 8.
23 F test for differences in coefficients between two PhDs are 0.9 and 0.6, respectively.

33
for forward citations, according to Columns 7 and 8. However, these
differences are also insignificant24.
With respect to research stage, the coefficients associated with basic
research are significantly positive for patent outputs. Inventors who engage
in basic research have 35% more patents and 28% more citations in terms of
cumulative output and 31% more patents and 23% more forward citations in
terms of annual productivity. The difference between cumulative output and
annual productivity in favour of basic research suggests that an inventor
working in basic research tends to have a longer professional life as an
inventor than those that engage in research at other levels. Conversely, the
technical service dummy variable is significantly negative for forward
citations indicating a reduction in annual productivity by 25%.
The independent laboratory variable is also significantly positive for
all output variables. Similar to basic research, inventors who work in
independent research laboratories have higher patent productivity in terms
of both patent counts and citation counts (90% and 71% respectively for
life-cycle productivity and 100% and 66% respectively for annual
24 F test for differences in coefficients between two PhDs are 1.3 and 0.8, respectively.

34
productivity). Thus, working in an independent research laboratory
significantly increases an inventor’s research productivity.
As shown in Table 2, both types of PhDs work significantly more on
basic research and in independent laboratories. In addition, the coefficients
associated with education level in column 1 to 4 are larger than those in
Column 5 to 8 of Table 3 (around 20% higher in the case of a traditional PhD).
This suggests that without controlling for research stage and workplace, we
will significantly overestimate the effect of education on patent outputs.
With respect to individual characteristics, males produce significantly
more patents in terms of fractional counts. A preference for challenge is
significantly positive for patent outputs in Columns 1 to 4.
Table 4 presents the estimations associated with Equation (2). The
first year of inventive activity is set at eighteen years old to account for the
delay due to time spent pursuing a higher level of education. The coefficient
associated with the traditional PhD variable decreased most, nearing the
level of PhDs-DO. This indicates that the delay in starting inventive work
due to the pursuit of higher education is significant but also that this delay is
completely overcome as the inventive output of traditional PhDs still exceeds

35
that of PhDs-DO.
(Table 4)
The effect of education level may also be overestimated since they do
not control for the inventor's inherent ability. An inventor with higher ability
is more likely to pursue higher education to refine his craft. To address this
possibility, we estimate Equations (1) and (2) by adding a T-score variable
associated with inventor ability as a control. In this estimation, we lose the
respondents with an education level associated with a two-year college or
less from our sample. Columns 1 to 4 in Table 5 are the results of this
estimation with the T-score control included and Columns 5 to 8 are the
estimations without the T-score variable. The coefficients associated with the
T-score variable are significant and positive for patent outputs. This confirms
the importance of inventor ability on patent productivity.
The comparison between two groups of the estimates suggests that the
difference of the coefficients between PhDs and MAs do not significantly
change after including a T-score variable, while those of MAs relative to

36
those of BAs decline and become insignificant. This indicates that there is no
significant difference in inventor ability between MAs and PhDs so that the
productivity difference can be significantly attributed to PhD education,
while this difference may exist between BAs and MAs. While the coefficients
of traditional PhD inventors remain significant and positive in all columns,
the coefficients associated with PhDs-DO are insignificant except in column
1. However, the difference between the coefficients of the two types of PhDs
does not significantly change. These results indicate that controlling for the
ability of inventors does not significantly influence the difference between
different graduate degrees, suggesting that such difference in the level of
graduate educations matters in inventor productivity.
(Table 5)
5.2. Estimation results based on panel data
Before estimating the Hausman-Taylor random-effect model, we
regressed Equations (3) and (4) using the fixed-effect model (fixed effect
given for each inventor), in order to get consistent estimates of the slope

37
coefficients with respect to experiences. The results are shown in Columns 1
to 4 of Table 6. The coefficients for experience are significantly positive while
the coefficients for the square terms are significantly negative for both
outputs in Column 1 and 2. Further, these results are robust after allowing
for interactions between the education level and experience in Columns 3
and 4, although the interaction terms associated with the square of
experience are not significant at the highest education levels. This result
produces a simple inverted U-shape relationship between experience and
patent productivity, especially pronounced at the lower education level. The
initial slopes with experience do not vary significantly across education
levels, according to the estimation results. BA and PhD-DO have the largest
coefficients.
Using these estimation results, the experience-related yearly profile of
patent and citation counts by education level are shown in Figures 4 and 5.
The slope for PhDs-DO is steeper than those for the other education levels25.
This indicates a strong within-firm learning curve for those who seek for a
25 While we estimate Equation (4) with an additional time variant dummy variable which is 1 if
inventor obtains PhD-DO degree and is 0 otherwise, this variable is not significant in any
specifications.

38
PhD while working and/or their increased deployment to tasks favorable for
inventions.
(Table 6)
(Figure 4 and 5)
Table 7 shows that the results of Equation (4) using a
Hausman-Taylor random-effect model. As mentioned above, this method can
estimate time-invariant variables after controlling for unobserved
heterogeneity among inventors. In Table 7, Column 1 for patent outputs and
Column 2 for citation outputs are estimated, allowing for the interaction
effects between the education level and experience. With respect to the fixed
effects of education levels, the coefficients for both types of PhDs are
significantly positive for forward citations and the highest, but only that for
traditional PhDs is significantly positive for patent application counts. The
fixed-effect coefficient of traditional PhDs remains higher than that of
PhDs-DO. Using the estimation results, the experience-related yearly profile
39
of patent and citation on counts by education level are shown in Figures 6
and 7. Traditional PhDs produce more patents and forward citations than
PhDs-DO. This indicates that while a rapidly increases his productivity as
he gains experience, the productivity of a traditional PhD remains
significantly higher during the average inventive span.
(Table 7)
(Figure 6 and 7)
To investigate the influence of receiving a PhD-DO during their
inventive career, we estimate Equation (4) by differentiating the PhD-DO
dummy variable into two time periods: before and after receiving the
PhD-DO degree. In Table 7, Columns 3 and 4 illustrate the results. While
both PhD-DO dummies are significant and positive for both types of patent
output, there are no significant differences between the two. This indicates
that the award of a PhD-DO degree, in and of itself, does not significantly
affect the resources available for the inventor.

40
The above results indicate that traditional PhD holders have
significantly higher research productivity than inventors with other
education levels. However, they also have a potential loss of inventive
productivity in their younger years because of longer time spent obtaining
higher educations. This begs the question: how quickly can their high
productivity compensate the lost productivity in their younger period? To
answer this question, we calculate when traditional PhD inventors can
recover their potential inventive loss due to delayed start-up by exploiting
the learning time according to the estimation results. In this estimation, we
assume that all inventors start their inventive activity immediately after
graduating. That is, BA inventors begin their inventive activity at age 23,
MA inventors begin at age 25, and traditional PhD inventors begin at age 28.
We additionally assume that PhD-DO inventors have MA degrees and begin
of their inventive activity at age 25. This assumption significantly
overestimates the potential inventive loss of traditional PhD inventors
because the difference between the first job year and first invention year
declines significantly with education level (see Table 8) 26 . That is, an 26 We do not calculate ‘less than two year college’ because it is composed of two groups for which
standard graduate years are different.

41
inventor with a BA degree starts invention in 5 years since its first job year,
while an inventor with a PhD degree starts invention in 2 years.
(Table 8)
Table 9 presents the estimated average time it takes an inventor with
a traditional PhD to surpass the cumulative inventive output of an inventor
with the other education levels, by using the results in Columns 1 and 2 of
Table 7. Cumulative invention productivity of traditional PhD inventors
surpasses that of PhD-DO inventors in approximately 4.6 years for patents
and 5.3 years for forward citations. This time frame is somewhat shorter
among BA and MA inventors. These results indicate that traditional PhD
inventors recover their potential invention loss due to their late start fairly
quickly (within at least 5.3 years, on average), even if we assume that they
are late by the full length of their additional educational period.
(Table 9)

42
5.3. Estimation results of exit analysis
Table 10 shows the results of estimating the hazard model for exit
from inventive activity. Column 1 in Table 10 presents the the results
estimated without research stage and workplace as controls. Column 2, by
contrast, includes these control variables. Results suggest that rate of exit
decreases with education level. The coefficients associated with both types of
PhDs are significant and negative for exit in Column 1 and 2. Further,
PhDs-DO have a lower exit rate than traditional PhDs. Specifically, when
compared to baseline, the exit rate for traditional PhD inventors and for
PhD-DO inventors is 62% and 69% lower respectively. Moreover, the rate for
exit for PhDs-DO is significantly negative even after controlling for inventor
ability (see Column 3). This indicates that if an inventor obtains a PhD-DO
degree, he/she tends to remain in their career as an inventor for a longer
period of time. As such, the awarding of a PhD-DO may serve as a signal in a
firm that such individual deserves a longer career as an inventor.
(Table 10)

43
The age coefficients in Table 10 show that the exit rate is low for
younger respondents, as expected. Moreover, the exit rate drastically
increases with age. This indicates that while young inventors remain in
research workplaces, they exit from their careers as inventors as they
become more senior. Interestingly the exit rate for inventors who engages in
basic research is significantly low. Conversely, the exit rate for inventors who
perform technical services is significantly high. The coefficient associated
with the number of inventors on a given patent is strongly significant and
positive. This result is reasonable because it suggests that the probability
that an inventor in a big team is a core inventor is lower.
5.4. Discussions of the robustness of our findings
We would like to discuss two sources which can potentially affect the
significance of our findings. The first source is our use of fractional counting,
instead of whole counting. A fractional count significantly discounts the
output of a co-invention, even though a fractional counts makes sense when
forward citation counts is used, as pointed out earlier. Table 1 in the
Appendix provides the estimation results for life-cycle cumulative patent

44
counts based on whole counts. The results are essentially the same as those
based on fractional counting. The inventors with traditional PhDs are most
productive, followed closely by inventors with PhD-DO. The gap between the
two types of PhD is a bit larger in the case of whole counts, which suggests
that a traditional PhD inventor works more in a team.
The second potential source is a sampling bias due to our
oversampling of higher quality inventions. Such bias tends to cause a
downward bias of the estimated coefficients of educational levels with
respect to invention performance, since we tend to pick up the inventors with
exceptionally good invention performance for those with lower educational
records. Thus, our estimates of the effects of higher education are
conservative estimates.
6. CONCLUSION
This paper has analyzed the life-cycle inventive productivity of
Japanese industrial inventors, using panel data of 1,731 inventors matched
with firm data. We focused on two issues. First, we examined whether and
how doctoral educations contribute to inventive performance, despite of their

45
delayed start. Second, we explored whether inventors with PhDs obtained
solely by completing a dissertation (PhDs-DO) are similarly productive as
inventors who earn PhDs through more traditional coursework. For these
analyses, we controlled for the types of places at which inventors work, the
types of projects in which they are engaged, inventors’ motivations, firm size,
cohort effects, technology fields and inventor’s abilities. We used the number
of patent applications and the total forward citations the applications
received within five years of their submission as performance measures.
Given this, we found the following:
1. The life-cycle productivity of traditional PhD inventors in terms of both
patent and citation counts is significantly higher than those with less
education even if they are late in joining the firm. The most important
reason for this is a high level of annual productivity of PhD inventors.
Additional source of high life-cycle productivity of traditional PhD inventors
is a short interval between the time an inventor starts his/her job and the
time he/she begins inventing.

46
2. The life-cycle productivity of a PhD-DO inventor is lower than that of a
traditional PhD inventor, but this difference is not statistically significant.
Our survey data suggests that a PhD-DO inventor works in independent
laboratories and engages in basic research as frequently as traditional PhD
inventors. The panel data estimates suggest that PhDs-DO have a steeper
‘learning’ curve and remain inventors for longer periods of time, although
there is no clear award effect. These results suggest that a system that
provides PhDs-DO to corporate inventors may serve as an important
screening and signaling device for encouraging high-ability inventors with
no PhD education to acquire scientific human capital and to move into a
position more suitable for inventions.
3. The Hausman-Taylor estimations suggest that higher productivity
estimates for traditional PhD inventors are robust to an additional control on
the possible correlation between unobserved heterogeneity of inventor ability
and the educational level. Thus, a PhD program functions as an effective
channel for helping an inventor acquire scientific human capital increasing
his inventive productivity.

47
4. Inventor productivity is significantly higher when the inventors belong to
the units dedicated to research, they are involved in basic research, and they
belong to a large firm with a large number of patent applications. In addition,
PhD inventors are more likely to work in those units, for such projects and in
a larger firm. Thus, productivity estimates without considering these
resource and task factors tend to significantly overestimate the influence of
higher education on patent productivity.
Our research shows that a traditional PhD inventor has higher
inventive productivity and can compensate easily for a delayed start to his
inventive career. This holds even if we control for the fact that such an
inventor is more likely to be assigned to a workplace, a project which
generates more patents, and their individual set of abilities. This suggests
that it would be worthwhile for a firm to recognize PhDs as important
sources of innovation. We can also note that PhD inventors are more likely to
generate internal knowledge spillover within a company through his
absorption of external scientific knowledge.
48
However, this raises a new question. Why are many PhDs unable to
find research jobs in the private sector despite their high inventive
productivity. There are various potential reasons for this. One possible
reason relates to an inherent selection bias in our study. The PhDs in our
sample have already been employed. Therefore, our sample consists of the
inventors whose specialization and capability are matched to the demands of
their employer or are suitable for inventive activity in private sector. If
specialization is more important for PhDs, the mismatch between demand
and supply may be more pronounced for PhDs.
A second potential reason is that there is asymmetric information
between PhDs and companies in the job market. As mentioned above, the
number of PhDs employed by companies is still quite low in Japan. As a
result, companies have not been able to effectively gauge their potential
inventive productivity and to develop the career plans exploiting fully the
potential of PhD inventors.
A third potential explanation for the lack of widespread PhD
employment relates to the expectations for multi-tasking by corporate
researchers in Japan. Inventive productivity is only one characteristic that a

49
new PhD hire must have. For example, they are expected to effectively
engage in technology transfer to the manufacturing sector. They may also be
expected to take on management roles within the company. These multi-task
expectations for inventors in Japan suggest that even traditional PhD
holders cannot continue their inventive activity in their late 40s, so that they
may not be able to realize fully the outputs of their human capital
Unfortunately, we do not have sufficient data to test these views, although
we plan to do so in the future.
Our evidence also shows that a system of PhD-DO is a useful
complement for traditional PhD. PhD-DO inventors are productive and
remain active for relatively long periods of time. Our evidence suggests that
a PhD-DO inventor realizes his inventive potential over time and will gain
the skills needed to take on more inventive jobs as he develops. As such, a
system for PhDs-DO seems to provide an incentive for a corporate inventor
to deepen his scientific understanding of the invention process under the
support of the firm. While the PhD-DO educational track is being phased out
in Japan, it will prove useful to retain the positive aspects of this system in
the new design of graduate education.

50
Acknowledgements: The authors are grateful for helpful comments and
suggestions by Masahisa Fujita, Masayuki Morikawa, Yoichiro Nisimura,
Yosuke Okada, Hideo Owan, Jun Suzuki, Naotoshi Tsukada, Tetsuo Wada
and the other participants in research seminar at RIETI. All remaining
errors are our own.

51
REFERENCESREFERENCESREFERENCESREFERENCES
AGIHON, P., BOUSTAN, L., HOXBY, C. and VANDENBUSSCHE, J. (2009),
“The Causal Impact of Education on Economic Growth: Evidence from
U.S.” (Working Paper, Harvard University)
ALLISON, P. D. and STEWART, J. A. (1974), “Productivity Differences
among Scientists: Evidence for Accumulative Advantage”, American
Sociological Review, 39393939, 596–606.
BASER, O. and PEMA, E. (2004), “Publications over the Academic Life-cycle:
Evidence for Academic Economists”, Economics Bulletin, 1111, 1–8.
BECKER, G. S. (1964), “Human Capital” (New York: Columbia University
Press).
CARD, D. (1999), “The Causal Effect of Education on Earnings”, in
Ashenfelter, O. and D. Card (eds) Handbook of Labor Economics 3
(Amsterdam, Netherlands: Elsevier).
COHEN, W. M. and LEVINTHAL, D. A. (1989), “Innovation and Learning:
The Two Faces of R&D”, The Economic Journal, 99999999, 569–596.
CYRANOSKI, D, GILBERT, N., LEDFORD, H., NAYAR, A. and YAHIA, M.,

52
2011. “The PhD Factory”, Nature, 472472472472, 276–279.
DIAMOND, A. M. (1986), “The Life-Cycle Research Productivity of
Mathematicians and Scientists”, Journal of Gerontology, 41414141, 520–525.
DONALD, D. R. and VESOVIC, J. (2006), “Educational Wage Premiums and
the U.S. Income Distribution: A Survey”, in Hanushek, E. A. and Welch,
F. (eds) Handbook of the Economics of Education 1 (Amsterdam,
Netherlands: Elsevier).
FOX, J. T. and SMEETS, V. (In press), “Does Input Quality Drive Measured
Differences in Firm Productivity?”, International Economic Review.
HAUSMAN, J. A. and TAYLOR, W. E. (1981), “Panel Data and Unobservable
Individual Effects”, Econometrica, 49494949, 1377–1398.
HALL, B. H., JAFFE, A.B. and TRATJENBERG, M. (2005), “Market Value
and Patent Citations”, RAND Journal of Economics, 36363636, 16–38.
HALL, B.H., MAIRESSE, J. and TURNER, L. (2007), “Identifying Age,
Cohort, And Period Effects In Scientific Research Productivity:
Discussion And Illustration Using Simulated And Actual Data On
French Physicists”, Economics of Innovation and New Technology, 16161616,
159–177.

53
HARHOFF, D., SCHERER, F. M. and VOPEL, K. (2003), “Citations, Family
Size, Opposition and the Value of Patent Rights”, Research Policy, 32323232,
1343–1363.
HOISL, K. (2007), “Tracing Mobile Inventors - The Causality between
Inventor Mobility and Inventor Productivity”, Research Policy, 33336666,
619–636.
HOISL, K. (2007), “A Closer Look at Inventive Output - The Role of Age and
Career Paths”, Munich School of Management Discussion Paper No.
2007-12.
JONES, B. F. (2009), “The Burden of Knowledge and the 'Death of the
Renaissance Man': Is Innovation Getting Harder?”, Review of Economic
Studies, 76767676, 283–317.
KIM, J., LEE, S. J. and MARSCHKE, G. (2004), “Research Scientist
Productivity and Firm Size: Evidence from Panel Data on Inventors”,
(Working Paper, SUNY Albany)
KRUEGER, A. B. and LINDAHL, M. (2001), “Education for Growth: Why
and for Whom?”, Journal of Economic Literature, 39393939, 1101–1136.
LEVIN, S. and STEPHAN, P. (1991), “Research Productivity over the Life

54
Cycle: Evidence for Academic Scientists”, American Economic Review,
81818181, 114–132.
LOTKA, A. J. (1926), “The Frequency Distribution of Scientific Productivity”,
Journal of the Washington Academy of Science, 16161616, 317–323.
MERTON, R. K. (1968), “The Matthew Effect in Science”, Science, 159159159159,
56–63.
MORIKAWA, M. (2012), “Postgraduate Education and Human Capital
Productivity in Japan”, RIETI Discussion Paper 12-E-009.
MINCER, J. (1974), “Schooling, Experience, and Earnings” (New York,
Colombia University Press)
MARIANI, M. and ROMANELLI, M. (2007), “‘Stacking’ and ‘Picking’
Inventions: The Patenting Behavior of European Inventors”, Research
Policy, 36363636, 1128–1142.
NAGAOKA, S. and TSUKADA, N. (2007) “Innovation Process in Japan:
Findings from the RIETI Inventors Survey (in Japanese)”, RIETI
Discussion Paper 07-J-046.
NARIN, F. and BREITZMAN, A. (1995), “Inventive Productivity”, Research
Policy, 24242424 (4), 507–519.

55
OECD. (2010), “OECD Science, Technology and Industry Outlook 2010”,
(OECD Publishing, http://dx.doi.org/10.1787/sti_outlook-2010-en)
ONISHI, K., NISHIMURA, Y., TSUKADA, N., YAMAUCHI, I., SHINBO, T.,
KANI, M. and NAKAMURA, K. (2012), “Standardization and Accuracy
of the Japanese Patent Applicant Names”, IIPR Discussion Paper No.
2012-001.
OSTER, S. M. and HAMERMESH, D. S. (1998), “Aging and Productivity
among Economists”, Review of Economics and Statistics, 80808080, 154–156.
SCHETTINO, F., STERLACCHINI, A. and VENTURINI, F. (2008),
“Inventive Productivity and Patent Quality: Evidence from Italian
Inventors”, MPRA Paper 7765.
SERNEELS, P. (2008), “Human Capital Revisited: the Role of Experience
and Education When Controlling for Performance and Cognitive Skills”,
Labour Economics, 15151515, 1143–1161.
STEPHAN, P. (2011), “How Economics Shapes Science”, (Cambridge, MA:
Harvard University Press).
TOIVANEN, Otto and VAANANEN, L. (2012) “Return to Inventors”, Review
of Economics and Statistics, 94949494, 1173–1190.
TURNER, L. and MAIRESSE, J. (2005), “Individual Productivity Differences

56
in Public Research: How Important are Non-individual Determinants?
An Econometric Study of French Physicists' Publications and Citations.
(1986–1997)”, (Working Paper,
http://piketty.pse.ens.fr/files/Turner2005.pdf).
WALSH, P. J. and NAGAOKA, S. (2009), “Who Invents?: Evidence from the
Japan-US Inventor Survey”, RIETI Discussion Paper 09-E-034.

57
Table 1. Existing studies
Quantity Citation Inventor Firm The others
Hoisl (2007)1)
(Cumulative number of patent applications)
/(age-25) ,
PhD vs. high school or vocational training
insignificant NAAge, mobility,
knowledge sourcesFirm size
2409 German inventors, EPO patents (1977-
2002)
Mariani and
Romanelli (2007)
EPO patent application or grants in 1988-1998,
PhD vs. high school0.27 insignificant Age
Firm size and number
of patentsCo-inventors
793 inventors from Germany, Italy, The
Netherlands and the UK, EPO patents
(1988-1998)
(1)Firm size, capital
intensity, etc.
(2)Fixed effects
Schettino, Sterlacchini
and Venturini (2008)
EPO patent applications (1991-2005),
University or PhD relative to non-university
degree
-0.13 0.17Age,
knowledgesource
Firm size and number
of patentsCo-inventors
743 Italian inventors,EPO partents(1991-
2005)
Assuming an average level of the importance of literature as information source for the invention.
Since their specification has the cumulative number of patents as an explanatory variable, the long-run effect of a PhD is larger than this coefficient.
AuthorsEffects of PhD in terms of elasticity Major Controls
Sample
Kim, Lee and
Marschke (2004)2) 0.07
** NA Age, patent stocks Co-inventors US inventors, US patents (-)Grants per year,
PhD vs. nonPhD degree
Output measures, and comparison base

58
Table 2. Mean statistics by level of educations
2 year college
degree or lessBA MA PhD PhD-DO
1.73 2.15 2.30 2.52 2.47
(1.41) (1.32) (1.24) (1.16) (1.31)
2.29 2.76 2.97 3.16 3.06
(1.53) (1.38) (1.33) (1.27) (1.44)
-1.35 -0.78 -0.50 -0.32 -0.73
(1.29) (1.17) (1.07) (1.04) (1.24)
-0.79 -0.16 0.16 0.33 -0.14
(1.44) (1.25) (1.17) (1.19) (1.41)
23.71 20.35 17.99 18.48 25.25
(9.14) (7.61) (7.15) (6.56) (5.98)
1960.12 1960.95 1963.04 1960.41 1955.29
(8.01) (6.83) (6.50) (6.96) (5.40)
128.14 117.46 120.03 102.30 129.41
(66.19) (55.79) (50.17) (37.12) (57.22)
0.97 0.98 0.99 0.96 0.98
(0.16) (0.15) (0.12) (0.19) (0.13)
0.13 0.11 0.23 0.46 0.48
(0.34) (0.31) (0.42) (0.50) (0.50)
0.28 0.27 0.42 0.54 0.57
(0.45) (0.45) (0.49) (0.50) (0.50)
0.67 0.78 0.67 0.46 0.39
(0.47) (0.41) (0.47) (0.50) (0.49)
0.20 0.11 0.08 0.05 0.04
(0.40) (0.31) (0.26) (0.23) (0.19)
0.09 0.08 0.03 0.04 0.00
(0.28) (0.27) (0.17) (0.19) (-)
0.05 0.05 0.02 0.02 0.00
(0.23) (0.21) (0.15) (0.13) (-)
0.17 0.16 0.14 0.11 0.05
(0.38) (0.36) (0.34) (0.31) (0.23)
0.54 0.66 0.77 0.84 0.95
(0.50) (0.47) (0.42) (0.37) (0.23)
- 49.02 55.51 57.74 61.02
(9.63) (8.34) (7.89) (5.49)
Inventive span is based on the first employed year as the initial year.
Standard deviations are in parentheses.
* p<0.1, ** p<0.05, *** p<0.01
other division***
software development division**
laboratory attached to manufacturing division
independent laboratory***
T-score***
technical service***
ln(patent)***
ln(citation)***
ln(patent/span)***
ln(citation/span)***
inventive span***
birth year***
log(firm patents)**
male
basic research***
applied research***
development***

59
Table 3. Life-cycle cumulative patent outputs and average productivity with
cohort dummies
ln(patent) ln(citation) ln(patent/span) ln(citation/span) ln(patent) ln(citation) ln(patent/span) ln(citation/span)
(1) (2) (3) (4) (5) (6) (7) (8)
0.012***
0.010***
0.005**
0.003 0.012***
0.010***
0.005**
0.003
(0.003) (0.003) (0.002) (0.002) (0.003) (0.003) (0.002) (0.002)
0.015 0.034 0.011 0.030 -0.039 -0.013 -0.028 -0.002
(0.088) (0.096) (0.077) (0.086) (0.087) (0.095) (0.077) (0.086)
0.220*
0.246*
0.223**
0.248**
0.168 0.183 0.178 0.192
(0.129) (0.138) (0.112) (0.123) (0.126) (0.135) (0.111) (0.122)
-0.065 -0.042 -0.081 -0.058 -0.051 -0.029 -0.067 -0.044
(0.080) (0.085) (0.071) (0.077) (0.079) (0.085) (0.070) (0.078)
-0.161 -0.185*
-0.142 -0.166*
-0.134 -0.162 -0.119 -0.146
(0.100) (0.110) (0.089) (0.100) (0.098) (0.109) (0.088) (0.100)
0.222*
0.212*
0.210**
0.200*
0.207*
0.184 0.195**
0.171
(0.114) (0.124) (0.098) (0.111) (0.111) (0.122) (0.097) (0.109)
0.026 0.01 -0.012 -0.028 -0.027 -0.042 -0.052 -0.067
(0.107) (0.118) (0.098) (0.110) (0.105) (0.118) (0.097) (0.110)
0.095 0.151 0.103 0.159 0.087 0.142 0.097 0.152
(0.101) (0.109) (0.089) (0.099) (0.096) (0.105) (0.085) (0.095)
0.477*
0.351 0.402*
0.277 0.603***
0.466 0.495**
0.358
(0.252) (0.304) (0.225) (0.270) (0.233) (0.295) (0.210) (0.262)
0.303***
0.267**
0.243***
0.207*
(0.103) (0.115) (0.093) (0.106)
0.098 0.109 0.065 0.076
(0.085) (0.093) (0.076) (0.085)
0.095 0.055 0.069 0.028
(0.095) (0.104) (0.086) (0.096)
-0.164 -0.235 -0.176 -0.247*
(0.137) (0.151) (0.125) (0.140)
0.082 0.185 0.043 0.146
(0.245) (0.276) (0.221) (0.254)
0.052 0.237 0.115 0.3
(0.255) (0.279) (0.226) (0.252)
0.488**
0.548**
0.422**
0.483**
(0.201) (0.221) (0.184) (0.203)
0.641***
0.722***
0.538***
0.620***
(0.191) (0.210) (0.173) (0.192)
0.437***
0.391**
0.468***
0.422***
0.386***
0.336**
0.426***
0.376***
(0.149) (0.161) (0.135) (0.148) (0.142) (0.154) (0.130) (0.142)
0.739***
0.761***
0.739***
0.761***
0.635***
0.652***
0.653***
0.670***
(0.168) (0.176) (0.149) (0.158) (0.161) (0.170) (0.144) (0.155)
1.413***
1.386***
1.361***
1.333***
1.223***
1.182***
1.198***
1.157***
(0.275) (0.298) (0.250) (0.280) (0.276) (0.302) (0.253) (0.286)
1.167***
1.161***
1.073***
1.067***
0.897***
0.883***
0.847***
0.833***
(0.224) (0.247) (0.202) (0.230) (0.224) (0.248) (0.202) (0.231)
-1.902**
-1.38 -5.106***
-4.584***
-1.975***
-1.595**
-4.131***
-3.751***
(0.894) (1.008) (0.843) (0.958) (0.563) (0.649) (0.507) (0.602)
Adj. R square 0.445 0.43 0.45 0.437 0.477 0.456 0.476 0.458
Observation 1736 1736 1736 1736 1731 1731 1731 1731
Patent output indicators are fractional counts.
Estimation method is OLS.
The beginning of inventive span is the first year inventor worked.
Firm dummies, technological dummies and cohort dummies are included in all equations.
Robust standard errors are in parentheses.
* p<0.1, ** p<0.05, *** p<0.01
MA degree
PhD degree
PhD degree(dissertation only)
_cons
technical service
other division
software development division
laboratory attached to
manufacturing division
independent laboratory
BA degree
development
motivation: money
ln(firm patents)
male
basic research
applied research
motivation: sciense
motivation: challenge
motivation: performance
motivation: career
motivation: reputation
motivation: benefit

60
Table 4. Life-cycle average productivity with cohort dummies (based on the
standardized first year of 18 years old)
ln(patent/span) ln(citation/span)
(1) (2)
0.009***
0.008**
(0.004) (0.004)
-0.039 -0.012
(0.082) (0.090)
0.169 0.185
(0.115) (0.126)
(0.035) (0.014)
(0.075) (0.081)
-0.147 -0.172*
(0.091) (0.102)
0.196*
0.173
(0.101) (0.112)
-0.046 -0.062
(0.100) (0.113)
0.067 0.125
(0.090) (0.100)
0.547**
0.407
(0.217) (0.274)
0.258***
0.222**
(0.098) (0.109)
0.078 0.09
(0.082) (0.089)
0.088 0.047
(0.091) (0.100)
-0.137 -0.212
(0.131) (0.145)
0.143 0.237
(0.229) (0.260)
0.152 0.331
(0.239) (0.260)
0.521***
0.573***
(0.188) (0.206)
0.655***
0.728***
(0.178) (0.196)
0.178 0.155
(0.129) (0.141)
0.276**
0.335**
(0.137) (0.144)
0.583**
0.613**
(0.239) (0.263)
0.449**
0.482**
(0.208) (0.233)
-4.438***
-4.052***
(0.544) (0.628)
Adj. R square 0.454 0.441
Observation 1731 1731
Patent output indicators are fractional counts.
Estimation method is OLS.
The beginning of inventive span is the first year inventor worked.
Firm dummies, technological dummies and cohort dummies are included in all equations.
Robust standard errors are in parentheses.
* p<0.1, ** p<0.05, *** p<0.01
_cons
development
technical service
other division
software development division
independent laboratory
BA degree
motivation: reputation
motivation: benefit
motivation: money
male
basic research
applied research
laboratory attached to
manufacturing division
MA degree
PhD degree
PhD degree(dissertation only)
ln(firm patents)
motivation: sciense
motivation: challenge
motivation: performance
motivation: career

61
Table 5. Life-cycle cumulative patent outputs and average productivity with
cohort dummies and T-score
ln(patent) ln(citation) ln(patent/span) ln(citation/span) ln(patent) ln(citation) ln(patent/span) ln(citation/span)
(1) (2) (3) (4) (5) (6) (7) (8)
0.014***
0.012***
0.007**
0.005*
0.013***
0.012***
0.006**
0.005*
(0.003) (0.003) (0.003) (0.003) (0.003) (0.003) (0.003) (0.003)
-0.073 -0.103 -0.05 -0.081 -0.062 -0.092 -0.042 -0.072
(0.105) (0.112) (0.091) (0.099) (0.106) (0.113) (0.092) (0.100)
0.177 0.19 0.153 0.166 0.197 0.21 0.169 0.182
(0.145) (0.154) (0.127) (0.140) (0.146) (0.155) (0.128) (0.140)
-0.038 -0.015 -0.055 -0.032 -0.048 -0.024 -0.062 -0.039
(0.088) (0.096) (0.077) (0.086) (0.088) (0.096) (0.077) (0.086)
-0.148 -0.193 -0.146 -0.191 -0.178 -0.223*
-0.17 -0.215*
(0.116) (0.130) (0.103) (0.118) (0.119) (0.133) (0.105) (0.120)
0.252**
0.235*
0.246**
0.229*
0.259**
0.241*
0.251**
0.234*
(0.123) (0.137) (0.108) (0.123) (0.124) (0.138) (0.109) (0.124)
0.024 0.032 -0.011 -0.004 0.032 0.039 -0.005 0.002
(0.121) (0.137) (0.112) (0.129) (0.122) (0.138) (0.112) (0.129)
0.111 0.165 0.108 0.162 0.102 0.156 0.101 0.155
(0.108) (0.117) (0.094) (0.105) (0.109) (0.118) (0.095) (0.105)
0.531*
0.289 0.441*
0.2 0.530*
0.288 0.440*
0.199
(0.311) (0.378) (0.261) (0.323) (0.321) (0.390) (0.267) (0.331)
0.273**
0.252*
0.219**
0.198*
0.276**
0.255**
0.222**
0.201*
(0.113) (0.128) (0.102) (0.117) (0.114) (0.128) (0.102) (0.117)
0.129 0.15 0.089 0.11 0.13 0.152 0.09 0.111
(0.091) (0.100) (0.081) (0.091) (0.092) (0.102) (0.082) (0.092)
0.11 0.09 0.079 0.059 0.093 0.073 0.066 0.046
(0.109) (0.121) (0.099) (0.111) (0.109) (0.120) (0.098) (0.111)
-0.103 -0.156 -0.125 -0.178 -0.116 -0.169 -0.135 -0.188
(0.173) (0.186) (0.154) (0.168) (0.171) (0.184) (0.152) (0.167)
-0.022 0.149 -0.03 0.14 -0.028 0.142 -0.036 0.135
(0.292) (0.319) (0.264) (0.291) (0.292) (0.316) (0.263) (0.289)
0.039 0.216 0.123 0.3 0.009 0.186 0.099 0.276
(0.307) (0.334) (0.266) (0.296) (0.311) (0.335) (0.269) (0.296)
0.415*
0.456*
0.389*
0.430*
0.425*
0.466*
0.397*
0.437*
(0.239) (0.256) (0.214) (0.231) (0.241) (0.257) (0.216) (0.232)
0.520**
0.637***
0.471**
0.588***
0.546**
0.663***
0.491**
0.608***
(0.227) (0.245) (0.205) (0.223) (0.231) (0.247) (0.208) (0.225)
0.014**
0.014**
0.011**
0.011*
(0.006) (0.007) (0.005) (0.006)
0.142 0.220*
0.132 0.210**
0.186*
0.264**
0.166*
0.245**
(0.105) (0.116) (0.092) (0.103) (0.105) (0.115) (0.091) (0.103)
0.806***
0.791**
0.746***
0.731**
0.848***
0.833***
0.778***
0.764***
(0.268) (0.308) (0.244) (0.292) (0.268) (0.306) (0.245) (0.290)
0.365*
0.398 0.311 0.344 0.434**
0.467*
0.366*
0.399*
(0.216) (0.253) (0.199) (0.236) (0.218) (0.253) (0.201) (0.238)
-0.891 -0.428 -3.612***
-3.148**
-0.316 0.149 -3.158***
-2.693**
(1.141) (1.295) (1.084) (1.242) (1.135) (1.270) (1.074) (1.216)
Adj. R square 0.474 0.447 0.467 0.442 0.467 0.442 0.462 0.438
Observation 1409 1409 1409 1409 1409 1409 1409 1409
Patent output indicators are fractional counts.
The beginning of inventive span is the first year inventor worked.
Firm dummies, technological dummies and cohort dummies are included in all equations.
Robust standard errors are in parentheses.
* p<0.1, ** p<0.05, *** p<0.01
MA degree
PhD degree
PhD degree (dissertation only)
_cons
technical service
other division
software development division
laboratory attached to
manufacturing division
independent laboratory
T-score
development
ln(firm patents)
motivation: sciense
motivation: challenge
motivation: performance
motivation: career
motivation: reputation
motivation: benefit
motivation: money
male
basic research
applied research

62
Table 6. Life-cycle patent outputs: panel analysis (FE model)
ln(patent) ln(citation) ln(patent) ln(citation)
(1) (2) (3) (4)
0.204***
0.235***
0.206***
0.237***
(0.009) (0.013) (0.010) (0.013)
0.027***
0.030***
(0.004) (0.006)
0.038***
0.044***
(0.003) (0.004)
0.034***
0.035***
(0.005) (0.006)
0.035**
0.017
(0.017) (0.023)
0.044***
0.044***
(0.012) (0.016)
-0.027**
-0.044**
(0.013) (0.019)
-0.082***
-0.110***
(0.013) (0.017)
-0.056***
-0.072***
(0.022) (0.026)
-0.077 -0.023
(0.081) (0.110)
-0.081*
-0.082
(0.046) (0.060)
0.034***
0.037***
(0.003) (0.003)
-0.058***
-0.077***
(0.009) (0.012)
-0.820***
-0.988***
-0.826***
-0.989***
(0.054) (0.070) (0.055) (0.071)
Observation 30433 30433 30433 30433
Patent output indicators are fractional counts.
Estimation method is Fixed effect model.
Robust standard errors are in parentheses.
* p<0.1, ** p<0.05, *** p<0.01
_cons
ln(firm patents)
BA degree*experience2
MA degree*experience2
PhD degree*experience2
PhD degree(dissertation only)*experience2
experience
experience2
Two years college or less *experience
BA degree*experience
MA degree*experience
PhD degree*experience
PhD degree(dissertation only)*experience
Two years college or less *experience2

63
Table 7. Life-cycle patent outputs: panel analysis (Hausman-Taylor RE
model)
ln(patent) ln(citation) ln(patent) ln(citation)
(1) (2) (3) (4)
0.206***
0.237***
0.206***
0.237***
(0.005) (0.008) (0.005) (0.008)
0.317**
0.382*
0.324***
0.390***
(0.131) (0.211) (0.091) (0.148)
0.01 -0.022 0.008 -0.024
(0.058) (0.094) (0.040) (0.065)
0.05 0.078 0.051*
0.079*
(0.040) (0.064) (0.027) (0.045)
0.008 0.012 0.009 0.013
(0.045) (0.072) (0.031) (0.050)
-0.042 -0.05 -0.043 -0.052
(0.056) (0.090) (0.038) (0.063)
0.029 0.034 0.031 0.038
(0.105) (0.169) (0.072) (0.118)
0.01 0.003 0.01 0.005
(0.107) (0.172) (0.073) (0.120)
0.064 0.073 0.065 0.076
(0.081) (0.131) (0.056) (0.091)
0.106 0.122 0.107*
0.124
(0.084) (0.135) (0.057) (0.094)
0.276 0.42 0.269 0.409
(0.329) (0.529) (0.229) (0.371)
0.324 0.547 0.311 0.532
(0.291) (0.466) (0.204) (0.330)
1.332**
2.433**
1.352***
2.446***
(0.621) (1.000) (0.430) (0.699)
0.889 1.588*
(0.579) (0.937)
0.895**
1.584**
(0.396) (0.647)
0.901**
1.552**
(0.400) (0.652)
0.031*
0.052**
0.031***
0.052***
(0.016) (0.026) (0.012) (0.019)
0.042***
0.066**
0.042***
0.066***
(0.016) (0.026) (0.011) (0.018)
0.038**
0.058**
0.038***
0.058***
(0.016) (0.026) (0.011) (0.018)
0.039**
0.039 0.039***
0.039*
(0.019) (0.029) (0.015) (0.023)
0.048***
0.066**
0.047***
0.068***
(0.018) (0.028) (0.014) (0.021)
-0.027**
-0.044***
-0.027**
-0.044***
(0.011) (0.015) (0.011) (0.015)
-0.083***
-0.110***
-0.083***
-0.110***
(0.008) (0.011) (0.008) (0.011)
-0.057***
-0.073***
-0.057***
-0.073***
(0.008) (0.011) (0.008) (0.011)
-0.078*
-0.024 -0.078*
-0.024
(0.045) (0.064) (0.046) (0.064)
-0.081***
-0.082**
-0.081***
-0.083**
(0.030) (0.042) (0.030) (0.042)
-0.117 -0.52 -0.862 -1.39
(0.738) (1.174) (0.900) (1.437)
Observation 30433 30433 30433 30433
Patent output indicators are fractional counts.
Estimation method is Hausman-Taylor random effect model
Motivation dummies, Firm dummies, technological dummies and cohort dummies are included in all equations.
Robust standard errors are in parentheses.
* p<0.1, ** p<0.05, *** p<0.01
MA degree*experience2
PhD degree*experience2
PhD degree(dissertation only)*experience2
_cons
BA degree*experience
MA degree*experience
PhD degree*experience
PhD degree(dissertation only)*experience
Two years college or less *experience2
BA degree*experience2
Two years college or less *experience
technical service
other division
software development division
laboratory attached to manufacturing division
independent laboratory
BA degree
MA degree
PhD degree
PhD degree(dissertation only)
PhD degree(dissertation only) before
PhD degree(dissertation only) after
male
basic research
applied research
development
ln(firm patents)

64
Table 8. Average age of first job and first patent invention
Table 9. Time required to compensate for the invention loss due to late start
of inventive activity by a traditional PhD.
first job year (A) first invention year (B) (B) - (A)
21.16 29.74 8.58
(4.77) (7.48) (7.28)
23.99 29.01 5.02
(3.00) (5.49) (5.15)
25.24 28.15 2.91
(2.54) (3.51) (3.92)
28.39 30.45 2.05
(2.90) (3.83) (2.79)
26.07 29.98 3.91
(3.12) (4.48) (3.78)
Standard deviations are in parentheses.
less than two year college
BA degree
MA degree
PhD degree
PhD degree(Dissertation only)
patent forward citation
BA degree 4.43 4.61
MA degree 3.43 3.51
PhD degree(dissertation only) 4.59 5.25
Column 1 is calculated by using column 1 in Table 8, and column 2 is calculated by using column 2 in
Table 2.

65
Table 10. The estimation of Cox Proportional Hazard Model (1) (2) (3)
-0.108**
-0.115***
-0.128**
(0.044) (0.044) (0.054)
-0.338**
(0.238) (0.209)
(0.155) (0.155) (0.184)
(0.264) (0.224) (0.318)
(0.209) (0.203) (0.253)
0.03 -0.002 0.106
(0.143) (0.145) (0.163)
0.116 0.115 0.007
(0.154) (0.154) (0.180)
0.124 0.115 0.201
(0.196) (0.198) (0.228)
-0.025 0.065 -0.017
(0.194) (0.191) (0.213)
0.083 0.095 0.115
(0.160) (0.158) (0.174)
0.136 0.005 0.414
(0.472) (0.478) (0.680)
1.351***
1.394***
1.388***
(0.059) (0.059) (0.066)
-0.626***
-0.641**
(0.219) (0.252)
-0.243 -0.188
(0.166) (0.188)
0.014 0.103
(0.181) (0.213)
0.452**
0.630**
(0.214) (0.268)
0.535 0.154
(0.371) (0.513)
0.828**
0.489
(0.381) (0.494)
0.281 0.046
(0.324) (0.444)
0.094 -0.142
(0.309) (0.409)
-0.01
(0.009)
-0.256 -0.227
(0.208) (0.205)
-0.417*
-0.289 -0.086
(0.217) (0.213) (0.193)
-1.226**
-0.958*
-0.523
(0.506) (0.512) (0.505)
-1.435***
-1.172**
-0.873*
(0.484) (0.494) (0.528)
-0.242***
-0.215**
-0.289***
(0.089) (0.092) (0.106)
0.003***
0.003**
0.004***
(0.001) (0.001) (0.001)
Log likelihood -3343.527 -3325.804 -2540.043
Observation 10447 10420 8512
Estimation method is Cox Proportional Hazard model.
Standard error are clustered by firms are in parentheses.
Technological dummies and cohort dummies are included in all equations.
Robust standard errors are in parentheses.
* p<0.1, ** p<0.05, *** p<0.01
age2
T-score
BA degree
MA degree
PhD degree
PhD degree(dissertation only)
age
independent laboratory
motivation: benefit
motivation: money
male
ln(number of inventors)
basic research
applied research
development
technical service
other division
software development division
laboratory attached to
manufacturing division
motivation: reputation
ln(firm patents)
motivation: sciense
motivation: challenge
motivation: performance
motivation: career

66
Figure 1. Distribution of the logarithm of the number of patents (life-cycle
productivity)
Figure 2. Distribution of the logarithm of the number of forward citations
(life-cycle productivity)
0.1
.2.3
.4Density
-2 0 2 4 6log of number of patents
0.1
.2.3
Density
-2 0 2 4 6log of number of citations

67
Figure 3. Timing of ‘Exit’ inventive activity by cohort groups
0
5
10
15
20
25
30
1995 1996 1997 1998 1999 2000 2001 2002 2003 2004 2005 2006 2007 2008 2009
1946
1947
1948
1949
1950
1951
1952
1953
1954
1955
1956
1957
1958
1959
1960
1961
1962
1963
1964

68
Figure 4. Experience effect on the number of patents (FE model)
Figure 5. Experience effect on the number of forward citations (FE model)
0
0.1
0.2
0.3
0.4
0.5
0.6
0 1 2 3 4 5 6 7 8 9 10 11 12 13 14 15 16 17 18 19 20
2 year college degree
or less
BA
MA
PhD
PhD(dissertation only)
0
0.1
0.2
0.3
0.4
0.5
0.6
0 1 2 3 4 5 6 7 8 9 10 11 12 13 14 15 16 17 18 19 20
2 year college degree
or less
BA
MA
PhD
PhD(dissertation only)

69
Figure 6. Experience effect on the number of patents (Hausman-Taylor RE
model)
Figure 7. Experience effect on the number of forward citations
(Hausman-Taylor RE model)
0
0.2
0.4
0.6
0.8
1
1.2
1.4
1.6
1.8
2
0 1 2 3 4 5 6 7 8 9 10 11 12 13 14 15 16 17 18 19 20
2 year college degree
or less
BA
MA
PhD
PhD(dissertation only)
0
0.5
1
1.5
2
2.5
3
3.5
0 1 2 3 4 5 6 7 8 9 10 11 12 13 14 15 16 17 18 19 20
2 year college degree
or less
BA
MA
PhD
PhD(dissertation only)

70
Appendix. Table 1. Life-cycle cumulative patent outputs and average
productivity with cohort dummies (whole counts)
ln(patent) ln(citation) ln(patent/span) ln(citation/span) ln(patent) ln(citation) ln(patent/span) ln(citation/span)
(1) (2) (3) (4) (5) (6) (7) (8)
0.011***
0.009***
0.004**
0.003 0.011***
0.009***
0.004**
0.002
(0.003) (0.003) (0.002) (0.002) (0.002) (0.003) (0.002) (0.002)
0.024 0.069 0.02 0.065 -0.03 0.02 -0.02 0.03
(0.084) (0.095) (0.073) (0.085) (0.082) (0.093) (0.072) (0.084)
0.194 0.219 0.196*
0.221*
0.132 0.142 0.141 0.151
(0.129) (0.141) (0.111) (0.126) (0.124) (0.137) (0.109) (0.124)
-0.002 0.012 -0.018 -0.004 0.014 0.026 -0.002 0.01
(0.076) (0.084) (0.067) (0.076) (0.074) (0.083) (0.066) (0.076)
-0.144 -0.168 -0.125 -0.149 -0.119 -0.143 -0.103 -0.128
(0.097) (0.108) (0.086) (0.099) (0.095) (0.108) (0.085) (0.099)
0.181*
0.164 0.169*
0.152 0.157 0.124 0.144 0.111
(0.109) (0.122) (0.093) (0.108) (0.106) (0.120) (0.092) (0.107)
0.039 0.037 0.001 -0.001 -0.019 -0.023 -0.044 -0.048
(0.104) (0.117) (0.095) (0.109) (0.103) (0.118) (0.095) (0.110)
0.087 0.141 0.096 0.149 0.077 0.13 0.087 0.139
(0.097) (0.108) (0.084) (0.097) (0.092) (0.104) (0.080) (0.094)
0.215 0.096 0.14 0.021 0.352 0.226 0.244 0.118
(0.248) (0.321) (0.208) (0.283) (0.235) (0.310) (0.196) (0.272)
0.315***
0.291**
0.255***
0.231**
(0.101) (0.115) (0.092) (0.106)
0.13 0.165*
0.097 0.133
(0.081) (0.091) (0.072) (0.082)
0.056 0.035 0.029 0.009
(0.091) (0.103) (0.083) (0.094)
-0.224*
-0.301**
-0.236**
-0.313**
(0.125) (0.143) (0.112) (0.131)
0.081 0.19 0.043 0.151
(0.239) (0.275) (0.217) (0.254)
0.037 0.24 0.1 0.303
(0.246) (0.277) (0.213) (0.246)
0.434**
0.495**
0.368**
0.429**
(0.194) (0.223) (0.178) (0.205)
0.651***
0.735***
0.548***
0.632***
(0.187) (0.212) (0.169) (0.195)
0.399***
0.368**
0.430***
0.399***
0.346**
0.311**
0.385***
0.350**
(0.144) (0.159) (0.130) (0.146) (0.136) (0.153) (0.124) (0.141)
0.743***
0.779***
0.743***
0.779***
0.624***
0.652***
0.642***
0.670***
(0.159) (0.172) (0.141) (0.156) (0.152) (0.167) (0.136) (0.152)
1.490***
1.452***
1.438***
1.399***
1.271***
1.217***
1.246***
1.191***
(0.258) (0.284) (0.235) (0.269) (0.260) (0.292) (0.240) (0.278)
1.233***
1.226***
1.138***
1.132***
0.923***
0.905***
0.873***
0.856***
(0.213) (0.239) (0.194) (0.224) (0.211) (0.240) (0.192) (0.226)
-1.189 0.358 -4.393***
-2.846***
-1.184**
0.267 -3.341***
-1.889***
(0.779) (0.909) (0.734) (0.866) (0.549) (0.631) (0.502) (0.592)
Adj. R square 1736 1736 1736 1736 1731 1731 1731 1731
Observation 0.389 0.373 0.401 0.39 0.432 0.41 0.438 0.421
Patent output indicators are whole counts.
Estimation method is OLS.
The beginning of inventive span is the first year inventor worked.
Firm dummies, technological dummies and cohort dummies are included in all equations.
Robust standard errors are in parentheses.
* p<0.1, ** p<0.05, *** p<0.01
MA degree
PhD degree
PhD degree(dissertation only)
_cons
technical service
other division
software development division
laboratory attached to
manufacturing division
independent laboratory
BA degree
development
ln(firm patents)
motivation: sciense
motivation: challenge
motivation: performance
motivation: career
motivation: reputation
motivation: benefit
motivation: money
male
basic research
applied research