life sciences apps note-2 - bruker
TRANSCRIPT

Introduction
Infrared (IR) spectroscopy is one of the most recognized analytical measurement techniques in academic, government, and industrial R&D laboratories for the characterization of polymeric materials. The spatial resolution of conventional bulk IR spectroscopy is limited by Abbe diffraction laws to between 3–10 µm,
depending on the method used. Atomic Force Microscopy (AFM) is a widely used nanoscale imaging technique that provides the user with a high spatial resolution topographic map of a sample surface.
Until now, the major drawback of AFM has been its inability to chemically characterize the material underneath the tip. When combined with an IR source; the resulting nanoIR technique breaks the diffraction
Life sciences
• nanoscale IR spectroscopy is used to acquire chemical composition of biological materials with nanoscale spatial resolution
• nanoIR is able to generate accurate and relevant chemical spectra at nanoscale resolutions far below the diffraction limit
• nanoIR was instrumental to a number of breakthroughs in far ranging fields.
AbstractThe nanoIR2-FS™ system is founded on multiple scientific breakthrough techniques of acquiring IR spectra and images at spatial resolutions well below the diffraction limit of conventional IR spectroscopy. The combination of infrared (IR) spectroscopy with atomic force microscopy (AFM) has enabled critical developments in extending chemical analysis to the nanoscale. These complementary techniques offer chemical analysis, as well as chemical and optical imaging with spatial resolution up to <10nm for both soft and hard matter applications. This note describes the application of the nanoIR technique in life science research, from analyzing the structure of hair, to characterizing a resin-wood interface, and determining the secondary structure of proteins.
Key wordsnanoIR | Nanoscale IR spectroscopy | Life Sciences | Proteins | Cells
The nanoscale spectroscopy companyThe world leader in nanoscale IR spectroscopy
AFM-IR chemical distribution image of human hair taken at 2924 cm-1, a common absorption band for lipids.

page 2
limit of conventional IR spectroscopy by orders of magnitude, while still providing the high resolution imaging capabilities of AFM.
In this note, we will discuss the applications of nanoIR in life sciences, including analyzing the structure of hair, characterizing a resin-wood interface, and determining the secondary structure of proteins.
Analysis of lipid distribution in human hairThe location of structural lipids in human hair is key to understanding the penetration pathways of hair products1. Conventional techniques such as ATR, FTIR, and Raman spectroscopy are unable to achieve the resolutions desired; however, nanoIR enables both nanoscale topographical imaging as well as chemical compositional information with sub 100nm spatial resolution.
Hair samples were cross sectioned and imaged over a 3200-2800 cm-1 spectral range (Figure 1). Three bands of interest were identified at 2924 and 2930 cm-1, which correspond to antisymmetric CH2 stretching vibrations characteristic of long-chain lipids, and 2960 cm-1, identified as antisymmetric CH3 vibrations, characteristic of keratin.
Higher IR absorbance at 2924 cm-1 found in the inner medulla and outer cuticle, as compared with a lower absorbance at the middle cortex, correlated to variability in lipid concentration. It was also noted that the aromatic CH stretching bands in the cortex (3000-3200 cm-1) were sharper than those in the cuticle, indicating more disorder in keratin structure in the cuticle. The IR band at 2930 cm-1 (lipid) was compared
to spectra taken at 1525 cm-1 (amide II band of keratin) in order to determine the lipid to keratin ratio, which suggested that the lipid component in the cuticle barrier layer is highest at the boundary between each cuticle layer (Figure 2) . nanoIR allowed for the spectroscopic characterization of hair at previously unattainable resolutions, and opens new possibilities into understanding the penetration pathway of cosmetic products and drugs through hair.
Resin-wood interfaceManufacturing processes rely heavily on the quality of adhesive bonding, and much of the stability is determined in the interphase region of the two materials. Nanoscale IR spectroscopy was used by
Figure 2. nanoIR single-wavenumber intensity ratio images (2930 cm-1 /1525 cm-1 ) collected from cross-sections of three different human hair samples from the same source. The IR band located at 2930 cm-1 is due to the absorbance of the long-chain CH2 antisymmetric stretching vibration of the lipid component, while the band at 1525 cm-1 is due to the absorbance of the amide II vibration of the hair keratin protein. The white-colored areas are locations of higher lipid concentration.
nanoIR spectroscopy Life sciences
Figure 1. Contact mode AFM height image (top) and 12 nanoIR spectra (bottom)of a human hair cross-section near the interface between the outer cuticle and cortex layers. The colored marker locations on the AFM image are locations where the corresponding nanoIR spectra of the same color were obtained. The spectra from bottom to top correspond to colored markers from bottom left to the top right along the ordinate axis of the image. The IR band labeled with an asterisk at 2924 cm-1 is due to the absorbance of the long-chain CH2 antisymmetric stretching vibration of a lipid component.
nanoIR spectroscopy Life sciences
page 3
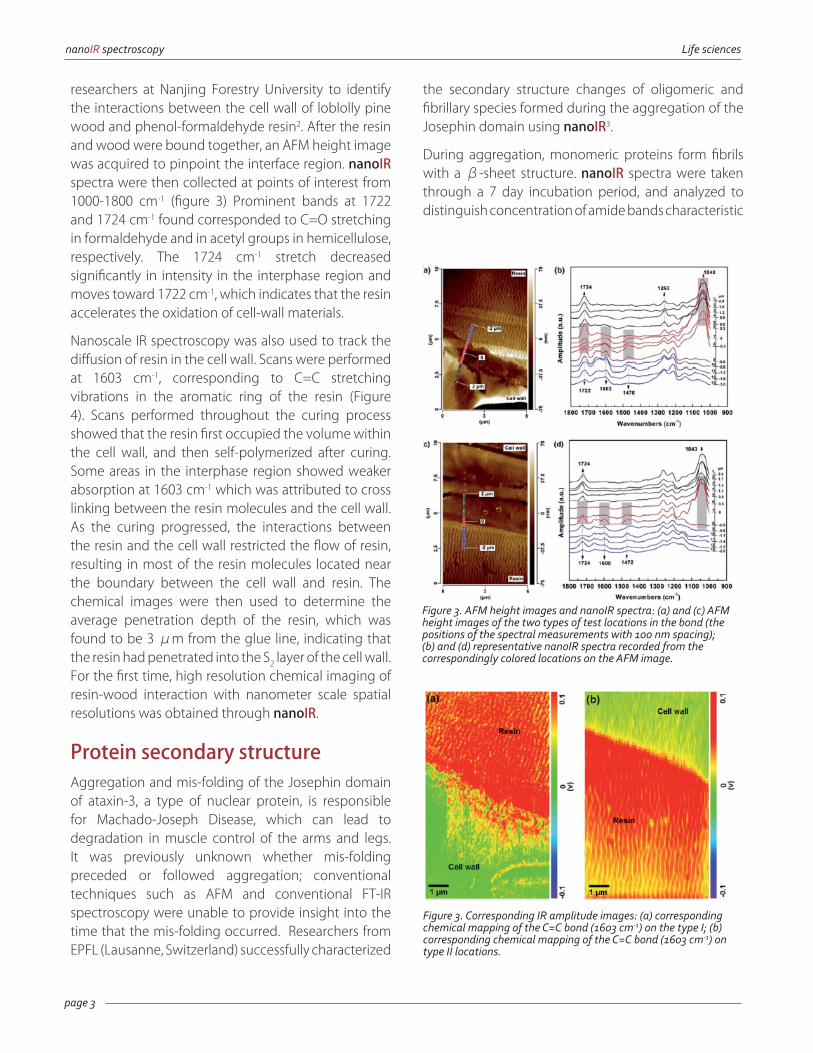
researchers at Nanjing Forestry University to identify the interactions between the cell wall of loblolly pine wood and phenol-formaldehyde resin2. After the resin and wood were bound together, an AFM height image was acquired to pinpoint the interface region. nanoIR spectra were then collected at points of interest from 1000-1800 cm-1 (figure 3) Prominent bands at 1722 and 1724 cm-1 found corresponded to C=O stretching in formaldehyde and in acetyl groups in hemicellulose, respectively. The 1724 cm-1 stretch decreased significantly in intensity in the interphase region and moves toward 1722 cm-1, which indicates that the resin accelerates the oxidation of cell-wall materials.
Nanoscale IR spectroscopy was also used to track the diffusion of resin in the cell wall. Scans were performed at 1603 cm-1, corresponding to C=C stretching vibrations in the aromatic ring of the resin (Figure 4). Scans performed throughout the curing process showed that the resin first occupied the volume within the cell wall, and then self-polymerized after curing. Some areas in the interphase region showed weaker absorption at 1603 cm-1 which was attributed to cross linking between the resin molecules and the cell wall. As the curing progressed, the interactions between the resin and the cell wall restricted the flow of resin, resulting in most of the resin molecules located near the boundary between the cell wall and resin. The chemical images were then used to determine the average penetration depth of the resin, which was found to be 3 μm from the glue line, indicating that the resin had penetrated into the S2 layer of the cell wall. For the first time, high resolution chemical imaging of resin-wood interaction with nanometer scale spatial resolutions was obtained through nanoIR.
Protein secondary structureAggregation and mis-folding of the Josephin domain of ataxin-3, a type of nuclear protein, is responsible for Machado-Joseph Disease, which can lead to degradation in muscle control of the arms and legs. It was previously unknown whether mis-folding preceded or followed aggregation; conventional techniques such as AFM and conventional FT-IR spectroscopy were unable to provide insight into the time that the mis-folding occurred. Researchers from EPFL (Lausanne, Switzerland) successfully characterized
the secondary structure changes of oligomeric and fibrillary species formed during the aggregation of the Josephin domain using nanoIR3.
During aggregation, monomeric proteins form fibrils with a β-sheet structure. nanoIR spectra were taken through a 7 day incubation period, and analyzed to distinguish concentration of amide bands characteristic
Figure 3. AFM height images and nanoIR spectra: (a) and (c) AFM height images of the two types of test locations in the bond (the positions of the spectral measurements with 100 nm spacing); (b) and (d) representative nanoIR spectra recorded from the correspondingly colored locations on the AFM image.
Figure 3. Corresponding IR amplitude images: (a) corresponding chemical mapping of the C=C bond (1603 cm-1) on the type I; (b) corresponding chemical mapping of the C=C bond (1603 cm-1) on type II locations.

page 4
nanoIR spectroscopy Life sciences
[email protected] Tel: +1 (805) 730 3310http://www.anasysinstruments.com/products/nanoIR2-FS/
©2017. Anasys Instruments. All rights reserved. nanoIR, nanoIR2-FS and nanoIR are trademarks of Anasys Instruments Corp.
All other trademarks are the property of their respective companies.
Applications Note: #108
of different secondary structures, with higher peaks indicative of higher concentrations of the structure (Figure 3). By the end of the incubation period, a clear distinction between the spectra of oligomers and fibrils was observed, with oligomers showing higher absorption in the α-helix component of the amide I band (1655 cm-1), and fibrils showing higher absorption in the β-sheet component (1,700 cm-1). (Figure 4)
In combination with other techniques to determine the stiffness of the species, the nanoIR spectra were used to determine that the presence of β-sheets determined the stiffness of amyloids. From this data, it was concluded that mis-folding only occurs after aggregation begins. nanoIR was the only technique able to provide the high spatially resolved chemical composition information required to characterize the formation of individual species in the aggregation pathway.
References1. Marcott, C. et al. Localization of Human Hair Structural Lipids Using Nanoscale Infrared Spectroscopy and Imaging. Applied Spectroscopy 68(5):564-569
2. Wang, X. et al. In situ identification of the molecular-scale interactions of phenol-formaldehyde resin and wood cell walls using infrared nanospectroscopy. RSC Adv. 2016 6 (80), 76318-76324
3. Ruggeri, F.S. et al. Infrared nanospectroscopy characterization of oligomeric and fibrillar aggregates during amyloid formation. Nature Communications 6, 7831
Figure 4. (a) AFM height. Infrared absorption at (b) 1,700 cm-1
(amide I), (c) 1,655 cm-1 (amide I) and (d) 1,430 cm-1. Scale bar, 1 μm. Spectra of amyloid structures: (e) misfolded (labelled 1, 2 and 3 in a) and (f) fibrils (labelled a–f in a).