life science journal 2013;10(12s) €¦ · · 2014-01-05regular building is designed by...
TRANSCRIPT

Life Science Journal 2013;10(12s) http://www.lifesciencesite.com
http://www.lifesciencesite.com [email protected] 949
Investigation of Seismic Performance of Vertically Irregular Reinforced Concrete Buildings
Qaiser uz Zaman Khan1, Asif Tahir 2, Syed Saqib Mehboob3
1. Professor, Civil Engineering Department, UET Taxila, Pakistan
2. Postgraduate Scholar, Civil Engineering Department, UET Taxila, Pakistan 3. Lecturer, Civil Engineering Department, UET Taxila, Pakistan
Abstract: Generally buildings hold irregularities in plan or sometimes in elevation as well. This develops a
damaging influence on seismic performance of building. The paper discusses the comparative study of performance evaluation of RC (Reinforced Concrete) Buildings with vertical irregularities (i.e., setbacks). A five story vertically
regular building is designed by equivalent static load method of seismic analysis by using UBC (Uniform Building
Codes) 1997. Nine vertically irregular models are derived from the regular building by omitting different stories at different heights creating setbacks. For numerical solution ETABs 9.7 nonlinear version software is used. Time
History and Response Spectrum Analysis are performed for ground acceleration data of ElCentro (1940) earthquake.
The study as a whole is a slight attempt to evaluate the effect of vertical irregularities on RC buildings, in terms of
dynamic characteristics such as Story Displacement, Overturning Moment, Base Shear, Story Drift and Participating Mass Ratio.
[Khan Q Z, Tahir A, Mehboob S S. Investigation of Seismic Performance of Vertically Irregular Reinforced
Concrete Buildings. Life Sci J 2013;10(12s):949-955] (ISSN:1097-8135). http://www.lifesciencesite.com. 154
Key words: Vertical irregularities, Seismic performance, Dynamic characteristics, Overturning moment.
1. Introduction
It is a known fact that the Globe is facing a threat of natural disasters from time to time. With
particular records based on earthquake occurrence,
the consequences are loss of human lives and
destruction of properties, which ultimately affects the natural economy. The occurrence of an earthquake
cannot be predicted and prevented but the
preparedness of the structures to resist earthquake forces become more important. However, more
recently, many destructive earthquakes, including the
1960 Chile earthquake, 1964 Great Alaska
earthquake, 1999 Athens (Greece) earthquake, 1999 Chi Chi (Taiwan) earthquake, 2001 Bhuj (India)
earthquake, 2003 Boumerdes (Algeria) earthquake,
2004 Off the West Coast of Northern Sumatra earthquake, 2005 Muzaffarabad (Pakistan)
earthquake and the 2011 Near the East Coast of
Honshu (Japan) earthquake have given more insights to performance of RC frame constructions. These
earthquakes are a wake-up call to enforce building
and seismic codes, making building insurance
compulsory along with the use of quality material and skilled workmanship.
The part of the land on the globe for which
lines of national boundaries are now indicating the
country as Pakistan has experienced many destructive earthquakes throughout its history. Most notable
events of major earthquakes experienced by this part
of land area since 1668 to 2013, in 1668 the epicenter was Shahbandar (Sindh), 1827 Lahore (Punjab), 1889
Jhalawan (Balochistan), 1909 Sibi (Balochistan),
1935 Ali Jaan (Balochistan), 1974 Hunza Hazara
(North-West Frontier Province), 2005 Muzaffarabad District, Azad State of Jammu and Kashmir (North-
West Frontier Province) and it was at Awaran
District, Balochistan in 2013. In many respects, including seismological and geotechnical, the
October 08, 2005 earthquake was a case of history
repeating itself 31 years later and has made the
engineering community in Pakistan aware of the need of seismic evaluation.
Based on the technology advancement and
knowledge gained after earthquake occurrences, the seismic code is usually revised. In 1986, the Pakistan
Building Code was completed; however, it was not
enforced practically, because it was not adopted as Governmental regulations and due to lack of due
process of adoption and implementation. The
devastating earthquake of October 08, 2005 in the
Northern Pakistan and Azad Jammu and Kashmir which claimed over 74000 lives and left over 100,000
Life Science Journal 2013;10(12s) http://www.lifesciencesite.com
http://www.lifesciencesite.com [email protected] 950
severely injured/incapacitated, drew the attention of
engineers to review the adequacy of design and construction practices in Pakistan. Pakistan is one of
the more seismically active regions of the world and
it is important to that Code for improving the seismic
safety be developed urgently. Pakistan will improve earthquake-related requirements in its building safety
codes. After an October 2005 earthquake devastated
a large area in northern Pakistan, Ministry of Housing and Works, Government of Pakistan engaged the
National Engineering Services Pakistan (Pvt.)
Limited (NESPAK) to develop revised seismic zoning maps and criteria. NESPAK approached the
International Code Council to help Pakistan develop
earthquake provisions to save lives and reduce
property losses. The International Code Council, USA was contacted for assistance along with ACI
and ASIC. Information contained in the ICC codes,
ACI 318 Code, and ASIC specifications was used for the development of the Pakistan Building Code
(Seismic Provisions -2007). Input of all the relevant
agencies and bodies, both in public and private sectors was sought and incorporated while
formulating the Building Code of Pakistan: Seismic
Provisions 2007 [1].
So after a long gap of about 21 years some new clauses were included and some old provisions
were updated. Assuming that concerned authorities
will take enough steps for code compliance and the structures that are being constructed are earthquake
resistant. Keeping the different points in view during
the revision process of the seismic zones in Pakistan,
the damage patterns in reinforced concrete frames during the earthquakes have been extensively studied.
Now a days need and demand of the latest
generation and growing population has made the architects or engineers inevitable towards planning of
irregular configurations.
2. Literature Review
Real building structures often have vertical irregularities, which are inherited from various functional, economical, aesthetical and architectural constraints and city regulations or building by laws. These irregularities cause non-uniform distribution of mass, stiffness, strength, geometry and structural form in elevation. Sudden changes in stiffness and strength between adjacent stories are related with changes in structural system along the height, changes in story height, setbacks, changes in materials and unanticipated participation of non-structural components. Such buildings, having
irregular configuration, are prone to earthquake due to concentration of stress and deflections or an undesirable load path in building structural system. Such types of irregularities have been renowned as one of the most important causes of brutal damage or poor performance of structures during earthquakes. Structural damage due to strong earthquake reveals that vertical irregular buildings exhibit unsatisfactory behavior, even though they are designed according to code.
Plan asymmetry and development of its design guidelines has been given focused attention over last two decades. A detailed list of such studies is available in various literatures. Different researchers now had started to investigate the behavior of buildings with irregularity that exists in these buildings in term of mass, geometry etc.
J. H. Cassis and E. Cornejo. 1996 [2],
studied the nonlinear response of reinforced concrete
buildings having irregularities in elevation. Nonlinear
Static incremental analysis was used to calculate the
strength and displacement capacity of the buildings.
And it was concluded that buildings with
irregularities in elevation without infill walls at
different heights imparts the brittle failure mode of
buildings.
M. Mezzi, A. Parducci and P. Verducci.
2004 [3], carried out an investigation to develop a
methodology for building’s seismic design by
considering the factors which influence the seismic
response of buildings. The results thus obtained were
commented and presented as sample design.
K. Güler, M. G. Güler, B. Taskin and M.
Altan. 2008 [4], had worked on existing vertical
irregular building which was retrofitted after the
earthquake. It was taken for the study of performance
evaluation. For the numerical solution, software
(SAP2000 and ZEUS-NL) were used.
V. K. Sadashiva, G.A. MacRae and B. L.
Deam. 2008 [5], presented a simple method of
determining structural irregularity limits for design
using different analysis procedures. Irregularity limits
in terms of interstorey drift response due to mass
irregularity was computed.
C. M. Ravi Kumar and et al. 2012 [6],
discussed the performance evaluation of reinforced
concrete buildings with vertical irregularities. This
Study included different dynamic influencing
parameters which can regulate the Base shear, Time
period and Story displacement etc. for various
seismic zones of India.
Life Science Journal 2013;10(12s) http://www.lifesciencesite.com
http://www.lifesciencesite.com [email protected] 951
In most of the Seismic Design Codes, design
guidelines and formulations of regular or symmetric
buildings are well framed. But as yet the codes fall
short of providing recommendations regarding design
of irregular structures. So, the study on this area
must be required by the structural designer for the
safe and sound design of vertically irregular building
against earthquake, especially because the literature
on seismic behavior of vertically irregular building is
rare and codes also do not contribute enough in this
regard.
Contextually, this research work makes a
small contribution to study the response of
geometrically irregular RC buildings.
3. Methodology
Since 1988 the UBC (Uniform Building
Code) started to distinguish vertically irregular
structures ones based on certain limits on the ratio of
strength, stiffness, mass, setbacks or offsets with
respect to an adjacent story. UBC provides
quantitative criteria for defining structural
irregularities. These criteria, for different types of
irregularity, can be summarized as follows: (i). Mass
irregularity, the effective storey mass is greater than
150% of the mass of an adjacent storey. (ii). Stiffness
irregularity, a soft storey is defined when its stiffness
is less than 70% of the storey above or less than 80%
of the mean stiffness of the three storeys above. (iii).
Strength irregularity, a weak storey is defined when
its strength is less than 80% of the storey above.
(iv). Vertical Geometric Irregularity (Setback), is
considered to exist where the horizontal dimension of
the lateral-force-resisting system in any story is more
than 130 % of that in an adjacent story [7].
The concept of this paper is studied
analytically, through a comparative parametric study
of several irregular multi story building models with
regular one.
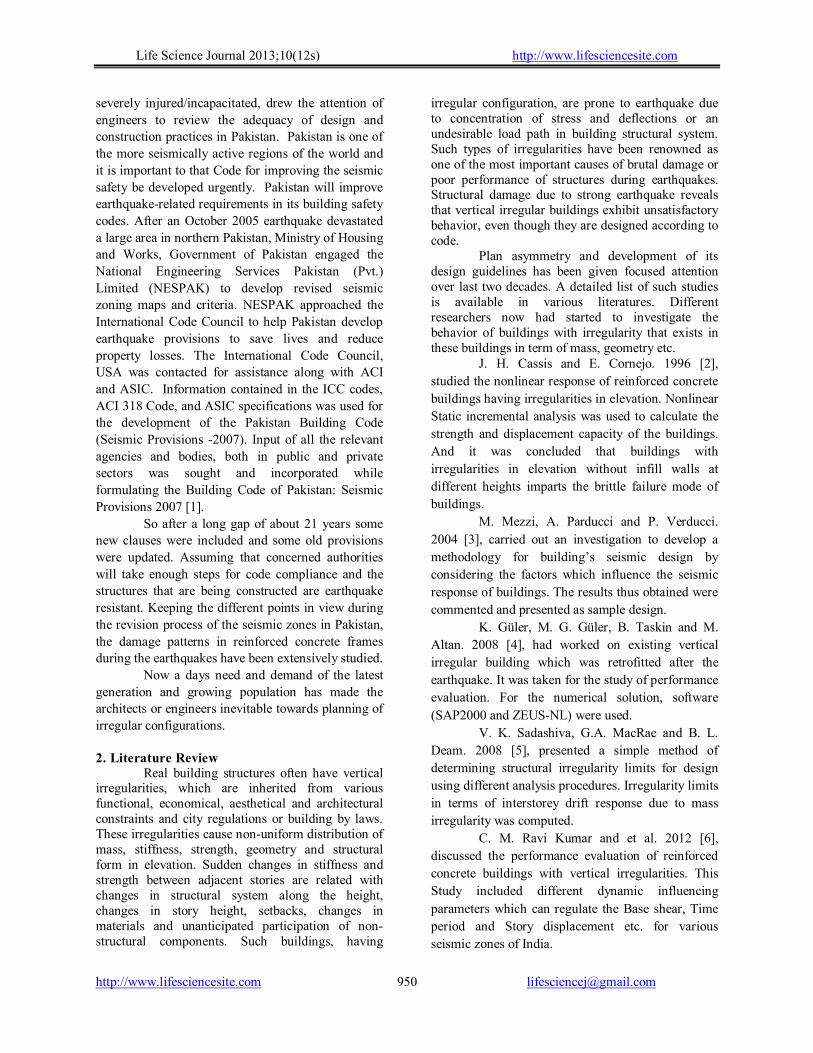
3.1 Characteristics of Buildings
For this study total ten model buildings are
considered. One model with regular frame is taken as
reference building and other nine vertically irregular
models are derived from the regular building by
omitting different stories at different heights creating
setbacks. The line diagrams of regular model and
other nine irregular models are demonstrated in the
Figure 1.0.
Figure 1.0: Regular structure and nine irregular
structures
Life Science Journal 2013;10(12s) http://www.lifesciencesite.com
http://www.lifesciencesite.com [email protected] 952
All models have floor height at each level is
12-ft except ground floor which has 17-ft ceiling
height. The buildings have four bays in plan in x-
direction, each bay of 20-ft width and in y-direction
each bay of 25-ft wide. The structural system of the
building is considered as space frames having shell
elements representing floors. The columns are
assumed to be fixed at base at the foundation level.
For each modeling frame elements are used
for columns and beams. Table 1.0 show the beam and
column dimensions used for modeling of all frame
structures either regular or irregular.
Table 1.0 Dimensions of structural members
Sr. No. Member b × h (inch × inch)
1 Beams 12 × 24
2 Columns 18 × 18
3.2 Numerical Analysis
In this study, nine buildings with vertical
irregularity are modeled using ETABS software.
Time history analysis and Response spectrum
analysis are performed for each of x-x and y-y
directions and performance level of the buildings are
obtained. The response of the superstructure is
assumed to be linear elastic.
The earthquake record of ElCentro has been
applied in this study for Time history analysis. The
details are listed in the Table 2.0.
Table 2.0 Earthquake accelogram
Accelogram Year Magnitude PGA (g)
ElCentro 1940 6.6 0.37
It is noted that the chosen accelogram well
suits the elastic spectrum for 0.2 Sec. spectral
acceleration Ss = 0.56, 1.0 Sec. spectral acceleration
S1 = 0.39, soil type E and damping equal to 5%.
4.0 Performance of buildings
The dynamic numerical analysis is carried
out by using ETABS computer software. For
structural system, the material class of concrete and
steel modulus of elasticity is 21.53 GPa and 200 GPa
respectively.
Seismic performance assessment of the
derived vertically irregular buildings has been
realized by 3D modeling of the frame structure by
introducing elements in ETABS software. The free
vibration periods and modal participating mass ratios
for 1st mode of all ten models are shown in Table 3.0.
Table 3.0 Free vibration periods and modal
participating mass ratio
Code
1st Mode
Period
(Sec.)
Modal
Participation Ratio
(x direction)
Modal
Participation Ratio
(y direction)
RM 1.304 90.913 0.000
IR1 0.877 52.67 24.904
IR2 1.172 66.318 12.132
IR3 1.202 89.033 0.000
IR4 1.233 89.036 0.004
IR5 1.235 89.319 0.086
IR6 1.217 89.066 0.005
IR7 1.187 88.929 0.007
IR8 1.102 85.448 0.000
IR9 1.138 88.196 0.0142
As it is seen, the participating mass ratio is ≈
82% and it is greater than 70% (i.e., code limit) for
the first mode and the height of the building is less
than 82-ft, which means the incremental equivalent
seismic load procedure, can be used.
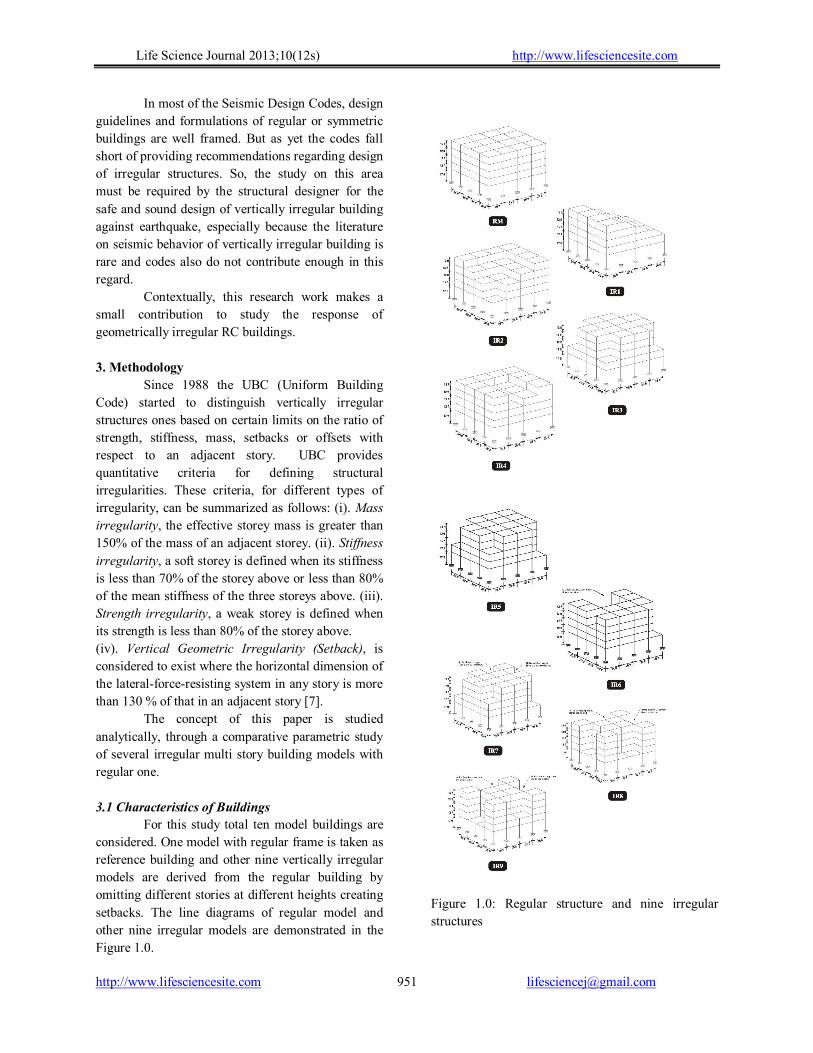
5. Analysis and Results discussion
Dynamic Analysis
All the frames were designed in the region
of moderately high seismicity with soil type E. the
design satisfy the strong column-weak beam
requirement of the code and the size and shape of
beams and columns are chosen to satisfy code drift
limitations. See Figure 1.0 for the respective
spectrum (for regular building model) to compare the
corresponding pseudo spectral accelerations (g) of
rest of the irregular building models.
Figure 1.0 Pseudo spectral acceleration (g)
Life Science Journal 2013;10(12s) http://www.lifesciencesite.com
http://www.lifesciencesite.com [email protected] 953
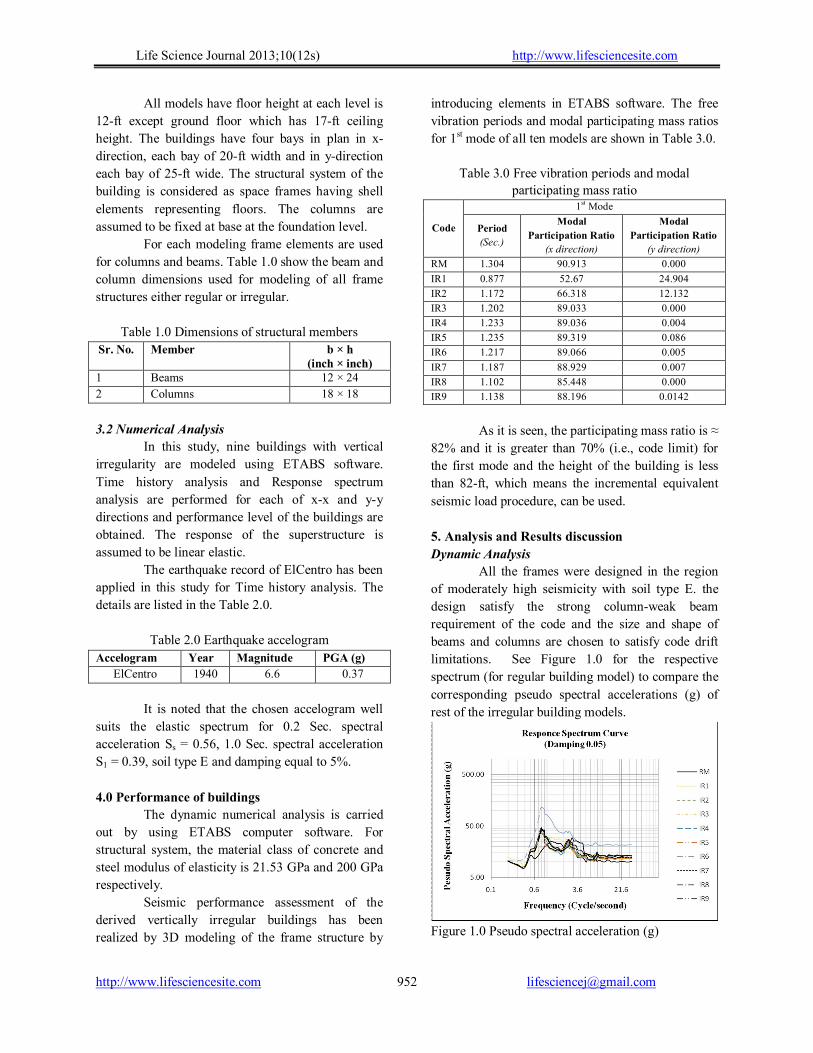
The estimation of the demand from an
earthquake and the evaluation of the capacity of the
building to deform with 5% damping ratio with
respect to the control frame (regular frame) was
considered. Figure 2.0 shows the story shear and
overturning moment results of the dynamic analysis
of regular building.
Figure 2.0 Story shear and overturning moment for
RM
For the four irregular building models out of
all nine models, the comparison of x-direction and y-
direction overturning moments and story shear versus
different story levels are presented in the Figure 2.1
(a) to (d).
Results of the study indicate that the
setbacks of the buildings at the upper levels
exacerbate the contribution of torsional moments and
the migration of demand from lower stories to upper
stories decreased.
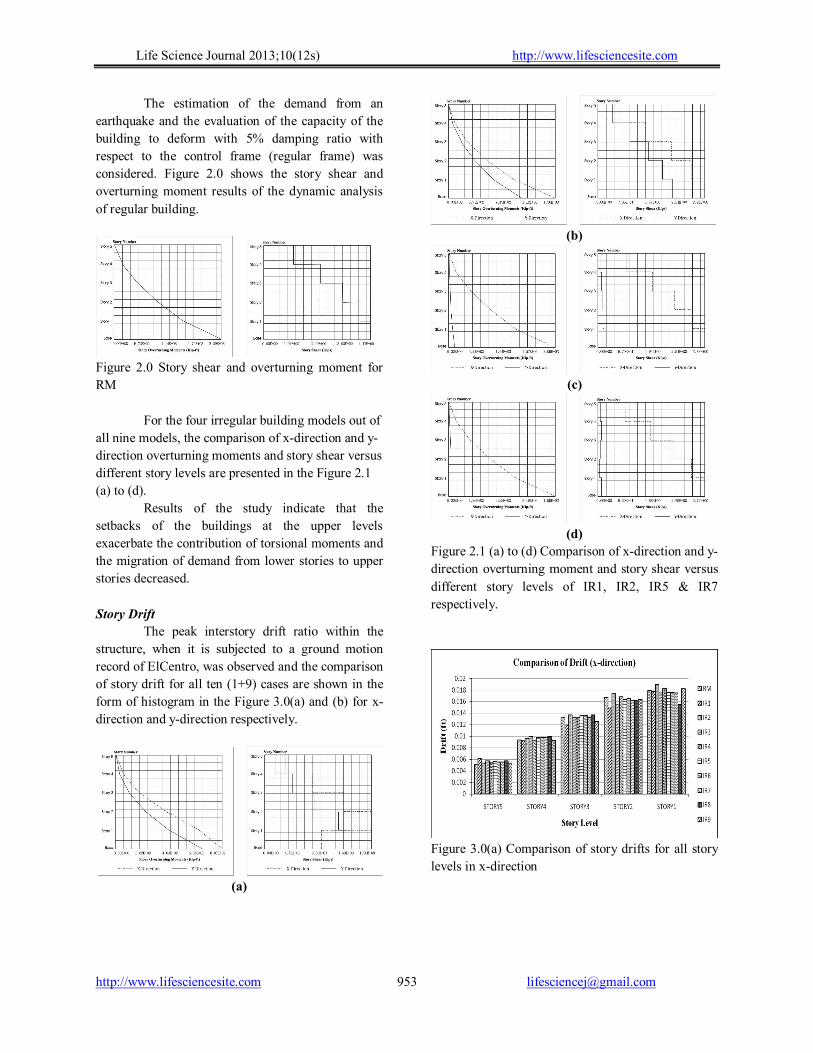
Story Drift
The peak interstory drift ratio within the
structure, when it is subjected to a ground motion
record of ElCentro, was observed and the comparison
of story drift for all ten (1+9) cases are shown in the
form of histogram in the Figure 3.0(a) and (b) for x-
direction and y-direction respectively.
(a)
(b)
(c)
(d)
Figure 2.1 (a) to (d) Comparison of x-direction and y-
direction overturning moment and story shear versus
different story levels of IR1, IR2, IR5 & IR7
respectively.
Figure 3.0(a) Comparison of story drifts for all story
levels in x-direction
Life Science Journal 2013;10(12s) http://www.lifesciencesite.com
http://www.lifesciencesite.com [email protected] 954
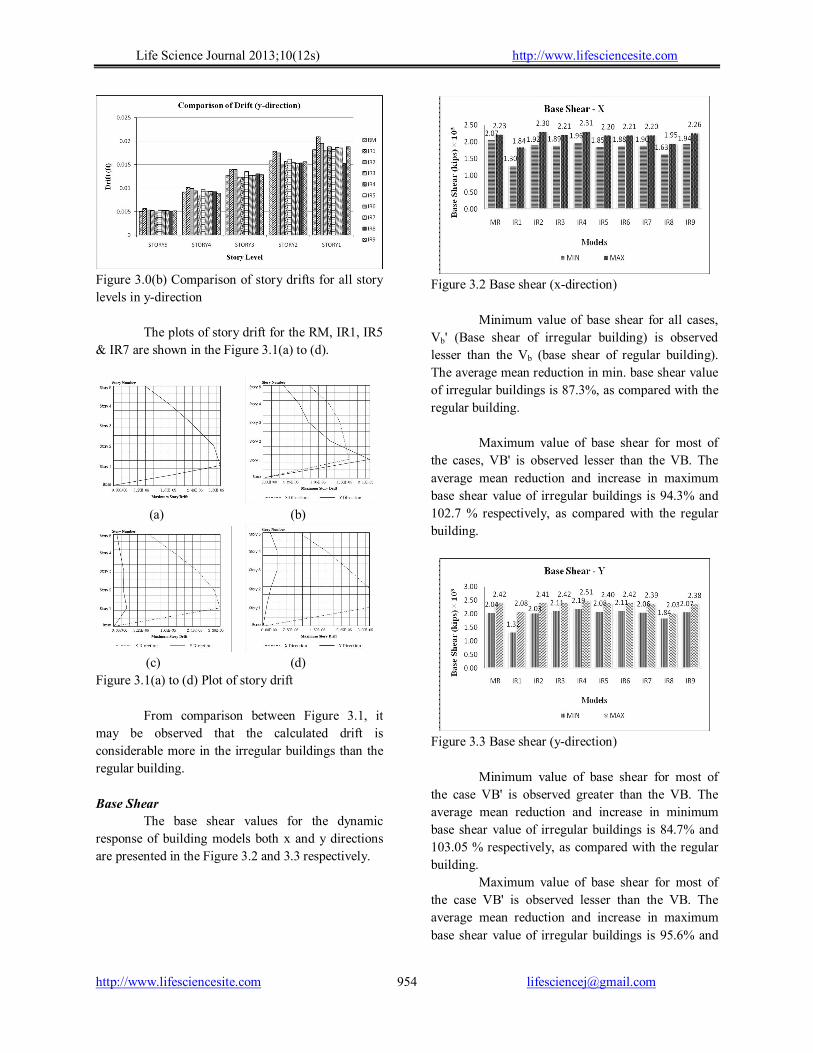
Figure 3.0(b) Comparison of story drifts for all story
levels in y-direction
The plots of story drift for the RM, IR1, IR5
& IR7 are shown in the Figure 3.1(a) to (d).
(a) (b)
(c) (d)
Figure 3.1(a) to (d) Plot of story drift
From comparison between Figure 3.1, it
may be observed that the calculated drift is
considerable more in the irregular buildings than the
regular building.
Base Shear
The base shear values for the dynamic
response of building models both x and y directions
are presented in the Figure 3.2 and 3.3 respectively.
Figure 3.2 Base shear (x-direction)
Minimum value of base shear for all cases,
Vb' (Base shear of irregular building) is observed
lesser than the Vb (base shear of regular building).
The average mean reduction in min. base shear value
of irregular buildings is 87.3%, as compared with the
regular building.
Maximum value of base shear for most of
the cases, VB' is observed lesser than the VB. The
average mean reduction and increase in maximum
base shear value of irregular buildings is 94.3% and
102.7 % respectively, as compared with the regular
building.
Figure 3.3 Base shear (y-direction)
Minimum value of base shear for most of
the case VB' is observed greater than the VB. The
average mean reduction and increase in minimum
base shear value of irregular buildings is 84.7% and
103.05 % respectively, as compared with the regular
building.
Maximum value of base shear for most of
the case VB' is observed lesser than the VB. The
average mean reduction and increase in maximum
base shear value of irregular buildings is 95.6% and
Life Science Journal 2013;10(12s) http://www.lifesciencesite.com
http://www.lifesciencesite.com [email protected] 955
103.5 % respectively, as compared with the regular
building..
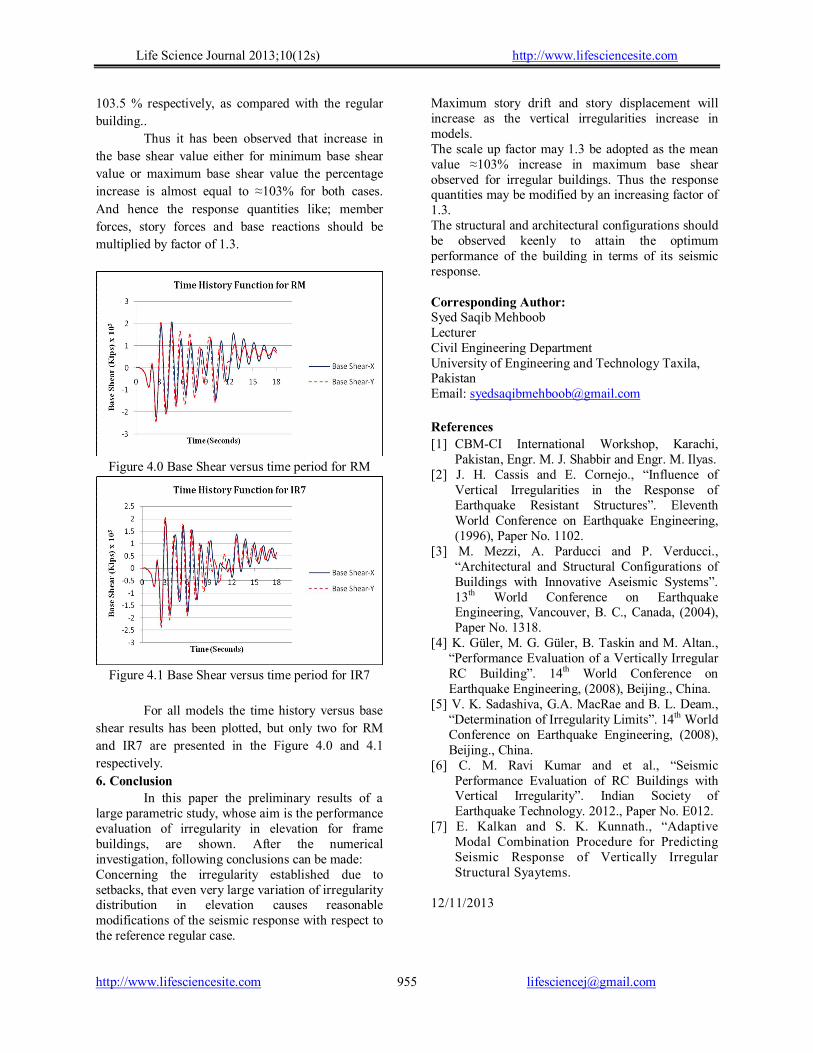
Thus it has been observed that increase in
the base shear value either for minimum base shear
value or maximum base shear value the percentage
increase is almost equal to ≈103% for both cases.
And hence the response quantities like; member
forces, story forces and base reactions should be
multiplied by factor of 1.3.
Figure 4.0 Base Shear versus time period for RM
Figure 4.1 Base Shear versus time period for IR7
For all models the time history versus base
shear results has been plotted, but only two for RM
and IR7 are presented in the Figure 4.0 and 4.1
respectively.
6. Conclusion
In this paper the preliminary results of a large parametric study, whose aim is the performance evaluation of irregularity in elevation for frame buildings, are shown. After the numerical investigation, following conclusions can be made: Concerning the irregularity established due to setbacks, that even very large variation of irregularity distribution in elevation causes reasonable modifications of the seismic response with respect to the reference regular case.
Maximum story drift and story displacement will increase as the vertical irregularities increase in models. The scale up factor may 1.3 be adopted as the mean value ≈103% increase in maximum base shear observed for irregular buildings. Thus the response quantities may be modified by an increasing factor of 1.3. The structural and architectural configurations should be observed keenly to attain the optimum performance of the building in terms of its seismic response. Corresponding Author: Syed Saqib Mehboob Lecturer Civil Engineering Department University of Engineering and Technology Taxila, Pakistan Email: [email protected]
References
[1] CBM-CI International Workshop, Karachi, Pakistan, Engr. M. J. Shabbir and Engr. M. Ilyas.
[2] J. H. Cassis and E. Cornejo., “Influence of Vertical Irregularities in the Response of Earthquake Resistant Structures”. Eleventh World Conference on Earthquake Engineering, (1996), Paper No. 1102.
[3] M. Mezzi, A. Parducci and P. Verducci., “Architectural and Structural Configurations of Buildings with Innovative Aseismic Systems”. 13th World Conference on Earthquake Engineering, Vancouver, B. C., Canada, (2004), Paper No. 1318.
[4] K. Güler, M. G. Güler, B. Taskin and M. Altan., “Performance Evaluation of a Vertically Irregular RC Building”. 14th World Conference on Earthquake Engineering, (2008), Beijing., China.
[5] V. K. Sadashiva, G.A. MacRae and B. L. Deam., “Determination of Irregularity Limits”. 14th World Conference on Earthquake Engineering, (2008), Beijing., China.
[6] C. M. Ravi Kumar and et al., “Seismic Performance Evaluation of RC Buildings with Vertical Irregularity”. Indian Society of Earthquake Technology. 2012., Paper No. E012.
[7] E. Kalkan and S. K. Kunnath., “Adaptive Modal Combination Procedure for Predicting Seismic Response of Vertically Irregular Structural Syaytems.
12/11/2013