life insurance m&a - member | soa life industry has traded-off materially as a result of...
TRANSCRIPT

Session 159 PD, Life Insurance M&A
Moderator:
David J. Weinsier, FSA, MAAA
Presenters: Germante Boncaldo
Su Meng Lee, FSA, CERA, MAAA Philip Salem
SOA Antitrust Disclaimer SOA Presentation Disclaimer

© Oliver Wyman
Life Insurance M&A2016 Society of Actuaries Annual MeetingSession #159
October 26, 2016

1© Oliver Wyman 1
AgendaIn this session, a panel of experts will provide an overview of the North American life and annuity mergers and acquisitions (M&A) landscape
I. Introduction (David Weinsier, Oliver Wyman)a. Summary of recent transactionsb. Themes driving current and future M&A activity
II. Investment banker’s view (Philip Salem, Goldman Sachs) a. Challenges facing U.S. life insurers and how companies are respondingb. Life insurance segment analyticsc. Trends and drivers of M&A activity
III. Global reinsurer’s view (Germante Boncaldo, Swiss Re)a. Value proposition of reinsurance in M&Ab. Reinsurance as a capital management toolc. Reinsurance as a financing partner
IV. Actuarial consultant’s view (Su Meng Lee, Milliman) a. Buy-side support Phase 1: review opportunityb. Buy-side support Phase 2: evaluate targetc. Buy-side support Phase 3: closing
V. Q&A

2© Oliver Wyman 2
Recent DealsSeveral very large transactions closed in 2014 & 2015, however 2016 has been relatively quiet to date

3© Oliver Wyman 3
Regulatory change
International influence
• European/Canadian solvency requirements
• SIFI influence
Risk and capital• Diversification and scale
• Tax benefits
Which way is the insurance M&A wind blowing?Tailwinds
• Seeking non-domestic growth
• Currency discrepancies
• Offsets to low investment returns
Economics• Low cost of debt
• Excess capital
• Motivations to shed low ROE business
4© Oliver Wyman 4
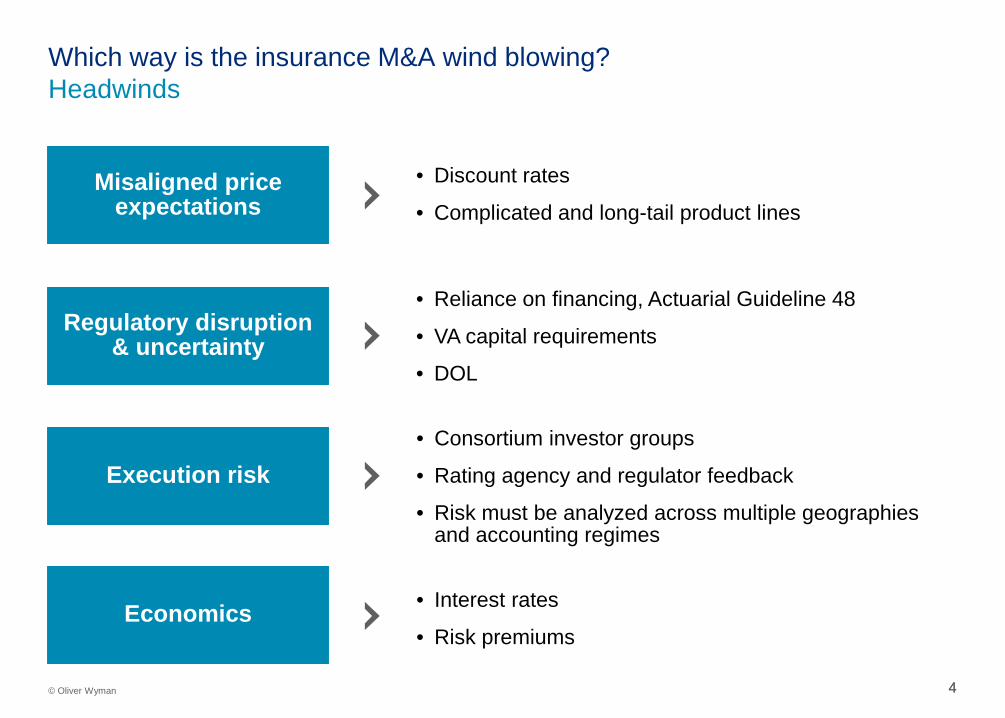
Misaligned price expectations
Execution risk
• Discount rates
• Complicated and long-tail product lines
Regulatory disruption & uncertainty
• Reliance on financing, Actuarial Guideline 48
• VA capital requirements
• DOL
Which way is the insurance M&A wind blowing?Headwinds
• Consortium investor groups
• Rating agency and regulator feedback
• Risk must be analyzed across multiple geographies and accounting regimes
Economics • Interest rates
• Risk premiums

5© Oliver Wyman 5
Q&A

Life Insurance Trends
2016 Society of Actuaries Annual Meeting
October 26, 2016

1
U.S. Life Sector Facing Numerous Challenges
Challenging Macro-Economic Factors
Difficulty in Driving Revenue Growth
Mixed Demographic Trends
Emergence of New Entrants Driving Competition
Technology Emerging as a Disrupter
Growing Regulatory Pressures
Increased Shareholder Activism
A
B
C
D
E
F
G

2
Life Industry Has Traded-off Materially as a Result of Industry Pressures and Negative Sentiment
Source: Bloomberg, CapIQ, Company filings and SNL FinancialNote: Market data as of 20-Sep-2016.¹Protection Peers: Aflac, Unum, Torchmark, Primerica, CNO, Genworth and FBL Financial.²Accumulation Peers: MetLife, Prudential, Ameriprise, Principal Financial Group, Lincoln National, VOYA and American Equity.
CNO
UNM
AFL
PRI
GNW
TMK
FFG
MET
PRU
AMP
PFG
VOYA
LNC
AEL
50 %
60 %
70 %
80 %
90 %
100 %
0.00 x 0.50 x 1.00 x 1.50 x 2.00 x 2.50 x 3.00 x
% o
f 52
Wee
k H
igh
P/BV (ex. AOCI)Protection Peers¹ Accumulation Peers²
# of Companies: 7
# of Companies: 7

3
Industry ROEs Have Been Slowly RecoveringFY2 ROE Median Analyst Estimates │ 2004 to Current
Source: IBES as of 20-Sep-2016¹ Protection Peers include Primerica, Aflac, FBL Financial, Torchmark, CNO, Unum and Genworth (GNW excluded after 12/31/2007). ² Capital Intensive Accumulations Peers include Prudential, Lincoln, Metlife, VOYA and American Equity.³ Non-Capital Intensive Accumulation Peers include Principal and Ameriprise.4 Pre-Crisis goes from 01-01-2004 to 12-31-2007.5 Post-Crisis goes from 01-01-2010 to 20-09-2016.
Protection peer ROE’s have been more stable and are in-
line with pre-crisis levels
Capital intensive
peer ROE’s have not
recovered to pre-crisis
levels whereas
non-capital intensive
peers have exceeded pre-crisis
levels
7.0 %
9.0 %
11.0 %
13.0 %
15.0 %
17.0 %
19.0 %
21.0 %
2004 2005 2006 2007 2008 2009 2010 2011 2012 2013 2014 2015 2016
FY2
RO
E
Protection Peers¹ Capital Intensive Accumulation Peers² Non-Capital Intensive Accumulation Peers³
Average Pre-Crisis4 Post-Crisis5 3YProtection Peers¹ 10.4 % 11.9 % 12.3 %Capital Intensive Accumulation Peers² 13.1 11.3 11.6Non-Capital Intensive Accumulation Peers³ 13.1 15.4 18.4
19.6 %
12.6 %
10.7 %

4
But Cost of Capital Still Elevated
Historical Beta Historical Cost of Equity
Source: Bloomberg, SNL Financial, CapIQ, Company filings. Note: Market data as of 20-Sep-2016. Peer composites based on average cost of equity across peers. ¹ Protection Peers include Primerica, Aflac, FBL Financial, Torchmark, CNO, Unum and Genworth (GNW excluded after 12/31/2007).² Capital Intensive Accumulations Peers Include Prudential, Lincoln, Metlife, VOYA and American Equity.³ Non-Capital Intensive Accumulation Peers include Principal and Ameriprise.4 Pre-Crisis goes from 01-01-2004 to 12-31-2007.5 Post-Crisis goes from 01-01-2010 to 20-09-2016.
7.0 %
9.0 %
11.0 %
13.0 %
15.0 %
17.0 %
19.0 %
21.0 %
23.0 %
25.0 %
2004 2006 2008 2010 2012 2014 2016
Impl
ied
Cos
t of E
quity
Protection Peers¹Capital Intensive Accumulation Peers²Non-Capital Intensive Accumulation Peers³
12.3 %
11.6 %
9.9 %
Average 04-Present Pre-Crisis4 Post-Crisis5
Protection Peers¹ 12.06 10.61 11.78Capital Intensive Accumulation Peers² 14.52 11.99 14.87Non-Capital Intensive Accumulation Peers³ 14.81 11.90 14.01
0.00
0.50
1.00
1.50
2.00
2.50
3.00
3.50
2004 2006 2008 2010 2012 2014 2016
His
toric
al A
xiom
a B
eta
Protection Peers¹Capital Intensive Accumulation Peers²Non-Capital Intensive Accumulation Peers³
Average 04-Present Pre-Crisis4 Post-Crisis5
Protection Peers¹ 1.24 0.80 1.42Capital Intensive Accumulation Peers² 1.52 0.99 1.76Non-Capital Intensive Accumulation Peers³ 1.47 0.98 1.63
1.48 1.40 1.27

5
How are Life Insurers Responding to Industry Challenges?
De-risking of Products and Reduction in Product Guarantees
Utilizing M&A to Optimize Business Portfolio, Add Scale and Enhance Capabilities
Re-Structuring and/or Breaking-Up of Complex and Multi-Line Companies
Searching for Enhanced Investment Yield
Investments in Technology and VC
Utilizing Capital Return to Enhance Returns to Shareholders
Sale of Certain Companies to Buyers With Lower Return Threshold
Increasing Cost Reduction Efforts
A
B
C
D
E
F
G
H
6
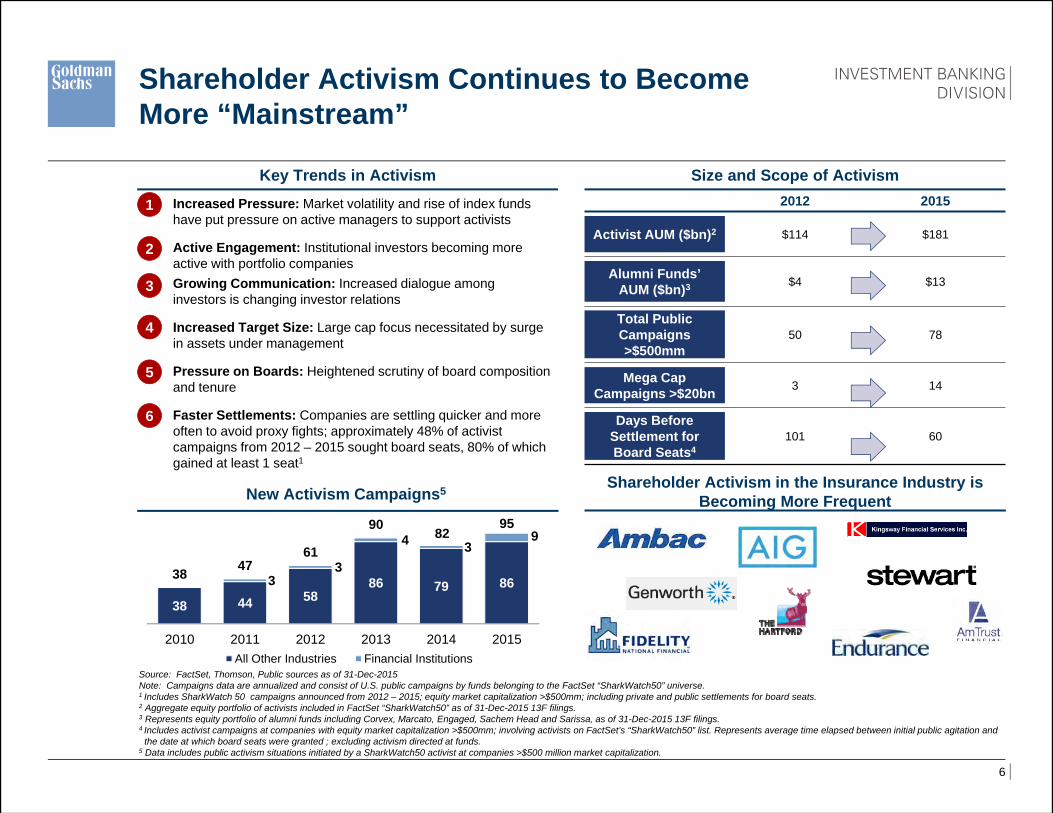
38 44 5886 79 863
3
4 39
38 4761
90 8295
2010 2011 2012 2013 2014 2015All Other Industries Financial Institutions
2012 2015
Activist AUM ($bn)2 $114 $181
Alumni Funds’ AUM ($bn)3 $4 $13
Total Public Campaigns>$500mm
50 78
Mega CapCampaigns >$20bn 3 14
Days Before Settlement forBoard Seats4
101 60
Key Trends in Activism Size and Scope of Activism
Shareholder Activism Continues to Become More “Mainstream”
Source: FactSet, Thomson, Public sources as of 31-Dec-2015Note: Campaigns data are annualized and consist of U.S. public campaigns by funds belonging to the FactSet “SharkWatch50” universe.1 Includes SharkWatch 50 campaigns announced from 2012 – 2015; equity market capitalization >$500mm; including private and public settlements for board seats.2 Aggregate equity portfolio of activists included in FactSet “SharkWatch50” as of 31-Dec-2015 13F filings.3 Represents equity portfolio of alumni funds including Corvex, Marcato, Engaged, Sachem Head and Sarissa, as of 31-Dec-2015 13F filings.4 Includes activist campaigns at companies with equity market capitalization >$500mm; involving activists on FactSet’s “SharkWatch50” list. Represents average time elapsed between initial public agitation and
the date at which board seats were granted ; excluding activism directed at funds.5 Data includes public activism situations initiated by a SharkWatch50 activist at companies >$500 million market capitalization.
Increased Pressure: Market volatility and rise of index funds have put pressure on active managers to support activists
Active Engagement: Institutional investors becoming more active with portfolio companies
Growing Communication: Increased dialogue among investors is changing investor relations
Increased Target Size: Large cap focus necessitated by surge in assets under management
Pressure on Boards: Heightened scrutiny of board composition and tenure
Faster Settlements: Companies are settling quicker and more often to avoid proxy fights; approximately 48% of activist campaigns from 2012 – 2015 sought board seats, 80% of which gained at least 1 seat1
1
2
3
4
5
6
New Activism Campaigns5 Shareholder Activism in the Insurance Industry is Becoming More Frequent
7
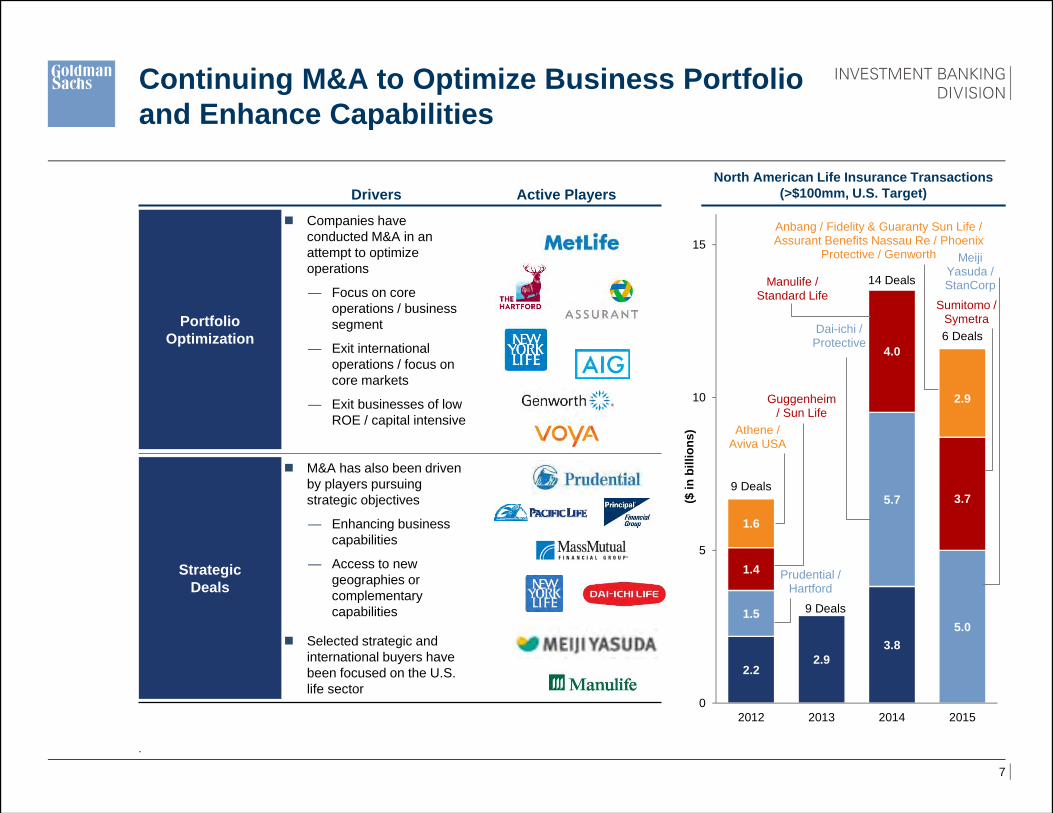
Continuing M&A to Optimize Business Portfolio and Enhance Capabilities
Drivers Active Players
PortfolioOptimization
Companies have conducted M&A in an attempt to optimize operations
— Focus on core operations / business segment
— Exit international operations / focus on core markets
— Exit businesses of low ROE / capital intensive
StrategicDeals
M&A has also been driven by players pursuing strategic objectives
— Enhancing business capabilities
— Access to new geographies or complementary capabilities
Selected strategic and international buyers have been focused on the U.S. life sector
North American Life Insurance Transactions (>$100mm, U.S. Target)
.
2.22.9
3.8
1.5
5.7
5.0
1.4
4.0
3.7
1.6
2.9
9 Deals
9 Deals
14 Deals
6 Deals
0
5
10
15
2012 2013 2014 2015
($ in
bill
ions
)
AXA
/AXA
Fin
Prudential / Hartford
Athene / Aviva USA
Guggenheim / Sun Life
Dai-ichi / Protective
Manulife / Standard Life
Anbang / Fidelity & Guaranty Sun Life / Assurant Benefits Nassau Re / Phoenix
Protective / Genworth
Sumitomo / Symetra
Meiji Yasuda / StanCorp

8
Emergence of New Entrants Driving Competition
Active Investors Financial / Run-off Investors

General Public Release
Reinsurance in M&A
General Public Release
Society of Actuaries Annual Meeting 26 October 2016

General Public Release
Socie ty of Actuaries Annual Meeting | 2 6 October 2 0 1 6
• The possible role of Reinsurance in an M&A transaction
• Reinsurance capital management example
• Reinsurance financing s tructure – what works & not
Reinsurance in M&A
2
General Public Release
Socie ty of Actuaries Annual Meeting | 2 6 October 2 0 1 6 3
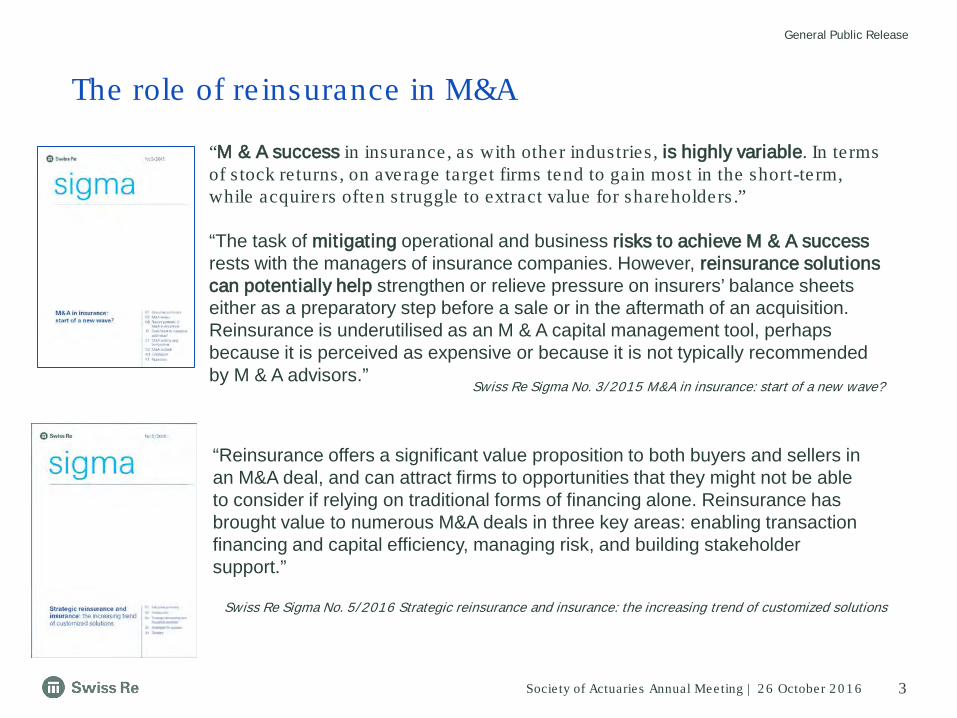
The role of re insurance in M&A
“M & A success in insurance, as with other industries , is highly variable. In terms of s tock returns, on average target firms tend to gain most in the short-term, while acquirers often s truggle to extract value for shareholders .”
“The task of mitigating operational and business risks to achieve M & A success rests with the managers of insurance companies. However, reinsurance solutions can potentially help strengthen or relieve pressure on insurers’ balance sheets either as a preparatory step before a sale or in the aftermath of an acquisition. Reinsurance is underutilised as an M & A capital management tool, perhaps because it is perceived as expensive or because it is not typically recommended by M & A advisors.”
“Reinsurance offers a significant value proposition to both buyers and sellers in an M&A deal, and can attract firms to opportunities that they might not be able to consider if relying on traditional forms of financing alone. Reinsurance has brought value to numerous M&A deals in three key areas: enabling transaction financing and capital efficiency, managing risk, and building stakeholder support.”
Swiss Re Sigma No. 3/ 2015 M&A in insurance: start of a new wave?
Swiss Re Sigma No. 5/ 2016 Strategic reinsurance and insurance: the increasing trend of customized solutions

General Public Release
Socie ty of Actuaries Annual Meeting | 2 6 October 2 0 1 6 4
Reinsurance can be applied to achieve the key goals of both parties in a transaction
Reinsurance Value PropositionReinsurance solves hurdles to deal execution
Build Stakeholder
Support
SecureTransaction Financing
Optimize Post-Deal Risk
Deliver Post-Deal Performance Targets
Unlock Trapped Capital Before Execution
Avoid Post-Transaction
al Issues
Improve Transaction
Certainty
Realize Full Deal Value
Buyers
Sellers
1. Capital: Enabling transaction financing and capital efficiency
2. Risk: Managing acquired and ongoing risk/ volatility
3. Stakeholder support: Building s takeholder support by addressing different needs

General Public Release
Socie ty of Actuaries Annual Meeting | 2 6 October 2 0 1 6 5
Reinsurance as Capital ManagementLeverage Effect
Companies maintain a Solvency ratio >100% to have a buffer against adverse developments and capital market volatility
A reduction in SCR increases the Solvency ratio in a more effective and sustainable way than an increase in own funds– Capital relief of USD 33m has the same impact as increasing own funds by USD 50m– In adverse claims developments, reinsurance protects own funds and provides capital relief
Increase in own funds
Current Solvencyratio: 100 %
OwnFunds
SCR
USD +50m
Target Solvency ratio: 150 %
USD -33m
Target Solvency ratio: 150 %
OwnFunds
SCR
100150
OwnFunds
SCR
Re-insurance
100100 100 67

General Public Release
Socie ty of Actuaries Annual Meeting | 2 6 October 2 0 1 6 6
Successful and Un-successful M&A transactionsVIF Financing success & what doesn’t work

M&A Buy-side EvaluationSu Meng Lee, FSA, MAAA, CERAOctober 26, 2016
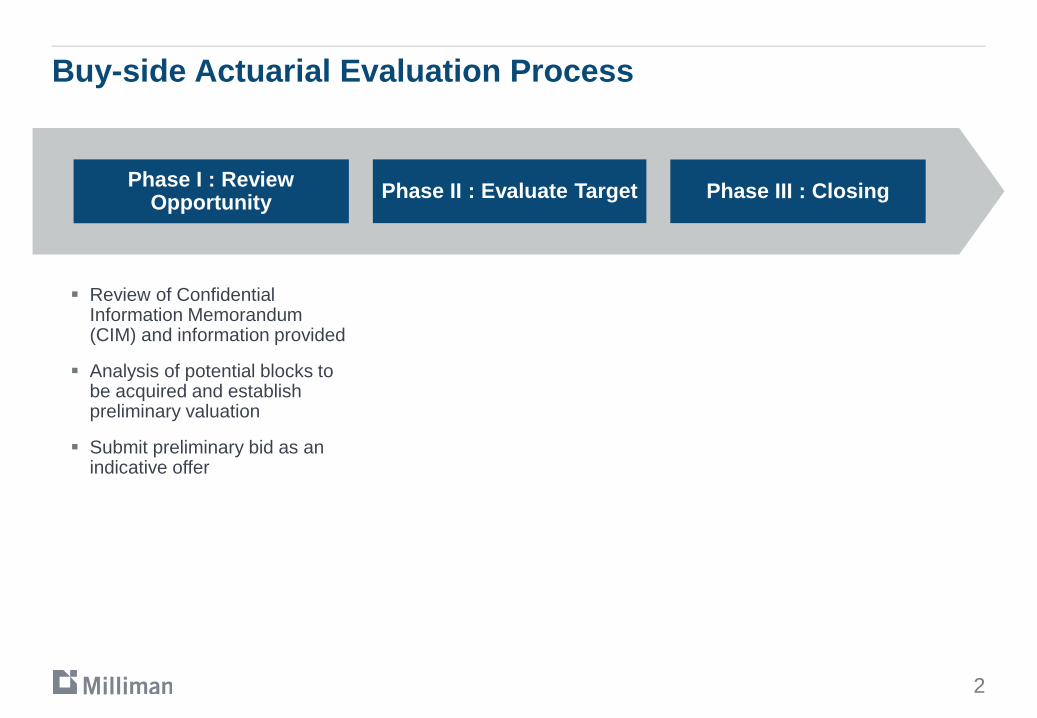
Buy-side Actuarial Evaluation Process
Phase I : Review Opportunity
Review of Confidential Information Memorandum (CIM) and information provided
Analysis of potential blocks to be acquired and establish preliminary valuation
Submit preliminary bid as an indicative offer
Phase II : Evaluate Target Phase III : Closing
2

Phase I : Analysis of Life & Annuity Products
3
Products Buyer Interest Mortality Exposure
GA Investment Risk Comments
Life
Traditional • Relatively less issues compared to the
other products
Term • XXX Regulations - financing difficulties
UL/EIUL
• Products with secondary guarantee carry tail risk
• AXXX Regulations - financing difficulties
LTC
• Lack credible experience – tail exposure
• Insurers increasing rates• Other risks : Morbidity & lapses
Annu
ities
DA/FIA • ALM risk
Structured Settlements
• ALM risk• Mortality – substandard risk
VA
• Regulation changes – uncertainties• Volatile reserves and capital balance• Other risks : Lapses & policy holder
behavior
HighestHighMediumLow

Buy-side Actuarial Evaluation Process
Phase I : Review Opportunity
Review of Confidential Information Memorandum (CIM) and information provided
Analysis of potential blocks to be acquired and establish preliminary valuation
Submit preliminary bid as an indicative offer
Phase II : Evaluate Target
Develop appraisal analysis based on Buyer’s financial objectives and reporting methodologies
In-depth due diligence process with more access to information than in Phase I
Submit final bid as a binding offer
Phase III : Closing
4
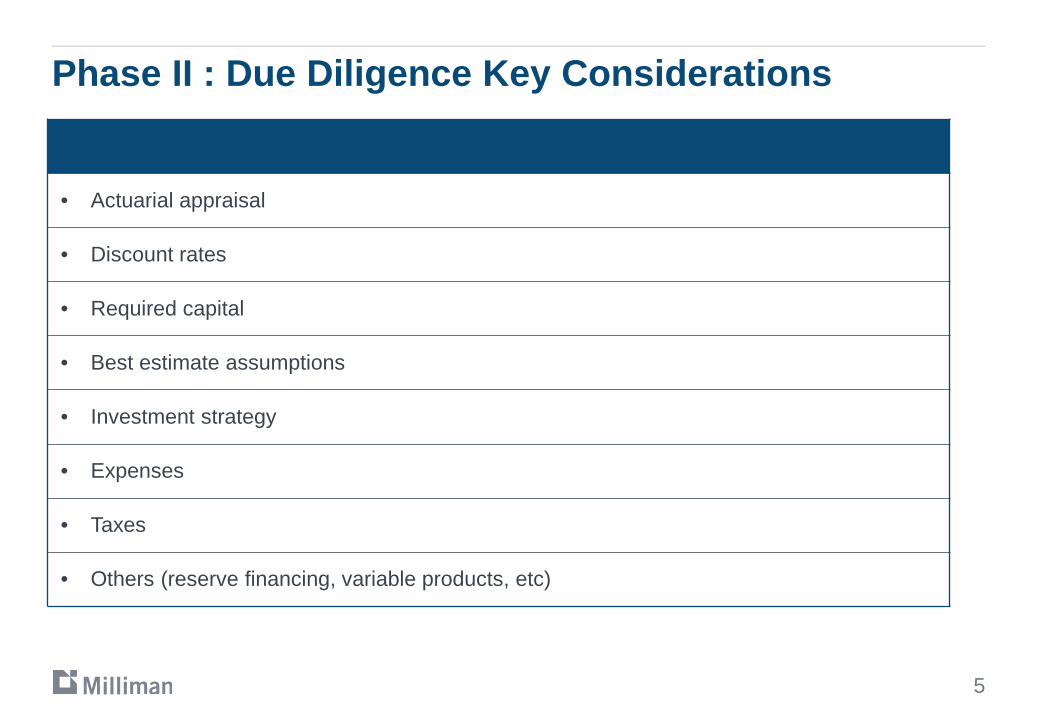
Phase II : Due Diligence Key Considerations
• Actuarial appraisal
• Discount rates
• Required capital
• Best estimate assumptions
• Investment strategy
• Expenses
• Taxes
• Others (reserve financing, variable products, etc)
5
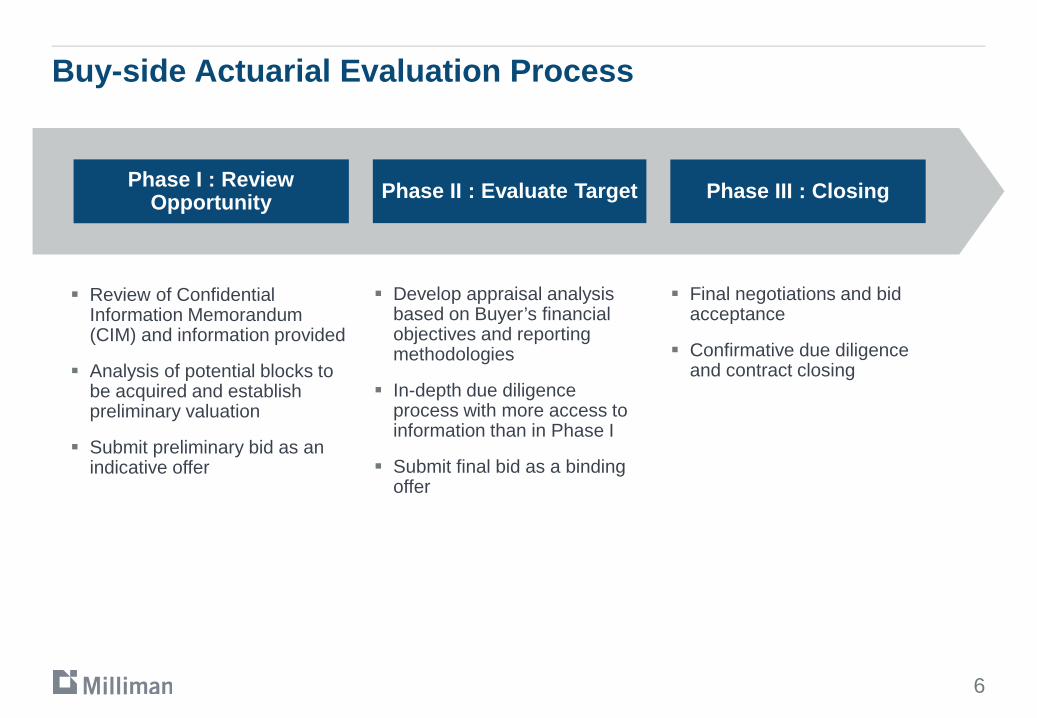
Buy-side Actuarial Evaluation Process
Phase I : Review Opportunity
Review of Confidential Information Memorandum (CIM) and information provided
Analysis of potential blocks to be acquired and establish preliminary valuation
Submit preliminary bid as an indicative offer
Phase II : Evaluate Target
Develop appraisal analysis based on Buyer’s financial objectives and reporting methodologies
In-depth due diligence process with more access to information than in Phase I
Submit final bid as a binding offer
Phase III : Closing
Final negotiations and bid acceptance
Confirmative due diligence and contract closing
6

Phase III : Common Reasons Deals Do Not Close
7
Regulatory uncertainties
Deal Fall Through
External market forces
Incompatible structure
Unable to mutually agree on valuation