life history, longevity and aging history, longevity and aging • population ecology • life...
TRANSCRIPT
Life history, longevity and aging
• Population ecology • Life history evolution • Reproductive value • Longevity and senescence
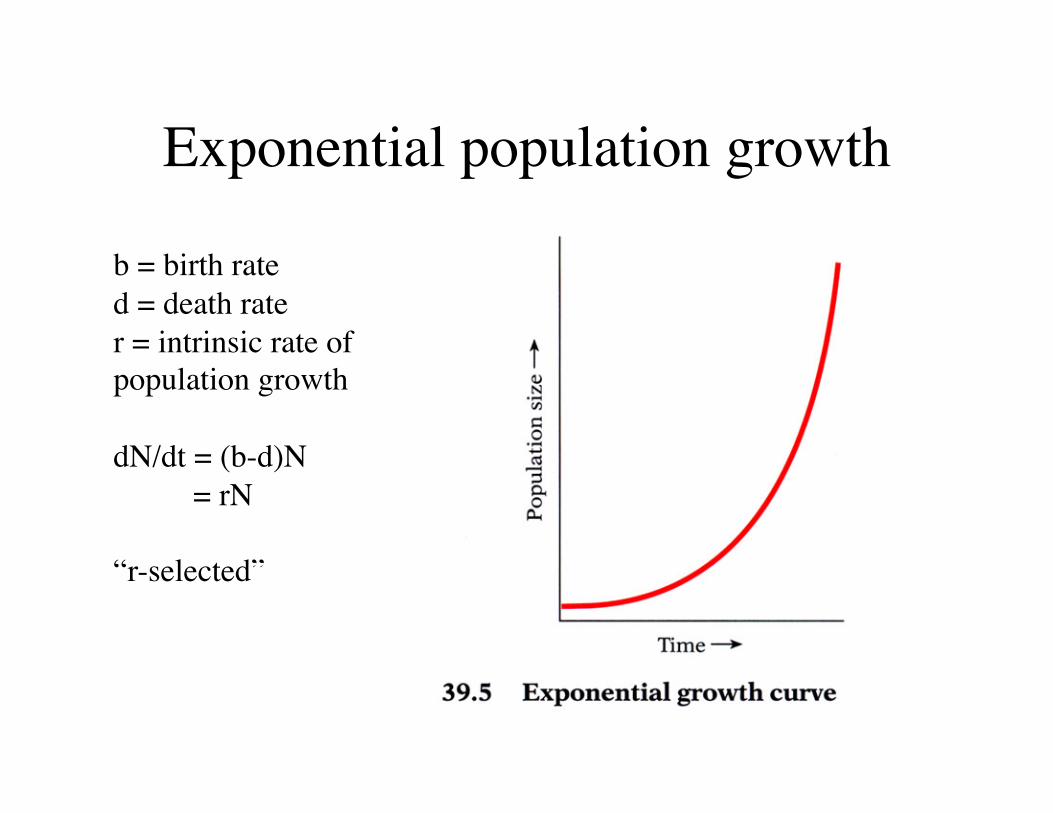
Exponential population growth
b = birth rate d = death rate r = intrinsic rate of population growth
dN/dt = (b-d)N = rN
“r-selected”
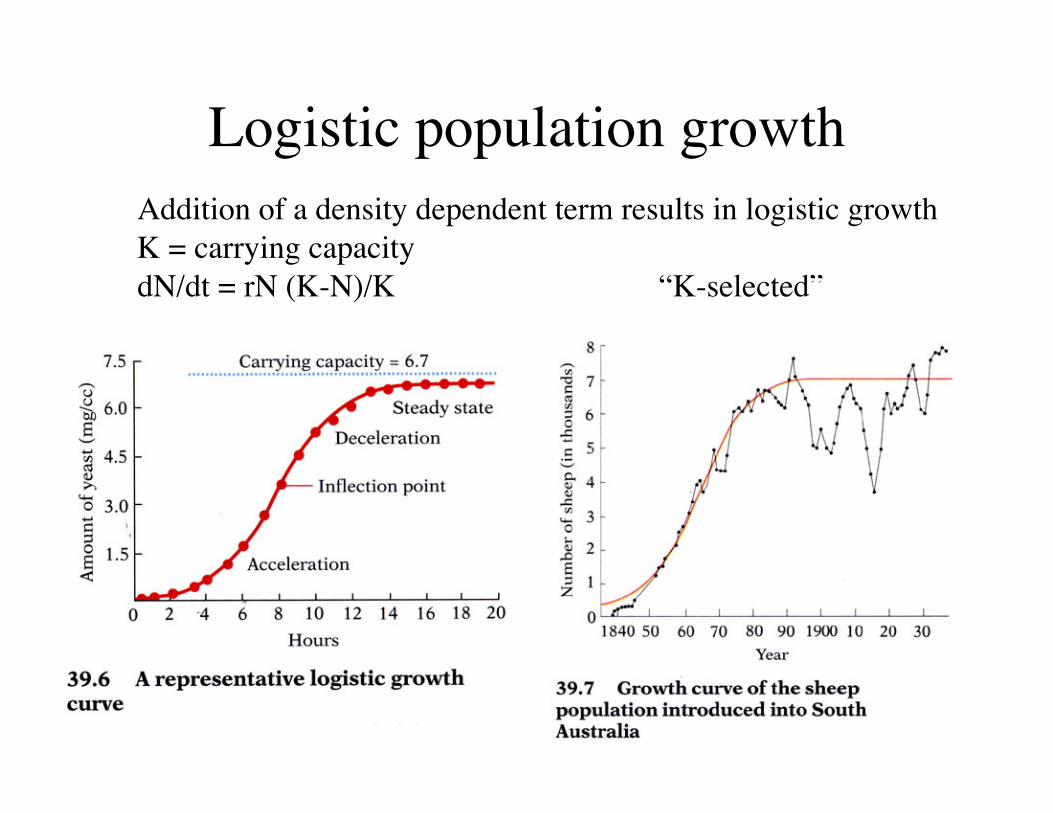
Logistic population growth Addition of a density dependent term results in logistic growth K = carrying capacity dN/dt = rN (K-N)/K “K-selected”

Age-specific population growth
• Age-specific survivorship (lx) • Age specific reproduction (mx) • Net reproductive rate: Ro = Σ lxmx
– Stable population: Ro = 1 – Growing population: Ro > 1 – Declining population: Ro < 1
The age-specific survival (lx) and fertility (mx) pattern specifies an organism’s life history pattern.
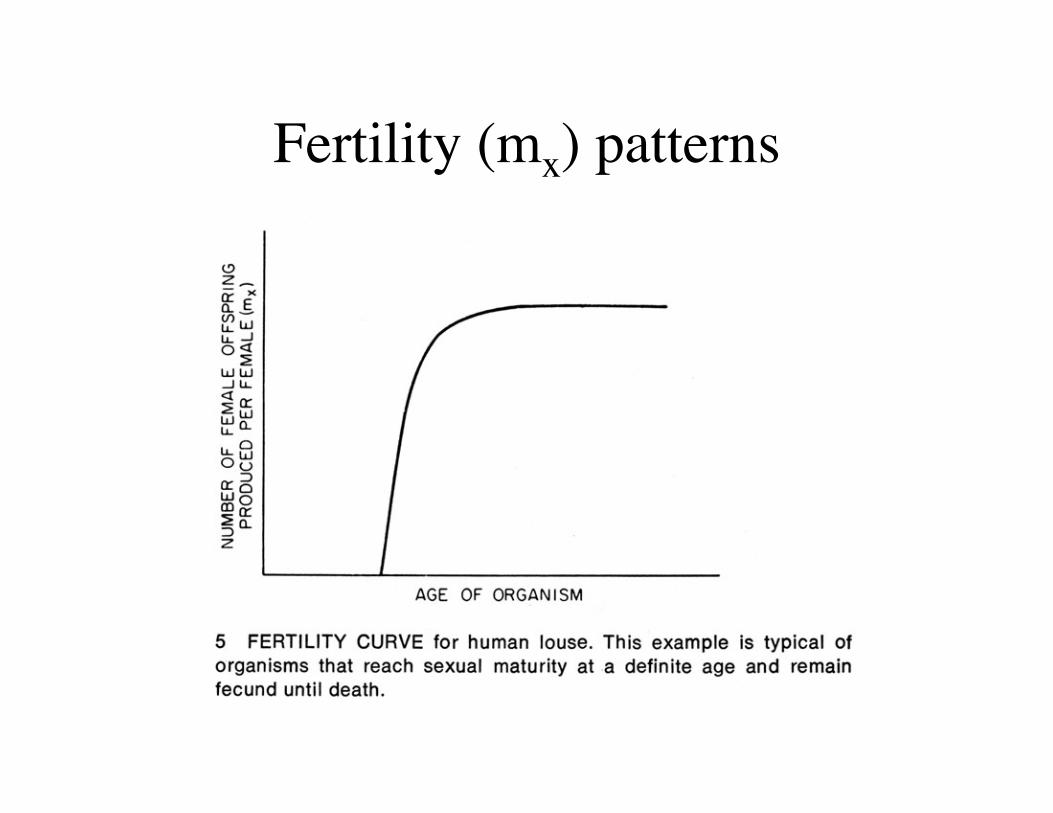
Fertility (mx) patterns
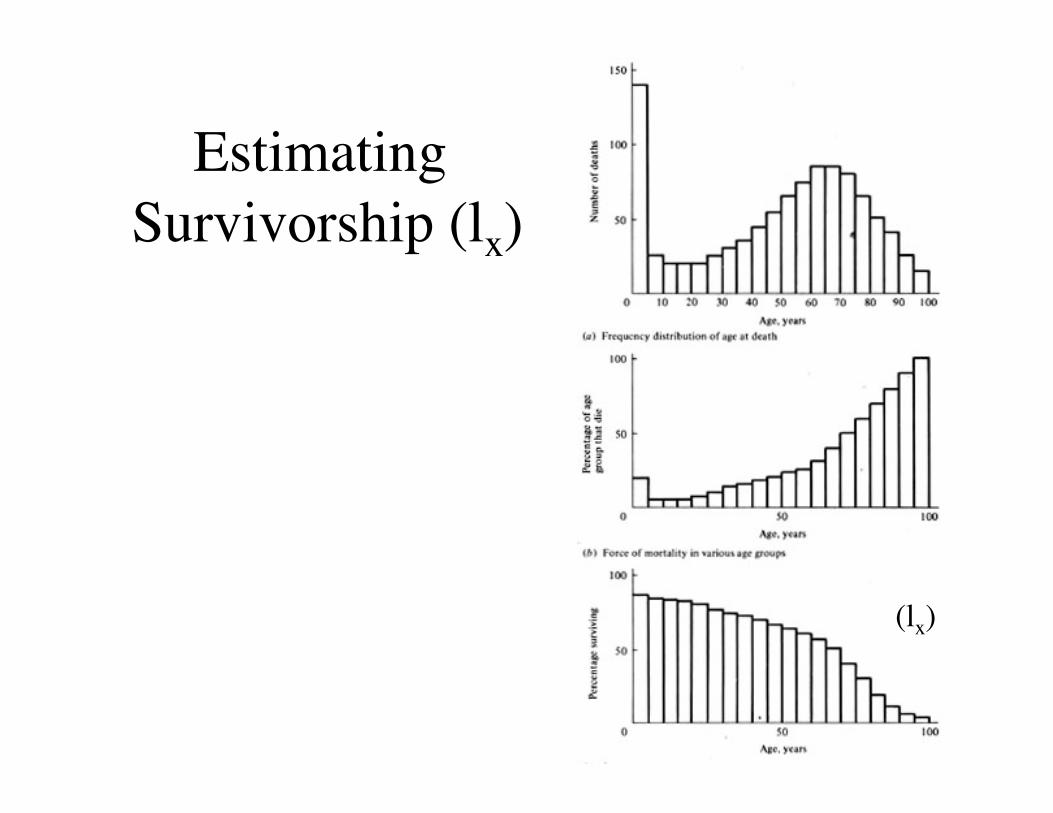
Estimating Survivorship (lx)
(lx)
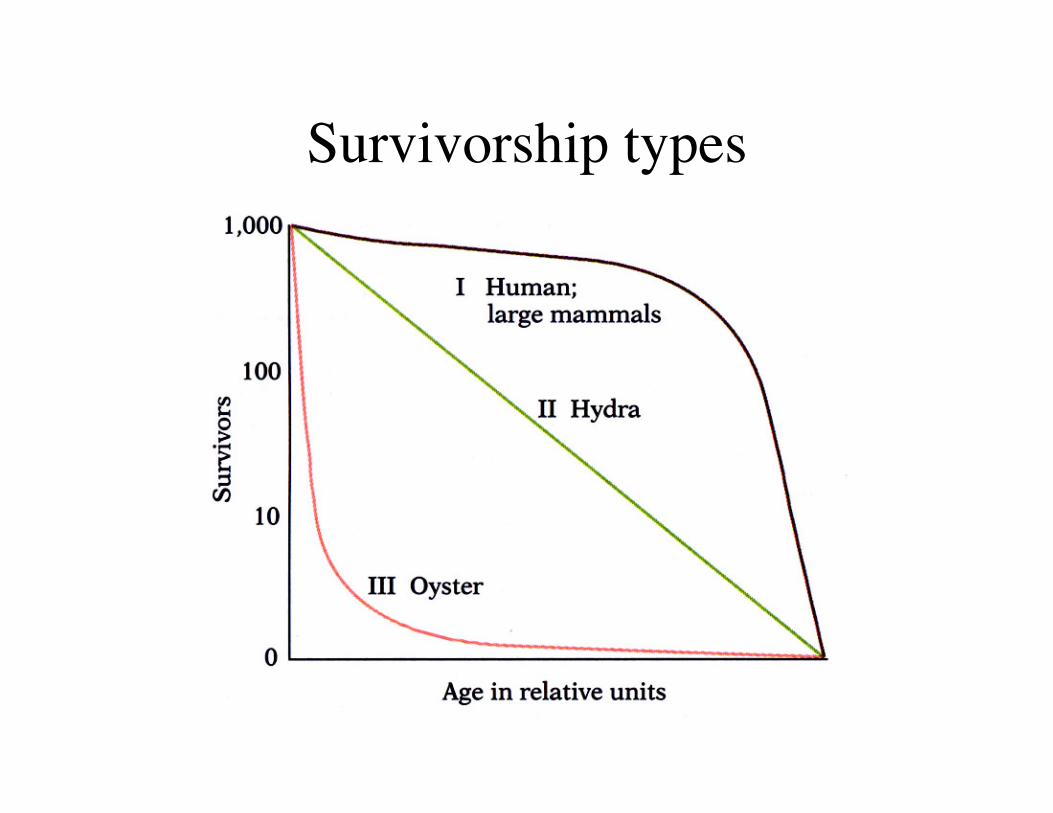
Survivorship types

Survivorship curve examples
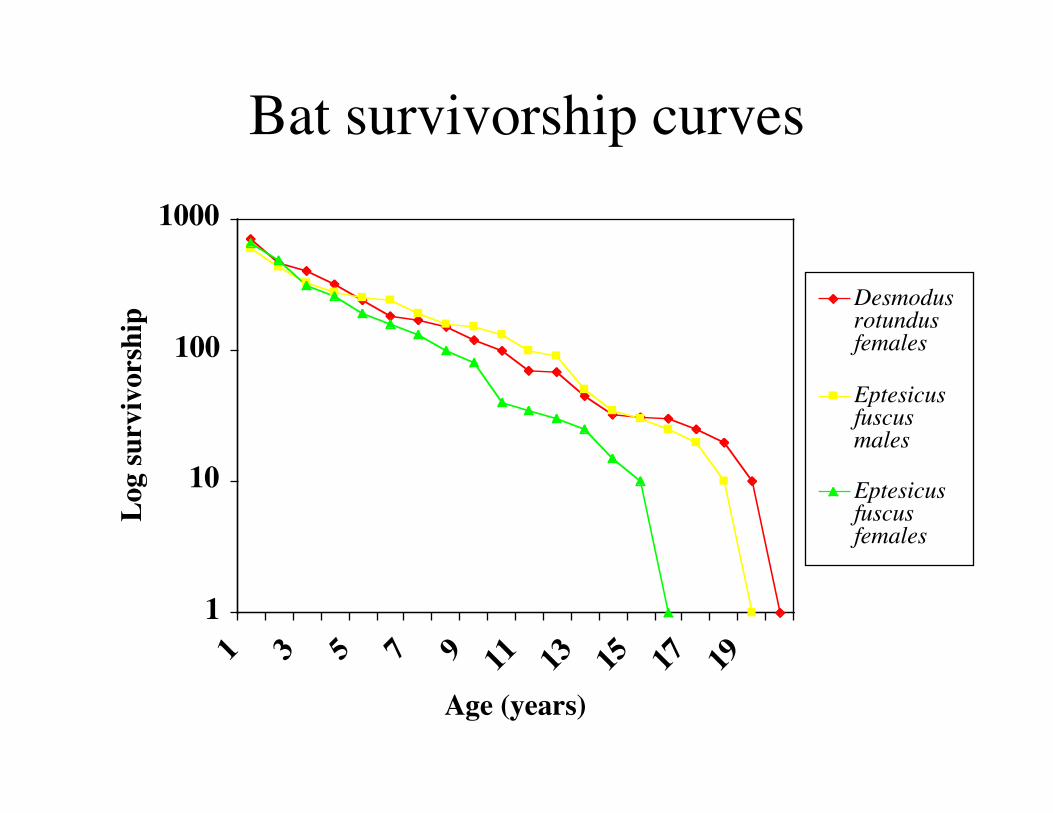
Bat survivorship curves
1
10
100
1000
1 3 5 7 9 11 13 15 17 19
Age (years)
Log
surv
ivor
ship
Desmodusrotundusfemales
Eptesicusfuscusmales
Eptesicusfuscusfemales

r vs K selected
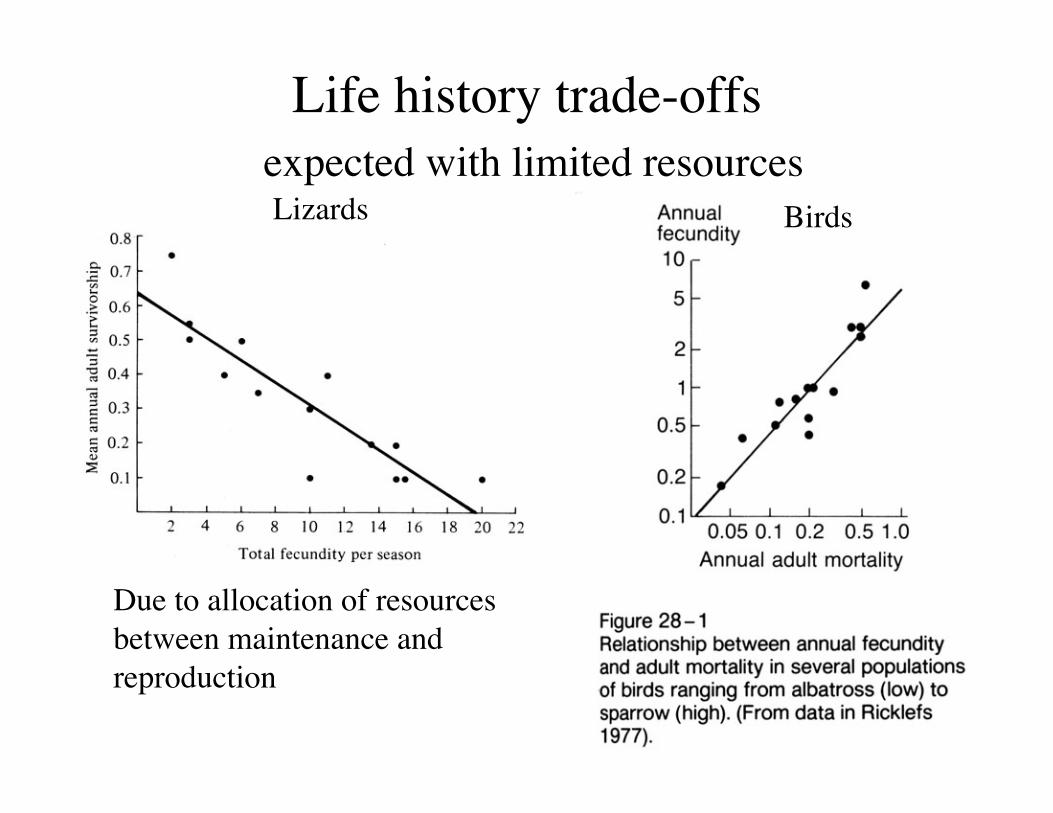
Life history trade-offs� expected with limited resources
Lizards Birds
Due to allocation of resources between maintenance and reproduction
Reproductive value • Age-specific expectation of offspring (how much is
a female worth in terms of future offspring?) • Assuming a stable population (R = 1) • Vx = (Σt=xmt lt)/lx
– the number of female offspring produced at this moment by females of age x or older / the number of females which are age x at this moment
• Reproductive value peaks near puberty in human populations
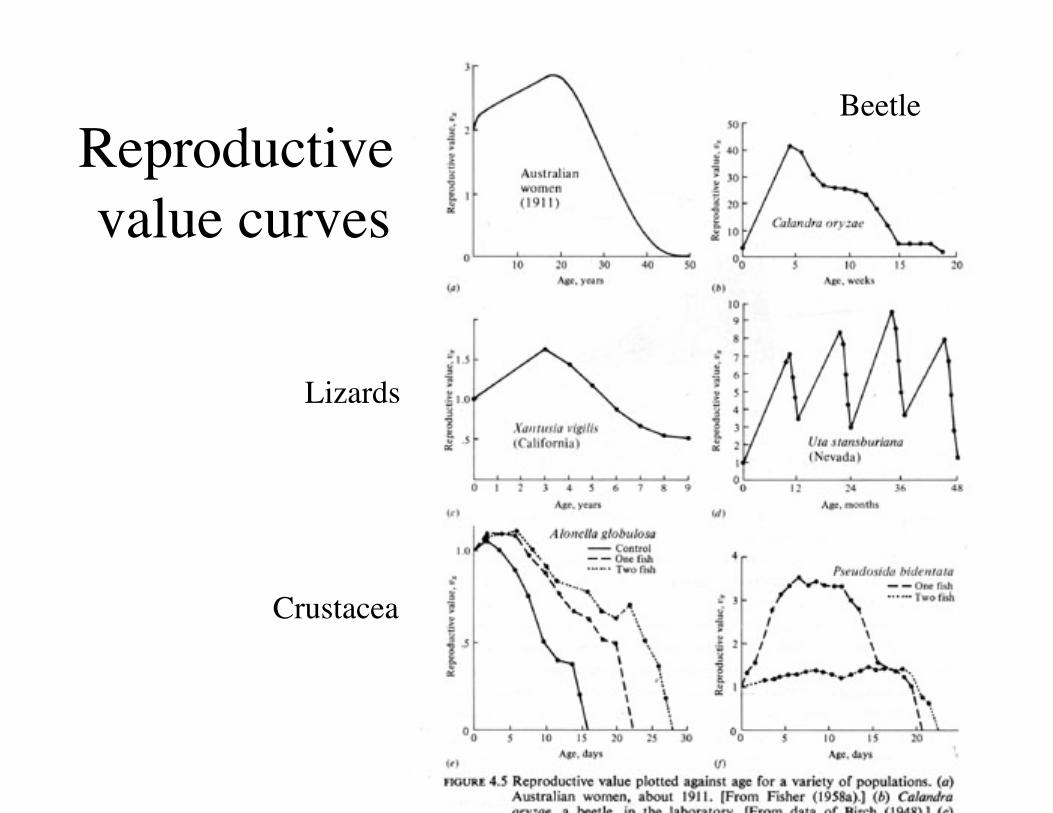
Reproductive value curves
Lizards
Beetle
Crustacea
Evolutionary theory of aging • The risk of extrinsic mortality should influence life
span because the force of natural selection declines with age
• Consequently, mutations with late-acting deleterious effects will not be eliminated (referred to as antagonistic pleiotropy)
• Senescence should result and shorten life span in proportion to mortality risk
• Expect that investing in early reproduction will detract from survival - the “disposable soma” idea
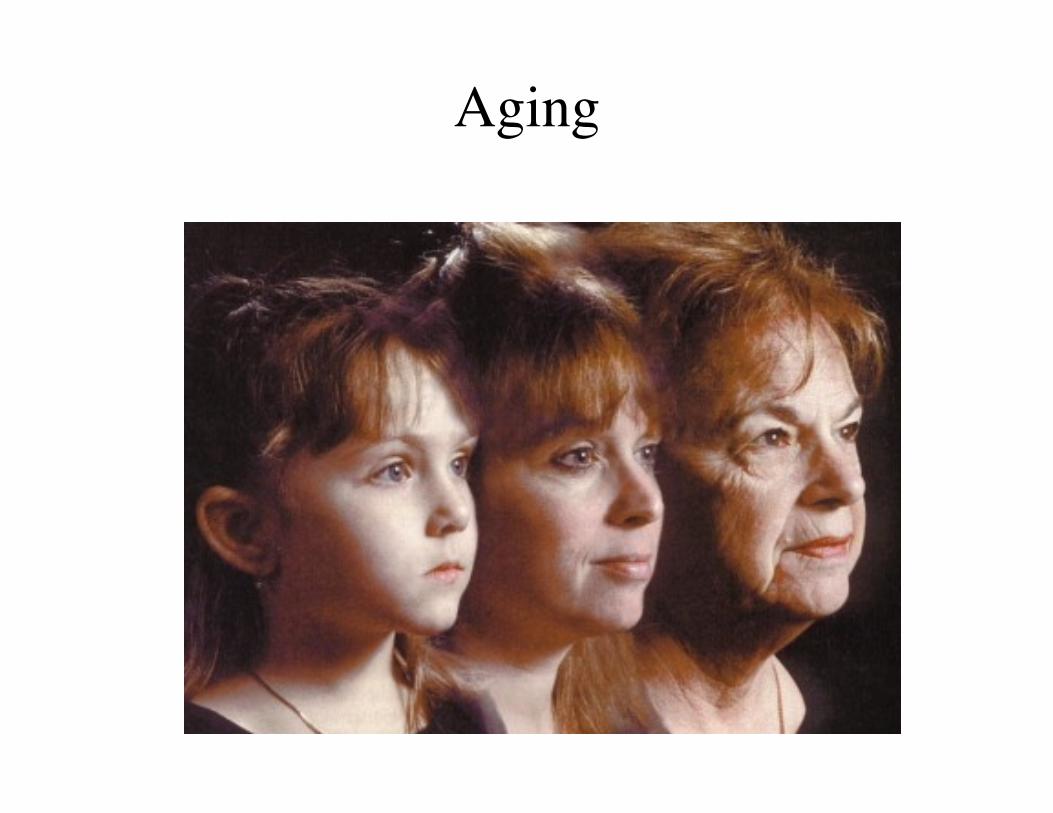
Aging
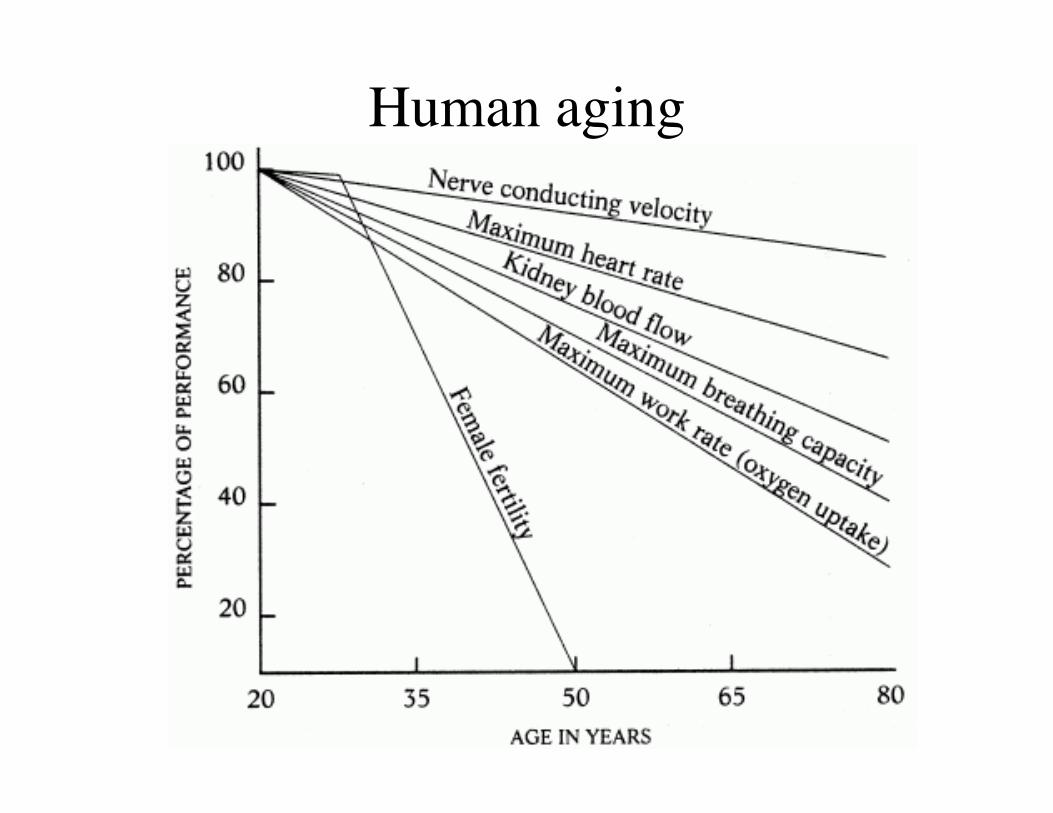
Human aging
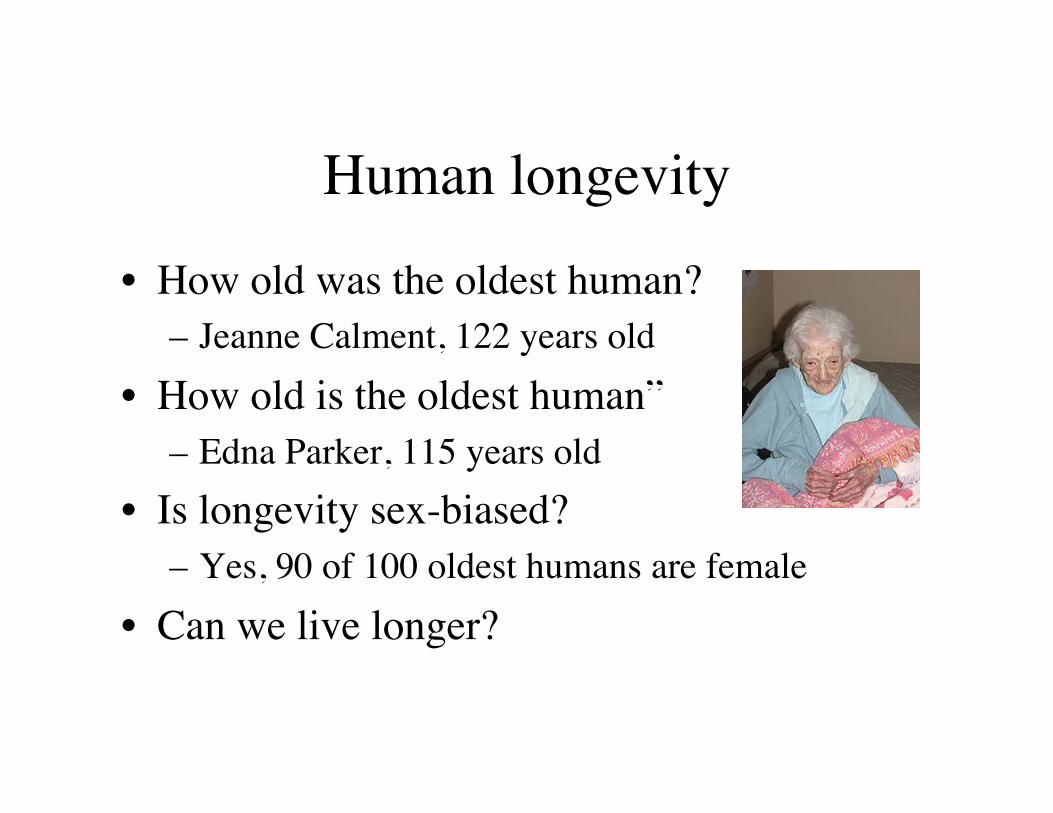
Human longevity
• How old was the oldest human? – Jeanne Calment, 122 years old
• How old is the oldest human” – Edna Parker, 115 years old
• Is longevity sex-biased? – Yes, 90 of 100 oldest humans are female
• Can we live longer?

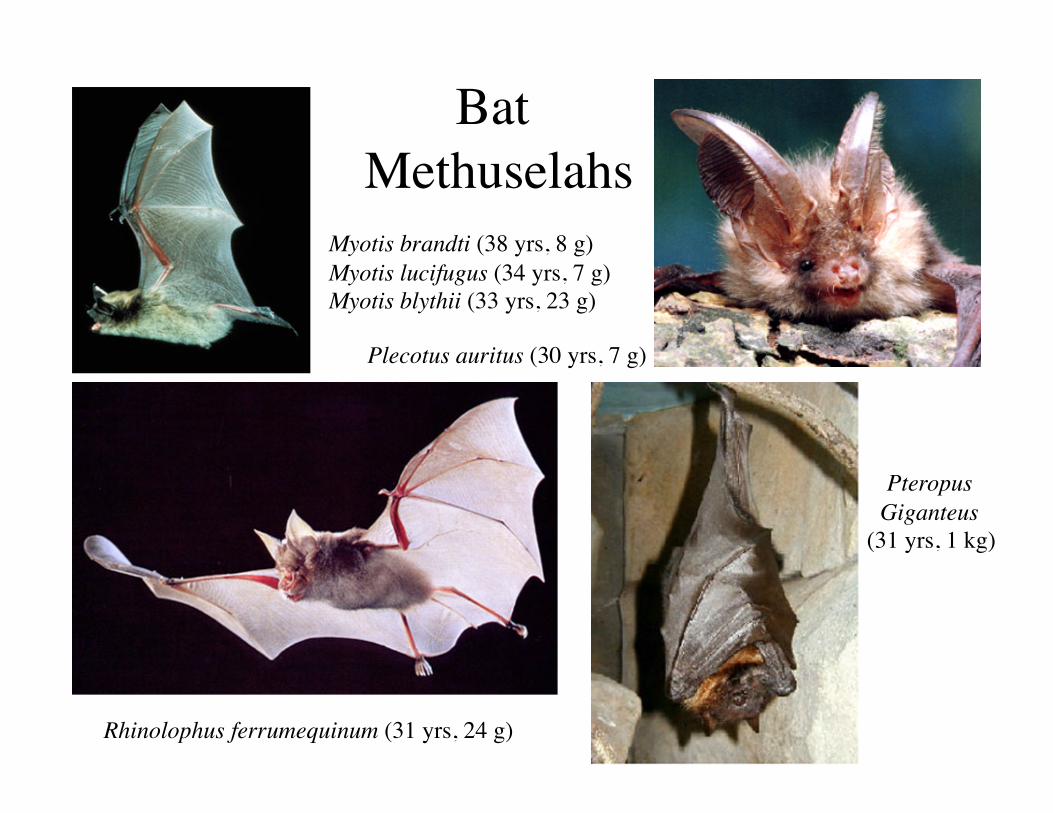
Bat Methuselahs
Rhinolophus ferrumequinum (31 yrs, 24 g)
Plecotus auritus (30 yrs, 7 g)
Myotis brandti (38 yrs, 8 g) Myotis lucifugus (34 yrs, 7 g) Myotis blythii (33 yrs, 23 g)
Pteropus Giganteus
(31 yrs, 1 kg)

Aging studies and bats • Bats are long-lived because they save energy by going into
torpor or hibernate (Bouliere 1958) • But, nonhibernating tropical bat species live as long as
temperate species (Herreid 1964) • Furthermore, bats live longer than expected for their body
size even after adjusting for metabolic differences (Jurgens and Prothero 1987)
• And, marsupials, which have lower metabolic rates than bats, have much shorter life spans (Austad and Fischer 1991)
• Flying mammals live longer than nonflying mammals (Holmes and Austad 1994)
Possible factors influencing �extrinsic mortality risk in bats
• Body size • Group size • Cave roosting • Diet • Hibernation (Latitude) • Reproductive rate
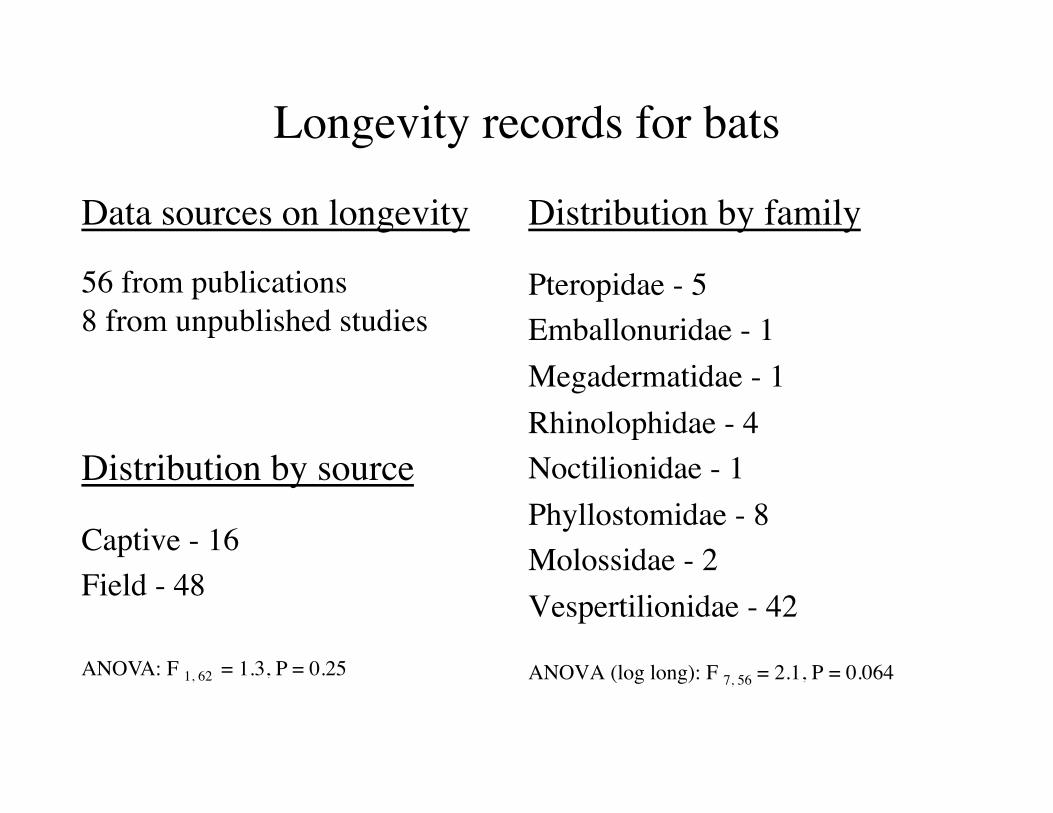
Longevity records for bats Distribution by family
Pteropidae - 5 Emballonuridae - 1 Megadermatidae - 1 Rhinolophidae - 4 Noctilionidae - 1 Phyllostomidae - 8 Molossidae - 2 Vespertilionidae - 42
ANOVA (log long): F 7, 56 = 2.1, P = 0.064
Distribution by source
Captive - 16 Field - 48
ANOVA: F 1, 62 = 1.3, P = 0.25
Data sources on longevity
56 from publications 8 from unpublished studies
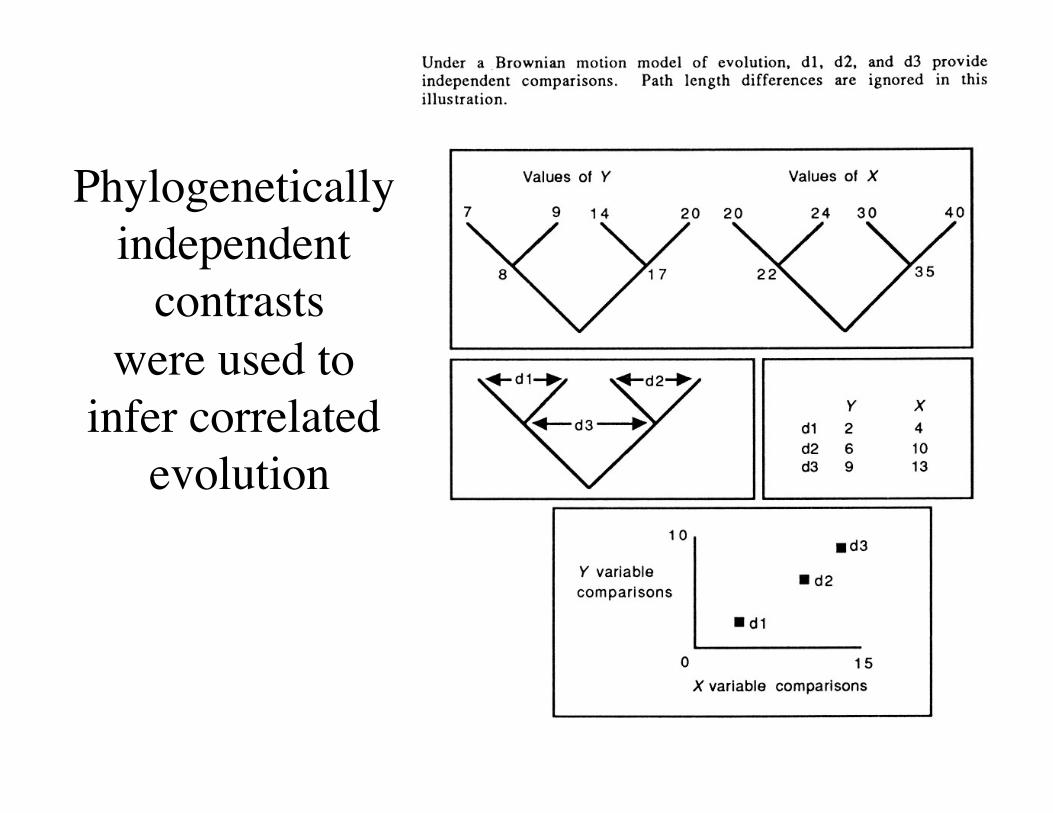
Phylogenetically independent
contrasts�were used to �
infer correlated evolution
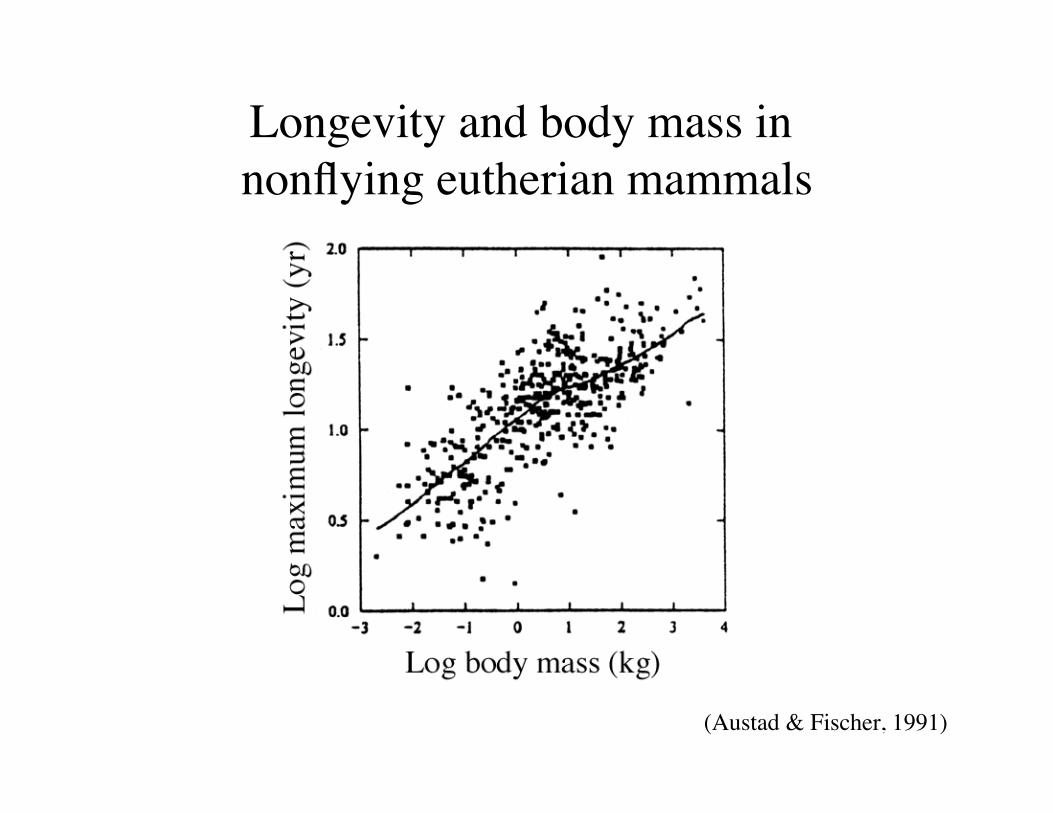
Longevity and body mass in �nonflying eutherian mammals
(Austad & Fischer, 1991)
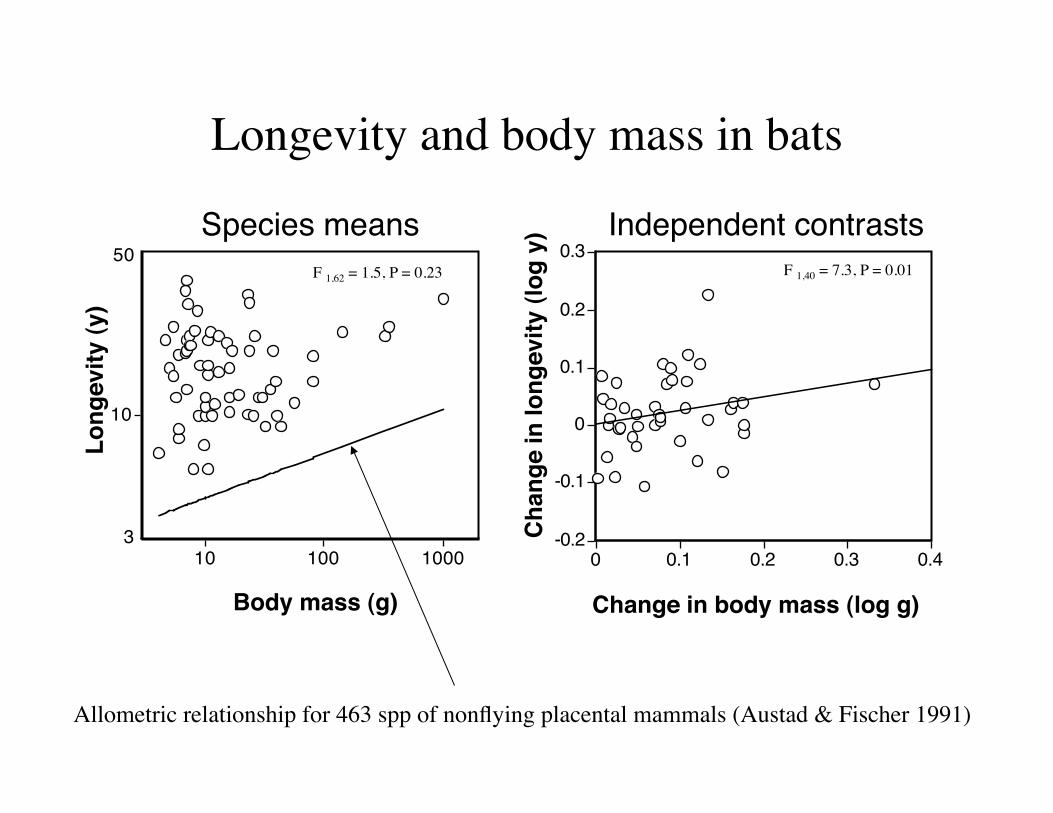
Longevity and body mass in bats
10
10 100 10003
50
-0.2
-0.1
0
0.1
0.2
0.3
0 0.1 0.2 0.3 0.4
Body mass (g) Change in body mass (log g)
Chan
ge in
long
evity
(log
y)
Long
evity
(y)
Species means Independent contrasts F 1,62 = 1.5, P = 0.23 F 1,40 = 7.3, P = 0.01
Allometric relationship for 463 spp of nonflying placental mammals (Austad & Fischer 1991)
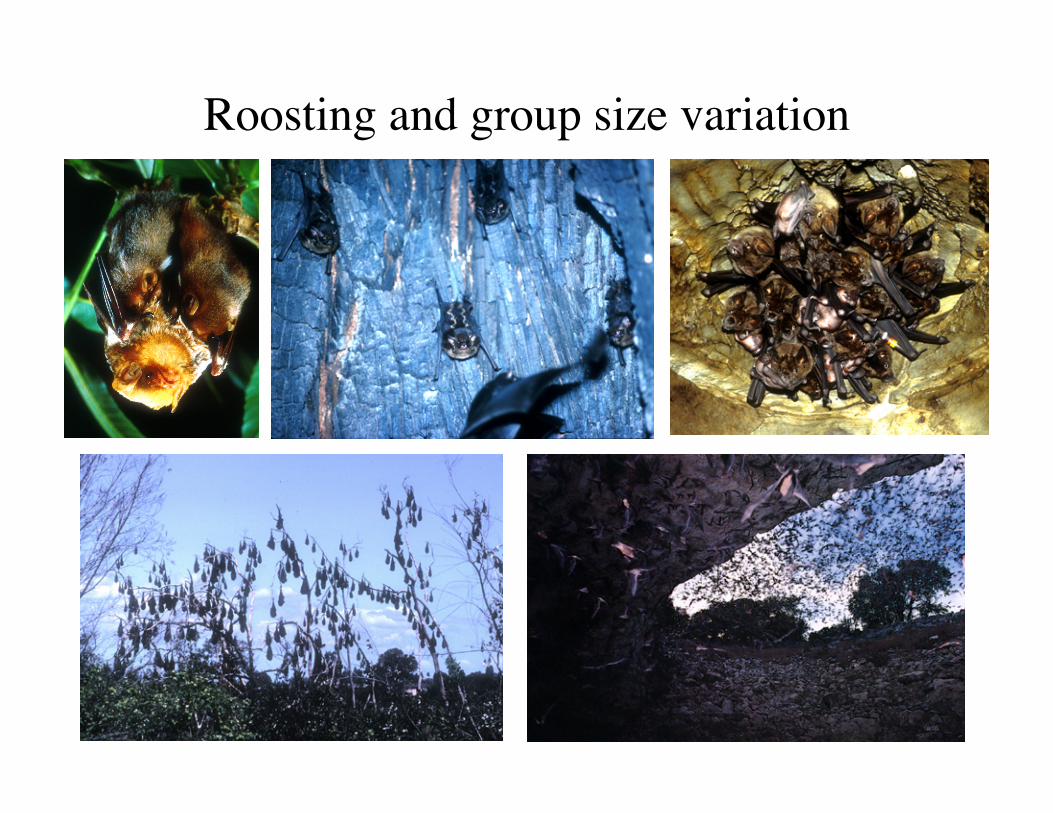
Roosting and group size variation
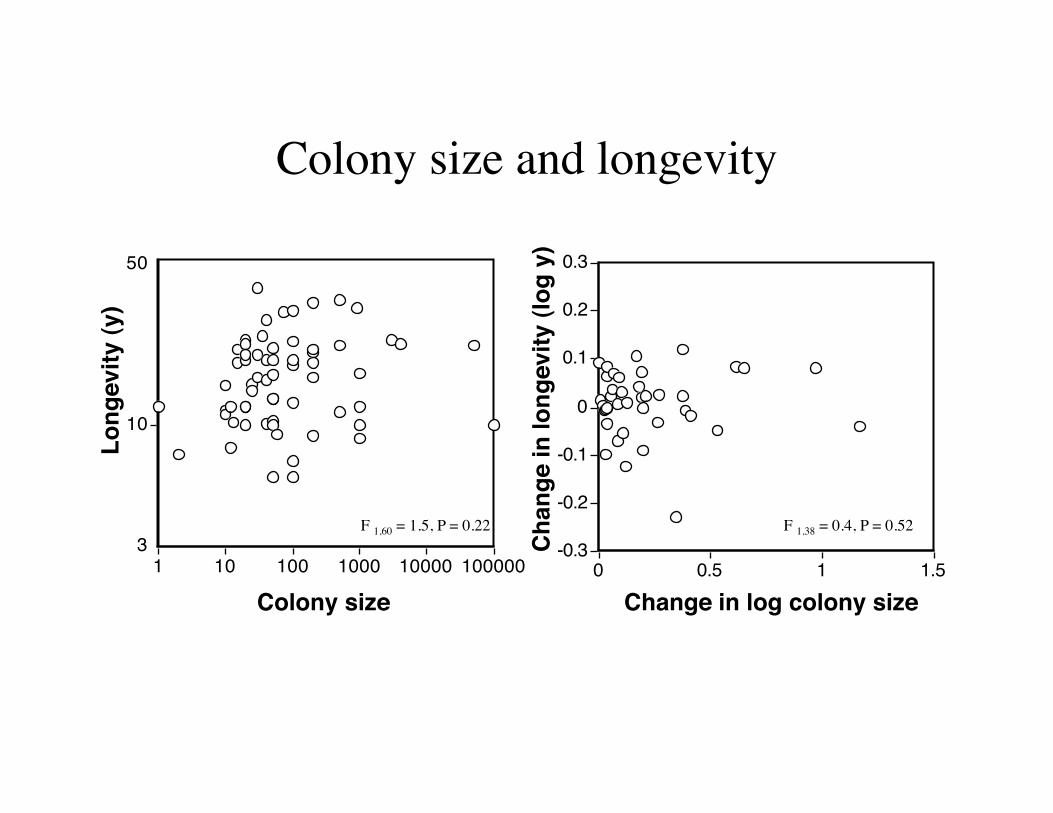
Colony size and longevity
Colony size Change in log colony size
Chan
ge in
long
evity
(log
y)
Long
evity
(y)
10
1 10 100 1000 10000 1000003
50
-0.3
-0.2
-0.1
0
0.1
0.2
0.3
0 0.5 1 1.5
F 1,60 = 1.5, P = 0.22 F 1,38 = 0.4, P = 0.52
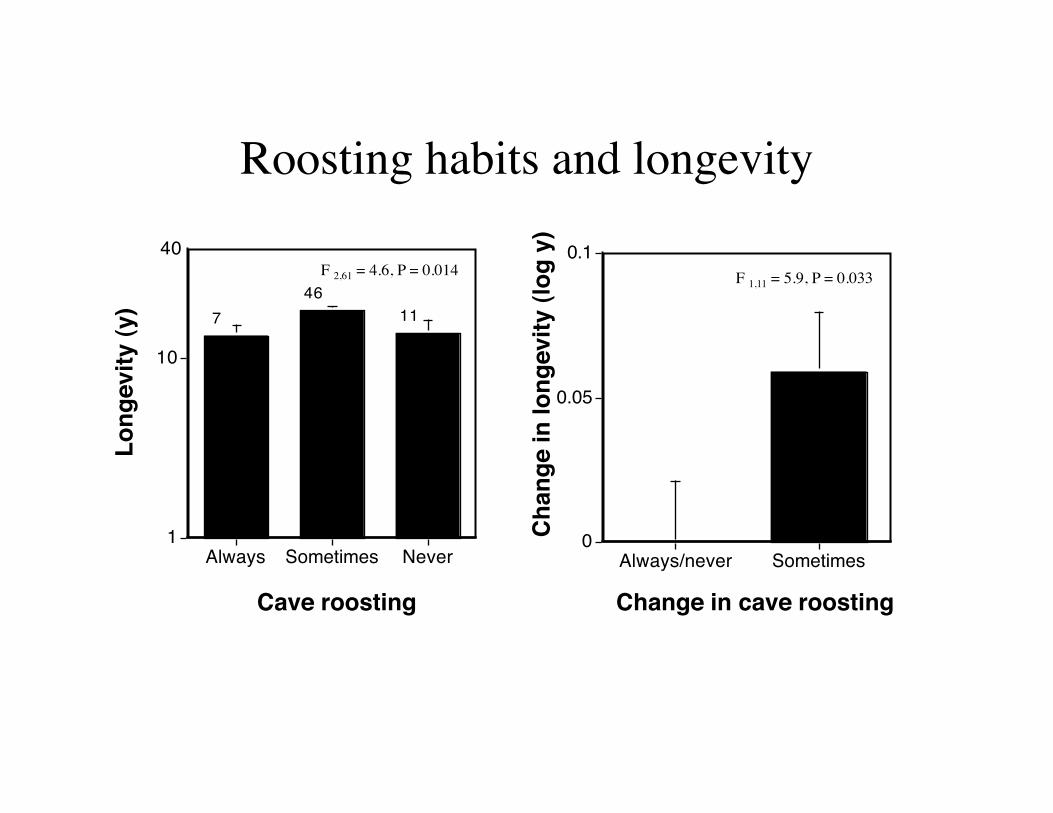
Roosting habits and longevity
746
11
1
10
Always Sometimes Never0
0.05
0.1
Always/never Sometimes
40
Cave roosting Change in cave roosting
Chan
ge in
long
evity
(log
y)
Long
evity
(y)
(a) (b) F 2,61 = 4.6, P = 0.014 F 1,11 = 5.9, P = 0.033
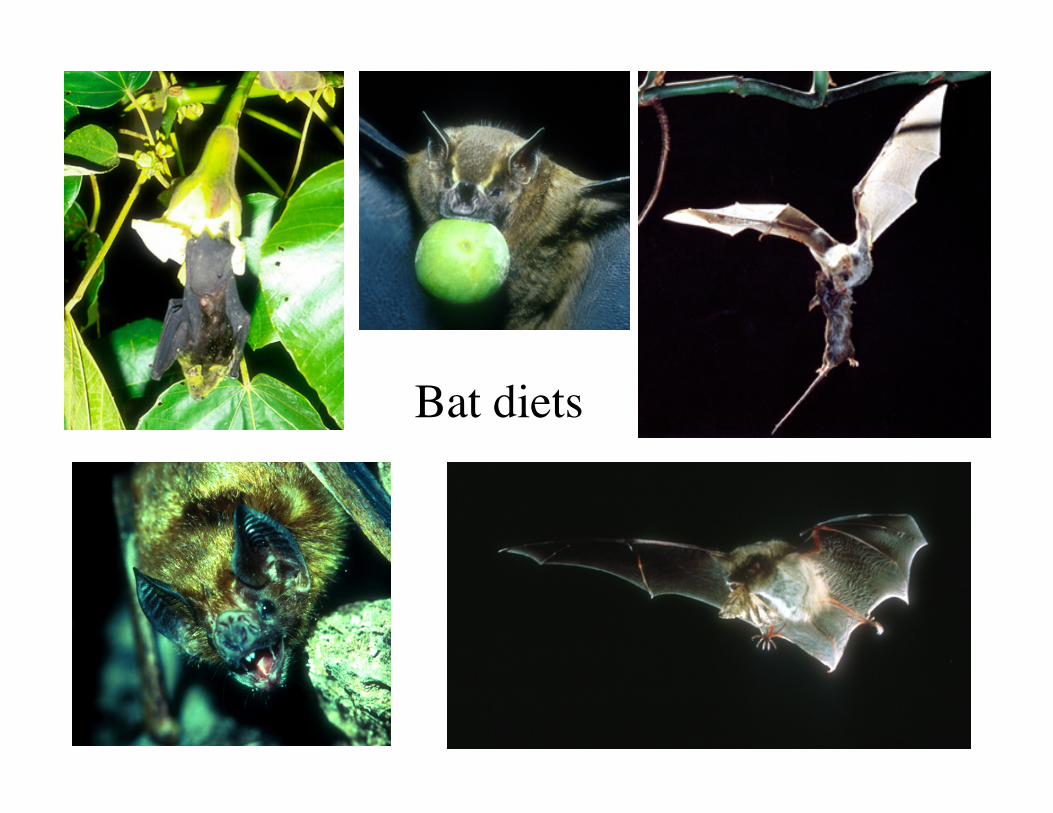
Bat diets
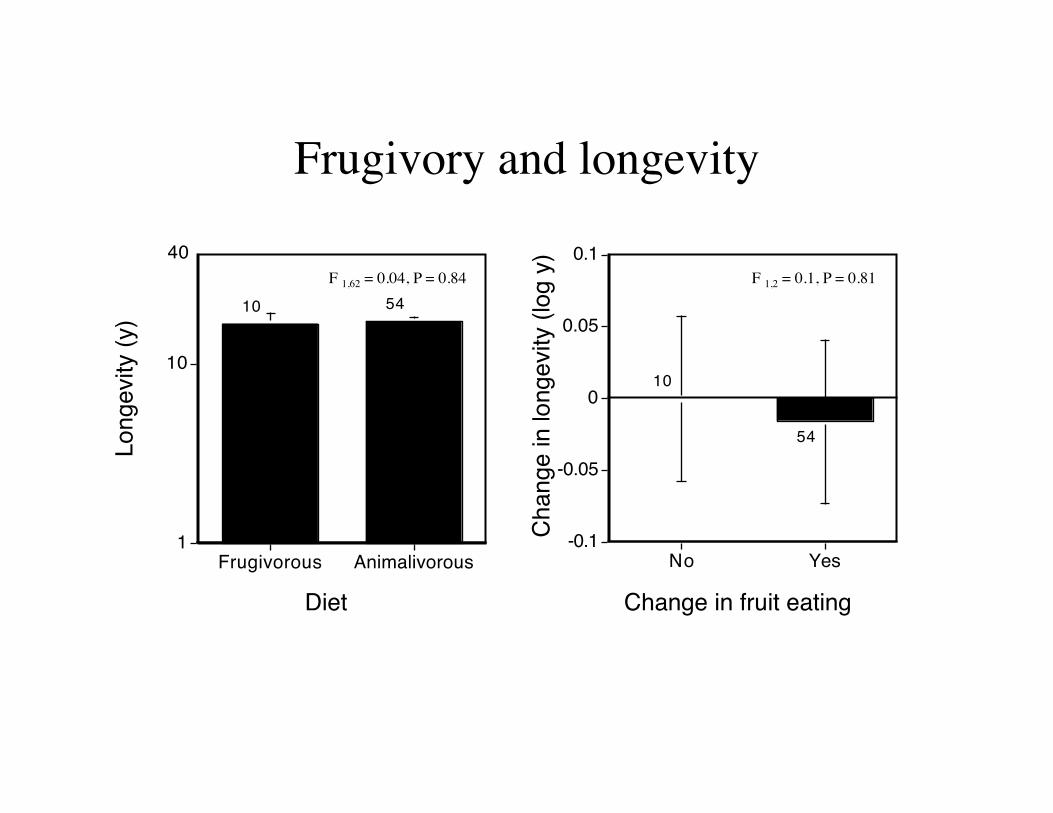
Frugivory and longevity
Diet Change in fruit eating
Chan
ge in
long
evity
(log
y)
Long
evity
(y) 10 54
1
10
Frugivorous Animalivorous
40
10
54
-0.1
-0.05
0
0.05
0.1
No Yes
F 1,2 = 0.1, P = 0.81 F 1,62 = 0.04, P = 0.84
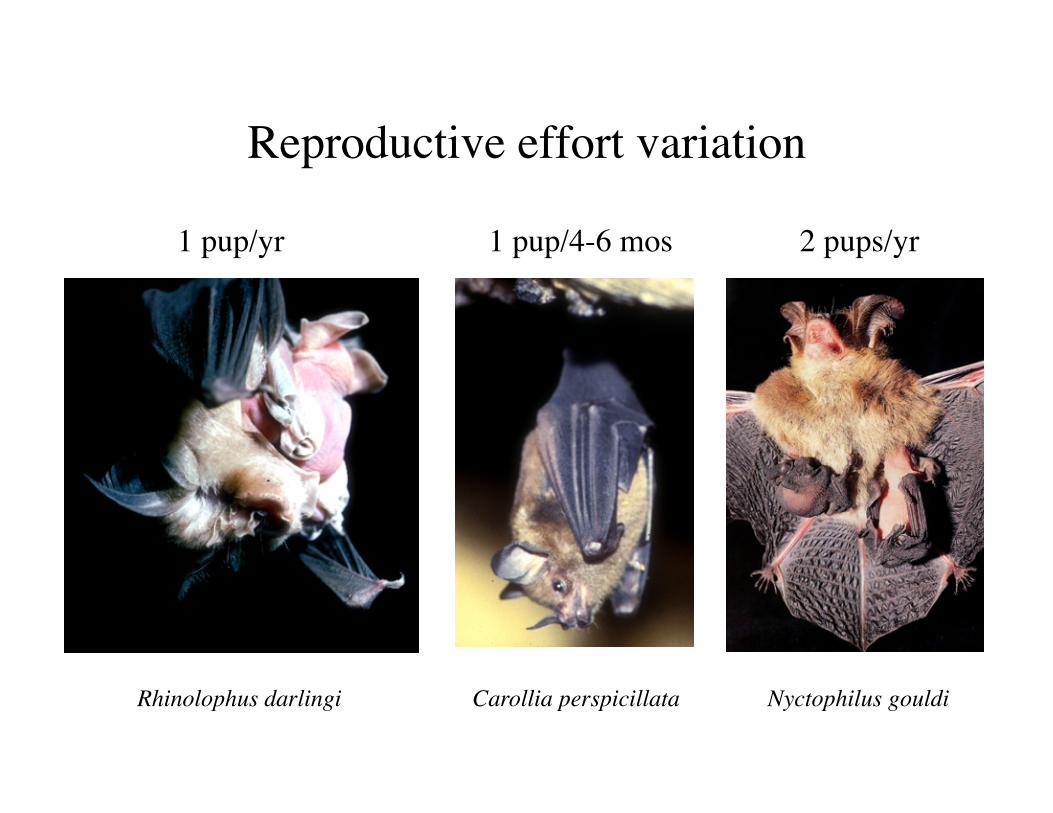
Reproductive effort variation 1 pup/yr 1 pup/4-6 mos 2 pups/yr
Rhinolophus darlingi Nyctophilus gouldi Carollia perspicillata
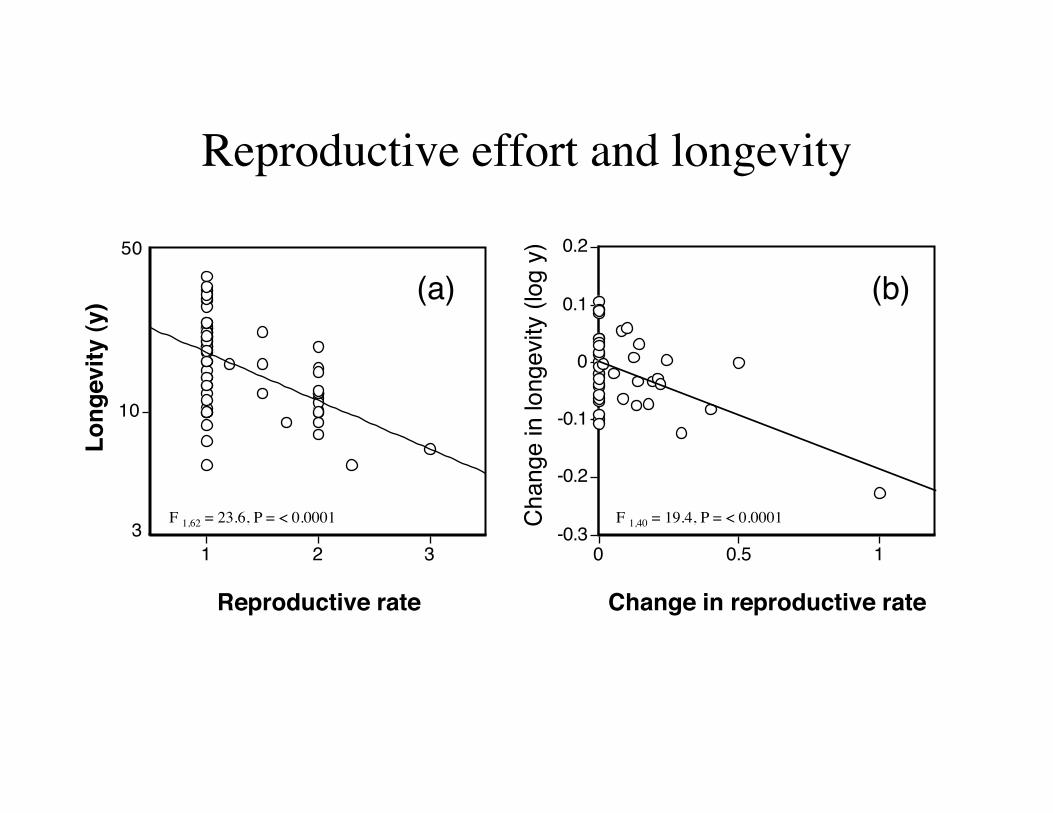
Reproductive effort and longevity
Reproductive rate Change in reproductive rate
Chan
ge in
long
evity
(log
y)
Long
evity
(y) (a) (b)
10
1 2 33
50
-0.3
-0.2
-0.1
0
0.1
0.2
0 0.5 1
F 1,62 = 23.6, P = < 0.0001 F 1,40 = 19.4, P = < 0.0001
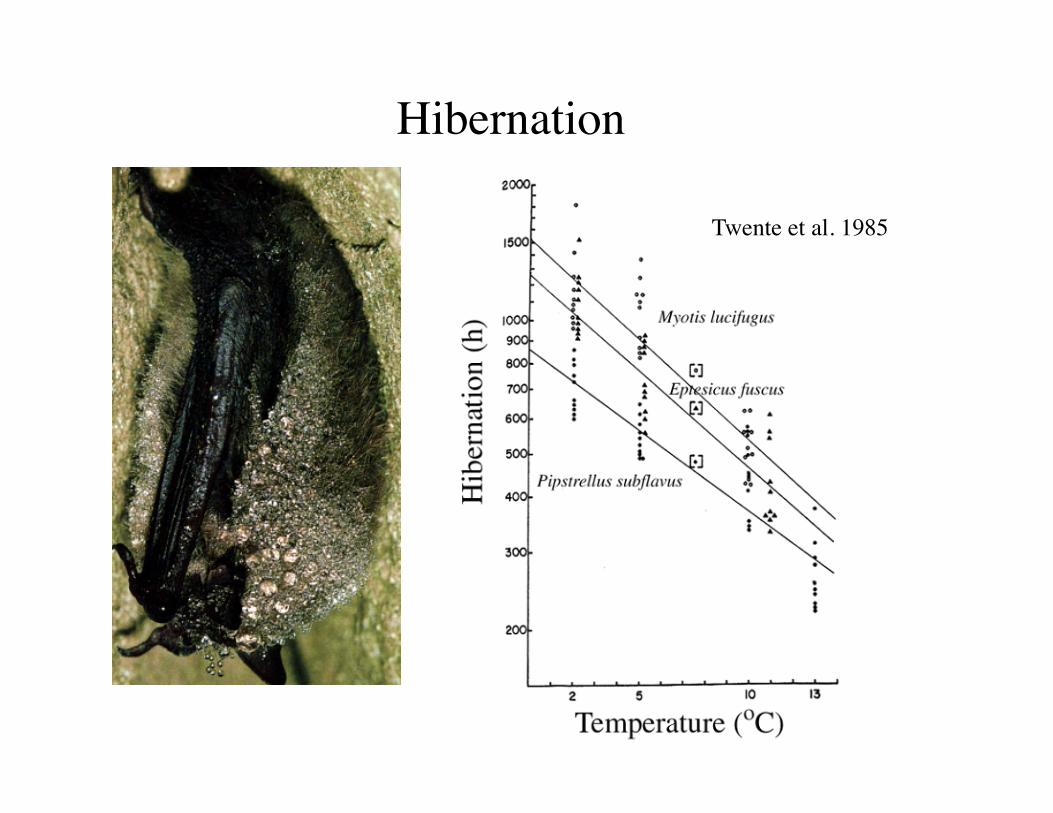
Hibernation
Twente et al. 1985
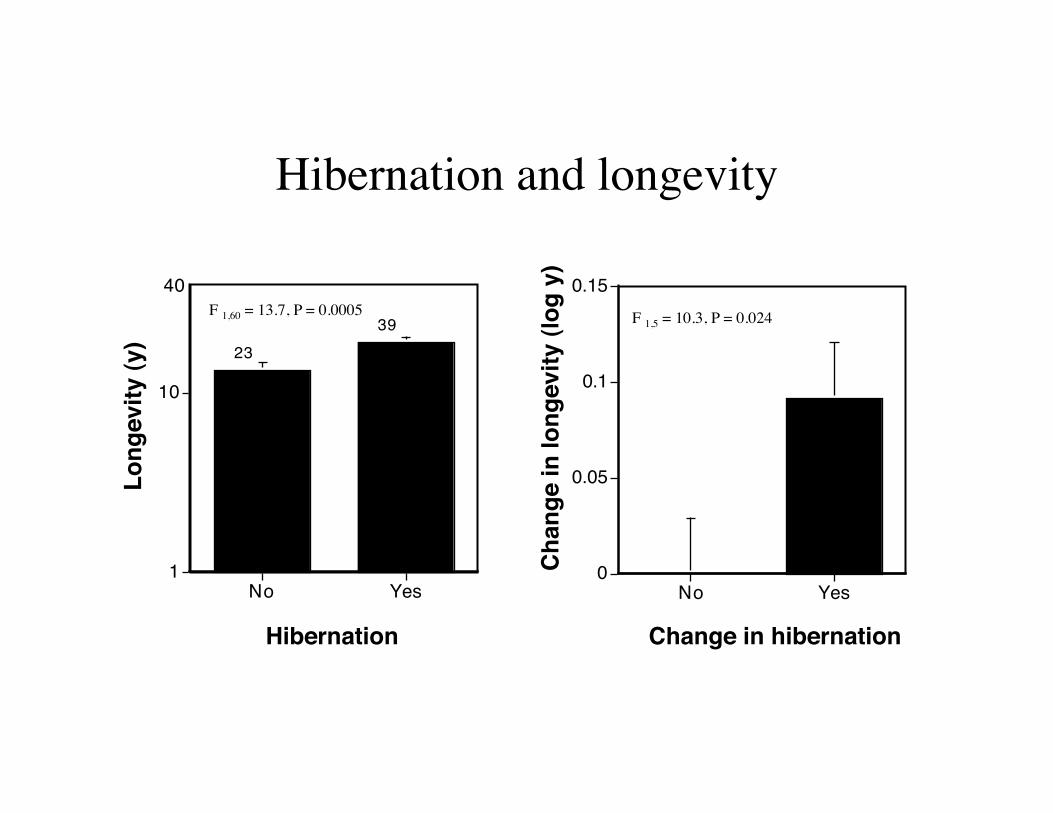
Hibernation and longevity
2339
1
10
No Yes
40
0
0.05
0.1
0.15
No Yes
Hibernation Change in hibernation
Chan
ge in
long
evity
(log
y)
Long
evity
(y)
F 1,60 = 13.7, P = 0.0005 F 1,5 = 10.3, P = 0.024
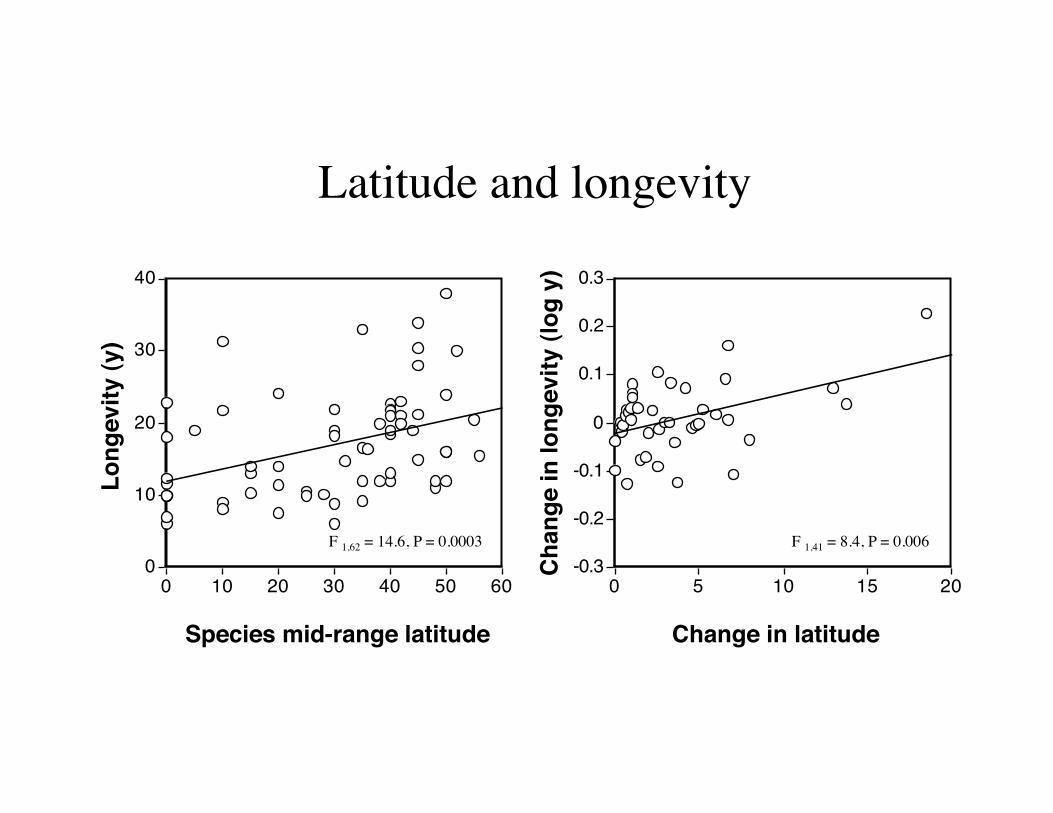
Latitude and longevity
Species mid-range latitude Change in latitude
Chan
ge in
long
evity
(log
y)
Long
evity
(y)
F 1,62 = 14.6, P = 0.0003 F 1,41 = 8.4, P = 0.006 0
10
20
30
40
0 10 20 30 40 50 60-0.3
-0.2
-0.1
0
0.1
0.2
0.3
0 5 10 15 20
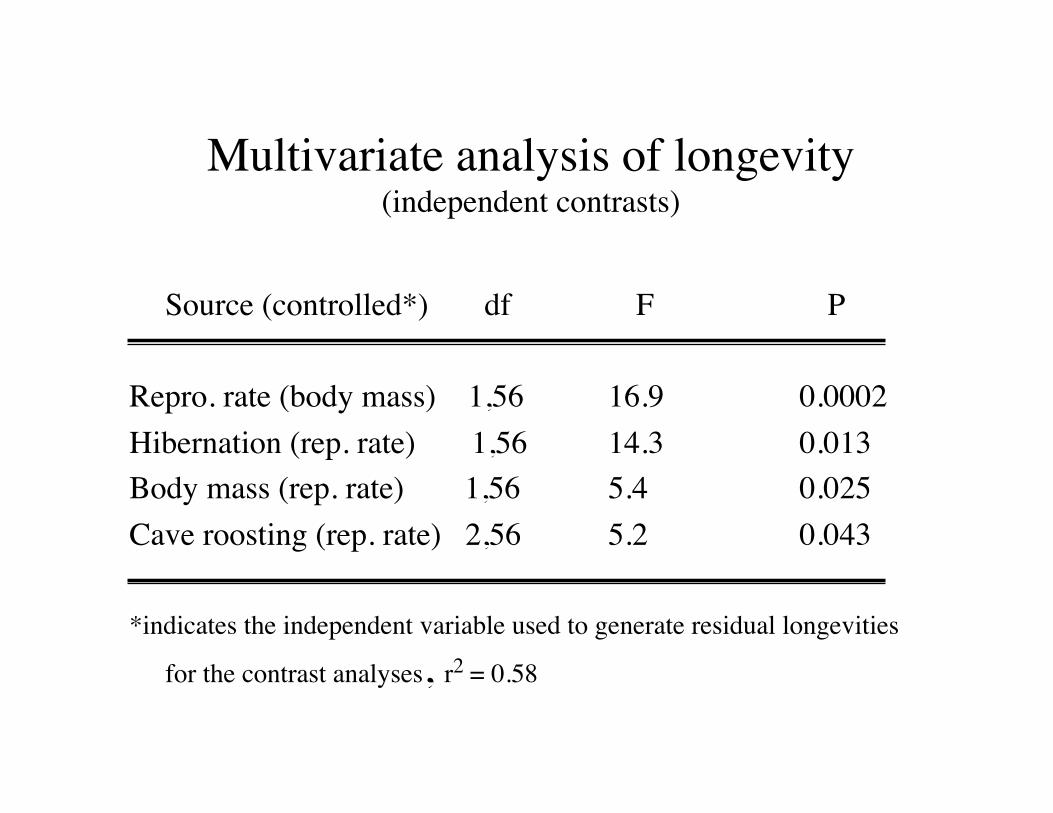
Multivariate analysis of longevity�(independent contrasts)
Source (controlled*) df F P
Repro. rate (body mass) 1,56 16.9 0.0002 Hibernation (rep. rate) 1,56 14.3 0.013 Body mass (rep. rate) 1,56 5.4 0.025 Cave roosting (rep. rate) 2,56 5.2 0.043
*indicates the independent variable used to generate residual longevities
for the contrast analyses, r2 = 0.58
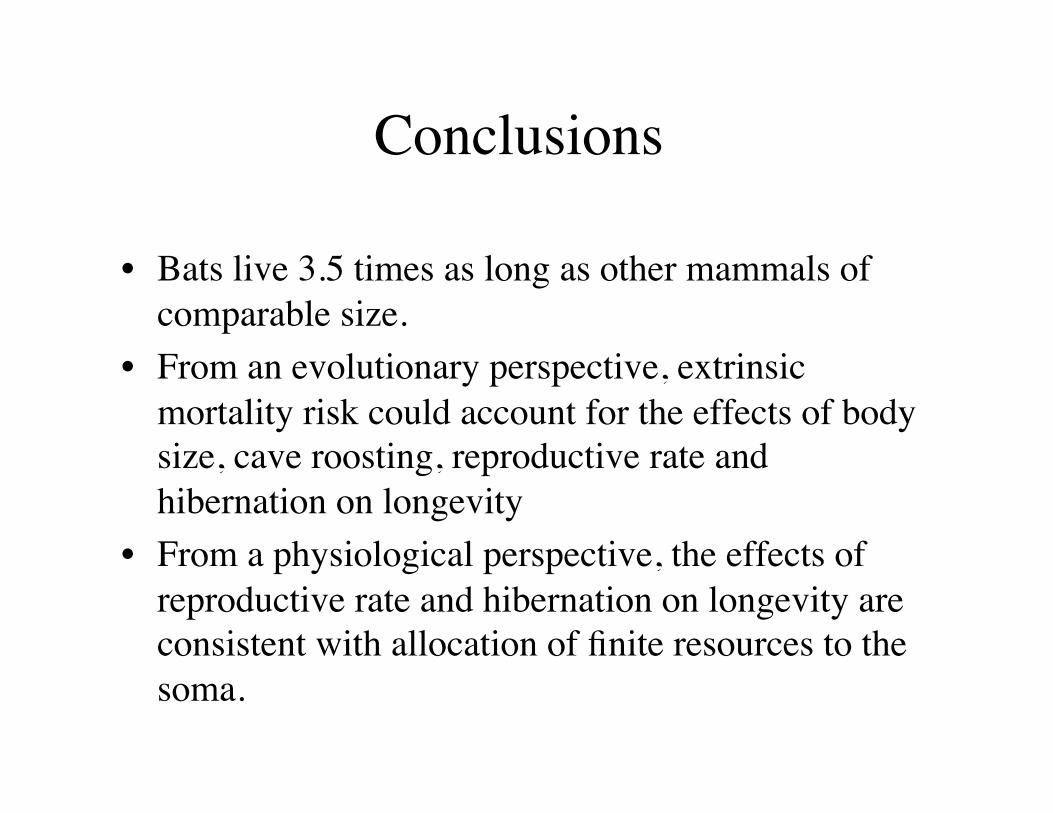
Conclusions
• Bats live 3.5 times as long as other mammals of comparable size.
• From an evolutionary perspective, extrinsic mortality risk could account for the effects of body size, cave roosting, reproductive rate and hibernation on longevity
• From a physiological perspective, the effects of reproductive rate and hibernation on longevity are consistent with allocation of finite resources to the soma.
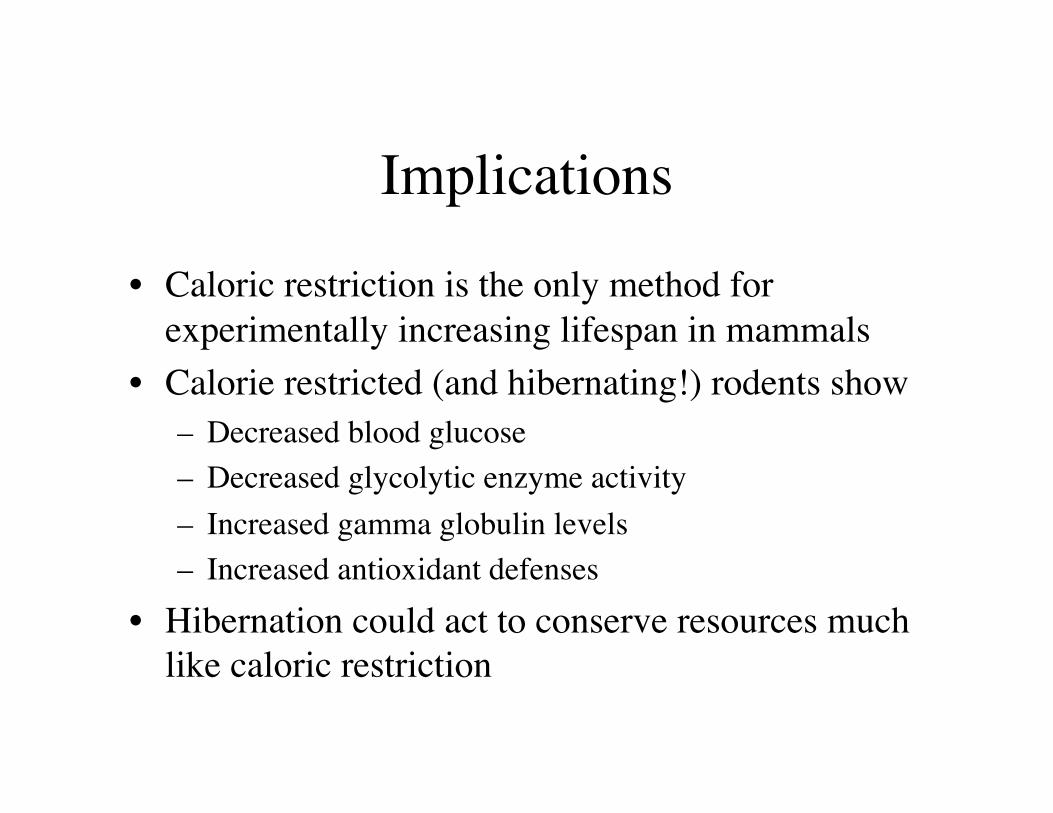
Implications
• Caloric restriction is the only method for experimentally increasing lifespan in mammals
• Calorie restricted (and hibernating!) rodents show – Decreased blood glucose – Decreased glycolytic enzyme activity – Increased gamma globulin levels – Increased antioxidant defenses
• Hibernation could act to conserve resources much like caloric restriction
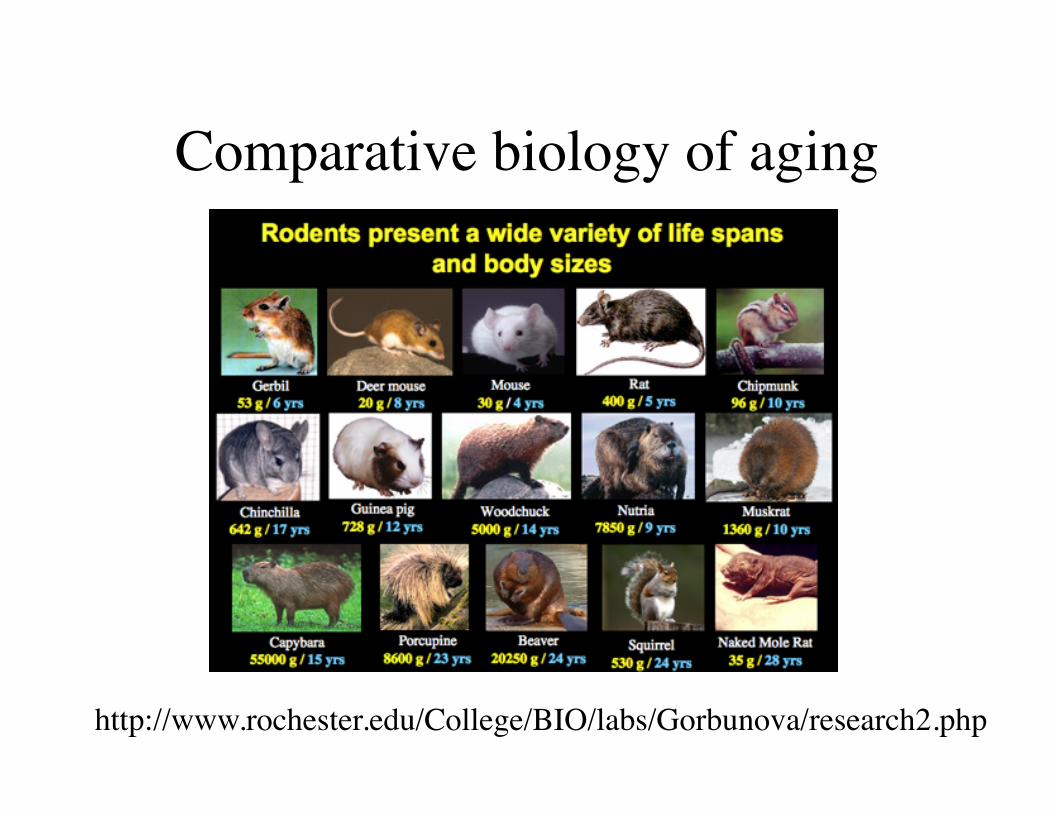
http://www.rochester.edu/College/BIO/labs/Gorbunova/research2.php
Comparative biology of aging
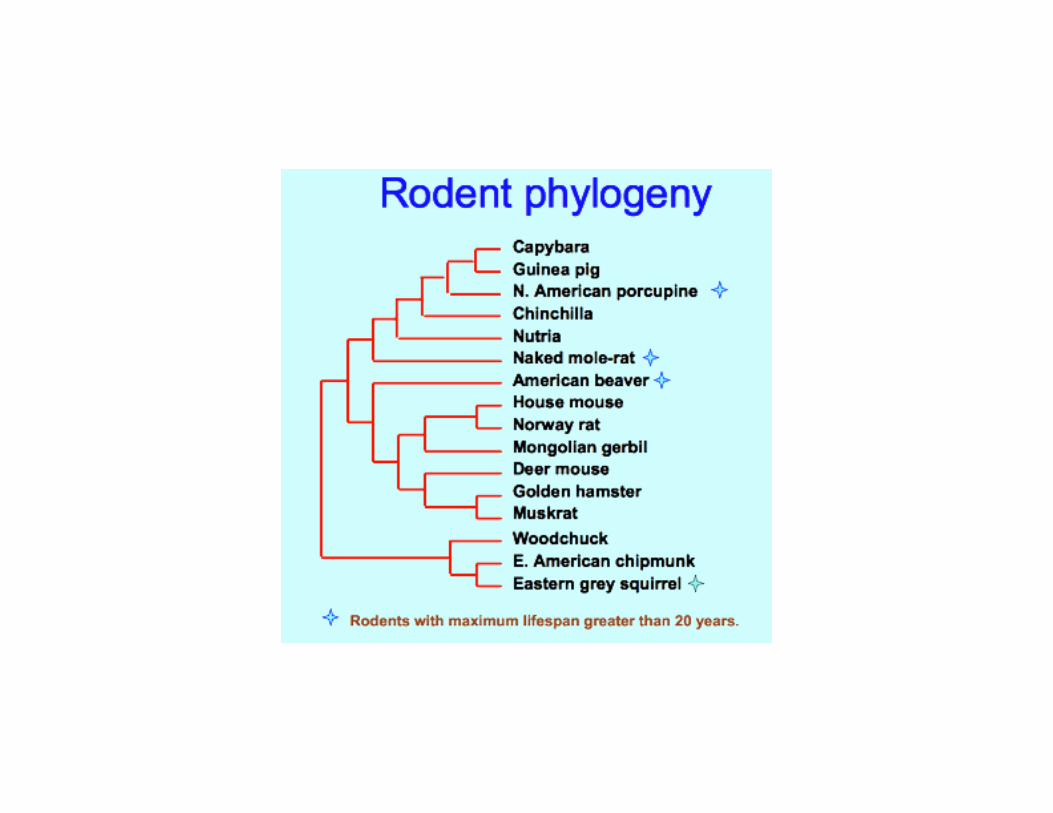
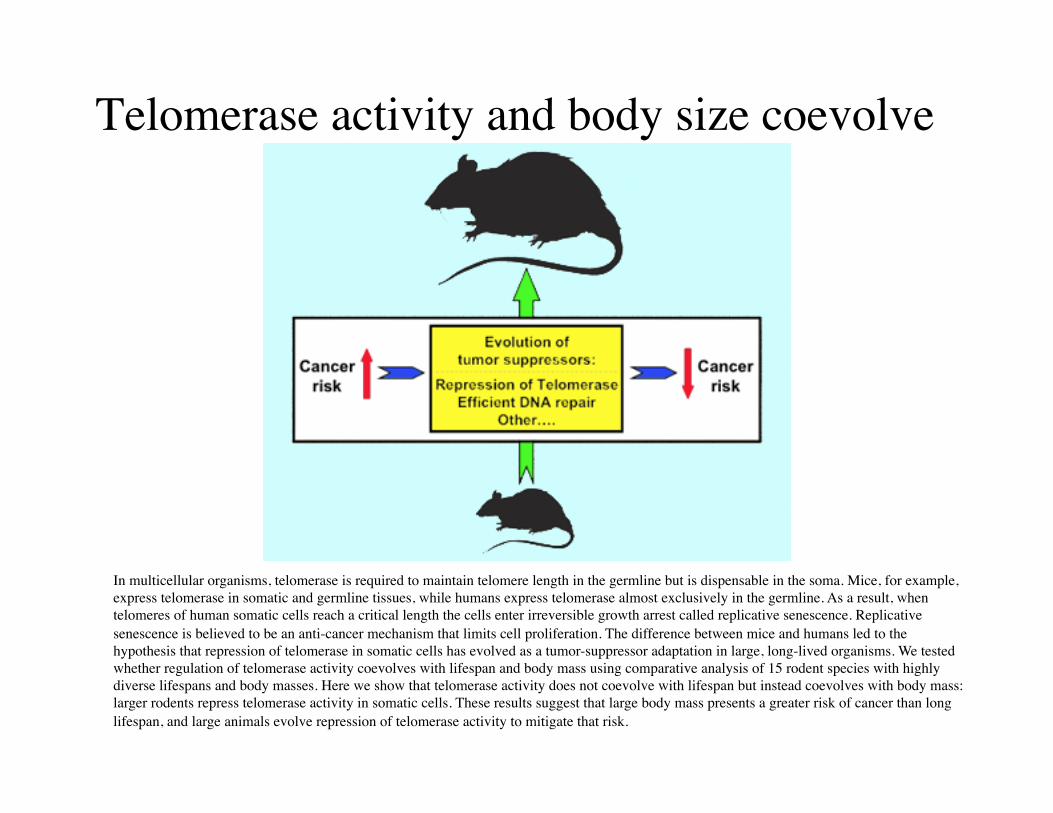
Telomerase activity and body size coevolve
In multicellular organisms, telomerase is required to maintain telomere length in the germline but is dispensable in the soma. Mice, for example, express telomerase in somatic and germline tissues, while humans express telomerase almost exclusively in the germline. As a result, when telomeres of human somatic cells reach a critical length the cells enter irreversible growth arrest called replicative senescence. Replicative senescence is believed to be an anti-cancer mechanism that limits cell proliferation. The difference between mice and humans led to the hypothesis that repression of telomerase in somatic cells has evolved as a tumor-suppressor adaptation in large, long-lived organisms. We tested whether regulation of telomerase activity coevolves with lifespan and body mass using comparative analysis of 15 rodent species with highly diverse lifespans and body masses. Here we show that telomerase activity does not coevolve with lifespan but instead coevolves with body mass: larger rodents repress telomerase activity in somatic cells. These results suggest that large body mass presents a greater risk of cancer than long lifespan, and large animals evolve repression of telomerase activity to mitigate that risk.
Additional Readings • Kirkwood, T.B.L. and Austad, S.N. 2000 Why do we age? Nature
408:233-238. • Perez-Campo, R., M. Lopez-Torres, S. Cadenas, C. Rojas and G. Barja
1998 The rate of free radical production as a determinant of the rate of aging: evidence from the comparative approach. Journal of Comparative Physiology B 168:149-158.
• Brunet-Rossinni AK 2004. Reduced free-radical production and extreme longevity in the little brown bat (Myotis lucifugus) versus two non-flying mammals. Mechanisms of Aging and Development 125: 11-20.