life cycle assessment of the use of compost from … cycle... · life cycle assessment of the use...
TRANSCRIPT

1
Life cycle assessment of the use of compost from municipal organic waste for
fertilization of tomato crops
Julia Martínez-Blanco* 1, Pere Muñoz 2, Assumpció Antón 2, Joan Rieradevall 1,3
1 Institute of Environmental Science and Technology (ICTA). SosteniPrA. Universidad Autónoma de Barcelona (UAB).
08193 Bellaterra (Barcelona), Spain.
2 Institute of Research and Technlology in the Agrifood sector (IRTA). SosteniPrA. 08348 Cabrils (Barcelona), Spain.
3 Chemical Engineering Department. Universidad Autónoma de Barcelona (UAB). 08193 Bellaterra (Barcelona), Spain.
* Corresponding author. Tel: +34935813760; fax: +34935818008.
E-mail address: [email protected]
doi:10.1016/j.resconrec.2009.02.003

2
Abstract
Organic waste composting techniques have been extensively developed in recent decades in response to the
increasing concern about the amount and management of waste. Most studies focus on a specific stage or
aspect in the life cycle of compost. The aim here is to determine the environmental impacts associated to the
use of compost, from the collection of organic municipal solid waste to its application to tomato crops, and
to compare these results with mineral fertilizer application, using life cycle assessment. Three systems were
considered, depending on the fertilizing treatment applied. The data was obtained experimentally in pilot
fields and in an industrial composting facility, both located in the Mediterranean area. Treatments with
compost have higher impacts than treatment with mineral fertilizer as a result of the high impact of compost
production. However, if we consider the burdens avoided by not dumping organic and green MSW, which
has been composted, this is reversed, with compost treatment having considerably less impact for 5 of the 7
potential impacts analyzed. No differences are observed in terms of agricultural production.
Key words: organic fertilizer; industrial composting facility; organic MSW; composting emissions;
environmental assessment; waste management
Introduction
In 1999, the European Union Landfill Directive (The Council of the European Union, 1999) required
member states to reduce the amount of biodegradable waste being dumped (Anton et al., 2005), in order to
minimise environmental impacts and the loss of organic resources. This directive promoted the adoption of
measures to increase and improve sorting at the origin, recuperation and recycling, including composting of
organic and green MSW (municipal solid waste).
Organic municipal solid waste (organic MSW) is defined as household waste and other waste which, because
of its nature or composition, is similar to household waste, capable of undergoing anaerobic or aerobic
decomposition, excluding green MSW from gardens and parks, which includes tree cuttings, branches, grass
and wood (European Commission, 2001).
The composting of organic MSW, as well as reducing the total amount of landfill waste, yields a product that
can be used in agricultural and destroys many of the pathogens and odour compounds (Jakobsen, 1995).
Several authors have assessed the positive repercussions of compost application. These include the reduction
of weed germination and number of plant pathogens; increase in yield, quality and development of edaphic
microorganism communities, and the increase in organic matter content, a parameter that has gradually
decreased over recent years in the Mediterranean region, but which decreases erosion rate and improves
moisture content and soil bulk density (Elherradi et al., 2005; European Commission, 2001; Iglesiasjimenez
and Alvarez, 1993; McConnell et al., 1993; Raviv, 1998; Sharma and Campbell, 2003; Silva et al., 2007). In
agricultural peri-urban areas there is added value through using compost from urban areas, and the proximity
to the market brings the opportunity to sell the agricultural produce and so close metabolic cycles.
3
McConnell et al. (1993) found that there are local limitations on the use of compost in horticulture, for
example, the increase in salt content, the toxicity of heavy metals and the difference in the NPK ratio of the
compost and that required by crops. However, most of the limitations can be reduced if the organic material
is of the right composition. This may be achieved by proper sorting at origin (Hargreaves et al., 2008),
followed by composting in controlled conditions with the necessary time for decomposition.
The European Commission working document for the directive on biological treatment of biowaste (2001) –
currently being drafted – provided guidelines for the inclusion of organic fertilizers and amendments in the
Spanish Royal Decree 824/2005 (Ministerio de la Presidencia, 2005), the main regulatory document in this
country in relation to fertilizers. This decree adopts the European Regulation Nº 2003/2003 (European
Parliament, 2003) relating to fertilizers, in which no reference is made to organic fertilizers or manure.
Although there has been an increase in studies on composting (Amlinger et al., 2008; Blengini, 2008; Bruun
et al., 2006; Cisneros, 2006; Dalemo et al., 1997; Elherradi et al., 2005; Favoino and Hogg, 2008; Guereca et
al., 2007; Guereca et al., 2006; Guerini et al., 2006; Hansen et al., 2006a; Hargreaves et al., 2008; Sharma
and Campbell, 2003; Silva et al., 2007; Tsai, 2008) most focus only on a specific aspect of the composting
life cycle, such as gas emissions or the use of compost as a fertilizer. Moreover there is a lack of
environmental quality data relating to compost application in horticulture, which could have an impact on
transport, generation of indirect waste or changes in the nutrient supply to the plant that have not been
sufficiently quantified (Sonesson et al., 2000).
Here we present details of the complete composting life cycle, providing information on the environmental
impacts and demonstrating the agronomic viability of compost as a fertilizer when it is used for horticultural
crops comparing this compost with traditionally used mineral fertilizers.
The plots are located in the county of Maresme, by the Mediterranean in the northeast of Spain. This
agricultural area close to the city of Barcelona has major urban pressure and is one of the most important
tomato producing areas in Catalonia. Cultivation is in soil or in an artificial substrate, in the field or in
greenhouse conditions. Owing to the soil characteristics in this area (sandy or sandy loam), with high
permeability and low cationic exchange capacity, for a long time soil was considered an inert substrate, and
farmers applied excessive water and fertilizers. Consequently, there was nutrient loss and aquifer pollution
(López et al., 1999) and the Maresme was declared a region vulnerable to nitrate contamination, according to
the European Directive 91/676 (European Economic Community, 1991). Among other good practices,
maximum nitrogen dosage was established and a fertilization management plan has been required from
existing and new producers since then.
In previous research, using lower nitrogen amounts and water supply than usual in the zone, we obtained
nearly identical
and quality of tomatoes (Antón, 2004; Muñoz et al., 2008a; Muñoz et al., 2008b; Muñoz et al., 2007b).
Economic and environmental benefits could be improved using compost from organic MSW, with a
reduction in use of mineral fertilizers and improvement of soil quality.
The life cycle assessment (LCA) environmental tool was applied to quantify the environmental impacts and
energy consumption associated with composting. According to ISO 14040, LCA assesses the environmental

4
aspects and potential environmental impacts during the whole process, from raw material acquisition through
production, use, end-of-life treatment, recycling and final disposal. There are three obligatory phases in an
LCA study: the definition of goal and scope, the inventory analysis and the impact assessment. LCA
methodology was initially developed for industrial products, so its agricultural application requires
systematic application of existing methods with some adaptations (Audsley, 1997; Hansen et al., 2006b;
International Organisation for Standardisation, 2006; Nemecek et al., 2004).
1. Methodology
1.1. Objective of the study
Two main objectives were defined. The first, agricultural and environmental viability of using compost on a
tomato crop in open field production in a Mediterranean area was assessed and critical phases of the system,
from the environmental point of view, were detected using the LCA tool. The second, to compare these
results with the burdens associated with mineral fertilization.
1.2. Description of the systems
Three fertilization treatments used for the production of tomatoes in the Mediterranean area have been
considered: compost (C), compost and mineral fertilizer (C+M), and mineral fertilizer (M).
Different stages were defined within each system: compost production (CP) and mineral fertilizer production
(FP); transport of compost (CT) and mineral fertilizer (FT) to the crops; and yield (Y). This latter includes
the sub-stages of field operations (Y_O), pesticides (Y_P) and the fertirrigation infrastructure (Y_F). For
treatment with compost the CP, CT and Y stages were considered; for treatment with mineral fertilizer FP, FT
and Y; and in the case of treatment with compost and mineral fertilizer CP, FP, CT, FT and Y were considered
(Figure 1).
The whole process, from raw materials required for the manufacture of the different elements to management
of the generated waste, is considered, but not post-cultivation, as tomatoes cultivated in this area are destined
for the local market and therefore their commercialization does not involve a significant environmental
burden, and is the same for the three treatments.
Figure 1
1.3. Functional unit
The functional unit chosen was the horticultural production of a ton of commercial tomatoes, to evaluate the
quantity and quality of the product, as the tomatoes have to comply with certain minimum standards to be
sold. This gave us a reference to normalise all the system’s input and output flows (International
Organisation for Standardisation, 2006).
1.4. Assigning burdens
5
Specification of assignment of environmental burdens was needed for two points of the systems: the
management of waste generated in cultivation and the comparison between composting and the manufacture
of mineral fertilizers. These “open-loop recycling allocations” come into play when comparing
multifunctional systems, very common in the study of waste management that usually provides an extra
function in addition to management itself (Ekvall and Tillman, 1997; Finnveden, 1999).
For the management of waste from cultivation, we used the cut-off method defined by Ekvall and Tillman
(1997), by which each system is assigned the burdens for which it is directly responsible. With this method
there is no uncertainty in the case of extraction of raw materials or the production processes and transport, as
these are all directly assigned to the system. In the case of waste management, dumping of all materials is
accounted for in the system being studied, while for recycled or reused waste, the burdens are attributed to
the system using the waste as a raw material source.
When comparing the impacts of the three treatments (C, C+M and M), it must be remembered that
composting, as well as providing fertilizer, is a form of waste management of organic MSW, which is not the
case in the production of mineral fertilizer. As proposed by Finnveden (1999) and Ekvall and Weidema
(2004), to make these three systems comparable and to include the extra function of composting, the
boundaries of the system should be expanded, considering a form of managing organic MSW alternative to
composting. The method selected was dumping, with the environmental burdens subtracted from those
treatments that include composting so that only the fertilizing function of the three treatments is compared.
1.5. Quality and origin of the data in the inventory
The system of study defined in section 1.2. requires a detailed data-collection process, summarised in Table
1. Much of this, specifically in relation to CP and the sub-stages considered in Y, was obtained
experimentally. To complete the life cycle inventory, bibliographical sources and the Ecoinvent database
(SCLCI, 2005) were used.
Table 1
For the collection and transport of organic MSW, data from Bravo (2004) and Muñoz et al. (2002) were
used, obtained on the basis of information provided by the local councils near to the industrial composting
plants.
The CP uses data from the industrial tunnel composting facility at Castelldefels, near Barcelona. This plant
was selected because of its proximity to the experimental plots, its stationary state, its technical
characteristics - such as its capacity for treatment, use of multi-tunnel technology and the type of biowaste it
treats - and because it generates a product of agronomic quality within the legal limits. These characteristics
are similar to those of other plants, such that the results can be extrapolated to other Mediterranean areas.
Owing to the lack of standardised information on the emissions from biofilters in composting facilities, two
of the gaseous compounds considered, ammonia (NH3) and volatile organic compounds (VOC), were
analysed between December 2007 and June 2008 at the composting facilities (Colon et al., 2008). For the

6
other compounds considered, CO2, CH4 and N2O, experimental data was taken from the literature (Beck-Friis
et al., 2001; Cisneros, 2006; Muñoz and Rieradevall, 2002; Soliva, 1987; Soliva, 2001; Sonesson et al.,
1997). Furthermore, experimental data from Muñoz et al. (2008a), on the physical and chemical
characteristics of the compost obtained from the Castelldefels plant, were used.
The data relating to agricultural practices was obtained in the experimental fields located in Santa Susana
(41º38’27’’N 2º43’00’’E), a village close to Barcelona, between May and September 2007, using the best
available techniques for integrated agriculture (MAPA, 2002). The soil is sandy and the fertirrigation
infrastructure is the standard for intensive horticulture on the Mediterranean coast, using water from wells.
Pesticide application was based on the regulations for integrated agriculture (MAPA, 2002), at the
minimums specified by the Spanish Ministry for Environment and Rural and Marine Affairs in the registry
of phytosanitary products (MMAMRM, 2008).
The doses of compost and mineral fertilizer were calculated depending on the expected tomato production
and the nitrogen concentrations of both fertilizers, for each treatment.
Calculation of gas emissions from the diesel used by agricultural machinery was based on Gasola et al.
(2007) and that from fertirrigation was based on Audsley (1997).
The Ecoinvent system process v. 1.2 (SCLCI, 2005) database was used to calculate consumption associated
with the production of mineral fertilizer, pesticides, machinery and tools, and the fertirrigation infrastructure,
as well as for transport and deposit of the waste in the landfill.
1.6. Categories of impact and LCA methodology
The computer tool used for impact analysis was the SimaPro v. 7.0 program (PRé Consultants, 2006), only
performing the obligatory classification and characterization phases defined by the ISO 14040 regulation
(International Organisation for Standardisation, 2006). In the classification stage, each burden is linked to
one or more impact categories, while in the characterization stage the contribution of each burden to the
impact categories is calculated by multiplying the burdens by a characterization factor (Guinée, 2001).
The optional normalization and valorisation phases were excluded as they entail a high degree of subjectivity
and reduce the information contributed with regard to environmental impacts. For normalization, the
reference system is generally chosen using overall indicator results for a specific region and for a specific
year (Pennington et al., 2004), as for weighting for valorisation which involves social, political and ethical
value choices (Blengini, 2008; Finnveden, 1997). Moreover, there are no specific values for the region of
study, not even for Spain.
The impact categories considered, defined by the CML (Guinée, 2001), are: abiotic depletion (AD), global
warming potential (GWP), ozone layer depletion potential (ODP), photochemical oxidation (PO),
acidification (A), eutrophication (E) and a flow indicator, the cumulative energy demand (CED).
Fresh water, marine, terrestrial and human ecotoxicity were not considered as the few existing ecotoxicity
effect indicators for chemicals are at a very early stage of development and significantly different methods
have been suggested by the international scientific community. Furthermore, few attempts have been made
to include ecotoxicity categories in current LCA methodology, so that considerable uncertainty could be
7
introduced in impact assessment for several of the stages or processes considered in the study, such as heavy
metal release and accumulation and pesticide use (Larsen and Hauschild, 2007; Pettersen and Hertwich,
2008).
The flow indicator for water consumption was also not considered, as the same quantities of irrigation water
were applied to the fields regardless of the treatment.
2. Life Cycle Inventory
This section describes the inventory data and the methodology used to obtain it.
To express energy and material flows in relation to the functional unit, the tomato harvest from each
treatment was considered (Table 2).
All transport was considered to be by road in the different stages and sub-stages, doubling the distance to
calculate the associated environmental burdens to take into account a return trip for unloading, except in the
case of FT. We took into consideration the production, maintenance and disposition of the vehicle, the
construction and maintenance of the roads and the diesel consumption (Spielmann et al., 2004).
Table 2
2.1. Stage of compost production (CP)
The composting facility studied has the capacity to treat about 15,000 t of organic waste a year - organic
MSW and green MSW - using multitunnel decomposition technology with the curing phase in turned
windrows in an enclosed building. It also has different biofilters for the treatment of exhaust gases.
2.1.1. Obtaining organic MSW
The organic MSW for the plant is obtained by sorting at origin in six nearby municipalities and the main
supply centre of fresh products to Barcelona. The green MSW is from parks and gardens in these
municipalities. Organic and green MSW are considered a mixture of homogeneous organic material for
collection and transport to the plant in 16 t maximum authorised load (MAL) trucks. The average distance
between collection points and the composting facility is 14 km, with the impacts of return trips made by the
trucks also attributed. The remaining considerations have been described by (Bravo, 2004; Muñoz et al.,
2002). We added the energy needed for grinding green MSW, which is done at a different facility to that
studied.
2.1.2. Industrial composting process
The industrial composting process in the studied plant includes four main phases:
• Pre-treatment: reception of the material, grinding to a maximum of 80 mm and mixing at a ratio of 1:1
organic and green MSW.
• Composting or decomposition: this is in tunnels which have a forced aeration and irrigation system to
optimise decomposition. The material remains there for a minimum of two weeks and the temperature must

8
exceed 65ºC for two or three days to guarantee hygienization of the material. The temperature and oxygen
concentration are automatically controlled.
• Curing: the decomposed material is put in piles periodically turned mechanically to enable internal
aeration, and which are watered when there is a need to increase humidity. The total maturation time is
generally about 8 weeks.
• Refining: screening to separate the mature compost, usually less than 15 mm, from the other fractions: the
green waste fraction that has not totally decomposed and is put back into the composting process, and the
solid waste fraction which is dumped. The latter includes non-organic material such as plastics and tins -
inappropriate items introduced in the process with organic and green MSW- and compostated material not
correctly separated.
The complete process takes around 10 weeks, and then it is considered that the material is stable and can be
applied to the soil without any problems associated to the incomplete decomposition of easily degradable
materials.
To consider the plant’s flows, we used values for the 2003-2006 period (Table 3), provided by the managers
of the plant and by Cisneros (2006). We also accounted for the impact of the building and the main
machinery, including production of the necessary construction materials, their transport and waste
management (Althaus et al., 2004; ITeC, 2008; SCLCI, 2005; WSOFM, 2008).
Table 3
2.1.3. Biofilter characteristics and gaseous emissions
The exhaust gases generated in the composting tunnels and in the pre-treatment and curing areas are treated
using a biofilter before being released into the environment. This is a layer of organic material biologically
enriched with ground pine, in which the contaminants are retained and metabolised by microorganisms.
Although during composting, more than 100 types of compound gases are emitted (Chung, 2007), table 3
shows those considered, representing 99 % of the total emissions (Amlinger et al., 2008; Beck-Friis et al.,
2001; Pagans et al., 2006a; Pagans et al., 2006b).
Emissions of NH3 and VOC were obtained using weekly experimental measures in the decomposition
biofilters at the composting facility in Castelldefels (Colon et al., 2008). For the other gases considered, the
emissions were estimated using theoretical factors and the following: (i) That 20% of the total waste is non-
organic, so does not have associated emissions. (ii) We determined the efficiency of the biofilters, which is
80% for CH4 and 85% for N2O (EIPPC Bureau, 2006; Sonesson et al., 1997). (iii) In accordance with the
European Commission (Smith et al., 2001) on the decomposition of biodegradable materials, the carbon
cycle is short term and is relatively constant from one year to another, so there is no net global warming and
biogenic CO2 is not included in the calculation of environmental impacts.
Table 3 shows the factor applied for each substance with respect to the total amount of organic and green
MSW treated.

9
2.2. Stage of mineral fertilizer production (FP)
The data on the manufacture of mineral fertilizer is from the processes inventoried in the Ecoinvent system
process v. 1.2 (SCLCI, 2005). As described by Nemecek et al. (2004), this stage includes the production
infrastructure; transport of prime and intermediate materials to the plant; synthesis of the chemical
components required, and deposition or treatment of the waste generated. Transport from the site of
production to that of cultivation was not included as this was accounted for in FT.
2.3. Stages of mineral fertilizer (FT) and compost (CT) transport
In the European-Mediterranean area, the mineral fertilizer is produced in Germany and transported to the
distributors in each country. Therefore, we considered transport over a distance of 1950 km in 16 MAL
trucks. Due to the efficiency of international transport platforms, unlike other forms of transport included in
the inventory, we considered that, for FT, the truck returned to Germany with another load and therefore
only the outward journey was included.
The compost is transported from the composting facility in Castelldefels, a town located 88 km from the
experimental plots. For CT we accounted for the environmental loads for return trips in a 16 MAL truck.
2.4. Yield stage (Y)
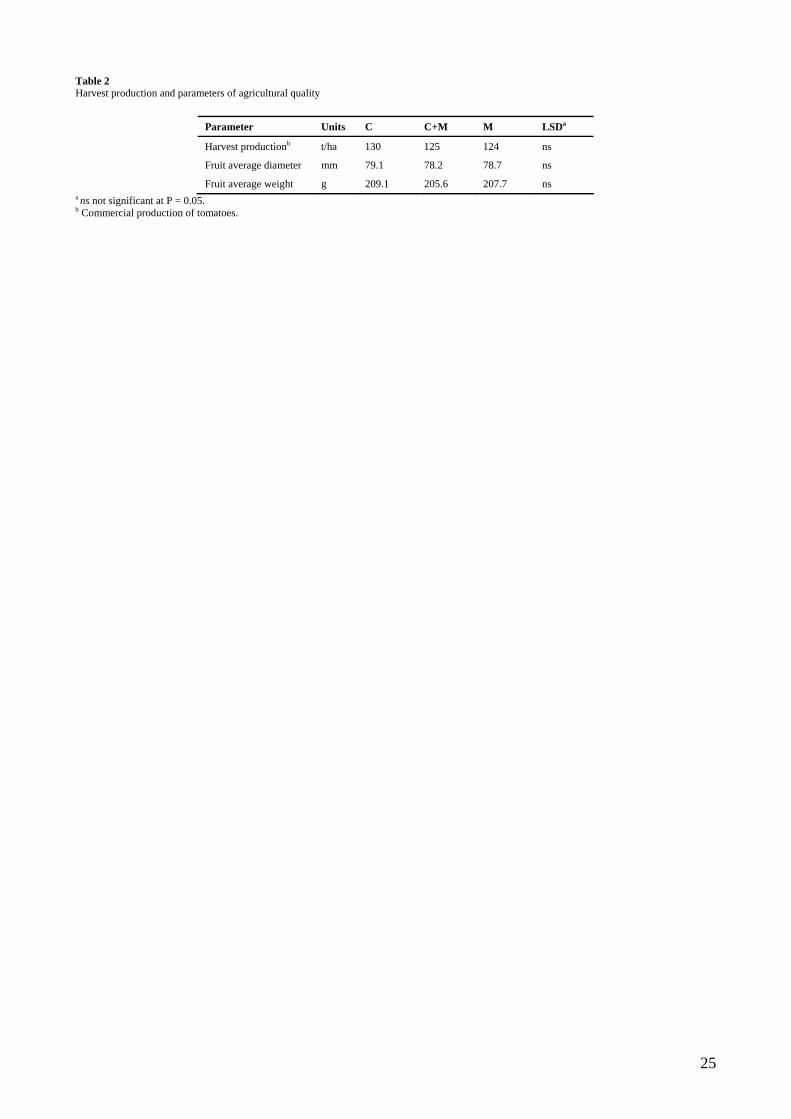
2.4.1. Harvest production and quality
Table 2 shows the commercial tomato production per surface unit and two commercial parameters, the
average diameter and weight of the fruit. Analysis of variance was by means of the General Linear Model,
and the least significant difference (LSD, P = 0.05) was used to establish differences between treatments
using the Enterprise Guide software package (SAS institute Inc., 2006).
2.4.2. Doses of fertilizing products applied
Compost was not applied for each new crop, so reducing the burdens of the machinery used during compost
application. We considered that the compost applied to the experimental fields had to supply nutrients to two
other crops apart from tomatoes, a total period of 18 months. The environmental costs associated with the
production, transport and application were distributed depending on the duration of each crop, 133 days in
this case.
The contribution of N for each treatment was calculated by taking into account the following: (i) The high
nitrogen content of the irrigation water used - 3 miliequivalents of nitrates - reduces the need for nitrogenated
fertilizers. In vulnerable Mediterranean areas (European Economic Community, 1991), this is a normal
value. (ii) The nitrogen absorbed by the crops was 39.1 gN/m2, 35.8 gN/m2 and 41.3 gN/m2 for C, C+M and
M respectively. (iii) The composition of the mineral fertilizer and the compost, taking into consideration the
proportion of the total compost for the 133 days of the tomato crop cycle. The doses for each treatment are
shown in Table 4.
The moisture content of the compost applied to the experimental plots was 27.7%, slightly lower than the 30
to 40% interval established by RD 824/2005 (MP, 2005), and the organic matter content was 62% for dry

10
material. In relation to heavy metals, this was class A compost (European Commission, 2001). The complete
analysis of the sample is included in Muñoz et al. (2008a).
Heavy metals release in field soil through compost application were not taken into account as their
concentration were lower than regulation limits and because ecotoxicity categories, the only categories
affected by heavy metal release, were not considered in this study (see section 1.6).
Table 4
2.4.3. Sub-stage of fertirrigation infrastructure (Y_F)
The system used in the experimental plots to supply water, fertilizers and phytosanitary products is a
fertirrigation infrastructure with pumps and pipes for extracting and channelling the water, tanks,
electrovalves for controlling dosage and a network of pipes supplying the plants (Table 5). T-TAPE® pipes
were used as a drip irrigation system. We considered the transport of these elements from the distribution
point, in 3.5 t MAL vans, and the waste management. The burdens attributed to the Y_F, per functional unit,
were assigned in accordance with the characteristics of the elements used and the duration of the crop with
respect to their lifespan.
Table 5
2.4.4. Pesticides sub-stage (Y_P)
The active substances considered in the Y_P are chlorothalonil, sulphur, bacillus, miclobutanil, spinosad,
indoxacarb, cymoxanil, famoxadone, bromopropylate, copper oxychloride, azoxystrobin and surfactant. The
minimum doses of phytosanitary products were applied as recommended by the Spanish Ministry for
Environment and Rural and Marine Affairs (MMAMRM, 2008).
2.4.5. Field management sub-stage (Y_O)
In Y_O, we took into account the irrigation and fertirrigation emissions as well as the tractor and other
agricultural machinery (Table 6). The phases considered for the machinery were: obtaining the prime
materials, manufacture, maintenance, fuel consumption during the field operations, and waste management.
The operations were the same for the three treatments, except for those related to the application of compost,
which were not considered in the case of M.
We also considered the burdens associated with the production and transport of the harvesting elements: the
HDPE (High Density Polyethylene) crates and steel handcarts.
Table 6
Irrigation water is pumped from a nearby well (depth, 10-15 m) to the fields using two pumps, one to pump
the water out of the wells (4 kW) and the other to spread it over the plots (2.7 kW). The supply of water

11
depends on the evapotranspiration demands, and in each treatment a meter was installed to determine the
final consumption of water, 566 L/m2.
To calculate the fertirrigation emissions, we considered the nitrogen contributions made by each fertilizer
and the nitrogen concentration absorbed by the crops. We accounted for emissions of NH3, N2O, NOx and N2
into the air and NO3 into the water, in accordance with Audsley’s hypothesis for sandy soils (Audsley, 1997).
2.4.6. Management of waste generated during the yield stage
During the Y stage, three different types of waste were generated: green waste containing the non-
commercialised parts of the plant and the non-commercial tomatoes; waste from the fertirrigation
infrastructure; and waste from harvesting elements, which included crates and handcarts. As discussed in
section 1.4., management of green MSW and steel of the harvesting handcarts were not included in the
impact assessment, as a recycling or recuperation treatment was considered for them. The waste from the
fertirrigation infrastructure and the fruit harvesting crates were deposited in a landfill 53 km from the fields
at the end of their useful life. The impact of their management consisted of transport to the landfill, in 16 t
MAL trucks, plus the burdens of deposition, which depended on the material (SCLCI, 2005). The burdens of
the fertirrigation infrastructure were attributed to the Y_F, and those of the harvesting crates, to Y_O.
2.5. Dumping of organic and green MSW
As mentioned in section 1.4., the alternative organic and green MSW management method selected was
dumping, as the two alternative methods, biomethanization and incineration, are associated with the extra
function of generation of energy, and incineration is not suitable for organic waste sorted at the origin as it is
excessively damp. Until recently, dumping of organic and green MSW was common, but is now prohibited
by Directive 1999/31/CE (The Council of the European Union, 1999).
There is no specific data (Finnveden et al., 2007) on the impacts of depositing organic and green MSW in
landfill. It has been assimilated in that considered by Ecoinvent (SCLCI, 2005) for the management of
municipal solid waste in landfill, and to this has been added the collection (manufacture and maintenance of
containers) and transport to the dump, which is located about 57 km from the collection area. The impact of
land use for the dump is also considered, as well as the construction of the landfill and road access, the
machinery and fuel used for operation, and the combustion of methane without making use of the energy
(Doka, 2003; SCLCI, 2005). One hundred years is considered to be the time limit of impact (Doka, 2003).
Environmental burdens of dumping the amount of composted organic and green MSW equal to that used to
produce the compost for the C and C+M treatments were subtracted from the total impact of these
treatments.
3. Results and discussion
Table 7 shows the environmental burdens associated with the three treatments, according to the
considerations in the inventory.
3.1. Harvest production and parameters of agricultural quality

12
No significant statistical differences were observed between treatments for commercial and non-commercial
production, or for the two quality parameters analysed, namely the fruit calibre and weight (Table 2). The
harvests were within the normal values expected for the commercial production of tomatoes in the area
(Muñoz et al., 2007a; Muñoz et al., 2007b). Non-commercial production was around 26.5 % (in weight) of
the commercial tomato production for the three treatments.
3.2. Environmental assessment by stages and sub-stages
Figure 2 shows the results broken down by stages and sub-stages as defined in section 1.2. These results do
not take into consideration the avoided burdens for C and C+M on depositing composted organic and green
MSW in landfill.
Figure 2
3.2.1. Treatment with compost
For treatment C, the biggest impact for all the categories was the compost production stage (CP), between 53
and 98% of the total impact, depending on the impact category considered. This is followed by field
operations sub-stage (Y_O), with an impact of between 23 and 29% of the total, for all categories except
photochemical oxidation (PO). In the case of PO, the compost production stage is responsible for 98% of the
total impact due to the emissions of volatile organic compounds. The CED for compost production (CP) is
1,390 MJ eq. per ton of tomatoes for C, while for Y_O it is 669 MJ eq.
Depending on the category, the yield stage, which is the sum of Y_F, Y_P and Y_O, has an impact of
between 2%, for PO, and 38%, for abiotic depletion (AD) and cumulative energy demand (CED). The main
contributions to the impact of Y_O are the water pumps and collection crates.
Figure 3 shows the contributions to the total impact of the composting production stage (CP). The electricity
consumption of the facility has the highest impact for AD, global warming potential (GWP), acidification
(A) and CED, representing 33-39% of the impact assigned to the CP stage for these categories. For the
category PO, the emissions of volatile organic compounds contribute 96% of the impact. In the case of
eutrophication (E), ammonium emissions cause the greatest impact, 47%, with respect to the total impact
associated to CP. For ozone layer depletion (ODP), diesel consumption contributes 33% of the impact of CP
also contributing considerably to the AD, ODP and CED categories. The management of solid waste
generated at the composting facility contributes considerably to all categories apart from PO, between 12 and
29 %; ammonium emissions to category A and E; and collection of organic and green MSW contributes
more than a 15 % to categories AD, GWP, ODP, E and CED.
Figure 3
The higher impact of the CP stage with respect to the others can also be explained by the processes with
which it is compared. The manufacture of mineral fertilizer is a highly efficient process resulting in a product

13
with a high concentration of nutrients, so only small amounts are required to be transported, even though this
involves long distances, while the transport of compost is local. As the main energetic source is solar energy
(photosynthesis), agricultural activities generally have little environmental impacts in comparison to
industrial activities.
3.2.2. Treatment with compost and mineral fertilizer
In the case of the C+M treatment, compost production (CP) is the highest or one of the stages with the most
impact for all the categories with a contribution to the total impact of between 33 and 95 %, and an
associated consumption of 682 MJ eq/t tomatoes (Figure 2).
Considering all the categories, fertilizer production (FP) accounts for between 0 and 15% of the total impact,
compost production (CP) between 33 and 95%, and the yield stage (Y), between 4 and 50%, in all cases
depending on the category.
3.2.3. Treatment with mineral fertilizer
For treatment M, sub-stage field operations (Y_O) has the greatest impact for all categories, between 28 and
51% of the total, depending which is considered (Figure 2). The energy consumption for this sub-stage is 695
MJ eq/t tomatoes, whereas for the FP stage it is 229 MJ eq/t tomatoes. The burdens associated with the
transport of the mineral fertilizer (FT) have an impact of between 0.3 and 1.4 times those of FP. The yield
stage (Y) has between 42 and 78% of the total impact of M.
For the Y stage, the differences between the percentages of the total impact for each treatment (C, C+M and
M), are the result of the combination of three factors. Firstly, the total impact is different for each treatment,
and also the relative weight of the Y stage, even though the absolute values may be similar (differences
below 24%). Secondly, the higher the tomato production, the more evenly distributed the impacts among the
functional units. Finally, there are differences between the inputs associated to the yield stage depending on
the treatment, such as the number of deposits of manure, the fertirrigation emissions and whether the
machinery for compost spreading is taken into consideration.
3.3. Environmental assessment of the total impacts for each treatment
Figure 4 shows the total impacts associated to the three systems, i.e. the sum of the impacts for the
considered stages for each of them, and the total impacts associated to the expanded systems. The latter
consider the burdens avoided through composting by not dumping organic and green MSW, for treatments C
and C+M that use compost. The C+M system has intermediate values between C and M, as it is a mixed
fertilization option and the functional unit used, tomato production, is very similar for the three treatments.
The organic and green MSW treated by composting is 1.25 t/t tomatoes for treatment C, 0.62 t/t tomatoes for
C+M, and 0 t/t tomatoes for M, which does not use compost. We considered that these amounts were the
organic and green MSW that was not managed by dumping to calculate the burdens avoided (see section
2.5). The results with and without considering avoided burdens are shown in Table 7.
Figure 4

14
3.3.1. Environmental assessment of the system
As shown in Figure 4, for all the categories, and without considering subtracted burdens, the order of total
environmental impacts is:
C>C+M>M
Treatment C has 13-47% more impact than C+M and between 35 and 97% more impact than M, depending
on the impact category and without considering the PO. The biggest difference between treatments arises for
PO.
Total energy consumption is 2,584 MJ eq/t tomatoes for treatment C and 1,404 MJ eq/t tomatoes for M, with
136 kg CO2 eq/t tomatoes and 88 kg CO2 eq/t tomatoes emitted, respectively.
The compost production stage has the highest effect on the order of results, especially the gas emissions in
those categories for which there is the greatest difference between treatments, PO and A.
3.3.2. Environmental assessment of the system considering avoided burdens
If we consider the expanded system by integrating avoided burdens, the non-deposit in dump of composted
organic and green MSW, the relative order of impacts is reversed for all impact categories except PO and A
(Figure 4):
Cexp<C+Mexp<Mexp
In the expanded case of treatment with mineral fertilizer (Mexp), the impact is the same whether or not we
consider the expansion of the system, as there is no avoided impact to be subtracted (M = Mexp). Treatment
Cexp implies the consumption of 1,074 MJ eq/t tomatoes and avoids the emission of 786 kg CO2 eq/t
tomatoes.
For all the impact categories except PO and A, treatments Cexp and C+Mexp have fewer impacts than Mexp,
and, in the case of GWP and E, have negative impacts, i.e. avoid impacts. For category A the impact is
nearly the same for the three treatments, M is slightly lower than C, with differences less than 23 %, while
for PO, Cexp has 27 times more impact than Mexp.
For the categories GWP and E, the impact of treatment Cexp is 1.2 and 1.1 times lower, respectively, than
C+Mexp and 9.9, and 31.4 times lower than Mexp. The causes of these major differences are the impacts
associated with the deposit of organic waste in landfill: the CO2 and CH4 emissions contribute to category
GWP, and the emissions and lixiviates of nitrogen and phosphorous contribute to E (Finnveden et al., 1995).
For categories AD, ODP and CED the impact is positive for the three treatments: Cexp has 16-65% less
impact than C+Mexp and 23-79% less impact than Mexp.
Table 7
4. Conclusions and future perspectives
The results of the LCA indicate that the production of a ton of tomatoes using compost (C) consumes 2,584
MJ eq. with 136 kg CO2 eq emitted. The stage with the major impact is compost production (CP), with
between 53 and 98% of the total impact, depending on the impact category, mainly due to emissions
generated and energy consumption at the composting facility. The yield stage also contributes between 2 and
38% of the total impact. For the photochemical oxidation category (PO), 97% of the impact is from the CP
15
stage, due to the emissions of volatile organic compounds during decomposition. Treatment C has 35-97%
more impact than treatment with mineral fertilizer (M), depending on the category of impact and excluding
PO, as a consequence of compost production.
We also considered an expanded system that integrates the burdens avoided by not depositing the composted
organic and green MSW in landfill. For the expanded scenario, treatment with compost (Cexp) has less impact
than Mexp for all the categories except acidification (A), for which impacts are similar, and PO, for which
Cexp has 27 times more impact than Mexp. Treatment Cexp implies the consumption of 1,074 MJ eq/t tomatoes
and avoids the emission of 786 kg CO2 eq/t tomatoes. In this case, compost appears to be an environmentally
better option than mineral fertilization for all categories except PO.
The application of compost as a fertilizer for tomato crops does not appear to have a negative affect on
production or product quality.
To improve treatment with compost, there is a need to focus on the compost production stage, optimizing the
exhaust gas treatment systems and minimizing energy consumption. Future studies are needed to provide
more specific data relating to the environmental impacts associated to depositing organic and green MSW in
dump, and new indicators to measure the potential local impacts, such as erosion and water consumption.
The use of this compost in horticulture is a treatment with less impact than mineral fertilizer, if the avoided
loads are considered, although compost production is a critical stage which needs to be optimised.
Acknowledgements
The authors would like to thank the Spanish Ministry for the Environment for financing this project
(A246/2007/2-02.3) and the Federación SELMAR, the ESAB and the Grupo de Investigación en Compostaje
(GICOM) at the Universidad Autónoma de Barcelona for their collaboration with the experimental work.

16
References Althaus, H.-J., Chudacoff, M., Hellweg, S., Hischier, R., Jungbluth, N., Osses, M. and Primas, A., 2004. Life cycle inventories of chemicals. Ecoinvent report No. 8. Swiss Centre for Life Cycle Inventories, Dübendorf, pp. 927.
Amlinger, F., Peyr, S. and Cuhls, C., 2008. Green house gas emissions from composting and mechanical biological treatment. Waste Management & Research, 26 1: 47-60.
Antón, A., 2004. Utilización del Análisis del Ciclo de Vida en la Evaluación del Impacto ambiental del cultivo bajo invernadero Mediterráneo. Thesis. Programa d'Enginyeria Ambiental, Universitat Politècnica de Catalunya, Barcelona.
Anton, M. A., Munoz, P., Castells, F., Montero, J. I. and Soliva, M., 2005. Improving waste management in protected horticulture. Agronomy for Sustainable Development, 25 4: 447-453.
Audsley, E., 1997. Harmonisation of environmental life cycle assessment for agriculture. Final Report Concerted Action AIR 3-CT94-2028. European Commission DG VI Agriculture, UK, pp. 101.
Beck-Friis, B., Smars, S., Jonsson, H. and Kirchmann, H., 2001. Gaseous emissions of carbon dioxide, ammonia and nitrous oxide from organic household waste in a compost reactor under different temperature regimes. Journal of Agricultural Engineering Research, 78 4: 423-430.
Blengini, G. A., 2008. Using LCA to evaluate impacts and resources conservation potential of composting: A case study of the Asti District in Italy. Resources, Conservation and Recycling, 52 12: 1373-1381.
Bravo, R., 2004. Análisis ambiental de la recogida de FORM en tres municipios de Cataluña mediante el sistema puerta a puerta (in Spanish). Mater's Degree Project, Institute of Environmental Science and Technology - Universidad Autónoma de Barcelona (ICTA-UAB).
Bruun, S., Hansen, T. L., Christensen, T. H., Magid, J. and Jensen, L. S., 2006. Application of processes organic municipal solid waste on agricultural land - A scenario analysis. Environmental Modeling and Assessment, 11 3: 251-165.
Cisneros, M., 2006. Evaluación ambiental de las plantas de compostaje en Cataluña (in Spanish). Master's Degree project, Institute of Environmental Science and Technology - Universidad Autónoma de Barcelona (ICTA-UAB).
Colon, J., Artola, A., Font, X. and Sánchez, A., 2008. Emissions de gasos contaminants en un procés de compostatge industrial: eficàcia de biofiltració i influència del canvi de material biofiltrant (in Catalan). Master's Degree Project, Universidad Autónoma de Barcelona (UAB).
Chung, Y.-C., 2007. Evaluation of gas removal and bacterial community diversity in a biofilter developed to treat composting exhaust gases. Journal of Hazardous Materials, 144 1-2: 377-385.
Dalemo, M., Sonesson, U., Bjorklund, A., Mingarini, K., Frostell, B., Jonsson, H., Nybrant, T., Sundqvist, J. O. and Thyselius, L., 1997. ORWARE - A simulation model for organic waste handling systems 1: model description. Resources Conservation and Recycling, 21 1: 17-37.
Doka, G., 2003. Life Cycle Inventories of Waste Treatment Services. Ecoinvent report No. 13. Swiss Centre for Life Cycle Inventories, Dübendorf, pp. 444.
EIPPC Bureau, 2006. Reference Document on Best Available Techniques for the Waste Treatments Industries. European Integrated Prevention Pollution and Control Bureau, EC.
Ekvall, T. and Tillman, A., 1997. Open-Loop Recycling, Criteria for allocation procedures. Int J LCA, 2 (3) 3: 155-162.
Ekvall, T. and Weidema, B. P., 2004. System boundaries and input data in consequential life cycle inventory analysis. International Journal of Life Cycle Assessment, 9 3: 161-171.
Elherradi, E., Soudi, B., Chiang, C. and Elkacemi, K., 2005. Evaluation of nitrogen fertilizing value of composted household solid waste under greenhouse conditions. Agronomy for Sustainable Development, 25 2: 169-175.
European Commission, 2001. Working document on Biological Treatment of Biowaste (2nd draft). Directorate-General Environment A.2. Official Journal of the European Communities.
17
European Economic Community, 1991. Directive 91/676/ECC, of 12 December 1991concerning the protection of waters against pollution caused by nitrates from agricultural sources. Official Journal of the European Communities.
European Parliament, 2003. Regulation Nº 2003/2003 relating to fertilizers. Official Journal of the European Communities.
Favoino, E. and Hogg, D., 2008. The potential role of compost in reducing greenhouse gases. Waste Management Research, 26 61.
Finnveden, G., 1997. Valuation methods within LCA - where are the values? International Journal of Life Cycle Assessment, 2 3: 163-169.
Finnveden, G., 1999. Methodological aspects of life cycle assessment of integrated solid waste management systems. Resources, Conservation and Recycling, 26 3-4: 173-187.
Finnveden, G., Albertsson, A.-C., Berendson, J., Eriksson, E., Höglund, L. O., Karlsson, S. and Sundqvist, J.-O., 1995. Solid waste treatment within the framework of life-cycle assessment. Journal of Cleaner Production, 3 4: 189-199.
Finnveden, G., Bjorklund, A., Moberg, A., Ekvall, T. and Moberg, A., 2007. Environmental and economic assessment methods for waste management decision-support: possibilities and limitations. Waste Management & Research, 25 3: 263-269.
Gasola, C. M., Gabarrell, X., Anton, A., Rigola, M., Carrasco, J., Ciria, P., Solano, M. L. and Rieradevall, J., 2007. Life cycle assessment of a Brassica carinata bioenergy cropping system in southern Europe. Biomass & Bioenergy, 31 8: 543-555.
Guereca, L. P., Agell, N., Gasso, S. and Baldasano, J. M., 2007. Fuzzy approach to life cycle impact assessment - An application for biowaste management systems. International Journal of Life Cycle Assessment, 12 (7) 7: 488-496.
Guereca, L. P., Gassó, S., Baldasano, J. M. and Jiménez-Guerrero, P., 2006. Life cycle assessment of two biowaste management systems for Barcelona, Spain. Resources, Conservation and Recycling, 49 1: 32-48.
Guerini, G., Maffeis, P., Allievi, L. and Gigliotti, C., 2006. Integrated waste management in a zone of northern Italy: compost production and use, and analytical control of compost, soil, and crop. Journal of Environmental Science and Health Part B-Pesticides Food Contaminants and Agricultural Wastes, 41 7: 1203-1219.
Guinée, J. B., 2001. Life cycle assessment: An operational guide to the ISO standars. Part 1 and 2. Ministry of Housing. Spatial Planning and Environment (VROM) and Centre of Environmental Science (CML), The Netherlands.
Hansen, T. L., Bhander, G. S., Christensen, T. H., Bruun, S. and Jensen, L. S., 2006a. Life cycle modelling of environmental impacts of application of processed organic municipal solid waste on agricultural land (EASEWASTE). Waste Management & Research, 24 2: 153-166.
Hansen, T. L., Christensen, T. H. and Schmidt, S., 2006b. Environmental modelling of use of treated organic waste on agricultural land: a comparison of existing models for life cycle assessment of waste systems. Waste Management & Research, 24 2: 141-152.
Hargreaves, J. C., Adl, M. S. and Warman, P. R., 2008. A review of the use of composted municipal solid waste in agriculture. Agriculture Ecosystems & Environment, 123 1-3: 1-14.
Iglesiasjimenez, E. and Alvarez, C. E., 1993. Apparent Availability of Nitrogen in Composted Municipal Refuse. Biology and Fertility of Soils, 16 4: 313-318.
International Organisation for Standardisation, 2006. ISO 14040. Environmental Management, Life Cycle Assessment-Principles and framework.
Jakobsen, S. T., 1995. Aerobic decomposition of organic wastes 2. Value of compost as a fertilizer. Resources, Conservation and Recycling, 13 1: 57-71.
Larsen, H. F. and Hauschild, M., 2007. Evaluation of ecotoxicity effect indicators for use in LCIA. International Journal of Life Cycle Assessment, 12 1: 24-33.

18
López, C., Muñoz, R., Tió, M. and Marfà, O., 1999. Lixiviació de nutrients i producció de maduixot. Efectes del maneig de la fertirrigació, vol. 5. In: Institut Cátala d'Estudis Agraris (Ed.), Dossiers Agraris: Problemes moderns en l’ús dels sòls, els nitrats. Barcelona, pp. 107-114.
MAPA, 2002. Real Decreto 1201/2002, de 20 de noviembre, por el que se regula la producción integrada de productos agrícolas (in Spanish). Ministerio español de Agricultura Pesca y Alimentación. Boletín Oficial del Estado.
McConnell, D. B., Shiralipour, A. and Smith, W. H., 1993. Agricultural Impact - Compost Application Improves Soil Properties. Biocycle, 34 4: 61-63.
Ministerio de la Presidencia, 2005. Real Decreto 824/2005 sobre productos fertilizantes (in Spanish). Boletín Oficial del Estado Español.
MMAMRM. Registro de Productos Fitosanitarios (in Spanish). Sección de Agricultura del Ministerio de Medio Ambiente y Medio Rural y Marino, 2008. Home page: <www.mma.es/portal/secciones>.
MP, 2005. Real Decreto 824/2005 sobre productos fertilizantes (in Spanish). Ministerio de la Presidencia. Boletín Oficial del Estado Español.
Muñoz, I., Gazulla, C., Bala, A. and Rieradevall, J., 2002. Análisis de ciclo de vida aplicado a diferentes modelos de gestión de residuos urbanos en municipios de la provincia de Barcelona (in Spanish). Master's Degree Project, Center of Environmental Projects-Universidad Autónoma de Barcelona (CEA-UAB).
Muñoz, I. and Rieradevall, J., 2002. Análisis del Ciclo de Vida aplicado a diferentes alternativas de Gestión de Residuos Urbanos y Lodos de depuradora según el Plan Integral de Gestión de Residuos Urbanos de Gipuzkoa en 2016 (in Spanish). Institute of Environmental Science and Technology - Universidad Autónoma de Barcelona (ICTA-UAB), Cerdañola del Vallès.
Muñoz, P., Antón, A., López, M., Huerta, O., Núñez, M., Rieradevall, J. and Ariño, J., 2008a. Aplicación de compost de fracción orgánica de residuos sólidos municipales en la fertilización de cultivos hortícolas en la comarca del Maresme (in Spanish). In: DGCEA (Ed.), Subvenciones de I+D+i en el ámbito de la prevención de la contaminación. Balance 2004-2007. Ministerio de Medio Ambiente, pp. 45-51, pp.
Muñoz, P., Antón, A., Nuñez, M., Vijay, A., Ariño, J., Castells, X., Montero, J. and Rieradevall, J., 2007a. Comparing the environmental impacts of greenhouse versus open-field tomato production in the Mediterranean region. Acta Horticulturae, 801 1591-1596.
Muñoz, P., Antón, A., Paranjpe, A., Ariño, J. and Montero, J., 2008b. High decrease in nitrate leaching by lower N input without reducing greenhouse tomato yield Agronomy for Sustainable Development, 28 4: 489.
Muñoz, P., Antón, A., Vijay, A., Montero, J., Ariño, J., Rodríguez, D. and Castells, X., 2007b. Producción de tomate en la comarca del Maresme con diferentes soluciones nutritivas (in Spanish). In: (Ed.), XXXVII Seminario de Tècnicos y Especialistas en Horticultura. Almería (España). In press.
Nemecek, T., Heil, A., Huguenin, O., Meier, S., Erzinger, S., Blaser, S., Dux, D. and Zimmermann, A., 2004. Life Cycle Inventories of Agricultural Production Systems. Final report, ecoinvent 2000 No. 15. Agroscope FAL Reckenholz and FAT Taenikon, Swiss Centre for Life Cycle Inventories, Dübendorf, pp. 289.
Pagans, E., Barrena, R., Font, X. and Sanchez, A., 2006a. Ammonia emissions from the composting of different organic wastes. Dependency on process temperature. Chemosphere, 62 9: 1534-1542.
Pagans, E., Font, X. and Sanchez, A., 2006b. Emission of volatile organic compounds from composting of different solid wastes: abatement by biofiltration. Journal of Hazardous Materials, 131 1-3: 179-186.
Pennington, D. W., Potting, J., Finnveden, G., Lindeijer, E., Jolliet, O., Rydberg, T. and Rebitzer, G., 2004. Life cycle assessment Part 2: Current impact assessment practice. Environment International, 30 5: 721-739.
Pettersen, J. and Hertwich, E., 2008. Critical Review: Life-Cycle Inventory Procedures for Long-Term Release of Metals. Environmental Science & Technology, 42 13: 4639-4647.
PRé Consultants, 2006. SimaPro software versión 7.0.2. PRé Consultants, The Netherlands.

19
Raviv, M., 1998. Horticultural uses of composted material. In: R. A. K. Szmidt (Ed.), International Symposium on Composting and Use of Composted Materials for Horticulture. Acta Horticulturae, UK, pp. 225-234.
SAS institute Inc., 2006. SAS Enterprise Guide. SAS, Cary, North Carolina, USA.
SCLCI, 2005. Ecoinvent Data v1.2. Swiss Centre for Life Cycle Inventories, Dübendorf.
Sharma, G. and Campbell, A., 2003. Life cycle inventory and life cycle assessment for windrow composting systems. Department of Environment and Conservation (University of New South Wales). Recycled Organics Unit, Sydney, pp. 16.
Silva, M. T. B., Menduina, A. M., Seijo, Y. C. and Viqueira, F. D. F., 2007. Assessment of municipal solid waste compost quality using standardized methods before preparation of plant growth media. Waste Management & Research, 25 2: 99-108.
Smith, A., Brown, K., Ogilvie, S. and et al, 2001. Waste Management Options and Climate Change. Final Report. European Commission, DG Environment, Luxembourg, pp. 224.
Soliva, M., 1987. Experiencias con el compost. Estudios y monografías 12. Servicio de Medio Ambiente de la Diputación de Barcelona, Barcelona.
Soliva, M., 2001. Compostaje y gestión de residuos orgánicos. Estudios y monografías 21 (in Spanish). Diputación de Barcelona, Área de Medio Ambiente, Barcelona.
Sonesson, U., Björklund, A., Carlsson, M. and Dalemo, M., 2000. Environmental and economic analysis of management systems for biodegradable waste. Resources, Conservation and Recycling, 28 1-2: 29-53.
Sonesson, U., Dalemo, M., Mingarini, K. and Jönsson, H., 1997. ORWARE - A simulation model for organic waste handling systems. Part 2: case study and simulation results. Resources, Conservation and Recycling, 21 1: 39-54.
Spielmann, M., Kägi, T., Stadler, P. and Tietje, O., 2004. Life Cycle Inventories of Transport Services. Final report, ecoinvent 2000 No. 14. Swiss Centre for Life Cycle Inventories, Dübendorf, pp. 246.
The Council of the European Union, 1999. Directive 1999/31/EC, of 26 April 1999 on the landfill of waste. Official Journal of the European Communities.
Tsai, W., 2008. Management considerations and environmental benefit analysis for turning food garbage into agricultural resources. Bioresurce Technology, 99 5309-5316.
WSOFM. Schedule A - Capital asset commodity class code list and useful life schedule. State Administrative & Accounting Manual, section 30.50.10. Washington State Office of Financial Management. 2008. Home page: <www.ofm.wa.gov/default.asp>.

20
Tables and figures Figure 1 Diagram of the systems studied, showing the mineral fertilizer and compost production, transport and yield stages considered.

21
Figure 2 Contribution to total environmental impacts of the stages for the three treatments
Caption (under the figure): Stages: Y_O, sub-stage of field operations; Y_P, sub-stage of pesticides; Y_F, sub-stage of fertirrigation infrastructure; CT, transport of compost phase; FT, transport of mineral fertilizer phase; CP, production of compost phase; FP, production of mineral fertilizer phase. Impact categories: AD, abiotic depletion; GWP, global warming potential; ODP, ozone layer depletion potential; PO, photochemical oxidation; A, acidification; E, eutrophication; CED, cumulative energy demand.

22
Figure 3 Contribution to total environmental impacts of the compost production stage for the items considered, treatment C
Caption (under the figure): Impact categories: AD, abiotic depletion; GWP, global warming potential; ODP, ozone layer depletion potential; PO, photochemical oxidation; A, acidification; E, eutrophication; CED, cumulative energy demand.

23
Figure 4 Total impact for each category with and without additional burdens for the three treatments
Table 1 Quality and origin of data used in the Life Cycle Inventory

24
Stage Process Type of data Source
Organic and green MSW collection and transport ERD Bravo (2004), Muñoz et al. (2002) and data supplied by
Castelldefels and Gavà municipalities
Composting process at plant: ⋅ energy and water consumption ⋅ leachates ⋅ compost obtained
EOD Data supplied by Castelldefels composting facility, managed by Metrocompost S.L. and Cisneros (2006)
Composting emissions: NH3 and VOC EOD Experimental measurements (with Group Composting Research of UAB, GICOM) (2007-2008) and Colon et al. (2008)
Composting emissions: CO2, CH4 and N2O ERD Beck-Friis et al. (2001), Cisneros (2006), Muñoz and Rieradevall (2002), Soliva (2001), Soliva (1987), Sonesson et al. (1997) and EIPPC Bureau (2006)
Compost characteristics EOD Experimental measurements 2006 (with Barcelona School of Agriculture, ESAB), Muñoz et al. (2008a)
All transports considered D Ecoinvent v. 1.2, 2005
Compost production
Facility infrastructure and machinery D (Althaus et al., 2004; ITeC, 2008; SCLCI, 2005; WSOFM, 2008)
Mineral fertilizer production Mineral fertilizer production: KNO3 D Ecoinvent v. 1.2, 2005
Transports of mineral fertilizer and compost
Mineral fertilizer transport and compost transport D Ecoinvent v. 1.2, 2005
System design EOD Experimental fields (2007) and MAPA (2002) Fertirrigation infrastructure Fertirrigation infrastructure production D Ecoinvent v. 1.2, 2005
Type of pesticides needed EOD Experimental fields (2007) and MAPA (2002)
Pesticide doses ERD Spanish Ministry for Environment and Rural and Marine Affairs in the register of phytosanitary products (2008) Pesticides
Pesticide production D Ecoinvent v. 1.2, 2005
Plot characteristics: ⋅ type of soil ⋅ type of water supply ⋅ plant density
EOD Experimental fields (2007)
Tomatoe harvest EOD Experimental fields (2007)
Average calibre and weight of the fruit EOD Experimental fields (2007)
Fertilizer consumption EOD Experimental fields (2007)
Machinery and tools: ⋅ type of machinery used ⋅ fuel consumption ⋅ operating rate
EOD Experimental fields (2007)
Machinery and management tools production D Ecoinvent v. 1.2, 2005
Diesel emissions ERD Gasola et al. (2007)
Water consumption EOD Experimental fields (2007)
Fertirrigation emissions ERD Audsley (1997)
Field operations
Landfill waste disposal D Ecoinvent v. 1.2, 2005 EOD: experimental own data. ERD: experimental reference data. D: database.
25
Table 2 Harvest production and parameters of agricultural quality
Parameter Units C C+M M LSDa
Harvest productionb t/ha 130 125 124 ns
Fruit average diameter mm 79.1 78.2 78.7 ns
Fruit average weight g 209.1 205.6 207.7 ns a ns not significant at P = 0.05. b Commercial production of tomatoes.

26
Table 3 Inventory of average input and output flows of materials and energy at the composting facility in Castelldefels (Barcelona) for the 2003-2006 period, and emission factors considered for the decomposition of organic waste (organic and green MSW)
a Diesel consumption includes the consumption by the organic MSW treatment plant and the fuel required to grind the green MSW at an external plant. b Water consumption includes the tap water supplied and rainwater collected in biofilters and reused. c Bibliographic data on output from biofilters. d Experimental data on output from biofilters.
Type of flow Units Annual flow
Input
Electric supply MWh/year 465.9
Diesel oil consumption a m3/year 64.3
Water consumption b m3/year 3,935
Total organic waste t/year 14,461
organic MSW t/year 10,022
green MSW t/year 4,439
Inappropriate items % 20
Output
Compost production t/year 2,094
Solid waste dumped t/year 2,823
Emissions
CO2 biogenic c t/year 2,385.89
NH3 d t/year 1.59
CH4 c t/year 5.45
COV d t/year 17.50
N2O c t/year 0.30

27
Table 4 Types and quantities of fertilizers applied for each treatment
C C+M M
Dose Dose of fertilizer (g/m2)
Dose of N (gN/ m2)
Dose of fertilizer (g/m2)
Dose of N (gN/ m2)
Dose of fertilizer (g/m2)
Dose of N (gN/ m2)
Compost 1,931.0 a 23.4 b 965.5 a 11.7 b 0.0 0.0
Irrigation water and rainfall c 23.9 23.9 23.9 23.9 23.9 23.9
2 0.0 0.0 90.2 12.5 146.2 20.2 a Proportion of the total compost dose for the 133 days of the tomato crop. The total doses for the 18 months were calculated as 7,840 g/m2 for C and
3,924 g/m2 for C+M. b Nitrogen available the first year after spreading the compost. c Irrigation water makes the largest contribution, with a concentration of 3 miliequivalents of HNO3.

28
Table 5 Manufactured materials and lifespan considered for the elements of fertirrigation infrastructure
Element Material Amount (kg/m2)
Lifespan (years)
Well pipes a Polyvinyl chloride 8.949E-4 10
Primary distribution pipes b Polyethylene 1.909E-3 10
Secondary distribution pipes c Polyethylene 5.250E-2 1
Electrovalves d Polyvinyl chloride 1.323E-2 10
Concrete 2.397E-2 50 Water tank e
Steel 4.762E-2 50
Fertilizer tanks g Polyethylene 4.247E-3 10
Water distribution pump Steel 9.440E-4 20
Water extraction pump Steel 9.440E-4 20 a Pipes transporting water from the pumps to the tanks. b Pipes transporting irrigation water from the tanks to each of the parcels. c T-TAPE with built-in drip irrigation systems. d One electrovalve per treatment. e One tank for the three treatments. f 500l tanks are considered. Three tanks for treatments M and C+M and one for treatment C.

29
Table 6 Characteristics of the machinery used during the yield stage
* Hours of use the machinery in each treatment considering an area of 5,000 m2.
Use of machinery (h)* Machinery Weight (kg) Life span (h)
C C+M M
Tractor 3,900 7,200 6.80 6.80 3.59
Plough 300 3,000 3.75 3.75 1.25
Tow 1,490 6,000 0.58 0.58 0
Fertilizer spreader 1,000 800 0.12 0.12 0
Furrow opener 1,190 3,000 0.79 0.79 0.79
Spray bag 1,000 1,000 1.54 1.54 1.54

30
Table 7 Total environmental impacts and by stages for treatments C, C+M and M
Total impact Production stage Transport stage Yield stage Impact category Units Total with
avoided burdens a
Total b FP CP FT CT Y_F Y_P Y_O
Compost treatment (C)
AD kg Sb eq. 4.20E-01 1.01E+00 5.39E-01 8.63E-02 8.94E-02 3.62E-02 4.20E-01
GWP kg CO2 eq. -7.86E+02 1.36E+02 7.90E+01 1.24E+01 8.86E+00 2.96E+00 -7.86E+02
ODP kg CFC-11 eq. 1.50E-06 1.35E-05 7.69E-06 1.65E-06 5.55E-07 5.19E-07 1.50E-06
PO kg C2H4 eq. 5.15E-01 7.09E-01 6.91E-01 3.46E-03 3.91E-03 8.83E-04 5.15E-01
A kg SO2 eq. 7.18E-01 1.31E+00 8.32E-01 7.21E-02 5.13E-02 2.00E-02 7.18E-01
E kg PO43- eq. -3.26E+00 1.94E-01 1.09E-01 1.46E-02 1.39E-02 1.24E-03 -3.26E+00
CED MJ eq. 1.07E+03 2.58E+03 1.39E+03 2.07E+02 2.27E+02 9.00E+01 1.07E+03
Compost and mineral fertilizer treatment (C+M)
AD kg Sb eq. 5.05E-01 8.10E-01 6.14E-02 2.64E-01 4.47E-02 3.83E-02 9.39E-02 4.11E-02 2.67E-01
GWP kg CO2 eq. -3.60E+02 1.07E+02 1.83E+01 3.95E+01 6.42E+00 5.49E+00 9.27E+00 3.36E+00 2.46E+01
ODP kg CFC-11 eq. 4.32E-06 1.05E-05 9.30E-07 3.62E-06 8.57E-07 7.33E-07 5.91E-07 5.89E-07 3.22E-06
PO kg C2H4 eq. 2.77E-01 3.77E-01 1.04E-03 3.58E-01 1.79E-03 1.53E-03 4.08E-03 1.00E-03 9.46E-03
A kg SO2 eq. 6.69E-01 8.62E-01 4.87E-02 4.14E-01 3.74E-02 3.20E-02 5.37E-02 2.27E-02 2.54E-01
E kg PO43- eq. -1.63E+00 1.29E-01 9.33E-03 5.18E-02 7.57E-03 6.47E-03 1.46E-02 1.41E-03 3.82E-02
CED MJ eq. 1.27E+03 2.06E+03 1.40E+02 6.82E+02 1.07E+02 9.18E+01 2.39E+02 1.02E+02 6.94E+02
Mineral fertilizer treatment (M)
AD kg Sb eq. 5.60E-01 5.60E-01 1.01E-01 6.04E-02 9.46E-02 3.78E-02 2.67E-01
GWP kg CO2 eq. 8.81E+01 7.55E+01 3.00E+01 8.67E+00 9.34E+00 3.09E+00 2.45E+01
ODP kg CFC-11 eq. 7.03E-06 7.03E-06 1.53E-06 1.16E-06 5.96E-07 5.42E-07 3.21E-06
PO kg C2H4 eq. 1.86E-02 1.86E-02 1.71E-03 2.42E-03 4.11E-03 9.23E-04 9.44E-03
A kg SO2 eq. 5.84E-01 4.59E-01 7.99E-02 5.05E-02 5.41E-02 2.09E-02 2.53E-01
E kg PO43- eq. 1.07E-01 7.95E-02 1.53E-02 1.02E-02 1.47E-02 1.29E-03 3.80E-02
CED MJ eq. 1.40E+03 1.40E+03 2.30E+02 1.45E+02 2.41E+02 9.41E+01 6.95E+02 a Total impact of the system considering avoided burdens through composting by not dumping organic and green MSW in treatments C and C+M. b Total impact of the system without considering avoided burdens (Sum of the seven columns on the right). Stages: Y_O, sub-stage of field operations; Y_P, sub-stage of pesticides; Y_F, sub-stage of fertirrigation infrastructure; CT, transport of compost phase; FT, transport of mineral fertilizer phase; CP, production of compost phase; FP, production of mineral fertilizer phase. Impact categories: AD, abiotic depletion; GWP, global warming potential; ODP, ozone layer depletion potential; PO, photochemical oxidation; A, acidification; E, eutrophication; CED, cumulative energy demand.